


适用于家庭办公和多媒体的经济型迷你 PC - GMKtec NucBox M3 Ultra(配备 Intel Core i7)评测
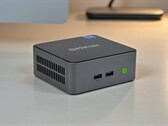
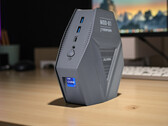
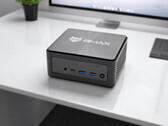
GMKtec 推出的 NucBox M3 Ultra 是一款采用英特尔酷睿 i7 处理器的新型迷你 PC。它既可作为裸机,也可作为完整系统,性能强劲,价格公道--但在当前的迷你 PC 市场上,这款较老的 SoC 是否足以独当一面?我们的评测将给出答案。
Intel Core i7-12700H, Iris Xe G7 96EUs, 437 g英特尔Xe显卡G7(Tiger-Lake UGPU,96EU)是高端Tiger-Lake U CPU(15-28瓦特)的集成显卡。 使用新的Xe体系结构(Gen12),于2020年9月引进。 所有CPU的基本时钟速度(保证)为400MHz的GPU时钟,最高可提升1340MHz(i7-1185G7)。 最慢的变型仅提供1100MHz的升压(i5-1130G7、12瓦特TDP)。
性能取决于笔记本电脑的TDP设置和使用冷却设备。 根据第一个信息,芯片可以设置为 12W 和 28W TDP(作为 Ice Lake-U 芯片),并且性能必须在 3D Mark 基准的专用 GeForce MX350 附近。 由于缺少专用图形内存和驱动程序支持,游戏性能可能会下降。 许多游戏(例如,Horizon Zero Dawn、Cyberpunk 2077等)在测试各种笔记本电脑时出现问题。请参阅下面的列表。 像Mass Effect Legend Edition这样的低负荷游戏在中等设定下正常运行。 与以前的Ice Lake Iris Plus G7 GPU相比,新的Tiger Lake GPU的速度约为原来的2倍。 因此,iGPU仅适用于要求苛刻的游戏中最低的图形设置和低分辨率。
Tiger Lake SoCs 和集成 GPU 在英特尔采用最新的 10nm+ (10nm SuperFin) 工艺(改进的 10nm 工艺)制造,因此效率非常高。
Gen. 12 / Xe Series
| ||||||||||||||||||||||||||||
| Codename | Tiger Lake Xe | |||||||||||||||||||||||||||
| Architecture | Gen. 11 Ice Lake | |||||||||||||||||||||||||||
| iGPU | Integrated Graphics | |||||||||||||||||||||||||||
| Pipelines | 96 - unified | |||||||||||||||||||||||||||
| Core Speed | 400 - 1350 (Boost) MHz | |||||||||||||||||||||||||||
| Shared Memory | yes | |||||||||||||||||||||||||||
| API | DirectX 12_1, OpenGL 4.6 | |||||||||||||||||||||||||||
| Power Consumption | 28 Watt | |||||||||||||||||||||||||||
| Man. Technology | 10 nm | |||||||||||||||||||||||||||
| Features | 3.8 MB L3 Cache, QuickSync, Device ID 9A49, Vendor ID 8086 | |||||||||||||||||||||||||||
| Date of Announcement | 15.08.2020 | |||||||||||||||||||||||||||
| ||||||||||||||||||||||||||||||||||||||||||||||||||||||||||||||||||||||||||||||||||||||||||||||||||||||||||||||||||||||||||||||||||||||||||||||||||||||||
| Model | CPU | GPU | RAM | Value |
|---|---|---|---|---|
| BMAX B9 Power DX12 | i9-12900HK 55 W / 45 W | Iris Xe G7 96EUs | 32 GB | 165 |
| Alliwava GH9, i9-12900HK DX12 | i9-12900HK 60 W / 45 W | Iris Xe G7 96EUs | 32 GB | 180 |
| Geekom XT13 Pro DX12 | i9-13900H | Iris Xe G7 96EUs | 32 GB | 183 |
| Geekom GT13 Pro DX12 | i9-13900H 64 W / 35 W | Iris Xe G7 96EUs 1500 MHz | 32 GB | 186 |
| BMAX B9 Power Vulkan | i9-12900HK 55 W / 45 W | Iris Xe G7 96EUs | 32 GB | 212 |
| Alliwava GH9, i9-12900HK Vulkan | i9-12900HK 60 W / 45 W | Iris Xe G7 96EUs | 32 GB | 221 |
| Model | CPU | GPU | RAM | Value |
|---|---|---|---|---|
| Geekom XT13 Pro DX12 | i9-13900H | Iris Xe G7 96EUs | 32 GB | 1276 |
| Geekom GT13 Pro DX12 | i9-13900H 64 W / 35 W | Iris Xe G7 96EUs 1500 MHz | 32 GB | 1283 |
| Model | CPU | GPU | RAM | Value |
|---|---|---|---|---|
| Asus ExpertBook B7 Flip B7402FEA | i7-1195G7 51 W / 35 W | Iris Xe G7 96EUs 1400 MHz | 16 GB | 8379 |
Lenovo ThinkBook 14s Yoga ITL 20WE0023GE  | i7-1165G7 44 W / 20 W | Iris Xe G7 96EUs 1300 MHz | 16 GB | 8382 |
| Dell Inspiron 15 3501 | i7-1165G7 51 W / 22 W | Iris Xe G7 96EUs 1300 / 1000 MHz | 16 GB | 8501 |
| Xiaomi Mi NoteBook Pro | i7-11370H 64 W / 28 W | Iris Xe G7 96EUs | 16 GB | 9548 |
| HP Spectre x360 14-ea0378ng | i7-1165G7 51 W / 30 W | Iris Xe G7 96EUs 1300 MHz | 16 GB | 10806 |
| Dynabook Portégé X30W-J-10K | i7-1165G7 @4.7 GHz 60 W / 28 W | Iris Xe G7 96EUs 1300 / 2000 MHz | 16 GB | 12132 |
| HP Spectre x360 14-ea0378ng Leistung | i7-1165G7 51 W / 30 W | Iris Xe G7 96EUs 1300 MHz | 16 GB | 12895 |
| LG Gram 16 (2021) | i7-1165G7 60 W / 30 W | Iris Xe G7 96EUs 1300 MHz 1.6 GB | 16 GB | 13415 |
| Huawei MateBook 16s i7 | i7-12700H 96 W / 54 W | Iris Xe G7 96EUs 1400 / 2400 MHz | 16 GB | 14228 |
| Huawei MateBook D 16 2022 | i7-12700H 64 W / 35 W | Iris Xe G7 96EUs 1400 / 1867 MHz | 16 GB | 14527 |
| GPU TDP ? | TDP 8 W | TDP 12 W | TDP 13 W |
|---|---|---|---|
| 90% | 100% | 98% | 65% |
| GPU TDP ? | TDP 8 W | TDP 12 W | TDP 13 W |
|---|---|---|---|
| 88% | 100% | 95% | 66% |
| GPU TDP ? | TDP 8 W | TDP 12 W | TDP 13 W |
|---|---|---|---|
| 94% | 100% | 98% | 74% |
| GPU TDP ? | TDP 8 W | TDP 12 W | TDP 13 W |
|---|---|---|---|
| 93% | 100% | 97% | 72% |
| GPU TDP ? | TDP 8 W | TDP 12 W | TDP 13 W |
|---|---|---|---|
| 100% | 95% | 100% | 88% |
| GPU TDP ? | TDP 8 W | TDP 12 W | TDP 13 W |
|---|---|---|---|
| 89% | 100% | 92% | 75% |
| Model | CPU | GPU | RAM | Value |
|---|---|---|---|---|
| Asus Chromebook Flip CX5 CX5500FEA | i7-1165G7 | Iris Xe G7 96EUs 1300 MHz | 16 GB | 16789 |
| Model | CPU | GPU | RAM | Value |
|---|---|---|---|---|
| Asus Chromebook Flip CX5 CX5500FEA | i7-1165G7 | Iris Xe G7 96EUs 1300 MHz | 16 GB | 28890 |
| Model | CPU | GPU | RAM | Value |
|---|---|---|---|---|
| Asus ExpertBook B7 Flip B7402FEA Flüstermodus | i7-1195G7 | Iris Xe G7 96EUs | 16 GB | 10094 |
| Asus ExpertBook B3 Flip B3402FEA | i7-1165G7 64 W / 32 W | Iris Xe G7 96EUs 1300 MHz | 16 GB | 11189 |
| Asus ExpertBook B7 Flip B7402FEA | i7-1195G7 51 W / 35 W | Iris Xe G7 96EUs 1400 MHz | 16 GB | 11935 |
| Asus ExpertBook B7 Flip B7402FEA Leistungsmodus | i7-1195G7 | Iris Xe G7 96EUs | 16 GB | 12264 |
| Lenovo ThinkBook 14s Yoga ITL 20WE0023GE | i7-1165G7 44 W / 20 W | Iris Xe G7 96EUs 1300 MHz | 16 GB | 12638 |
| Dell Inspiron 15 3501 | i7-1165G7 51 W / 22 W | Iris Xe G7 96EUs 1300 / 1000 MHz | 16 GB | 12774 |
| Samsung Galaxy Book2 Pro 360 13 NP930QED-KA3DE | i7-1260P 45 W / 20 W | Iris Xe G7 96EUs 1400 / 5200 MHz | 16 GB | 12874 |
| HP Spectre x360 14-ea0378ng | i7-1165G7 51 W / 30 W | Iris Xe G7 96EUs 1300 MHz | 16 GB | 13551 |
| Asus ExpertBook B7 Flip B7402FEA Dual-Channel | i7-1195G7 51 W / 35 W | Iris Xe G7 96EUs 1400 MHz | 16 GB | 14801 |
| LG Gram 16 (2021) | i7-1165G7 60 W / 30 W | Iris Xe G7 96EUs 1300 MHz 1.6 GB | 16 GB | 15010 |
| Dynabook Portégé X30W-J-10K | i7-1165G7 @4.7 GHz 60 W / 28 W | Iris Xe G7 96EUs 1300 / 2000 MHz | 16 GB | 15956 |
| HP Spectre x360 14-ea0378ng Leistung | i7-1165G7 51 W / 30 W | Iris Xe G7 96EUs 1300 MHz | 16 GB | 16494 |
| HP Pavilion Plus 14-ew0153TU | i7-1355U 41 W / 25 W | Iris Xe G7 96EUs | 16 GB | 16600 |
| Acer SF514-55T | i7-1165G7 | Iris Xe G7 96EUs 400 / 1600 MHz | 16 GB | 16623 |
| LG Gram 16 (2021) Leistung | i7-1165G7 | Iris Xe G7 96EUs | 16 GB | 16741 |
| Dell Inspiron 14 5430 | i7-1355U 55 W / 28 W | Iris Xe G7 96EUs | 16 GB | 16972 |
| Acer TravelMate P614P-52 | i7-1165G7 64 W / 28 W | Iris Xe G7 96EUs 1300 / 1600 MHz | 32 GB | 17552 |
| Geekom XT13 Pro | i9-13900H | Iris Xe G7 96EUs | 32 GB | 18654 |
| Huawei MateBook 16s i9 | i9-13900H 115 W / 60 W | Iris Xe G7 96EUs | 16 GB | 21714 |
| Model | CPU | GPU | RAM | Value |
|---|---|---|---|---|
| Asus ExpertBook B3 Flip B3402FEA | i7-1165G7 64 W / 32 W | Iris Xe G7 96EUs 1300 MHz | 16 GB | 11724 |
| Asus ExpertBook B7 Flip B7402FEA Flüstermodus | i7-1195G7 | Iris Xe G7 96EUs | 16 GB | 12423 |
| Asus ExpertBook B7 Flip B7402FEA | i7-1195G7 51 W / 35 W | Iris Xe G7 96EUs 1400 MHz | 16 GB | 12983 |
| Asus ExpertBook B7 Flip B7402FEA Leistungsmodus | i7-1195G7 | Iris Xe G7 96EUs | 16 GB | 13198 |
| Lenovo ThinkBook 14s Yoga ITL 20WE0023GE | i7-1165G7 44 W / 20 W | Iris Xe G7 96EUs 1300 MHz | 16 GB | 14348 |
| Dell Inspiron 15 3501 | i7-1165G7 51 W / 22 W | Iris Xe G7 96EUs 1300 / 1000 MHz | 16 GB | 14645 |
| HP Spectre x360 14-ea0378ng | i7-1165G7 51 W / 30 W | Iris Xe G7 96EUs 1300 MHz | 16 GB | 17526 |
| Asus ExpertBook B7 Flip B7402FEA Dual-Channel | i7-1195G7 51 W / 35 W | Iris Xe G7 96EUs 1400 MHz | 16 GB | 17700 |
| Samsung Galaxy Book2 Pro 360 13 NP930QED-KA3DE | i7-1260P 45 W / 20 W | Iris Xe G7 96EUs 1400 / 5200 MHz | 16 GB | 17798 |
| HP Pavilion Plus 14-ew0153TU | i7-1355U 41 W / 25 W | Iris Xe G7 96EUs | 16 GB | 20414 |
| Dynabook Portégé X30W-J-10K | i7-1165G7 @4.7 GHz 60 W / 28 W | Iris Xe G7 96EUs 1300 / 2000 MHz | 16 GB | 20517 |
| HP Spectre x360 14-ea0378ng Leistung | i7-1165G7 51 W / 30 W | Iris Xe G7 96EUs 1300 MHz | 16 GB | 20622 |
| Dell Inspiron 14 5430 | i7-1355U 55 W / 28 W | Iris Xe G7 96EUs | 16 GB | 20792 |
| LG Gram 16 (2021) | i7-1165G7 60 W / 30 W | Iris Xe G7 96EUs 1300 MHz 1.6 GB | 16 GB | 21120 |
| Acer TravelMate P614P-52 | i7-1165G7 64 W / 28 W | Iris Xe G7 96EUs 1300 / 1600 MHz | 32 GB | 21333 |
| LG Gram 16 (2021) Leistung | i7-1165G7 | Iris Xe G7 96EUs | 16 GB | 21758 |
| Acer SF514-55T | i7-1165G7 | Iris Xe G7 96EUs 400 / 1600 MHz | 16 GB | 21795 |
| Huawei MateBook 16s i9 | i9-13900H 115 W / 60 W | Iris Xe G7 96EUs | 16 GB | 24384 |
| GPU TDP ? | TDP 8 W | TDP 12 W | TDP 13 W |
|---|---|---|---|
| 91% | 100% | 98% | 83% |
| GPU TDP ? | TDP 8 W | TDP 12 W | TDP 13 W |
|---|---|---|---|
| 92% | 100% | 97% | 87% |
| Model | CPU | GPU | RAM | Value | |
|---|---|---|---|---|---|
| 3DMark 06 - Score Unknown Settings | |||||
| Acer SF514-55T (3DMark 06 - Score Unknown Settings) | i7-1165G7 | Iris Xe G7 96EUs 400 / 1600 MHz | 16 GB | 24558 | |
| Model | CPU | GPU | RAM | Value | |
|---|---|---|---|---|---|
| 3DMark 06 - Standard 1366x768 | |||||
| Geekom XT13 Pro (3DMark 06 - Standard 1366x768) | i9-13900H | Iris Xe G7 96EUs | 32 GB | 30156 | |
| Minisforum MS-01 (3DMark 06 - Standard 1366x768) | i9-13900H 80 W / 60 W | Iris Xe G7 96EUs | 32 GB | 38453 | |
| Model | CPU | GPU | RAM | Value | |
|---|---|---|---|---|---|
| 3DMark 06 - Standard 1280x1024 | |||||
| Minipc Union Ace Magician TK11-A0 (3DMark 06 - Standard 1280x1024) | i5-1135G7 48 W / 20 W | Iris Xe G7 96EUs ? / 2000 MHz | 16 GB | 17626 | |
| Prime Computer PrimeBook Circular-i7-1165G7 (3DMark 06 - Standard 1280x1024) | i7-1165G7 45 W / 33 W | Iris Xe G7 96EUs 1300 / 2000 MHz | 16 GB | 19983 | |
| Asus ZenBook 14 UX425EA (3DMark 06 - Standard 1280x1024) | i7-1165G7 | Iris Xe G7 96EUs 400 / 1600 MHz | 16 GB | 20836 | |
| Geekom Mini IT11, i7-11390H (3DMark 06 - Standard 1280x1024) | i7-11390H 64 W / 35 W | Iris Xe G7 96EUs 1400 / 2000 MHz | 32 GB | 22323 | |
| BMAX B9 Power (3DMark 06 - Standard 1280x1024) | i9-12900HK 55 W / 45 W | Iris Xe G7 96EUs | 32 GB | 24822 | |
| Asus ZenBook S13 OLED UX5304 (3DMark 06 - Standard 1280x1024) | i7-1355U 44 W / 17 W | Iris Xe G7 96EUs 1300 MHz | 16 GB | 25303 | |
| Asus ExpertBook P1 P1503CVA-S70188X (3DMark 06 - Standard 1280x1024) | i7-13700H 45 W / 28 W | Iris Xe G7 96EUs 1500 MHz | 16 GB | 25677 | |
| Dynabook Portégé X30W-J-10K (3DMark 06 - Standard 1280x1024) | i7-1165G7 @4.7 GHz 60 W / 28 W | Iris Xe G7 96EUs 1300 / 2000 MHz | 16 GB | 25888 | |
| Intel NUC Pro Chassis_i7_1185G7 (3DMark 06 - Standard 1280x1024) | i7-1185G7 | Iris Xe G7 96EUs | 16 GB | 26439 | |
| Geekom Mini IT13 (3DMark 06 - Standard 1280x1024) | i9-13900HK 55 W / 35 W | Iris Xe G7 96EUs 1500 MHz | 32 GB | 26510 | |
| Lenovo ThinkPad T16 G2 21HH003AGE (3DMark 06 - Standard 1280x1024) | i7-1355U 20 W / 14 W | Iris Xe G7 96EUs 1300 / 2600 MHz | 16 GB | 26538 | |
| Schenker Work 15 Tiger Lake-H (3DMark 06 - Standard 1280x1024) | i7-11370H 44 W / 35 W | Iris Xe G7 96EUs | 16 GB | 27110 | |
| LG Gram 17 (2023) (3DMark 06 - Standard 1280x1024) | i7-1360P 43 W / 26 W | Iris Xe G7 96EUs 1400 MHz | 16 GB | 27376 | |
| Minisforum EliteMini TH50 (3DMark 06 - Standard 1280x1024) | i5-11320H 35 W / 35 W | Iris Xe G7 96EUs | 16 GB | 27809 | |
| Samsung Galaxy Book3 Pro 14 (3DMark 06 - Standard 1280x1024) | i7-1360P 64 W / 28 W | Iris Xe G7 96EUs 1500 MHz | 16 GB | 28118 | |
| Geekom Mini IT12 (3DMark 06 - Standard 1280x1024) | i7-1260P 64 W / 28 W | Iris Xe G7 96EUs 1400 / 2666 MHz | 16 GB | 28231 | |
| Khadas Mind (3DMark 06 - Standard 1280x1024) | i7-1360P 64 W / 28 W | Iris Xe G7 96EUs | 32 GB | 28276 | |
| MSI Prestige 14 Evo A11MO-026US (3DMark 06 - Standard 1280x1024) | i7-1195G7 64 W / 36 W | Iris Xe G7 96EUs | 16 GB | 28857 | |
| GMK NucBox M3 Ultra (3DMark 06 - Standard 1280x1024) | i7-12700H 35 W / 35 W | Iris Xe G7 96EUs 1400 MHz | 32 GB | 28930 | |
| LG Gram SuperSlim (2023) (3DMark 06 - Standard 1280x1024) | i7-1360P 43 W / 26 W | Iris Xe G7 96EUs 1500 MHz | 16 GB | 29112 | |
| Intel NUC Pro Chassis_i7_1265U (3DMark 06 - Standard 1280x1024) | i7-1265U | Iris Xe G7 96EUs | 16 GB | 30016 | |
| HP Spectre x360 2-in-1 16-f1075ng (3DMark 06 - Standard 1280x1024) | i7-12700H 65 W / 40 W | Iris Xe G7 96EUs 1400 / 2666 MHz | 16 GB | 30209 | |
| Geekom XT12 Pro (3DMark 06 - Standard 1280x1024) | i9-12900H 80 W / 35 W | Iris Xe G7 96EUs | 32 GB | 30775 | |
| Huawei MateBook X Pro 2023 (3DMark 06 - Standard 1280x1024) | i7-1360P 64 W / 30 W | Iris Xe G7 96EUs 1500 / 2600 MHz | 16 GB | 31307 | |
| Lenovo Yoga 9i 14 2022 i7-1260P (3DMark 06 - Standard 1280x1024) | i7-1260P 64 W / 38 W | Iris Xe G7 96EUs 1400 / 2600 MHz | 16 GB | 32422 | |
| Morefine S600-Apex Engineer (3DMark 06 - Standard 1280x1024) | i9-12900HK 115 W / 65 W | Iris Xe G7 96EUs 1895 / 1600 MHz | 64 GB | 32724 | |
| Minisforum Neptune Series NAD9 (3DMark 06 - Standard 1280x1024) | i9-12900H | Iris Xe G7 96EUs 1450 / 2600 MHz | 16 GB | 32907 | |
| Intel NUC 12 Pro Kit NUC12WSKi7 (3DMark 06 - Standard 1280x1024) | i7-1260P 64 W / 40 W | Iris Xe G7 96EUs 1400 / 1600 MHz | 16 GB | 32994 | |
| Geekom GT13 Pro (3DMark 06 - Standard 1280x1024) | i9-13900H 64 W / 35 W | Iris Xe G7 96EUs 1500 MHz | 32 GB | 33774 | |
| Intel NUC 13 Pro Desk Edition Kit (3DMark 06 - Standard 1280x1024) | i7-1360P 64 W / 40 W | Iris Xe G7 96EUs | 32 GB | 34030 | |
| Minisforum Venus Series NAB9 (3DMark 06 - Standard 1280x1024) | i9-12900HK 64 W / 45 W | Iris Xe G7 96EUs | 32 GB | 34204 | |
| Intel NUC 13 Pro Kit NUC13ANK (3DMark 06 - Standard 1280x1024) | i7-1360P 64 W / 40 W | Iris Xe G7 96EUs | 32 GB | 34555 | |
| Model | CPU | GPU | RAM | Value |
|---|---|---|---|---|
| Asus ZenBook 14 UX425EA | i7-1165G7 | Iris Xe G7 96EUs 400 / 1600 MHz | 16 GB | 23.1 |
| Model | CPU | GPU | RAM | Value |
|---|---|---|---|---|
| Minisforum EliteMini TH50 | i5-11320H 35 W / 35 W | Iris Xe G7 96EUs | 16 GB | 37.3 |
| Geekom Mini IT11, i7-11390H | i7-11390H 64 W / 35 W | Iris Xe G7 96EUs 1400 / 2000 MHz | 32 GB | 37.4 |
| Khadas Mind | i7-1360P 64 W / 28 W | Iris Xe G7 96EUs | 32 GB | 41.6 |
| Geekom Mini IT12 | i7-1260P 64 W / 28 W | Iris Xe G7 96EUs 1400 / 2666 MHz | 16 GB | 43.7 |
| Geekom XT12 Pro | i9-12900H 80 W / 35 W | Iris Xe G7 96EUs | 32 GB | 45.3 |
| Intel NUC 13 Pro Kit NUC13ANK | i7-1360P 64 W / 40 W | Iris Xe G7 96EUs | 32 GB | 45.9 |
| Intel NUC 13 Pro Desk Edition Kit | i7-1360P 64 W / 40 W | Iris Xe G7 96EUs | 32 GB | 46 |
| Geekom GT13 Pro | i9-13900H 64 W / 35 W | Iris Xe G7 96EUs 1500 MHz | 32 GB | 46.6 |
| Minisforum Neptune Series NAD9 | i9-12900H | Iris Xe G7 96EUs 1450 / 2600 MHz | 16 GB | 47.2 |
| Minisforum Venus Series NAB9 | i9-12900HK 64 W / 45 W | Iris Xe G7 96EUs | 32 GB | 47.3 |
| Minisforum MS-01 | i9-13900H 80 W / 60 W | Iris Xe G7 96EUs | 32 GB | 53.1 |
| Model | CPU | GPU | RAM | Value |
|---|---|---|---|---|
| Geekom Mini IT11, i7-11390H | i7-11390H 64 W / 35 W | Iris Xe G7 96EUs 1400 / 2000 MHz | 32 GB | 2.85 |
| Khadas Mind | i7-1360P 64 W / 28 W | Iris Xe G7 96EUs | 32 GB | 3.43 |
| Minisforum EliteMini TH50 | i5-11320H 35 W / 35 W | Iris Xe G7 96EUs | 16 GB | 3.44 |
| Geekom Mini IT12 | i7-1260P 64 W / 28 W | Iris Xe G7 96EUs 1400 / 2666 MHz | 16 GB | 3.55 |
| Intel NUC 13 Pro Desk Edition Kit | i7-1360P 64 W / 40 W | Iris Xe G7 96EUs | 32 GB | 3.55 |
| Geekom XT12 Pro | i9-12900H 80 W / 35 W | Iris Xe G7 96EUs | 32 GB | 3.64 |
| Geekom GT13 Pro | i9-13900H 64 W / 35 W | Iris Xe G7 96EUs 1500 MHz | 32 GB | 3.81 |
| Intel NUC 13 Pro Kit NUC13ANK | i7-1360P 64 W / 40 W | Iris Xe G7 96EUs | 32 GB | 3.86 |
| Minisforum Venus Series NAB9 | i9-12900HK 64 W / 45 W | Iris Xe G7 96EUs | 32 GB | 3.89 |
| Minisforum Neptune Series NAD9 | i9-12900H | Iris Xe G7 96EUs 1450 / 2600 MHz | 16 GB | 3.94 |
| Minisforum MS-01 | i9-13900H 80 W / 60 W | Iris Xe G7 96EUs | 32 GB | 4 |
| Model | CPU | GPU | RAM | Value |
|---|---|---|---|---|
| Geekom Mini IT11, i7-11390H | i7-11390H 64 W / 35 W | Iris Xe G7 96EUs 1400 / 2000 MHz | 32 GB | 15 |
| Geekom XT12 Pro | i9-12900H 80 W / 35 W | Iris Xe G7 96EUs | 32 GB | 16.6 |
| Geekom Mini IT12 | i7-1260P 64 W / 28 W | Iris Xe G7 96EUs 1400 / 2666 MHz | 16 GB | 16.7 |
| Minisforum Venus Series NAB9 | i9-12900HK 64 W / 45 W | Iris Xe G7 96EUs | 32 GB | 17.4 |
| Intel NUC 13 Pro Desk Edition Kit | i7-1360P 64 W / 40 W | Iris Xe G7 96EUs | 32 GB | 17.7 |
| Minisforum Neptune Series NAD9 | i9-12900H | Iris Xe G7 96EUs 1450 / 2600 MHz | 16 GB | 17.9 |
| Intel NUC 13 Pro Kit NUC13ANK | i7-1360P 64 W / 40 W | Iris Xe G7 96EUs | 32 GB | 18.2 |
| Minisforum EliteMini TH50 | i5-11320H 35 W / 35 W | Iris Xe G7 96EUs | 16 GB | 18.4 |
| Geekom GT13 Pro | i9-13900H 64 W / 35 W | Iris Xe G7 96EUs 1500 MHz | 32 GB | 19.1 |
| Khadas Mind | i7-1360P 64 W / 28 W | Iris Xe G7 96EUs | 32 GB | 21.2 |
| Minisforum MS-01 | i9-13900H 80 W / 60 W | Iris Xe G7 96EUs | 32 GB | 24.8 |
| Model | CPU | GPU | RAM | Value |
|---|---|---|---|---|
| Geekom Mini IT11, i7-11390H | i7-11390H 64 W / 35 W | Iris Xe G7 96EUs 1400 / 2000 MHz | 32 GB | 8.13 |
| Minisforum EliteMini TH50 | i5-11320H 35 W / 35 W | Iris Xe G7 96EUs | 16 GB | 11.1 |
| Geekom Mini IT12 | i7-1260P 64 W / 28 W | Iris Xe G7 96EUs 1400 / 2666 MHz | 16 GB | 11.2 |
| Intel NUC 13 Pro Desk Edition Kit | i7-1360P 64 W / 40 W | Iris Xe G7 96EUs | 32 GB | 11.5 |
| Geekom XT12 Pro | i9-12900H 80 W / 35 W | Iris Xe G7 96EUs | 32 GB | 11.8 |
| Intel NUC 13 Pro Kit NUC13ANK | i7-1360P 64 W / 40 W | Iris Xe G7 96EUs | 32 GB | 11.9 |
| Khadas Mind | i7-1360P 64 W / 28 W | Iris Xe G7 96EUs | 32 GB | 12 |
| Minisforum Venus Series NAB9 | i9-12900HK 64 W / 45 W | Iris Xe G7 96EUs | 32 GB | 12.2 |
| Geekom GT13 Pro | i9-13900H 64 W / 35 W | Iris Xe G7 96EUs 1500 MHz | 32 GB | 12.2 |
| Minisforum Neptune Series NAD9 | i9-12900H | Iris Xe G7 96EUs 1450 / 2600 MHz | 16 GB | 12.3 |
| Minisforum MS-01 | i9-13900H 80 W / 60 W | Iris Xe G7 96EUs | 32 GB | 14.5 |
| Model | CPU | GPU | RAM | Value |
|---|---|---|---|---|
| Geekom Mini IT11, i7-11390H | i7-11390H 64 W / 35 W | Iris Xe G7 96EUs 1400 / 2000 MHz | 32 GB | 30.4 |
| Geekom Mini IT12 | i7-1260P 64 W / 28 W | Iris Xe G7 96EUs 1400 / 2666 MHz | 16 GB | 36.5 |
| Geekom XT12 Pro | i9-12900H 80 W / 35 W | Iris Xe G7 96EUs | 32 GB | 38.3 |
| Minisforum EliteMini TH50 | i5-11320H 35 W / 35 W | Iris Xe G7 96EUs | 16 GB | 39.2 |
| Intel NUC 13 Pro Desk Edition Kit | i7-1360P 64 W / 40 W | Iris Xe G7 96EUs | 32 GB | 39.2 |
| Minisforum Venus Series NAB9 | i9-12900HK 64 W / 45 W | Iris Xe G7 96EUs | 32 GB | 39.8 |
| Minisforum Neptune Series NAD9 | i9-12900H | Iris Xe G7 96EUs 1450 / 2600 MHz | 16 GB | 39.9 |
| Intel NUC 13 Pro Kit NUC13ANK | i7-1360P 64 W / 40 W | Iris Xe G7 96EUs | 32 GB | 40 |
| Khadas Mind | i7-1360P 64 W / 28 W | Iris Xe G7 96EUs | 32 GB | 41.3 |
| Geekom GT13 Pro | i9-13900H 64 W / 35 W | Iris Xe G7 96EUs 1500 MHz | 32 GB | 42.4 |
| Minisforum MS-01 | i9-13900H 80 W / 60 W | Iris Xe G7 96EUs | 32 GB | 51.9 |
| Model | CPU | GPU | RAM | Value |
|---|---|---|---|---|
| Intel NUC 13 Pro Desk Edition Kit | i7-1360P 64 W / 40 W | Iris Xe G7 96EUs | 32 GB | 0.32 |
| Geekom XT12 Pro | i9-12900H 80 W / 35 W | Iris Xe G7 96EUs | 32 GB | 0.4 |
| Minisforum Venus Series NAB9 | i9-12900HK 64 W / 45 W | Iris Xe G7 96EUs | 32 GB | 0.4 |
| Minisforum Neptune Series NAD9 | i9-12900H | Iris Xe G7 96EUs 1450 / 2600 MHz | 16 GB | 0.41 |
| Geekom Mini IT12 | i7-1260P 64 W / 28 W | Iris Xe G7 96EUs 1400 / 2666 MHz | 16 GB | 0.41 |
| Geekom GT13 Pro | i9-13900H 64 W / 35 W | Iris Xe G7 96EUs 1500 MHz | 32 GB | 0.41 |
| Intel NUC 13 Pro Kit NUC13ANK | i7-1360P 64 W / 40 W | Iris Xe G7 96EUs | 32 GB | 0.42 |
| Minisforum EliteMini TH50 | i5-11320H 35 W / 35 W | Iris Xe G7 96EUs | 16 GB | 0.43 |
| Khadas Mind | i7-1360P 64 W / 28 W | Iris Xe G7 96EUs | 32 GB | 0.46 |
| Minisforum MS-01 | i9-13900H 80 W / 60 W | Iris Xe G7 96EUs | 32 GB | 0.5 |
| Geekom Mini IT11, i7-11390H | i7-11390H 64 W / 35 W | Iris Xe G7 96EUs 1400 / 2000 MHz | 32 GB | 0.92 |
| Model | CPU | GPU | RAM | Value |
|---|---|---|---|---|
| Geekom Mini IT11, i7-11390H | i7-11390H 64 W / 35 W | Iris Xe G7 96EUs 1400 / 2000 MHz | 32 GB | 7.28 |
| Khadas Mind | i7-1360P 64 W / 28 W | Iris Xe G7 96EUs | 32 GB | 7.37 |
| Geekom Mini IT12 | i7-1260P 64 W / 28 W | Iris Xe G7 96EUs 1400 / 2666 MHz | 16 GB | 7.52 |
| Intel NUC 13 Pro Kit NUC13ANK | i7-1360P 64 W / 40 W | Iris Xe G7 96EUs | 32 GB | 8.05 |
| Minisforum EliteMini TH50 | i5-11320H 35 W / 35 W | Iris Xe G7 96EUs | 16 GB | 8.37 |
| Minisforum Neptune Series NAD9 | i9-12900H | Iris Xe G7 96EUs 1450 / 2600 MHz | 16 GB | 9.64 |
| Geekom XT12 Pro | i9-12900H 80 W / 35 W | Iris Xe G7 96EUs | 32 GB | 26.9 |
| Intel NUC 13 Pro Desk Edition Kit | i7-1360P 64 W / 40 W | Iris Xe G7 96EUs | 32 GB | 27.4 |
| Minisforum Venus Series NAB9 | i9-12900HK 64 W / 45 W | Iris Xe G7 96EUs | 32 GB | 27.7 |
| Geekom GT13 Pro | i9-13900H 64 W / 35 W | Iris Xe G7 96EUs 1500 MHz | 32 GB | 28.2 |
| Minisforum MS-01 | i9-13900H 80 W / 60 W | Iris Xe G7 96EUs | 32 GB | 30 |
| Model | CPU | GPU | RAM | Value |
|---|---|---|---|---|
| Geekom Mini IT11, i7-11390H | i7-11390H 64 W / 35 W | Iris Xe G7 96EUs 1400 / 2000 MHz | 32 GB | 29.2 |
| Intel NUC 13 Pro Desk Edition Kit | i7-1360P 64 W / 40 W | Iris Xe G7 96EUs | 32 GB | 35.4 |
| Minisforum Venus Series NAB9 | i9-12900HK 64 W / 45 W | Iris Xe G7 96EUs | 32 GB | 35.9 |
| Minisforum EliteMini TH50 | i5-11320H 35 W / 35 W | Iris Xe G7 96EUs | 16 GB | 37.1 |
| Geekom XT12 Pro | i9-12900H 80 W / 35 W | Iris Xe G7 96EUs | 32 GB | 37.1 |
| Geekom Mini IT12 | i7-1260P 64 W / 28 W | Iris Xe G7 96EUs 1400 / 2666 MHz | 16 GB | 38.5 |
| Geekom GT13 Pro | i9-13900H 64 W / 35 W | Iris Xe G7 96EUs 1500 MHz | 32 GB | 38.6 |
| Khadas Mind | i7-1360P 64 W / 28 W | Iris Xe G7 96EUs | 32 GB | 39.4 |
| Intel NUC 13 Pro Kit NUC13ANK | i7-1360P 64 W / 40 W | Iris Xe G7 96EUs | 32 GB | 39.5 |
| Minisforum Neptune Series NAD9 | i9-12900H | Iris Xe G7 96EUs 1450 / 2600 MHz | 16 GB | 41.2 |
| Minisforum MS-01 | i9-13900H 80 W / 60 W | Iris Xe G7 96EUs | 32 GB | 41.7 |
| Model | CPU | GPU | RAM | Value |
|---|---|---|---|---|
| Geekom Mini IT11, i7-11390H | i7-11390H 64 W / 35 W | Iris Xe G7 96EUs 1400 / 2000 MHz | 32 GB | 30.1 |
| Khadas Mind | i7-1360P 64 W / 28 W | Iris Xe G7 96EUs | 32 GB | 37.8 |
| Geekom Mini IT12 | i7-1260P 64 W / 28 W | Iris Xe G7 96EUs 1400 / 2666 MHz | 16 GB | 38.7 |
| Minisforum EliteMini TH50 | i5-11320H 35 W / 35 W | Iris Xe G7 96EUs | 16 GB | 38.8 |
| Geekom XT12 Pro | i9-12900H 80 W / 35 W | Iris Xe G7 96EUs | 32 GB | 40.1 |
| Minisforum Venus Series NAB9 | i9-12900HK 64 W / 45 W | Iris Xe G7 96EUs | 32 GB | 40.2 |
| Intel NUC 13 Pro Kit NUC13ANK | i7-1360P 64 W / 40 W | Iris Xe G7 96EUs | 32 GB | 40.3 |
| Minisforum Neptune Series NAD9 | i9-12900H | Iris Xe G7 96EUs 1450 / 2600 MHz | 16 GB | 40.9 |
| Intel NUC 13 Pro Desk Edition Kit | i7-1360P 64 W / 40 W | Iris Xe G7 96EUs | 32 GB | 41 |
| Geekom GT13 Pro | i9-13900H 64 W / 35 W | Iris Xe G7 96EUs 1500 MHz | 32 GB | 41.4 |
| Minisforum MS-01 | i9-13900H 80 W / 60 W | Iris Xe G7 96EUs | 32 GB | 46.7 |
| Model | CPU | GPU | RAM | Value |
|---|---|---|---|---|
| Schenker Vision 15 | i7-1165G7 50 W / 40 W | Iris Xe G7 96EUs 1300 / 1600 MHz | 16 GB | 11.66 |
| Geekom Mini IT11, i7-11390H | i7-11390H 64 W / 35 W | Iris Xe G7 96EUs 1400 / 2000 MHz | 32 GB | 47.6 |
| Minisforum EliteMini TH50 | i5-11320H 35 W / 35 W | Iris Xe G7 96EUs | 16 GB | 49.7 |
| Khadas Mind | i7-1360P 64 W / 28 W | Iris Xe G7 96EUs | 32 GB | 53.7 |
| Geekom Mini IT12 | i7-1260P 64 W / 28 W | Iris Xe G7 96EUs 1400 / 2666 MHz | 16 GB | 54.1 |
| Intel NUC 13 Pro Kit NUC13ANK | i7-1360P 64 W / 40 W | Iris Xe G7 96EUs | 32 GB | 55.7 |
| Minisforum Neptune Series NAD9 | i9-12900H | Iris Xe G7 96EUs 1450 / 2600 MHz | 16 GB | 55.8 |
| Intel NUC 13 Pro Desk Edition Kit | i7-1360P 64 W / 40 W | Iris Xe G7 96EUs | 32 GB | 55.8 |
| Geekom XT12 Pro | i9-12900H 80 W / 35 W | Iris Xe G7 96EUs | 32 GB | 57.1 |
| Minisforum Venus Series NAB9 | i9-12900HK 64 W / 45 W | Iris Xe G7 96EUs | 32 GB | 57.4 |
| Geekom GT13 Pro | i9-13900H 64 W / 35 W | Iris Xe G7 96EUs 1500 MHz | 32 GB | 58.3 |
| Minisforum MS-01 | i9-13900H 80 W / 60 W | Iris Xe G7 96EUs | 32 GB | 63.7 |
| Model | CPU | GPU | RAM | Value |
|---|---|---|---|---|
| Geekom Mini IT11, i7-11390H | i7-11390H 64 W / 35 W | Iris Xe G7 96EUs 1400 / 2000 MHz | 32 GB | 5.16 |
| Schenker Vision 15 | i7-1165G7 50 W / 40 W | Iris Xe G7 96EUs 1300 / 1600 MHz | 16 GB | 5.29 |
| Minisforum EliteMini TH50 | i5-11320H 35 W / 35 W | Iris Xe G7 96EUs | 16 GB | 6.19 |
| Khadas Mind | i7-1360P 64 W / 28 W | Iris Xe G7 96EUs | 32 GB | 6.2 |
| Intel NUC 13 Pro Desk Edition Kit | i7-1360P 64 W / 40 W | Iris Xe G7 96EUs | 32 GB | 6.29 |
| Geekom Mini IT12 | i7-1260P 64 W / 28 W | Iris Xe G7 96EUs 1400 / 2666 MHz | 16 GB | 6.44 |
| Geekom XT12 Pro | i9-12900H 80 W / 35 W | Iris Xe G7 96EUs | 32 GB | 6.55 |
| Geekom GT13 Pro | i9-13900H 64 W / 35 W | Iris Xe G7 96EUs 1500 MHz | 32 GB | 6.85 |
| Minisforum Venus Series NAB9 | i9-12900HK 64 W / 45 W | Iris Xe G7 96EUs | 32 GB | 6.98 |
| Minisforum Neptune Series NAD9 | i9-12900H | Iris Xe G7 96EUs 1450 / 2600 MHz | 16 GB | 7.02 |
| Intel NUC 13 Pro Kit NUC13ANK | i7-1360P 64 W / 40 W | Iris Xe G7 96EUs | 32 GB | 7.02 |
| Minisforum MS-01 | i9-13900H 80 W / 60 W | Iris Xe G7 96EUs | 32 GB | 7.03 |
| Model | CPU | GPU | RAM | Value |
|---|---|---|---|---|
| Geekom Mini IT11, i7-11390H | i7-11390H 64 W / 35 W | Iris Xe G7 96EUs 1400 / 2000 MHz | 32 GB | 14.8 |
| Geekom Mini IT12 | i7-1260P 64 W / 28 W | Iris Xe G7 96EUs 1400 / 2666 MHz | 16 GB | 16.8 |
| Geekom XT12 Pro | i9-12900H 80 W / 35 W | Iris Xe G7 96EUs | 32 GB | 17.3 |
| Minisforum Venus Series NAB9 | i9-12900HK 64 W / 45 W | Iris Xe G7 96EUs | 32 GB | 17.3 |
| Minisforum Neptune Series NAD9 | i9-12900H | Iris Xe G7 96EUs 1450 / 2600 MHz | 16 GB | 17.9 |
| Intel NUC 13 Pro Desk Edition Kit | i7-1360P 64 W / 40 W | Iris Xe G7 96EUs | 32 GB | 18.1 |
| Intel NUC 13 Pro Kit NUC13ANK | i7-1360P 64 W / 40 W | Iris Xe G7 96EUs | 32 GB | 18.2 |
| Minisforum EliteMini TH50 | i5-11320H 35 W / 35 W | Iris Xe G7 96EUs | 16 GB | 18.4 |
| Geekom GT13 Pro | i9-13900H 64 W / 35 W | Iris Xe G7 96EUs 1500 MHz | 32 GB | 19.1 |
| Khadas Mind | i7-1360P 64 W / 28 W | Iris Xe G7 96EUs | 32 GB | 21.4 |
| Schenker Vision 15 | i7-1165G7 50 W / 40 W | Iris Xe G7 96EUs 1300 / 1600 MHz | 16 GB | 21.71 |
| Minisforum MS-01 | i9-13900H 80 W / 60 W | Iris Xe G7 96EUs | 32 GB | 25 |
| Model | CPU | GPU | RAM | Value |
|---|---|---|---|---|
| Schenker Vision 15 | i7-1165G7 50 W / 40 W | Iris Xe G7 96EUs 1300 / 1600 MHz | 16 GB | 8.47 |
| Geekom Mini IT11, i7-11390H | i7-11390H 64 W / 35 W | Iris Xe G7 96EUs 1400 / 2000 MHz | 32 GB | 10.9 |
| Minisforum EliteMini TH50 | i5-11320H 35 W / 35 W | Iris Xe G7 96EUs | 16 GB | 13.1 |
| Geekom Mini IT12 | i7-1260P 64 W / 28 W | Iris Xe G7 96EUs 1400 / 2666 MHz | 16 GB | 14 |
| Geekom XT12 Pro | i9-12900H 80 W / 35 W | Iris Xe G7 96EUs | 32 GB | 14.4 |
| Minisforum Venus Series NAB9 | i9-12900HK 64 W / 45 W | Iris Xe G7 96EUs | 32 GB | 14.4 |
| Minisforum Neptune Series NAD9 | i9-12900H | Iris Xe G7 96EUs 1450 / 2600 MHz | 16 GB | 14.5 |
| Intel NUC 13 Pro Desk Edition Kit | i7-1360P 64 W / 40 W | Iris Xe G7 96EUs | 32 GB | 15.2 |
| Intel NUC 13 Pro Kit NUC13ANK | i7-1360P 64 W / 40 W | Iris Xe G7 96EUs | 32 GB | 15.4 |
| Geekom GT13 Pro | i9-13900H 64 W / 35 W | Iris Xe G7 96EUs 1500 MHz | 32 GB | 15.6 |
| Minisforum MS-01 | i9-13900H 80 W / 60 W | Iris Xe G7 96EUs | 32 GB | 15.8 |
| Khadas Mind | i7-1360P 64 W / 28 W | Iris Xe G7 96EUs | 32 GB | 16 |
| Model | CPU | GPU | RAM | Value |
|---|---|---|---|---|
| Geekom Mini IT11, i7-11390H | i7-11390H 64 W / 35 W | Iris Xe G7 96EUs 1400 / 2000 MHz | 32 GB | 34.3 |
| Minisforum EliteMini TH50 | i5-11320H 35 W / 35 W | Iris Xe G7 96EUs | 16 GB | 39.3 |
| Schenker Vision 15 | i7-1165G7 50 W / 40 W | Iris Xe G7 96EUs 1300 / 1600 MHz | 16 GB | 40.42 |
| Geekom Mini IT12 | i7-1260P 64 W / 28 W | Iris Xe G7 96EUs 1400 / 2666 MHz | 16 GB | 42.9 |
| Minisforum Neptune Series NAD9 | i9-12900H | Iris Xe G7 96EUs 1450 / 2600 MHz | 16 GB | 44.2 |
| Intel NUC 13 Pro Kit NUC13ANK | i7-1360P 64 W / 40 W | Iris Xe G7 96EUs | 32 GB | 44.6 |
| Khadas Mind | i7-1360P 64 W / 28 W | Iris Xe G7 96EUs | 32 GB | 46.3 |
| Intel NUC 13 Pro Desk Edition Kit | i7-1360P 64 W / 40 W | Iris Xe G7 96EUs | 32 GB | 47.2 |
| Geekom XT12 Pro | i9-12900H 80 W / 35 W | Iris Xe G7 96EUs | 32 GB | 47.5 |
| Minisforum Venus Series NAB9 | i9-12900HK 64 W / 45 W | Iris Xe G7 96EUs | 32 GB | 48.3 |
| Geekom GT13 Pro | i9-13900H 64 W / 35 W | Iris Xe G7 96EUs 1500 MHz | 32 GB | 51.6 |
| Minisforum MS-01 | i9-13900H 80 W / 60 W | Iris Xe G7 96EUs | 32 GB | 58.4 |
| Model | CPU | GPU | RAM | Value |
|---|---|---|---|---|
| Geekom Mini IT11, i7-11390H | i7-11390H 64 W / 35 W | Iris Xe G7 96EUs 1400 / 2000 MHz | 32 GB | 3.35 |
| Minisforum EliteMini TH50 | i5-11320H 35 W / 35 W | Iris Xe G7 96EUs | 16 GB | 3.64 |
| Schenker Vision 15 | i7-1165G7 50 W / 40 W | Iris Xe G7 96EUs 1300 / 1600 MHz | 16 GB | 4.02 |
| Intel NUC 13 Pro Kit NUC13ANK | i7-1360P 64 W / 40 W | Iris Xe G7 96EUs | 32 GB | 4.23 |
| Minisforum Neptune Series NAD9 | i9-12900H | Iris Xe G7 96EUs 1450 / 2600 MHz | 16 GB | 4.27 |
| Geekom Mini IT12 | i7-1260P 64 W / 28 W | Iris Xe G7 96EUs 1400 / 2666 MHz | 16 GB | 4.29 |
| Intel NUC 13 Pro Desk Edition Kit | i7-1360P 64 W / 40 W | Iris Xe G7 96EUs | 32 GB | 4.32 |
| Khadas Mind | i7-1360P 64 W / 28 W | Iris Xe G7 96EUs | 32 GB | 4.34 |
| Minisforum Venus Series NAB9 | i9-12900HK 64 W / 45 W | Iris Xe G7 96EUs | 32 GB | 4.39 |
| Geekom XT12 Pro | i9-12900H 80 W / 35 W | Iris Xe G7 96EUs | 32 GB | 4.5 |
| Geekom GT13 Pro | i9-13900H 64 W / 35 W | Iris Xe G7 96EUs 1500 MHz | 32 GB | 4.62 |
| Minisforum MS-01 | i9-13900H 80 W / 60 W | Iris Xe G7 96EUs | 32 GB | 4.72 |
| Model | CPU | GPU | RAM | Value |
|---|---|---|---|---|
| Schenker Vision 15 | i7-1165G7 50 W / 40 W | Iris Xe G7 96EUs 1300 / 1600 MHz | 16 GB | 3.38 |
| Geekom Mini IT11, i7-11390H | i7-11390H 64 W / 35 W | Iris Xe G7 96EUs 1400 / 2000 MHz | 32 GB | 30.3 |
| Minisforum EliteMini TH50 | i5-11320H 35 W / 35 W | Iris Xe G7 96EUs | 16 GB | 34.2 |
| Geekom Mini IT12 | i7-1260P 64 W / 28 W | Iris Xe G7 96EUs 1400 / 2666 MHz | 16 GB | 36.8 |
| Khadas Mind | i7-1360P 64 W / 28 W | Iris Xe G7 96EUs | 32 GB | 37.5 |
| Intel NUC 13 Pro Kit NUC13ANK | i7-1360P 64 W / 40 W | Iris Xe G7 96EUs | 32 GB | 38 |
| Minisforum Neptune Series NAD9 | i9-12900H | Iris Xe G7 96EUs 1450 / 2600 MHz | 16 GB | 38.8 |
| Intel NUC 13 Pro Desk Edition Kit | i7-1360P 64 W / 40 W | Iris Xe G7 96EUs | 32 GB | 39.5 |
| Minisforum Venus Series NAB9 | i9-12900HK 64 W / 45 W | Iris Xe G7 96EUs | 32 GB | 40.2 |
| Geekom XT12 Pro | i9-12900H 80 W / 35 W | Iris Xe G7 96EUs | 32 GB | 41.1 |
| Geekom GT13 Pro | i9-13900H 64 W / 35 W | Iris Xe G7 96EUs 1500 MHz | 32 GB | 42.7 |
| Minisforum MS-01 | i9-13900H 80 W / 60 W | Iris Xe G7 96EUs | 32 GB | 46.2 |
| Model | CPU | GPU | RAM | Value |
|---|---|---|---|---|
| Geekom Mini IT11, i7-11390H | i7-11390H 64 W / 35 W | Iris Xe G7 96EUs 1400 / 2000 MHz | 32 GB | 42.5 |
| Intel NUC 13 Pro Desk Edition Kit | i7-1360P 64 W / 40 W | Iris Xe G7 96EUs | 32 GB | 49 |
| Geekom XT12 Pro | i9-12900H 80 W / 35 W | Iris Xe G7 96EUs | 32 GB | 51.3 |
| Minisforum Venus Series NAB9 | i9-12900HK 64 W / 45 W | Iris Xe G7 96EUs | 32 GB | 51.6 |
| Minisforum EliteMini TH50 | i5-11320H 35 W / 35 W | Iris Xe G7 96EUs | 16 GB | 52.9 |
| Geekom GT13 Pro | i9-13900H 64 W / 35 W | Iris Xe G7 96EUs 1500 MHz | 32 GB | 54.7 |
| Geekom Mini IT12 | i7-1260P 64 W / 28 W | Iris Xe G7 96EUs 1400 / 2666 MHz | 16 GB | 56.3 |
| Intel NUC 13 Pro Kit NUC13ANK | i7-1360P 64 W / 40 W | Iris Xe G7 96EUs | 32 GB | 56.6 |
| Khadas Mind | i7-1360P 64 W / 28 W | Iris Xe G7 96EUs | 32 GB | 57.1 |
| Minisforum MS-01 | i9-13900H 80 W / 60 W | Iris Xe G7 96EUs | 32 GB | 58.9 |
| Minisforum Neptune Series NAD9 | i9-12900H | Iris Xe G7 96EUs 1450 / 2600 MHz | 16 GB | 59.4 |
| Schenker Vision 15 | i7-1165G7 50 W / 40 W | Iris Xe G7 96EUs 1300 / 1600 MHz | 16 GB | 61 |
| Model | CPU | GPU | RAM | Value |
|---|---|---|---|---|
| Geekom Mini IT11, i7-11390H | i7-11390H 64 W / 35 W | Iris Xe G7 96EUs 1400 / 2000 MHz | 32 GB | 30 |
| Geekom Mini IT12 | i7-1260P 64 W / 28 W | Iris Xe G7 96EUs 1400 / 2666 MHz | 16 GB | 37.9 |
| Schenker Vision 15 | i7-1165G7 50 W / 40 W | Iris Xe G7 96EUs 1300 / 1600 MHz | 16 GB | 37.94 |
| Minisforum EliteMini TH50 | i5-11320H 35 W / 35 W | Iris Xe G7 96EUs | 16 GB | 38.5 |
| Khadas Mind | i7-1360P 64 W / 28 W | Iris Xe G7 96EUs | 32 GB | 39 |
| Minisforum Venus Series NAB9 | i9-12900HK 64 W / 45 W | Iris Xe G7 96EUs | 32 GB | 39.9 |
| Geekom XT12 Pro | i9-12900H 80 W / 35 W | Iris Xe G7 96EUs | 32 GB | 40.1 |
| Intel NUC 13 Pro Kit NUC13ANK | i7-1360P 64 W / 40 W | Iris Xe G7 96EUs | 32 GB | 40.2 |
| Minisforum Neptune Series NAD9 | i9-12900H | Iris Xe G7 96EUs 1450 / 2600 MHz | 16 GB | 40.5 |
| Intel NUC 13 Pro Desk Edition Kit | i7-1360P 64 W / 40 W | Iris Xe G7 96EUs | 32 GB | 40.5 |
| Geekom GT13 Pro | i9-13900H 64 W / 35 W | Iris Xe G7 96EUs 1500 MHz | 32 GB | 41.2 |
| Minisforum MS-01 | i9-13900H 80 W / 60 W | Iris Xe G7 96EUs | 32 GB | 46.5 |
| Model | CPU | GPU | RAM | Value |
|---|---|---|---|---|
| Geekom GT13 Pro | i9-13900H 64 W / 35 W | Iris Xe G7 96EUs 1500 MHz | 32 GB | 19.1 |
| Model | CPU | GPU | RAM | Value |
|---|---|---|---|---|
| BMAX B9 Power | i9-12900HK 55 W / 45 W | Iris Xe G7 96EUs | 32 GB | 3.84 |
| Alliwava GH9, i9-12900HK | i9-12900HK 60 W / 45 W | Iris Xe G7 96EUs | 32 GB | 4.24 |
| GMK NucBox M3 Ultra | i7-12700H 35 W / 35 W | Iris Xe G7 96EUs 1400 MHz | 32 GB | 4.39 |
| Lenovo Yoga Slim 7 Carbon 13IAP7-82U9005FGE | i7-1260P 46 W / 28 W | Iris Xe G7 96EUs 1400 / 2400 MHz | 16 GB | 5.98 |
| Geekom XT13 Pro | i9-13900H | Iris Xe G7 96EUs | 32 GB | 6.42 |
| Geekom XT12 Pro | i9-12900H 80 W / 35 W | Iris Xe G7 96EUs | 32 GB | 6.47 |
| Geekom GT13 Pro | i9-13900H 64 W / 35 W | Iris Xe G7 96EUs 1500 MHz | 32 GB | 6.86 |
| Minisforum Venus Series NAB9 | i9-12900HK 64 W / 45 W | Iris Xe G7 96EUs | 32 GB | 6.99 |
| Model | CPU | GPU | RAM | Value |
|---|---|---|---|---|
| Lenovo Yoga Slim 7 Carbon 13IAP7-82U9005FGE | i7-1260P 46 W / 28 W | Iris Xe G7 96EUs 1400 / 2400 MHz | 16 GB | 6.37 |
| Geekom GT13 Pro | i9-13900H 64 W / 35 W | Iris Xe G7 96EUs 1500 MHz | 32 GB | 7.28 |
| Alliwava GH9, i9-12900HK | i9-12900HK 60 W / 45 W | Iris Xe G7 96EUs | 32 GB | 8.36 |
| GMK NucBox M3 Ultra | i7-12700H 35 W / 35 W | Iris Xe G7 96EUs 1400 MHz | 32 GB | 8.47 |
| BMAX B9 Power | i9-12900HK 55 W / 45 W | Iris Xe G7 96EUs | 32 GB | 8.64 |
| Minisforum Venus Series NAB9 | i9-12900HK 64 W / 45 W | Iris Xe G7 96EUs | 32 GB | 8.69 |
| Geekom XT12 Pro | i9-12900H 80 W / 35 W | Iris Xe G7 96EUs | 32 GB | 8.76 |
| Geekom XT13 Pro | i9-13900H | Iris Xe G7 96EUs | 32 GB | 9.13 |
| Model | CPU | GPU | RAM | Value |
|---|---|---|---|---|
| Lenovo Yoga Slim 7 Carbon 13IAP7-82U9005FGE | i7-1260P 46 W / 28 W | Iris Xe G7 96EUs 1400 / 2400 MHz | 16 GB | 49.8 |
| BMAX B9 Power | i9-12900HK 55 W / 45 W | Iris Xe G7 96EUs | 32 GB | 61.6 |
| Geekom XT12 Pro | i9-12900H 80 W / 35 W | Iris Xe G7 96EUs | 32 GB | 63.2 |
| Minisforum Venus Series NAB9 | i9-12900HK 64 W / 45 W | Iris Xe G7 96EUs | 32 GB | 63.3 |
| Alliwava GH9, i9-12900HK | i9-12900HK 60 W / 45 W | Iris Xe G7 96EUs | 32 GB | 63.6 |
| GMK NucBox M3 Ultra | i7-12700H 35 W / 35 W | Iris Xe G7 96EUs 1400 MHz | 32 GB | 64.2 |
| Geekom XT13 Pro | i9-13900H | Iris Xe G7 96EUs | 32 GB | 67.5 |
| Geekom GT13 Pro | i9-13900H 64 W / 35 W | Iris Xe G7 96EUs 1500 MHz | 32 GB | 68.8 |
| Model | CPU | GPU | RAM | Value |
|---|---|---|---|---|
| Lenovo Yoga Slim 7 Carbon 13IAP7-82U9005FGE | i7-1260P 46 W / 28 W | Iris Xe G7 96EUs 1400 / 2400 MHz | 16 GB | 4.02 |
| Alliwava GH9, i9-12900HK | i9-12900HK 60 W / 45 W | Iris Xe G7 96EUs | 32 GB | 4.31 |
| GMK NucBox M3 Ultra | i7-12700H 35 W / 35 W | Iris Xe G7 96EUs 1400 MHz | 32 GB | 4.34 |
| BMAX B9 Power | i9-12900HK 55 W / 45 W | Iris Xe G7 96EUs | 32 GB | 4.36 |
| Minisforum Venus Series NAB9 | i9-12900HK 64 W / 45 W | Iris Xe G7 96EUs | 32 GB | 4.39 |
| Geekom XT12 Pro | i9-12900H 80 W / 35 W | Iris Xe G7 96EUs | 32 GB | 4.49 |
| Geekom XT13 Pro | i9-13900H | Iris Xe G7 96EUs | 32 GB | 4.62 |
| Geekom GT13 Pro | i9-13900H 64 W / 35 W | Iris Xe G7 96EUs 1500 MHz | 32 GB | 4.63 |
| Model | CPU | GPU | RAM | Value |
|---|---|---|---|---|
| Lenovo Yoga Slim 7 Carbon 13IAP7-82U9005FGE | i7-1260P 46 W / 28 W | Iris Xe G7 96EUs 1400 / 2400 MHz | 16 GB | 23.6 |
| BMAX B9 Power | i9-12900HK 55 W / 45 W | Iris Xe G7 96EUs | 32 GB | 24.4 |
| Alliwava GH9, i9-12900HK | i9-12900HK 60 W / 45 W | Iris Xe G7 96EUs | 32 GB | 25.2 |
| GMK NucBox M3 Ultra | i7-12700H 35 W / 35 W | Iris Xe G7 96EUs 1400 MHz | 32 GB | 25.8 |
| Minisforum Venus Series NAB9 | i9-12900HK 64 W / 45 W | Iris Xe G7 96EUs | 32 GB | 27.1 |
| Geekom XT12 Pro | i9-12900H 80 W / 35 W | Iris Xe G7 96EUs | 32 GB | 27.5 |
| Geekom XT13 Pro | i9-13900H | Iris Xe G7 96EUs | 32 GB | 28.6 |
| Geekom GT13 Pro | i9-13900H 64 W / 35 W | Iris Xe G7 96EUs 1500 MHz | 32 GB | 28.7 |
| Model | CPU | GPU | RAM | Value |
|---|---|---|---|---|
| BMAX B9 Power | i9-12900HK 55 W / 45 W | Iris Xe G7 96EUs | 32 GB | 12.3 |
| Lenovo Yoga Slim 7 Carbon 13IAP7-82U9005FGE | i7-1260P 46 W / 28 W | Iris Xe G7 96EUs 1400 / 2400 MHz | 16 GB | 12.5 |
| Geekom XT12 Pro | i9-12900H 80 W / 35 W | Iris Xe G7 96EUs | 32 GB | 12.6 |
| Geekom XT13 Pro | i9-13900H | Iris Xe G7 96EUs | 32 GB | 13.1 |
| Alliwava GH9, i9-12900HK | i9-12900HK 60 W / 45 W | Iris Xe G7 96EUs | 32 GB | 13.1 |
| Minisforum Venus Series NAB9 | i9-12900HK 64 W / 45 W | Iris Xe G7 96EUs | 32 GB | 13.2 |
| GMK NucBox M3 Ultra | i7-12700H 35 W / 35 W | Iris Xe G7 96EUs 1400 MHz | 32 GB | 13.2 |
| Geekom GT13 Pro | i9-13900H 64 W / 35 W | Iris Xe G7 96EUs 1500 MHz | 32 GB | 13.8 |
| Model | CPU | GPU | RAM | Value |
|---|---|---|---|---|
| Lenovo Yoga Slim 7 Carbon 13IAP7-82U9005FGE | i7-1260P 46 W / 28 W | Iris Xe G7 96EUs 1400 / 2400 MHz | 16 GB | 13.4 |
| BMAX B9 Power | i9-12900HK 55 W / 45 W | Iris Xe G7 96EUs | 32 GB | 14.7 |
| Alliwava GH9, i9-12900HK | i9-12900HK 60 W / 45 W | Iris Xe G7 96EUs | 32 GB | 14.7 |
| GMK NucBox M3 Ultra | i7-12700H 35 W / 35 W | Iris Xe G7 96EUs 1400 MHz | 32 GB | 14.7 |
| Geekom XT12 Pro | i9-12900H 80 W / 35 W | Iris Xe G7 96EUs | 32 GB | 15.7 |
| Minisforum Venus Series NAB9 | i9-12900HK 64 W / 45 W | Iris Xe G7 96EUs | 32 GB | 15.7 |
| Geekom GT13 Pro | i9-13900H 64 W / 35 W | Iris Xe G7 96EUs 1500 MHz | 32 GB | 16.1 |
| Geekom XT13 Pro | i9-13900H | Iris Xe G7 96EUs | 32 GB | 16.1 |
| Model | CPU | GPU | RAM | Value |
|---|---|---|---|---|
| Geekom Mini IT11, i7-11390H | i7-11390H 64 W / 35 W | Iris Xe G7 96EUs 1400 / 2000 MHz | 32 GB | 3.61 |
| Minisforum Neptune Series NAD9 | i9-12900H | Iris Xe G7 96EUs 1450 / 2600 MHz | 16 GB | 4.1 |
| Khadas Mind | i7-1360P 64 W / 28 W | Iris Xe G7 96EUs | 32 GB | 5.08 |
| Intel NUC 13 Pro Desk Edition Kit | i7-1360P 64 W / 40 W | Iris Xe G7 96EUs | 32 GB | 6.93 |
| Geekom GT13 Pro | i9-13900H 64 W / 35 W | Iris Xe G7 96EUs 1500 MHz | 32 GB | 7.39 |
| Minisforum MS-01 | i9-13900H 80 W / 60 W | Iris Xe G7 96EUs | 32 GB | 9.18 |
| Minisforum EliteMini TH50 | i5-11320H 35 W / 35 W | Iris Xe G7 96EUs | 16 GB | 14 |
| GPU TDP ? | TDP 8 W | TDP 12 W | TDP 13 W |
|---|---|---|---|
| 93% | 100% | 91% | 83% |
| GPU TDP ? | TDP 8 W | TDP 12 W | TDP 13 W |
|---|---|---|---|
| 100% | 100% | 100% | 100% |
| Model | CPU | GPU | RAM | Value |
|---|---|---|---|---|
| Asus Chromebook Flip CX5 CX5601FB | i7-1255U | Iris Xe G7 96EUs | 16 GB | 14 |
| Model | CPU | GPU | RAM | Value |
|---|---|---|---|---|
| Asus Chromebook Flip CX5 CX5601FB | i7-1255U | Iris Xe G7 96EUs | 16 GB | 35 |
| Lenovo ThinkPad X1 Nano-20UN002UGE | i7-1160G7 40 W / 19 W | Iris Xe G7 96EUs 1100 / 1600 MHz | 16 GB | 37.8 |
| Asus ZenBook Flip S UX371 | i7-1165G7 51 W / 25 W | Iris Xe G7 96EUs | 16 GB | 43.7 |
| MSI Prestige 14 Evo A11MO-026US DX12 | i7-1195G7 64 W / 36 W | Iris Xe G7 96EUs | 16 GB | 50 |
| MSI Prestige 14 Evo A11MO-026US Vulkan | i7-1195G7 64 W / 36 W | Iris Xe G7 96EUs | 16 GB | 57.8 |
| Model | CPU | GPU | RAM | Value |
|---|---|---|---|---|
| Asus Chromebook Flip CX5 CX5601FB | i7-1255U | Iris Xe G7 96EUs | 16 GB | 84 |
| Asus ZenBook Flip S UX371 | i7-1165G7 51 W / 25 W | Iris Xe G7 96EUs | 16 GB | 85.5 |
| Lenovo ThinkPad X1 Nano-20UN002UGE | i7-1160G7 40 W / 19 W | Iris Xe G7 96EUs 1100 / 1600 MHz | 16 GB | 104.3 |
| MSI Prestige 14 Evo A11MO-026US DX12 | i7-1195G7 64 W / 36 W | Iris Xe G7 96EUs | 16 GB | 135 |
| MSI Prestige 14 Evo A11MO-026US Vulkan | i7-1195G7 64 W / 36 W | Iris Xe G7 96EUs | 16 GB | 153 |
| Model | CPU | GPU | RAM | Value |
|---|---|---|---|---|
| Asus ZenBook Flip S UX371 | i7-1165G7 51 W / 25 W | Iris Xe G7 96EUs | 16 GB | 81.5 |
| Asus Chromebook Flip CX5 CX5601FB | i7-1255U | Iris Xe G7 96EUs | 16 GB | 90 |
| Lenovo ThinkPad X1 Nano-20UN002UGE | i7-1160G7 40 W / 19 W | Iris Xe G7 96EUs 1100 / 1600 MHz | 16 GB | 93.6 |
| Dynabook Portégé X30W-J-10K | i7-1165G7 @4.7 GHz 60 W / 28 W | Iris Xe G7 96EUs 1300 / 2000 MHz | 16 GB | 111.6 |
| Model | CPU | GPU | RAM | Value |
|---|---|---|---|---|
| Asus ZenBook Flip S UX371 | i7-1165G7 51 W / 25 W | Iris Xe G7 96EUs | 16 GB | 108.3 |
| Asus Chromebook Flip CX5 CX5601FB | i7-1255U | Iris Xe G7 96EUs | 16 GB | 118 |
| Lenovo ThinkPad X1 Nano-20UN002UGE | i7-1160G7 40 W / 19 W | Iris Xe G7 96EUs 1100 / 1600 MHz | 16 GB | 119.3 |
| Acer SF514-55T | i7-1165G7 | Iris Xe G7 96EUs 400 / 1600 MHz | 16 GB | 161 |
| Model | CPU | GPU | RAM | Value |
|---|---|---|---|---|
| Asus Chromebook Flip CX5 CX5601FB | i7-1255U | Iris Xe G7 96EUs | 16 GB | 139 |
| Asus ZenBook Flip S UX371 | i7-1165G7 51 W / 25 W | Iris Xe G7 96EUs | 16 GB | 164.4 |
| Lenovo ThinkPad X1 Nano-20UN002UGE | i7-1160G7 40 W / 19 W | Iris Xe G7 96EUs 1100 / 1600 MHz | 16 GB | 174.4 |
| Model | CPU | GPU | RAM | Value |
|---|---|---|---|---|
| Asus ZenBook Flip S UX371 | i7-1165G7 51 W / 25 W | Iris Xe G7 96EUs | 16 GB | 256 |
| Lenovo ThinkPad X1 Nano-20UN002UGE | i7-1160G7 40 W / 19 W | Iris Xe G7 96EUs 1100 / 1600 MHz | 16 GB | 259.4 |
| GPU TDP ? | TDP 8 W | TDP 12 W | TDP 13 W |
|---|---|---|---|
| 101% | 100% | 100% | 102% |
| Model | CPU | GPU | RAM | Value |
|---|---|---|---|---|
| MSI Prestige 14 Evo A11MO-026US DX12 | i7-1195G7 64 W / 36 W | Iris Xe G7 96EUs | 16 GB | 32.2 |
| GPU TDP ? | TDP 8 W | TDP 12 W | TDP 13 W |
|---|---|---|---|
| 100% | 94% | 90% | 76% |
| Model | CPU | GPU | RAM | Value |
|---|---|---|---|---|
| Asus ExpertBook P1 P1503CVA-S70188X | i7-13700H 45 W / 28 W | Iris Xe G7 96EUs 1500 MHz | 16 GB | 43.1 |
| Dell Latitude 7030 Rugged Extreme | i7-1260U 30 W / 22 W | Iris Xe G7 96EUs 950 / 2600 MHz | 32 GB | 45.3 |
| Lenovo IdeaPad Slim 5 16IRU9 | Core 7 150U 37 W / 22 W | Iris Xe G7 96EUs 1300 MHz | 16 GB | 48.7 |
| Model | CPU | GPU | RAM | Value |
|---|---|---|---|---|
| MSI Cubi NUC 1M | Core 7 150U 32 W / 20 W | Iris Xe G7 96EUs 1300 / 2600 MHz | 16 GB | 36.1 |
| Dell Latitude 7030 Rugged Extreme | i7-1260U 30 W / 22 W | Iris Xe G7 96EUs 950 / 2600 MHz | 32 GB | 38.8 |
| Lenovo IdeaPad Slim 5 16IRU9 | Core 7 150U 37 W / 22 W | Iris Xe G7 96EUs 1300 MHz | 16 GB | 41.2 |
| Geekom Mini IT13 | i9-13900HK 55 W / 35 W | Iris Xe G7 96EUs 1500 MHz | 32 GB | 41.6 |
| Beelink SEi13 Pro | i9-13900HK 46 W / 44 W | Iris Xe G7 96EUs 1500 MHz | 32 GB | 53.4 |
| Geekom XT13 Pro | i9-13900H | Iris Xe G7 96EUs | 32 GB | 54 |
| Geekom GT13 Pro | i9-13900H 64 W / 35 W | Iris Xe G7 96EUs 1500 MHz | 32 GB | 55.9 |
| Beelink GTI13 Ultra | i9-13900HK 65 W / 55 W | Iris Xe G7 96EUs 1500 / 2600 MHz | 32 GB | 91.9 |
| Model | CPU | GPU | RAM | Value |
|---|---|---|---|---|
| Beelink GTI13 Ultra | i9-13900HK 65 W / 55 W | Iris Xe G7 96EUs 1500 / 2600 MHz | 32 GB | 0.1382 |
| Beelink SEi13 Pro | i9-13900HK 46 W / 44 W | Iris Xe G7 96EUs 1500 MHz | 32 GB | 0.1397 |
| Geekom Mini IT13 | i9-13900HK 55 W / 35 W | Iris Xe G7 96EUs 1500 MHz | 32 GB | 0.2327 |
| MSI Cubi NUC 1M | Core 7 150U 32 W / 20 W | Iris Xe G7 96EUs 1300 / 2600 MHz | 16 GB | 0.2687 |
| GPU TDP ? | TDP 8 W | TDP 12 W | TDP 13 W |
|---|---|---|---|
| 88% | 94% | 100% | 77% |
| Model | CPU | GPU | RAM | Value |
|---|---|---|---|---|
| Lenovo ThinkPad X1 Yoga G7 21CE002HGE | i7-1270P 64 W / 28 W | Iris Xe G7 96EUs 1400 MHz | 16 GB | 1070 |
| Huawei MateBook D 16 2022 | i7-12700H 64 W / 35 W | Iris Xe G7 96EUs 1400 / 1867 MHz | 16 GB | 1100 |
| LG Gram 16Z90Q | i7-1260P 43 W / 25 W | Iris Xe G7 96EUs 1400 / 2600 MHz | 16 GB | 1200 |
| MSI Prestige 14 Evo A11M-005 | i7-1185G7 64 W / 64 W | Iris Xe G7 96EUs 1350 / 2000 MHz | 16 GB | 1350 |
| Honor MagicBook View 14 | i7-11390H 64 W / 45 W | Iris Xe G7 96EUs 1400 / 1600 MHz | 16 GB | 1400 |
| Model | CPU | GPU | RAM | Value |
|---|---|---|---|---|
| Huawei MateBook 16s i7 | i7-12700H 96 W / 54 W | Iris Xe G7 96EUs 1400 / 2400 MHz | 16 GB | 1100 |
| Huawei MateBook D 16 2022 | i7-12700H 64 W / 35 W | Iris Xe G7 96EUs 1400 / 1867 MHz | 16 GB | 1100 |
| Lenovo ThinkPad X1 Yoga G7 21CE002HGE | i7-1270P 64 W / 28 W | Iris Xe G7 96EUs 1400 MHz | 16 GB | 1150 |
| Dell XPS 13 Plus 9320 4K | i7-1260P 64 W / 34 W | Iris Xe G7 96EUs 1400 MHz | 32 GB | 1197 |
| Microsoft Surface Pro 8, i7-1185G7 | i7-1185G7 54 W / 29 W | Iris Xe G7 96EUs 1350 / 2000 MHz | 16 GB | 1350 |
| Geekom Mini IT13 | i9-13900H 65 W / 35 W | Iris Xe G7 96EUs 1 GB | 32 GB | 1366 |
| Lenovo Yoga 9i 14 2022 i7-1260P | i7-1260P 64 W / 38 W | Iris Xe G7 96EUs 1400 / 2600 MHz | 16 GB | 1396 |
| Honor MagicBook View 14 | i7-11390H 64 W / 45 W | Iris Xe G7 96EUs 1400 / 1600 MHz | 16 GB | 1400 |
The following benchmarks stem from our benchmarks of review laptops. The performance depends on the used graphics memory, clock rate, processor, system settings, drivers, and operating systems. So the results don't have to be representative for all laptops with this GPU. For detailed information on the benchmark results, click on the fps number.


For more games that might be playable and a list of all games and graphics cards visit our Gaming List
#0 ran 0s before starting gpusingle class +0s ... 0s
#1 no ids found in url (should be separated by "_") +0s ... 0s
#2 not redirecting to Ajax server +0s ... 0s
#3 did not recreate cache, as it is less than 5 days old! Created at Fri, 10 Jul 2026 05:30:22 +0200 +0.003s ... 0.003s
#4 no comparison url found in template nbc.compare_page_1 needed +0.014s ... 0.017s
#5 no comparison url found in template nbc.compare_page_1 needed +0s ... 0.017s
#6 no comparison url found in template nbc.compare_page_1 needed +0s ... 0.017s
#7 no comparison url found in template nbc.compare_page_1 needed +0s ... 0.017s
#8 no comparison url found in template nbc.compare_page_1 needed +0s ... 0.017s
#9 no comparison url found in template nbc.compare_page_1 needed +0s ... 0.017s
#10 no comparison url found in template nbc.compare_page_1 needed +0s ... 0.017s
#11 no comparison url found in template nbc.compare_page_1 needed +0s ... 0.017s
#12 composed specs +0s ... 0.017s
#13 did output specs +0s ... 0.017s
#14 start showIntegratedCPUs +0s ... 0.017s
#15 getting avg benchmarks for device 10364 +0.075s ... 0.092s
#16 got single benchmarks 10364 +0.582s ... 0.674s
#17 got avg benchmarks for devices +0s ... 0.674s
#18 min, max, avg, median took s +4.727s ... 5.401s
#19 before gaming benchmark output +0.002s ... 5.403s
#20 Got 6683 rows for game benchmarks. +0.799s ... 6.202s
#21 composed SQL query for gamebenchmarks +0s ... 6.202s
#22 got data and put it in $dataArray +0.106s ... 6.308s
#23 benchmarks composed for output. +3.148s ... 9.456s
#24 no comparison url found in template nbc.compare_page_1 needed +0.309s ... 9.765s
#25 return log +0s ... 9.765s
Beelink GTI13 Ultra: Intel Core i9-13900HK, 1.3 kg
Review » Beelink GTI13 超迷你电脑评测:配备英特尔酷睿 i9 处理器的 Mac Mini 替代机型
Asus ExpertBook P1 P1503CVA-S70188X: Intel Core i7-13700H, 15.60", 1.7 kg
Review » 华硕 ExpertBook P1 评测--经济实惠的笔记本电脑,适合办公和在家办公,具有众多安全功能
MSI Cubi NUC 1M: Intel Core 7 150U, 0.7 kg
Review » 微星 Cubi NUC M1 迷你 PC 评测:性能稳定,但价格高于竞争对手
Dell Latitude 7030 Rugged Extreme: Intel Core i7-1260U, 10.00", 1.1 kg
Review » 戴尔Latitude 7030 Rugged Extreme 评测:坚固耐用的平板电脑,全 sRGB 色彩
Geekom XT13 Pro: Intel Core i9-13900H, 0.6 kg
Review » Geekom XT13 Pro 评测:NUC 迷你 PC 没有流星湖,只有英特尔酷睿 i9-13900H
Lenovo IdeaPad Slim 5 16IRU9: Intel Core 7 150U, 16.00", 1.8 kg
Review » 英特尔酷睿 7 150U 性能首次亮相:联想 IdeaPad Slim 5 16IRU9 笔记本电脑评测
Geekom GT13 Pro: Intel Core i9-13900H, 0.4 kg
Review » Geekom GT13 Pro 迷你 PC 评测 - 配备英特尔酷睿 i9-13900H、32 GB DDR4 内存和 2 TB 固态硬盘的时尚 NUC 替代品
Durabook S15: Intel Core i7-1255U, 15.60", 2.7 kg
Review » Durabook S15 强固型笔记本电脑评测:在同类产品中出人意料的轻薄
Minisforum MS-01: Intel Core i9-13900H, 1.5 kg
Review » 工作站评测:Minisforum MS-01 首次亮相,配备英特尔酷睿 i9-13900H,但缺少专用显卡前置工作站
Minisforum Venus Series NAB9: Intel Core i9-12900HK, 0.6 kg
Review » Minisforum Venus 系列 NAB9 评测:配备英特尔酷睿 i9-12900HK、32 GB 内存和主动式固态硬盘冷却系统的迷你 PC
Geekom XT12 Pro: Intel Core i9-12900H, 0.5 kg
Review » Geekom XT12 Pro 评测:时尚的 NUC 迷你 PC 替代品,配备英特尔酷睿 i9-12900H、32 GB DDR4 内存和 1 TB 固态硬盘
Asus Expertbook B5 Flip B5402F, i7-1360P: Intel Core i7-1360P, 14.00", 1.4 kg
Review » 华硕专家本 B5 Flip B5402F 评测--一款出色的可折叠便携本
Lenovo Thinkpad X1 Fold 16: Intel Core i7-1250U, 16.30", 1.9 kg
Review » 联想 ThinkPad X1 Fold 16 笔记本电脑评测:展开未来
Asus VivoBook S15 K5504: Intel Core i9-13900H, 15.60", 1.6 kg
Review » 华硕 VivoBook S15 BAPE 笔记本电脑评测:性能超强的 OLED 笔记本电脑?还是特别版会铩羽而归?
Huawei MateBook D 16 2024: Intel Core i9-13900H, 16.00", 1.7 kg
Review » 华为 MateBook D 16 2024 评测--配备英特尔酷睿 i9-13900H 的多媒体笔记本电脑
Geekom Mini IT13: Intel Core i9-13900H, 0.7 kg
Review » Geekom Mini IT13 迷你电脑评测 - 配备超强酷睿 i9 处理器的迷你台式机
HP Pavilion Plus 14-ew0153TU: Intel Core i7-1355U, 14.00", 1.4 kg
Review » 惠普Pavilion Plus 14 Core i7 评测:英特尔 Raptor Lake 还是 AMD Zen 4?选择一目了然
Eurocom C315 Blitz: Intel Core i7-1360P, 15.60", 1.7 kg
Review » Eurocom C315 Blitz 笔记本电脑评测:酷睿 i7-1360P 喜忧参半
Lenovo ThinkPad T14s G4 i7-1365U: Intel Core i7-1365U, 14.00", 1.4 kg
Review » 联想 ThinkPad T14s G4 酷睿 i7 笔记本电脑评测:与 AMD Ryzen 7 的艰苦较量
LG Gram 2in1 16 16T90R - G.AA78G: Intel Core i7-1360P, 16.00", 1.5 kg
Review » LG Gram 16 英寸二合一机评测--重量不再是独特卖点
Acer Aspire Vero AV15-53P: Intel Core i7-1355U, 15.60", 1.8 kg
Review » 宏碁 Aspire Vero 15 评论:令人印象深刻的环保笔记本电脑,几乎没有任何妥协
Asus ExpertBook B9 B9403CVA-KM0153X: Intel Core i7-1355U, 14.00", 1 kg
Review » 华硕 ExpertBook B9 OLED (2023) 评测:适合高要求用户的超薄商务笔记本
Lenovo ThinkPad X1 Carbon G11 21HNS54T00: Intel Core i7-1370P, 14.00", 1.2 kg
Review » 联想 ThinkPad X1 Carbon 11 代笔记本电脑评测:虚拟机怪兽,CPU故障
Lenovo ThinkPad L13 Yoga G4 i7-1355U: Intel Core i7-1355U, 13.30", 1.4 kg
Review » 联想 ThinkPad L13 Yoga G4 英特尔可折叠电脑评测:电池续航时间短于 AMD
Lenovo ThinkPad E14 G5 i7-1355U: Intel Core i7-1355U, 14.00", 1.5 kg
Review » 联想 ThinkPad E14 G5 英特尔笔记本电脑评测:酷睿 i7-1355U 对 Ryzen 7 7730U
Schenker Vision 14 2023: Intel Core i7-13700H, 14.00", 1.3 kg
Review » 申克 Vision 14 2023 评测:电池续航时间超长的镁合金超极本
Lenovo ThinkPad T14s G4 21F6005GGE: Intel Core i7-1355U, 14.00", 1.3 kg
Review » 联想 ThinkPad T14s G4 英特尔笔记本电脑评测:OLED 取代电池续航时间
HP Envy x360 15-fe0072ng: Intel Core i7-1355U, 15.60", 1.8 kg
Review » 惠普 Envy x360 英特尔 i7-1355U 可折叠机型评测:英特尔优于 AMD
Lenovo ThinkPad X13 G4 21EX004QGE: Intel Core i7-1355U, 13.30", 1.2 kg
Review » 联想 ThinkPad X13 G4 英特尔笔记本电脑评测:配备 OLED 的紧凑型 5G 旅行者
BMAX B7 Power G7A2: Intel Core i7-11390H, 0.4 kg
Review » BMAX B7 Power 评测:搭载英特尔酷睿 i7 处理器、售价 400 美元的节俭型迷你 PC
Lenovo ThinkBook Plus Gen4 IRU: Intel Core i7-1355U, 13.30", 1.4 kg
Review » 联想 ThinkBook Plus Twist Gen 4 可折叠笔记本评测:电子墨水与 OLED 混合技术
Lenovo IdeaCentre Mini 01IRH8: Intel Core i7-13700H, 1.8 kg
Review » 联想 IdeaCentre Mini 01IRH8 评测:英特尔 NUC 的挑战者即将登场
LG Gram Style 14Z90RS-G.AD7AG: Intel Core i7-1360P, 14.00", 1 kg
Review » LG Gram Style 14 笔记本电脑评测:优雅、快速、(太)热
Lenovo ThinkPad X1 Nano Gen 3: Intel Core i7-1360P, 13.00", 1 kg
Review » 联想 ThinkPad X1 Nano Gen 3 笔记本电脑评测:不到 1 千克的英特尔酷睿处理器
Intel NUC 13 Pro Desk Edition Kit: Intel Core i7-1360P, 0.6 kg
Review » 英特尔 NUC 13 Pro 套件 - Vivid Canyon 评测:最后一款英特尔 NUC 采用新外壳和酷睿 i7-1360P 处理器
Khadas Mind: Intel Core i7-1360P, 0.4 kg
Review » Khadas Mind 工作站评测:这款配备电池和酷睿 i7-1360P 处理器的便携式迷你 PC 能否取代笔记本电脑?
Lenovo ThinkPad T16 G2 21HH003AGE: Intel Core i7-1355U, 16.00", 1.8 kg
Review » 联想ThinkPad T16 G2评测:安静的办公笔记本电脑,超长的电池续航时间
Schenker Vision 16 PH6PRX1: Intel Core i7-13700H, 16.00", 1.5 kg
Review » 申克 Vision 16 2023 评论:16 英寸轻便型,端口众多
LG Gram SuperSlim (2023): Intel Core i7-1360P, 15.60", 1 kg
Review » LG Gram SuperSlim (2023) 评测:重990克,电池续航时间长,配备OLED显示屏的笔记本电脑
HP Dragonfly G4: Intel Core i7-1365U, 13.50", 1.1 kg
Review » 惠普蜻蜓G4笔记本电脑评测:惠普Dragonfly G4笔记本电脑评测:与已经非常出色的Dragonfly G3相比的小幅升级
Dell XPS 13 Plus 9320 Core i7-1360P: Intel Core i7-1360P, 13.40", 1.3 kg
Review » 几乎没有比上一年更好的了:2023 戴尔XPS 13 Plus 9320 酷睿i7-1360P评测
Geekom Mini IT11, i7-11390H: Intel Core i7-11390H, 0.5 kg
Review » Geekom Mini IT11评测:搭载酷睿i7-11390H和USB4的英特尔NUC竞争者已到极限
Lenovo ThinkPad X1 Carbon G11-21HNS00000: Intel Core i7-1365U, 14.00", 1.2 kg
Review » 联想ThinkPad X1 Carbon G11评测--停滞不前的昂贵商务旗舰机
Dell Latitude 9440 2-in-1: Intel Core i7-1365U, 14.00", 1.6 kg
Review » 适用于商业用户的XPS敞篷车:戴尔Latitude 9440 2合1评论
Huawei MateBook X Pro 2023: Intel Core i7-1360P, 14.20", 1.3 kg
Review » 华为MateBook X Pro 2023回顾--MacBook Air的竞争对手也支持外部GPU
Acer Swift Go SFG16-71: Intel Core i7-13700H, 16.00", 1.6 kg
Review » 宏碁Swift Go 16评论:拥有耀眼的OLED显示屏的多媒体笔记本电脑
Asus ZenBook 14X UX3404VC: Intel Core i9-13900H, 14.50", 1.6 kg
Review » 华硕ZenBook 14X(2023)笔记本电脑评测:OLED超极本的极限
Lenovo ThinkPad X1 Yoga G8 i7-1355U: Intel Core i7-1355U, 14.00", 1.4 kg
Review » 新的CPU,同样的问题:联想ThinkPad X1 Yoga G8敞篷车评测
Lenovo ThinkPad X13 Yoga G3 21AW003UGE: Intel Core i7-1265U, 13.30", 1.2 kg
Review » 联想ThinkPad X13 Yoga G3笔记本电脑评测:桤木湖让商务敞篷车变得更糟
Huawei MateBook 16s i9: Intel Core i9-13900H, 16.00", 2 kg
Review » 华为MateBook 16s 2023评测 - 多媒体笔记本电脑现在有了更明亮的3:2显示屏
Lenovo Yoga Book 9i 2-in-1 Dual Screen: Intel Core i7-1355U, 13.30", 1.6 kg
Review » 双重麻烦:联想Yoga Book 9i二合一双屏OLED敞篷车评测
Framework Laptop 13.5 13th Gen Intel: Intel Core i7-1370P, 13.50", 1.3 kg
Review » 酷睿i7-1370P性能首次亮相:框架笔记本13.5英寸13代英特尔评测
Samsung Galaxy Book3 Pro 14: Intel Core i7-1360P, 14.00", 1.2 kg
Review » 三星Galaxy Book3 Pro 14评论:轻巧的办公笔记本,拥有20小时的电池寿命
LG Gram 17 (2023): Intel Core i7-1360P, 17.00", 1.4 kg
Review » LG Gram 17 (2023)回顾:拥有酷睿i7和长电池寿命的超轻办公笔记本电脑
Geekom Mini IT12: Intel Core i7-1260P, 0.6 kg
Review » Geekom Mini IT12评论:搭载英特尔酷睿i7-1260P的英特尔NUC竞争者工作起来非常安静
Lenovo Yoga 7 16IRL8: Intel Core i7-1355U, 16.00", 2 kg
Review » 酷睿i7-1355U首次亮相:联想Yoga 7 16IRL8敞篷车评测
Asus ZenBook S13 OLED UX5304: Intel Core i7-1355U, 13.30", 1 kg
Review » 华硕Zenbook S 13 OLED 2023评测--全球最轻薄的OLED超极本与恼人的粉丝斗争
Microsoft Surface Laptop 5 15, i7-1255U: Intel Core i7-1255U, 15.00", 1.6 kg
Review » 微软Surface Laptop 5 15评测--老式设计,高端价格
Intel NUC 13 Pro Kit NUC13ANK: Intel Core i7-1360P, 0.5 kg
Review » 英特尔NUC 13 Pro套件又名Arena Canyon评论:配备英特尔酷睿i7-1360P的现代迷你PC,满足苛刻的应用需求
Lenovo Yoga 9 14IRP G8: Intel Core i7-1360P, 14.00", 1.4 kg
Review » 联想Yoga 9i 14 G8 2023敞篷车回顾:英特尔猛禽湖让人失望
HP ProBook 440 G9-5Y3Z3EA: Intel Core i7-1255U, 14.00", 1.4 kg
Review » 惠普ProBook 440 G9评论。高效的酷睿i7-1255U笔记本电脑,没有闪耀的光芒
Trigkey Speed S: Intel Core i5-11320H, 0.4 kg
Review » Trigkey Speed S评论。廉价的即用型酷睿i5-11320H迷你电脑
Asus Chromebook Flip CX5 CX5601FB: Intel Core i7-1255U, 15.80", 2.1 kg
Review » 华硕Chromebook Flip CX5回顾。高性能,高价格
Lenovo Yoga 9 14IRP G8: Intel Core i7-1360P, 14.00", 1.4 kg
Review » 英特尔猛禽湖-P评测--酷睿i7-1360P的首次亮相
Lenovo ThinkPad T16 Gen 1 Core i7-1270P: Intel Core i7-1270P, 16.00", 2 kg
Review » 联想ThinkPad T16 Gen 1酷睿i7笔记本电脑评测。以性能为代价的安静
Minisforum Neptune Series NAD9: Intel Core i9-12900H, 1.2 kg
Review » Minisforum海王星系列NAD9台式电脑评论。配备英特尔酷睿i9-12900H的紧凑型动力源
Microsoft Surface Pro 9, i7-1255U: Intel Core i7-1255U, 13.00", 0.9 kg
Review » 微软Surface Pro 9回顾。可折叠式的,现在有了明显更多的CPU功率
LG Gram 16Z90Q: Intel Core i7-1260P, 16.00", 1.2 kg
Review » LG Gram 16 (2022) 笔记本电脑评论。具有稳定性问题的轻量级设备
HP Spectre x360 2-in-1 16-f1075ng: Intel Core i7-12700H, 16.00", 2 kg
Review » 惠普Spectre x360 16回顾。2合1笔记本电脑,显示效果好,运行时间强
Acer Aspire Vero AV14-51-72DL: Intel Core i7-1255U, 14.00", 1.5 kg
Review » 宏碁Aspire Vero AV14笔记本电脑评论。由回收材料制成的引人注目的机箱
Lenovo ThinkPad X1 Carbon G10 21CB00DCGE: Intel Core i7-1260P, 14.00", 1.2 kg
Review » 联想ThinkPad X1 Carbon G10 30周年笔记本评测。存在体力问题的OLED版
Lenovo IdeaPad Flex 7i 14IAU7: Intel Core i7-1255U, 14.00", 1.5 kg
Review » 联想IdeaPad Flex 7与IdeaPad Flex 5的审查。更快的处理器和更好的触摸屏
HP EliteBook 840 G9: Intel Core i7-1280P, 14.00", 1.5 kg
Review » 惠普EliteBook 840 G9笔记本电脑评测。联想ThinkPad X1 Carbon的替代品
Lenovo ThinkPad X1 Carbon G10 Core i7-1265U: Intel Core i7-1265U, 14.00", 1.2 kg
Review » 酷睿i7-1265U与酷睿i5-1250P:联想ThinkPad X1 Carbon 10代笔记本电脑评测
HP Elite Dragonfly Folio 13.5 G3: Intel Core i7-1265U, 13.50", 1.4 kg
Review » 惠普Dragonfly Folio 13.5 G3敞篷车回顾。不再有骁龙或ARM上的Windows
Intel NUC 12 Pro Kit NUC12WSKi7: Intel Core i7-1260P, 0.5 kg
Review » 英特尔NUC 12 Pro套件 - 华尔街大峡谷的回顾。配备英特尔酷睿i7-1260P的高级迷你PC,具有高通用性
Geekom Mini IT11-GM11i7T: Intel Core i7-1195G7, 0.6 kg
Review » Geekom Mini IT11 SFF台式电脑上手。坚实的紧凑型Tiger Lake PC
Intel NUC Pro Chassis_i7_1185G7: Intel Core i7-1185G7
Review » 英特尔NUC Pro机箱元件评测--模块化裸机的多种用途
Intel NUC Pro Chassis_i7_1265U: Intel Core i7-1265U
Review » 英特尔NUC Pro机箱元件评测--模块化裸机的多种用途
Dell Latitude 9330: Intel Core i7-1260U, 13.30", 1.2 kg
Review » 酷睿i7-1260U首次亮相。戴尔Latitude 13 9330 2-in-1敞篷车评论
HP Envy x360 13-bf0013dx: Intel Core i7-1250U, 13.30", 1.4 kg
Review » 2022年惠普Envy x360 13敞篷车回顾。酷睿i5-1230U还是酷睿i7-1250U?
Morefine S600-Apex Engineer: Intel Core i9-12900HK, 0.8 kg
Review » 摩尔芬S600 Apex工程师评测:配备英特尔酷睿i9 12900HK和64GB内存的强大迷你PC
Lenovo Yoga Slim 7 Carbon 13IAP7-82U9005FGE: Intel Core i7-1260P, 13.30", 1 kg
Review » 联想Yoga Slim 7i Carbon 13笔记本电脑评测--1公斤以下的强大超便携笔记本电脑
Acer TravelMate P6 TMP614P-52-724G: Intel Core i7-1185G7, 14.00", 1.2 kg
Review » 宏碁TravelMate P6 TMP614P-52回顾。轻量级的办公笔记本,电池续航能力强
Lenovo ThinkBook Plus Gen3: Intel Core i7-12700H, 17.30", 2 kg
Review » 联想ThinkBook Plus第三代笔记本电脑评测。21:10超宽生产力的助推器
Lenovo Yoga Slim 9 14IAP7: Intel Core i7-1280P, 14.00", 1.4 kg
Review » 联想Yoga Slim 9i评测。可以说是最快的Evo笔记本电脑
Asus ExpertBook B2 Flip B2502FBA-N80141X: Intel Core i7-1260P, 15.60", 1.9 kg
Review » 华硕ExpertBook B2 Flip的回顾。带有防眩光触摸屏和5G调制解调器的2合1笔记本
Beelink SEi11 Pro: Intel Core i5-11320H, 0.4 kg
Review » Beelink SEi11迷你电脑评论。比英特尔NUC 11更便宜,但速度一样快
Minipc Union Ace Magician TK11-A0: Intel Core i5-1135G7, 0.6 kg
Review » Ace Magician TK11-A0评测。高效的迷你PC,带有Thunderbolt 4和其他有用的功能
Huawei MateBook X Pro 2022: Intel Core i7-1260P, 14.20", 1.3 kg
Review » 华为MateBook X Pro 2022笔记本电脑评测。MacBook Air的竞争者以顶级IPS显示屏得分
Lenovo ThinkPad X1 Nano Gen 2 Core i7-1280P: Intel Core i7-1280P, 13.00", 1 kg
Review » 联想ThinkPad X1 Nano第二代回顾。史上最小的X1笔记本电脑
Dell XPS 13 Plus 9320 i7-1280P OLED: Intel Core i7-1280P, 13.40", 1.3 kg
Review » 所有三个戴尔XPS 13 Plus 9320 SKU的回顾。酷睿i5-1240P,i7-1260P,还是i7-1280P OLED?
HP Elite Dragonfly G3: Intel Core i7-1265U, 13.50", 1.2 kg
Review » HP Elite Dragonfly G3 13.5笔记本电脑评测。全新的设计和性能
HP ProBook 450 G9 6A180EA: Intel Core i7-1255U, 15.60", 1.7 kg
Review » 惠普ProBook 450 G9笔记本电脑评论。一个高效的英特尔CPU在最后
HP Spectre x360 13.5 14t-ef000: Intel Core i7-1255U, 13.50", 1.4 kg
Review » 2022年惠普Spectre x360 13.5回顾。巅峰的超便携可转换笔记本
Dynabook Portégé X40-K: Intel Core i7-1260P, 14.00", 1.5 kg
Review » Dynabook Portégé X40-K评论。具有经济型显示屏的高级笔记本电脑
Dell Latitude 9430 2-in-1: Intel Core i7-1265U, 14.00", 1.5 kg
Review » 戴尔Latitude 9430二合一敞篷车回顾。英特尔第12代的升级
Lenovo Yoga 7 16IAP7: Intel Core i7-1260P, 16.00", 2 kg
Review » 联想Yoga 7 16代7评测。庞大的16英寸可转换笔记本电脑
HP Pavilion Plus 14 eh0097nr: Intel Core i7-12700H, 14.00", 1.4 kg
Review » 惠普Pavilion Plus 14笔记本电脑回顾。OLED、90赫兹和12代酷睿H
Dell Latitude 13 7330: Intel Core i7-1265U, 13.30", 1 kg
Review » 英特尔酷睿i7-1265U首次亮相。戴尔Latitude 13 7330 1公斤笔记本电脑评测
Framework Laptop 13.5 12th Gen Intel: Intel Core i7-1260P, 13.50", 1.3 kg
Review » 框架笔记本电脑13.5英特尔第12代回顾。像微软的Surface,但实际上是可以维修的
Dell XPS 13 Plus 9320 4K: Intel Core i7-1260P, 13.40", 1.2 kg
Review » 戴尔XPS 13 Plus 9320笔记本电脑评测--XPS 13现在有了触摸条
Panasonic Toughbook 40: Intel Core i7-1185G7, 14.00", 3.9 kg
Review » 松下Toughbook 40笔记本电脑回顾。高度的适应性和模块化
Huawei MateBook D 16 2022: Intel Core i7-12700H, 16.00", 1.7 kg
Review » 华为MateBook D 16 2022评测--多媒体笔记本电脑现在采用16:10格式,并配有数字键盘
MSI Summit E14 Flip Evo A12MT: Intel Core i7-1260P, 14.00", 1.6 kg
Review » 微星Summit E14 Flip Evo A12M敞篷车回顾。惠普、戴尔或联想的合法替代品
Prime Computer PrimeBook Circular-i7-1165G7: Intel Core i7-1165G7, 13.90", 1.6 kg
Review » PrimeBook Circular回顾。模块化的14英寸基于NUC的笔记本电脑
Huawei MateBook 16s i7: Intel Core i7-12700H, 16.00", 2 kg
Review » 华为MateBook 16s评测--配备桤木湖i7的大型多媒体笔记本电脑
GPD Win Max 2: Intel Core i7-1260P, 10.10", 1 kg
Review » GPD Win Max 2掌上游戏电脑回顾。英特尔酷睿i7-1260P或AMD Ryzen 7 6800U?
Asus VivoBook S 14X S5402Z: Intel Core i7-12700H, 14.50", 1.6 kg
Review » 华硕VivoBook S 14X S5402Z评论。世界上第一台14.5英寸2.8K 120 Hz OLED笔记本电脑
Dell Inspiron 16 7620 2-in-1: Intel Core i7-1260P, 16.00", 2.1 kg
Review » 戴尔Inspiron 16 7620二合一敞篷车回顾。麦拉和铝制底盘
Dell Inspiron 14 7420 2-in-1: Intel Core i7-1255U, 14.00", 1.6 kg
Review » 英特尔酷睿i7-1255U首次亮相。戴尔Inspiron 14 7420二合一敞篷车评测
Samsung Galaxy Book2 Pro 360 13 NP930QED-KA3DE: Intel Core i7-1260P, 13.30", 1 kg
Review » 三星Galaxy Book2 Pro 360 13在审查。轻巧的二合一笔记本电脑,带手写笔输入和OLED显示屏
Asus Zenbook Pro 14 Duo OLED UX8402ZA: Intel Core i7-12700H, 14.50", 1.7 kg
Review » 华硕Zenbook Pro 14 Duo在审查。具有快速120赫兹OLED显示屏的双屏笔记本电脑
Getac S410 Gen 4: Intel Core i7-1185G7, 14.00", 3.2 kg
Review » Getac S410第4代笔记本电脑回顾。简单的变化,巨大的升级
Lenovo ThinkPad X1 Yoga G7 21CE002HGE: Intel Core i7-1270P, 14.00", 1.5 kg
Review » 联想ThinkPad X1 Yoga G7笔记本电脑。高端商务敞篷车评测
Lenovo Yoga 9i 14 2022 i7-1260P: Intel Core i7-1260P, 14.00", 1.4 kg
Review » 联想Yoga 9i 14 2022笔记本电脑--高端可转换4K-OLED的评测
Lenovo Yoga 9 14IAP7 82LU0001US: Intel Core i7-1260P, 14.00", 1.4 kg
Review » 英特尔酷睿i7-1260P首次亮相。联想Yoga 9 14IAP7敞篷车评测
Dell Latitude 7330 Rugged Extreme: Intel Core i7-1185G7, 13.30", 2.7 kg
Review » DellLatitude 7330 Rugged Extreme评论。最好的13英寸耐用型笔记本电脑之一
Schenker Work 17 Tiger Lake-H: Intel Core i7-11370H, 17.30", 2.3 kg
Review » Schenker Work 17笔记本电脑评测。大屏幕和多彩的键盘
Huawei MateBook 14 2021, i7-1165G7: Intel Core i7-1165G7, 14.00", 1.5 kg
Review » 华为MateBook 14 (2021)回顾。带触摸功能的MacBook Air?
Asus ExpertBook B3 Flip B3402FEA: Intel Core i7-1165G7, 14.00", 1.6 kg
Review » 华硕ExpertBook B3 Flip在审查中。带有数字手写笔和LTE调制解调器的二合一笔记本电脑
Schenker Work 15 Tiger Lake-H: Intel Core i7-11370H, 15.60", 1.7 kg
Review » Schenker Work 15Tiger Lake-H 笔记本电脑评论。办公室里的RGB照明
Minisforum EliteMini TH50: Intel Core i5-11320H, 0.8 kg
Review » Minisforum EliteMini TH50评论。适合日常办公的紧凑型台式电脑
Asus ExpertBook B7 Flip B7402FEA: Intel Core i7-1195G7, 14.00", 1.4 kg
Review » 华硕ExpertBook B7 Flip在审查中。具有5G调制解调器和长电池寿命的2合1笔记本电脑
LG Gram 15Z90P-G.AA89G: Intel Core i7-1165G7, 15.60", 1.1 kg
Review » LG Gram 15Z90P评论:1.1公斤(约2.4磅)的15英寸笔记本电脑
Honor MagicBook View 14: Intel Core i7-11390H, 14.20", 1.5 kg
Review » Honor MagicBook View 14评论。14英寸笔记本电脑的触摸爱好者
Xiaomi Mi NoteBook Pro: Intel Core i7-11370H, 14.00", 1.4 kg
Review » 小米NoteBook Pro笔记本电脑评测。残缺的酷睿i7-11370H限制了其他良好的设备
Samsung Galaxy Book Pro 15 NP950XDB-KC5US: Intel Core i7-1165G7, 15.60", 1.1 kg
Review » 三星Galaxy Book Pro 15 NP950XDB笔记本电脑评论。惊人的轻量级
Dell Inspiron 14 5410-D3D7T: Intel Core i7-1165G7, 14.00", 1.5 kg
Review » 戴尔Inspiron 14 5410二合一笔记本电脑在审查。这款模块化的可转换笔记本提供了经济实惠的性能
Acer Enduro Urban N3 EUN314: Intel Core i7-1165G7, 14.00", 1.8 kg
Review » Acer Enduro Urban N3 EUN314笔记本电脑评测。部分坚固耐用,部分超极本
Dell Inspiron 13 7306-6TYH5: Intel Core i7-1165G7, 13.30", 1.4 kg
Review » 戴尔Inspiron 13 7306笔记本电脑评测。适用于绘画和创意任务的紧凑型敞篷车
Microsoft Surface Pro 8, i7-1185G7: Intel Core i7-1185G7, 13.00", 0.9 kg
Review » 微软Surface Pro 8 Convertible评测。强大的,120赫兹和最终的Thunderbolt
Gigabyte U4 UD: Intel Core i7-1195G7, 14.00", 1 kg
Review » Gigabyte U4 UD 笔记本电脑评测。轻量级,有很大的潜力,但有时会被浪费掉
Dell Latitude 15 9520 2-in-1: Intel Core i7-1185G7, 15.00", 1.7 kg
Review » 戴尔Latitude 15 9520二合一与Latitude 9510二合一:较新的不一定更好
GPD Pocket 3: Intel Core i7-1195G7, 8.00", 0.7 kg
Review » GPD Pocket 3可转换UMPC回顾。比许多英特尔EVO笔记本电脑更快
Dynabook Portégé X30W-J-10K: Intel Core i7-1165G7, 13.30", 1 kg
Review » Dynabook Portégé X30W-J-10K笔记本电脑评测--一个具有端口多样性的轻量级产品
VAIO SX14 VJS144X0111K: Intel Core i7-1195G7, 14.00", 1.1 kg
Review » 2021年VAIO SX14回顾。2500美元的酷睿i7超极本
Lenovo ThinkBook 13x G1-20WJ001KGE: Intel Core i7-1160G7, 13.30", 1.1 kg
Review » 联想ThinkBook 13x G1的回顾。具有良好电池寿命的超薄笔记本
Lenovo IdeaPad Slim 7i Pro 14IHU5: Intel Core i7-11370H, 14.00", 1.4 kg
Review » 联想IdeaPad Slim 7i Pro笔记本电脑回顾。90赫兹让一切变得不同
Dell Inspiron 15 3501: Intel Core i7-1165G7, 15.60", 2 kg
Review » 戴尔Inspiron 15 3501笔记本电脑在审查。安静的办公笔记本电脑
Acer Swift 3 SF316-51: Intel Core i7-11370H, 16.10", 1.7 kg
Review » Acer Swift 3 SF316-51 in review:这款笔记本电脑是否对得起它的名字?
Huawei MateBook 14s i7: Intel Core i7-11370H, 14.20", 1.4 kg
Review » 华为MateBook 14s i7笔记本评测--强大的副笔记本与3:2触摸屏
Dell XPS 13 9310 2-in-1: Intel Core i7-1165G7, 13.40", 1.3 kg
Review » 戴尔XPS 13 9310二合一评测。在一个特定方面优于XPS 13 7390二合一产品
Fujitsu LifeBook U9311X i7 LTE: Intel Core i7-1185G7, 13.30", 1 kg
Review » 富士通LifeBook U9311X评测--带LTE的1公斤商务敞篷车
Acer TravelMate P614P-52: Intel Core i7-1165G7, 14.00", 1 kg
Review » 宏碁TravelMate P6(2021)评论。欢迎对已经有能力的商务笔记本电脑进行改进,但并非没有注意事项
Asus Chromebook Flip CX5 CX5500FEA: Intel Core i7-1165G7, 15.60", 2 kg
Review » 华硕Chromebook Flip CX5在回顾。1,200欧元的Chromebook?
HP EliteBook 830 G8-i7-1165G7: Intel Core i7-1165G7, 13.30", 1.3 kg
Review » 惠普EliteBook 830 G8商务笔记本回顾。1,000尼特SureView面板仍有问题
Lenovo ThinkPad T14s G2 20WM003TGE: Intel Core i7-1165G7, 14.00", 1.3 kg
Review » 联想ThinkPad T14s G2 Intel评测。尽管是16:9的格式,但却是一台非常好的商务笔记本电脑
Lenovo ThinkPad X13 G2 20WK0024GE: Intel Core i7-1165G7, 13.30", 1.3 kg
Review » 联想ThinkPad X13 G2评论。完美的移动伴侣?
ADATA XPG Xenia 14: Intel Core i7-1165G7, 14.00", 1 kg
Review » 威刚XPG Xenia 14笔记本电脑评测。一个新的14英寸的最爱
Framework Laptop 13.5: Intel Core i7-1165G7, 13.50", 1.3 kg
Review » 框架笔记本电脑13.5评论。如果微软生产可维修的Surface笔记本电脑,这将是它。
HP EliteBook 840 Aero G8 3E4Q6AA: Intel Core i7-1185G7, 14.00", 1.2 kg
Review » HP EliteBook 840 Aero G8回顾。可能是我们见过的最安静的英特尔EVO笔记本电脑
Dell 16 DC16251: Intel Core 7 150U, 16.00", 2 kg
External Review » Dell 16 DC16251 - 评测与配置
Dell Pro 14 Essential: Intel Core 7 150U, 14.00", 1.7 kg
External Review » Dell Pro 14 Essential
Acer Aspire 17 A17-51M: Intel Core i9-13900H, 17.30", 2.1 kg
External Review » Acer Aspire 17 A17-51M
HP ProBook 440 G9-5Y3Z3EA: Intel Core i7-1255U, 14.00", 1.4 kg
External Review » HP ProBook 440 G9-5Y3Z3EA
HP OmniBook 5 Flip 14-fp0000: Intel Core 7 150U, 14.00", 1.7 kg
External Review » HP OmniBook 5 Flip 14-fp0000
Panasonic Let’s Note FV4: Intel Core i7-1370P, 14.00", 0 kg
External Review » Panasonic Let’s Note FV4
Acer Aspire Lite 16 AL16-51P: Intel Core i7-1255U, 16.00", 1.8 kg
External Review » Acer Aspire Lite 16 AL16-51P
Asus ExpertBook P1 P1503CVA-S70188X: Intel Core i7-13700H, 15.60", 1.7 kg
External Review » Asus ExpertBook P1 P1503CVA-S70188X
Dell Inspiron 5440: Intel Core 7 150U, 14.00", 1.6 kg
External Review » Dell Inspiron 5440
MSI Modern 15 F1M: Intel Core 7 150U, 15.60", 1.7 kg
External Review » MSI Modern 15 F1M
Lenovo IdeaPad 5 2-in-1 16IRU9: Intel Core 7 150U, 16.00", 1.9 kg
External Review » Lenovo IdeaPad 5 2-in-1 16IRU9
Acer TravelMate Spin P4 TMP414RN-53: Intel Core i7-1355U, 14.00", 1.4 kg
External Review » Acer TravelMate Spin P4 TMP414RN-53
Dell Vostro 5640: Intel Core 7 150U, 16.00", 1.9 kg
External Review » Dell Vostro 5640
Lenovo IdeaPad Slim 5 16IRU9: Intel Core 7 150U, 16.00", 1.8 kg
External Review » Lenovo IdeaPad Slim 5 16IRU9
Dell Inspiron 15 3501: Intel Core i7-1165G7, 15.60", 2 kg
External Review » Dell Inspiron 15 3501
MSI Modern 14 H D13MG: Intel Core i9-13900H, 14.00", 1.6 kg
External Review » MSI Modern 14 H D13MG
Asus Vivobook 14 X1404ZA, i7-1255U: Intel Core i7-1255U, 14.00", 1.4 kg
External Review » Asus Vivobook 14 X1404ZA, i7-1255U
Dell Inspiron 14 5430: Intel Core i7-1355U, 14.00", 1.5 kg
External Review » Dell Inspiron 14 5430
Samsung Galaxy Book4 15, Core 7 150U: Intel Core 7 150U, 15.60", 1.6 kg
External Review » Samsung Galaxy Book4 15, Core 7 150U
Asus ExpertBook B9 B9403CVAR: Intel Core 7 150U, 14.00", 1 kg
External Review » Asus ExpertBook B9 B9403CVAR
Lenovo IdeaPad Slim 5 15IRU9, Core 7 150U: Intel Core 7 150U, 15.30", 1.7 kg
External Review » Lenovo IdeaPad Slim 5 15IRU9, Core 7 150U
Acer Swift Go 14 SFG14-71, i7-1355U: Intel Core i7-1355U, 14.00", 1.3 kg
External Review » Acer Swift Go 14 SFG14-71, i7-1355U
MSI Modern 15 H C13M: Intel Core i7-13700H, 15.60", 1.9 kg
External Review » MSI Modern 15 H C13M
Lenovo Yoga Pro 7 14IRH8: Intel Core i7-13700H, 14.50", 1.5 kg
External Review » Lenovo Yoga Pro 7 14IRH8
Asus Vivobook 15 X1504VAP: Intel Core 7 150U, 15.60", 1.7 kg
External Review » Asus Vivobook 15 X1504VAP
Lenovo ThinkPad X13 Yoga G4, i7-1365U: Intel Core i7-1365U, 13.30", 1.2 kg
External Review » Lenovo ThinkPad X13 Yoga G4, i7-1365U
Acer Aspire 5 A517-58M: Intel Core i7-1355U, 17.30", 2.1 kg
External Review » Acer Aspire 5 A517-58M
HP EliteBook 840 G10, i7-1360P: Intel Core i7-1360P, 14.00", 1.4 kg
External Review » HP EliteBook 840 G10, i7-1360P
MSI Commercial 14 H A13: Intel Core i7-13700H, 14.00", 1.6 kg
External Review » MSI Commercial 14 H A13
Panasonic Toughbook 55 Mk3: Intel Core i7-1370P, 14.00", 2.1 kg
External Review » Panasonic Toughbook 55 Mk3
Dell Inspiron 5330: Intel Core i7-1360P, 13.30", 1.3 kg
External Review » Dell Inspiron 5330
Asus ExpertBook B1 B1502CB, i7-1255U: Intel Core i7-1255U, 15.60", 1.7 kg
External Review » Asus ExpertBook B1 B1502CB, i7-1255U
Lenovo ThinkPad E16, i7-1355U: Intel Core i7-1355U, 16.00", 2 kg
External Review » Lenovo ThinkPad E16, i7-1355U
HP Envy x360 15-fe0072ng: Intel Core i7-1355U, 15.60", 1.8 kg
External Review » HP Envy x360 15-fe0072ng
Asus Vivobook S 14 Flip TP3402VA, i9-13900H: Intel Core i9-13900H, 14.00", 1.5 kg
External Review » Asus Vivobook S 14 Flip TP3402VA, i9-13900H
Lenovo ThinkPad X1 Yoga G8, i7-1365U: Intel Core i7-1365U, 14.00", 1.4 kg
External Review » Lenovo ThinkPad X1 Yoga G8, i7-1365U
Dell Latitude 5540: Intel Core i7-1365U, 15.60", 1.6 kg
External Review » Dell Latitude 5540
Samsung Galaxy Book4 360: Intel Core 7 150U, 15.60", 1.5 kg
External Review » Samsung Galaxy Book4 360
Dell Latitude 3540: Intel Core i7-1355U, 15.60", 1.8 kg
External Review » Dell Latitude 3540
Dell Latitude 7440 2-in-1: Intel Core i7-1365U, 14.00", 1.5 kg
External Review » Dell Latitude 7440 2-in-1
Lenovo Thinkpad X1 Fold 16: Intel Core i7-1250U, 16.30", 1.9 kg
External Review » Lenovo Thinkpad X1 Fold 16
Infinix INBook Y3 Max: Intel Core i7-1255U, 16.00", 1.8 kg
External Review » Infinix INBook Y3 Max
Acer Aspire Vero AV15-53P: Intel Core i7-1355U, 15.60", 1.8 kg
External Review » Acer Aspire Vero AV15-53P
Lenovo ThinkPad L14 G4, i7-1355U: Intel Core i7-1355U, 14.00", 1.4 kg
External Review » Lenovo ThinkPad L14 G4, i7-1355U
Lenovo ThinkPad T14s G4 i7-1365U: Intel Core i7-1365U, 14.00", 1.4 kg
External Review » Lenovo ThinkPad T14s G4 i7-1365U
Dell Latitude 14 7440, i7-1355U: Intel Core i7-1355U, 14.00", 1.5 kg
External Review » Dell Latitude 14 7440, i7-1355U
Dell Latitude 14 5440: Intel Core i7-1355U, 14.00", 1.4 kg
External Review » Dell Latitude 14 5440
Lenovo ThinkBook 14s Yoga IRU G3, i7-1355U: Intel Core i7-1355U, 14.00", 1.5 kg
External Review » Lenovo ThinkBook 14s Yoga IRU G3, i7-1355U
HP EliteBook 860 G10: Intel Core i7-1355U, 16.00", 1.7 kg
External Review » HP EliteBook 860 G10
Acer TravelMate P6 TMP614-53: Intel Core i7-1355U, 14.00", 1.1 kg
External Review » Acer TravelMate P6 TMP614-53
Framework Laptop 13.5, i7-1360P: Intel Core i7-1360P, 13.50", 1.3 kg
External Review » Framework Laptop 13.5, i7-1360P
HP Pavilion Plus 14-ew0153TU: Intel Core i7-1355U, 14.00", 1.4 kg
External Review » HP Pavilion Plus 14-ew0153TU
Lenovo ThinkPad L13 Yoga G4 i7-1355U: Intel Core i7-1355U, 13.30", 1.4 kg
External Review » Lenovo ThinkPad L13 Yoga G4 i7-1355U
Medion Akoya S17413: Intel Core i7-1255U, 17.30", 2.3 kg
External Review » Medion Akoya S17413
HP Spectre x360 14-ef2074ng: Intel Core i7-1355U, 13.50", 1.4 kg
External Review » HP Spectre x360 14-ef2074ng
Acer TravelMate P4 TMP416-52: Intel Core i7-1355U, 16.00", 1.6 kg
External Review » Acer TravelMate P4 TMP416-52
Huawei MateBook D 16 2024: Intel Core i9-13900H, 16.00", 1.7 kg
External Review » Huawei MateBook D 16 2024
Lenovo ThinkPad L15 G4, i7-1365U: Intel Core i7-1365U, 15.60", 1.8 kg
External Review » Lenovo ThinkPad L15 G4, i7-1365U
Fujitsu Stylistic Q7312: Intel Core i7-1265U, 13.30", 1.3 kg
External Review » Fujitsu Stylistic Q7312
MSI Modern 15 H B13M: Intel Core i9-13900H, 15.60", 1.9 kg
External Review » MSI Modern 15 H B13M
Huawei MateBook E 2023: Intel Core i7-1260U, 12.60", 0.7 kg
External Review » Huawei MateBook E 2023
MSI Summit E14 Evo A12M, i7-1260P: Intel Core i7-1260P, 14.00", 1.6 kg
External Review » MSI Summit E14 Evo A12M, i7-1260P
Lenovo ThinkPad T16 G2 21HH003AGE: Intel Core i7-1355U, 16.00", 1.8 kg
External Review » Lenovo ThinkPad T16 G2 21HH003AGE
HP Pavilion 15t-eg3000: Intel Core i7-1355U, 15.60", 1.7 kg
External Review » HP Pavilion 15t-eg3000
HP Elitebook 1040 G10, i7-1355U: Intel Core i7-1355U, 14.00", 1.2 kg
External Review » HP Elitebook 1040 G10, i7-1355U
Lenovo ThinkPad X13 G4 21EX004QGE: Intel Core i7-1355U, 13.30", 1.2 kg
External Review » Lenovo ThinkPad X13 G4 21EX004QGE
Lenovo ThinkPad X1 Carbon G11 21HNS54T00: Intel Core i7-1370P, 14.00", 1.2 kg
External Review » Lenovo ThinkPad X1 Carbon G11 21HNS54T00
Lenovo ThinkPad L15 G4, i7-1355U: Intel Core i7-1355U, 15.60", 1.8 kg
External Review » Lenovo ThinkPad L15 G4, i7-1355U
Asus VivoBook 16 X1605, i7-1255U: Intel Core i7-1255U, 16.00", 1.9 kg
External Review » Asus VivoBook 16 X1605, i7-1255U
Lenovo ThinkPad E14 G5 i7-1355U: Intel Core i7-1355U, 14.00", 1.5 kg
External Review » Lenovo ThinkPad E14 G5 i7-1355U
Lenovo ThinkPad T14 G4: Intel Core i7-1355U, 14.00", 1.4 kg
External Review » Lenovo ThinkPad T14 G4
HP Pavilion x360 14-ek1000ng: Intel Core i7-1355U, 14.00", 1.5 kg
External Review » HP Pavilion x360 14-ek1000ng
Dell Latitude 16 7640: Intel Core i7-1365U, 16.00", 1.8 kg
External Review » Dell Latitude 16 7640
Lenovo ThinkBook 16 G4+: Intel Core i7-1255U, 16.00", 1.8 kg
External Review » Lenovo ThinkBook 16 G4+
Asus Vivobook 17 F1704: Intel Core i5-1335U, 17.30", 2.1 kg
External Review » Asus Vivobook 17 F1704
Lenovo Yoga Slim 7 Carbon 13IRP8: Intel Core i7-1360P, 13.30", 1 kg
External Review » Lenovo Yoga Slim 7 Carbon 13IRP8
Asus Vivobook S 14 OLED K5404VA: Intel Core i9-13900H, 14.50", 1.5 kg
External Review » Asus Vivobook S 14 OLED K5404VA
Lenovo ThinkPad T14s G4 21F6005GGE: Intel Core i7-1355U, 14.00", 1.3 kg
External Review » Lenovo ThinkPad T14s G4 21F6005GGE
Acer Aspire 5 A514-56M: Intel Core i7-1355U, 14.00", 1.7 kg
External Review » Acer Aspire 5 A514-56M
Asus VivoBook 16X X1605, i7-1255U: Intel Core i7-1255U, 16.00", 1.9 kg
External Review » Asus VivoBook 16X X1605, i7-1255U
Asus VivoBook S15 OLED K5504, i9-13900H: Intel Core i9-13900H, 15.60", 1.8 kg
External Review » Asus VivoBook S15 OLED K5504, i9-13900H
Getac B360 G2: Intel Core i7-1280P, 13.30", 2.3 kg
External Review » Getac B360 G2
Asus ZenBook 14X OLED UX3404VA, i9-13900H: Intel Core i9-13900H, 14.50", 1.6 kg
External Review » Asus ZenBook 14X OLED UX3404VA, i9-13900H
HP Elitebook 840 G10: Intel Core i7-1355U, 14.00", 1.4 kg
External Review » HP Elitebook 840 G10
HP 15s-fq5121ns: Intel Core i7-1255U, 15.60", 1.7 kg
External Review » HP 15s-fq5121ns
HP Spectre Fold: Intel Core i7-1250U, 17.00", 1.6 kg
External Review » HP Spectre Fold
Asus ExpertBook B7 Flip B7402FBA: Intel Core i7-1260P, 14.00", 1.5 kg
External Review » Asus ExpertBook B7 Flip B7402FBA
Asus ExpertBook B9 B9403CVA-KM0153X: Intel Core i7-1355U, 14.00", 1 kg
External Review » Asus ExpertBook B9 B9403CVA-KM0153X
Lenovo Yoga 7 14IRL8, i7-1360P: Intel Core i7-1360P, 14.00", 1.5 kg
External Review » Lenovo Yoga 7 14IRL8, i7-1360P
HP Elite x360 1040 G10: Intel Core i7-1355U, 14.00", 1.3 kg
External Review » HP Elite x360 1040 G10
Lenovo ThinkPad X13 G4: Intel Core i7-1365U, 13.30", 1.1 kg
External Review » Lenovo ThinkPad X13 G4
Lenovo Yoga 7 16IRL8, i7-1360P: Intel Core i7-1360P, 16.00", 2 kg
External Review » Lenovo Yoga 7 16IRL8, i7-1360P
Asus Vivobook 17X K3704VA: Intel Core i9-13900H, 17.30", 2.1 kg
External Review » Asus Vivobook 17X K3704VA
Dell Vostro 15 3530: Intel Core i7-1355U, 15.60", 1.9 kg
External Review » Dell Vostro 15 3530
Lenovo Yoga Slim 6 14IAP8: Intel Core i7-1260P, 14.00", 1.3 kg
External Review » Lenovo Yoga Slim 6 14IAP8
HP Envy 17-cw0000: Intel Core i7-12700H, 17.30", 2.5 kg
External Review » HP Envy 17-cw0000
HP Spectre x360 14-ef2038no: Intel Core i7-1355U, 13.50", 1.4 kg
External Review » HP Spectre x360 14-ef2038no
Lenovo IdeaPad 3 15IAU7: Intel Core i7-1255U, 15.60", 1.6 kg
External Review » Lenovo IdeaPad 3 15IAU7
HP Spectre x360 16-f2000: Intel Core i7-1360P, 16.00", 2.2 kg
External Review » HP Spectre x360 16-f2000
Lenovo ThinkBook Plus Gen4 IRU: Intel Core i7-1355U, 13.30", 1.4 kg
External Review » Lenovo ThinkBook Plus Gen4 IRU
Samsung Galaxy Book3 15, i7-1355U: Intel Core i7-1355U, 15.60", 1.6 kg
External Review » Samsung Galaxy Book3 15, i7-1355U
Asus Vivobook 15X K3504VA, i7-1355U: Intel Core i7-1355U, 15.60", 1.6 kg
External Review » Asus Vivobook 15X K3504VA, i7-1355U
Acer Aspire Vero AV15-53P-75NA: Intel Core i7-1355U, 15.60", 1.7 kg
External Review » Acer Aspire Vero AV15-53P-75NA
HP Pavilion 15-eg2772nd: Intel Core i7-1255U, 15.60", 1.7 kg
External Review » HP Pavilion 15-eg2772n
HP Pavilion Plus 14-eh0004ns: Intel Core i7-12700H, 14.00", 1.4 kg
External Review » HP Pavilion Plus 14-eh0004ns
Dell Inspiron 15 5510: Intel Core i5-11320H, 15.60", 1.6 kg
External Review » Dell Inspiron 15 5510
Asus Vivobook S 14 K3402ZA, i7-12700H: Intel Core i7-12700H, 14.00", 1.5 kg
External Review » Asus Vivobook S 14 K3402ZA, i7-12700H
Lenovo ThinkPad X1 Yoga G8 i7-1355U: Intel Core i7-1355U, 14.00", 1.4 kg
External Review » Lenovo ThinkPad X1 Yoga G8 i7-1355U
Lenovo ThinkPad X1 Carbon G11, i7-1355U: Intel Core i7-1355U, 14.00", 1.1 kg
External Review » Lenovo ThinkPad X1 Carbon G11, i7-1355U
Asus Zenbook 14 UX3402VA, i7-1360P: Intel Core i7-1360P, 14.00", 1.4 kg
External Review » Asus Zenbook 14 UX3402VA, i7-1360P
Dell Latitude 9440 2-in-1: Intel Core i7-1365U, 14.00", 1.6 kg
External Review » Dell Latitude 9440 2-in-1
Lenovo ThinkPad X1 Yoga G8, i7-1370P: Intel Core i7-1370P, 14.00", 1.4 kg
External Review » Lenovo ThinkPad X1 Yoga G8, i7-1370P
Asus ExpertBook B9 B9400, i7-1265U: Intel Core i7-1265U, 14.00", 1 kg
External Review » Asus ExpertBook B9 B9400, i7-1265U
Durabook R11 Rugged: Intel Core i7-1255U, 11.60", 1.2 kg
External Review » Durabook R11 Rugged
Asus Vivobook 15 OLED L1201W: Intel Core i9-13900H, 15.60", 1.7 kg
External Review » Asus Vivobook 15 OLED L1201W
LG Gram Style 14Z90RS-G.AD7AG: Intel Core i7-1360P, 14.00", 1 kg
External Review » LG Gram Style 14Z90RS-G.AD7AG
MSI Modern 14 C13M, i7-1355U: Intel Core i7-1355U, 14.00", 1.4 kg
External Review » MSI Modern 14 C13M, i7-1355U
Huawei MateBook 14s 2023: Intel Core i7-13700H, 14.20", 1.4 kg
External Review » Huawei MateBook 14s 2023
Huawei MateBook D 16 2023: Intel Core i9-13900H, 16.00", 1.7 kg
External Review » Huawei MateBook D 16 2023
Lenovo ThinkPad X1 Carbon G11-21HNS00000: Intel Core i7-1365U, 14.00", 1.2 kg
External Review » Lenovo ThinkPad X1 Carbon G11-21HNS00000
Lenovo ThinkPad X1 Nano Gen 3: Intel Core i7-1360P, 13.00", 1 kg
External Review » Lenovo ThinkPad X1 Nano Gen 3
Dell XPS 13 Plus 9320 Core i7-1360P: Intel Core i7-1360P, 13.40", 1.3 kg
External Review » Dell XPS 13 Plus 9320 Core i7-1360P
Acer Aspire 5 A515-58M: Intel Core i7-1355U, 15.60", 1.8 kg
External Review » Acer Aspire 5 A515-58M
HP 15s-fq5054ns: Intel Core i7-1255U, 15.60", 1.7 kg
External Review » HP 15s-fq5054ns
Acer Aspire 5 A515-57-77VF: Intel Core i7-1255U, 15.60", 1.8 kg
External Review » Acer Aspire 5 A515-57-77VF
Acer Aspire Vero AV15-53: Intel Core i7-1355U, 15.60", 1.8 kg
External Review » Acer Aspire Vero 15 AV15-53
Asus Vivobook 15X K3504VA: Intel Core i7-1360P, 15.60", 1.6 kg
External Review » Asus Vivobook 15X K3504VA
Dell Latitude 13 7330 Rugged Extreme, i7-1165G7: Intel Core i7-1165G7, 13.30", 2.7 kg
External Review » Dell Latitude 13 7330 Rugged Extreme, i7-1165G7
LG Gram SuperSlim (2023): Intel Core i7-1360P, 15.60", 1 kg
External Review » LG Gram SuperSlim (2023)
MSI Prestige 16 Evo A13M: Intel Core i7-13700H, 16.00", 1.9 kg
External Review » MSI Prestige 16 Evo A13M
Acer Swift 14 SF14-71T-75UX: Intel Core i7-13700H, 14.00", 1.2 kg
External Review » Acer Swift 14 SF14-71T-75UX
Huawei MateBook X Pro 2023: Intel Core i7-1360P, 14.20", 1.3 kg
External Review » Huawei MateBook X Pro 2023
Dell Inspiron 14 7430 2-in-1: Intel Core i7-1355U, 14.00", 1.6 kg
External Review » Dell Inspiron 14 7430 2-in-1
Asus Zenbook 14X OLED UX3404VA: Intel Core i7-13700H, 14.50", 1.6 kg
External Review » Asus Zenbook 14X OLED UX3404VA
Lenovo Yoga 7 14IRL8: Intel Core i7-1360P, 14.00", 1.6 kg
External Review » Lenovo Yoga 7 14IRL8
HP EliteBook 1040 G9, i7-1255U: Intel Core i7-1255U, 14.00", 1.2 kg
External Review » HP EliteBook 1040 G9, i7-1255U
Acer Swift Go 16 SFG16-71: Intel Core i7-1355U, 16.00", 1.6 kg
External Review » Acer Swift Go 16 SFG16-71
Asus VivoBook S15 OLED K5504VA: Intel Core i5-13500H, 15.60", 1.8 kg
External Review » Asus VivoBook S15 OLED K5504VA
Asus Vivobook 16X F1603ZA: Intel Core i7-12700H, 16.00", 1.9 kg
External Review » Asus Vivobook 16X F1603ZA
HP Dragonfly G4: Intel Core i7-1355U, 13.50", 1 kg
External Review » HP Dragonfly G4
Lenovo Yoga 7 16IRL8: Intel Core i7-1355U, 16.00", 2 kg
External Review » Lenovo Yoga 7 16IRL8
Lenovo Yoga Book 9i 2-in-1 Dual Screen: Intel Core i7-1355U, 13.30", 1.6 kg
External Review » Lenovo Yoga Book 9i 2-in-1 Dual Screen
MSI Summit E14 Flip Evo A13MT: Intel Core i7-1360P, 14.00", 1.6 kg
External Review » MSI Summit E14 Flip Evo A13MT
Asus VivoBook 15 F1500EA, i7-1165G7: Intel Core i7-1165G7, 15.60", 1.8 kg
External Review » Asus VivoBook 15 F1500EA, i7-1165G7
Samsung Galaxy Book3 Pro 16, i7-1360P: Intel Core i7-1360P, 16.00", 1.6 kg
External Review » Samsung Galaxy Book3 Pro 16, i7-1360P
Acer Aspire 3 A315-58, i7-1165G7: Intel Core i7-1165G7, 15.60", 1.7 kg
External Review » Acer Aspire 3 A315-58, i7-1165G7
Asus VivoBook 14 F1402ZA, i7-1255U: Intel Core i7-1255U, 14.00", 1.5 kg
External Review » Asus VivoBook 14 F1402ZA, i7-1255U
HP 15s-fq4088ns: Intel Core i7-1195G7, 15.60", 1.7 kg
External Review » HP 15s-fq4088ns
Acer Swift 14 SF14-71T-74RF: Intel Core i7-13700H, 14.00", 1.2 kg
External Review » Acer Swift 14 SF14-71T-74RF
Acer Swift Go SFG16-71: Intel Core i7-13700H, 16.00", 1.6 kg
External Review » Acer Swift Go SFG16-71
Asus VivoBook 14X S3405: Intel Core i9-13900H, 14.00", 1.4 kg
External Review » Asus VivoBook 14X S3405
MSI Prestige 13 Evo A12M: Intel Core i7-1280P, 13.30", 1 kg
External Review » MSI Prestige 13 Evo A12M
HP ZBook Firefly 14 G9, i7-1255U: Intel Core i7-1255U, 14.00", 1.5 kg
External Review » HP ZBook Firefly 14 G9, i7-1255U
Asus ZenBook S13 OLED UX5304: Intel Core i7-1355U, 13.30", 1 kg
External Review » Asus ZenBook S13 OLED UX5304
Acer TravelMate Spin P6 TMP614RN-52: Intel Core i7-1165G7, 14.00", 1 kg
External Review » Acer TravelMate Spin P6 TMP614RN-52
LG gram Style 16Z90RS: Intel Core i7-1360P, 16.00", 1.3 kg
External Review » LG gram Style 16Z90RS
MSI Prestige 13 Evo A13M: Intel Core i7-1360P, 13.30", 1 kg
External Review » MSI Prestige 13 Evo A13M
MSI Summit E13 Flip Evo A13MT: Intel Core i7-1360P, 13.40", 1.4 kg
External Review » MSI Summit E13 Flip Evo A13MT
MSI Modern 15 B13M: Intel Core i7-1355U, 15.60", 1.7 kg
External Review » MSI Modern 15 B13M
HP EliteBook 840 G9: Intel Core i7-1255U, 14.00", 1.4 kg
External Review » HP EliteBook 840 G9
Lenovo YogaBook 9 13IRU8: Intel Core i7-1355U, 13.30", 1.3 kg
External Review » Lenovo YogaBook 9 13IRU8
LG gram Style 14Z90RS: Intel Core i7-1360P, 14.00", 1 kg
External Review » LG gram Style 14Z90RS
Asus ExpertBook P1412: Intel Core i7-1165G7, 14.00", 1.5 kg
External Review » Asus ExpertBook P1412
Lenovo Yoga Slim 7 Pro 14IAP7: Intel Core i7-12700H, 14.00", 1.4 kg
External Review » Lenovo Yoga Slim 7 Pro 14IAP7
Lenovo ThinkPad E15 G4, i7-1260P: Intel Core i7-1260P, 15.60", 1.7 kg
External Review » Lenovo ThinkPad E15 G4, i7-1260P
MSI Prestige 14 Evo B13M: Intel Core i7-13700H, 14.00", 1.5 kg
External Review » MSI Prestige 14 Evo B13M
Samsung Galaxy Book3 360 13, i7-1360P: Intel Core i7-1360P, 13.30", 1.2 kg
External Review » Samsung Galaxy Book3 360 13, i7-1360P
Acer Aspire 5 A515-57-76BV: Intel Core i7-1255U, 15.60", 1.8 kg
External Review » Acer Aspire 5 A515-57-76BV
HP 15s-fq5061ns: Intel Core i7-1255U, 15.60", 1.7 kg
External Review » HP 15s-fq5061ns
Dell Latitude 5431, i7-1270P: Intel Core i7-1270P, 14.00", 1.5 kg
External Review » Dell Latitude 5431, i7-1270P
Lenovo ThinkBook 13x Gen 2, i7-1255U: Intel Core i7-1255U, 13.30", 1.2 kg
External Review » Lenovo ThinkBook 13x Gen 2, i7-1255U
HP 15s-fq5047ns: Intel Core i7-1255U, 15.60", 1.7 kg
External Review » HP 15s-fq5047ns
HP 15s-fq5098ns: Intel Core i7-1255U, 15.60", 1.6 kg
External Review » HP 15s-fq5098ns
ADATA XPG Xenia 14: Intel Core i7-1165G7, 14.00", 1 kg
External Review » ADATA XPG Xenia 14
Dell Latitude 7430, i5-1265U: Intel Core i7-1265U, 14.00", 1.2 kg
External Review » Dell Latitude 7430, i5-1265U
Lenovo ThinkPad X1 Nano G2, i7-1260P: Intel Core i7-1260P, 13.00", 1 kg
External Review » Lenovo ThinkPad X1 Nano G2, i7-1260P
Lenovo ThinkPad X13 G3, i7-1260P: Intel Core i7-1260P, 13.30", 1.3 kg
External Review » Lenovo ThinkPad X13 G3, i7-1260P
Lenovo V15 G3 IAP, i7-1255U: Intel Core i7-1255U, 15.60", 1.7 kg
External Review » Lenovo V15 G3 IAP, i7-1255U
Samsung Galaxy Book3 Pro 14: Intel Core i7-1360P, 14.00", 1.2 kg
External Review » Samsung Galaxy Book3 Pro 14, Core i7-1360P
Lenovo ThinkPad T16 Gen 1 Core i7-1270P: Intel Core i7-1270P, 16.00", 2 kg
External Review » Lenovo ThinkPad T16 Gen 1 Core i7-1270P
Asus Zenbook 14 Flip UP3404VA-KN026W: Intel Core i7-1360P, 14.00", 1.5 kg
External Review » Asus Zenbook 14 Flip 2023 UP3404VA-KN026W
Acer Aspire Vero AV15-51-7617: Intel Core i7-1195G7, 15.60", 1.8 kg
External Review » Acer Aspire Vero AV15-51-7617
HP Spectre x360 14-ef2177ng: Intel Core i7-1355U, 13.50", 1.4 kg
External Review » HP Spectre x360 14-ef2177ng
HP Spectre x360 14-ef0075ng: Intel Core i7-1255U, 13.50", 1.4 kg
External Review » HP Spectre x360 14-ef0075ng
HP Envy x360 13-bf0035no: Intel Core i7-1250U, 13.30", 1.4 kg
External Review » HP Envy x360 13-bf0035no
Asus ZenBook 14X UX3404VC: Intel Core i9-13900H, 14.50", 1.6 kg
External Review » Asus ZenBook 14X UX3404VC
Acer Swift Go 14 SFG14-71-785V: Intel Core i7-13700H, 14.00", 1.3 kg
External Review » Acer Swift Go 14 SFG14-71-785V
LG Gram 17 (2023): Intel Core i7-1360P, 17.00", 1.4 kg
External Review » LG Gram 17Z90R-G.AA77G
Lenovo Yoga 9 14IRP G8: Intel Core i7-1360P, 14.00", 1.4 kg
External Review » Lenovo Yoga 9 14IRP G8
Lenovo Yoga 9 14IRP8, i7-1360P: Intel Core i7-1360P, 14.00", 1.4 kg
External Review » Lenovo Yoga 9 14IRP8, i7-1360P
Acer Chromebook Vero 514 CBV514-1H, i7-1255U: Intel Core i7-1255U, 14.00", 1.5 kg
External Review » Acer Chromebook Vero 514 CBV514-1H, i7-1255U
Asus ExpertBook B5 B5602CBA, i7-1260P: Intel Core i7-1260P, 16.00", 1.5 kg
External Review » Asus ExpertBook B5 B5602CBA, i7-1260P
HP Envy x360 15-es2026nr: Intel Core i7-1260P, 15.60", 1.7 kg
External Review » HP Envy x360 15-es2026nr
Lenovo ThinkPad T14s G3-21BR00G0GE: Intel Core i7-1260P, 14.00", 1.2 kg
External Review » Lenovo ThinkPad T14s G3-21BR00G0GE
LG Gram 14Z90Q, i7-1260P: Intel Core i7-1260P, 14.00", 1 kg
External Review » LG Gram 14Z90Q, i7-1260P
Asus VivoBook 14 F1402ZA-EK329W: Intel Core i7-1255U, 14.00", 1.5 kg
External Review » Asus VivoBook 14 F1402ZA-EK329W
Fujitsu Lifebook U9312, i7-1265U: Intel Core i7-1265U, 13.30", 0.9 kg
External Review » Fujitsu Lifebook U9312, i7-1265U
HP EliteBook 1040 G9, i7-1265U: Intel Core i7-1265U, 14.00", 1.2 kg
External Review » HP EliteBook 1040 G9, i7-1265U
Samsung Galaxy Book3 Pro 360 16, i7-1360P: Intel Core i7-1360P, 16.00", 1.7 kg
External Review » Samsung Galaxy Book3 Pro 360 16, i7-1360P
HP Envy x360 15-ew0871nd: Intel Core i7-1260P, 15.60", 1.7 kg
External Review » HP Envy x360 15-ew0871nd
Dell XPS 13 9315 2-in-1, i7-1250U: Intel Core i7-1250U, 13.00", 0.8 kg
External Review » Dell XPS 13 9315 2-in-1, i7-1250U
HP Envy x360 13-bf0013dx: Intel Core i7-1250U, 13.30", 1.4 kg
External Review » HP Envy x360 13-bf0013dx
Acer Aspire 3 A317-54-768S: Intel Core i7-1255U, 13.30", 2.5 kg
External Review » Acer Aspire 3 A317-54-768S
HP EliteBook 830 G9, i7-1255U: Intel Core i7-1255U, 13.30", 1.3 kg
External Review » HP EliteBook 830 G9, i7-1255U
HP ProBook 450 G9 6A180EA: Intel Core i7-1255U, 15.60", 1.7 kg
External Review » HP ProBook 450 G9 6A180EA
Acer Aspire Vero AV14-51-73LM: Intel Core i7-1255U, 14.00", 1.5 kg
External Review » Acer Aspire Vero AV14-51-73LM
Dell Inspiron 14 5410-D3D7T: Intel Core i7-1165G7, 14.00", 1.5 kg
External Review » Dell Inspiron 14 5410-D3D7T
Acer Aspire Vero AV15-52-73F2: Intel Core i7-1255U, 15.60", 1.8 kg
External Review » Acer Aspire Vero AV15-52-73F2
Huawei MateBook 14s 2022, i7-12700H: Intel Core i7-12700H, 14.20", 1.4 kg
External Review » Huawei MateBook 14s 2022, i7-12700H
Infinix Inbook X2 Plus, i7-1195G7: Intel Core i7-1195G7, 15.60", 1.7 kg
External Review » Infinix Inbook X2 Plus, i7-1195G7
Asus ExpertBook B5 Flip B5402F, i7-1260P: Intel Core i7-1260P, 14.00", 1.3 kg
External Review » Asus ExpertBook B5 Flip B5402F, i7-1260P
Asus Zenbook Pro 15 Flip Q529ZA, i7-12700H: Intel Core i7-12700H, 15.60", 1.8 kg
External Review » Asus Zenbook Pro 15 Flip Q529ZA, i7-12700H
Lenovo IdeaPad Duet 5 12IAU7, i7-1255U: Intel Core i7-1255U, 12.40", 0.8 kg
External Review » Lenovo IdeaPad Duet 5 12IAU7, i7-1255U
HP Envy x360 15-eu1026nr: Intel Core i7-1255U, 15.60", 1.8 kg
External Review » HP Envy x360 15-eu1026nr
Asus ExpertBook B2 Flip B2502FBA-N80141X: Intel Core i7-1260P, 15.60", 1.9 kg
External Review » Asus ExpertBook B2 Flip B2502FBA-N80141X
Dynabook Portégé X30L-K-108: Intel Core i7-1260P, 13.30", 0.9 kg
External Review » Dynabook Portégé X30L-K-108
Asus Vivobook 14 F1400EA-EB1594W: Intel Core i7-1165G7, 14.00", 1.6 kg
External Review » Asus Vivobook 14 F1400EA-EB1594W
HP 15s-fq4009ns: Intel Core i7-1195G7, 15.60", 1.7 kg
External Review » HP 15s-fq4009ns
Dell Latitude 9330: Intel Core i7-1260U, 13.30", 1.2 kg
External Review » Dell Latitude 9330
Lenovo IdeaPad Gaming 3 16IAH7-82SA009GGE: Intel Core i7-12700H, 16.00", 2.6 kg
External Review » Lenovo IdeaPad Gaming 3 16IAH7-82SA009GGE
LG Gram 16 2-in-1 2022 16T90Q, i7-1260P: Intel Core i7-1260P, 16.00", 1.5 kg
External Review » LG Gram 16 2-in-1 2022 16T90Q, i7-1260P
Dell Inspiron 16 Plus 7620, iGPU: Intel Core i7-12700H, 16.00", 2.1 kg
External Review » Dell Inspiron 16 Plus 7620, iGPU
Asus ZenBook Flip S UX371EA-HL753W: Intel Core i7-1165G7, 13.30", 1.2 kg
External Review » Asus ZenBook Flip S UX371EA-HL753W
Samsung Galaxy Book2 360 13-NP730QED: Intel Core i7-1255U, 13.30", 1.2 kg
External Review » Samsung Galaxy Book2 360 13-NP730QED
Microsoft Surface Laptop 5 15, i7-1265U: Intel Core i7-1265U, 15.00", 1.6 kg
External Review » Microsoft Surface Laptop 5 15, i7-1265U
HP Elite Dragonfly Folio 13.5 G3: Intel Core i7-1265U, 13.50", 1.4 kg
External Review » HP Elite Dragonfly Folio 13.5 G3
HP EliteBook 840 G9: Intel Core i7-1280P, 14.00", 1.5 kg
External Review » HP EliteBook 840 G9
Lenovo ThinkPad X1 Carbon G10 Core i7-1265U: Intel Core i7-1265U, 14.00", 1.2 kg
External Review » Lenovo ThinkPad X1 Carbon G10 Core i7-1265U
HP Spectre x360 14-ef0073ng: Intel Core i7-1255U, 13.50", 1.4 kg
External Review » HP Spectre x360 14-ef0073ng
Lenovo ThinkPad X1 Carbon G10 Core i7-1270P: Intel Core i7-1270P, 14.00", 1.1 kg
External Review » Lenovo ThinkPad X1 Carbon G10 Core i7-1270P
Lenovo ThinkPad T14 G3 21AH00HXGE: Intel Core i7-1260P, 14.00", 1.3 kg
External Review » Lenovo ThinkPad T14 G3 21AH00HXGE
Lenovo Yoga 9 14IAP7 82LU0001US: Intel Core i7-1260P, 14.00", 1.4 kg
External Review » Lenovo Yoga 9 14IAP7 82LU0001US
HP Spectre x360 16-f1075ng: Intel Core i7-12700H, 16.00", 2 kg
External Review » HP Spectre x360 16-f1075ng
HP EliteBook 860 G9, i7-1255U: Intel Core i7-1255U, 16.00", 1.8 kg
External Review » HP EliteBook 860 G9, i7-1255U
HP Elite x360 1040 G9, i7-1265U: Intel Core i7-1265U, 14.00", 1.4 kg
External Review » HP Elite x360 1040 G9, i7-1265U
Acer Swift 5 SF514-56T-706S: Intel Core i7-1260P, 14.00", 1.2 kg
External Review » Acer Swift 5 SF514-56T-706S
MSI Modern 14 C12M, i7-1255U: Intel Core i7-1255U, 14.00", 1.4 kg
External Review » MSI Modern 14 C12M, i7-1255U
Microsoft Surface Laptop 5 13, i7-1255U: Intel Core i7-1255U, 13.50", 1.3 kg
External Review » Microsoft Surface Laptop 5 13, i7-1255U
Asus ZenBook S 13 Flip UP5302ZA, i7-1260P: Intel Core i7-1260P, 13.30", 1.1 kg
External Review » Asus ZenBook S 13 Flip UP5302ZA, i7-1260P
HP Pavilion 15-eg2025nr: Intel Core i7-1165G7, 15.60", 1.8 kg
External Review » HP Pavilion 15-eg2025nr
Dynabook Tecra A40-K-101: Intel Core i7-1260P, 14.00", 1.5 kg
External Review » Dynabook Tecra A40-K-101
Asus Vivobook 17X K1703, i7-12700H: Intel Core i7-12700H, 17.30", 2.1 kg
External Review » Asus Vivobook 17X K1703, i7-12700H
MSI Summit E13 Flip Evo A12MT-059RU: Intel Core i7-1280P, 13.40", 1.4 kg
External Review » MSI Summit E13 Flip Evo A12MT-059RU
Asus ExpertBook B9 B9400, i7-1255U: Intel Core i7-1255U, 14.00", 1 kg
External Review » Asus ExpertBook B9 B9400, i7-1255U
HP Envy x360 13-bf0090TU: Intel Core i7-1250U, 13.30", 1.3 kg
External Review » HP Envy x360 13-bf0090TU
Lenovo Ideapad 5 Pro 14IAP7, i7-1260P: Intel Core i7-1260P, 14.00", 1.4 kg
External Review » Lenovo Ideapad 5 Pro 14IAP7, i7-1260P
HP Elite Dragonfly G3: Intel Core i7-1265U, 13.50", 1.2 kg
External Review » HP Elite Dragonfly G3
Acer Aspire Vero AV14-51-72DL: Intel Core i7-1255U, 14.00", 1.5 kg
External Review » Acer Aspire Vero AV14-51-72DL
Lenovo Yoga 7 14IAL7-82QE003FGE: Intel Core i7-1260P, 14.00", 1.4 kg
External Review » Lenovo Yoga 7 14IAL7-82QE003FGE
MSI Prestige 14 Evo A12M-248RU: Intel Core i7-1280P, 14.00", 1.3 kg
External Review » MSI Prestige 14 Evo A12M-248RU
Dell Latitude 14 9430, i7-1265U: Intel Core i7-1265U, 14.00", 1.3 kg
External Review » Dell Latitude 14 9430, i7-1265U
HP Envy x360 13-bf0042TU: Intel Core i7-1250U, 13.30", 1.3 kg
External Review » HP Envy x360 13-bf0042TU
LG Gram 16Z90Q: Intel Core i7-1260P, 16.00", 1.2 kg
External Review » LG Gram 16Z90Q
Lenovo Yoga 9 14IAP7-82LU007FGE: Intel Core i7-1280P, 14.00", 1.4 kg
External Review » Lenovo Yoga 9 14IAP7-82LU007FGE
Microsoft Surface Pro 9, i7-1255U: Intel Core i7-1255U, 13.00", 0.9 kg
External Review » Microsoft Surface Pro 9, i7-1255U
Huawei MateBook 16s i9: Intel Core i9-13900H, 16.00", 2 kg
External Review » Huawei MateBook 16s i9
Microsoft Surface Laptop 5 15, i7-1255U: Intel Core i7-1255U, 15.00", 1.6 kg
External Review » Microsoft Surface Laptop 5 15, i7-1255U
Dynabook Portégé X30W-K-11E: Intel Core i7-1260P, 13.30", 1 kg
External Review » Dynabook Portégé X30W-K-11E
Microsoft Surface Laptop 5 13, i7-1265U: Intel Core i7-1265U, 13.50", 1.3 kg
External Review » Microsoft Surface Laptop 5 13, i7-1265U
Lenovo ThinkPad X1 Nano Gen 2 Core i7-1280P: Intel Core i7-1280P, 13.00", 1 kg
External Review » Lenovo ThinkPad X1 Nano Gen 2 Core i7-1280P
Dell Latitude 9430 2-in-1: Intel Core i7-1265U, 14.00", 1.5 kg
External Review » Dell Latitude 9430 2-in-1
Lenovo Yoga Slim 7 Carbon 13IAP7-82U9005FGE: Intel Core i7-1260P, 13.30", 1 kg
External Review » Lenovo Yoga Slim 7 Carbon 13IAP7-82U9005FGE
HP ZBook Firefly 14 G9, i7-1265U: Intel Core i7-1265U, 14.00", 1.5 kg
External Review » HP ZBook Firefly 14 G9, i7-1265U
MSI Summit E16 Flip Evo A12MT: Intel Core i7-1280P, 16.00", 1.9 kg
External Review » MSI Summit E16 Flip Evo A12MT
MSI Modern 15 B12M, i7-1255U: Intel Core i7-1255U, 15.60", 1.8 kg
External Review » MSI Modern 15 B12M, i7-1255U
Dynabook Portégé X40L-K1467: Intel Core i7-1270P, 14.00", 1.1 kg
External Review » Dynabook Portégé X40L-K1467
Dell Latitude 14 7430 2-in-1, i7-1265U: Intel Core i7-1265U, 14.00", 1.2 kg
External Review » Dell Latitude 14 7430 2-in-1, i7-1265U
Samsung Galaxy Book Pro 15 NP950XDB-KC5US: Intel Core i7-1165G7, 15.60", 1.1 kg
External Review » Samsung Galaxy Book Pro 15 NP950XDB-KC5US
Lenovo Yoga Slim 9 14IAP7: Intel Core i7-1280P, 14.00", 1.4 kg
External Review » Lenovo Yoga Slim 9 14IAP7
Lenovo ThinkPad X1 Fold G2: unknown, 16.30", 1.3 kg
External Review » Lenovo ThinkPad X1 Fold G2
HP Envy 13-ba1006ns: Intel Core i7-1165G7, 13.30", 1.3 kg
External Review » HP Envy 13-ba1006ns
HP 14s-dq4001ns: Intel Core i7-1195G7, 14.00", 1.5 kg
External Review » HP 14s-dq4001ns
Dynabook Portégé X30L-K-122: Intel Core i7-1260P, 13.30", 0.9 kg
External Review » Dynabook Portégé X30L-K-122
Lenovo ThinkPad X1 Carbon G10-21CB009SGE: Intel Core i7-1255U, 14.00", 1.1 kg
External Review » Lenovo ThinkPad X1 Carbon G10-21CB009SGE
Acer Aspire Vero AV15-52-712Q: Intel Core i7-1255U, 15.60", 1.8 kg
External Review » Acer Aspire Vero AV15-52-712Q
HP Elite Dragonfly G3, i7-1265U: Intel Core i7-1265U, 13.50", 1 kg
External Review » HP Elite Dragonfly G3, i7-1265U
Dynabook Portégé X40-K: Intel Core i7-1260P, 14.00", 1.5 kg
External Review » Dynabook Portégé X40-K
MSI Summit E13 Flip Evo A12MT-023: Intel Core i7-1280P, 13.40", 1.4 kg
External Review » MSI Summit E13 Flip Evo A12MT-023
Acer Swift 3 SF314-71-751E: Intel Core i7-12700H, 14.00", 1.4 kg
External Review » Acer Swift 3 SF314-71-751E
Acer Aspire Vero AV15-52-772X: Intel Core i7-1255U, 15.60", 1.8 kg
External Review » Acer Aspire Vero AV15-52-772X
Lenovo IdeaPad 3 15ITL6-82H8015MMH: Intel Core i7-1165G7, 15.60", 1.7 kg
External Review » Lenovo IdeaPad 3 15ITL6-82H8015MMH
HP Pavilion x360 14-ek0000: Intel Core i7-1255U, 14.00", 1.5 kg
External Review » HP Pavilion x360 14-ek0000
HP Pavilion 15-eg2000: Intel Core i7-1260P, 15.60", 1.7 kg
External Review » HP Pavilion 15-eg2000
Lenovo Yoga 7 16IAP7: Intel Core i7-1260P, 16.00", 2 kg
External Review » Lenovo Yoga 7 16IAP7
Lenovo Yoga 7 14IAL7-82QE000KUS: Intel Core i7-1255U, 14.00", 1.5 kg
External Review » Lenovo Yoga 7 14IAL7-82QE000KUS
MSI Prestige 14 Evo A12M-089: Intel Core i7-1280P, 14.00", 1.3 kg
External Review » MSI Prestige 14 Evo A12M-089
Acer Swift 5 SF514-56T-797T: Intel Core i7-1260P, 14.00", 1.2 kg
External Review » Acer Swift 5 SF514-56T-797T
HP Elite Dragonfly G3, i7-1255U: Intel Core i7-1255U, 13.50", 1 kg
External Review » HP Elite Dragonfly G3, i7-1255U
Lenovo ThinkBook 14s Yoga G2 IAP 21DM000FGE: Intel Core i7-1255U, 14.00", 1.5 kg
External Review » Lenovo ThinkBook 14s Yoga G2 IAP 21DM000FGE
LG Gram 17 2022, i7-1260P: Intel Core i7-1260P, 17.00", 1.4 kg
External Review » LG Gram 17 2022, i7-1260P
MSI Modern 14 B11SBU: Intel Core i7-1195G7, 14.00", 1.3 kg
External Review » MSI Modern 14 B11SBU
Dell XPS 13 Plus 9320 i7-1280P FHD: Intel Core i7-1280P, 13.40", 1.3 kg
External Review » Dell XPS 13 Plus 9320 i7-1280P FHD
Acer Aspire 5 A515-56-758V: Intel Core i7-1165G7, 15.60", 1.7 kg
External Review » Acer Aspire 5 A515-56-758V
Asus VivoBook 15 K513EA-L12236: Intel Core i7-1165G7, 15.60", 1.8 kg
External Review » Asus VivoBook 15 K513EA-L12236
Dell Latitude 13 7330: Intel Core i7-1265U, 13.30", 1 kg
External Review » Dell Latitude 13 7330
Dell XPS 13 Plus 9320 i7-1280P OLED: Intel Core i7-1280P, 13.40", 1.3 kg
External Review » Dell XPS 13 Plus 9320 i7-1280P OLED
Lenovo ThinkPad X1 Carbon G10-21CB00B9GE: Intel Core i7-1260P, 14.00", 1.1 kg
External Review » Lenovo ThinkPad X1 Carbon G10-21CB00B9GE
VAIO FE 14.1 VWNC71429-BK: Intel Core i7-1255U, 14.10", 1.6 kg
External Review » VAIO FE 14.1 VWNC71429-BK
One Netbook T1: Intel Core i7-1260P, 13.00", 1 kg
External Review » One Netbook T1
Huawei MateBook X Pro 2022: Intel Core i7-1260P, 14.20", 1.3 kg
External Review » Huawei MateBook X Pro 2022
Lenovo ThinkPad E15 G4-21E60050GE: Intel Core i7-1255U, 15.60", 1.7 kg
External Review » Lenovo ThinkPad E15 G4-21E60050GE
Samsung Galaxy Book2 15, i7-1255U: Intel Core i7-1255U, 15.60", 1.6 kg
External Review » Samsung Galaxy Book2 15, i7-1255U
Dell Inspiron 16 7620 2-in-1: Intel Core i7-1260P, 16.00", 2.1 kg
External Review » Dell Inspiron 16 7620 2-in-1
HP Pavilion Plus 14 eh0097nr: Intel Core i7-12700H, 14.00", 1.4 kg
External Review » HP Pavilion Plus 14 eh0097nr
Dell Inspiron 14 7420 2-in-1: Intel Core i7-1255U, 14.00", 1.6 kg
External Review » Dell Inspiron 14 7420 2-in-1
Lenovo IdeaPad Flex 5 14IAU7-82R7002QGE: Intel Core i7-1255U, 14.00", 1.6 kg
External Review » Lenovo IdeaPad Flex 5 14IAU7-82R7002QGE
Samsung Galaxy Book2 Pro 360 13, i7-1255U: Intel Core i7-1255U, 13.30", 1.2 kg
External Review » Samsung Galaxy Book2 360 Pro 13, i7-1255U
Asus Vivobook 15 F515EA-EJ1479W: Intel Core i7-1165G7, 15.60", 1.8 kg
External Review » Asus Vivobook 15 F515EA-EJ1479W
Dell Inspiron 14 7420 2-in-1, i5-1235U: Intel Core i5-1235U, 14.00", 1.6 kg
External Review » Dell Inspiron 14 7420, 2-in-1
Panasonic Toughbook 40: Intel Core i7-1185G7, 14.00", 3.9 kg
External Review » Panasonic Toughbook 40
HP Elitebook 840 G8 Aero 5Z619EA: Intel Core i7-1165G7, 14.00", 1.3 kg
External Review » HP Elitebook 840 G8 Aero 5Z619EA
Acer Swift 5 SF514-56T-7173: Intel Core i7-1260P, 14.00", 1.2 kg
External Review » Acer Swift 5 SF514-56T-7173
LG Gram 16Z90Q 2022: Intel Core i7-1260P, 16.00", 1.3 kg
External Review » LG Gram 16Z90Q 2022
MSI Modern 14 B11MO-879XES: Intel Core i7-1195G7, 14.00", 1.3 kg
External Review » MSI Modern 14 B11MO-879XES
Acer Swift 3 SF314-512-78H2: Intel Core i7-1260P, 14.00", 1.3 kg
External Review » Acer Swift 3 SF314-512-78H2
Asus VivoBook S 14X S5402Z: Intel Core i7-12700H, 14.50", 1.6 kg
External Review » Asus VivoBook S 14X S5402Z
Dell Inspiron 15 3511, i7-1165G7: Intel Core i7-1165G7, 15.60", 1.7 kg
External Review » Dell Inspiron 15 3511, i7-1165G7
MSI Summit E14 Flip Evo A12MT: Intel Core i7-1260P, 14.00", 1.6 kg
External Review » MSI Summit E14 Flip Evo A12MT
HP Envy x360 15t-ew000: Intel Core i7-1260P, 15.60", 1.7 kg
External Review » HP Envy x360 15t-ew000
Acer Spin 5 SP514-51N-70LZ: Intel Core i7-1260P, 14.00", 1.3 kg
External Review » Acer Spin 5 SP514-51N-70LZ
Asus VivoBook S 14 S3402, i7-12700H: Intel Core i7-12700H, 14.00", 1.5 kg
External Review » Asus VivoBook S 14 S3402, i7-12700H
HP Spectre x360 13.5 14t-ef000: Intel Core i7-1255U, 13.50", 1.4 kg
External Review » HP Spectre x360 13.5 14t-ef000
Asus Zenbook Pro 14 Duo OLED UX8402ZA: Intel Core i7-12700H, 14.50", 1.7 kg
External Review » Asus Zenbook Pro 14 Duo OLED UX8402ZA
Dynabook Portégé X30L-J-190: Intel Core i7-1165G7, 13.30", 0.9 kg
External Review » Dynabook Portégé X30L-J-190
HP 15s-fq4086ns: Intel Core i7-1195G7, 15.60", 1.7 kg
External Review » HP 15s-fq4086ns
HP Pavilion x360 14-dy1034ns: Intel Core i7-1195G7, 14.00", 1.5 kg
External Review » HP Pavilion x360 14-dy1034ns
Samsung Galaxy Book2 Pro 15, i7-1260P: Intel Core i7-1260P, 15.60", 1.1 kg
External Review » Samsung Galaxy Book2 Pro 15, i7-1246P
Asus ZenBook Flip 14 UP5401EA-KU030T: Intel Core i7-1165G7, 14.00", 1.4 kg
External Review » Asus ZenBook Flip 14 UP5401EA-KU030T
Asus ExpertBook B7 Flip B7402FEA: Intel Core i7-1195G7, 14.00", 1.4 kg
External Review » Asus ExpertBook B7 Flip B7402FEA
Lenovo ThinkPad X1 Yoga G7 21CD006YGE: Intel Core i7-1260P, 14.00", 1.4 kg
External Review » Lenovo ThinkPad X1 Yoga G7 21CD006YGE
HP Envy 17-cr0474ng: Intel Core i7-1260P, 17.30", 2.5 kg
External Review » HP Envy 17-cr0474ng
Asus ZenBook Flip 13 UX363EA-AH74T: Intel Core i7-1165G7, 13.30", 1.3 kg
External Review » Asus ZenBook Flip 13 UX363EA-AH74T
Acer TravelMate P6 TMP614P-52-724G: Intel Core i7-1185G7, 14.00", 1.2 kg
External Review » Acer TravelMate P6 TMP614P-52-724G
Lenovo Yoga Slim 7 Carbon 13IAP7-82U9002JUK: Intel Core i7-1260P, 13.30", 1 kg
External Review » Lenovo Yoga Slim 7 Carbon 13IAP7-82U9002JUK
Acer TravelMate Vero TMV15-51-728C: Intel Core i7-1195G7, 15.60", 1.8 kg
External Review » Acer TravelMate Vero TMV15-51-728C
Lenovo Yoga Duet 7 13ITL6-82MA000RGE: Intel Core i7-1165G7, 13.00", 0.8 kg
External Review » Lenovo Yoga Duet 7 13ITL6-82MA000RGE
Prime Computer PrimeBook Circular-i7-1165G7: Intel Core i7-1165G7, 13.90", 1.6 kg
External Review » Prime Computer PrimeBook Circular-i7-1165G7
Dell XPS 13 Plus 9320 4K: Intel Core i7-1260P, 13.40", 1.2 kg
External Review » Dell XPS 13 Plus 9320 4K
Huawei MateBook 16s i7: Intel Core i7-12700H, 16.00", 2 kg
External Review » Huawei MateBook 16s i7
Huawei MateBook D 16 2022: Intel Core i7-12700H, 16.00", 1.7 kg
External Review » Huawei MateBook D 16 2022
Lenovo ThinkPad X1 Yoga G7 21CE002HGE: Intel Core i7-1270P, 14.00", 1.5 kg
External Review » Lenovo ThinkPad X1 Yoga G7 21CE002HGE
Dell XPS 13 Plus 9320, i7-1260P FHD: Intel Core i7-1260P, 13.40", 1.3 kg
External Review » Dell XPS 13 9320, i7-1260P
MSI Summit E14 Evo A12M-050: Intel Core i7-1280P, 14.00", 1.6 kg
External Review » MSI Summit E14 Evo A12M-050
Asus VivoBook 14 F415EA-EB377T: Intel Core i7-1165G7, 14.00", 1.6 kg
External Review » Asus VivoBook 14 F415EA-EB377T
Asus VivoBook 15 K513EA-L11141T: Intel Core i7-1165G7, 15.60", 1.8 kg
External Review » Asus VivoBook 15 K513EA-L11141T
HP Pavilion x360 14-dy1004ns: Intel Core i7-1195G7, 14.00", 1.5 kg
External Review » HP Pavilion x360 14-dy1004ns
Realme Book Prime: Intel Core i5-11320H, 14.00", 1.4 kg
External Review » realme Book Prime
Dell Latitude 7330 Rugged Extreme: Intel Core i7-1185G7, 13.30", 2.7 kg
External Review » Dell Latitude 7330 Rugged Extreme
Acer Enduro Urban N3 EUN314-51W-70RF: Intel Core i7-1165G7, 14.00", 1.9 kg
External Review » Acer Enduro Urban N3 EUN314-51W-70RF
Dell Latitude 14 5430 Rugged, i7-1185G7: Intel Core i7-1185G7, 14.00", 2 kg
External Review » Dell Latitude 14 5430 Rugged, i7-1185G7
Asus ZenBook 14X UX5401ZA-L7078W: Intel Core i9-12900H, 14.00", 1.4 kg
External Review » Asus ZenBook 14X UX5401ZA-L7078W
Samsung Galaxy Book2 Pro 360 15 NP950QED-KA3DE: Intel Core i7-1260P, 15.60", 1.4 kg
External Review » Samsung Galaxy Book2 Pro 360 15 NP950QED-KA3DE
Asus Zenbook 14 UX3402, i7-1260P: Intel Core i7-1260P, 14.00", 1.4 kg
External Review » Asus Zenbook 14 UX3402, i7-1260P
MSI Modern 14 B11MOU-485XES: Intel Core i7-1165G7, 14.00", 1.3 kg
External Review » MSI Modern 14 B11MOU-485XES
Durabook Z14I: Intel Core i7-1165G7, 14.00", 3.6 kg
External Review » Durabook Z14I
MSI Modern 14 B11MO-074XES: Intel Core i7-1165G7, 14.00", 1.3 kg
External Review » MSI Modern 14 B11MO-074XES
Asus ZenBook Flip 13 UX363EA-HP525T: Intel Core i7-1165G7, 15.60", 1.3 kg
External Review » Asus ZenBook Flip 13 UX363EA-HP525T
Huawei MateBook X Pro 2022: Intel Core i7-1195G7, 14.20", 1.4 kg
External Review » Huawei MateBook X Pro 2022
Asus ExpertBook B1 B1500CEAE-BQ0067R: Intel Core i7-1165G7, 15.60", 1.7 kg
External Review » Asus ExpertBook B1 B1500CEAE-BQ0067R
Dell Vostro 14 5410, i5: Intel Core i5-11320H, 14.00", 1.4 kg
External Review » Dell Vostro 14 5410, i5
Samsung Galaxy Book2 Pro 360 13 NP930QED-KA3DE: Intel Core i7-1260P, 13.30", 1 kg
External Review » Samsung Galaxy Book2 Pro 360 13 NP930QED-KA3DE
Lenovo Yoga 9i 14 2022 i7-1260P: Intel Core i7-1260P, 14.00", 1.4 kg
External Review » Lenovo Yoga 9i 14 2022 i7-1260P
Dell XPS 13 9305-P42X4: Intel Core i7-1165G7, 13.30", 1.2 kg
External Review » Dell XPS 13 9305-P42X4
Asus ExpertBook B9450CEA-XH75: Intel Core i7-1165G7, 14.00", 1 kg
External Review » Asus ExpertBook B9450CEA-XH75
HP 15s-fq4005ns: Intel Core i7-1195G7, 15.60", 1.7 kg
External Review » HP 15s-fq4005ns
Asus ExpertBook B1 B1400CEAE-EB0116R: Intel Core i7-1165G7, 14.00", 1.5 kg
External Review » Asus ExpertBook B1 B1400CEAE-EB0116R
Lenovo Yoga 9 14ITL5-82BG009WUS: Intel Core i7-1195G7, 14.00", 1.4 kg
External Review » Lenovo Yoga 9 14ITL5-82BG009WUS
HP Spectre x360 14-ea1013TU: Intel Core i7-1195G7, 13.50", 1.3 kg
External Review » HP Spectre x360 14-ea1013TU
HP Envy x360 15m-es1023dx: Intel Core i7-1195G7, 15.60", 1.8 kg
External Review » HP Envy x360 15m-es1023dx
VAIO SX14, i7-1165G7: Intel Core i7-1165G7, 14.00", 1.1 kg
External Review » VAIO SX14, i7-1165G7
Xiaomi RedmiBook Pro 15, i5-11320H iGPU: Intel Core i5-11320H, 15.60", 1.7 kg
External Review » Xiaomi RedmiBook Pro 15, i5-11320H iGPU
Asus VivoBook S14 S435EA-KC035T: Intel Core i7-1165G7, 14.00", 1.3 kg
External Review » Asus VivoBook S14 S435EA-KC035T
HP 15s-fq4006ns: Intel Core i7-1195G7, 15.60", 1.7 kg
External Review » HP 15s-fq4006ns
Asus VivoBook 14 F415EA-EB378T: Intel Core i7-1165G7, 14.00", 1.6 kg
External Review » Asus VivoBook 14 F415EA-EB378T
Asus VivoBook S14 S433EA-EB1150T: Intel Core i7-1165G7, 14.00", 1.4 kg
External Review » Asus VivoBook S14 S433EA-EB1150T
Lenovo IdeaPad 5 Pro 14ITL6-82L3003NSP: Intel Core i7-1165G7, 14.00", 1.4 kg
External Review » Lenovo IdeaPad 5 Pro 14ITL6-82L3003NSP
HP Spectre x360 14-ea0435no: Intel Core i7-1165G7, 13.50", 1.3 kg
External Review » HP Spectre x360 14-ea0435no
Lenovo ThinkBook Plus Gen3: Intel Core i7-12700H, 17.30", 2 kg
External Review » Lenovo ThinkBook Plus Gen3
Gigabyte U4 UD: Intel Core i7-1195G7, 14.00", 1 kg
External Review » Gigabyte U4 UD
Asus ExpertBook B7 Flip B7402FEA-LA0413R: Intel Core i7-1195G7, 14.00", 1.5 kg
External Review » Asus ExpertBook B7 Flip B7402FEA-LA0413R
HP Envy x360 15-es0021ur: Intel Core i7-1165G7, 15.60", 1.8 kg
External Review » HP Envy x360 15-es0021ur
Acer Aspire Vero AV15-51-76PV: Intel Core i7-1195G7, 15.60", 1.8 kg
External Review » Acer Aspire Vero AV15-51-76PV
Asus ZenBook 14 UX425EA-KI359T: Intel Core i7-1165G7, 14.00", 1.2 kg
External Review » Asus ZenBook 14 UX425EA-KI359T
Acer Aspire Vero AV15-51-78SB: Intel Core i7-1195G7, 15.60", 1.8 kg
External Review » Acer Aspire Vero AV15-51-78SB
Asus Vivobook Pro 14 K3400PA, i7-11370H: Intel Core i7-11370H, 14.00", 1.4 kg
External Review » Asus Vivobook Pro 14 K3400PA, i7-11370H
Asus ExpertBook B3 Flip B3402FEA: Intel Core i7-1165G7, 14.00", 1.6 kg
External Review » Asus ExpertBook B3 Flip B3402FEA-EC0053R
HP Pavilion 15-eg0025nr: Intel Core i7-1165G7, 15.60", 1.8 kg
External Review » HP Pavilion 15-eg0025nr
Dynabook Tecra A40-J-11J: Intel Core i7-1165G7, 14.00", 1.5 kg
External Review » Dynabook Tecra A40-J-11J
Dell Latitude 15 9520 2-in-1: Intel Core i7-1185G7, 15.00", 1.7 kg
External Review » Dell Latitude 15 9520 2-in-1
Asus ZenBook Flip 13 UX363EA-HP043T: Intel Core i7-1165G7, 13.30", 1.3 kg
External Review » Asus ZenBook Flip 13 UX363EA-HP043T
MSI Modern 15 A11M-045XES: Intel Core i7-1165G7, 15.60", 1.6 kg
External Review » MSI Modern 15 A11M-045XES
Dynabook Tecra A50-J-13W: Intel Core i7-1165G7, 15.60", 1.6 kg
External Review » Dynabook Tecra A50-J-13W
Lenovo IdeaPad 5 14ITL05-82FE005PGE: Intel Core i7-1165G7, 14.00", 1.4 kg
External Review » Lenovo IdeaPad 5 14ITL05-82FE005PGE
Asus Zenbook 14X OLED Space Edition, i7-12700H: Intel Core i7-12700H, 14.00", 1.4 kg
External Review » Asus Zenbook 14X OLED Space Edition, i7-12700H
Acer Swift 3 SF316-51: Intel Core i7-11370H, 16.10", 1.7 kg
External Review » Acer Swift 3 SF316-51
Acer Aspire Vero AV15-51-7555: Intel Core i7-1195G7, 15.60", 1.8 kg
External Review » Acer Aspire Vero AV15-51-7555
Intel NUC M15 Kit LAPBC710: Intel Core i7-1165G7, 15.60", 1.7 kg
External Review » Intel NUC M15 Kit LAPBC710
Honor MagicBook View 14: Intel Core i7-11390H, 14.20", 1.5 kg
External Review » Honor MagicBook View 14
Lenovo ThinkBook 13x ITG-20WJ001HGE: Intel Core i5-1130G7, 13.30", 1.1 kg
External Review » Lenovo ThinkBook 13x ITG-20WJ001HGE
Asus VivoBook Pro 15 K3500PA-L1077T: Intel Core i7-11370H, 15.60", 1.7 kg
External Review » Asus VivoBook Pro 15 K3500PA-L1077T
VAIO SX14 VJS144X0111K: Intel Core i7-1195G7, 14.00", 1.1 kg
External Review » VAIO SX14 VJS144X0111K
Lenovo IdeaPad Slim 7i Pro 14IHU5: Intel Core i7-11370H, 14.00", 1.4 kg
External Review » Lenovo IdeaPad Slim 7i Pro 14IHU5
Acer Aspire 5 A515-56-73AP: Intel Core i7-1165G7, 15.60", 1.7 kg
External Review » Acer Aspire 5 A515-56-73AP
Dell Latitude 15 5520, i7-1185G7: Intel Core i7-1185G7, 15.60", 1.6 kg
External Review » Dell Latitude 15 5520, i7-1185G7
Honor MagicBook View 14, i5-11320H: Intel Core i5-11320H, 14.20", 1.5 kg
External Review » Honor MagicBook View 14, i5-11320H
Asus ExpertBook B5 Flip B5302FEA-LG0400R: Intel Core i7-1165G7, 13.30", 1.3 kg
External Review » Asus ExpertBook B5 Flip B5302FEA-LG0400R
HP Pavilion x360 14-dy0028ns: Intel Core i7-1165G7, 14.00", 1.6 kg
External Review » HP Pavilion x360 14-dy0028ns
HP Pavilion x360 14-dy0034ns: Intel Core i7-1165G7, 14.00", 1.6 kg
External Review » HP Pavilion x360 14-dy0034ns
Lenovo Yoga Slim 7 14ITL05-82A30024GE: Intel Core i7-1165G7, 14.00", 1.4 kg
External Review » Lenovo Yoga Slim 7 14ITL05-82A30024GE
Asus Zenbook 14X UX5401EA-KN144T: Intel Core i7-1165G7, 14.00", 1.4 kg
External Review » Asus Zenbook 14X UX5401EA-KN144T
HP 15s-fq2089ns: Intel Core i7-1165G7, 15.60", 1.7 kg
External Review » HP 15s-fq2089ns
HP Envy x360 13-bd0350nd: Intel Core i7-1165G7, 13.30", 1.3 kg
External Review » HP Envy x360 13-bd0350nd
Dell XPS 13 9310 Core i7 4K: Intel Core i7-1185G7, 13.40", 1.3 kg
External Review » Dell XPS 13 9310 Core i7 4K
Dynabook Portégé X30W-J-10K: Intel Core i7-1165G7, 13.30", 1 kg
External Review » Dynabook Portégé X30W-J-10K
LG Gram 16 2-in-1 16T90P: Intel Core i7-1165G7, 16.00", 1.5 kg
External Review » LG Gram 16 2-in-1 16T90P
Acer Aspire Vero AV15-51-78SE: Intel Core i7-1195G7, 15.60", 1.8 kg
External Review » Acer Aspire Vero AV15-51-78SE
Dynabook Portégé X30L-J-13R: Intel Core i7-1165G7, 13.30", 0.9 kg
External Review » Dynabook Portégé X30L-J-13R
Samsung Galaxy Book Pro 360 13 NP935QDB-KA2UK: Intel Core i5-1130G7, 13.30", 1.1 kg
External Review » Samsung Galaxy Book Pro 360 13 NP935QDB-KA2UK
Microsoft Surface Pro 8, i7-1185G7: Intel Core i7-1185G7, 13.00", 0.9 kg
External Review » Microsoft Surface Pro 8, i7-1185G7
Asus Expertbook B5 B5302C, i7-1165G7: Intel Core i7-1165G7, 13.30", 1.1 kg
External Review » Asus Expertbook B5 B5302C, i7-1165G7
Xiaomi Mi Notebook Pro 14, i7-11370H: Intel Core i7-11370H, 14.00", 1.5 kg
External Review » Xiaomi Mi Notebook Pro 14, i7-11370H
Dell Latitude 15 9520-NMM8M: Intel Core i7-1185G7, 15.60", 1.4 kg
External Review » Dell Latitude 15 9520-NMM8M
Dynabook Portégé X30L-J-13P: Intel Core i7-1165G7, 13.30", 0.9 kg
External Review » Dynabook Portégé X30L-J-13P
HP Pavilion 15-eg0018ns: Intel Core i7-1165G7, 15.60", 1.8 kg
External Review » HP Pavilion 15-eg0018ns
HP Pavilion x360 14-dw1023ns: Intel Core i7-1165G7, 14.00", 1.6 kg
External Review » HP Pavilion x360 14-dw1023ns
Acer Swift 3 SF316-51-7486: Intel Core i7-11370H, 16.10", 1.8 kg
External Review » Acer Swift 3 SF316-51-7486
Huawei MateBook 14s i7: Intel Core i7-11370H, 14.20", 1.4 kg
External Review » Huawei MateBook 14s i7
Panasonic Toughbook FZ-55 MK2: Intel Core i7-1185G7, 14.00", 2.3 kg
External Review » Panasonic Toughbook FZ-55 MK2
Xiaomi Mi Notebook Ultra 2021 i7: Intel Core i7-11370H, 15.60", 1.7 kg
External Review » Xiaomi Mi Notebook Ultra 2021 i7
Samsung Galaxy Book 15, i7-1165G7: Intel Core i7-1165G7, 15.60", 1.6 kg
External Review » Samsung Galaxy Book 15, i7-1165G7
Lenovo ThinkPad X1 Yoga G6-20XY002PUS: Intel Core i7-1165G7, 14.00", 1.4 kg
External Review » Lenovo ThinkPad X1 Yoga G6-20XY002PUS
Fujitsu UH-X, i7: Intel Core i7-1165G7, 13.30", 0.7 kg
External Review » Fujitsu UH-X, i7
HP 15s-fq2088ns: Intel Core i7-1165G7, 15.60", 1.7 kg
External Review » HP 15s-fq2088ns
MSI Prestige 14 Evo A11MO-043: Intel Core i7-1195G7, 14.00", 1.3 kg
External Review » MSI Prestige 14 Evo A11MO-043
Lenovo ThinkPad X1 Nano-20UN0058US: Intel Core i7-1180G7, 13.00", 0.9 kg
External Review » Lenovo ThinkPad X1 Nano-20UN0058US
HP 15s-fq2010ns: Intel Core i7-1165G7, 15.60", 1.7 kg
External Review » HP 15s-fq2010ns
Asus Chromebook CX9400, i7-1165G7: Intel Core i7-1165G7, 14.00", 1.1 kg
External Review » Asus Chromebook CX9400, i7-1165G7
Dell Latitude 13 7320 2-in-1, i7-1185G7: Intel Core i7-1185G7, 13.30", 1.1 kg
External Review » Dell Latitude 13 7320 2-in-1, i7-1185G7
HP Pavilion 15-eg0019ns: Intel Core i7-1165G7, 15.60", 1.8 kg
External Review » HP Pavilion 15-eg0019ns
Lenovo IdeaPad Flex 5 14ITL05-82HS003QGE: Intel Core i7-1165G7, 14.00", 1.5 kg
External Review » Lenovo IdeaPad Flex 5 14ITL05-82HS003QGE
Asus ExpertBook B9 B9400CE-KC0166R: Intel Core i7-1165G7, 14.00", 1 kg
External Review » Asus ExpertBook B9 B9400CE-KC0166R
HP Pavilion 15-eg0504TU: Intel Core i7-1165G7, 15.60", 1.8 kg
External Review » HP Pavilion 15-eg0504TU
Lenovo ThinkPad X1 Carbon G9-20XW005JGE: Intel Core i7-1165G7, 14.00", 1.1 kg
External Review » Lenovo ThinkPad X1 Carbon G9-20XW005JGE
Dell XPS 13 9310 2-in-1: Intel Core i7-1165G7, 13.40", 1.3 kg
External Review » Dell XPS 13 9310 2-in-1
Fujitsu LifeBook U9311X i7 LTE: Intel Core i7-1185G7, 13.30", 1 kg
External Review » Fujitsu LifeBook U9311X i7 LTE
Microsoft Surface Laptop 4 15, i7-1185G7: Intel Core i7-1185G7, 15.00", 1.5 kg
External Review » Microsoft Surface Laptop 4 15, i7-1185G7
Dell Latitude 15 7520, i7-1165G7: Intel Core i7-1165G7, 15.60", 1.8 kg
External Review » Dell Latitude 15 7520, i7-1165G7
Lenovo ThinkPad T15 G2, i7-1165G7 iGPU: Intel Core i7-1165G7, 15.60", 1.8 kg
External Review » Lenovo ThinkPad T15 G2, i7-1165G7 iGPU
Dell Latitude 9420 2-in-1: Intel Core i7-1185G7, 14.00", 1.5 kg
External Review » Dell Latitude 9420 2-in-1
Asus VivoBook S14 S433EA-AM613T: Intel Core i7-1165G7, 14.00", 1.4 kg
External Review » Asus VivoBook S14 S433EA-AM613T
HP Spectre x360 14-ea0059nw: Intel Core i7-1165G7, 13.50", 1.3 kg
External Review » HP Spectre x360 14-ea0059nw
HP Envy x360 15-es0570nd: Intel Core i7-1165G7, 15.60", 1.8 kg
External Review » HP Envy x360 15-es0570nd
LG Gram 16 (2021): Intel Core i7-1165G7, 16.00", 1.2 kg
External Review » LG Gram 16 (2021)
Lenovo IdeaPad 3 15ITL6-82H800BHSP: Intel Core i7-1165G7, 15.60", 1.7 kg
External Review » Lenovo IdeaPad 3 15ITL6-82H800BHSP
HP Pavilion x360 14-dw1003ns: Intel Core i7-1165G7, 14.00", 1.6 kg
External Review » HP Pavilion x360 14-dw1003ns
HP Envy 14-eb0037no: Intel Core i7-1165G7, 14.00", 1.5 kg
External Review » HP Envy 14-eb0037no
Getac S410, i7-1165G7: Intel Core i7-1165G7, 14.00", 2.4 kg
External Review » Getac S410, i7-1165G7
Acer TravelMate P4 TMP414-51-75L8: Intel Core i7-1165G7, 14.00", 1.4 kg
External Review » Acer TravelMate P4 TMP414-51-75L8
Asus Vivobook 14 K413EA-EB608T: Intel Core i7-1165G7, 14.00", 1.4 kg
External Review » Asus Vivobook 14 K413EA-EB608T
HP 15s-fq2039ns: Intel Core i7-1165G7, 15.60", 1.7 kg
External Review » HP 15s-fq2039ns
Lenovo ThinkPad X1 Yoga G6-20Y0S00200: Intel Core i7-1165G7, 14.00", 1.4 kg
External Review » Lenovo ThinkPad X1 Yoga G6-20Y0S00200
Durabook S14I: Intel Core i7-1165G7, 14.00", 3 kg
External Review » Durabook S14I
Samsung Galaxy Book Pro 13 NP935XDB-KC1SE: Intel Core i7-1160G7, 13.30", 0.9 kg
External Review » Samsung Galaxy Book Pro 13 NP935XDB-KC1SE
Acer Swift 3X SF314-510G-73NT: Intel Core i7-1165G7, 14.00", 1.4 kg
External Review » Acer Swift 3X SF314-510G-73NT
Huawei MateBook D 15 2021, i7-1165G7: Intel Core i7-1165G7, 15.60", 1.6 kg
External Review » Huawei MateBook D 15 2021, i7-1165G7
Lenovo ThinkPad X1 Yoga G6-20XY002VUS: Intel Core i7-1185G7, 14.00", 1.4 kg
External Review » Lenovo ThinkPad X1 Yoga G6-20XY002VUS
HP Envy x360 13-bd0032nr: Intel Core i7-1165G7, 13.30", 1.3 kg
External Review » HP Envy x360 13-bd0032nr
HP EliteBook 850 G8 3C7Z8EA: Intel Core i7-1165G7, 15.60", 1.8 kg
External Review » HP EliteBook 850 G8 3C7Z8EA
HP EliteBook 840 Aero G8 3E4Q6AA: Intel Core i7-1185G7, 14.00", 1.2 kg
External Review » HP EliteBook 840 G8 3E4Q6AA
HP EliteBook 830 G8-i7-1165G7: Intel Core i7-1165G7, 13.30", 1.3 kg
External Review » HP EliteBook 830 G8-i7-1165G7
Lenovo ThinkPad X1 Carbon G9-20XWCTO1WW: Intel Core i7-1165G7, 14.00", 1.2 kg
External Review » Lenovo ThinkPad X1 Carbon G9-20XWCTO1WW
Dynabook Portégé X40-J-11C: Intel Core i7-1165G7, 14.00", 1.4 kg
External Review » Dynabook Portégé X40-J-11C
Acer TravelMate P614P-52: Intel Core i7-1165G7, 14.00", 1 kg
External Review » Acer TravelMate P614P-52
Asus ExpertBook B9 B9400CEA-KC0266R: Intel Core i7-1185G7, 14.00", 1 kg
External Review » Asus ExpertBook B9 B9400CEA-KC0266R
Dell Latitude 14 5420, i7-1165G7: Intel Core i7-1165G7, 14.00", 1.4 kg
External Review » Dell Latitude 14 5420, i7-1165G7
HP EliteBook x360 1030 G8, i7-1165G7: Intel Core i7-1165G7, 13.30", 1.2 kg
External Review » HP EliteBook x360 1030 G8, i7-1165G7
HP EliteBook x360 1040 G8, i7-1165G7: Intel Core i7-1165G7, 14.00", 1.3 kg
External Review » HP EliteBook x360 1040 G8, i7-1165G7
Lenovo ThinkPad X1 Carbon G9 FHD, i7-1185G7: Intel Core i7-1185G7, 15.60", 1.1 kg
External Review » Lenovo ThinkPad X1 Carbon G9 FHD, i7-1185G7
Samsung Galaxy Book Pro 13 NP930XDB-KD1US: Intel Core i7-1165G7, 13.30", 0.9 kg
External Review » Samsung Galaxy Book Pro 13 NP930XDB-KD1US
MSI Prestige 14 Evo A11M-266RU: Intel Core i7-1185G7, 14.00", 1.3 kg
External Review » MSI Prestige 14 Evo A11M-266RU
Huawei MateBook 14 2021, i7-1165G7: Intel Core i7-1165G7, 14.00", 1.5 kg
External Review » Huawei MateBook 14 2021, i7-1165G7
Acer Swift 3 SF314-59-71YQ: Intel Core i7-1165G7, 14.00", 1.2 kg
External Review » Acer Swift 3 SF314-59-71YQ
HP Pavilion 15-eg0021nr: Intel Core i7-1165G7, 15.60", 1.8 kg
External Review » HP Pavilion 15-eg0021nr
HP Pavilion x360 14-dw1004ns: Intel Core i7-1165G7, 14.00", 1.6 kg
External Review » HP Pavilion x360 14-dw1004ns
HP Elite Dragonfly G2, i7-1165G7: Intel Core i7-1165G7, 13.30", 1 kg
External Review » HP Elite Dragonfly G2, i7-1165G7
Asus Chromebook Flip CX5 CX5500FEA: Intel Core i7-1165G7, 15.60", 2 kg
External Review » Asus Chromebook Flip CX5 CX5500FEA-E60050
Dynabook Portégé X30W-J-10C: Intel Core i7-1165G7, 13.30", 1 kg
External Review » Dynabook Portégé X30W-J-10C
Asus ZenBook 13 UX325EA-KG245T: Intel Core i7-1165G7, 13.30", 1.2 kg
External Review » Asus ZenBook 13 UX325EA-KG245T
HP 15s-fq2042ns: Intel Core i7-1165G7, 15.60", 1.7 kg
External Review » HP 15s-fq2042ns
HP Envy 14-eb0490nd: Intel Core i7-1165G7, 14.00", 1.5 kg
External Review » HP Envy 14-eb0490nd
HP ProBook 440 G8-2W1G4EA: Intel Core i7-1165G7, 14.00", 1.4 kg
External Review » HP ProBook 440 G8-2W1G4EA
Lenovo ThinkPad X1 Titanium Yoga G1 20QA001PGE: Intel Core i5-1130G7, 13.50", 1.2 kg
External Review » Lenovo ThinkPad X1 Titanium Yoga G1 20QA001PGE
Dell Latitude 14 7420, i7-1185G7: Intel Core i7-1185G7, 14.00", 1.2 kg
External Review » Dell Latitude 14 7420, i7-1185G7
Samsung Galaxy Book Pro 360 15 NP950QDB-KA1US: Intel Core i7-1165G7, 15.60", 1.4 kg
External Review » Samsung Galaxy Book Pro 360 15 NP950QDB-KA1US
Samsung Galaxy Book Pro 15 NP950XDB-KA1US: Intel Core i7-1165G7, 15.60", 1.1 kg
External Review » Samsung Galaxy Book Pro 15 NP950XDB-KA1US
Dell XPS 13 9310 OLED: Intel Core i7-1185G7, 13.40", 1.2 kg
External Review » Dell XPS 13 9310 OLED
MSI Summit E13 Flip Evo A11MT: Intel Core i7-1185G7, 13.40", 1.4 kg
External Review » MSI Summit E13 Flip Evo A11MT
Dell Latitude 13 7320, i7-1185G7: Intel Core i7-1185G7, 13.30", 1.3 kg
External Review » Dell Latitude 13 7320, i7-1185G7
Lenovo ThinkPad X1 Titanium Yoga G1 20QB0018GE: Intel Core i7-1180G7, 13.50", 1.2 kg
External Review » Lenovo ThinkPad X1 Titanium Yoga G1 20QB0018GE
Dell Latitude 13 7320 2-in-1, i7-1165G7: Intel Core i7-1165G7, 13.30", 1.4 kg
External Review » Dell Latitude 13 7320 2-in-1, i7-1165G7
Dell Latitude 13 7320 Detachable, i7-1180G7: Intel Core i7-1180G7, 13.00", 0.8 kg
External Review » Dell Latitude 13 7320 Detachable, i5-1135G7
HP Pavilion 14-dv0058TU: Intel Core i7-1165G7, 14.00", 1.4 kg
External Review » HP Pavilion 14-dv0058TU
Asus ZenBook 13 UX325EA: Intel Core i7-1165G7, 13.30", 1.2 kg
External Review » Asus ZenBook 13 UX325EA
HP Elite Dragonfly Max: Intel Core i7-1185G7, 13.30", 1.2 kg
External Review » HP Elite Dragonfly Max
LG Gram 14Z90P-G.AA79G: Intel Core i7-1165G7, 14.00", 1 kg
External Review » LG Gram 14Z90P-G.AA79G
HP 14s-dq2013ns: Intel Core i7-1165G7, 14.00", 1.5 kg
External Review » HP 14s-dq2013ns
HP 14s-dq2005ns: Intel Core i7-1165G7, 14.00", 1.5 kg
External Review » HP 14s-dq2005ns
HP Pavilion 13-bb0667ng: Intel Core i7-1165G7, 13.30", 1.2 kg
External Review » HP Pavilion 13-bb0667ng
MSI Summit B15 A11M-057: Intel Core i7-1165G7, 15.60", 1.6 kg
External Review » MSI Summit B15 A11M-057
Acer TravelMate P4 TMP414-51-74K7: Intel Core i7-1165G7, 14.00", 1.4 kg
External Review » Acer TravelMate P4 TMP414-51-74K7
Asus VivoBook S14 S435EA-HM004T: Intel Core i7-1165G7, 14.00", 1.3 kg
External Review » Asus VivoBook S14 S435EA-HM004T
Honor Magicbook 14 i7-1165G7: Intel Core i7-1165G7, 14.00", 1.4 kg
External Review » Honor Magicbook 14 i7-1165G7
Lenovo ThinkPad X1 Carbon G9-20XXS00100: Intel Core i7-1165G7, 14.00", 1.2 kg
External Review » Lenovo ThinkPad X1 Carbon G9-20XXS00100
Microsoft Surface Laptop 4 13 i7: Intel Core i7-1185G7, 13.50", 1.3 kg
External Review » Microsoft Surface Laptop 4 13 i7
Lenovo ThinkPad X1 Titanium Yoga G1 20QA001RGE: Intel Core i7-1160G7, 13.50", 1.2 kg
External Review » Lenovo ThinkPad X1 Titanium Yoga G1 20QA001RGE
Lenovo Yoga Slim 7i Carbon 13 ITL: Intel Core i7-1165G7, 13.30", 1 kg
External Review » Lenovo Yoga Slim 7i Carbon 13 ITL
HP 15s-fq2011ns: Intel Core i7-1165G7, 15.60", 1.7 kg
External Review » HP 15s-fq2011ns
Asus ZenBook Flip 13 UX363EA-HP165T: Intel Core i7-1165G7, 13.30", 1.3 kg
External Review » Asus ZenBook Flip 13 UX363EA-HP165T
Asus VivoBook 15 K513EA-BQ684: Intel Core i7-1165G7, 15.60", 1.8 kg
External Review » Asus VivoBook 15 K513EA-BQ684
LG Gram 15Z95N-G.AA78B: Intel Core i7-1165G7, 15.60"
External Review » LG Gram 15Z95N-G.AA78B
LG Gram 17Z95N-G.AA78B: Intel Core i7-1165G7, 17.00", 1.4 kg
External Review » LG Gram 17Z95N-G.AA78B
Lenovo Yoga Slim 9 14ITL5-82D1002HGE: Intel Core i7-1165G7, 14.00", 1.2 kg
External Review » Lenovo Yoga Slim 9 14ITL5-82D1002HGE
Lenovo ThinkPad X12 20UVS03G00: Intel Core i7-1160G7, 12.30", 1.1 kg
External Review » Lenovo ThinkPad X12 20UVS03G00
LG Gram 16Z90P-K.AAB6U1: Intel Core i7-1165G7, 16.00", 1.2 kg
External Review » LG Gram 16Z90P-K.AAB6U1
HP Pavilion 13-bb0015cl: Intel Core i7-1165G7, 13.30", 1.2 kg
External Review » HP Pavilion 13-bb0015cl
Lenovo ThinkBook 14s Yoga ITL 20WE0023GE: Intel Core i7-1165G7, 14.00", 1.5 kg
External Review » Lenovo ThinkBook 14s Yoga ITL 20WE0023GE
Samsung Galaxy Book Flex2 NP930QCA-KA2DE: Intel Core i7-1165G7, 13.30", 1.3 kg
External Review » Samsung Galaxy Book Flex2 NP930QCA-KA2DE
Acer Swift 5 SF514-55T-70LG: Intel Core i7-1165G7, 14.00", 1.1 kg
External Review » Acer Swift 5 SF514-55T-70LG
Lenovo Yoga 7 14ITL5, i7-1165G7: Intel Core i7-1165G7, 14.00", 1.4 kg
External Review » Lenovo Yoga 7 14ITL5, i7-1165G7
LG Gram 17Z90P-K.AAB8U1: Intel Core i7-1165G7, 17.00", 1.4 kg
External Review » LG Gram 17Z90P-K.AAB8U1
Lenovo ThinkBook 15 G2 ITL, i7-1165G7: Intel Core i7-1165G7, 15.60", 1.7 kg
External Review » Lenovo ThinkBook 15 G2 ITL, i7-1165G7
HP Spectre x360 13-aw2002ng: Intel Core i7-1165G7, 13.30", 1.3 kg
External Review » HP Spectre x360 13-aw2002ng
HP EliteBook 840 Aero G8, i7-1185G7: Intel Core i7-1185G7, 14.00", 1.2 kg
External Review » HP EliteBook 840 Aero G8, i7-1185G
Lenovo ThinkBook Plus Gen2 Core i7: Intel Core i7-1160G7, 13.30", 1.2 kg
External Review » Lenovo ThinkBook Plus Gen2
Lenovo Yoga 9i 14ITL5-82BG004GGE: Intel Core i7-1185G7, 14.00", 1.4 kg
External Review » Lenovo Yoga 9i 14ITL5-82BG004GGE
HP Spectre x360 14-ea0004ns: Intel Core i7-1165G7, 13.50", 1.4 kg
External Review » HP Spectre x360 14-ea0004ns
Asus ZenBook 14 UX425EA-HM165T: Intel Core i7-1165G7, 14.00", 1.2 kg
External Review » Asus ZenBook 14 UX425EA-HM165T
Acer Swift 3 Air 3 SF313-53-79G3: Intel Core i7-1165G7, 13.50", 1.2 kg
External Review » Acer Swift 3 Air 3 SF313-53-79G3
Lenovo IdeaPad Slim 9i 14ITL5: Intel Core i7-1165G7, 14.00", 1.3 kg
External Review » Lenovo IdeaPad Slim 9i 14ITL5
Huawei MateBook X Pro 2021: Intel Core i7-1165G7, 13.90", 1.3 kg
External Review » Huawei MateBook X Pro 2021
Asus ZenBook 13 UX325EA-EG247: Intel Core i7-1165G7, 13.30", 1.1 kg
External Review » Asus ZenBook 13 UX325EA-EG247
HP Spectre x360 13-aw2006ng: Intel Core i7-1165G7, 13.30", 1.3 kg
External Review » HP Spectre x360 13-aw2006ng
HP Elite x2 G8: Intel Core i7-1165G7, 13.00"
External Review » HP Elite x2 G8
VAIO Z VJZ141C11L: Intel Core i7-11375H, 14.00", 1 kg
External Review » VAIO Z VJZ141C11L
HP Spectre x360 13t-aw200: Intel Core i7-1165G7, 13.30", 1.3 kg
External Review » HP Spectre x360 13t-aw200
Lenovo ThinkPad X1 Nano-20UN002WMX: Intel Core i7-1160G7, 13.00", 1 kg
External Review » Lenovo ThinkPad X1 Nano-20UN002WMX
Acer Swift 5 SF514-55T-71NL: Intel Core i7-1165G7, 14.00", 1.1 kg
External Review » Acer Swift 5 SF514-55T-71NL
Acer Swift 5 SF514-55TA-7494: Intel Core i7-1165G7, 14.00", 1.1 kg
External Review » Acer Swift 5 SF514-55TA-7494
MSI Prestige 14 Evo A11M-014IT: Intel Core i7-1185G7, 14.00", 1.3 kg
External Review » MSI Prestige 14 Evo A11M-014IT
HP Envy x360 15-ed1550nd: Intel Core i7-1165G7, 15.60", 1.9 kg
External Review » HP Envy x360 15-ed1550nd
Dell Inspiron 13 7306 2-in-1, i7-1165G7: Intel Core i7-1165G7, 13.30", 1.4 kg
External Review » Dell Inspiron 13 7306 2-in-1, i7-1165G7
Lenovo ThinkPad X12 Detachable, i5-1130G7: Intel Core i5-1130G7, 12.30", 0.8 kg
External Review » Lenovo ThinkPad X12 Detachable, i5-1130G7
Lenovo ThinkPad X1 Titanium Yoga G1-20QA0030GE: Intel Core i7-1160G7, 13.50", 1.2 kg
External Review » Lenovo ThinkPad X1 Titanium Yoga G1-20QA0030GE
Asus ZenBook Duo 14 UX482EA: Intel Core i7-1165G7, 14.00", 1.6 kg
External Review » Asus ZenBook Duo 14 UX482EA
MSI Modern 14 B11M-028: Intel Core i7-1165G7, 14.00", 1.3 kg
External Review » MSI Modern 14 B11M-028
Lenovo Yoga 9 14 ITL 4K: Intel Core i7-1185G7, 14.00", 1.5 kg
External Review » Lenovo Yoga 9 14 ITL 4K
Asus VivoBook S14 S433EQ-EB044T: Intel Core i7-1165G7, 14.00", 1.4 kg
External Review » Asus VivoBook S14 S433EQ-EB044T
HP Spectre x360 14t-ea000: Intel Core i7-1165G7, 13.50", 1.3 kg
External Review » HP Spectre x360 14t-ea000
Acer Swift 5 SF514-55TA-74EC: Intel Core i7-1165G7, 14.00", 1.1 kg
External Review » Acer Swift 5 SF514-55TA-74EC
Lenovo Yoga 7 15ITL5-82BJ0031GE: Intel Core i7-1165G7, 15.60", 1.9 kg
External Review » Lenovo Yoga 7 15ITL5-82BJ0031GE
Lenovo ThinkPad X1 Nano-20UN002UGE: Intel Core i7-1160G7, 13.00", 0.9 kg
External Review » Lenovo ThinkPad X1 Nano-20UN002UGE
Razer Blade Stealth 13 2021, i7-1165G7: Intel Core i7-1165G7, 13.30", 1.4 kg
External Review » Razer Blade Stealth 13 2021, i7-1165G7
Lenovo ThinkPad X1 Nano-20UN002DGE: Intel Core i5-1130G7, 13.00", 0.9 kg
External Review » Lenovo ThinkPad X1 Nano-20UN002DGE
HP Spectre x360 14-ea0030tu: Intel Core i7-1165G7, 13.50", 1.4 kg
External Review » HP Spectre x360 14-ea0030tu
Asus ZenBook Flip S UX371EA-HL135T: Intel Core i7-1165G7, 13.30", 1.2 kg
External Review » Asus ZenBook Flip S UX371EA-HL135T
Asus ZenBook S UX393EA-HK003T: Intel Core i7-1165G7, 13.90", 1.4 kg
External Review » Asus ZenBook S UX393EA-HK003T
Dell XPS 13 9310 cn93214sc: Intel Core i7-1165G7, 13.40", 1.3 kg
External Review » Dell XPS 13 9310 cn93214sc
Asus ZenBook 14 Ultralight UX435EGL: Intel Core i7-1165G7, 14.00", 1 kg
External Review » Asus ZenBook 14 Ultralight UX435EGL
MSI Prestige 14 Evo A11M-005: Intel Core i7-1185G7, 14.00", 1.2 kg
External Review » MSI Prestige 14 Evo A11M-005
Schenker Vision 15: Intel Core i7-1165G7, 15.60", 1.7 kg
External Review » Schenker Vision 15
Asus ZenBook Flip S UX371EA-HL003T: Intel Core i7-1165G7, 13.30", 1.3 kg
External Review » Asus ZenBook Flip S UX371EA-HL003T
Dell XPS 13 cn93214sc: Intel Core i7-1165G7, 13.40", 1.2 kg
External Review » Dell XPS 13 cn93214sc
Dell XPS 13 9310 2-in-1, i7-1165G7: Intel Core i7-1165G7, 13.40", 1.3 kg
External Review » Dell XPS 13 9310 2-in-1, i7-1165G7
Lenovo Yoga 9 14ITL5, i7-1185G7: Intel Core i7-1185G7, 14.00", 1.4 kg
External Review » Lenovo Yoga 9 14ITL5, i7-1185G7
Asus ZenBook 13 UX325EA-AH77: Intel Core i7-1165G7, 13.30", 1.1 kg
External Review » Asus ZenBook 13 UX325EA-AH77
Asus VivoBook S15 S533EA-BQ003T: Intel Core i7-1165G7, 15.60", 1.8 kg
External Review » Asus VivoBook S15 S533EA-BQ003T
Asus ZenBook 14 Ultralight UX435, i7: Intel Core i7-1165G7, 14.00", 1 kg
External Review » Asus ZenBook 14 Ultralight UX435, i7
Razer Book 13 FHD: Intel Core i7-1165G7, 13.40", 1.4 kg
External Review » Razer Book 13 FHD
Acer TravelMate Spin P4 TMP414RN-51-71V7: Intel Core i7-1165G7, 14.00", 1.5 kg
External Review » Acer TravelMate Spin P4 TMP414RN-51-71V7
Asus ZenBook Flip 13 UX363EA-EM045R: Intel Core i7-1165G7, 13.30", 1.3 kg
External Review » Asus ZenBook Flip 13 UX363EA-EM045R
Acer Swift 3X SF314-510G-761J: Intel Core i7-1165G7, 14.00", 1.4 kg
External Review » Acer Swift 3X SF314-510G-761J
HP Envy 13-ba1097nr: Intel Core i7-1165G7, 13.30", 1.3 kg
External Review » HP Envy 13-ba1097nr
Fujitsu LifeBook U9311: Intel Core i7-1165G7, 13.30", 0.9 kg
External Review » Fujitsu LifeBook U9311
Acer Swift 3 SF313-53-78UG: Intel Core i7-1165G7, 13.50", 1.2 kg
External Review » Acer Swift 3 SF313-53-78UG
Asus ZenBook 13 UX325EA, i7-1165G7: Intel Core i7-1165G7, 13.30", 1.1 kg
External Review » Asus ZenBook 13 UX325EA, i7-1165G7
Asus ExpertBook B9 B9400CEA-KC0167R: Intel Core i7-1165G7, 14.00", 1 kg
External Review » Asus ExpertBook B9400CEA-KC0167R
Dell XPS 13 9310, i7-1165G7 4K: Intel Core i7-1165G7, 13.40", 1.3 kg
External Review » Dell XPS 13 9310, i7-1165G7 4K
Acer Swift 5 SF514-55T-55WL: Intel Core i5-1135G7, 14.00", 1.1 kg
External Review » Acer Swift 5 SF514-55T-55WL
Dell XPS 13 9310 Core i7 FHD: Intel Core i7-1165G7, 13.40", 1.3 kg
External Review » Dell XPS 13 9310 Core i7 FHD
Asus ZenBook S UX393EA-HK001T: Intel Core i7-1165G7, 13.90", 1.4 kg
External Review » Asus ZenBook S UX393EA-HK001T
Asus Vivobook S14 S433EA-EB160T: Intel Core i7-1165G7, 14.00", 1.4 kg
External Review » Asus Vivobook S14 S433EA-EB160T
Asus ZenBook 14 UX425EA: Intel Core i7-1165G7, 14.00", 1.2 kg
External Review » Asus ZenBook 14 UX425EA
Asus ZenBook Flip S UX371: Intel Core i7-1165G7, 13.30", 1.2 kg
External Review » Asus ZenBook Flip S UX371
Acer Swift 5 (2021): Intel Core i7-1165G7, 14.00", 1 kg
External Review » Acer Swift 5 (2021)
Beelink SEi13 Pro: Intel Core i9-13900HK, 0.8 kg
» Beelink SEi13 采用与 GTi13 Ultra 完全相同的 CPU,但体积更小、结构更精简
Framework Laptop 13.5 13th Gen Intel: Intel Core i7-1370P, 13.50", 1.3 kg
» Framework 12 作为可维修的 "入门级 "二合一笔记本电脑发布,采用坚固耐用的设计
GPD Pocket 3: Intel Core i7-1195G7, 8.00", 0.7 kg
» GPD 公布 Pocket 4 售价:搭载 AMD 处理器的超便携笔记本电脑即将上市
GPD Win Max 2: Intel Core i7-1260P, 10.10", 1 kg
» GPD 公布 Pocket 4 售价:搭载 AMD 处理器的超便携笔记本电脑即将上市
Framework Laptop 13.5, i7-1360P: Intel Core i7-1360P, 13.50", 1.3 kg
» Framework 笔记本电脑砖系统可利用乐高脚垫、轮子、电缆支架等扩展笔记本电脑
Khadas Mind: Intel Core i7-1360P, 0.4 kg
» 外观时尚的 Khadas Mind 2 发布,最高配备 Core Ultra 7 155H CPU、64 GB 内存和出色的可扩展性,且价格优惠
Minisforum MS-01: Intel Core i9-13900H, 1.5 kg
» Minisforum MS-A1 是一款搭载 AMD 处理器的高端微型 PC,内存容量高达 96GB,支持 OCuLink
Lenovo Yoga Book 9i 2-in-1 Dual Screen: Intel Core i7-1355U, 13.30", 1.6 kg
» 联想 Yoga Book 9i:创新双显示屏笔记本电脑的第九代新机型泄露
Lenovo Yoga 9 14IRP G8: Intel Core i7-1360P, 14.00", 1.4 kg
» 联想的高端可折叠Yoga 9 14将从AMD处理器中获得巨大的利益
Dell Latitude 9330: Intel Core i7-1260U, 13.30", 1.2 kg
» 酷睿i7-1260U基本上是支持vPro的酷睿i5-1235U,它们之间的性能水平相似
Lenovo ThinkBook Plus Gen3: Intel Core i7-12700H, 17.30", 2 kg
» 联想ThinkBook第三代有很多屏幕,但没有足够的图形能力
Huawei MateBook X Pro 2022: Intel Core i7-1260P, 14.20", 1.3 kg
» 华为MateBook X Pro是最好的英特尔Evo笔记本电脑之一,但由于缺乏维护选项,无法获得更好的评价
Acer Swift Go SFG16-71: Intel Core i7-13700H, 16.00", 1.6 kg
» 营销过头了:一台濒临过热的笔记本电脑
» Comparison of GPUs
Detailed list of all laptop GPUs sorted by class and performance.
» Benchmark List
Sort and restrict laptop GPUs based on performance in synthetic benchmarks.
» Notebook Gaming List
Playable games for each graphics card and their average FPS results.
* Approximate position of the graphics adapter
» Notebookcheck多媒体笔记本电脑Top 10排名
» Notebookcheck游戏笔记本电脑Top 10排名
» Notebookcheck低价办公/商务笔记本电脑Top 10排名
» Notebookcheck高端办公/商务笔记本电脑Top 10排名
» Notebookcheck工作站笔记本电脑Top 10排名
» Notebookcheck亚笔记本电脑Top 10排名
» Notebookcheck超级本产品Top 10排名
» Notebookcheck变形本产品Top 10排名
» Notebookcheck平板电脑Top 10排名
» Notebookcheck智能手机Top 10排名
» Notebookcheck评测过最出色的笔记本电脑屏幕
» Notebookcheck售价500欧元以下笔记本电脑Top 10排名
» Notebookcheck售价300欧元以下笔记本电脑Top 10排名