


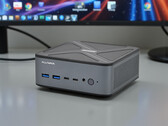
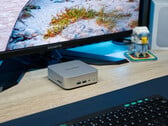
Alliwava GH8 评测--配备 Ryzen 9 8945HS 和 USB4 的强大高效迷你 PC
Alliwava GH8 旨在展示当今迷你 PC 的性能。凭借 AMD Ryzen 9 8945HS、高速 DDR5 内存和 PCIe 固态硬盘,这款小巧的系统配备了通常在大型计算机中才能见到的硬件。但性能是否足以满足日常使用,散热、噪音和效率的实际表现如何?我们将在这篇评测中揭开这些问题的谜底。
AMD Ryzen 9 8945HS, Radeon 780M, 516 g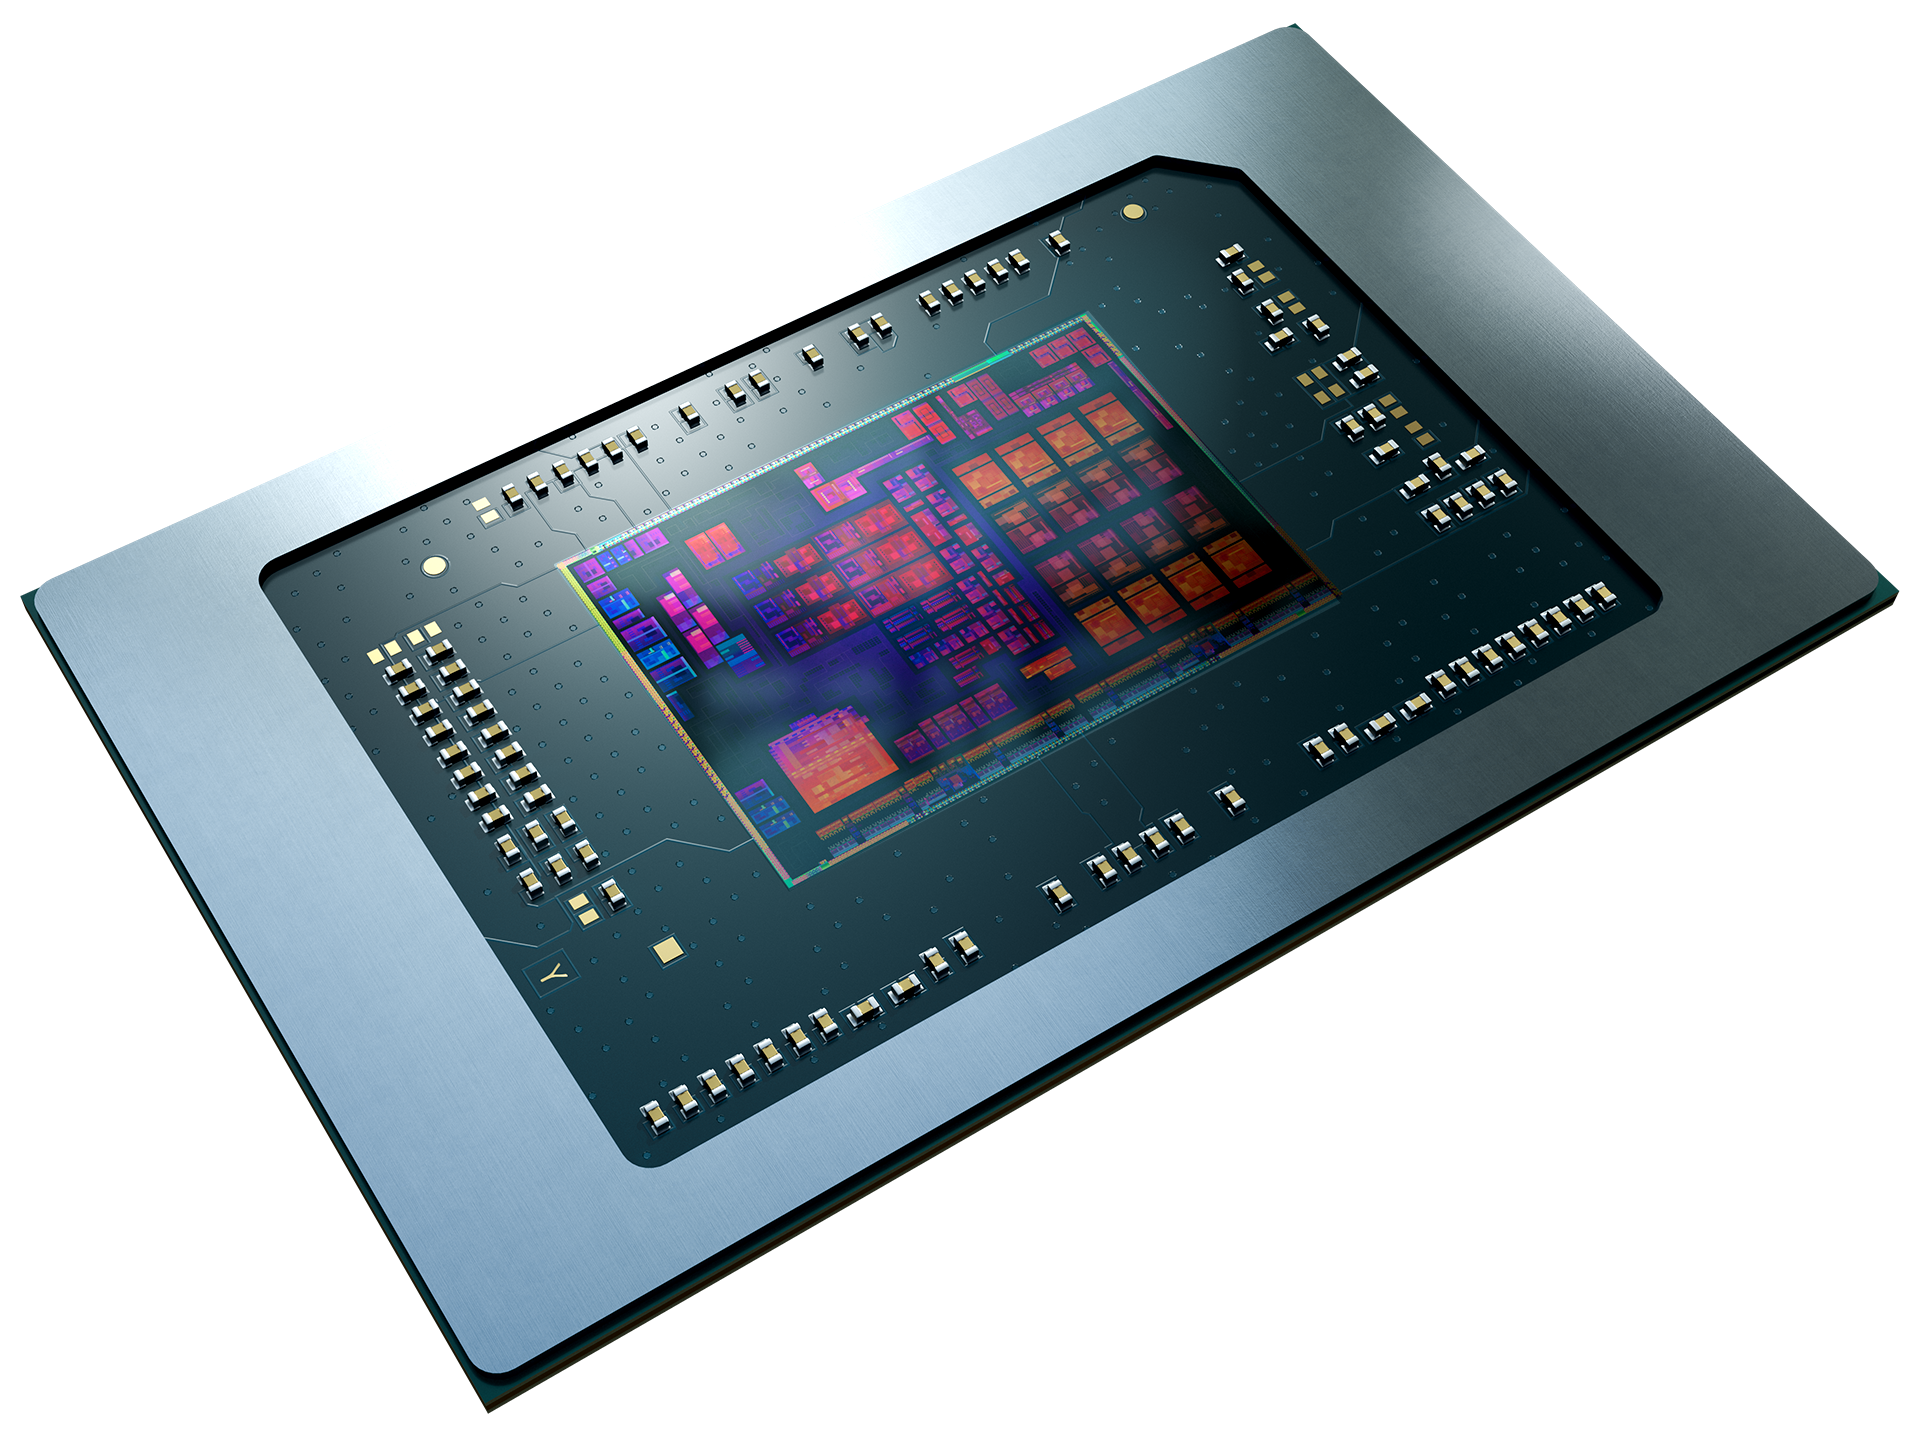
AMD Radeon 780M 是适用于笔记本电脑的 Ryzen 7040 系列中的集成 GPU(Phoenix,例如 Ryzen 9 7940HS)。 iGPU 基于新的 RDNA3 架构,具有 12 个 CU(= 768 个着色器),主频高达 3 GHz(取决于 CPU 型号)。与前身 Radeon 680M 一样,780M 支持硬件光线追踪,但性能太慢,无法在当前游戏中使用。
得益于新的架构和更高的时钟速度,Radeon 780M 应该明显比旧的 Radeon 680M 更快。这意味着要求最高的游戏应该可以在最低图形设置下运行(例如《赛博朋克 2077》),而要求较低的游戏(例如《FIFA 23》)可以在更高的设置和分辨率 (1080p) 下运行。 2023 年初,Radeon 780M 成为市场上最快的 iGPU。
得益于现代 4 纳米工艺和巧妙的节能功能,功耗相对较低(根据 AMD 的说法)。前两种型号的整个芯片可配置在 15 - 54 瓦 TDP 之间。
AMD Radeon 700M Series
| ||||||||||
| Codename | Phoenix | |||||||||
| Architecture | RDNA 3 | |||||||||
| iGPU | Integrated Graphics | |||||||||
| Pipelines | 768 - unified | |||||||||
| TMUs | 48 | |||||||||
| ROPs | 32 | |||||||||
| Raytracing Cores | 12 | |||||||||
| Core Speed | 1500 - 3000 (Boost) MHz | |||||||||
| Shared Memory | yes | |||||||||
| API | DirectX 12_2, OpenGL 4.6, OpenCL 2.1, Vulkan 1.3 | |||||||||
| Power Consumption | 54 Watt (35 - 54 Watt TGP) | |||||||||
| Man. Technology | 4 nm | |||||||||
| Displays | 4 Displays (max.), HDMI 2.1, DisplayPort 2.1 | |||||||||
| Features | Miracast, FreeSync, Adaptive-Sync, UHBR10, HDR Metadata, SmartShift MAX, SmartAccess Memory, 8k60 AV1, 8k43 H.265, 4k175 H.264 De- and Encode | |||||||||
| Date of Announcement | 05.01.2023 | |||||||||
| Link to Manufacturer Page | www.amd.com | |||||||||
| Predecessor | Radeon 680M | |||||||||
| ||||||||||||||||||||||||||||||||||||||||||||||||||||||||||||||||||||||||||||||||||||||||||||||||||||||||||||||||||||||||||||||||||||
| Model | CPU | GPU | RAM | Value |
|---|---|---|---|---|
| Lenovo IdeaPad Slim 3 14 AHP G10 | R7 8840HS | Radeon 780M 2700 / 3733 MHz | 16 GB | 2447 |
| Minisforum MS-A1 DX12 | R7 8700G 65 W / 65 W | Radeon 780M | 32 GB | 2677 |
| Ninkear A16 Pro | R7 8845HS 65 W / 45 W | Radeon 780M | 32 GB | 2714 |
| ONEXPLAYER 2 Pro AR18 DX12 | R7 7840U 30 W / 30 W | Radeon 780M | 32 GB | 2728 |
| Geekom AX8 Pro DX12 | R9 8945HS 60 W / 45 W | Radeon 780M | 32 GB | 2756 |
| Zotac ZGC-G1A1W-01 DX12 | R7 8840U 30 W / 28 W | Radeon 780M 4 GB | 16 GB | 2764 |
| Zotac ZGC-G1A1W-01 Vulkan | R7 8840U 30 W / 28 W | Radeon 780M 4 GB | 16 GB | 2786 |
| Schenker VIA 14 Pro (M24) | R7 8845HS 54 W / 54 W | Radeon 780M 2700 / 1067 MHz | 32 GB | 2788 |
| Aoostar GEM12 | R7 8845HS 65 W / 54 W | Radeon 780M 2700 MHz | 32 GB | 2806 |
| Schenker XMG Evo 14 (M24) | R7 8845HS 45 W / 45 W | Radeon 780M 2800 MHz | 32 GB | 2816 |
| Geekom AE7 DX12 | R9 7940HS 65 W / 45 W | Radeon 780M | 32 GB | 2869 |
| Asus ROG Ally X | Z1 Extreme 53 W / 30 W | Radeon 780M 2700 / 937 MHz | 24 GB | 2972 |
| Model | CPU | GPU | RAM | Value |
|---|---|---|---|---|
| Lenovo ThinkPad X13 Gen 4 21J3001VGE | R7 PRO 7840U 30 W / 20 W | Radeon 780M | 32 GB | 4696 |
| Geekom A7 Max, R9 7940HS | R9 7940HS 65 W / 54 W | Radeon 780M | 16 GB | 10354 |
| Alliwava H90 Pro | R7 8745HS 54 W / 35 W | Radeon 780M | 32 GB | 14565 |
| Alliwava GH8, R9 8945HS | R9 8945HS 45 W / 40 W | Radeon 780M 2330 MHz | 32 GB | 16556 |
| Geekom A8, R7 8745HS | R7 8745HS 60 W / 35 W | Radeon 780M 2800 MHz | 32 GB | 19101 |
| Minisforum AI X1, Ryzen 7 255 | Ryzen 7 255 65 W / 54 W | Radeon 780M | 32 GB | 19818 |
| Model | CPU | GPU | RAM | Value | |
|---|---|---|---|---|---|
| 3DMark 06 - Standard 1366x768 | |||||
| Minisforum AI X1, Ryzen 7 255 (3DMark 06 - Standard 1366x768) | Ryzen 7 255 65 W / 54 W | Radeon 780M | 32 GB | 45874 | |
| Geekom A8, R9 8945HS (3DMark 06 - Standard 1366x768) | R9 8945HS | Radeon 780M 2800 MHz | 32 GB | 45913 | |
| Model | CPU | GPU | RAM | Value | |
|---|---|---|---|---|---|
| 3DMark 06 - Standard 1280x1024 | |||||
| Geekom A7 Max, R9 7940HS (3DMark 06 - Standard 1280x1024) | R9 7940HS 65 W / 54 W | Radeon 780M | 16 GB | 29523 | |
| Chuwi Aubox, R7 8745HS (3DMark 06 - Standard 1280x1024) | R7 8745HS 70 W / 60 W | Radeon 780M | 16 GB | 30331 | |
| Asus VivoBook 18 M1807HA (3DMark 06 - Standard 1280x1024) | R7 260 60 W / 54 W | Radeon 780M 0.5 GB | 16 GB | 30503 | |
| Ninkear M8, 32+1TB (3DMark 06 - Standard 1280x1024) | R7 8745HS 50 W / 35 W | Radeon 780M | 32 GB | 35485 | |
| Minisforum Mercury Series EM780 (3DMark 06 - Standard 1280x1024) | R7 7840U | Radeon 780M | 32 GB | 37928 | |
| Alliwava H90 Pro (3DMark 06 - Standard 1280x1024) | R7 8745HS 54 W / 35 W | Radeon 780M | 32 GB | 38036 | |
| Minisforum V3 (3DMark 06 - Standard 1280x1024) | R7 8840U 28 W / 28 W | Radeon 780M | 32 GB | 39262 | |
| Lenovo Yoga Slim 7 14APU G8 (3DMark 06 - Standard 1280x1024) | R7 7840S 52 W / 42 W | Radeon 780M ? / 800 MHz | 32 GB | 41384 | |
| Alliwava GH8, R9 8945HS (3DMark 06 - Standard 1280x1024) | R9 8945HS 45 W / 40 W | Radeon 780M 2330 MHz | 32 GB | 41414 | |
| Peladn HA-4, R7 7840HS (3DMark 06 - Standard 1280x1024) | R7 7840HS 45 W / 45 W | Radeon 780M ? / 2800 MHz | 42008 | ||
| Asus ROG Zephyrus G14 GA402XY (3DMark 06 - Standard 1280x1024) | R9 7940HS | Radeon 780M | 32 GB | 42218 | |
| Minisforum Venus Series UM790 Pro (3DMark 06 - Standard 1280x1024) | R9 7940HS 65 W / 0 W | Radeon 780M | 16 GB | 42265 | |
| Geekom A7 (3DMark 06 - Standard 1280x1024) | R9 7940HS 60 W / 35 W | Radeon 780M 2800 MHz | 32 GB | 42323 | |
| BOSGAME M4 Neo (3DMark 06 - Standard 1280x1024) | R7 7840HS 65 W / 54 W | Radeon 780M ? / 2800 MHz | 32 GB | 42328 | |
| Geekom AX8 Pro (3DMark 06 - Standard 1280x1024) | R9 8945HS 60 W / 45 W | Radeon 780M | 32 GB | 43083 | |
| Acemagic AM18 (3DMark 06 - Standard 1280x1024) | R7 7840HS 54 W / 45 W | Radeon 780M | 32 GB | 44009 | |
| Geekom A8, R7 8745HS (3DMark 06 - Standard 1280x1024) | R7 8745HS 60 W / 35 W | Radeon 780M 2800 MHz | 32 GB | 44071 | |
| Minisforum MS-A1 (3DMark 06 - Standard 1280x1024) | R7 8700G 65 W / 65 W | Radeon 780M | 32 GB | 44432 | |
| Geekom AE7 (3DMark 06 - Standard 1280x1024) | R9 7940HS 65 W / 45 W | Radeon 780M | 32 GB | 44889 | |
| Geekom A8 Max, R7 8845HS (3DMark 06 - Standard 1280x1024) | R7 8845HS 65 W / 45 W | Radeon 780M | 32 GB | 45064 | |
| Minisforum EliteMini UM890 Pro (3DMark 06 - Standard 1280x1024) | R9 8945HS 65 W / 54 W | Radeon 780M | 32 GB | 45393 | |
| Aoostar GEM12 (3DMark 06 - Standard 1280x1024) | R7 8845HS 65 W / 54 W | Radeon 780M 2700 MHz | 32 GB | 45449 | |
| Minisforum EliteMini UM780 XTX (3DMark 06 - Standard 1280x1024) | R7 7840HS 65 W / 54 W | Radeon 780M | 32 GB | 45612 | |
| Model | CPU | GPU | RAM | Value |
|---|---|---|---|---|
| Lenovo ThinkPad P14s G4 21K5000LGE | R7 PRO 7840U 40 W / 32 W | Radeon 780M ? / 800 MHz | 16 GB | 93 |
| Ninkear M8, 32+1TB | R7 8745HS 50 W / 35 W | Radeon 780M | 32 GB | 96.2 |
| Minisforum Mercury Series EM780 | R7 7840U | Radeon 780M | 32 GB | 96.5 |
| Minisforum Venus Series UM790 Pro | R9 7940HS 65 W / 0 W | Radeon 780M | 16 GB | 103 |
| Geekom A8, R9 8945HS | R9 8945HS | Radeon 780M 2800 MHz | 32 GB | 106 |
| Minisforum V3 | R7 8840U 28 W / 28 W | Radeon 780M | 32 GB | 107 |
| Minisforum EliteMini UM780 XTX | R7 7840HS 65 W / 54 W | Radeon 780M | 32 GB | 113 |
| Peladn HA-4, R7 7840HS | R7 7840HS 45 W / 45 W | Radeon 780M ? / 2800 MHz | 113 | |
| Aoostar GEM12 | R7 8845HS 65 W / 54 W | Radeon 780M 2700 MHz | 32 GB | 114 |
| Geekom A7 | R9 7940HS 60 W / 35 W | Radeon 780M 2800 MHz | 32 GB | 116 |
| Acemagic AM18 | R7 7840HS 54 W / 45 W | Radeon 780M | 32 GB | 116 |
| Geekom AE7 | R9 7940HS 65 W / 45 W | Radeon 780M | 32 GB | 117 |
| Minisforum EliteMini UM890 Pro | R9 8945HS 65 W / 54 W | Radeon 780M | 32 GB | 128 |
| Model | CPU | GPU | RAM | Value |
|---|---|---|---|---|
| Ninkear M8, 32+1TB | R7 8745HS 50 W / 35 W | Radeon 780M | 32 GB | 55.6 |
| Aoostar GEM12 | R7 8845HS 65 W / 54 W | Radeon 780M 2700 MHz | 32 GB | 58.9 |
| Minisforum Mercury Series EM780 | R7 7840U | Radeon 780M | 32 GB | 64 |
| Peladn HA-4, R7 7840HS | R7 7840HS 45 W / 45 W | Radeon 780M ? / 2800 MHz | 68.2 | |
| Minisforum Venus Series UM790 Pro | R9 7940HS 65 W / 0 W | Radeon 780M | 16 GB | 68.3 |
| Minisforum V3 | R7 8840U 28 W / 28 W | Radeon 780M | 32 GB | 72.7 |
| Lenovo ThinkPad P14s G4 21K5000LGE | R7 PRO 7840U 40 W / 32 W | Radeon 780M ? / 800 MHz | 16 GB | 74.09 |
| Acemagic AM18 | R7 7840HS 54 W / 45 W | Radeon 780M | 32 GB | 74.9 |
| Geekom A7 | R9 7940HS 60 W / 35 W | Radeon 780M 2800 MHz | 32 GB | 75.8 |
| Minisforum EliteMini UM780 XTX | R7 7840HS 65 W / 54 W | Radeon 780M | 32 GB | 76.9 |
| Geekom AE7 | R9 7940HS 65 W / 45 W | Radeon 780M | 32 GB | 77.5 |
| Geekom A8, R9 8945HS | R9 8945HS | Radeon 780M 2800 MHz | 32 GB | 77.6 |
| Minisforum EliteMini UM890 Pro | R9 8945HS 65 W / 54 W | Radeon 780M | 32 GB | 83.3 |
| Model | CPU | GPU | RAM | Value |
|---|---|---|---|---|
| Ninkear M8, 32+1TB | R7 8745HS 50 W / 35 W | Radeon 780M | 32 GB | 22 |
| Peladn HA-4, R7 7840HS | R7 7840HS 45 W / 45 W | Radeon 780M ? / 2800 MHz | 24.7 | |
| Geekom AE7 | R9 7940HS 65 W / 45 W | Radeon 780M | 32 GB | 25.2 |
| Geekom A8, R9 8945HS | R9 8945HS | Radeon 780M 2800 MHz | 32 GB | 25.8 |
| Minisforum EliteMini UM890 Pro | R9 8945HS 65 W / 54 W | Radeon 780M | 32 GB | 26.1 |
| Minisforum Venus Series UM790 Pro | R9 7940HS 65 W / 0 W | Radeon 780M | 16 GB | 28.1 |
| Minisforum Mercury Series EM780 | R7 7840U | Radeon 780M | 32 GB | 29.1 |
| Acemagic AM18 | R7 7840HS 54 W / 45 W | Radeon 780M | 32 GB | 30 |
| Minisforum EliteMini UM780 XTX | R7 7840HS 65 W / 54 W | Radeon 780M | 32 GB | 30.1 |
| Geekom A7 | R9 7940HS 60 W / 35 W | Radeon 780M 2800 MHz | 32 GB | 30.3 |
| Aoostar GEM12 | R7 8845HS 65 W / 54 W | Radeon 780M 2700 MHz | 32 GB | 30.3 |
| Lenovo ThinkPad P14s G4 21K5000LGE | R7 PRO 7840U 40 W / 32 W | Radeon 780M ? / 800 MHz | 16 GB | 30.47 |
| Minisforum V3 | R7 8840U 28 W / 28 W | Radeon 780M | 32 GB | 32 |
| Model | CPU | GPU | RAM | Value |
|---|---|---|---|---|
| Lenovo ThinkPad P14s G4 21K5000LGE | R7 PRO 7840U 40 W / 32 W | Radeon 780M ? / 800 MHz | 16 GB | 29.45 |
| Ninkear M8, 32+1TB | R7 8745HS 50 W / 35 W | Radeon 780M | 32 GB | 35.8 |
| Minisforum Mercury Series EM780 | R7 7840U | Radeon 780M | 32 GB | 46 |
| Geekom A8, R9 8945HS | R9 8945HS | Radeon 780M 2800 MHz | 32 GB | 47.7 |
| Minisforum V3 | R7 8840U 28 W / 28 W | Radeon 780M | 32 GB | 49 |
| Aoostar GEM12 | R7 8845HS 65 W / 54 W | Radeon 780M 2700 MHz | 32 GB | 51.4 |
| Peladn HA-4, R7 7840HS | R7 7840HS 45 W / 45 W | Radeon 780M ? / 2800 MHz | 54 | |
| Minisforum EliteMini UM890 Pro | R9 8945HS 65 W / 54 W | Radeon 780M | 32 GB | 56.9 |
| Geekom A7 | R9 7940HS 60 W / 35 W | Radeon 780M 2800 MHz | 32 GB | 60.5 |
| Acemagic AM18 | R7 7840HS 54 W / 45 W | Radeon 780M | 32 GB | 60.5 |
| Geekom AE7 | R9 7940HS 65 W / 45 W | Radeon 780M | 32 GB | 60.5 |
| Minisforum EliteMini UM780 XTX | R7 7840HS 65 W / 54 W | Radeon 780M | 32 GB | 61.7 |
| Minisforum Venus Series UM790 Pro | R9 7940HS 65 W / 0 W | Radeon 780M | 16 GB | 65 |
| Model | CPU | GPU | RAM | Value |
|---|---|---|---|---|
| Ninkear M8, 32+1TB | R7 8745HS 50 W / 35 W | Radeon 780M | 32 GB | 58.1 |
| Minisforum Venus Series UM790 Pro | R9 7940HS 65 W / 0 W | Radeon 780M | 16 GB | 60.8 |
| Lenovo ThinkPad P14s G4 21K5000LGE | R7 PRO 7840U 40 W / 32 W | Radeon 780M ? / 800 MHz | 16 GB | 62.92 |
| Minisforum Mercury Series EM780 | R7 7840U | Radeon 780M | 32 GB | 63.8 |
| Peladn HA-4, R7 7840HS | R7 7840HS 45 W / 45 W | Radeon 780M ? / 2800 MHz | 65.1 | |
| Minisforum V3 | R7 8840U 28 W / 28 W | Radeon 780M | 32 GB | 66.8 |
| Aoostar GEM12 | R7 8845HS 65 W / 54 W | Radeon 780M 2700 MHz | 32 GB | 67.3 |
| Geekom A7 | R9 7940HS 60 W / 35 W | Radeon 780M 2800 MHz | 32 GB | 69.7 |
| Geekom AE7 | R9 7940HS 65 W / 45 W | Radeon 780M | 32 GB | 71.3 |
| Acemagic AM18 | R7 7840HS 54 W / 45 W | Radeon 780M | 32 GB | 71.5 |
| Minisforum EliteMini UM780 XTX | R7 7840HS 65 W / 54 W | Radeon 780M | 32 GB | 73.4 |
| Geekom A8, R9 8945HS | R9 8945HS | Radeon 780M 2800 MHz | 32 GB | 75 |
| Minisforum EliteMini UM890 Pro | R9 8945HS 65 W / 54 W | Radeon 780M | 32 GB | 78.3 |
| Model | CPU | GPU | RAM | Value |
|---|---|---|---|---|
| Ninkear M8, 32+1TB | R7 8745HS 50 W / 35 W | Radeon 780M | 32 GB | 14.9 |
| Minisforum Mercury Series EM780 | R7 7840U | Radeon 780M | 32 GB | 18.1 |
| Peladn HA-4, R7 7840HS | R7 7840HS 45 W / 45 W | Radeon 780M ? / 2800 MHz | 18.1 | |
| Minisforum V3 | R7 8840U 28 W / 28 W | Radeon 780M | 32 GB | 18.2 |
| Aoostar GEM12 | R7 8845HS 65 W / 54 W | Radeon 780M 2700 MHz | 32 GB | 18.4 |
| Geekom A8, R9 8945HS | R9 8945HS | Radeon 780M 2800 MHz | 32 GB | 19 |
| Minisforum EliteMini UM890 Pro | R9 8945HS 65 W / 54 W | Radeon 780M | 32 GB | 19.2 |
| Minisforum EliteMini UM780 XTX | R7 7840HS 65 W / 54 W | Radeon 780M | 32 GB | 20.1 |
| Geekom A7 | R9 7940HS 60 W / 35 W | Radeon 780M 2800 MHz | 32 GB | 20.7 |
| Geekom AE7 | R9 7940HS 65 W / 45 W | Radeon 780M | 32 GB | 20.9 |
| Acemagic AM18 | R7 7840HS 54 W / 45 W | Radeon 780M | 32 GB | 21.3 |
| Minisforum Venus Series UM790 Pro | R9 7940HS 65 W / 0 W | Radeon 780M | 16 GB | 40.9 |
| Model | CPU | GPU | RAM | Value |
|---|---|---|---|---|
| Ninkear M8, 32+1TB | R7 8745HS 50 W / 35 W | Radeon 780M | 32 GB | 39.8 |
| Minisforum Mercury Series EM780 | R7 7840U | Radeon 780M | 32 GB | 44.3 |
| Minisforum Venus Series UM790 Pro | R9 7940HS 65 W / 0 W | Radeon 780M | 16 GB | 48.2 |
| Minisforum V3 | R7 8840U 28 W / 28 W | Radeon 780M | 32 GB | 51 |
| Minisforum EliteMini UM780 XTX | R7 7840HS 65 W / 54 W | Radeon 780M | 32 GB | 51.1 |
| Aoostar GEM12 | R7 8845HS 65 W / 54 W | Radeon 780M 2700 MHz | 32 GB | 53.3 |
| Geekom A8, R9 8945HS | R9 8945HS | Radeon 780M 2800 MHz | 32 GB | 55.1 |
| Geekom A7 | R9 7940HS 60 W / 35 W | Radeon 780M 2800 MHz | 32 GB | 55.4 |
| Peladn HA-4, R7 7840HS | R7 7840HS 45 W / 45 W | Radeon 780M ? / 2800 MHz | 55.6 | |
| Acemagic AM18 | R7 7840HS 54 W / 45 W | Radeon 780M | 32 GB | 56.3 |
| Geekom AE7 | R9 7940HS 65 W / 45 W | Radeon 780M | 32 GB | 56.6 |
| Minisforum EliteMini UM890 Pro | R9 8945HS 65 W / 54 W | Radeon 780M | 32 GB | 58 |
| Model | CPU | GPU | RAM | Value |
|---|---|---|---|---|
| Ninkear M8, 32+1TB | R7 8745HS 50 W / 35 W | Radeon 780M | 32 GB | 65 |
| Minisforum Venus Series UM790 Pro | R9 7940HS 65 W / 0 W | Radeon 780M | 16 GB | 65.5 |
| Minisforum Mercury Series EM780 | R7 7840U | Radeon 780M | 32 GB | 69.2 |
| Lenovo ThinkPad P14s G4 21K5000LGE | R7 PRO 7840U 40 W / 32 W | Radeon 780M ? / 800 MHz | 16 GB | 73.76 |
| Minisforum V3 | R7 8840U 28 W / 28 W | Radeon 780M | 32 GB | 78.2 |
| Geekom A8, R9 8945HS | R9 8945HS | Radeon 780M 2800 MHz | 32 GB | 86.4 |
| Aoostar GEM12 | R7 8845HS 65 W / 54 W | Radeon 780M 2700 MHz | 32 GB | 86.6 |
| Peladn HA-4, R7 7840HS | R7 7840HS 45 W / 45 W | Radeon 780M ? / 2800 MHz | 87.3 | |
| Acemagic AM18 | R7 7840HS 54 W / 45 W | Radeon 780M | 32 GB | 88.5 |
| Geekom A7 | R9 7940HS 60 W / 35 W | Radeon 780M 2800 MHz | 32 GB | 89 |
| Minisforum EliteMini UM780 XTX | R7 7840HS 65 W / 54 W | Radeon 780M | 32 GB | 89.8 |
| Geekom AE7 | R9 7940HS 65 W / 45 W | Radeon 780M | 32 GB | 90.9 |
| Minisforum EliteMini UM890 Pro | R9 8945HS 65 W / 54 W | Radeon 780M | 32 GB | 99.5 |
| Model | CPU | GPU | RAM | Value |
|---|---|---|---|---|
| Ninkear M8, 32+1TB | R7 8745HS 50 W / 35 W | Radeon 780M | 32 GB | 67.5 |
| Minisforum Mercury Series EM780 | R7 7840U | Radeon 780M | 32 GB | 75.6 |
| Minisforum Venus Series UM790 Pro | R9 7940HS 65 W / 0 W | Radeon 780M | 16 GB | 77.3 |
| Lenovo ThinkPad P14s G4 21K5000LGE | R7 PRO 7840U 40 W / 32 W | Radeon 780M ? / 800 MHz | 16 GB | 77.92 |
| Peladn HA-4, R7 7840HS | R7 7840HS 45 W / 45 W | Radeon 780M ? / 2800 MHz | 78.7 | |
| Minisforum V3 | R7 8840U 28 W / 28 W | Radeon 780M | 32 GB | 82.1 |
| Acemagic AM18 | R7 7840HS 54 W / 45 W | Radeon 780M | 32 GB | 83.7 |
| Geekom A7 | R9 7940HS 60 W / 35 W | Radeon 780M 2800 MHz | 32 GB | 84.7 |
| Minisforum EliteMini UM780 XTX | R7 7840HS 65 W / 54 W | Radeon 780M | 32 GB | 85 |
| Geekom AE7 | R9 7940HS 65 W / 45 W | Radeon 780M | 32 GB | 85.3 |
| Aoostar GEM12 | R7 8845HS 65 W / 54 W | Radeon 780M 2700 MHz | 32 GB | 85.7 |
| Geekom A8, R9 8945HS | R9 8945HS | Radeon 780M 2800 MHz | 32 GB | 87.4 |
| Minisforum EliteMini UM890 Pro | R9 8945HS 65 W / 54 W | Radeon 780M | 32 GB | 88.5 |
| Model | CPU | GPU | RAM | Value |
|---|---|---|---|---|
| Ninkear M8, 32+1TB | R7 8745HS 50 W / 35 W | Radeon 780M | 32 GB | 76.5 |
| Minisforum Mercury Series EM780 | R7 7840U | Radeon 780M | 32 GB | 89.7 |
| Lenovo ThinkPad P16s G2 21K9000CGE | R7 PRO 7840U 51 W / 41 W | Radeon 780M 800 MHz | 32 GB | 91.8 |
| Asus ROG Zephyrus G14 GA402XY | R9 7940HS | Radeon 780M | 32 GB | 91.92 |
| Geekom A8, R9 8945HS | R9 8945HS | Radeon 780M 2800 MHz | 32 GB | 97.3 |
| Minisforum Venus Series UM790 Pro | R9 7940HS 65 W / 0 W | Radeon 780M | 16 GB | 98.4 |
| Geekom AE7 | R9 7940HS 65 W / 45 W | Radeon 780M | 32 GB | 98.9 |
| Minisforum V3 | R7 8840U 28 W / 28 W | Radeon 780M | 32 GB | 101 |
| Aoostar GEM12 | R7 8845HS 65 W / 54 W | Radeon 780M 2700 MHz | 32 GB | 104 |
| Minisforum EliteMini UM780 XTX | R7 7840HS 65 W / 54 W | Radeon 780M | 32 GB | 107 |
| Acemagic AM18 | R7 7840HS 54 W / 45 W | Radeon 780M | 32 GB | 107 |
| Geekom A7 | R9 7940HS 60 W / 35 W | Radeon 780M 2800 MHz | 32 GB | 109 |
| Peladn HA-4, R7 7840HS | R7 7840HS 45 W / 45 W | Radeon 780M ? / 2800 MHz | 111 | |
| Minisforum EliteMini UM890 Pro | R9 8945HS 65 W / 54 W | Radeon 780M | 32 GB | 118 |
| Model | CPU | GPU | RAM | Value |
|---|---|---|---|---|
| Ninkear M8, 32+1TB | R7 8745HS 50 W / 35 W | Radeon 780M | 32 GB | 72.1 |
| Asus ROG Zephyrus G14 GA402XY | R9 7940HS | Radeon 780M | 32 GB | 99.64 |
| Minisforum Mercury Series EM780 | R7 7840U | Radeon 780M | 32 GB | 116 |
| Minisforum Venus Series UM790 Pro | R9 7940HS 65 W / 0 W | Radeon 780M | 16 GB | 118 |
| Aoostar GEM12 | R7 8845HS 65 W / 54 W | Radeon 780M 2700 MHz | 32 GB | 119 |
| Peladn HA-4, R7 7840HS | R7 7840HS 45 W / 45 W | Radeon 780M ? / 2800 MHz | 125 | |
| Minisforum V3 | R7 8840U 28 W / 28 W | Radeon 780M | 32 GB | 131 |
| Acemagic AM18 | R7 7840HS 54 W / 45 W | Radeon 780M | 32 GB | 134 |
| Geekom AE7 | R9 7940HS 65 W / 45 W | Radeon 780M | 32 GB | 134 |
| Geekom A8, R9 8945HS | R9 8945HS | Radeon 780M 2800 MHz | 32 GB | 135 |
| Lenovo ThinkPad P16s G2 21K9000CGE | R7 PRO 7840U 51 W / 41 W | Radeon 780M 800 MHz | 32 GB | 136.1 |
| Geekom A7 | R9 7940HS 60 W / 35 W | Radeon 780M 2800 MHz | 32 GB | 137 |
| Minisforum EliteMini UM780 XTX | R7 7840HS 65 W / 54 W | Radeon 780M | 32 GB | 140 |
| Minisforum EliteMini UM890 Pro | R9 8945HS 65 W / 54 W | Radeon 780M | 32 GB | 150 |
| Model | CPU | GPU | RAM | Value |
|---|---|---|---|---|
| Ninkear M8, 32+1TB | R7 8745HS 50 W / 35 W | Radeon 780M | 32 GB | 17 |
| Peladn HA-4, R7 7840HS | R7 7840HS 45 W / 45 W | Radeon 780M ? / 2800 MHz | 23.6 | |
| Geekom A8, R9 8945HS | R9 8945HS | Radeon 780M 2800 MHz | 32 GB | 24.2 |
| Geekom A7 | R9 7940HS 60 W / 35 W | Radeon 780M 2800 MHz | 32 GB | 25.4 |
| Geekom AE7 | R9 7940HS 65 W / 45 W | Radeon 780M | 32 GB | 25.4 |
| Asus ROG Zephyrus G14 GA402XY | R9 7940HS | Radeon 780M | 32 GB | 25.91 |
| Minisforum EliteMini UM890 Pro | R9 8945HS 65 W / 54 W | Radeon 780M | 32 GB | 26 |
| Minisforum Venus Series UM790 Pro | R9 7940HS 65 W / 0 W | Radeon 780M | 16 GB | 28.1 |
| Lenovo ThinkPad P16s G2 21K9000CGE | R7 PRO 7840U 51 W / 41 W | Radeon 780M 800 MHz | 32 GB | 28.6 |
| Minisforum Mercury Series EM780 | R7 7840U | Radeon 780M | 32 GB | 29 |
| Acemagic AM18 | R7 7840HS 54 W / 45 W | Radeon 780M | 32 GB | 29.9 |
| Aoostar GEM12 | R7 8845HS 65 W / 54 W | Radeon 780M 2700 MHz | 32 GB | 29.9 |
| Minisforum EliteMini UM780 XTX | R7 7840HS 65 W / 54 W | Radeon 780M | 32 GB | 30 |
| Minisforum V3 | R7 8840U 28 W / 28 W | Radeon 780M | 32 GB | 31.8 |
| Model | CPU | GPU | RAM | Value |
|---|---|---|---|---|
| Ninkear M8, 32+1TB | R7 8745HS 50 W / 35 W | Radeon 780M | 32 GB | 50.1 |
| Minisforum Venus Series UM790 Pro | R9 7940HS 65 W / 0 W | Radeon 780M | 16 GB | 53.2 |
| Minisforum Mercury Series EM780 | R7 7840U | Radeon 780M | 32 GB | 56.3 |
| Minisforum V3 | R7 8840U 28 W / 28 W | Radeon 780M | 32 GB | 59.8 |
| Asus ROG Zephyrus G14 GA402XY | R9 7940HS | Radeon 780M | 32 GB | 62.75 |
| Lenovo ThinkPad P16s G2 21K9000CGE | R7 PRO 7840U 51 W / 41 W | Radeon 780M 800 MHz | 32 GB | 66.1 |
| Geekom A8, R9 8945HS | R9 8945HS | Radeon 780M 2800 MHz | 32 GB | 69.2 |
| Aoostar GEM12 | R7 8845HS 65 W / 54 W | Radeon 780M 2700 MHz | 32 GB | 70.5 |
| Minisforum EliteMini UM890 Pro | R9 8945HS 65 W / 54 W | Radeon 780M | 32 GB | 73.1 |
| Geekom A7 | R9 7940HS 60 W / 35 W | Radeon 780M 2800 MHz | 32 GB | 77.6 |
| Geekom AE7 | R9 7940HS 65 W / 45 W | Radeon 780M | 32 GB | 78.6 |
| Acemagic AM18 | R7 7840HS 54 W / 45 W | Radeon 780M | 32 GB | 79 |
| Minisforum EliteMini UM780 XTX | R7 7840HS 65 W / 54 W | Radeon 780M | 32 GB | 79.8 |
| Peladn HA-4, R7 7840HS | R7 7840HS 45 W / 45 W | Radeon 780M ? / 2800 MHz | 82.3 |
| Model | CPU | GPU | RAM | Value |
|---|---|---|---|---|
| Ninkear M8, 32+1TB | R7 8745HS 50 W / 35 W | Radeon 780M | 32 GB | 68.7 |
| Asus ROG Zephyrus G14 GA402XY | R9 7940HS | Radeon 780M | 32 GB | 83.66 |
| Minisforum Venus Series UM790 Pro | R9 7940HS 65 W / 0 W | Radeon 780M | 16 GB | 91.1 |
| Minisforum Mercury Series EM780 | R7 7840U | Radeon 780M | 32 GB | 94.6 |
| Peladn HA-4, R7 7840HS | R7 7840HS 45 W / 45 W | Radeon 780M ? / 2800 MHz | 99.6 | |
| Lenovo ThinkPad P16s G2 21K9000CGE | R7 PRO 7840U 51 W / 41 W | Radeon 780M 800 MHz | 32 GB | 103 |
| Geekom A8, R9 8945HS | R9 8945HS | Radeon 780M 2800 MHz | 32 GB | 103 |
| Minisforum V3 | R7 8840U 28 W / 28 W | Radeon 780M | 32 GB | 105 |
| Geekom A7 | R9 7940HS 60 W / 35 W | Radeon 780M 2800 MHz | 32 GB | 107 |
| Geekom AE7 | R9 7940HS 65 W / 45 W | Radeon 780M | 32 GB | 107 |
| Minisforum EliteMini UM780 XTX | R7 7840HS 65 W / 54 W | Radeon 780M | 32 GB | 108 |
| Acemagic AM18 | R7 7840HS 54 W / 45 W | Radeon 780M | 32 GB | 108 |
| Aoostar GEM12 | R7 8845HS 65 W / 54 W | Radeon 780M 2700 MHz | 32 GB | 109 |
| Minisforum EliteMini UM890 Pro | R9 8945HS 65 W / 54 W | Radeon 780M | 32 GB | 116 |
| Model | CPU | GPU | RAM | Value |
|---|---|---|---|---|
| Ninkear M8, 32+1TB | R7 8745HS 50 W / 35 W | Radeon 780M | 32 GB | 14.4 |
| Minisforum Mercury Series EM780 | R7 7840U | Radeon 780M | 32 GB | 18.4 |
| Minisforum V3 | R7 8840U 28 W / 28 W | Radeon 780M | 32 GB | 18.9 |
| Asus ROG Zephyrus G14 GA402XY | R9 7940HS | Radeon 780M | 32 GB | 20.29 |
| Lenovo ThinkPad P16s G2 21K9000CGE | R7 PRO 7840U 51 W / 41 W | Radeon 780M 800 MHz | 32 GB | 20.7 |
| Minisforum Venus Series UM790 Pro | R9 7940HS 65 W / 0 W | Radeon 780M | 16 GB | 21.9 |
| Aoostar GEM12 | R7 8845HS 65 W / 54 W | Radeon 780M 2700 MHz | 32 GB | 22.2 |
| Geekom A8, R9 8945HS | R9 8945HS | Radeon 780M 2800 MHz | 32 GB | 22.6 |
| Minisforum EliteMini UM890 Pro | R9 8945HS 65 W / 54 W | Radeon 780M | 32 GB | 22.6 |
| Peladn HA-4, R7 7840HS | R7 7840HS 45 W / 45 W | Radeon 780M ? / 2800 MHz | 23.4 | |
| Geekom A7 | R9 7940HS 60 W / 35 W | Radeon 780M 2800 MHz | 32 GB | 23.8 |
| Acemagic AM18 | R7 7840HS 54 W / 45 W | Radeon 780M | 32 GB | 24.1 |
| Geekom AE7 | R9 7940HS 65 W / 45 W | Radeon 780M | 32 GB | 24.4 |
| Minisforum EliteMini UM780 XTX | R7 7840HS 65 W / 54 W | Radeon 780M | 32 GB | 25.8 |
| Model | CPU | GPU | RAM | Value |
|---|---|---|---|---|
| Ninkear M8, 32+1TB | R7 8745HS 50 W / 35 W | Radeon 780M | 32 GB | 59.2 |
| Asus ROG Zephyrus G14 GA402XY | R9 7940HS | Radeon 780M | 32 GB | 70.44 |
| Minisforum Venus Series UM790 Pro | R9 7940HS 65 W / 0 W | Radeon 780M | 16 GB | 81.7 |
| Minisforum Mercury Series EM780 | R7 7840U | Radeon 780M | 32 GB | 82.2 |
| Lenovo ThinkPad P16s G2 21K9000CGE | R7 PRO 7840U 51 W / 41 W | Radeon 780M 800 MHz | 32 GB | 84.6 |
| Geekom AE7 | R9 7940HS 65 W / 45 W | Radeon 780M | 32 GB | 87.2 |
| Minisforum V3 | R7 8840U 28 W / 28 W | Radeon 780M | 32 GB | 87.7 |
| Peladn HA-4, R7 7840HS | R7 7840HS 45 W / 45 W | Radeon 780M ? / 2800 MHz | 88 | |
| Aoostar GEM12 | R7 8845HS 65 W / 54 W | Radeon 780M 2700 MHz | 32 GB | 90.7 |
| Acemagic AM18 | R7 7840HS 54 W / 45 W | Radeon 780M | 32 GB | 92 |
| Geekom A8, R9 8945HS | R9 8945HS | Radeon 780M 2800 MHz | 32 GB | 92.8 |
| Geekom A7 | R9 7940HS 60 W / 35 W | Radeon 780M 2800 MHz | 32 GB | 93.4 |
| Minisforum EliteMini UM780 XTX | R7 7840HS 65 W / 54 W | Radeon 780M | 32 GB | 93.6 |
| Minisforum EliteMini UM890 Pro | R9 8945HS 65 W / 54 W | Radeon 780M | 32 GB | 95.8 |
| Model | CPU | GPU | RAM | Value |
|---|---|---|---|---|
| Ninkear M8, 32+1TB | R7 8745HS 50 W / 35 W | Radeon 780M | 32 GB | 82.8 |
| Asus ROG Zephyrus G14 GA402XY | R9 7940HS | Radeon 780M | 32 GB | 83.02 |
| Minisforum Venus Series UM790 Pro | R9 7940HS 65 W / 0 W | Radeon 780M | 16 GB | 94.4 |
| Minisforum Mercury Series EM780 | R7 7840U | Radeon 780M | 32 GB | 101 |
| Minisforum V3 | R7 8840U 28 W / 28 W | Radeon 780M | 32 GB | 113 |
| Lenovo ThinkPad P16s G2 21K9000CGE | R7 PRO 7840U 51 W / 41 W | Radeon 780M 800 MHz | 32 GB | 113.2 |
| Peladn HA-4, R7 7840HS | R7 7840HS 45 W / 45 W | Radeon 780M ? / 2800 MHz | 123 | |
| Aoostar GEM12 | R7 8845HS 65 W / 54 W | Radeon 780M 2700 MHz | 32 GB | 124 |
| Geekom A8, R9 8945HS | R9 8945HS | Radeon 780M 2800 MHz | 32 GB | 126 |
| Acemagic AM18 | R7 7840HS 54 W / 45 W | Radeon 780M | 32 GB | 129 |
| Geekom A7 | R9 7940HS 60 W / 35 W | Radeon 780M 2800 MHz | 32 GB | 130 |
| Minisforum EliteMini UM780 XTX | R7 7840HS 65 W / 54 W | Radeon 780M | 32 GB | 132 |
| Geekom AE7 | R9 7940HS 65 W / 45 W | Radeon 780M | 32 GB | 132 |
| Minisforum EliteMini UM890 Pro | R9 8945HS 65 W / 54 W | Radeon 780M | 32 GB | 135 |
| Model | CPU | GPU | RAM | Value |
|---|---|---|---|---|
| Ninkear M8, 32+1TB | R7 8745HS 50 W / 35 W | Radeon 780M | 32 GB | 63.9 |
| Asus ROG Zephyrus G14 GA402XY | R9 7940HS | Radeon 780M | 32 GB | 68.89 |
| Minisforum Mercury Series EM780 | R7 7840U | Radeon 780M | 32 GB | 75.9 |
| Minisforum Venus Series UM790 Pro | R9 7940HS 65 W / 0 W | Radeon 780M | 16 GB | 77.9 |
| Peladn HA-4, R7 7840HS | R7 7840HS 45 W / 45 W | Radeon 780M ? / 2800 MHz | 78.1 | |
| Minisforum V3 | R7 8840U 28 W / 28 W | Radeon 780M | 32 GB | 80.7 |
| Lenovo ThinkPad P16s G2 21K9000CGE | R7 PRO 7840U 51 W / 41 W | Radeon 780M 800 MHz | 32 GB | 80.9 |
| Aoostar GEM12 | R7 8845HS 65 W / 54 W | Radeon 780M 2700 MHz | 32 GB | 82.4 |
| Acemagic AM18 | R7 7840HS 54 W / 45 W | Radeon 780M | 32 GB | 83.1 |
| Geekom A7 | R9 7940HS 60 W / 35 W | Radeon 780M 2800 MHz | 32 GB | 83.9 |
| Geekom AE7 | R9 7940HS 65 W / 45 W | Radeon 780M | 32 GB | 84 |
| Geekom A8, R9 8945HS | R9 8945HS | Radeon 780M 2800 MHz | 32 GB | 85.8 |
| Minisforum EliteMini UM780 XTX | R7 7840HS 65 W / 54 W | Radeon 780M | 32 GB | 86.1 |
| Minisforum EliteMini UM890 Pro | R9 8945HS 65 W / 54 W | Radeon 780M | 32 GB | 88.9 |
| Model | CPU | GPU | RAM | Value |
|---|---|---|---|---|
| Asus ROG Zephyrus G14 GA402XY | R9 7940HS | Radeon 780M | 32 GB | 47.09 |
| Lenovo ThinkPad P14s G5 21ME000TGE | R7 PRO 8840HS 50 W / 35 W | Radeon 780M | 64 GB | 66.65 |
| Lenovo ThinkPad P14s G4 21K5000LGE | R7 PRO 7840U 40 W / 32 W | Radeon 780M ? / 800 MHz | 16 GB | 67.7 |
| Lenovo ThinkPad P16s G2 21K9000CGE | R7 PRO 7840U 51 W / 41 W | Radeon 780M 800 MHz | 32 GB | 67.9 |
| Model | CPU | GPU | RAM | Value |
|---|---|---|---|---|
| Minisforum Venus Series UM790 Pro | R9 7940HS 65 W / 0 W | Radeon 780M | 16 GB | 17.4 |
| Minisforum Mercury Series EM780 | R7 7840U | Radeon 780M | 32 GB | 24.6 |
| Geekom A7 | R9 7940HS 60 W / 35 W | Radeon 780M 2800 MHz | 32 GB | 24.7 |
| Minisforum EliteMini UM780 XTX | R7 7840HS 65 W / 54 W | Radeon 780M | 32 GB | 25.8 |
| Geekom A8, R9 8945HS | R9 8945HS | Radeon 780M 2800 MHz | 32 GB | 26.5 |
| Aoostar GEM12 | R7 8845HS 65 W / 54 W | Radeon 780M 2700 MHz | 32 GB | 27.2 |
| Model | CPU | GPU | RAM | Value |
|---|---|---|---|---|
| Ayaneo Air 1S Retro Power | R7 7840U 28 W / 25 W | Radeon 780M | 32 GB |
| Model | CPU | GPU | RAM | Value |
|---|---|---|---|---|
| Lenovo ThinkPad E14 Gen 7 21T0003NGE | R7 250 40 W / 35 W | Radeon 780M | 32 GB | 16.7 |
| Lenovo ThinkPad T14 Gen 5 21MC003QGE | R7 8840U 51 W / 28 W | Radeon 780M | 32 GB | 26.9 |
| Schenker VIA 14 Pro (M24) | R7 8845HS 54 W / 54 W | Radeon 780M 2700 / 1067 MHz | 32 GB | 27.1 |
| Lenovo ThinkPad P14s G5 21ME000TGE | R7 PRO 8840HS 50 W / 35 W | Radeon 780M | 64 GB | 27.1 |
| Asus ROG Zephyrus G14 GA402XY | R9 7940HS | Radeon 780M | 32 GB | 27.3 |
| HP EliteBook 8 G1a 14 AD3E9ET | R7 250 30 W / 25 W | Radeon 780M | 32 GB | 28.7 |
| Lenovo ThinkPad X13 Gen 4 21J3001VGE | R7 PRO 7840U 30 W / 20 W | Radeon 780M | 32 GB | 88.9 |
| Model | CPU | GPU | RAM | Value |
|---|---|---|---|---|
| Lenovo ThinkPad E14 Gen 7 21T0003NGE | R7 250 40 W / 35 W | Radeon 780M | 32 GB | 37.7 |
| Asus ROG Zephyrus G14 GA402XY | R9 7940HS | Radeon 780M | 32 GB | 58.3 |
| Lenovo ThinkPad X13 Gen 4 21J3001VGE | R7 PRO 7840U 30 W / 20 W | Radeon 780M | 32 GB | 59.2 |
| Lenovo ThinkPad T14 Gen 5 21MC003QGE | R7 8840U 51 W / 28 W | Radeon 780M | 32 GB | 60.3 |
| Lenovo ThinkPad P14s G5 21ME000TGE | R7 PRO 8840HS 50 W / 35 W | Radeon 780M | 64 GB | 60.6 |
| Schenker VIA 14 Pro (M24) | R7 8845HS 54 W / 54 W | Radeon 780M 2700 / 1067 MHz | 32 GB | 60.8 |
| HP EliteBook 8 G1a 14 AD3E9ET | R7 250 30 W / 25 W | Radeon 780M | 32 GB | 63.6 |
| Model | CPU | GPU | RAM | Value |
|---|---|---|---|---|
| Lenovo ThinkPad E14 Gen 7 21T0003NGE | R7 250 40 W / 35 W | Radeon 780M | 32 GB | 90 |
| Lenovo ThinkPad X13 Gen 4 21J3001VGE | R7 PRO 7840U 30 W / 20 W | Radeon 780M | 32 GB | 112.3 |
| Asus ROG Zephyrus G14 GA402XY | R9 7940HS | Radeon 780M | 32 GB | 141 |
| Schenker VIA 14 Pro (M24) | R7 8845HS 54 W / 54 W | Radeon 780M 2700 / 1067 MHz | 32 GB | 146.7 |
| Lenovo ThinkPad T14 Gen 5 21MC003QGE | R7 8840U 51 W / 28 W | Radeon 780M | 32 GB | 149.1 |
| Lenovo ThinkPad P14s G5 21ME000TGE | R7 PRO 8840HS 50 W / 35 W | Radeon 780M | 64 GB | 152.8 |
| HP EliteBook 8 G1a 14 AD3E9ET | R7 250 30 W / 25 W | Radeon 780M | 32 GB | 156.6 |
| Model | CPU | GPU | RAM | Value |
|---|---|---|---|---|
| Lenovo ThinkPad E14 Gen 7 21T0003NGE | R7 250 40 W / 35 W | Radeon 780M | 32 GB | 105.4 |
| Lenovo ThinkPad X13 Gen 4 21J3001VGE | R7 PRO 7840U 30 W / 20 W | Radeon 780M | 32 GB | 159.6 |
| Asus ROG Zephyrus G14 GA402XY | R9 7940HS | Radeon 780M | 32 GB | 161 |
| Lenovo ThinkPad T14 Gen 5 21MC003QGE | R7 8840U 51 W / 28 W | Radeon 780M | 32 GB | 162.3 |
| Lenovo ThinkPad P14s G5 21ME000TGE | R7 PRO 8840HS 50 W / 35 W | Radeon 780M | 64 GB | 166.1 |
| HP EliteBook 8 G1a 14 AD3E9ET | R7 250 30 W / 25 W | Radeon 780M | 32 GB | 174.8 |
| Model | CPU | GPU | RAM | Value |
|---|---|---|---|---|
| Lenovo ThinkPad E14 Gen 7 21T0003NGE | R7 250 40 W / 35 W | Radeon 780M | 32 GB | 151.8 |
| Lenovo ThinkPad T14 Gen 5 21MC003QGE | R7 8840U 51 W / 28 W | Radeon 780M | 32 GB | 190.7 |
| Lenovo ThinkPad X13 Gen 4 21J3001VGE | R7 PRO 7840U 30 W / 20 W | Radeon 780M | 32 GB | 217 |
| Asus ROG Zephyrus G14 GA402XY | R9 7940HS | Radeon 780M | 32 GB | 224 |
| Lenovo ThinkPad P14s G5 21ME000TGE | R7 PRO 8840HS 50 W / 35 W | Radeon 780M | 64 GB | 224.8 |
| HP EliteBook 8 G1a 14 AD3E9ET | R7 250 30 W / 25 W | Radeon 780M | 32 GB | 230.3 |
| Model | CPU | GPU | RAM | Value |
|---|---|---|---|---|
| Lenovo ThinkPad E14 Gen 7 21T0003NGE | R7 250 40 W / 35 W | Radeon 780M | 32 GB | 188.8 |
| Asus ROG Zephyrus G14 GA402XY | R9 7940HS | Radeon 780M | 32 GB | 288 |
| Lenovo ThinkPad T14 Gen 5 21MC003QGE | R7 8840U 51 W / 28 W | Radeon 780M | 32 GB | 297.6 |
| Lenovo ThinkPad X13 Gen 4 21J3001VGE | R7 PRO 7840U 30 W / 20 W | Radeon 780M | 32 GB | 300.9 |
| HP EliteBook 8 G1a 14 AD3E9ET | R7 250 30 W / 25 W | Radeon 780M | 32 GB | 302.9 |
| Lenovo ThinkPad P14s G5 21ME000TGE | R7 PRO 8840HS 50 W / 35 W | Radeon 780M | 64 GB | 308.8 |
| Model | CPU | GPU | RAM | Value |
|---|---|---|---|---|
| Lenovo ThinkPad E14 Gen 7 21T0003NGE | R7 250 40 W / 35 W | Radeon 780M | 32 GB | 392.4 |
| Lenovo ThinkPad X13 Gen 4 21J3001VGE | R7 PRO 7840U 30 W / 20 W | Radeon 780M | 32 GB | 552.4 |
| Lenovo ThinkPad T14 Gen 5 21MC003QGE | R7 8840U 51 W / 28 W | Radeon 780M | 32 GB | 563.8 |
| Asus ROG Zephyrus G14 GA402XY | R9 7940HS | Radeon 780M | 32 GB | 574 |
| Lenovo ThinkPad P14s G5 21ME000TGE | R7 PRO 8840HS 50 W / 35 W | Radeon 780M | 64 GB | 574.9 |
| HP EliteBook 8 G1a 14 AD3E9ET | R7 250 30 W / 25 W | Radeon 780M | 32 GB | 619.9 |
The following benchmarks stem from our benchmarks of review laptops. The performance depends on the used graphics memory, clock rate, processor, system settings, drivers, and operating systems. So the results don't have to be representative for all laptops with this GPU. For detailed information on the benchmark results, click on the fps number.


For more games that might be playable and a list of all games and graphics cards visit our Gaming List
#0 ran 0s before starting gpusingle class +0s ... 0s
#1 no ids found in url (should be separated by "_") +0s ... 0s
#2 not redirecting to Ajax server +0s ... 0s
#3 did not recreate cache, as it is less than 5 days old! Created at Tue, 28 Jul 2026 05:31:23 +0200 +0.002s ... 0.002s
#4 no comparison url found in template nbc.compare_page_1 needed +0.013s ... 0.015s
#5 no comparison url found in template nbc.compare_page_1 needed +0s ... 0.016s
#6 composed specs +0.001s ... 0.016s
#7 did output specs +0s ... 0.016s
#8 start showIntegratedCPUs +0s ... 0.016s
#9 getting avg benchmarks for device 11564 +0.052s ... 0.068s
#10 got single benchmarks 11564 +0.281s ... 0.349s
#11 got avg benchmarks for devices +0s ... 0.349s
#12 No cached benchmark found, getting uncached values +3.05s ... 3.398s
#13 min, max, avg, median took s +0.792s ... 4.19s
#14 before gaming benchmark output +0.001s ... 4.191s
#15 Got 3790 rows for game benchmarks. +0.572s ... 4.763s
#16 composed SQL query for gamebenchmarks +0s ... 4.763s
#17 got data and put it in $dataArray +0.092s ... 4.855s
#18 benchmarks composed for output. +2.065s ... 6.92s
#19 no comparison url found in template nbc.compare_page_1 needed +0.409s ... 7.329s
#20 return log +0s ... 7.329s

Alliwava H90 Pro: AMD Ryzen 7 8745HS, 0.5 kg
Review » 性能与效率的完美结合:采用 AMD Ryzen 7 APU 的 Alliwava H90 Pro 迷你电脑评测
HP EliteBook 8 G1a 14 AD3E9ET: AMD Ryzen 7 250, 14.00", 1.4 kg
Review » 这款价格更实惠的 AMD Ryzen 7 版本仍然是一款赢家:惠普EliteBook 8 G1a 14笔记本电脑评测
GMK NucBox K12: AMD Ryzen 7 H 255, 0.9 kg
Review » GMK NucBox K12 迷你电脑评测:更大,但不一定更快
Lenovo ThinkPad E14 Gen 7 21T0003NGE: AMD Ryzen 7 250, 14.00", 1.5 kg
Review » 对于这款商务笔记本电脑来说,AMD 是比英特尔更糟糕的选择:联想 ThinkPad E14 7 代评测
Peladn HA-4, R7 7840HS: AMD Ryzen 7 7840HS, 1 kg
Review » 功能强大的迷你电脑物美价廉?Peladn HA-4 向 Geekom、Minisforum 等挑战--Ryzen 7 7840HS 评测带来的效率奇迹
Beelink SER9 Pro: AMD Ryzen 7 H 255, 0.8 kg
Review » Beelink SER9 Pro Ryzen 7 迷你电脑评测:普通非 Pro 版速度更快
Ninkear M8, 32+1TB: AMD Ryzen 7 8745HS, 0.5 kg
Review » 比 Geekom 和 Minisforum 更好?搭载 AMD Ryzen 7 的 Ninkear M8 mini PC 在评测中表现如何?
Chuwi Aubox, R7 8745HS: AMD Ryzen 7 8745HS, 0.7 kg
Review » 450 美元以下的最佳迷你 PC?配备 AMD Ryzen 7 8745HS 的 Chuwi AuBox 评测
BOSGAME M4 Neo: AMD Ryzen 7 7840HS, 0.6 kg
Review » Bosgame M4 Neo 测试 - 昂贵迷你 PC 的经济型替代品
Geekom A8 Max, R7 8845HS: AMD Ryzen 7 8845HS, 0.7 kg
Review » 最超值的 AMD Ryzen 7 8845HS?- Geekom A8 Max 迷你电脑评测
Asus VivoBook 18 M1807HA: AMD Ryzen 7 260, 18.40", 2.6 kg
Review » 华硕 VivoBook 18 笔记本电脑评测:不到 1,000 美元的显示屏怪物
Minisforum EliteMini UM890 Pro: AMD Ryzen 9 8945HS, 0.7 kg
Review » Minisforum EliteMini UM890 Pro 评测:配备 AMD Ryzen 9 和超静音散热技术的强大迷你 PC
Lenovo IdeaPad Slim 3 14 AHP G10: AMD Ryzen 7 8840HS, 14.00", 1.5 kg
Review » 联想 IdeaPad Slim 3 14 评测--经济实惠的多媒体笔记本电脑,搭载 Zen 4,动力强劲
GMK NucBox K11: AMD Ryzen 9 8945HS, 0.6 kg
Review » GMK NucBox K11 迷你电脑评测:搭载 AMD Zen 4,每美元性能强劲
Zotac ZGC-G1A1W-01: AMD Ryzen 7 8840U, 7.00", 0.7 kg
Review » ZOTAC Gaming Zone 手持设备评测:Precision 控制器、亮丽的 OLED 显示屏和小巧的机身
BOSGAME M2: AMD Ryzen 9 7940HS, 0.8 kg
Review » BOSGAME M2 迷你电脑评测:修正了原版 M1 的一大缺陷
Lenovo ThinkPad P14s G5 21ME000TGE: AMD Ryzen 7 PRO 8840HS, 14.00", 1.4 kg
Review » OLED 吞噬电池寿命联想 ThinkPad P14s 第 5 代 AMD 笔记本电脑评测
HP EliteBook 845 G11: AMD Ryzen 7 PRO 8840HS, 14.00", 1.5 kg
Review » 惠普 EliteBook 845 G11 笔记本电脑评测--无重大变化,但仍是最佳商务笔记本之一
Lenovo ThinkPad T14 Gen 5 21MC003QGE: AMD Ryzen 7 8840U, 14.00", 1.5 kg
Review » AMD 比英特尔快得多联想 ThinkPad T14 第 5 代笔记本电脑评测
Ayaneo Flip KB: AMD Ryzen 7 8840U, 7.00", 0.7 kg
Review » Ayaneo Flip KB 评测--采用效率较低的 AMD Ryzen 7 8840U 的功能强大的掌上游戏机
Lenovo Yoga 7 2-in-1 14AHP9: AMD Ryzen 7 8840HS, 14.00", 1.6 kg
Review » 联想 Yoga 7 二合一 14AHP9 评测:快速的中端敞篷跑车,弱显示屏拖了后腿
Lenovo IdeaPad 5 2-in-1 14AHP9: AMD Ryzen 7 8845HS, 14.00", 1.6 kg
Review » IdeaPad 5 二合一 14AHP9 可折叠电脑评测:联想最便宜也是最快的产品之一
Ninkear A16 Pro: AMD Ryzen 7 8845HS, 16.00", 1.8 kg
Review » Ninkear A16 Pro 笔记本电脑评测:经济实惠、功能强大、使用安静
Zotac ZGC-G1A1W-01: AMD Ryzen 7 8840U, 7.00", 0.7 kg
Review » Zotac Zone 评测:丰富的显示屏与同级领先的输入
Minisforum MS-A1: AMD Ryzen 7 8700G, 1.7 kg
Review » Minisforum MS-A1 评测:工作站支持各种 AMD CPU 并提供四个固态硬盘空间
Schenker XMG Evo 14 (M24): AMD Ryzen 7 8845HS, 14.00", 1.5 kg
Review » 申克 XMG Evo 14 (M24) 笔记本电脑评测--配备 Ryzen 8000 和高达 96 GB 内存的全能型好手
Geekom AX8 Pro: AMD Ryzen 9 8945HS, 0.5 kg
Review » Geekom AX8 Pro AI NUC PC 评测:AMD Ryzen 9 8945HS,32 GB DDR5 内存和 2 TB SSD,0.47L 机箱
Lenovo ThinkPad X13 Gen 4 21J3001VGE: AMD Ryzen 7 PRO 7840U, 13.30", 1.3 kg
Review » 联想 ThinkPad X13 Gen 4 AMD 笔记本电脑评测:性能平平的紧凑型 Ryzen 机器
Asus ROG Ally X: AMD Ryzen Z1 Extreme, 7.00", 0.7 kg
Review » 华硕 ROG Ally X 评测--凭借更快的内存和 80 Wh 超大电池,成为最佳游戏掌上电脑
Geekom AE7: AMD Ryzen 9 7940HS, 0.6 kg
Review » Geekom AE7 评测:配备 AMD Ryzen 9 7940HS、DDR5 内存、现代接口和一个问题的 NUC 迷你 PC
Schenker VIA 14 Pro (M24): AMD Ryzen 7 8845HS, 14.00", 1.4 kg
Review » 申克威盛 14 Pro (M24) 评测--配备 Ryzen 8000 和更亮显示屏的紧凑型 AMD 超小型笔记本电脑
Beelink SER8: AMD Ryzen 7 8845HS, 0.8 kg
Review » Beelink SER8 PC 评论:Mac Mini-inspired 设计与 AMD Ryzen 7 8845HS
Dell Inspiron 14 7445 2-in-1: AMD Ryzen 7 8840HS, 14.00", 1.7 kg
Review » 戴尔 Inspiron 14 7445 二合一可转换机型评测:从 Ryzen-U 过渡到 Ryzen-HS
Aoostar GEM12: AMD Ryzen 7 8845HS, 0.7 kg
Review » Aoostar GEM12 迷你电脑评测:AMD Ryzen 7 8845HS,32 GB 内存、1 TB SSD 和 OCuLink 接口
GPD Win Mini 2024 7": AMD Ryzen 7 8840U, 7.00", 0.5 kg
Review » GPD Win Mini Zen 4 手持设备评测:华硕 ROG Ally 的可靠替代品
Geekom A8, R9 8945HS: AMD Ryzen 9 8945HS, 0.4 kg
Review » Geekom A8 评测:高级 0.5 升迷你 PC,配备 AMD Ryzen 9 8945HS、32 GB DDR5 内存和 2 TB 固态硬盘
Lenovo ThinkPad T16 G2 21K70035GE: AMD Ryzen 7 7840U, 16.00", 1.8 kg
Review » 联想 ThinkPad T16 G2 AMD 笔记本电脑评测:搭载 Ryzen 7040 的大型 ThinkPad 更加出色
BOSGAME M1: AMD Ryzen 7 7840HS, 0.8 kg
Review » BOSGAME M1 迷你 PC 评测:Ryzen 7 7840HS 仍是一头猛兽
HP Envy x360 2-in-1 16-ad0097nr: AMD Ryzen 7 8840HS, 16.00", 1.8 kg
Review » 惠普 Envy x360 2 合 1 16 评论:Ryzen 7 8840HS 击败酷睿 7 155U
Asus Zenbook 14 OLED UM3406HA: AMD Ryzen 7 8840HS, 14.00", 1.2 kg
Review » 华硕 Zenbook 14 OLED 评测 - AMD 版 Zenbook 配备了较弱的 1080p OLED 屏幕
Minisforum V3: AMD Ryzen 7 8840U, 14.00", 0.9 kg
Review » Minisforum V3 三合一平板电脑评测:首款采用 AMD Hawk Point APU(又称 AMD Ryzen 7 8840U)的 Windows 平板电脑
Acemagic AM18: AMD Ryzen 7 7840HS, 0.6 kg
Review » Acemagic AM18 评测:采用抢眼赛博朋克外观的游戏迷你 PC,配备 AMD Ryzen 7 7840HS 和 32 GB 内存
GMK NucBox K6: AMD Ryzen 7 7840HS, 0.5 kg
Review » GMK NucBox K6 迷你电脑评测:与最新英特尔酷睿 Ultra 笔记本电脑一样强大
Lenovo IdeaPad Pro 5 14AHP9: AMD Ryzen 7 8845HS, 14.00", 1.5 kg
Review » 联想 IdeaPad Pro 5 14AHP9 笔记本电脑评测--配备 Ryzen 8000 和 120-Hz OLED 的强大超便携产品
Minisforum Mercury Series EM780: AMD Ryzen 7 7840U, 0.2 kg
Review » Minisforum Mercury 系列 EM780 评测:配备 AMD Ryzen 7 7840U、32 GB 内存和 1 TB SSD 的超小型迷你 PC
Geekom A7: AMD Ryzen 9 7940HS, 0.4 kg
Review » 带 0.5 升机箱的 Geekom A7 评测:配备 AMD Ryzen 9 7940HS、32 GB DDR5 内存和 2 TB SSD 的高级迷你 PC
HP EliteBook 865 G10: AMD Ryzen 9 PRO 7940HS, 16.00", 1.9 kg
Review » 惠普EliteBook 865 G10笔记本电脑评测--被Sure View毁掉的高性能商务笔记本电脑
Asus ROG Zephyrus G14 2024 GA403U: AMD Ryzen 9 8945HS
Review » 测试中的 AMD Ryzen 8000 Hawk Point - Zen4 更新版在数字运算和 GPU 性能方面优于 Meteor Lake
ONEXPLAYER 2 Pro AR18: AMD Ryzen 7 7840U, 8.40", 0.9 kg
Review » OneXPlayer 2 Pro 游戏手持设备、平板电脑或可拆卸设备评测:配备强大 Ryzen 7 的多面设备
Ayaneo Kun: AMD Ryzen 7 7840U, 8.40", 0.9 kg
Review » Ayaneo Kun 游戏掌上电脑评测:个人主义者的性能野兽
Lenovo ThinkPad P16s G2 21K9000CGE: AMD Ryzen 7 PRO 7840U, 16.00", 1.8 kg
Review » 联想 ThinkPad P16s G2 AMD 评测:这款工作站笔记本电脑内含强劲动力和 OLED 显示屏
Tuxedo Pulse 14 Gen3: AMD Ryzen 7 7840HS, 14.00", 1.4 kg
Review » Tuxedo Pulse 14 Gen3 评测--配备 AMD Zen4 和 120Hz 显示屏的 Linux 超极本
Lenovo ThinkPad P14s G4 21K5000LGE: AMD Ryzen 7 PRO 7840U, 14.00", 1.3 kg
Review » 联想 ThinkPad P14s G4 AMD 评测:快速、便携、直观
Lenovo ThinkPad Z13 Gen 2: AMD Ryzen 7 PRO 7840U, 13.30", 1.2 kg
Review » ThinkPad Z13 Gen 2 笔记本电脑评测:联想对戴尔 XPS 13 的回应
Lenovo Legion Go: AMD Ryzen Z1 Extreme, 8.80", 0.8 kg
Review » 联想Legion Go 游戏掌上电脑评测:创意不错,但执行不够完美
Lenovo Yoga Pro 7 14APH G8: AMD Ryzen 7 7840HS, 14.50", 1.5 kg
Review » 联想 Yoga Pro 7 14 G8 笔记本电脑评测--AMD Zen4 并非自动更好
Lenovo ThinkPad T14 G4 21K4S02000: AMD Ryzen 7 PRO 7840U, 14.00", 1.5 kg
Review » 联想 ThinkPad T14 G4 AMD 笔记本电脑评测:小巧的 ThinkPad 中的 Ryzen 功能
Minisforum EliteMini UM780 XTX: AMD Ryzen 7 7840HS, 0.8 kg
Review » Minisforum EliteMini UM780 XTX 评测:配备 AMD Ryzen 7 7840HS 和 Radeon 780M 的迷你 PC 已获得 OCuLink 和 USB-4 连接
HP Pavilion Plus 14-ey0095cl: AMD Ryzen 7 7840U, 14.00", 1.4 kg
Review » 惠普Pavilion Plus 14 Ryzen 7 笔记本电脑评测:所有正确位置的变化
Lenovo ThinkPad T14s G4-21F8002TGE: AMD Ryzen 7 7840U, 14.00", 1.4 kg
Review » 联想ThinkPad T14s G4评测:采用 AMD Zen4 的商务笔记本电脑更出色
Lenovo Yoga Slim 7 14APU G8: AMD Ryzen 7 7840S, 14.50", 1.3 kg
Review » 联想 Yoga Slim 7 14 G8 AMD 评测--定制 Zen4 CPU 与出色的 2.9K OLED 相得益彰
Ayaneo Air 1S Retro Power : AMD Ryzen 7 7840U, 5.50", 0.4 kg
Review » 测试中的 Ayaneo Air 1S Retro Power 游戏掌上电脑 - 口袋里的 Zen4 Power
Acer Swift Edge SFE16 Ryzen 7 7840U: AMD Ryzen 7 7840U, 16.00", 1.2 kg
Review » 宏碁 Swift Edge 16 Ryzen 7 7840U 笔记本电脑评测:Zen 4 CPU 和 3.2K 120 Hz OLED 提升
Framework Laptop 13.5 Ryzen 7 7840U: AMD Ryzen 7 7840U, 13.50", 1.3 kg
Review » 框架笔记本 13.5 Ryzen 7 7840U 评测:比英特尔版本好太多
HP EliteBook 845 G10 5Z4X0ES: AMD Ryzen 7 7840U, 14.00", 1.5 kg
Review » 惠普EliteBook 845 G10评测:凭借 AMD Ryzen 7 7840U 和无与伦比的价格,商务笔记本电脑给人留下深刻印象
Beelink SER7: AMD Ryzen 7 7840HS, 0.6 kg
Review » Beelink SER7 迷你 PC 评测:配备蒸汽室冷却系统的 Ryzen 7 7840HS
HP EliteBook 845 G10 818N0EA: AMD Ryzen 9 PRO 7940HS, 14.00", 1.5 kg
Review » 惠普EliteBook 845 G10评测:配备 AMD Zen4 的近乎完美的商务笔记本电脑
Review » 使用新驱动程序测试 AMD Radeon 780M 和 760M iGPU 的性能
Minisforum Venus Series UM790 Pro: AMD Ryzen 9 7940HS, 0.7 kg
Review » Minisforum Venus 系列 UM790 Pro 评测:AMD Ryzen 9 7940HS 和 Radeon 780M 使其优于竞争对手
Beelink GTR7 7840HS: AMD Ryzen 7 7840HS, 0.9 kg
Review » AMD Ryzen 7 7840HS性能首次亮相:Beelink GTR7迷你电脑评测
Asus ROG Ally Z1 Extreme: AMD Ryzen Z1 Extreme, 7.00", 0.6 kg
Review » 华硕ROG Ally Z1 Extreme评测--拥有120赫兹显示屏和AMD Zen4的游戏掌机
Asus ROG Zephyrus G14 GA402XY: AMD Ryzen 9 7940HS, 14.00"
Review » AMD Radeon 780M iGPU分析--AMD新的RDNA-3 GPU对其竞争对手的挑战
Review » AMD Ryzen 9 7940HS分析--Zen4 Phoenix的理想效率是Apple
Asus ROG Ally X: AMD Ryzen Z1 Extreme
External Review » Asus ROG Ally X - 评测与配置
HP ProBook 4 G1a 14: AMD Ryzen 7 250, 14.00", 1.4 kg
External Review » HP ProBook 4 G1a 14
Lenovo IdeaPad Slim 3 15AHP10: AMD Ryzen 7 8840HS, 15.30", 1.6 kg
External Review » Lenovo IdeaPad Slim 3 15AHP10
Acer TravelMate P4 TMP414-42: AMD Ryzen 7 8840U, 14.00", 1.5 kg
External Review » Acer TravelMate P4 TMP414-42
HP EliteBook 8 G1a 14 AD3E9ET: AMD Ryzen 7 250, 14.00", 1.4 kg
External Review » HP EliteBook 8 G1a 14
HP Omnibook 5 16-bc1000: AMD Ryzen 7 8840U, 16.00", 1.8 kg
External Review » HP Omnibook 5 16-bc1000
HP EliteBook 865 G11: AMD Ryzen 7 8840U, 1.00", 1.9 kg
External Review » HP EliteBook 865 G11
Lenovo ThinkPad T14 G4 21K4S02000: AMD Ryzen 7 PRO 7840U, 14.00", 1.5 kg
External Review » Lenovo ThinkPad T14 G4 21K4S02000
Lenovo IdeaPad 5 16AHP9: AMD Ryzen 7 8845HS, 16.00", 1.9 kg
External Review » Lenovo IdeaPad 5 16AHP9
Asus Vivobook S 15 OLED M5506UA: AMD Ryzen 7 8845HS, 15.60", 1.5 kg
External Review » Asus Vivobook S 15 OLED M5506UA
Acer Nitro Blaze 11: AMD Ryzen 7 8840HS, 10.95", 1.1 kg
External Review » Acer Nitro Blaze 11
Lenovo IdeaPad 5 2-in-1 14AHP9, R7 8845HS: AMD Ryzen 7 8845HS, 14.00", 1.6 kg
External Review » Lenovo IdeaPad 5 2-in-1 14AHP9, R7 8845HS
Acer Nitro Blaze 7: AMD Ryzen 7 8840HS, 7.00", 0.7 kg
External Review » Acer Nitro Blaze 7
HP EliteBook 845 G11: AMD Ryzen 7 PRO 8840HS, 14.00", 1.5 kg
External Review » HP EliteBook 845 G11
Acer Swift Go 14 SFG14-63, R7 8845HS: AMD Ryzen 7 8845HS, 14.00", 1.3 kg
External Review » Acer Swift Go 14 SFG14-63, R7 8845HS
Lenovo ThinkPad T14 G5: AMD Ryzen 7 8840U, 14.00", 1.4 kg
External Review » Lenovo ThinkPad T14 G5
Acer Aspire 15 A15-41M: AMD Ryzen 7 8840HS, 15.60", 1.7 kg
External Review » Acer Aspire 15 A15-41M
Honor MagicBook X16 Plus 2024: AMD Ryzen 7 8845HS, 16.00", 1.8 kg
External Review » Honor MagicBook X16 Plus 2024
Acer Swift Edge SFE16-44: AMD Ryzen 7 8840U, 16.00", 1.2 kg
External Review » Acer Swift Edge SFE16-44
HP Envy x360 14-fa0000: AMD Ryzen 7 8840HS, 14.00", 1.4 kg
External Review » HP Envy x360 14-fa0000
HP Pavilion Aero 13-bg0000: AMD Ryzen 7 8840HS, 13.30", 1 kg
External Review » HP Pavilion Aero 13-bg0000
Lenovo Yoga 7 14AHP9: AMD Ryzen 7 8840HS, 14.00", 1.5 kg
External Review » Lenovo Yoga 7 14AHP9
Dell Inspiron 14 7445 2-in-1: AMD Ryzen 7 8840HS, 14.00", 1.7 kg
External Review » Dell Inspiron 14 7445 2-in-1
Asus Vivobook S 14 OLED M5406UA: AMD Ryzen 7 8845HS, 14.00", 1.3 kg
External Review » Asus Vivobook S 14 OLED M5406UA
Asus VivoBook S 14 OLED S5406UA: AMD Ryzen 9 8945HS, 14.00", 1.3 kg
External Review » Asus VivoBook S 14 OLED S5406UA
Asus ROG Ally X: AMD Ryzen Z1 Extreme, 7.00", 0.7 kg
External Review » Asus ROG Ally X
Lenovo ThinkPad T16 G2 21K70035GE: AMD Ryzen 7 7840U, 16.00", 1.8 kg
External Review » Lenovo ThinkPad T16 G2 21K70035GE
HP Envy x360 2-in-1 16-ad0097nr: AMD Ryzen 7 8840HS, 16.00", 1.8 kg
External Review » HP Envy x360 2-in-1 16-ad0097nr
HP ZBook Firefly 14 G10, R7 7840HS: AMD Ryzen 7 7840HS, 14.00", 1.5 kg
External Review » HP ZBook Firefly 14 G10, R7 7840HS
Asus Zenbook 14 OLED UM3406HA: AMD Ryzen 7 8840HS, 14.00", 1.2 kg
External Review » Asus Zenbook 14 OLED UM3406HA
HP EliteBook 865 G10, R7 PRO 7840U: AMD Ryzen 7 PRO 7840U, 16.00", 1.8 kg
External Review » HP EliteBook 865 G10, R7 PRO 7840U
Lenovo ThinkPad P14s G4 21K5000LGE: AMD Ryzen 7 PRO 7840U, 14.00", 1.3 kg
External Review » Lenovo ThinkPad P14s G4 21K5000LGE
HP EliteBook 865 G10: AMD Ryzen 9 PRO 7940HS, 16.00", 1.9 kg
External Review » HP EliteBook 865 G10
Lenovo IdeaPad Pro 5 16APH8: AMD Ryzen 7 7840HS, 16.00", 1.9 kg
External Review » Lenovo IdeaPad Pro 5 16APH8
Lenovo IdeaPad Pro 5 14AHP9: AMD Ryzen 7 8845HS, 14.00", 1.5 kg
External Review » Lenovo IdeaPad Pro 5 14AHP9
HP EliteBook 845 G10 5Z4X0ES: AMD Ryzen 7 7840U, 14.00", 1.5 kg
External Review » HP EliteBook 845 G10 5Z4X0ES
Lenovo ThinkPad Z13 Gen 2: AMD Ryzen 7 PRO 7840U, 13.30", 1.2 kg
External Review » Lenovo ThinkPad Z13 Gen 2
HP ZBook Firefly 14 G10: AMD Ryzen 9 PRO 7940HS, 14.00", 1.5 kg
External Review » HP ZBook Firefly 14 G10
Asus ROG Ally Z1 Extreme: AMD Ryzen Z1 Extreme, 7.00", 0.6 kg
External Review » Asus ROG Ally Z1 Extreme
Schenker VIA 14 Pro (L23): AMD Ryzen 7 PRO 7840HS, 14.00", 1.4 kg
External Review » SCHENKER VIA 14 Pro (L23)
Lenovo ThinkPad T14s G4-21F8002TGE: AMD Ryzen 7 7840U, 14.00", 1.4 kg
External Review » Lenovo ThinkPad T14s G4-21F8002TGE
HP Pavilion Plus 14-ey0095cl: AMD Ryzen 7 7840U, 14.00", 1.4 kg
External Review » HP Pavilion Plus 14-ey0095cl
Acer Swift Edge SFE16 Ryzen 7 7840U: AMD Ryzen 7 7840U, 16.00", 1.2 kg
External Review » Acer Swift Edge SFE16 Ryzen 7 7840U
Lenovo Yoga Pro 7 14APH G8: AMD Ryzen 7 7840HS, 14.50", 1.5 kg
External Review » Lenovo Yoga Pro 7 14APH8
Lenovo IdeaPad 5 Pro 16APH8: AMD Ryzen 7 7840HS, 16.00", 1.9 kg
External Review » Lenovo IdeaPad 5 Pro 16APH8
Lenovo Legion Go: AMD Ryzen Z1 Extreme, 8.80", 0.8 kg
External Review » Lenovo Legion Go
Xiaomi RedmiBook Pro 15 2023: AMD Ryzen 7 7840HS, 15.60", 1.8 kg
External Review » Xiaomi RedmiBook Pro 15 2023
Acer Swift Edge SFE16-43: AMD Ryzen 7 7840U, 16.00", 1.3 kg
External Review » Acer Swift Edge SFE16-43
Lenovo Yoga Slim 6 14APU8 7840U: AMD Ryzen 7 7840U, 14.00", 1.4 kg
External Review » Lenovo Yoga Slim 6
Acemagic AM18: AMD Ryzen 7 7840HS, 0.6 kg
» Acemagic 2026 周年庆:迷你 PC、笔记本电脑和 NAS 系统大折扣活动
Alliwava GH8, R9 8945HS: AMD Ryzen 9 8945HS, 0.5 kg
» Alliwava GH8 迷你 PC 评测:搭载 AMD Ryzen 9 处理器的顶级机型袭来 Minisforum, Geekom & Co
Geekom A7 Max, R9 7940HS: AMD Ryzen 9 7940HS, 0.7 kg
» 配备 AMD Ryzen 9 的迷你 PC:Geekom A7 Max Edition 2026 值得购买吗?
Dynabook Tecra A60 A65-M: AMD Ryzen 7 250, 16.00", 1.7 kg
» Dynabook Tecra A65-M 显示双通道内存对集成显卡性能的重要性
» 这一缺点让新款 Dynabook Tecra A65-M 彻底黯然失色。
Minisforum AI X1, Ryzen 7 255: AMD Ryzen 7 255, 0.7 kg
» Minisforum AI X1 便宜起步:配备 AMD Ryzen 7 255 和内置扬声器的迷你 PC 评测
Geekom A8, R7 8745HS: AMD Ryzen 7 8745HS, 0.4 kg
» 配备 Ryzen 7 8745HS 的 Geekom A8:这款迷你 PC 值得购买吗?
HP EliteBook 8 G1a 14 AD3E9ET: AMD Ryzen 7 250, 14.00", 1.4 kg
» 旧标准的回归:惠普让 RJ45 以太网端口重返多种商业模式
GMK NucBox K12: AMD Ryzen 7 H 255, 0.9 kg
» GMK NucBox K12 的设计有一个微小但令人讨厌的缺陷
» 新款 Ryzen 7 H 255 的性能几乎与 3 年前的 Ryzen 7 7840HS 完全相同
Lenovo ThinkPad E14 Gen 7 21T0003NGE: AMD Ryzen 7 250, 14.00", 1.5 kg
» 终于采用了 AMD Zen 4 处理器,但仍落后一个时代:联想的 ThinkPad E14 第 7 代 AMD 比以往任何时候都更好
Peladn HA-4, R7 7840HS: AMD Ryzen 7 7840HS, 1 kg
» 测试中的时尚 Ryzen 7 mini PC - Peladn HA-4 以最高效率和 RGB 灯光获得好评
Beelink SER9 Pro: AMD Ryzen 7 H 255, 0.8 kg
» 在首次基准测试中,Ryzen 7 H 255 是 Ryzen 7 8845HS 的翻版
Minisforum EliteMini UM890 Pro: AMD Ryzen 9 8945HS, 0.7 kg
» Minisforum EliteMini UM890 Pro:配备 AMD Ryzen 9 APU 的完美迷你 PC?
Framework Laptop 13.5 Ryzen 7 7840U: AMD Ryzen 7 7840U, 13.50", 1.3 kg
» Framework 12 作为可维修的 "入门级 "二合一笔记本电脑发布,采用坚固耐用的设计
Lenovo ThinkPad P14s G5 21ME000TGE: AMD Ryzen 7 PRO 8840HS, 14.00", 1.4 kg
» 成熟的 Strix 光环:下一版 ThinkPad P14s AMD 需要 Ryzen AI Max
» 不平等待遇:联想如何让 AMD 版 ThinkPad P14s 5 代变得更糟
Lenovo Legion Go: AMD Ryzen Z1 Extreme, 8.80", 0.8 kg
» 联想Legion Go 2 控制器将向后兼容Legion Go,"不久 "即可购买
HP EliteBook 845 G11: AMD Ryzen 7 PRO 8840HS, 14.00", 1.5 kg
» 惠普EliteBook 845是最好的商务笔记本之一,但散热性能仍是弱点
Asus Zenbook 14 OLED UM3406HA: AMD Ryzen 7 8840HS, 14.00", 1.2 kg
» 2025 华硕 Zenbook 14 OLED 笔记本现配备英特尔酷睿 Ultra 200H 和 Ryzen AI 300 APU
Asus ROG Ally X: AMD Ryzen Z1 Extreme, 7.00", 0.7 kg
» 微星 Claw 8 AI+ 与罗杰 Ally X:据报道,Lunar Lake APU 让微星在性能和电池续航时间方面缩小差距
Asus ROG Ally Z1 Extreme: AMD Ryzen Z1 Extreme, 7.00", 0.6 kg
» 微星 Claw 8 AI+ 与罗杰 Ally X:据报道,Lunar Lake APU 让微星在性能和电池续航时间方面缩小差距
Lenovo Legion Go: AMD Ryzen Z1 Extreme, 8.80", 0.8 kg
» 微星 Claw 8 AI+ 与罗杰 Ally X:据报道,Lunar Lake APU 让微星在性能和电池续航时间方面缩小差距
Ayaneo Air 1S Retro Power : AMD Ryzen 7 7840U, 5.50", 0.4 kg
» Ayaneo Flip KB 手持控制台:功能卓越,性能中等
Ayaneo Flip KB: AMD Ryzen 7 8840U, 7.00", 0.7 kg
» Ayaneo Flip KB 手持控制台:功能卓越,性能中等
Ayaneo Kun: AMD Ryzen 7 7840U, 8.40", 0.9 kg
» Ayaneo Flip KB 手持控制台:功能卓越,性能中等
GPD Win Mini 2024 7": AMD Ryzen 7 8840U, 7.00", 0.5 kg
» GPD 公布 Pocket 4 售价:搭载 AMD 处理器的超便携笔记本电脑即将上市
Asus ROG Ally X: AMD Ryzen Z1 Extreme, 7.00", 0.7 kg
» 借助华硕 ROG Ally 显示屏和 Gamescope 中的 VRR 支持,SteamOS 向第三方手持设备靠拢
Framework Laptop 13.5 Ryzen 7 7840U: AMD Ryzen 7 7840U, 13.50", 1.3 kg
» Framework 笔记本电脑砖系统可利用乐高脚垫、轮子、电缆支架等扩展笔记本电脑
Minisforum Mercury Series EM780: AMD Ryzen 7 7840U, 0.2 kg
» Minisforum Mercury 系列 EM780 在 1/4 L 机箱中内置 AMD Ryzen 7 7840U 和 32 GB DDR5 内存
Lenovo ThinkPad P16s G2 21K9000CGE: AMD Ryzen 7 PRO 7840U, 16.00", 1.8 kg
» 快速、明亮、实用:配备 Ryzen 7 和 Radeon 780M 的联想 ThinkPad P16s G2 AMD 评测
Asus ROG Ally Z1 Extreme: AMD Ryzen Z1 Extreme, 7.00", 0.6 kg
» 华硕ROG盟友:高管证实玩家可以暂缓最近麻烦的BIOS更新
» Comparison of GPUs
Detailed list of all laptop GPUs sorted by class and performance.
» Benchmark List
Sort and restrict laptop GPUs based on performance in synthetic benchmarks.
» Notebook Gaming List
Playable games for each graphics card and their average FPS results.
* Approximate position of the graphics adapter
» Notebookcheck多媒体笔记本电脑Top 10排名
» Notebookcheck游戏笔记本电脑Top 10排名
» Notebookcheck低价办公/商务笔记本电脑Top 10排名
» Notebookcheck高端办公/商务笔记本电脑Top 10排名
» Notebookcheck工作站笔记本电脑Top 10排名
» Notebookcheck亚笔记本电脑Top 10排名
» Notebookcheck超级本产品Top 10排名
» Notebookcheck变形本产品Top 10排名
» Notebookcheck平板电脑Top 10排名
» Notebookcheck智能手机Top 10排名
» Notebookcheck评测过最出色的笔记本电脑屏幕
» Notebookcheck售价500欧元以下笔记本电脑Top 10排名
» Notebookcheck售价300欧元以下笔记本电脑Top 10排名