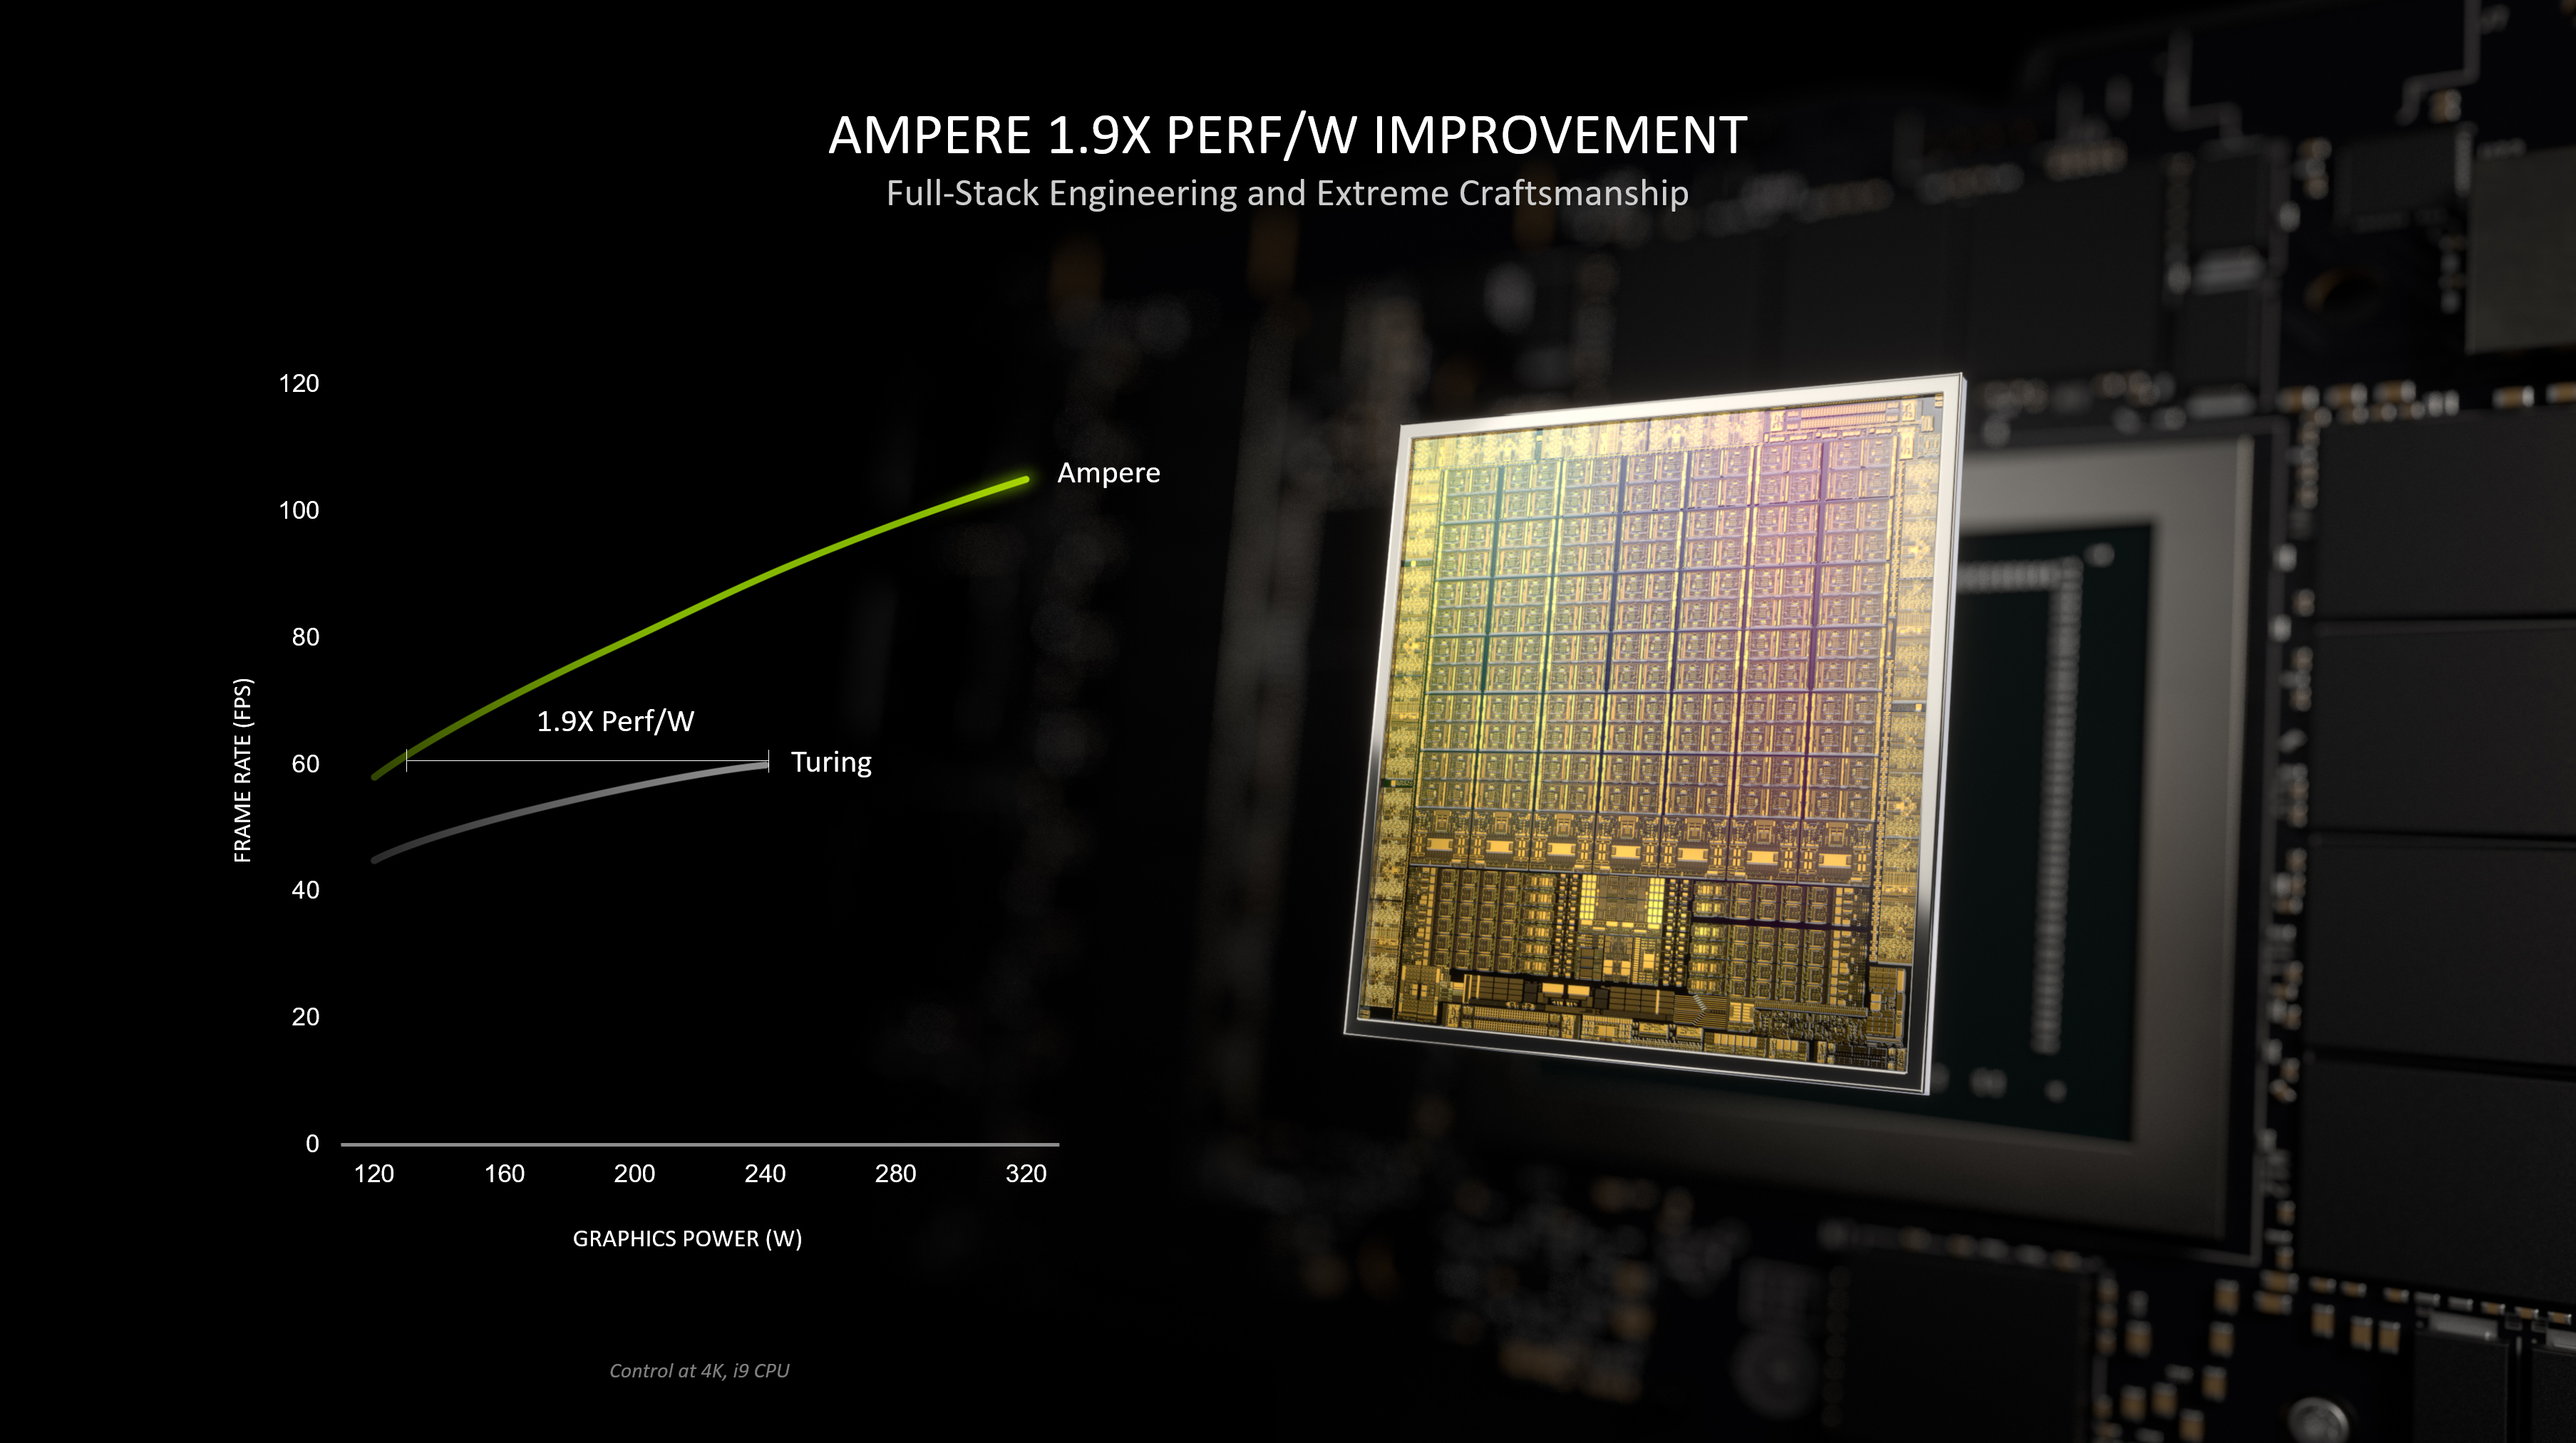
Notebook reviews with NVIDIA GeForce RTX 3050 Ti Laptop GPU graphics card
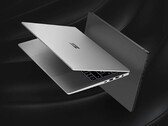
华硕VivoBook Pro 16回顾:一台拥有Core i7、RTX 3050 Ti和DCI-P3的多媒体笔记本电脑
VivoBook并没有完全配备最新的硬件(Alder Lake、Ampere),但它确实因其他原因而得分:华硕笔记本电脑有一个明亮的16英寸屏幕(2,560 x 1,600像素),采用16:10格式,具有很高的刷新率(120赫兹)和很好的色彩空间覆盖(DCI-P3)。
Intel Core i7-12700H, NVIDIA GeForce RTX 3050 Ti Laptop GPU, 16", 1.9 kg惠普Victus 15笔记本电脑回顾。昂贵的预算游戏玩家
Victus 15应该是Omen系列的一个钱包友好型替代品,但是它的零售价很高,为1200美元的入门级GPU,其性能几乎与两年前的GTX 1660 Ti相同,走了一条细线。
Intel Core i7-12700H, NVIDIA GeForce RTX 3050 Ti Laptop GPU, 15.6", 2.3 kg微星Prestige 15笔记本电脑评测。炫目的4K图像质量,坚实的性能
微星的Creator笔记本将杰出的图像价值与一个高效和强大的处理器以及一个实现了光线追踪的独立图形芯片相结合。这种组合似乎特别适合在更高层次上进行图像编辑/处理。
Intel Core i7-1280P, NVIDIA GeForce RTX 3050 Ti Laptop GPU, 15.6", 1.8 kg申科Vision 14笔记本电脑评测--大规模的酷睿i7-12700H性能升级
考虑到低重量,即使是Tiger Lake Schenker Vision 14,配备GeForce RTX 3050 Ti GPU的14英寸笔记本电脑也是非常强大的,通过这一代的Alder Lake Core i7-12700H升级,得到了巨大的提升。此外,电池尺寸也得到了增加,运行时间明显改善。
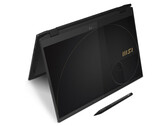
Intel Core i7-12700H, NVIDIA GeForce RTX 3050 Ti Laptop GPU, 14", 1.3 kg微星Summit E16 Flip回顾。带笔、16:10显示屏和RTX 3050 Ti的二合一笔记本电脑
Summit E16 Flip提供了一个16英寸的触摸屏,采用更适合办公的16:10格式,雷电4,以及一个专用的GeForce RTX 3050 Ti Laptop GPU。触摸屏可以用手指或附带的微星输入笔操作。
Intel Core i7-1280P, NVIDIA GeForce RTX 3050 Ti Laptop GPU, 16", 1.9 kgLenovo IdeaPad Gaming 3 15IAH7: Intel Core i5-12500H, 15.60", 2.4 kg
Review » 联想IdeaPad Gaming 3 15IAH7回顾。最强大的RTX 3050 Ti笔记本电脑之一
HP Pavilion Gaming 17-cd2146ng: Intel Core i5-11300H, 17.30", 2.8 kg
Review » 惠普Pavilion Gaming 17笔记本电脑评测。一个好的显示器,一个预算价格
Dell Inspiron 16 Plus 7620: Intel Core i7-12700H, 16.00", 2.1 kg
Review » 戴尔Inspiron 16 Plus 7620评论。具备所有功能的多媒体笔记本电脑
Dell XPS 15 9520 RTX 3050 Ti: Intel Core i7-12700H, 15.60", 1.9 kg
Review » 2022年戴尔XPS 15 9520 3.5K OLED笔记本电脑回顾。跳过或购买?
HP Victus 16-e0145ng: AMD Ryzen 5 5600H, 16.10", 2.4 kg
Review » 惠普Victus 16回顾。配备AMD CPU和Nvidia GPU的经济实惠的游戏笔记本电脑
Asus Zenbook Pro 15 OLED UM535Q: AMD Ryzen 9 5900HX, 15.60", 1.9 kg
Review » 华硕Zenbook Pro 15 OLED UM535Q笔记本电脑回顾。就像一个由AMD驱动的XPS 15
Dell G15 5510-43NHT: Intel Core i5-10200H, 15.60", 2.5 kg
Review » 戴尔G15 5510笔记本电脑回顾。经济型120赫兹游戏笔记本面对AMD的同行
Lenovo ThinkBook 15p G2 ITH 21B1000YGE: Intel Core i7-11800H, 15.60", 1.9 kg
Review » 联想ThinkBook 15p G2。测试带RTX和4K的创作者笔记本
Lenovo Ideapad Gaming 3 15IHU-82K1002RGE: Intel Core i5-11300H, 15.60", 2 kg
Review » 联想IdeaPad Gaming 3i 15 G6笔记本电脑评论。显示效果不佳的预算型游戏笔记本
Microsoft Surface Laptop Studio i7 RTX 3050 Ti: Intel Core i7-11370H, 14.40", 1.8 kg
Review » 微软Surface Laptop Studio评论。有趣的概念与缓慢的英特尔CPU
Asus ROG Flow Z13 GZ301ZE: Intel Core i9-12900H, 13.40", 1.2 kg
Review » 华硕ROG Flow Z13的评论。配备强大的Alder Lake i9处理器的游戏平板电脑
Schenker Vision 14: Intel Core i7-11370H, 14.00", 1.1 kg
Review » Schenker Vision 14笔记本电脑回顾。现在还可以使用GeForce RTX 3050 Ti
Asus Vivobook Pro 16X-M7600QE: AMD Ryzen 9 5900HX, 16.10", 1.9 kg
Review » 华硕Vivobook Pro 16X的预生产单位审查。性能、耐力和强大的OLED显示屏
Lenovo ThinkPad X1 Extreme G4-20Y5CTO1WW (3050 Ti): Intel Core i7-11800H, 16.00", 2 kg
Review » 联想ThinkPad X1 Extreme第四代笔记本电脑评测。带16:10触摸屏的高性能旗舰机
Dell G15 5515: AMD Ryzen 7 5800H, 15.60", 2.4 kg
Review » 戴尔G15 5515 Ryzen版回顾。一款经济实惠的FHD游戏笔记本
Asus Zephyrus G14 GA401QEC: AMD Ryzen 9 5900HS, 14.00", 1.7 kg
Review » 华硕Zephyrus G14 GA401Q评测。阿兰-沃克特别版14英寸游戏笔记本
Schenker XMG Focus 17: Intel Core i7-11800H, 17.30", 2.5 kg
Review » XMG Focus 17 (Clevo NP70HK)笔记本电脑回顾。配备RTX 3050 Ti的中档游戏笔记本
Schenker XMG Focus 15: Intel Core i7-11800H, 15.60", 1.9 kg
Review » XMG Focus 15 (Clevo NP50HK)游戏笔记本回顾。RTX 3050 Ti的极限
Dell G15 5515: AMD Ryzen 7 5800H, 15.60", 2.4 kg
External Review » Dell G15 5515
HP Victus 16-e1000ax: AMD Ryzen 5 6600H, 16.10", 2.4 kg
External Review » HP Victus 16-e1000ax
HP Victus 16-e0145ng: AMD Ryzen 5 5600H, 16.10", 2.4 kg
External Review » HP Victus 16-e0145ng
HP Victus 16-d1008ns: Intel Core i5-12500H, 16.10", 2.5 kg
External Review » HP Victus 16-d1008ns
HP Victus 16-d1018ns: Intel Core i5-12500H, 16.10", 2.5 kg
External Review » HP Victus 16-d1018ns
Acer Aspire 7 A715-51G-51BY: Intel Core i5-1240P, 15.60", 2.1 kg
External Review » Acer Aspire 7 A715-51G-51BY
HP Victus 16-d1023ns: Intel Core i7-12700H, 16.10", 2.5 kg
External Review » HP Victus 16-d1023ns
HP Omen 16-c0025ns: AMD Ryzen 7 5800H, 16.10", 2.3 kg
External Review » HP Omen 16-c0025ns
Acer Nitro 5 AN515-58-7365: Intel Core i7-12700H, 15.60", 2.5 kg
External Review » Acer Nitro 5 AN515-58-7365
Asus VivoBook Pro 16: Intel Core i7-12700H, 16.00", 1.9 kg
External Review » Asus VivoBook Pro 16 K6602ZE-KV040W
MSI Katana GF66 12UD-436: Intel Core i7-12650H, 15.60", 2.3 kg
External Review » MSI Katana GF66 12UD-436
Acer Aspire 7 A715-43G-R83Y: AMD Ryzen 7 5825U, 15.60", 2.2 kg
External Review » Acer Aspire 7 A715-43G-R83Y
MSI Sword 17 A12UD: Intel Core i7-12700H, 17.30", 2.6 kg
External Review » MSI Sword 17 A12UD
LG UltraPC 17, i7-1260P RTX 3050 Ti: Intel Core i7-1260P, 17.00", 2 kg
External Review » LG UltraPC 17, i7-1260P RTX 3050 Ti
Asus ZenBook Pro 15 UM535QE, R7 5800H: AMD Ryzen 7 5800H, 15.60", 2 kg
External Review » Asus ZenBook Pro 15 UM535QE, R7 5800H
Dell G15 5520, i5-12500H RTX 3050 Ti: Intel Core i5-12500H, 15.60", 2.7 kg
External Review » Dell G15 5520, i5-12500H RTX 3050 Ti
Asus TUF Gaming A17 FA707RE-HX030W: AMD Ryzen 7 6800H, 17.30", 2.6 kg
External Review » Asus TUF Gaming A17 FA707RE-HX030W
Acer Swift X SFX14-42G-R607: AMD Ryzen 7 5825U, 14.00", 1.4 kg
External Review » Acer Swift X SFX14-42G-R607
MSI Katana GF66 12UD-064FR: Intel Core i7-12700H, 15.60", 2.3 kg
External Review » MSI Katana GF66 12UD-064FR
Asus Vivobook Pro 14X N7401ZE: Intel Core i7-12700H, 14.50", 1.7 kg
External Review » Asus Vivobook Pro 14X N7401ZE
Asus VivoBook Pro 16X M7600RE: AMD Ryzen 9 6900HX, 16.00", 2 kg
External Review » Asus VivoBook Pro 16X M7600RE
HP Victus 16-d1027ns: Intel Core i7-12700H, 16.10", 2.5 kg
External Review » HP Victus 16-d1027ns
HP Omen 16-n0000ns: AMD Ryzen 7 6800H, 16.10", 2.3 kg
External Review » HP Omen 16-n0000ns
Dell G15 5520, i7-12700H RTX 3050 Ti: Intel Core i7-12700H, 15.60", 2.7 kg
External Review » Dell G15 5520, i7-12700H RTX 3050 Ti
Lenovo Legion 5 15IAH7-82RC004JGE: Intel Core i5-12500H, 15.60", 2.4 kg
External Review » Lenovo Legion 5 15IAH7-82RC004JGE
Lenovo Ideapad Gaming 3 15ARH7-82SB0073GE: AMD Ryzen 7 6800H, 15.60", 2.3 kg
External Review » Lenovo Ideapad Gaming 3 15ARH7-82SB0073GE
HP Victus 16-e0091ns: AMD Ryzen 5 5600H, 16.10", 2.5 kg
External Review » HP Victus 16-e0091ns
Lenovo IdeaPad Gaming 3 15IAH7-82S90075SP: Intel Core i5-12500H, 15.60", 2.3 kg
External Review » Lenovo IdeaPad Gaming 3 15IAH7-82S90075SP
Lenovo IdeaPad Gaming 3 15IAH7, i7-12700H RTX 3050 Ti: Intel Core i7-12700H, 15.60", 2.3 kg
External Review » Lenovo IdeaPad Gaming 3 15IAH7, i7-12700H RTX 3050 Ti
Alienware x14, i7-12700H 3050 Ti: Intel Core i7-12700H, 14.00", 1.8 kg
External Review » Alienware x14, i7-12700H 3050 Ti
Dell Inspiron 16 Plus 7620: Intel Core i7-12700H, 16.00", 2.1 kg
External Review » Dell Inspiron 16 Plus 7620
HP Omen 16-c0027ns: AMD Ryzen 7 5800H, 16.10", 2.3 kg
External Review » HP Omen 16-c0027ns
HP Victus 16-e0093ns: AMD Ryzen 7 5800H, 16.10", 2.5 kg
External Review » HP Victus 16-e0093ns
HP Victus 15-fb0012AX: AMD Ryzen 7 5800H, 15.60", 2.3 kg
External Review » HP Victus 15-fb0012AX
HP Victus 16-e1085cl: AMD Ryzen 7 6800H, 16.10", 2.5 kg
External Review » HP Victus 16-e1085cl
MSI Thin GF63 11UD: Intel Core i7-11800H, 15.60", 1.9 kg
External Review » MSI Thin GF63 11UD
Acer Predator Triton 300 PT315-53-54XN: Intel Core i5-11400H, 15.60", 2.1 kg
External Review » Acer Predator Triton 300 PT315-53-54XN
HP Victus 15-fb0028n: AMD Ryzen 7 5800H, 15.60", 2.3 kg
External Review » HP Victus 15-fb0028n
MSI Summit E16 Flip A12UDT-031: Intel Core i7-1280P, 16.00", 1.9 kg
External Review » MSI Summit E16 Flip A12UDT-031
MSI Prestige 15 A12UD-049ES: Intel Core i7-1280P, 15.60", 1.7 kg
External Review » MSI Prestige 15 A12UD-049ES
Dell XPS 15 9520, i9-12900H 3050 Ti: Intel Core i9-12900H, 15.60", 1.9 kg
External Review » Dell XPS 15 9520, i9-12900H 3050 Ti
Dell Vostro 16 7620, i7-12700H RTX 3050 Ti: Intel Core i7-12700H, 16.00", 2 kg
External Review » Dell Vostro 16 7620, i7-12700H RTX 3050 Ti
Lenovo IdeaPad Gaming 3 15IAH7, i7-12650H RTX 3050 Ti: Intel Core i7-12650H, 15.60", 2.3 kg
External Review » Lenovo IdeaPad Gaming 3 15IAH7, i7-12650H RTX 3050 Ti
Asus ROG Strix G17 G713IC-HX011: AMD Ryzen 7 4800H, 17.30", 2.4 kg
External Review » Asus ROG Strix G17 G713IC-HX011
HP Omen 16-c0615nd: AMD Ryzen 7 5800H, 16.10", 2.3 kg
External Review » HP Omen 16-c0615nd
Acer Nitro 5 AN515-57-505V: Intel Core i5-11400H, 15.60", 2.2 kg
External Review » Acer Nitro 5 AN515-57-505V
Alienware m15 R7, i7-12700H RTX 3050 Ti: Intel Core i7-12700H, 15.60", 2.4 kg
External Review » Alienware m15 R7, i7-12700H RTX 3050 Ti
Asus TUF Dash F15 FX517ZE-HN044W: Intel Core i5-12450H, 15.60", 2 kg
External Review » Asus TUF Dash F15 FX517ZE-HN044W
Acer Nitro 5 AN515-58-NH.QFKEK.001: Intel Core i5-12500H, 15.60", 2.5 kg
External Review » Acer Nitro 5 AN515-58-NH.QFKEK.001
Acer Predator Helios 300 PH315-54 NH.QC5EP.00A: Intel Core i5-11400H, 15.60", 2.2 kg
External Review » Acer Predator Helios 300 PH315-54 NH.QC5EP.00A
Asus ROG Zephyrus G15 GA503QE: AMD Ryzen 9 5900HS, 15.60", 1.9 kg
External Review » Asus ROG Zephyrus G15 GA503QE
Acer Predator Helios 300 PH315-54-582Q: Intel Core i5-11400H, 15.60", 2.9 kg
External Review » Acer Predator Helios 300 PH315-54-582Q
Asus TUF Gaming F15 FX506HE-HN012: Intel Core i5-11400H, 15.60", 2.3 kg
External Review » Asus TUF Gaming F15 FX506HE-HN012
Asus ZenBook Pro 14 Duo UX8402ZE-M3075W: Intel Core i7-12700H, 14.00", 1.8 kg
External Review » Asus ZenBook Pro 14 Duo UX8402ZE-M3075W
MSI Summit E16 Flip A12UDT-006: Intel Core i7-1260P, 16.00", 1.9 kg
External Review » MSI Summit E14 Flip Evo A12MT-016
HP Victus 16-e0090ns: AMD Ryzen 7 5800H, 16.10", 2.5 kg
External Review » HP Victus 16-e0090ns
Asus TUF Dash F15 FX517ZE: Intel Core i7-12650H, 15.60", 2 kg
External Review » Asus TUF Dash F15 FX517ZE
Asus Zenbook Pro 14 Duo UX8402ZE-M3030W: Intel Core i9-12900H, 14.50", 1.8 kg
External Review » Asus Zenbook Pro Duo 14 UX8402ZE-M3030W
MSI Prestige 15 A12UD-093: Intel Core i7-1280P, 15.60", 1.8 kg
External Review » MSI Prestige 15 A12UD-093
Dell XPS 15 9520 RTX 3050 Ti: Intel Core i7-12700H, 15.60", 1.9 kg
External Review » Dell XPS 15 9520 RTX 3050 Ti
MSI Katana GF66 12UD-251: Intel Core i7-12700H, 15.60", 2.3 kg
External Review » MSI Katana GF66 12UD-251
Lenovo Legion S7 15ACH6-82K8002YGE: AMD Ryzen 7 5800H, 15.60", 1.9 kg
External Review » Lenovo Legion S7 15ACH6-82K8002YGE
MSI Creator M16 A12UD-283: Intel Core i7-12700H, 16.00", 2.3 kg
External Review » MSI Creator M16 A12UD-283
MSI Katana GF76 12UD-041: Intel Core i7-12700H, 17.30", 2.6 kg
External Review » MSI Katana GF76 12UD-041
Asus ROG Flow X13 GV301RE-LJ096W: AMD Ryzen 9 6900HS, 13.40", 1.3 kg
External Review » Asus ROG Flow X13 GV301RE-LJ096W
Acer Nitro 5 AN515-58-77YB: Intel Core i7-12700H, 15.60", 2.5 kg
External Review » Acer Nitro 5 AN515-58-77YB
Asus ROG Flow X13 GV301RE-LI134W: AMD Ryzen 7 6800HS, 13.40", 1.3 kg
External Review » Asus ROG Flow X13 GV301RE-LI134W
MSI Katana GF66 11UD-1222PL: Intel Core i5-11400H, 15.60", 2.1 kg
External Review » MSI Katana GF66 11UD-1222PL
MSI Katana GF66 11UD-480XUA: Intel Core i5-11400H, 15.60", 2.1 kg
External Review » MSI Katana GF66 11UD-480XUA
Acer Swift X SFX14-51G-79RJ: Intel Core i7-1260P, 14.00", 1.4 kg
External Review » Acer Swift X SFX14-51G-79RJ
HP Omen 16-c0010ca: AMD Ryzen 7 5800H, 16.10", 2.3 kg
External Review » HP Omen 16-c0010ca
HP Omen 16-b0352TX: Intel Core i7-11800H, 16.00", 2.3 kg
External Review » HP Omen 16-b0352TX
Lenovo ThinkPad X1 Extreme G4-20Y5001NGE: Intel Core i7-11800H, 16.00", 1.9 kg
External Review » Lenovo ThinkPad X1 Extreme G4-20Y5001NGE
HP Envy 15-ep1074ng: Intel Core i7-11800H, 15.60", 2.2 kg
External Review » HP Envy 15-ep1074ng
Lenovo ThinkBook 15p G2 ITH 21B1000YGE: Intel Core i7-11800H, 15.60", 1.9 kg
External Review » Lenovo ThinkBook 15p G2 ITH 21B1000YGE
Asus Zenbook Pro 15 OLED UM535Q: AMD Ryzen 9 5900HX, 15.60", 1.9 kg
External Review » Asus Zenbook Pro 15 OLED UM535Q
Acer Swift X SFX14-41G-R1GH: AMD Ryzen 7 5800U, 14.00", 1.5 kg
External Review » Acer Swift X SFX14-41G-R1GH
Microsoft Surface Laptop Studio i7 RTX 3050 Ti: Intel Core i7-11370H, 14.40", 1.8 kg
External Review » Microsoft Surface Laptop Studio i7 RTX 3050 Ti
HP Pavilion Gaming 15-dk2070ng: Intel Core i7-11370H, 15.60", 2.3 kg
External Review » HP Pavilion Gaming 15-dk2070ng
Asus ROG Zephyrus G14 GA401QE-HZ047: AMD Ryzen 9 5900HS, 14.00", 1.6 kg
External Review » Asus ROG Zephyrus G14 GA401QE-HZ047
Asus ROG Strix G17 G713IE-HX011: AMD Ryzen 7 4800H, 17.30", 2.7 kg
External Review » Asus ROG Strix G17 G713IE-HX011
Samsung Galaxy Book Odyssey 15 NP762XDA-XA1US: Intel Core i7-11600H, 15.60", 1.9 kg
External Review » Samsung Galaxy Book Odyssey 15 NP762XDA-XA1US
Asus ROG Flow Z13 GZ301ZE: Intel Core i9-12900H, 13.40", 1.2 kg
External Review » Asus ROG Flow Z13 GZ301ZE
Lenovo Legion 5 15ITH6, i7-11600H RTX 3050 Ti: Intel Core i7-11600H, 15.60", 2.4 kg
External Review » Lenovo Legion 5 15ITH6, i7-11600H RTX 3050 Ti
HP Victus 16-d0065ng: Intel Core i7-11800H, 16.10", 2.5 kg
External Review » HP Victus 16-d0065ng
Asus ROG Strix G15 G513IE-HN004W: AMD Ryzen 7 4800H, 15.60", 2.3 kg
External Review » Asus ROG Strix G15 G513IE-HN004W
MSI Sword 15 A11UD: Intel Core i7-11800H, 15.60", 2.3 kg
External Review » MSI Sword 15 A11UD
Acer Nitro 5 AN517-54-79L1: Intel Core i7-11800H, 17.30", 2.7 kg
External Review » Acer Nitro 5 AN517-54-79L1
Asus VivoBook Pro 15 M3500-L1179T: AMD Ryzen 9 5900HX, 15.60", 1.7 kg
External Review » Asus VivoBook Pro 15 M3500-L1179T
Asus TUF Gaming F15 FX506HCB-HN243T: Intel Core i5-11400H, 15.60", 2.3 kg
External Review » Asus TUF Gaming F15 FX506HCB-HN243T
Dell G15 5511-RNGVW: Intel Core i7-11800H, 15.60", 2.8 kg
External Review » Dell G15 5511-RNGVW
Dell G15 5515-2CMCX: AMD Ryzen 7 5800H, 15.60", 2.8 kg
External Review » Dell G15 5515-2CMCX
Tuxedo InfinityBook Pro 14 Gen6, 11370H 3K: Intel Core i7-11370H, 14.00", 1 kg
External Review » Tuxedo InfinityBook Pro 14 Gen6, 11370H 2K
Asus Vivobook Pro 16X-M7600QE: AMD Ryzen 9 5900HX, 16.10", 1.9 kg
External Review » Asus Vivobook Pro 16X-M7600QE
HP Victus 16-d0367ng: Intel Core i5-11400H, 16.10", 2.5 kg
External Review » HP Victus 16-d0367ng
Dell G15 5515, 5600H RTX 3050 Ti: AMD Ryzen 5 5600H, 15.60", 2.6 kg
External Review » Dell G15 5515, 5600H RTX 3050 Ti
Lenovo Legion S7 15ACH6-82K8CTO1WW: AMD Ryzen 5 5600H, 15.60", 1.9 kg
External Review » Lenovo Legion S7 15ACH6-82K8CTO1WW
Acer Swift X SFX16-51G-76HE: Intel Core i7-11390H, 16.00", 1.8 kg
External Review » Acer Swift X SFX16-51G-76HE
Acer ConceptD 3 Ezel CC315-73G-74TT: Intel Core i7-11800H, 15.60", 2.2 kg
External Review » Acer ConceptD 3 Ezel CC315-73G-74TT
Asus Vivobook Pro 14X M7400, 5800H 3050 Ti: AMD Ryzen 7 5800H, 14.00", 1.5 kg
External Review » Asus Vivobook Pro 14X M7400, 5800H 3050 Ti
Lenovo Legion 5 15ITH6, i7-11800H 3050 Ti: Intel Core i7-11800H, 15.60", 2.4 kg
External Review » Lenovo Legion 5 15ITH6, i7-11800H 3050 Ti
Dell XPS 15 9510, 11900H RTX 3050 Ti OLED: Intel Core i9-11900H, 15.60", 2 kg
External Review » Dell XPS 15 9510, 11900H RTX 3050 Ti OLED
Acer Nitro 5 AN517-54-77KG: Intel Core i7-11800H, 17.30", 2.7 kg
External Review » Acer Nitro 5 AN517-54-77KG
HP Victus 16-e0076ng: AMD Ryzen 7 5800H, 16.10", 2.5 kg
External Review » HP Victus 16-e0076ng
Asus ROG Zephyrus G14 GA401QE-HZ055T: AMD Ryzen 7 5800HS, 14.00", 1.7 kg
External Review » Asus ROG Zephyrus G14 GA401QE-HZ055T
Microsoft Surface Laptop Studio, i7-11370H RTX 3050 Ti: Intel Core i7-11370H, 14.40", 1.8 kg
External Review » Microsoft Surface Laptop Studio, i7-11370H RTX 3050 Ti
Gigabyte G5 MD-51US123SH: Intel Core i5-11400H, 15.60", 2.2 kg
External Review » Gigabyte G5 MD-51US123SH
MSI GF75 Thin 10UD: Intel Core i7-10750H, 17.30", 2.2 kg
External Review » MSI GF75 Thin 10UD
MSI Katana GF66 11UD-836XFR: Intel Core i5-11400H, 15.60", 2.1 kg
External Review » MSI Katana GF66 11UD-836XFR
Asus Vivobook Pro 14X M7400, 5900HX 3050 Ti: AMD Ryzen 9 5900HX, 14.00", 1.5 kg
External Review » Asus Vivobook Pro 14X M7400, 5900HX 3050 Ti
Acer Nitro 5 AN515-57-796N: Intel Core i7-11800H, 15.60", 2.3 kg
External Review » Acer Nitro 5 AN515-57-796N
Asus Vivobook Pro 16X M7600, 5900HX 3050 Ti: AMD Ryzen 9 5900HX, 16.00", 2 kg
External Review » Asus Vivobook Pro 16X M7600, 5900HX 3050 Ti
Acer Swift X SFX14-41G-R1S6: AMD Ryzen 7 5800U, 14.00", 1.5 kg
External Review » Acer Swift X SFX14-41G-R1S6
MSI Katana GF66 11UD-092: Intel Core i7-11800H, 15.60", 2.1 kg
External Review » MSI Katana GF66 11UD-092
MSI Pulse GL66 11UDK: Intel Core i7-11800H, 15.60", 2.3 kg
External Review » MSI Pulse GL66 11UDK
MSI Pulse GL76 11UDK: Intel Core i7-11800H, 17.30", 2.3 kg
External Review » MSI Pulse GL76 11UDK
Dell XPS 15 9510, 11800H RTX 3050 Ti FHD: Intel Core i7-11800H, 15.60", 2 kg
External Review » Dell XPS 15 9510, 11800H RTX 3050 Ti FHD
Dell XPS 15 9510 11800H RTX 3050 Ti OLED: Intel Core i7-11800H, 15.60", 1.9 kg
External Review » Dell XPS 15 9510 11800H RTX 3050 Ti OLED
Asus Zephyrus G14 GA401QEC: AMD Ryzen 9 5900HS, 14.00", 1.7 kg
External Review » Asus Zephyrus G14 GA401Q - Alan Walker Special Edition
Lenovo Legion 5 15ACH6H-82JW0012US: AMD Ryzen 7 5800H, 15.60", 2.4 kg
External Review » Lenovo Legion 5 15ACH6H-82JW0012US
Asus TUF Dash F15 TUF516PE-AB73: Intel Core i7-11370H, 15.60", 2 kg
External Review » Asus TUF Dash F15 TUF516PE-AB73
Asus ROG Flow X13 GV301QE-K6149T: AMD Ryzen 9 5900HS, 13.40", 1.3 kg
External Review » Asus ROG Flow X13 GV301QE-K6149T
Asus ROG Strix G17 G713QE-RB74: AMD Ryzen 7 5800H, 17.30", 2.5 kg
External Review » Asus ROG Strix G17 G713QE-RB74
MSI Katana GF76 11UD-050: Intel Core i7-11800H, 17.30", 2.3 kg
External Review » MSI Katana GF76 11UD-050
Asus TUF Gaming F15 TUF506HE-DS74: Intel Core i7-11800H, 15.60", 2.3 kg
External Review » Asus TUF Gaming F15 TUF506HE-DS74
Asus TUF Dash F15 FX516PE-HN006T: Intel Core i7-11370H, 15.60", 2 kg
External Review » Asus TUF Dash F15 FX516P-EHN006T
Dell G15 5510, i5-10200H RTX 3050 Ti: Intel Core i5-10200H, 15.60", 2.7 kg
External Review » Dell G15 5510, i5-10200H RTX 3050 Ti
Acer Swift X SFX14-41G-R4VH: AMD Ryzen 7 5800U, 14.00", 1.4 kg
External Review » Acer Swift X SFX14-41G-R4VH