


Honor MagicBook Pro 14 2026 笔记本电脑评测--采用豹湖技术的 OLED 全能型笔记本电脑令人印象深刻
全新的Honor MagicBook Pro 14 2026 配备了英特尔全新的 Panther Lake 芯片和强大的 iGPU。此外,它还拥有 120 Hz 的 OLED 触摸屏和超长的电池续航时间。
Intel Core Ultra 5 338H, Arc B370 Panther Lake iGPU, 14.6", 1.4 kg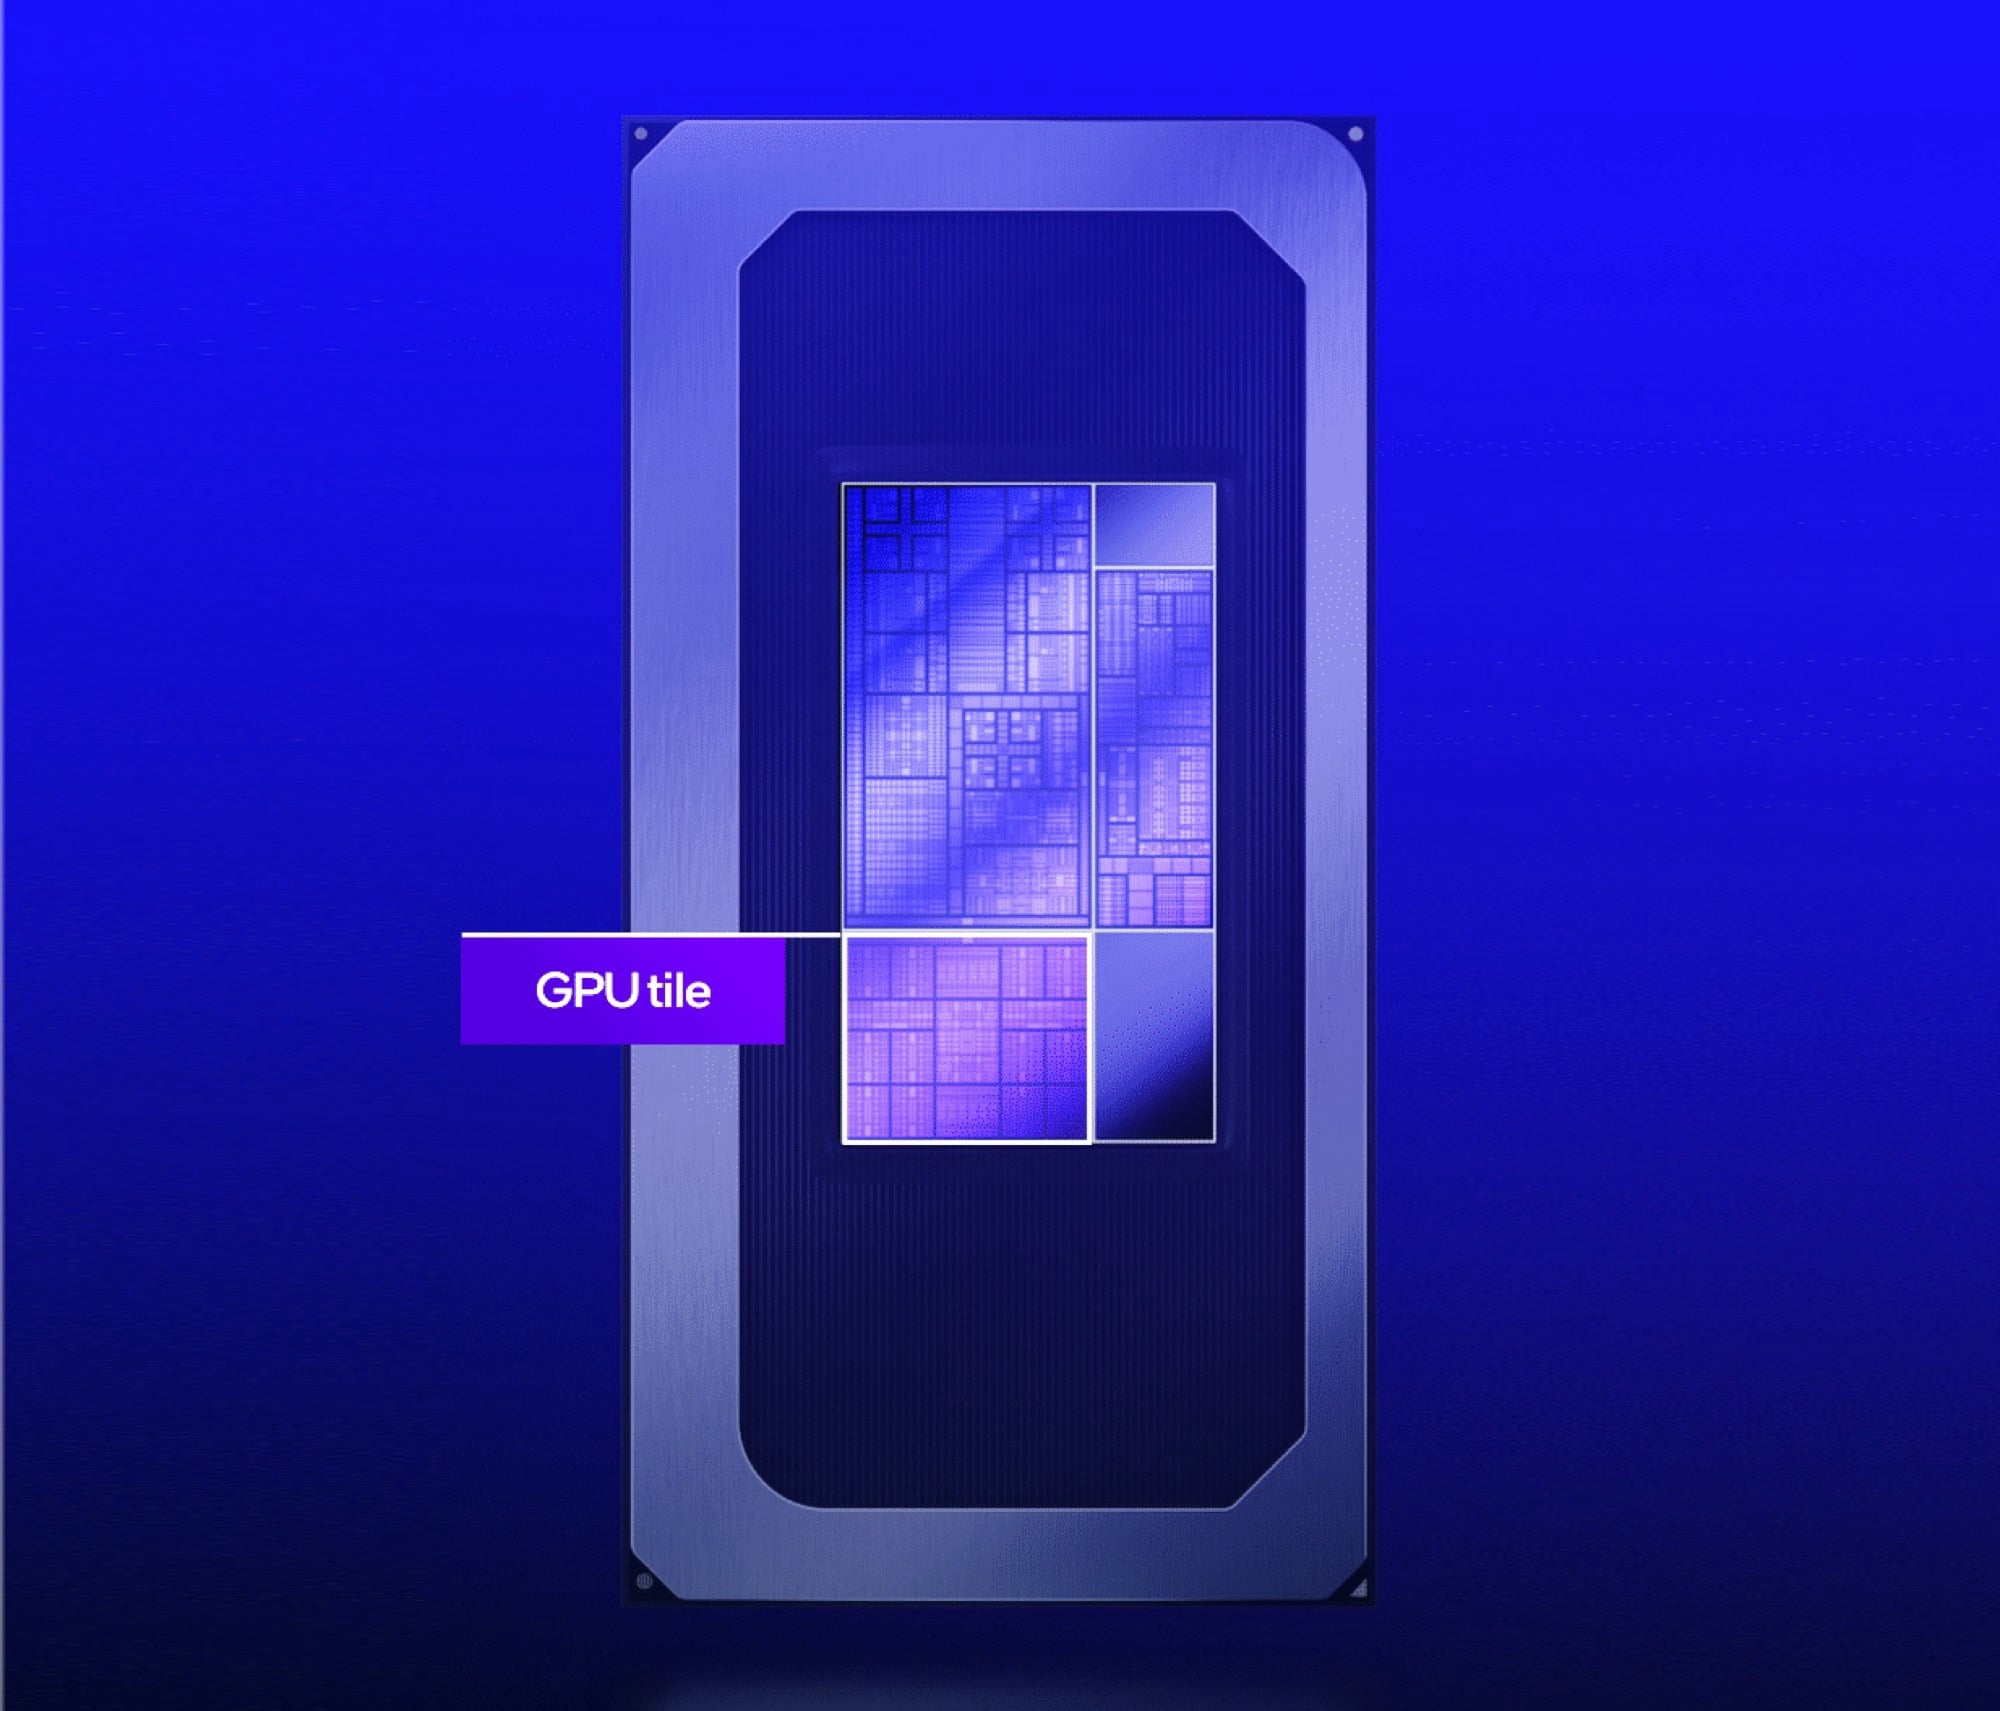
配备 10 个 Xe3-LPG 内核的英特尔 Arc B370(或 Arc Pro B370)Panther Lake iGPU 是英特尔 Panther Lake SoC 系列中速度第二快的集成图形处理器,在 12 个 Xe3 内核中最多可配备 10 个。10 个 Xe3 内核相当于 80 个 EU 和 1280 个 ALU,还包括 10 个光线追踪内核。所有内核均可访问 16 MB 二级缓存。
性能明显高于较早的 英特尔 Arc 140T的性能,但仍明显低于 Arc B390 Arc B390例如,它在 3DMarkFire Strike 中比 Arc B390 快 14%。在我们使用 MagicBook Pro 14 进行的测试中,要求极高的《刺客信条:暗影》几乎玩不了。 Honor MagicBook Pro 14.不过,即使在中高细节设置下,《ARC Raiders》、《使命召唤 BO7》和《F1 25》也能流畅运行(请参阅下面的基准测试)。
新的媒体引擎现在支持 AV1 编解码、VVC 解码、AVC 10 位和 eDP 1.5。iGPU 通过双通道内存控制器支持快速 LPDDR5-9600(最大 96 GB)或 DDR5-7200(最大 128 GB)。
芯片采用现代 N3E 工艺在台积电制造。
Arc Xe3 Series
| |||||||||||||
| Codename | Panther Lake iGPU | ||||||||||||
| Architecture | Xe3 | ||||||||||||
| iGPU | Integrated Graphics | ||||||||||||
| Pipelines | 80 - unified | ||||||||||||
| Raytracing Cores | 12 | ||||||||||||
| Core Speed | 2400 (Boost) MHz | ||||||||||||
| AI GPU | 98 TOPS INT8 | ||||||||||||
| Cache | L1: 640 KB, L2: 16 MB | ||||||||||||
| Shared Memory | no | ||||||||||||
| API | DirectX 12_2, OpenGL 4.6, OpenCL 3.0 | ||||||||||||
| Man. Technology | 3 nm | ||||||||||||
| Displays | 4 Displays (max.), HDMI 2.1 FRL, DisplayPort 2.1 UHBR20 | ||||||||||||
| Date of Announcement | 05.01.2026 | ||||||||||||
| Link to Manufacturer Page | www.intel.com | ||||||||||||
| ||||||||||||||||
The following benchmarks stem from our benchmarks of review laptops. The performance depends on the used graphics memory, clock rate, processor, system settings, drivers, and operating systems. So the results don't have to be representative for all laptops with this GPU. For detailed information on the benchmark results, click on the fps number.


| low | med. | high | ultra | QHD | 4K | |
|---|---|---|---|---|---|---|
| Call of Duty Black Ops 7 | 77 | 72 | 56 | 20 | ||
| Anno 117: Pax Romana | 48.4 | 35.5 | 25.8 | 14.3 | ||
| ARC Raiders | 104.9 | 52.3 | 39.1 | 21.4 | ||
| F1 25 | 133.3 | 111.2 | 84.9 | |||
| Assassin's Creed Shadows | 32 | 31 | 26 | 18 | ||
| F1 24 | 137.9 | 130.9 | 97.6 | 33.6 | 22 | |
| Cyberpunk 2077 | 72.7 | 57.7 | 49.6 | 43.5 | 22.8 | |
| Baldur's Gate 3 | 60.8 | 47.3 | 41.8 | 40.6 | 28.8 | |
| Strange Brigade | 356 | 126.8 | 105.8 | 92.6 | 68.8 | |
| X-Plane 11.11 | 62.5 | 52.2 | 45.1 | |||
| Final Fantasy XV Benchmark | 125.5 | 69.3 | 48.5 | 35.6 | ||
| Dota 2 Reborn | 126.7 | 98.6 | 103.7 | 104.8 | ||
| GTA V | 101.7 | 40.6 | 28 | |||
| low | med. | high | ultra | QHD | 4K | < 30 fps < 60 fps < 120 fps ≥ 120 fps | 2 5 5 | 6 4 2 | 2 6 5 | 4 4 2 | 4 1 1 | |
For more games that might be playable and a list of all games and graphics cards visit our Gaming List
Honor MagicBook Pro 14 2026: Intel Core Ultra 5 338H, 14.60", 1.4 kg
External Review » Honor MagicBook Pro 14 2026
» Honor MagicBook Pro 14 与Apple MacBook Pro 14 M5 - 谁是最佳多媒体笔记本电脑?
» HonorMagicBook Pro 14 是一款令人印象深刻的现代 OLED 触摸屏产品
» Honor MagicBook Pro 14 配备的英特尔新款 Arc B370 GPU 与戴尔 XPS 14 配备的 Arc B390 几乎一样快
Intel Core Ultra 5 338H Engineering Sample: Intel Core Ultra 5 338H
» 英特尔酷睿 5338H 和 Arc B370 基准测试 - 几乎与 Arc B390 一样快
» Comparison of GPUs
Detailed list of all laptop GPUs sorted by class and performance.
» Benchmark List
Sort and restrict laptop GPUs based on performance in synthetic benchmarks.
» Notebook Gaming List
Playable games for each graphics card and their average FPS results.
* Approximate position of the graphics adapter
» Notebookcheck多媒体笔记本电脑Top 10排名
» Notebookcheck游戏笔记本电脑Top 10排名
» Notebookcheck低价办公/商务笔记本电脑Top 10排名
» Notebookcheck高端办公/商务笔记本电脑Top 10排名
» Notebookcheck工作站笔记本电脑Top 10排名
» Notebookcheck亚笔记本电脑Top 10排名
» Notebookcheck超级本产品Top 10排名
» Notebookcheck变形本产品Top 10排名
» Notebookcheck平板电脑Top 10排名
» Notebookcheck智能手机Top 10排名
» Notebookcheck评测过最出色的笔记本电脑屏幕
» Notebookcheck售价500欧元以下笔记本电脑Top 10排名
» Notebookcheck售价300欧元以下笔记本电脑Top 10排名