

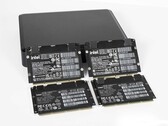
英特尔NUC Pro机箱元件评测--模块化裸机的多种用途
NUC pro机箱元件主要只是一个空壳,只有在计算元件的作用下才会有生命力。我们仔细观察了该设备,并分析了四个不同计算元素的性能。这些都依赖于英特尔最新版本的Alder Lake-U处理器。
Intel Core i7-1185G7, Iris Xe G7 96EUs
英特尔酷睿i7-1185G7是一款基于笔记本电脑和超极本的高能效四核SoC,基于2020年9月推出的Tiger Lake-U一代(UP4)。它集成了四个Willow Cove处理器内核(Hyper-C拥有8个线程,线程)。每个内核可以将rom的频率从3 GHz(基频)提高到4.8 GHz(单核睿频强)。全核可以达到4.3 GHz的频率。在发布时,i7-1185G7是该系列中最快的型号。
另一个新颖之处是基于全新Gen 12架构的集成Xe图形卡。与较旧的Iris Plus G7(Ice Lake)相比,它应该提供更高的性能。在i7-1185G7中,它使用96个EU,频率在400-1350 MHz之间。 GPU和CPU可以一起使用12 MB的L3缓存。
此外,Tiger Lake SoC增加了对PCIe 4的支持(四个通道),AI硬件加速以及芯片中Thunderbolt 4 / USB 4和Wi-Fi 6的部分集成。
该芯片采用英特尔改进的10nm +工艺(称为SuperFin)生产,应该可以与台积电(TSMC)的7nm工艺(例如Ryzen 4000系列)相媲美。
UP3系列的工作范围规定为12至28瓦。因此,该处理器也适用于轻薄笔记本电脑。
| Codename | Tiger Lake-UP3 | ||||||||||||||||||||||||||||||||
| Series | Intel Tiger Lake | ||||||||||||||||||||||||||||||||
Series: Tiger Lake Tiger Lake-UP3
| |||||||||||||||||||||||||||||||||
| Clock Rate | 3000 - 4800 MHz | ||||||||||||||||||||||||||||||||
| Level 1 Cache | 320 KB | ||||||||||||||||||||||||||||||||
| Level 2 Cache | 5 MB | ||||||||||||||||||||||||||||||||
| Level 3 Cache | 12 MB | ||||||||||||||||||||||||||||||||
| Number of Cores / Threads | 4 / 8 | ||||||||||||||||||||||||||||||||
| Power Consumption (TDP = Thermal Design Power) | 28 Watt | ||||||||||||||||||||||||||||||||
| Manufacturing Technology | 10 nm | ||||||||||||||||||||||||||||||||
| Max. Temperature | 100 °C | ||||||||||||||||||||||||||||||||
| Socket | BGA1449 | ||||||||||||||||||||||||||||||||
| Features | DDR4-3200/LPDDR4x-4266 RAM, PCIe 4, 4 GT/s bus, DL Boost, GNA, MMX, SSE, SSE2, SSE3, SSSE3, SSE4.1, SSE4.2, AVX, AVX2, AVX-512, BMI2, ABM, FMA, ADX, VMX, SMX, SMEP, SMAP, EIST, TM1, TM2, HT, Turbo, SST, AES-NI, RDRAND, RDSEED, SHA, TME | ||||||||||||||||||||||||||||||||
| GPU | Intel Iris Xe Graphics G7 96EUs (400 - 1350 MHz) | ||||||||||||||||||||||||||||||||
| 64 Bit | 64 Bit support | ||||||||||||||||||||||||||||||||
| Architecture | x86 | ||||||||||||||||||||||||||||||||
| Announcement Date | 09/02/2020 | ||||||||||||||||||||||||||||||||
| Product Link (external) | ark.intel.com | ||||||||||||||||||||||||||||||||
Microsoft Surface Pro 8, i7-1185G7: Intel Iris Xe Graphics G7 96EUs, 13.00", 0.9 kg
Review » 微软Surface Pro 8 Convertible评测。强大的,120赫兹和最终的Thunderbolt
Dell Latitude 15 9520 2-in-1: Intel Iris Xe Graphics G7 96EUs, 15.00", 1.7 kg
Review » 戴尔Latitude 15 9520二合一与Latitude 9510二合一:较新的不一定更好
Fujitsu LifeBook U9311X i7 LTE: Intel Iris Xe Graphics G7 96EUs, 13.30", 1 kg
Review » 富士通LifeBook U9311X评测--带LTE的1公斤商务敞篷车
HP EliteBook 840 Aero G8 3E4Q6AA: Intel Iris Xe Graphics G7 96EUs, 14.00", 1.2 kg
Review » HP EliteBook 840 Aero G8回顾。可能是我们见过的最安静的英特尔EVO笔记本电脑
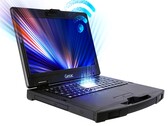
Panasonic Toughbook 40: Intel Iris Xe Graphics G7 96EUs, 14.00", 3.9 kg
External Review » Panasonic Toughbook 40
Acer TravelMate P6 TMP614P-52-724G: Intel Iris Xe Graphics G7 96EUs, 14.00", 1.2 kg
External Review » Acer TravelMate P6 TMP614P-52-724G
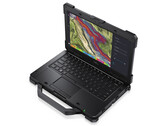
Dell Latitude 7330 Rugged Extreme: Intel Iris Xe Graphics G7 96EUs, 13.30", 2.7 kg
External Review » Dell Latitude 7330 Rugged Extreme
Dell Latitude 14 5430 Rugged, i7-1185G7: Intel Iris Xe Graphics G7 96EUs, 14.00", 2 kg
External Review » Dell Latitude 14 5430 Rugged, i7-1185G7
Dell Latitude 15 9520 2-in-1: Intel Iris Xe Graphics G7 96EUs, 15.00", 1.7 kg
External Review » Dell Latitude 15 9520 2-in-1
Dell Latitude 15 5520, i7-1185G7: Intel Iris Xe Graphics G7 96EUs, 15.60", 1.6 kg
External Review » Dell Latitude 15 5520, i7-1185G7
Dell XPS 13 9310 Core i7 4K: Intel Iris Xe Graphics G7 96EUs, 13.40", 1.3 kg
External Review » Dell XPS 13 9310 Core i7 4K
Microsoft Surface Pro 8, i7-1185G7: Intel Iris Xe Graphics G7 96EUs, 13.00", 0.9 kg
External Review » Microsoft Surface Pro 8, i7-1185G7
Dell Latitude 15 9520-NMM8M: Intel Iris Xe Graphics G7 96EUs, 15.60", 1.4 kg
External Review » Dell Latitude 15 9520-NMM8M
Panasonic Toughbook FZ-55 MK2: Intel Iris Xe Graphics G7 96EUs, 14.00", 2.3 kg
External Review » Panasonic Toughbook FZ-55 MK2
MSI Summit E14 A11SCST-069NE: NVIDIA GeForce GTX 1650 Ti Mobile, 14.00", 1.3 kg
External Review » MSI Summit E14 A11SCST-069NE
Dell Latitude 13 7320 2-in-1, i7-1185G7: Intel Iris Xe Graphics G7 96EUs, 13.30", 1.1 kg
External Review » Dell Latitude 13 7320 2-in-1, i7-1185G7
MSI Summit E14 A11SCS: NVIDIA GeForce GTX 1650 Ti Max-Q, 14.00", 1.3 kg
External Review » MSI Summit E14 A11SCS
Fujitsu LifeBook U9311X i7 LTE: Intel Iris Xe Graphics G7 96EUs, 13.30", 1 kg
External Review » Fujitsu LifeBook U9311X i7 LTE
HP ZBook Firefly 14 G8, i7-1185G7: NVIDIA T500 Laptop GPU, 14.00", 1.4 kg
External Review » HP ZBook Firefly 14 G8, i7-1185G7
Microsoft Surface Laptop 4 15, i7-1185G7: Intel Iris Xe Graphics G7 96EUs, 15.00", 1.5 kg
External Review » Microsoft Surface Laptop 4 15, i7-1185G7
Dell Latitude 9420 2-in-1: Intel Iris Xe Graphics G7 96EUs, 14.00", 1.5 kg
External Review » Dell Latitude 9420 2-in-1
MSI Prestige 14 A11SCS-036DC: NVIDIA GeForce GTX 1650 Ti Max-Q, 14.00", 1.3 kg
External Review » MSI Prestige 14 A11SCS-036DC
Lenovo ThinkPad X1 Yoga G6-20XY002VUS: Intel Iris Xe Graphics G7 96EUs, 14.00", 1.4 kg
External Review » Lenovo ThinkPad X1 Yoga G6-20XY002VUS
HP EliteBook 840 Aero G8 3E4Q6AA: Intel Iris Xe Graphics G7 96EUs, 14.00", 1.2 kg
External Review » HP EliteBook 840 G8 3E4Q6AA
MSI Summit E15 A11SCS-091AU: NVIDIA GeForce GTX 1650 Ti Max-Q, 15.60", 1.7 kg
External Review » MSI Summit E15 A11SCS-091AU
Asus ExpertBook B9 B9400CEA-KC0266R: Intel Iris Xe Graphics G7 96EUs, 14.00", 1 kg
External Review » Asus ExpertBook B9 B9400CEA-KC0266R
Lenovo ThinkPad X1 Carbon G9 FHD, i7-1185G7: Intel Iris Xe Graphics G7 96EUs, 15.60", 1.1 kg
External Review » Lenovo ThinkPad X1 Carbon G9 FHD, i7-1185G7
MSI Prestige 14 Evo A11M-266RU: Intel Iris Xe Graphics G7 96EUs, 14.00", 1.3 kg
External Review » MSI Prestige 14 Evo A11M-266RU
MSI Stealth 15M A11SEK-055XES: NVIDIA GeForce RTX 2060 Mobile, 15.60", 1.7 kg
External Review » MSI Stealth 15M A11SEK-055XES
HP ZBook Firefly 15 G8-313P1EA: NVIDIA T500 Laptop GPU, 15.60", 1.8 kg
External Review » HP ZBook Firefly 15 G8-313P1EA
Dell Latitude 14 7420, i7-1185G7: Intel Iris Xe Graphics G7 96EUs, 14.00", 1.2 kg
External Review » Dell Latitude 14 7420, i7-1185G7
Dell XPS 13 9310 OLED: Intel Iris Xe Graphics G7 96EUs, 13.40", 1.2 kg
External Review » Dell XPS 13 9310 OLED
MSI Summit E13 Flip Evo A11MT: Intel Iris Xe Graphics G7 96EUs, 13.40", 1.4 kg
External Review » MSI Summit E13 Flip Evo A11MT
Dell Latitude 13 7320, i7-1185G7: Intel Iris Xe Graphics G7 96EUs, 13.30", 1.3 kg
External Review » Dell Latitude 13 7320, i7-1185G7
Lenovo ThinkPad P14s Gen2-20VX000GGE: NVIDIA T500 Laptop GPU, 14.00", 1.5 kg
External Review » Lenovo ThinkPad P14s Gen2-20VX000GGE
HP Elite Dragonfly Max: Intel Iris Xe Graphics G7 96EUs, 13.30", 1.2 kg
External Review » HP Elite Dragonfly Max
Microsoft Surface Laptop 4 13 i7: Intel Iris Xe Graphics G7 96EUs, 13.50", 1.3 kg
External Review » Microsoft Surface Laptop 4 13 i7
MSI Prestige 15 A11SCS-033XES: NVIDIA GeForce GTX 1650 Ti Max-Q, 15.60", 1.7 kg
External Review » MSI Prestige 15 A11SCS-033XES
HP EliteBook 840 Aero G8, i7-1185G7: Intel Iris Xe Graphics G7 96EUs, 14.00", 1.2 kg
External Review » HP EliteBook 840 Aero G8, i7-1185G
Lenovo Yoga 9i 14ITL5-82BG004GGE: Intel Iris Xe Graphics G7 96EUs, 14.00", 1.4 kg
External Review » Lenovo Yoga 9i 14ITL5-82BG004GGE
MSI Summit E15 A11SCST-067RU: NVIDIA GeForce GTX 1650 Ti Max-Q, 15.60", 1.8 kg
External Review » MSI Summit E15 A11SCST-067RU
MSI Summit E15 A11SCST-227ID: NVIDIA GeForce GTX 1650 Ti Max-Q, 15.60"
External Review » MSI Summit E15 A11SCST-227ID
MSI Prestige 15 A11SCX-019XES: NVIDIA GeForce GTX 1650 Max-Q, 15.60", 1.7 kg
External Review » MSI Prestige 15 A11SCX-019XES
MSI Prestige 14 Evo A11M-014IT: Intel Iris Xe Graphics G7 96EUs, 14.00", 1.3 kg
External Review » MSI Prestige 14 Evo A11M-014IT
MSI Summit E15 A11SCST: NVIDIA GeForce GTX 1650 Ti Max-Q, 15.60", 1.8 kg
External Review » MSI Summit E15 A11SCST
Lenovo Yoga 9 14 ITL 4K: Intel Iris Xe Graphics G7 96EUs, 14.00", 1.5 kg
External Review » Lenovo Yoga 9 14 ITL 4K
MSI Stealth 15M A11SDK-085: NVIDIA GeForce GTX 1660 Ti Max-Q, 15.60"
External Review » MSI Stealth 15M A11SDK-085
MSI Stealth 15M A11SDK-032RU: NVIDIA GeForce GTX 1660 Ti Max-Q, 15.60"
External Review » MSI Stealth 15M A11SDK-032RU
MSI Prestige 14 Evo A11M-005: Intel Iris Xe Graphics G7 96EUs, 14.00", 1.2 kg
External Review » MSI Prestige 14 Evo A11M-005
Lenovo Yoga 9 14ITL5, i7-1185G7: Intel Iris Xe Graphics G7 96EUs, 14.00", 1.4 kg
External Review » Lenovo Yoga 9 14ITL5, i7-1185G7
» Notebookcheck多媒体笔记本电脑Top 10排名
» Notebookcheck游戏笔记本电脑Top 10排名
» Notebookcheck低价办公/商务笔记本电脑Top 10排名
» Notebookcheck高端办公/商务笔记本电脑Top 10排名
» Notebookcheck工作站笔记本电脑Top 10排名
» Notebookcheck亚笔记本电脑Top 10排名
» Notebookcheck超级本产品Top 10排名
» Notebookcheck变形本产品Top 10排名
» Notebookcheck平板电脑Top 10排名
» Notebookcheck智能手机Top 10排名
» Notebookcheck评测过最出色的笔记本电脑屏幕
» Notebookcheck售价500欧元以下笔记本电脑Top 10排名
» Notebookcheck售价300欧元以下笔记本电脑Top 10排名