Notebookcheck Logo

NVIDIA RTX A5500 Laptop GPU

NVIDIA RTX A5500 Laptop GPU

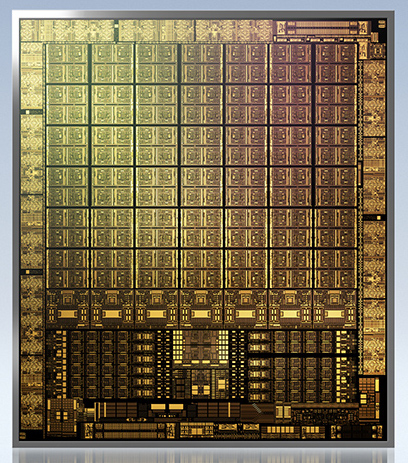
NVIDIA RTX A5500 Laptop GPU或A5500 Mobile是一款用于移动工作站的专业显卡。它基于GA103S安培芯片,与消费者的GeForce RTX 3080 Ti Laptop GPU类似。它提供相同的7424个图形核心,58个RT核心,232个Tensor核心,以及16GB GDDR6显存和256位内存总线。它支持PCIe 4.0,将有80-165瓦(TGP)的不同型号,具有不同的时钟速度(和性能)。该GPU支持eDP 1.4b连接内部显示器,支持DisplayPort 1.4和HDMI 2.1的外部连接。

不再有Max-Q变体(以前用于低功率变体),但每个OEM可以选择实施Max-Q技术(动态提升、Whispermode)。

在相同的TGP水平下,其原始性能应该与GeForce RTX 3080 Ti笔记本电脑相似。这两款GPU都在很大程度上依赖于良好的冷却和高TGP以获得良好的性能。在类似的功耗水平下,RTX A5500应该明显比旧的RTX A5000 и Quadro RTX 5000快。然而,A5500的桌面变体要快得多。

GA103S芯片提供7424个FP32 ALU,其中一半还可以执行INT32指令(即3712个INT32 ALU)。使用Ampere,所有着色器仍然可以执行FP32或INT32指令。据Nvidia称,该芯片上的光线追踪和张量核心也得到了改进。安培芯片还包括一个改进的第五代视频编码器(用于H.264和H.265的NVENC)和第七代解码器(用于现在包括AV1的各种格式)。

GA103S芯片由三星以8纳米(8N)制造,这还不能完全跟上台积电的7纳米节点(例如,AMD使用的,也用于专业的GA100安培芯片)。

RTX A Series

RTX A5500 Laptop GPU 7424 256 Bit @ 16000 MHz
RTX A4500 Laptop GPU 5888 @ 0.93 - 1.5 GHz256 Bit @ 16000 MHz
RTX A5000 Laptop GPU 6144 @ 1.22 - 1.77 GHz256 Bit @ 14000 MHz
RTX A4000 Laptop GPU 5120 @ 0.78 - 1.68 GHz256 Bit @ 12000 MHz
RTX A3000 Laptop GPU 4096 @ 1.08 - 1.56 GHz192 Bit @ 14000 MHz
RTX A2000 Laptop GPU 2560 @ 0.89 - 1.69 GHz128 Bit @ 14000 MHz
RTX A1000 Laptop GPU 2048 128 Bit @ 14000 MHz
RTX A500 Laptop GPU 2048 64 Bit @ 14000 MHz
CodenameGA103S
ArchitectureAmpere
Pipelines7424 - unified
Raytracing Cores58
Tensor / AI Cores232
Theoretical Performance24.7 TFLOPS FP32
Memory Speed16000 MHz
Memory Bus Width256 Bit
Memory TypeGDDR6
Max. Amount of Memory16 GB
Shared Memoryno
Memory Bandwidth512 GB/s
APIDirectX 12_2, Shader 6.7, OpenGL 4.6
Power Consumption165 Watt (80 - 165 Watt TGP)
technology8 nm
PCIe4
Notebook Sizelarge
Date of Announcement30.03.2022
Link to Manufacturer Pagenvdam.widen.net
PredecessorRTX A5000 Laptop GPU

Benchmarks

3DMark - 3DMark Time Spy Score
min: 9402     avg: 10011     median: 9872 (28%)     max: 10760 Points
3DMark - 3DMark Time Spy Graphics
min: 8940     avg: 9652     median: 9568 (25%)     max: 10449 Points
3DMark - 3DMark Cloud Gate Graphics
104565 Points (28%)
3DMark - 3DMark Fire Strike Standard Score
min: 22698     avg: 24228     median: 24046 (42%)     max: 25940 Points
3DMark - 3DMark Fire Strike Standard Graphics
min: 25713     avg: 26953     median: 26260 (30%)     max: 28885 Points
3DMark 11 - 3DM11 Performance Score
min: 29929     avg: 30867     median: 30135 (42%)     max: 32536 Points
3DMark 11 - 3DM11 Performance GPU
min: 33715     avg: 35743     median: 35376 (30%)     max: 38139 Points
SPECviewperf 11
specvp11 snx-01 +
SPECviewperf 11 - specvp11 snx-01
167.7 fps (100%)
specvp11 tcvis-02 +
SPECviewperf 11 - specvp11 tcvis-02
176.7 fps (100%)
specvp11 sw-02 +
SPECviewperf 11 - specvp11 sw-02
131.5 fps (100%)
specvp11 proe-05 +
SPECviewperf 11 - specvp11 proe-05
84.9 fps (100%)
specvp11 maya-03 +
SPECviewperf 11 - specvp11 maya-03
121 fps (91%)
specvp11 lightwave-01 +
SPECviewperf 11 - specvp11 lightwave-01
16.4 fps (18%)
specvp11 ensight-04 +
SPECviewperf 11 - specvp11 ensight-04
165.9 fps (79%)
specvp11 catia-03 +
SPECviewperf 11 - specvp11 catia-03
189.8 fps (100%)
SPECviewperf 12
specvp12 sw-03 +
SPECviewperf 12 - specvp12 sw-03
min: 167.74     avg: 186.1     median: 193.9 (48%)     max: 196.83 fps
specvp12 snx-02 +
SPECviewperf 12 - specvp12 snx-02
min: 176.66     avg: 204.4     median: 214.7 (32%)     max: 221.72 fps
specvp12 showcase-01 +
SPECviewperf 12 - specvp12 showcase-01
min: 131.53     avg: 137.9     median: 135.4 (29%)     max: 146.77 fps
specvp12 mediacal-01 +
SPECviewperf 12 - specvp12 mediacal-01
min: 84.87     avg: 90.6     median: 90.5 (23%)     max: 96.45 fps
specvp12 maya-04 +
SPECviewperf 12 - specvp12 maya-04
min: 121.02     avg: 151.3     median: 162.3 (44%)     max: 170.56 fps
specvp12 energy-01 +
SPECviewperf 12 - specvp12 energy-01
min: 16.41     avg: 17.8     median: 18 (16%)     max: 19.08 fps
specvp12 creo-01 +
SPECviewperf 12 - specvp12 creo-01
min: 165.88     avg: 173.4     median: 174.4 (70%)     max: 179.74 fps
specvp12 catia-04 +
SPECviewperf 12 - specvp12 catia-04
min: 189.79     avg: 212.7     median: 209.9 (35%)     max: 238.46 fps
SPECviewperf 13 specvp13 sw-04 +
SPECviewperf 13 - specvp13 sw-04
min: 186.09     avg: 196.6     median: 196.8 (53%)     max: 206.94 fps
specvp13 snx-03 +
SPECviewperf 13 - specvp13 snx-03
min: 334.23     avg: 380.1     median: 393.1 (44%)     max: 413.09 fps
specvp13 showcase-02 +
SPECviewperf 13 - specvp13 showcase-02
min: 132.86     avg: 137.1     median: 135.7 (30%)     max: 142.9 fps
specvp13 medical-02 +
SPECviewperf 13 - specvp13 medical-02
min: 116.87     avg: 129.7     median: 132.3 (28%)     max: 140.01 fps
specvp13 maya-05 +
SPECviewperf 13 - specvp13 maya-05
min: 265.99     avg: 319.4     median: 329.3 (37%)     max: 362.87 fps
specvp13 energy-02 +
SPECviewperf 13 - specvp13 energy-02
min: 61.15     avg: 64.6     median: 63.6 (21%)     max: 69.02 fps
specvp13 creo-02 +
SPECviewperf 13 - specvp13 creo-02
min: 243.69     avg: 294.5     median: 308.8 (45%)     max: 330.97 fps
specvp13 catia-05 +
SPECviewperf 13 - specvp13 catia-05
min: 302.32     avg: 337.3     median: 340.2 (38%)     max: 369.46 fps
specvp13 3dsmax-06 +
SPECviewperf 13 - specvp13 3dsmax-06
min: 223.61     avg: 232.4     median: 232.4 (40%)     max: 241.24 fps
SPECviewperf 2020 specvp2020 solidworks-05 1080p +
SPECviewperf 2020 - specvp2020 solidworks-05 1080p
min: 206.6     avg: 234.6     median: 239.1 (46%)     max: 258.01 fps
specvp2020 snx-04 1080p +
SPECviewperf 2020 - specvp2020 snx-04 1080p
min: 308.7     avg: 371.4     median: 394.7 (64%)     max: 410.78 fps
specvp2020 medical-03 1080p +
SPECviewperf 2020 - specvp2020 medical-03 1080p
min: 61.01     avg: 64.7     median: 64.7 (70%)     max: 68.3 fps
specvp2020 maya-06 1080p +
SPECviewperf 2020 - specvp2020 maya-06 1080p
min: 293.35     avg: 354.2     median: 365.3 (53%)     max: 403.83 fps
specvp2020 energy-03 1080p +
SPECviewperf 2020 - specvp2020 energy-03 1080p
min: 62.08     avg: 65.3     median: 64.6 (52%)     max: 69.15 fps
specvp2020 creo-03 1080p +
SPECviewperf 2020 - specvp2020 creo-03 1080p
min: 104.45     avg: 141.6     median: 155.3 (77%)     max: 165.08 fps
specvp2020 catia-06 1080p +
SPECviewperf 2020 - specvp2020 catia-06 1080p
min: 96.23     avg: 103.3     median: 103.9 (67%)     max: 109.77 fps
specvp2020 3dsmax-07 1080p +
SPECviewperf 2020 - specvp2020 3dsmax-07 1080p
min: 125.82     avg: 133.9     median: 131.3 (60%)     max: 144.56 fps
specvp2020 solidworks-05 4k +
SPECviewperf 2020 - specvp2020 solidworks-05 4k
min: 93.77     avg: 101.7     median: 102.2 (30%)     max: 109.04 fps
specvp2020 snx-04 4k +
SPECviewperf 2020 - specvp2020 snx-04 4k
min: 195.95     avg: 258.9     median: 279.4 (29%)     max: 301.3 fps
specvp2020 medical-03 4k +
SPECviewperf 2020 - specvp2020 medical-03 4k
min: 23.31     avg: 24.5     median: 24.3 (23%)     max: 25.78 fps
specvp2020 maya-06 4k +
SPECviewperf 2020 - specvp2020 maya-06 4k
min: 132.18     avg: 178.4     median: 184.7 (30%)     max: 218.16 fps
specvp2020 energy-03 4k +
SPECviewperf 2020 - specvp2020 energy-03 4k
min: 21.54     avg: 22.7     median: 22.6 (5%)     max: 24.11 fps
specvp2020 creo-03 4k +
SPECviewperf 2020 - specvp2020 creo-03 4k
min: 55.8     avg: 88.2     median: 91.3 (43%)     max: 117.5 fps
specvp2020 catia-06 4k +
SPECviewperf 2020 - specvp2020 catia-06 4k
min: 55.52     avg: 62.3     median: 62.7 (41%)     max: 68.64 fps
specvp2020 3dsmax-07 4k +
SPECviewperf 2020 - specvp2020 3dsmax-07 4k
min: 73.53     avg: 75.6     median: 73.7 (31%)     max: 79.63 fps
Cinebench R15
Cinebench R15 OpenGL 64 Bit +
Cinebench R15 - Cinebench R15 OpenGL 64 Bit
min: 330     avg: 356.7     median: 366 (21%)     max: 374 fps
Cinebench R15 OpenGL Ref. Match 64 Bit +
Cinebench R15 - Cinebench R15 OpenGL Ref. Match 64 Bit
99.6 % (100%)
Basemark GPU 1.2 - Basemark GPU 1.2 Vulkan Official High Offscreen 2160
3.6 fps (1%)
Power Consumption - Furmark Stress Test Power Consumption - external Monitor *
min: 144.6     avg: 157.7     median: 153.7 (22%)     max: 174.7 Watt
0102030405060708090100110120130140150160170180Tooltip
Power Consumption - The Witcher 3 Power Consumption - external Monitor *
min: 159.8     avg: 181.5     median: 183.6 (26%)     max: 201 Watt
0153045607590105120135150165180195Tooltip
Power Consumption - Witcher 3 Power Consumption *
min: 158.8     avg: 185.1     median: 188.6 (41%)     max: 208 Watt
0153045607590105120135150165180195210Tooltip
Emissions Witcher 3 Fan Noise +
Emissions - Witcher 3 Fan Noise
min: 41.9     avg: 47.7     median: 49.5 (79%)     max: 51.6 dB(A)
- Range of benchmark values for this graphics card
- Average benchmark values for this graphics card
* Smaller numbers mean a higher performance

Game Benchmarks

The following benchmarks stem from our benchmarks of review laptops. The performance depends on the used graphics memory, clock rate, processor, system settings, drivers, and operating systems. So the results don't have to be representative for all laptops with this GPU. For detailed information on the benchmark results, click on the fps number.

Returnal

Returnal

2023
low 1920x1080
70  fps    + Compare
med. 1920x1080
68  fps    + Compare
high 1920x1080
64  fps    + Compare
ultra 1920x1080
59  fps    + Compare
QHD 2560x1440
42  fps    + Compare
4K 3840x2160
20  fps    + Compare
» With all tested laptops playable in detail settings ultra.
F1 22

F1 22

2022
low 1920x1080
190.8 224 ~ 207 fps    + Compare
med. 1920x1080
188.2 209 ~ 199 fps    + Compare
high 1920x1080
163.1 170.2 ~ 167 fps    + Compare
ultra 1920x1080
60.9 66.4 ~ 64 fps    + Compare
QHD 2560x1440
37.2 40.8 ~ 39 fps    + Compare
4K 3840x2160
17.6 18.8 ~ 18 fps    + Compare
» With all tested laptops playable in detail settings ultra.
Additional Benchmarks
Ultra Low Preset 16xAF TAA 1280x720
246
323
low 1920x1080
193.7  fps    + Compare
med. 1920x1080
158.6  fps    + Compare
high 1920x1080
109.5  fps    + Compare
ultra 1920x1080
87.5  fps    + Compare
QHD 2560x1440
57.9  fps    + Compare
4K 3840x2160
29.6  fps    + Compare
» With all tested laptops playable in detail settings ultra.
low 1920x1080
93.9 128.7 132.3 ~ 118 fps    + Compare
med. 1920x1080
80.2 114.4 117.7 ~ 104 fps    + Compare
high 1920x1080
79.3 87.6 96.1 ~ 88 fps    + Compare
ultra 1920x1080
69.8 75.7 80.7 ~ 75 fps    + Compare
QHD 2560x1440
41.4 45.3 47 ~ 45 fps    + Compare
4K 3840x2160
17.8 18.1 20.4 ~ 19 fps    + Compare
» With all tested laptops playable in detail settings ultra.
low 1920x1080
128.9  fps    + Compare
med. 1920x1080
119.6  fps    + Compare
high 1920x1080
105.6  fps    + Compare
ultra 1920x1080
79  fps    + Compare
QHD 2560x1440
62.2  fps    + Compare
4K 3840x2160
35.6  fps    + Compare
» With all tested laptops playable in detail settings ultra.
Additional Benchmarks
Low Preset 1280x720
156.3
low 1280x720
142  fps    + Compare
med. 1920x1080
124  fps    + Compare
high 1920x1080
137  fps    + Compare
ultra 1920x1080
134  fps    + Compare
QHD 2560x1440
104  fps    + Compare
4K 3840x2160
49  fps    + Compare
» With all tested laptops playable in detail settings ultra.
Additional Benchmarks
Low Preset 1920x1080
136
Far Cry 6

Far Cry 6

2021
low 1280x720
132  fps    + Compare
med. 1920x1080
115  fps    + Compare
high 1920x1080
104  fps    + Compare
ultra 1920x1080
95  fps    + Compare
QHD 2560x1440
79  fps    + Compare
4K 3840x2160
42  fps    + Compare
» With all tested laptops playable in detail settings ultra.
Additional Benchmarks
Low Graphics Quality 1920x1080
123
Hitman 3

Hitman 3

2021
low 1280x720
229  fps    + Compare
med. 1920x1080
186.6  fps    + Compare
high 1920x1080
179.9  fps    + Compare
ultra 1920x1080
161.4  fps    + Compare
QHD 2560x1440
104.6  fps    + Compare
4K 3840x2160
43.8  fps    + Compare
» With all tested laptops playable in detail settings ultra.
Additional Benchmarks
Minimum Settings 1920x1080
210.8
Dirt 5

Dirt 5

2020
low 1280x720
167.6  fps    + Compare
med. 1920x1080
130  fps    + Compare
high 1920x1080
114.8  fps    + Compare
ultra 1920x1080
92.2  fps    + Compare
QHD 2560x1440
71.9  fps    + Compare
4K 3840x2160
39.8  fps    + Compare
» With all tested laptops playable in detail settings ultra.
low 1280x720
119  fps    + Compare
med. 1920x1080
98  fps    + Compare
high 1920x1080
93  fps    + Compare
ultra 1920x1080
77  fps    + Compare
QHD 2560x1440
58  fps    + Compare
4K 3840x2160
30  fps    + Compare
» With all tested laptops playable in detail settings ultra.
low 1280x720
139  fps    + Compare
med. 1920x1080
130  fps    + Compare
high 1920x1080
111  fps    + Compare
ultra 1920x1080
101  fps    + Compare
QHD 2560x1440
89  fps    + Compare
4K 3840x2160
42  fps    + Compare
» With all tested laptops playable in detail settings ultra.
low 1280x720
314.1  fps    + Compare
med. 1920x1080
189.7  fps    + Compare
high 1920x1080
139.2  fps    + Compare
ultra 1920x1080
110.1  fps    + Compare
QHD 2560x1440
77.1  fps    + Compare
4K 3840x2160
34.9  fps    + Compare
» With all tested laptops playable in detail settings ultra.
low 1280x720
162.9  fps    + Compare
med. 1920x1080
135.4  fps    + Compare
high 1920x1080
110.4  fps    + Compare
ultra 1920x1080
89.3  fps    + Compare
QHD 2560x1440
62.7  fps    + Compare
4K 3840x2160
30.2  fps    + Compare
» With all tested laptops playable in detail settings ultra.
Additional Benchmarks
Very Low Overall Quality (DX11) 1920x1080
156
low 1280x720
171  fps    + Compare
med. 1920x1080
125.8  fps    + Compare
high 1920x1080
95.3  fps    + Compare
ultra 1920x1080
75.7  fps    + Compare
QHD 2560x1440
58.5  fps    + Compare
4K 3840x2160
31.3  fps    + Compare
» With all tested laptops playable in detail settings ultra.
Additional Benchmarks
Ultra Quality DXR 16xAF 1920x1080
63.4
Strange Brigade

Strange Brigade

2018
low 1280x720
377 442 447 ~ 422 fps    + Compare
med. 1920x1080
235 244 264 ~ 248 fps    + Compare
high 1920x1080
190.2 200 223 ~ 204 fps    + Compare
ultra 1920x1080
168.6 177.9 197.7 ~ 181 fps    + Compare
QHD 2560x1440
122 129.3 138.6 ~ 130 fps    + Compare
4K 3840x2160
67.6  fps    + Compare
» With all tested laptops playable in detail settings ultra.
low 1280x720
146.2 151.3 155.8 ~ 151 fps    + Compare
med. 1920x1080
130.9 134.3 137.6 ~ 134 fps    + Compare
high 1920x1080
103.6 107.8 108.8 ~ 107 fps    + Compare
4K 3840x2160
81.9 92.7 93.7 ~ 89 fps    + Compare
» With all tested laptops playable in detail settings high.
low 1280x720
170.1 180.1 212 ~ 187 fps    + Compare
med. 1920x1080
131.6 138.9 142.5 ~ 138 fps    + Compare
high 1920x1080
103.5 107.8 113.1 ~ 108 fps    + Compare
QHD 2560x1440
75.1 78.9 83.5 ~ 79 fps    + Compare
4K 3840x2160
39.4 43.5 45.4 ~ 43 fps    + Compare
» With all tested laptops playable in detail settings high.
low 1280x720
191.3 193.3 194.3 ~ 193 fps    + Compare
med. 1366x768
171.3 173.1 174.5 ~ 173 fps    + Compare
high 1920x1080
161.8 162.4 166.1 ~ 163 fps    + Compare
ultra 1920x1080
150.7 152.9 156.3 ~ 153 fps    + Compare
4K 3840x2160
116.1 131.4 132.8 ~ 127 fps    + Compare
» With all tested laptops playable in detail settings ultra.
low 1024x768
421.2 447 489.4 ~ 453 fps    + Compare
med. 1366x768
306.8 308.5 329.9 ~ 315 fps    + Compare
high 1920x1080
169.3 205.4 211.8 ~ 196 fps    + Compare
ultra 1920x1080
92.8 101.5 110.4 ~ 102 fps    + Compare + 📈 Graph
4K 3840x2160
62.2 62.5 63.7 ~ 63 fps    + Compare
» With all tested laptops playable in detail settings ultra.
GTA V

GTA V

2015
low 1024x768
183.4 185.4 185.9 ~ 185 fps    + Compare
med. 1366x768
178.1 182.7 183.4 ~ 181 fps    + Compare
high 1920x1080
166.2 170.7 177.7 ~ 172 fps    + Compare
ultra 1920x1080
102.6 118.5 124.4 ~ 115 fps    + Compare
QHD 2560x1440
97.5 99.2 103.5 ~ 100 fps    + Compare
4K 3840x2160
97.1  fps    + Compare
» With all tested laptops playable in detail settings ultra.
Additional Benchmarks
Highest Settings possible 16xAF 4xMSAA + FXAA 3840x2160
49.8
Normal/Off 4xAF 1920x1080
179.3
183
179.3
Lowest Settings possible 1920x1080
185.1
184.7
185.5
lowmed.highultraQHD4K
Returnal706864594220
F1 22207199167643918
Tiny Tina's Wonderlands193.7158.6109.587.557.929.6
Cyberpunk 2077 1.611810488754519
God of War128.9119.6105.67962.235.6
Guardians of the Galaxy14212413713410449
Far Cry 6132115104957942
Hitman 3229186.6179.9161.4104.643.8
Dirt 5167.6130114.892.271.939.8
Watch Dogs Legion1199893775830
Horizon Zero Dawn1391301111018942
Gears Tactics314.1189.7139.2110.177.134.9
Borderlands 3162.9135.4110.489.362.730.2
Metro Exodus171125.895.375.758.531.3
Strange Brigade42224820418113067.6
X-Plane 11.1115113410789
Final Fantasy XV Benchmark1871381087943
Dota 2 Reborn193173163153127
The Witcher 345331519610263
GTA V18518117211510097.1
< 30 fps
< 60 fps
< 120 fps
≥ 120 fps


3
17


5
15


12
8

1
13
4

6
10
1
4
11
4
1

For more games that might be playable and a list of all games and graphics cards visit our Gaming List

v1.26
log 15. 18:23:09

#0 no ids found in url (should be separated by "_") +0s ... 0s

#1 not redirecting to Ajax server +0s ... 0s

#2 did not recreate cache, as it is less than 5 days old! Created at Sat, 13 Apr 2024 05:44:32 +0200 +0.001s ... 0.001s

#3 no comparison url found in template nbc.compare_page_1 needed +0.037s ... 0.038s

#4 no comparison url found in template nbc.compare_page_1 needed +0s ... 0.038s

#5 no comparison url found in template nbc.compare_page_1 needed +0s ... 0.039s

#6 no comparison url found in template nbc.compare_page_1 needed +0s ... 0.039s

#7 no comparison url found in template nbc.compare_page_1 needed +0s ... 0.039s

#8 no comparison url found in template nbc.compare_page_1 needed +0s ... 0.04s

#9 no comparison url found in template nbc.compare_page_1 needed +0s ... 0.04s

#10 composed specs +0.001s ... 0.041s

#11 did output specs +0s ... 0.041s

#12 start showIntegratedCPUs +0s ... 0.041s

#13 getting avg benchmarks for device 11316 +0.014s ... 0.055s

#14 got single benchmarks 11316 +0.019s ... 0.073s

#15 got avg benchmarks for devices +0s ... 0.073s

#16 min, max, avg, median took s +0.78s ... 0.853s

#17 before gaming benchmark output +0s ... 0.853s

#18 Got 191 rows for game benchmarks. +0.071s ... 0.925s

#19 composed SQL query for gamebenchmarks +0s ... 0.925s

#20 got data and put it in $dataArray +0.015s ... 0.939s

#21 benchmarks composed for output. +1.042s ... 1.982s

#22 no comparison url found in template nbc.compare_page_1 needed +0.004s ... 1.986s

#23 return log +0s ... 1.986s

Please share our article, every link counts!

» Comparison of GPUs
Detailed list of all laptop GPUs sorted by class and performance.

» Benchmark List
Sort and restrict laptop GPUs based on performance in synthetic benchmarks.

» Notebook Gaming List
Playable games for each graphics card and their average FPS results.

Class 1

GeForce RTX 2080 Super Mobile

Class 2

M1 Max 32-Core GPU *
GeForce RTX 2070 Super Mobile
M1 Max 24-Core GPU *
Quadro RTX 5000 Max-Q
Radeon RX 5700M *
GeForce GTX 1080 Mobile
Quadro RTX 4000 (Laptop)
M1 Pro 16-Core GPU *
Radeon PRO W6600M *
GeForce RTX 2070 Super Max-Q
Quadro RTX 4000 Max-Q *
M1 Pro 14-Core GPU *
Quadro P5200
Quadro RTX 3000 Max-Q *
Quadro P4200
Quadro P5000 Max-Q *
GeForce GTX 980 (Laptop)
Quadro P4000
Quadro P4000 Max-Q
Quadro P3200
Radeon RX 580X (Laptop) *
Radeon RX 580 (Laptop)
Radeon Pro 5300M
Radeon RX 5300M
Quadro P3000 Max-Q *
Quadro T2000 Max-Q *
Radeon Pro WX 7100 *
Radeon RX 570X (Laptop) *
Radeon RX 570 (Laptop) *
Radeon RX 470 (Laptop) *
Quadro T1000 Max-Q *

Class 3

Vega M GH
Quadro M5000M
GeForce GTX 1050 Ti Mobile
Radeon 680M
Quadro P2000
Quadro P2000 Max-Q
Quadro M4000M
T500 Laptop GPU *
Radeon R9 M395X
GeForce GTX 1050 Ti Max-Q *
Radeon Pro Vega 16
WX Vega M GL
Radeon R9 M485X
Quadro M3000M
FirePro W7170M
Radeon R9 M395
GeForce GTX 1050 Max-Q *
Radeon 660M
Radeon Pro WX 4150 *
Radeon RX 560X (Laptop)
Radeon RX 560 (Laptop)
Radeon RX 460 (Laptop)
Quadro P1000
Radeon R9 M390
Xe MAX
Radeon Pro 560X
Radeon Pro 560
Radeon Pro 460
Radeon Pro WX 4130 *
GeForce GTX 960M
Quadro P620 *
Radeon RX 550X (Laptop)
Radeon Pro WX 3200 *
Radeon Pro 555X
Radeon Pro 555
Radeon Pro 455
Quadro P600
Quadro M2000M
Radeon RX 540X *
Radeon Pro WX 2100 *
Radeon Pro WX 3100 *
GeForce GTX 950M
Radeon Pro 450
Radeon 630
Radeon 540X *
Radeon R9 M385X
Quadro P520
Quadro M1000M
GeForce 945M
Quadro P500 *
Iris Plus Graphics G7 (Ice Lake 64 EU) *
Vega 10 *
Iris Pro Graphics 580
FirePro W5170M *
Radeon R9 M370X
Vega 9
FirePro W5130M
UHD Graphics Xe G4 48EUs *
UHD Graphics 32EUs
UHD Graphics Xe 32EUs (Tiger Lake-H) *
UHD Graphics 750
Vega 7
Radeon R7 M465
Iris Pro Graphics 6200
Vega 8
GeForce 940M
Iris Plus Graphics G4 (Ice Lake 48 EU)
Quadro M600M
FirePro W4190M
Radeon R9 M375
Radeon R7 M445
Iris Plus Graphics 650
Iris Graphics 550
Radeon 625
Vega 6 *
Iris Plus Graphics 640
Iris Graphics 540
UHD Graphics 24EUs (Alder Lake-N) *
Radeon R7 M360
GeForce 920M
Radeon 620
Radeon R7 M340
Radeon 610
Radeon 610M *
Vega 6 *
UHD Graphics G1 (Ice Lake 32 EU)
UHD Graphics Xe 16EUs (Tiger Lake-H) *
HD Graphics 530
Radeon R5 (Bristol Ridge)
Adreno 690 *
Adreno 685 *
Adreno 680 *
Radeon R5 M330
GeForce 910M
HD Graphics 520

Class 4

UHD Graphics 730
Radeon R5 M320 *
Radeon R5 M315 *
Radeon R5 M420 *
Vega 2 *
UHD Graphics 617
UHD Graphics 615
HD Graphics 515
UHD Graphics 610
HD Graphics 510
UHD Graphics 605
Radeon R4 (Stoney Ridge)
Radeon R2 (Stoney Ridge)
HD Graphics (Broadwell)
UHD Graphics 600
HD Graphics (Braswell)

Class 5

* Approximate position of the graphics adapter