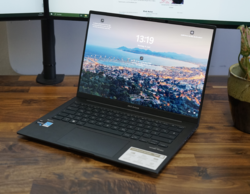
华硕ZenBook 14X(2023)笔记本电脑评测:OLED超极本的极限

华硕对华硕ZenBook 14X进行了小幅改造,因此它现在看起来很像紧凑的13英寸超极本ZenBook S13。然而,这款拥有特别好的底盘的14英寸机的重量明显增加到1.56公斤。作为回报,华硕安装了更强大的英特尔酷睿i9-13900H,如果需要,还可以安装NvidiaGeForce RTX 3050。与前代产品一样,安装了2.8K OLED显示屏,从90赫兹升级到非常好的120赫兹。
由于在14英寸的细分市场中,没有多少竞争对手采用OLED显示屏,我们也包括了IPS竞争对手进行比较。这里有趣的是华硕ROG Flow Z13 GZ301V 平板电脑,它配备了同样强大的英特尔Core i9处理器。
潜在的竞争对手比较
Rating | Date | Model | Weight | Height | Size | Resolution | Price |
|---|---|---|---|---|---|---|---|
| 88.5 % v7 (old) | 06 / 2023 | Asus ZenBook 14X UX3404VC i9-13900H, Iris Xe G7 96EUs | 1.6 kg | 16.9 mm | 14.50" | 2880x1800 | |
| 91.9 % v7 (old) | 06 / 2022 | Apple MacBook Pro 13 2022 M2 M2, M2 10-Core GPU | 1.4 kg | 15.6 mm | 13.30" | 2560x1600 | |
| 89.2 % v7 (old) | 04 / 2023 | Lenovo Slim Pro 7 14ARP8 R7 7735HS, GeForce RTX 3050 6GB Laptop GPU | 1.6 kg | 15.6 mm | 14.50" | 2560x1600 | |
| 89.1 % v7 (old) | 04 / 2023 | Asus ROG Flow Z13 GZ301V i9-13900H, GeForce RTX 4060 Laptop GPU | 1.6 kg | 14.2 mm | 13.40" | 2560x1600 | |
| 87.3 % v7 (old) | 09 / 2022 | Dell XPS 13 Plus 9320 i7-1280P OLED i7-1280P, Iris Xe G7 96EUs | 1.3 kg | 15.28 mm | 13.40" | 3456x2160 | |
| 87.2 % v7 (old) | 09 / 2022 | Dell Inspiron 14 Plus 7420 i7-12700H, GeForce RTX 3050 4GB Laptop GPU | 1.7 kg | 18.87 mm | 14.00" | 2240x1400 | |
| 86.6 % v7 (old) | 10 / 2022 | LG Gram 14Z90Q i5-1240P, Iris Xe G7 80EUs | 980 g | 16.8 mm | 14.00" | 1920x1200 |
案例 - 没有比这更高质量的了
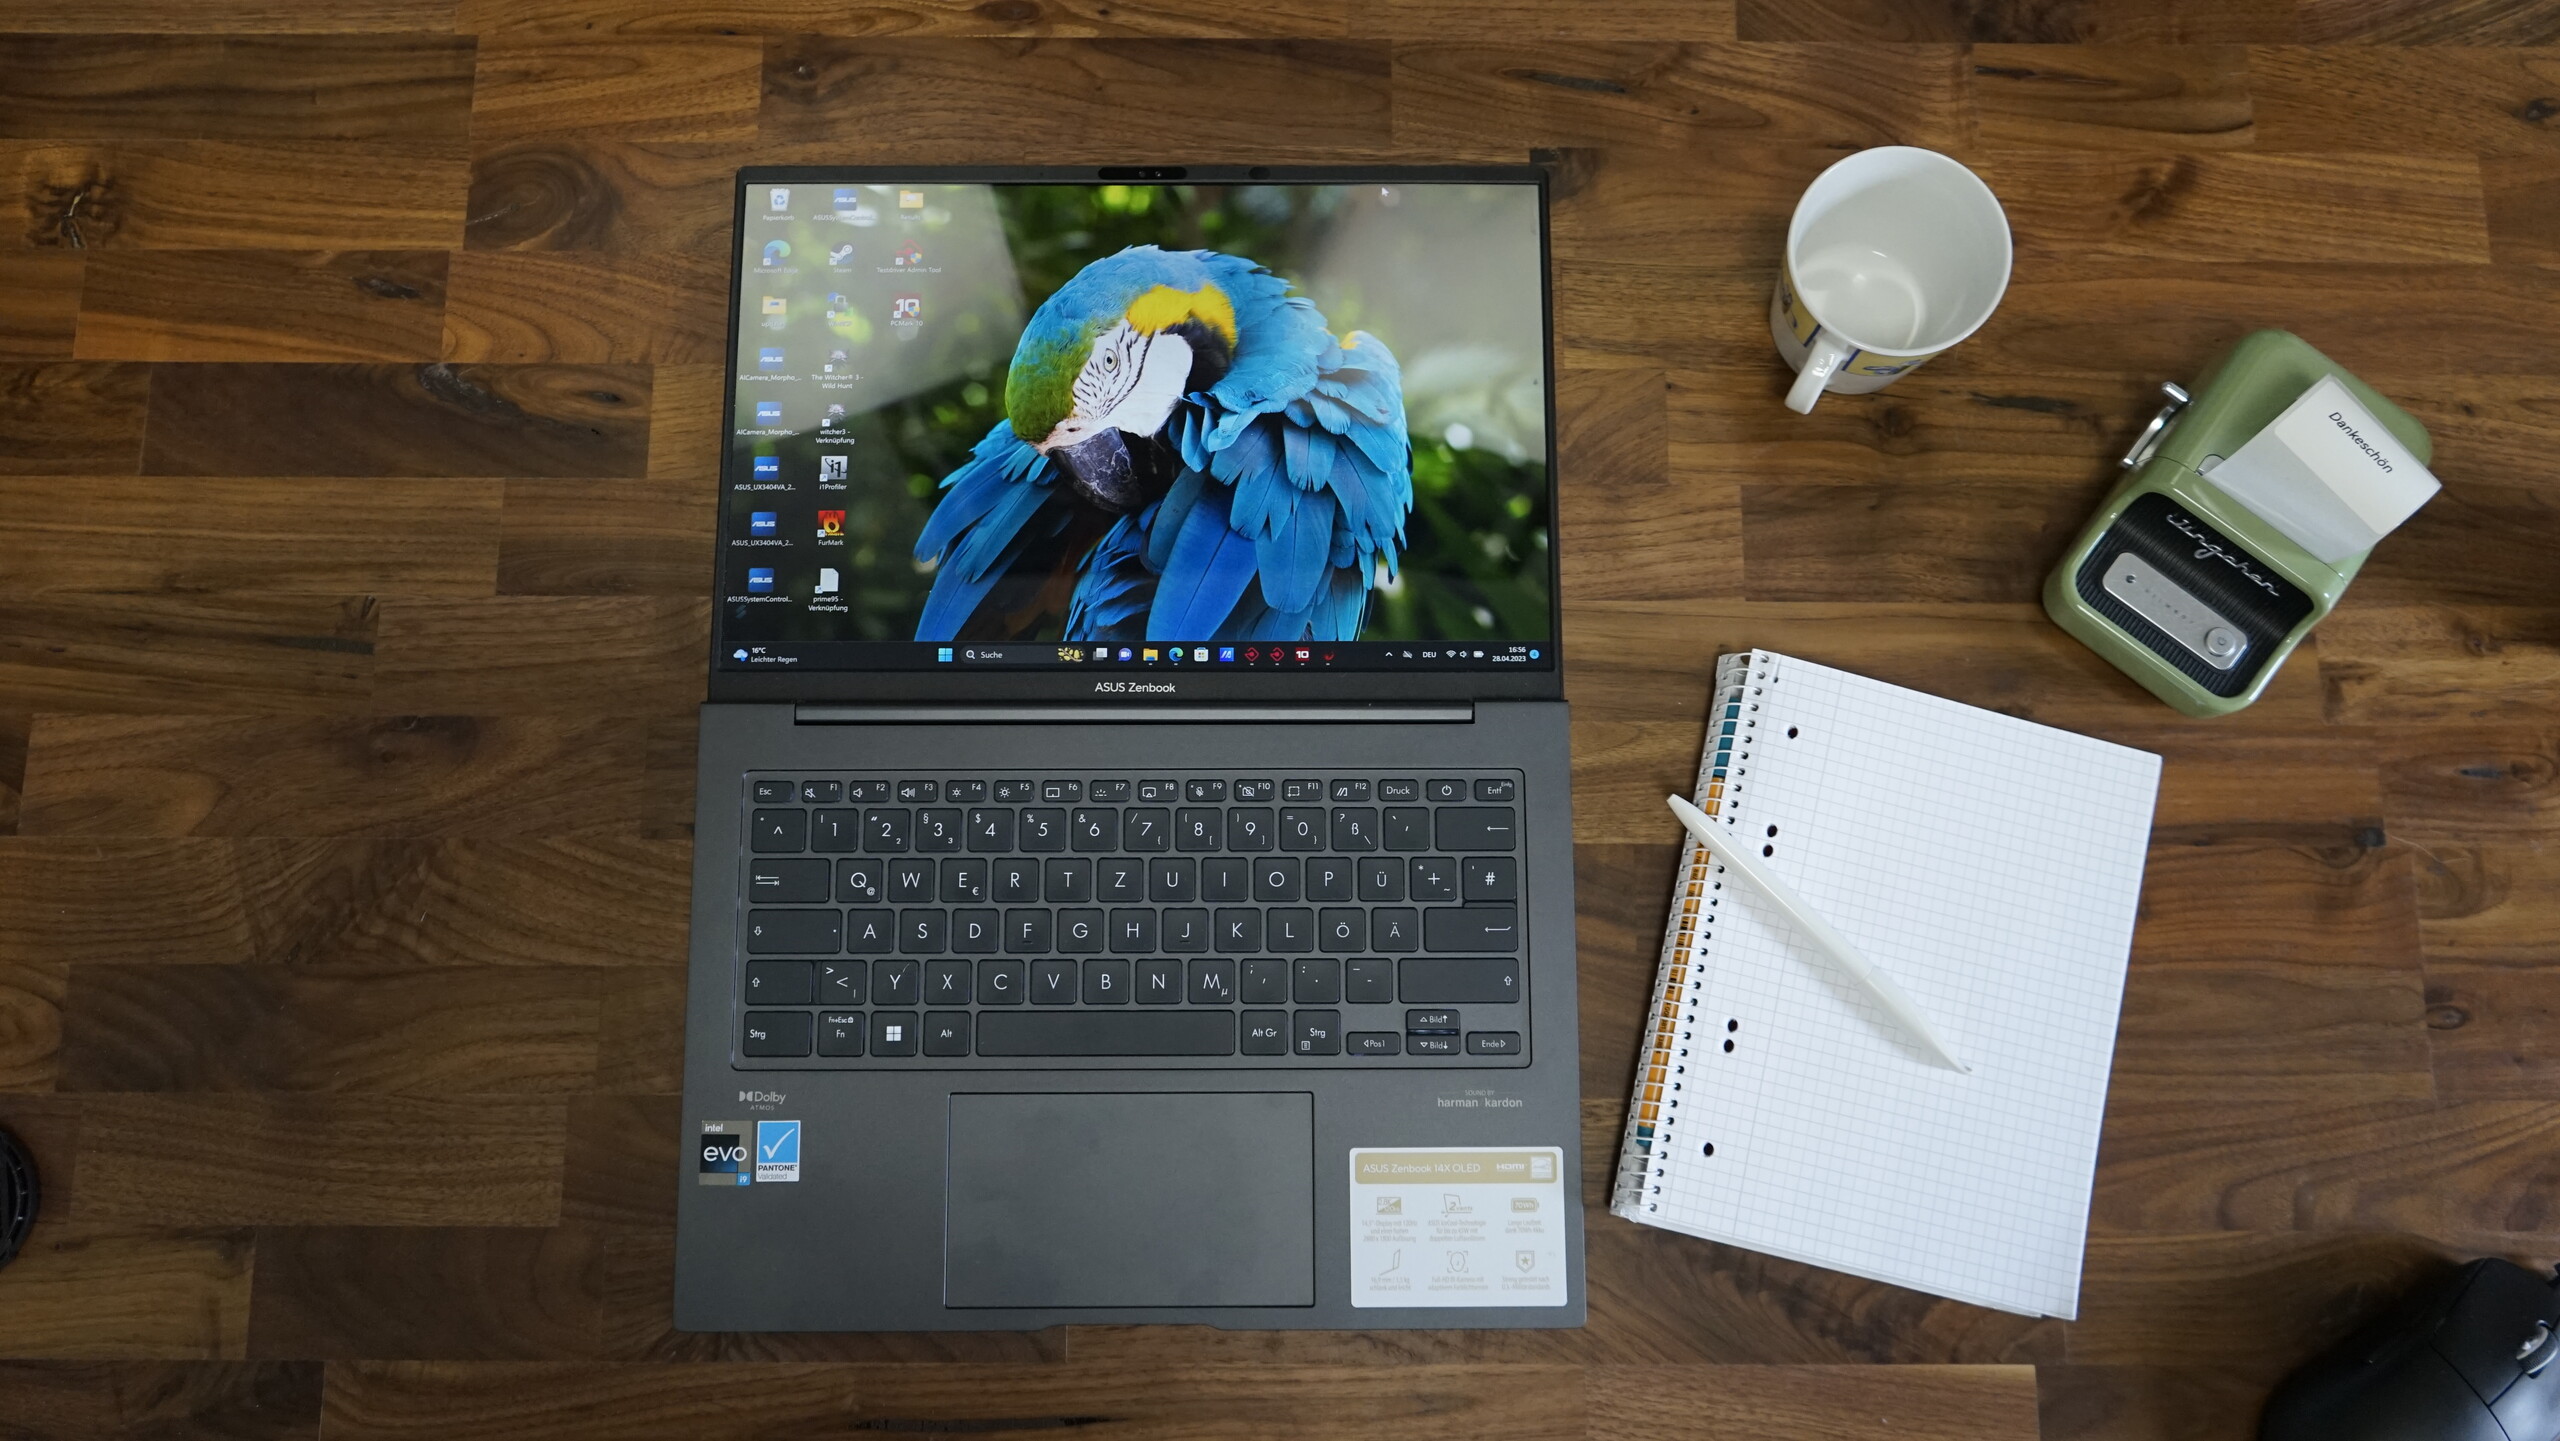
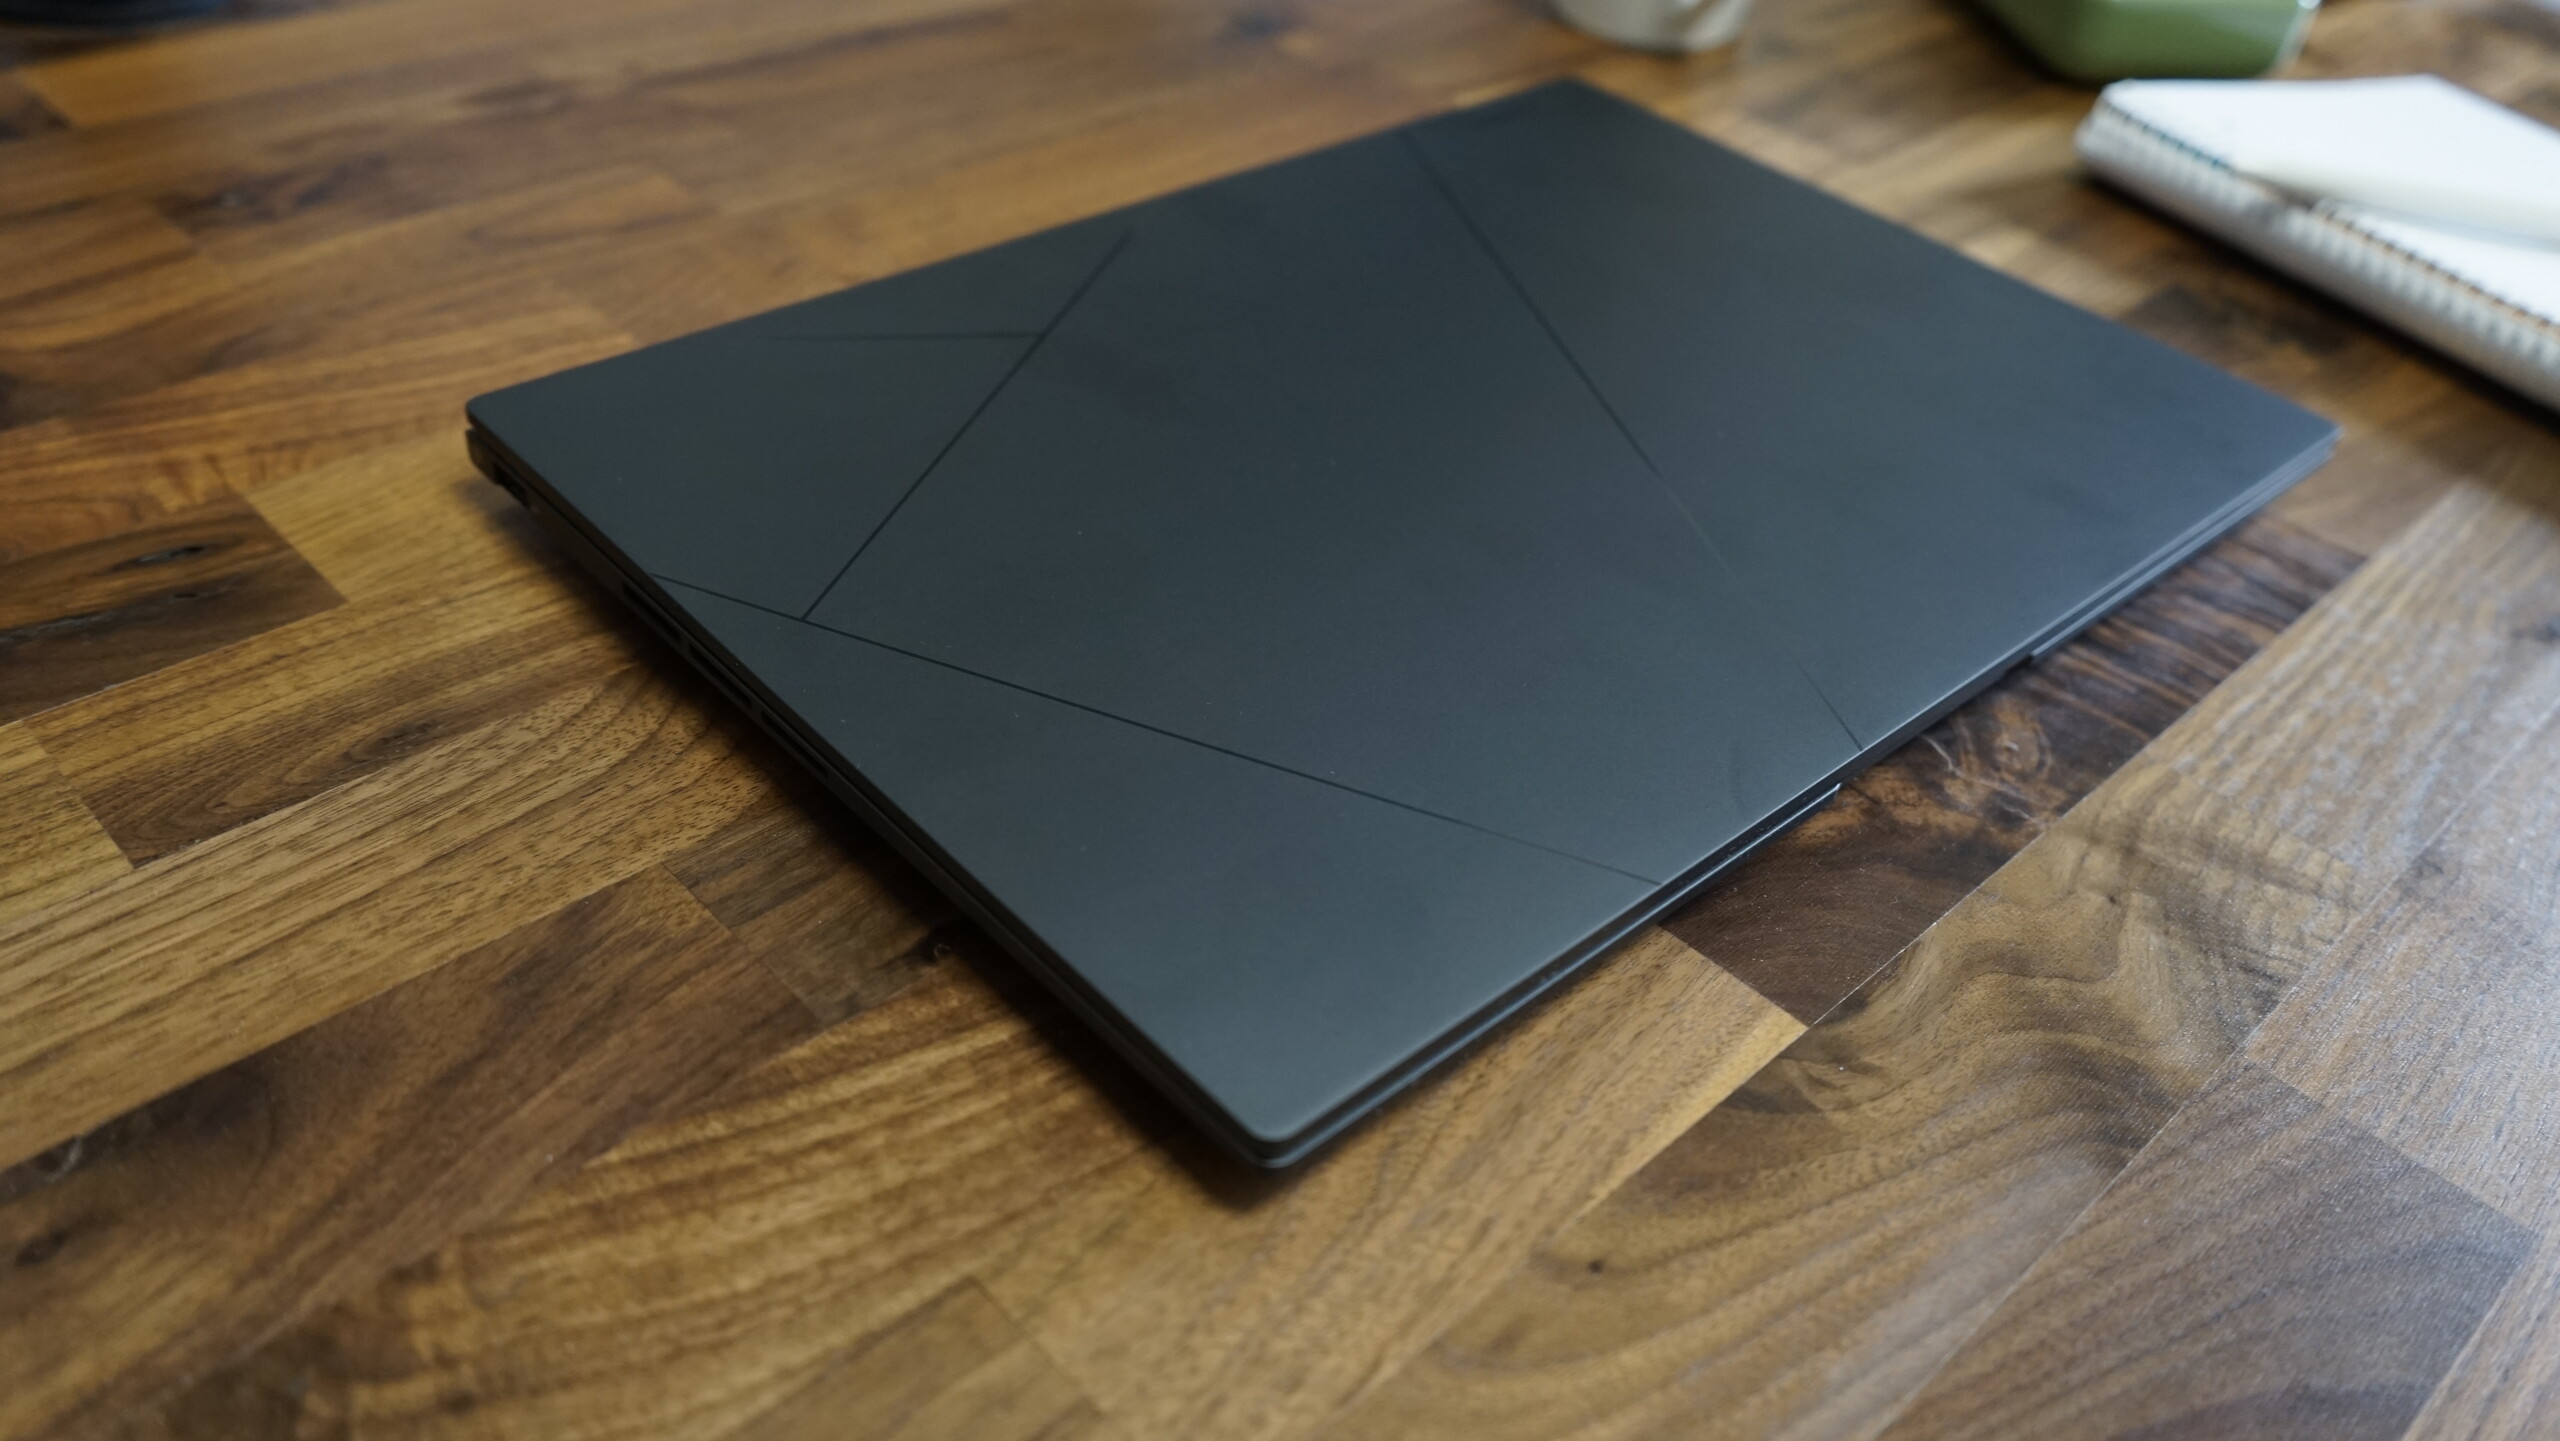
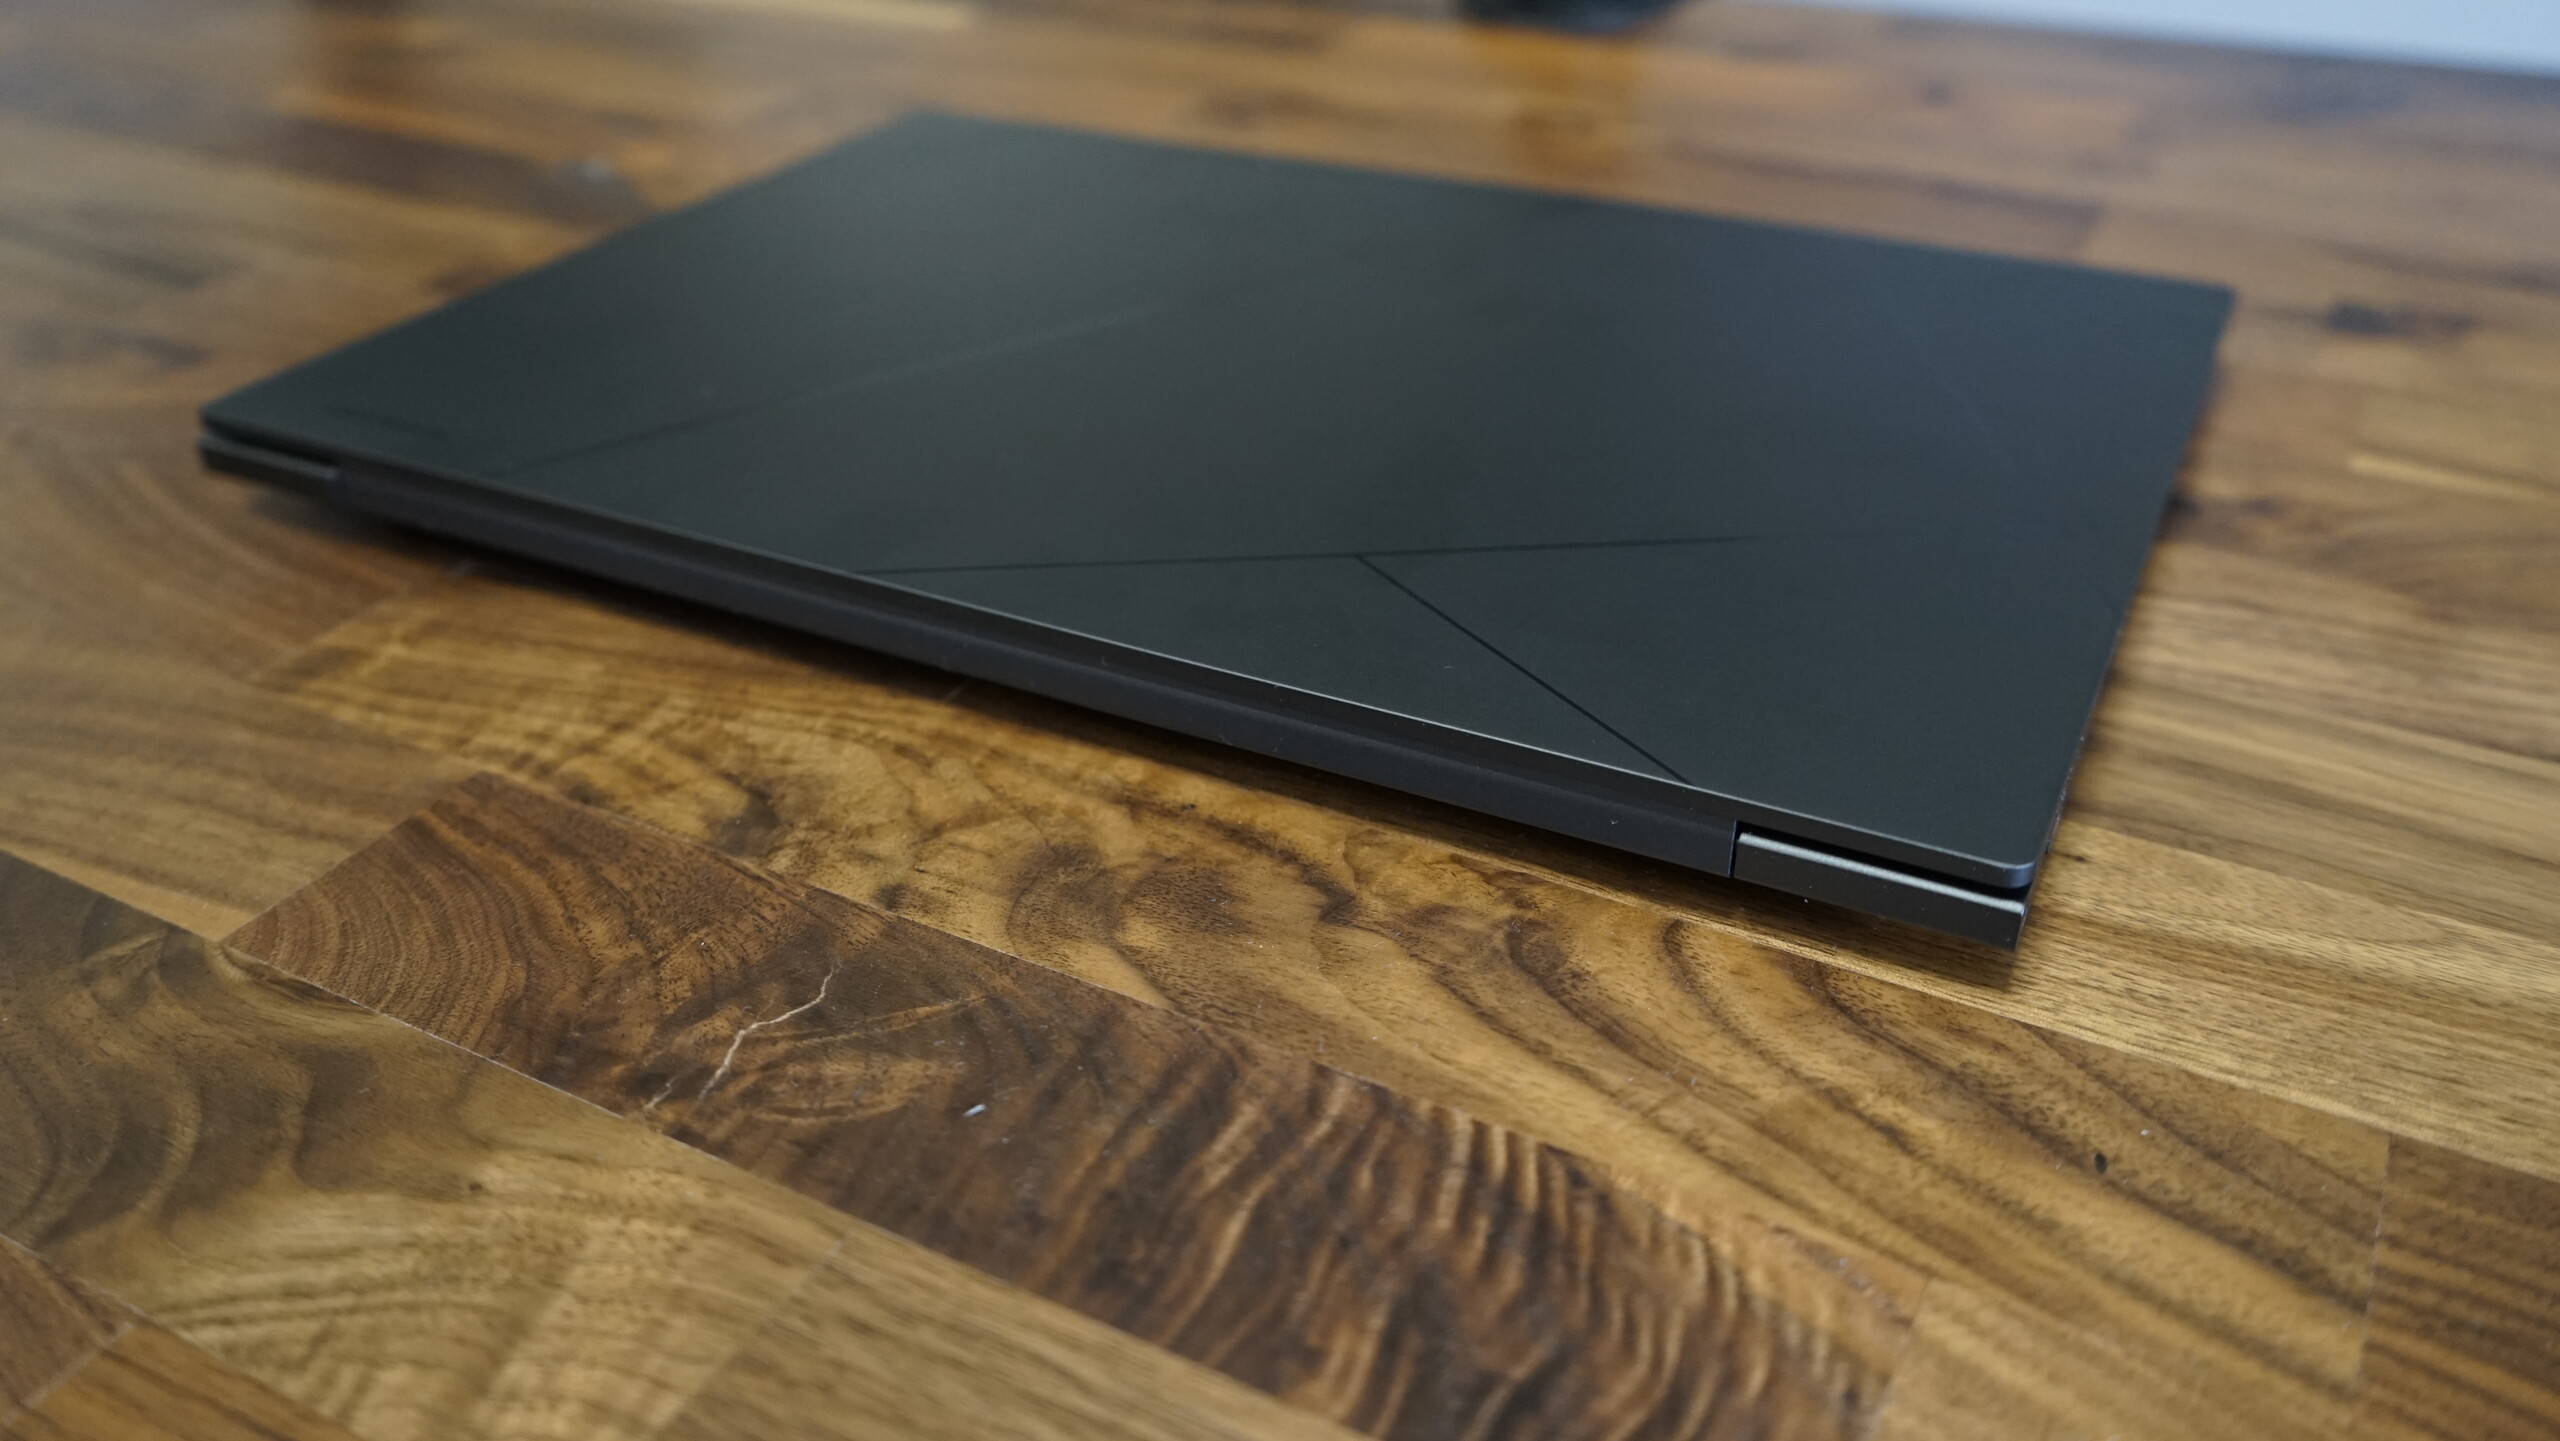
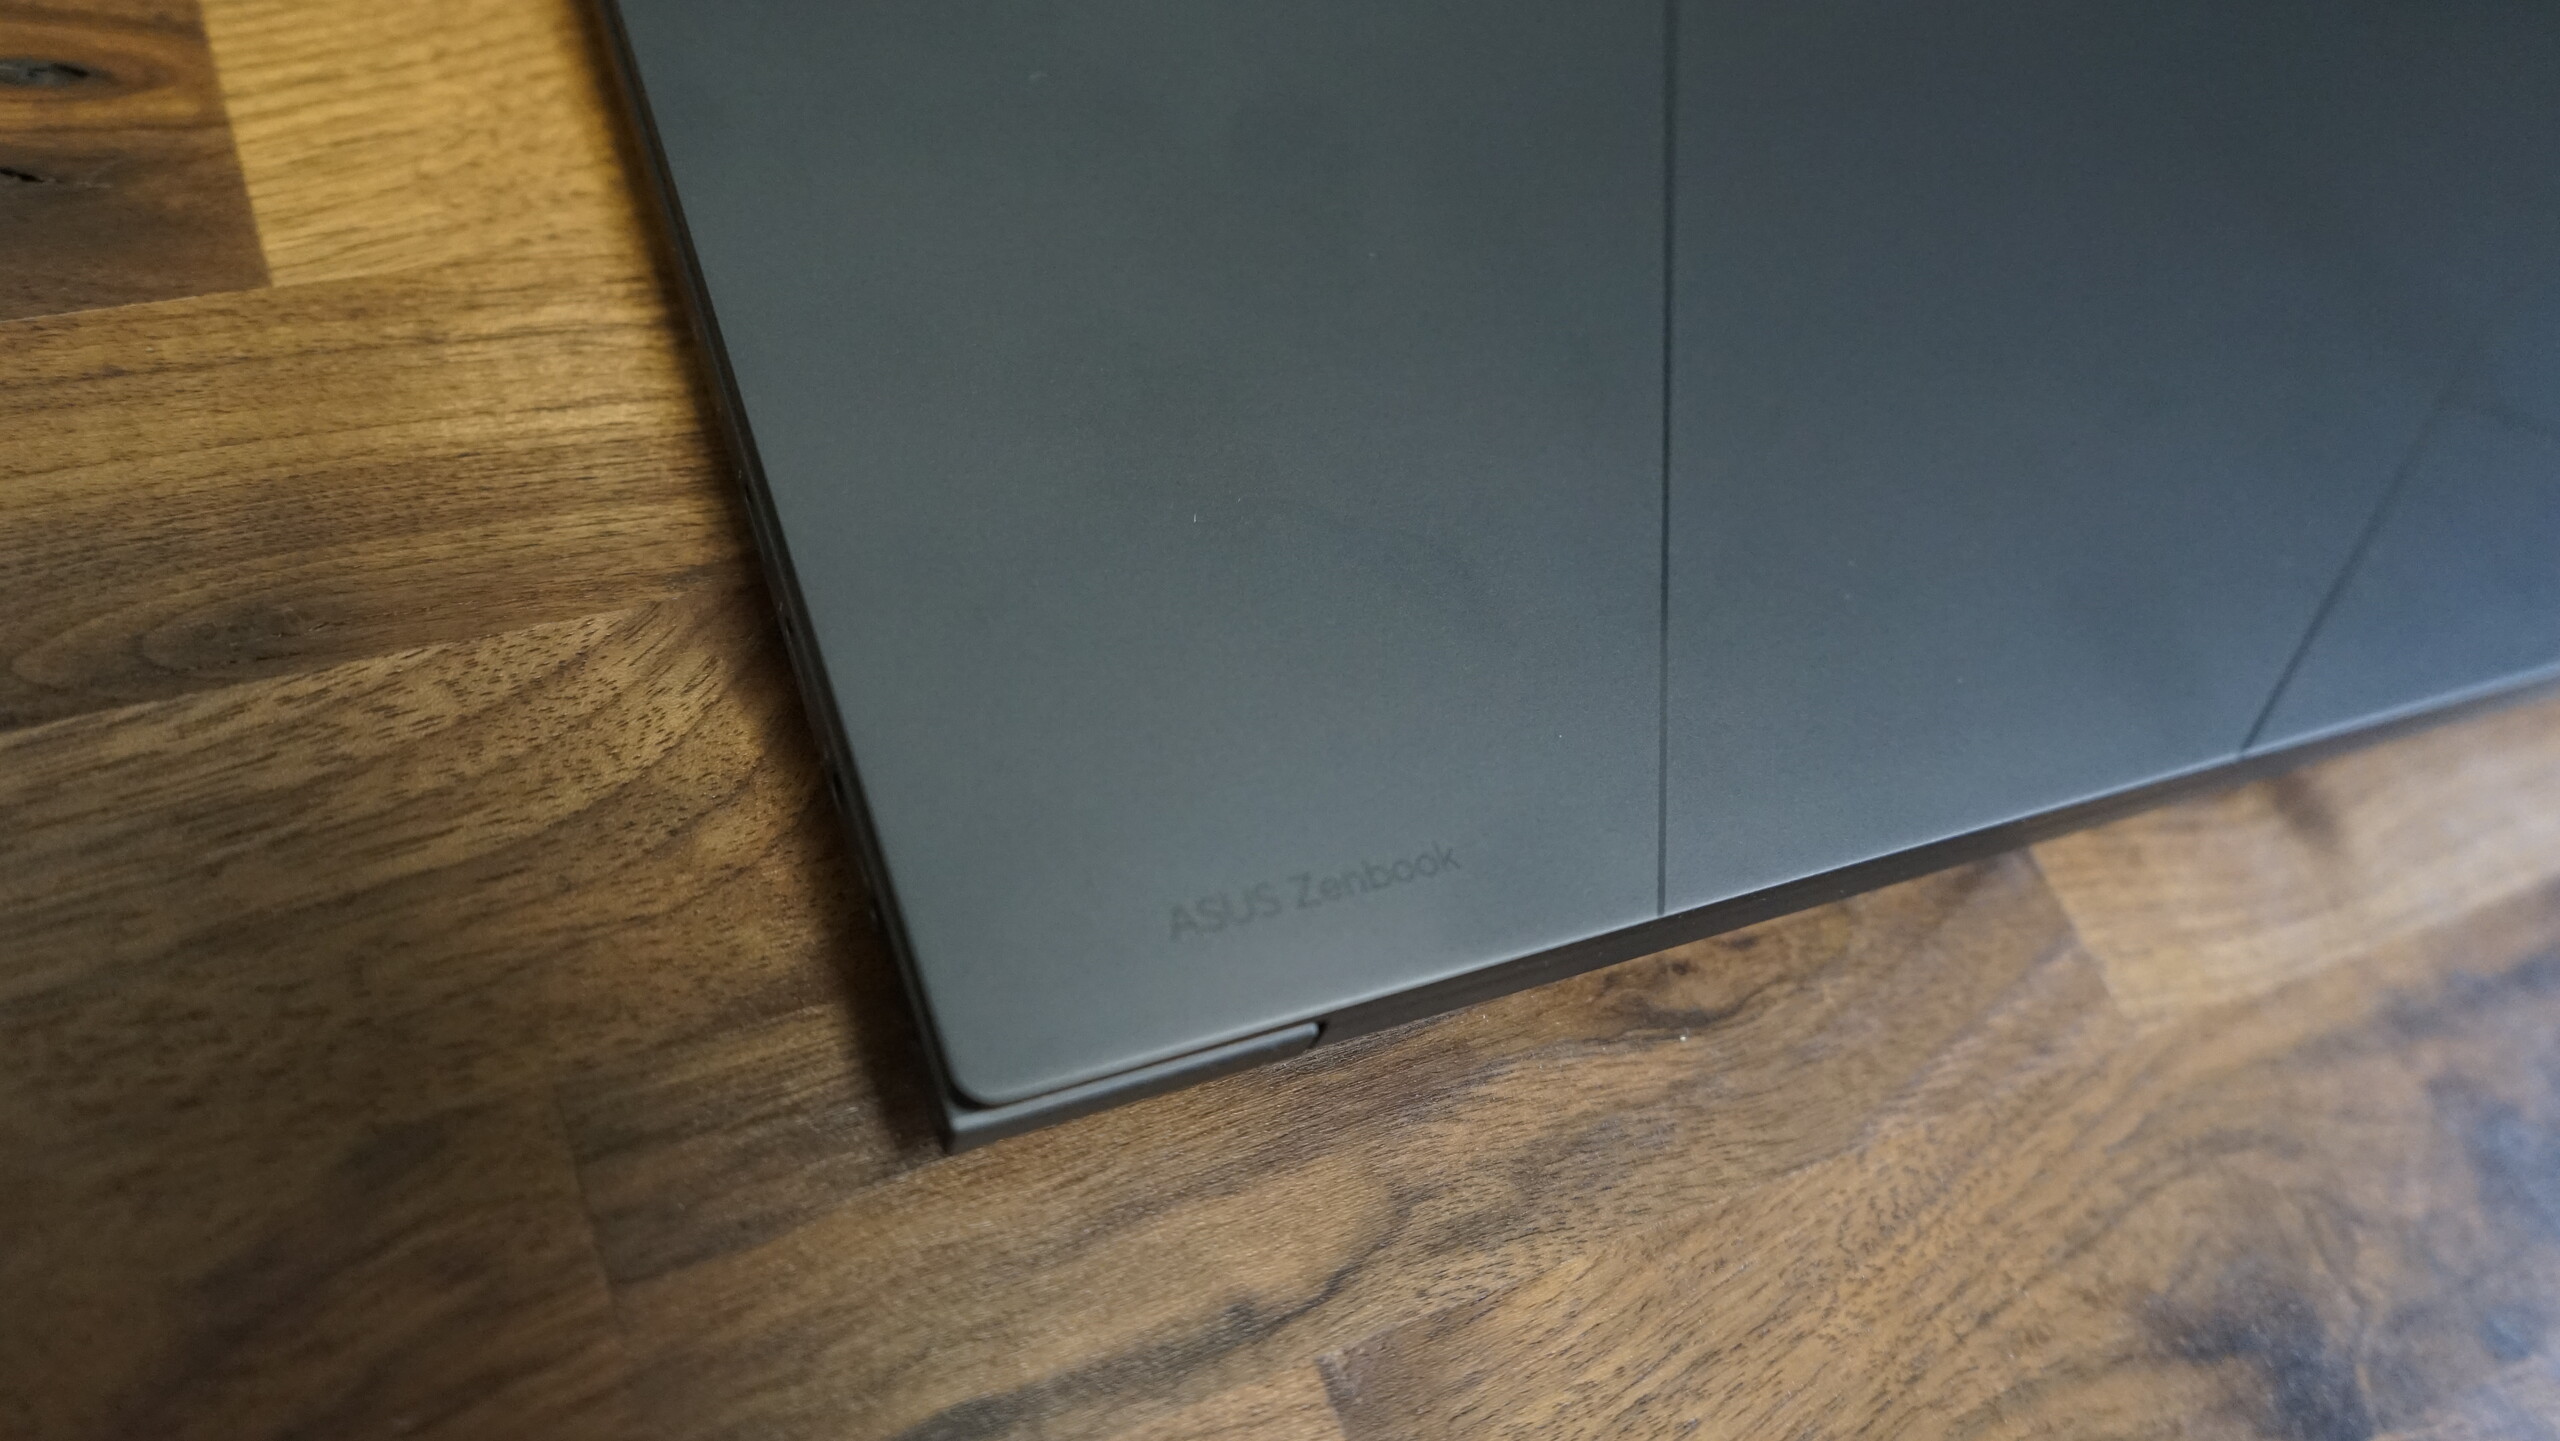
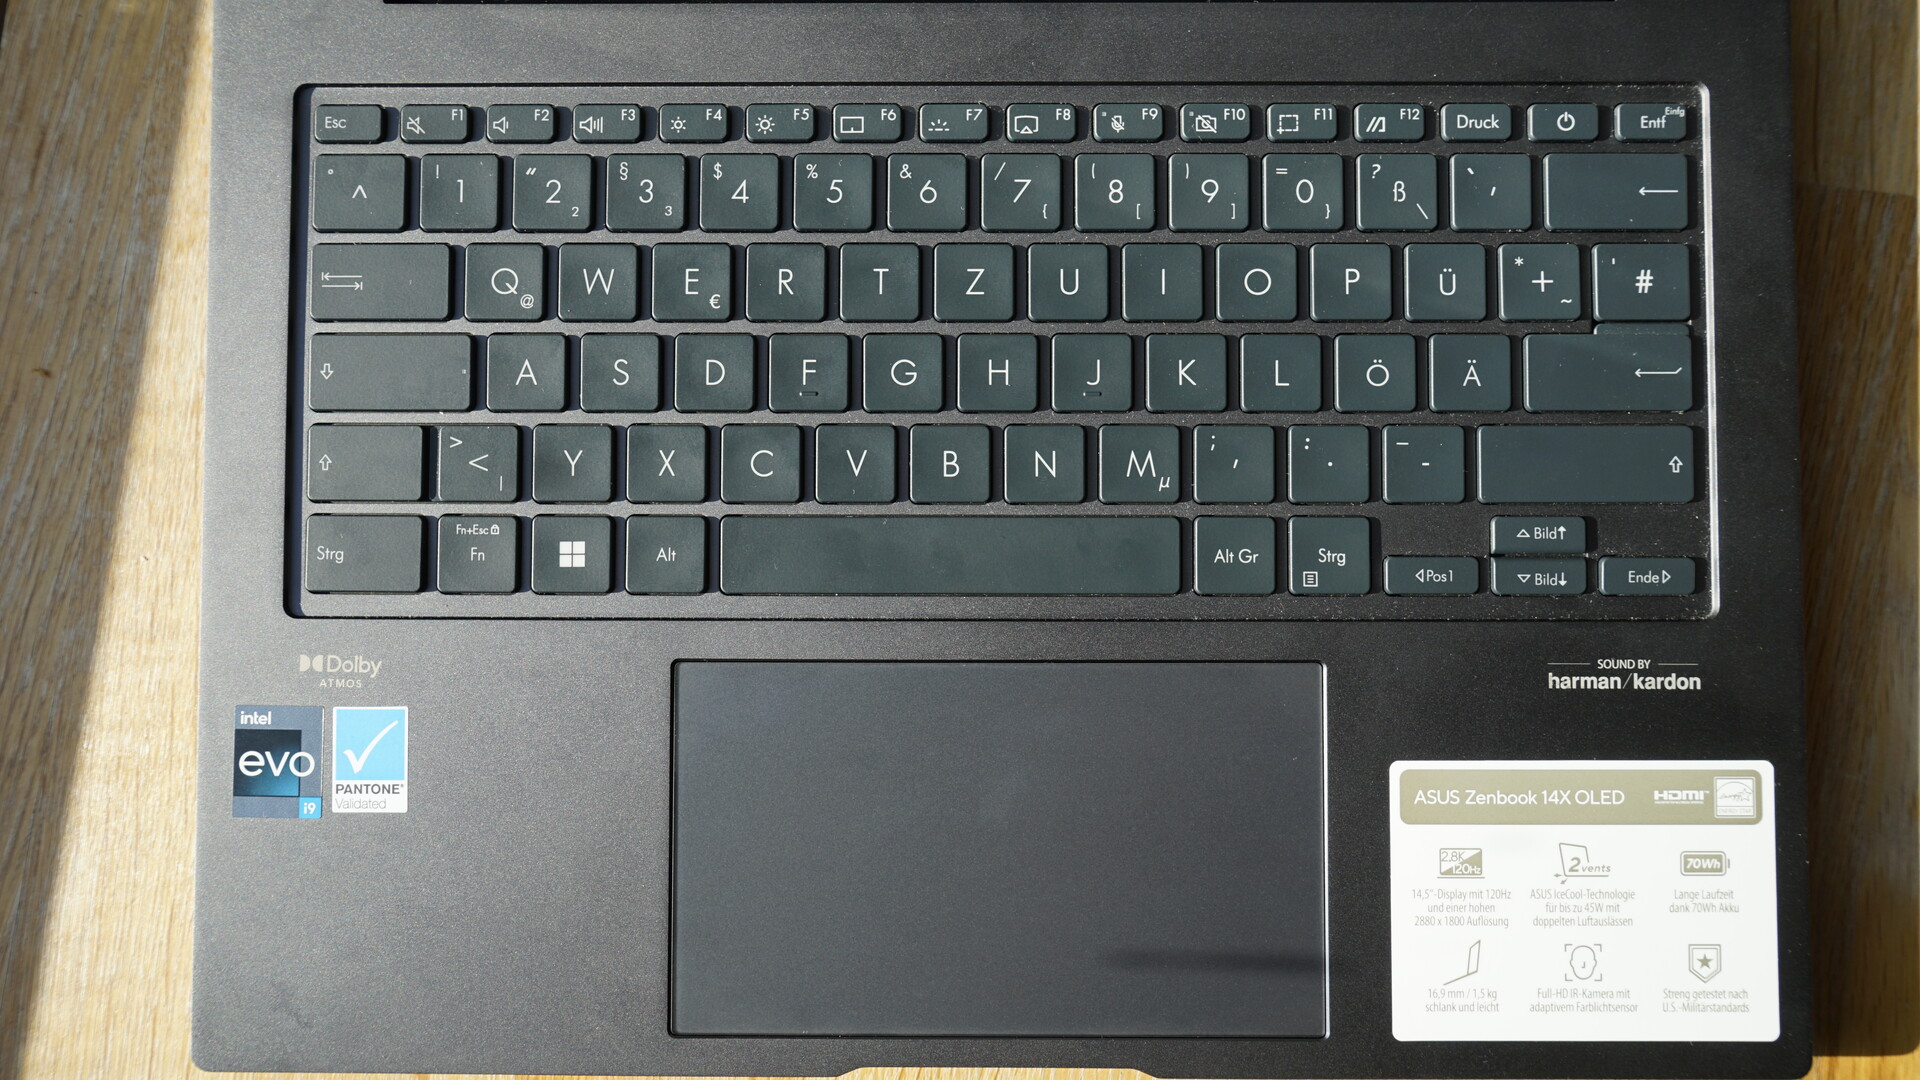
新款华硕ZenBook 14X的外壳在很大程度上与前代产品相似,但在设计上还是略有不同。整个机箱由铝制成,因此特别坚固和抗扭,这也反映在更高的重量上。机盖在不受力的情况下无法翘起,并采用了与2023年ZenBook S 13相同的ProArt标志。新的ZenBook有砂岩米色 或墨玉灰两种颜色可供选择。我们评测的灰色变体看起来高品质和优雅,但很快就会出现指纹。
关闭时,盖子以磁力固定在底座上。铰链,就像箱子的其他部分一样,是高质量和紧密的。不过,单手打开笔记本电脑是可能的。尽管铰链很紧,但由于底座足够重和稳定,打字时显示屏不会来回晃动。
坚固的设计也延伸到了键盘区域。在这里,ZenBook也是非常坚固的,键盘区没有任何地方屈服。
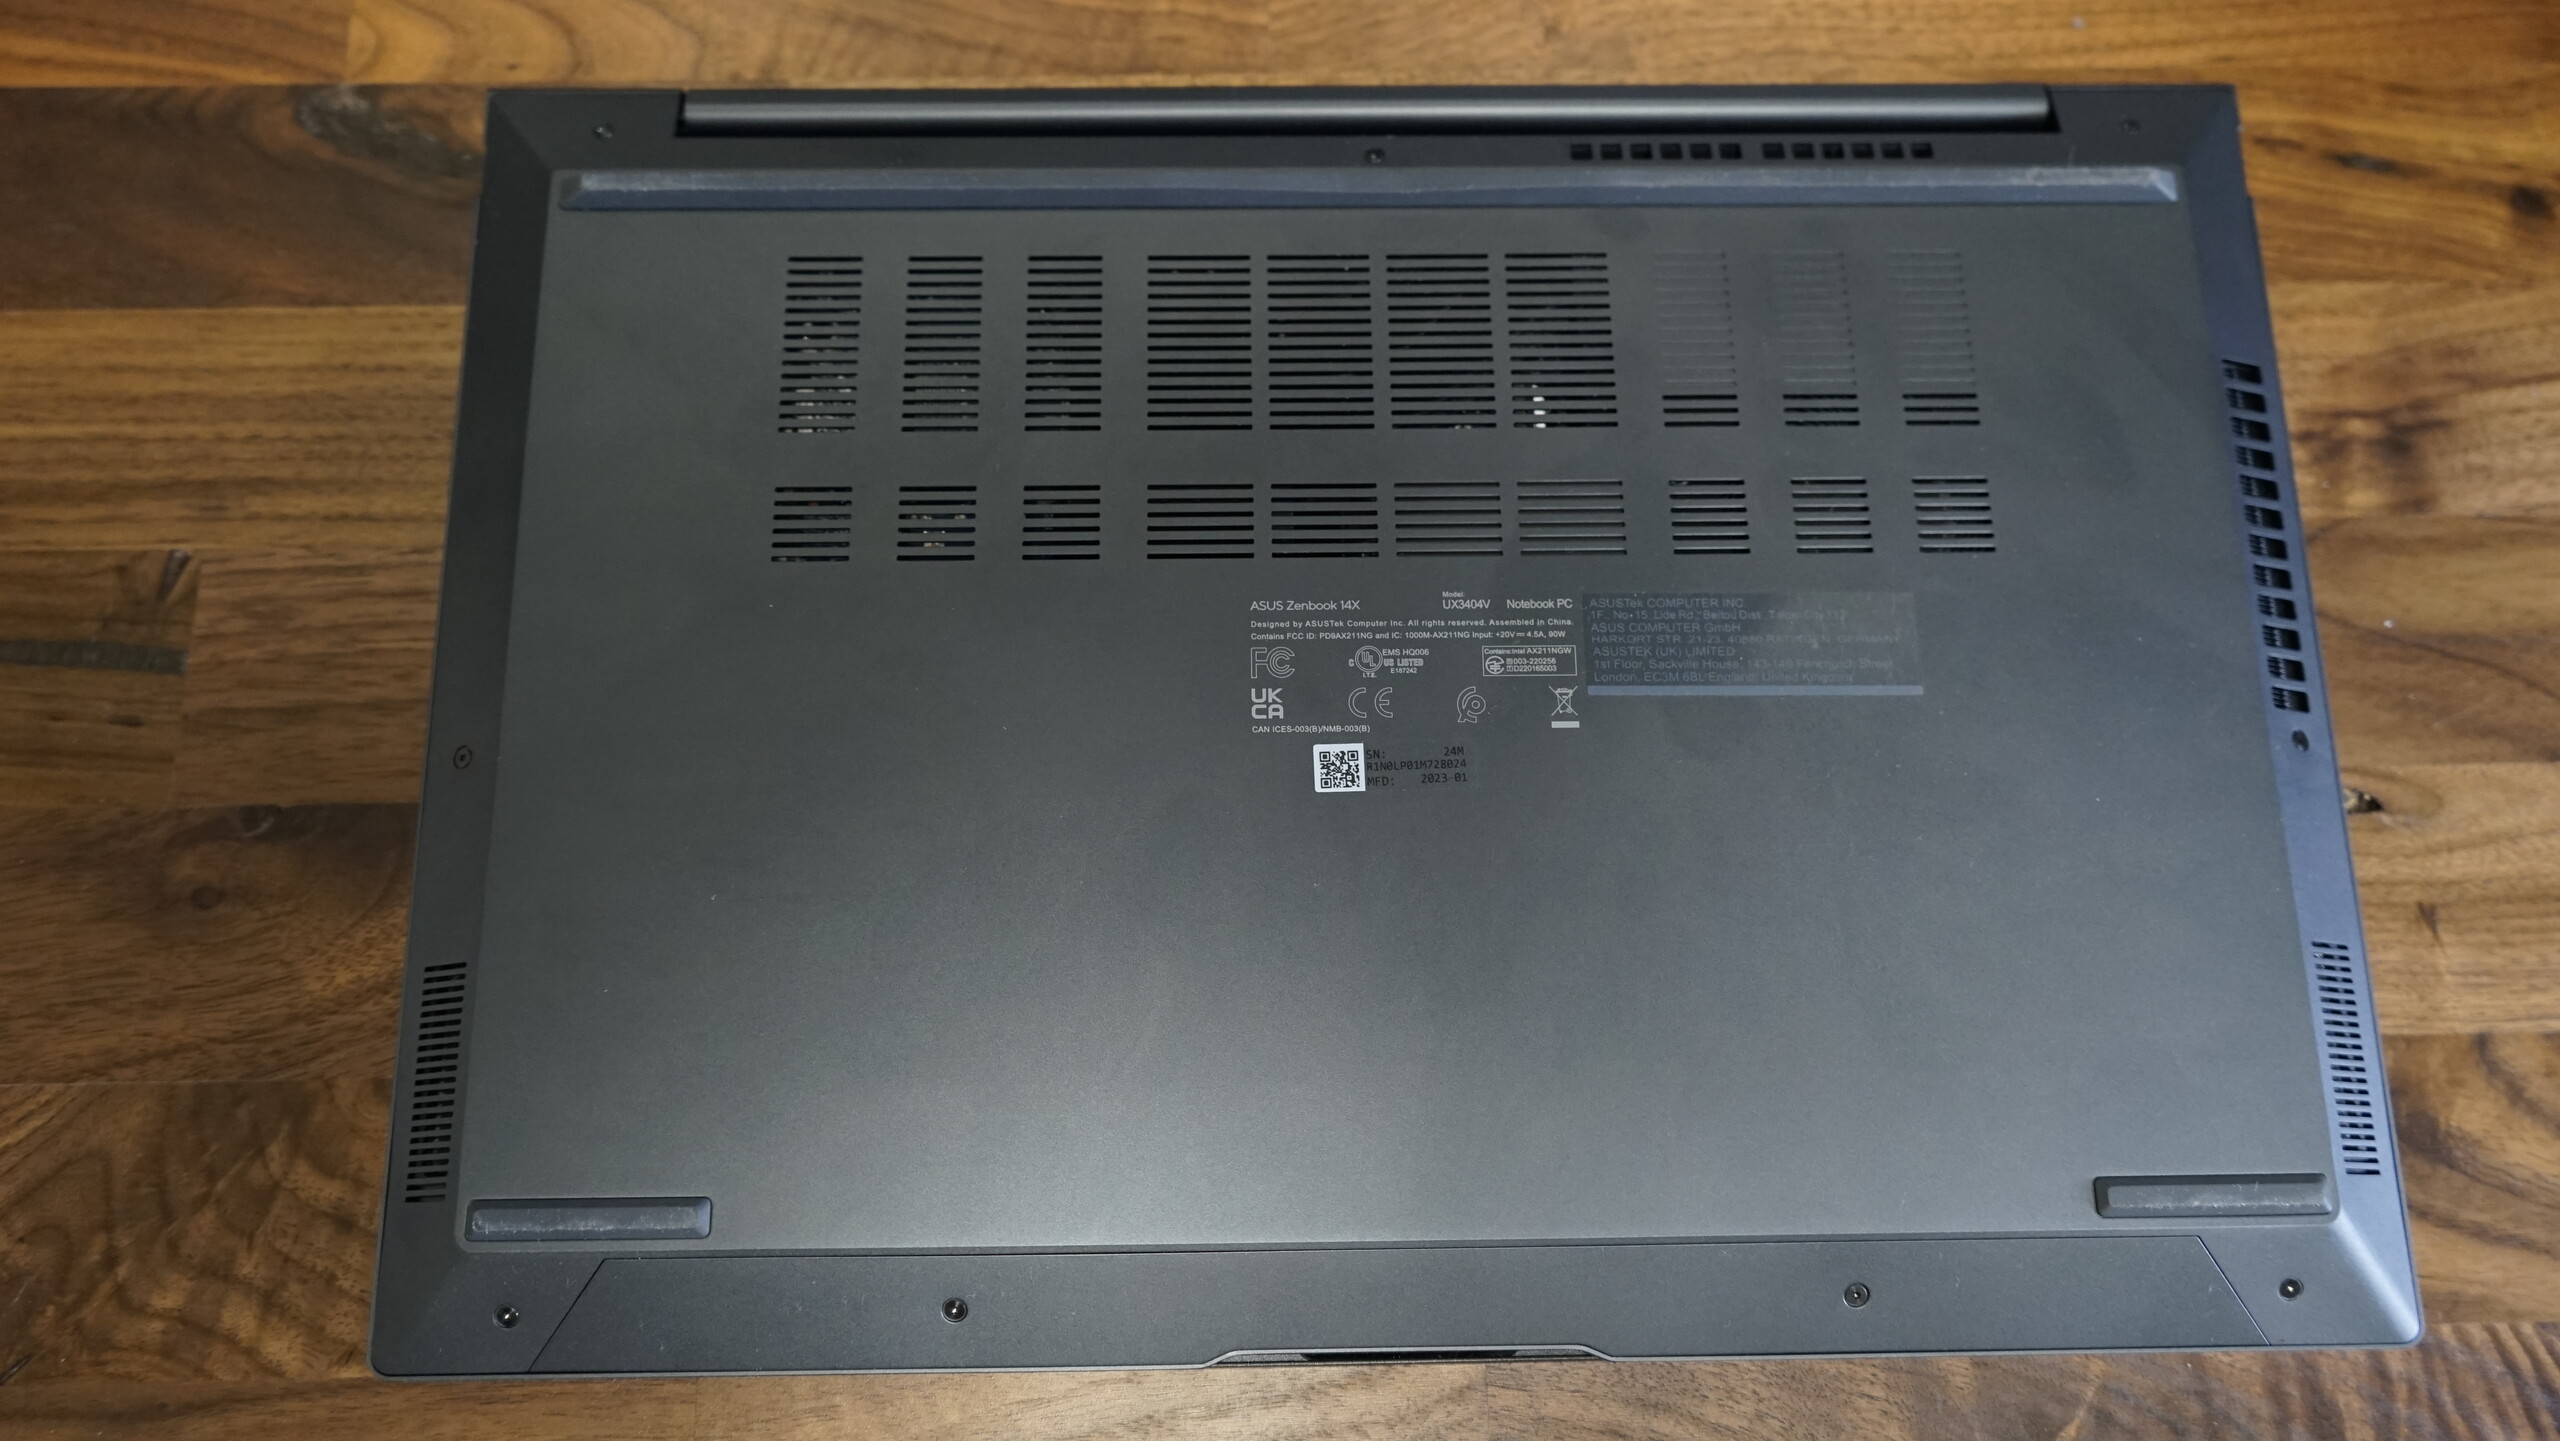
与2023年的ZenBook S 13不同,新的ZenBook 14X没有使用ErgoLift机制,而是落在了经典设计上。底部相对较大的支脚为风扇提供了足够的空间,使其能够不受限制地工作。
上一版本的ZenBook 14X的重量超过了许多其他子笔记本,为1.406公斤。2023年的ZenBook 14X将这一点提高了一个档次,现在重量为1.56公斤。在比较领域,联想超薄Pro 7 14ARP8和戴尔Inspiron 14 Plus 7420甚至更高,而华硕ROG Flow Z13 GZ301V采用相同的英特尔酷睿i9处理器,重量几乎完全相同,为1.551公斤。ZenBook 14X的尺寸为16.9毫米,属于中场,在深度方面也不太超过平均水平。
装备
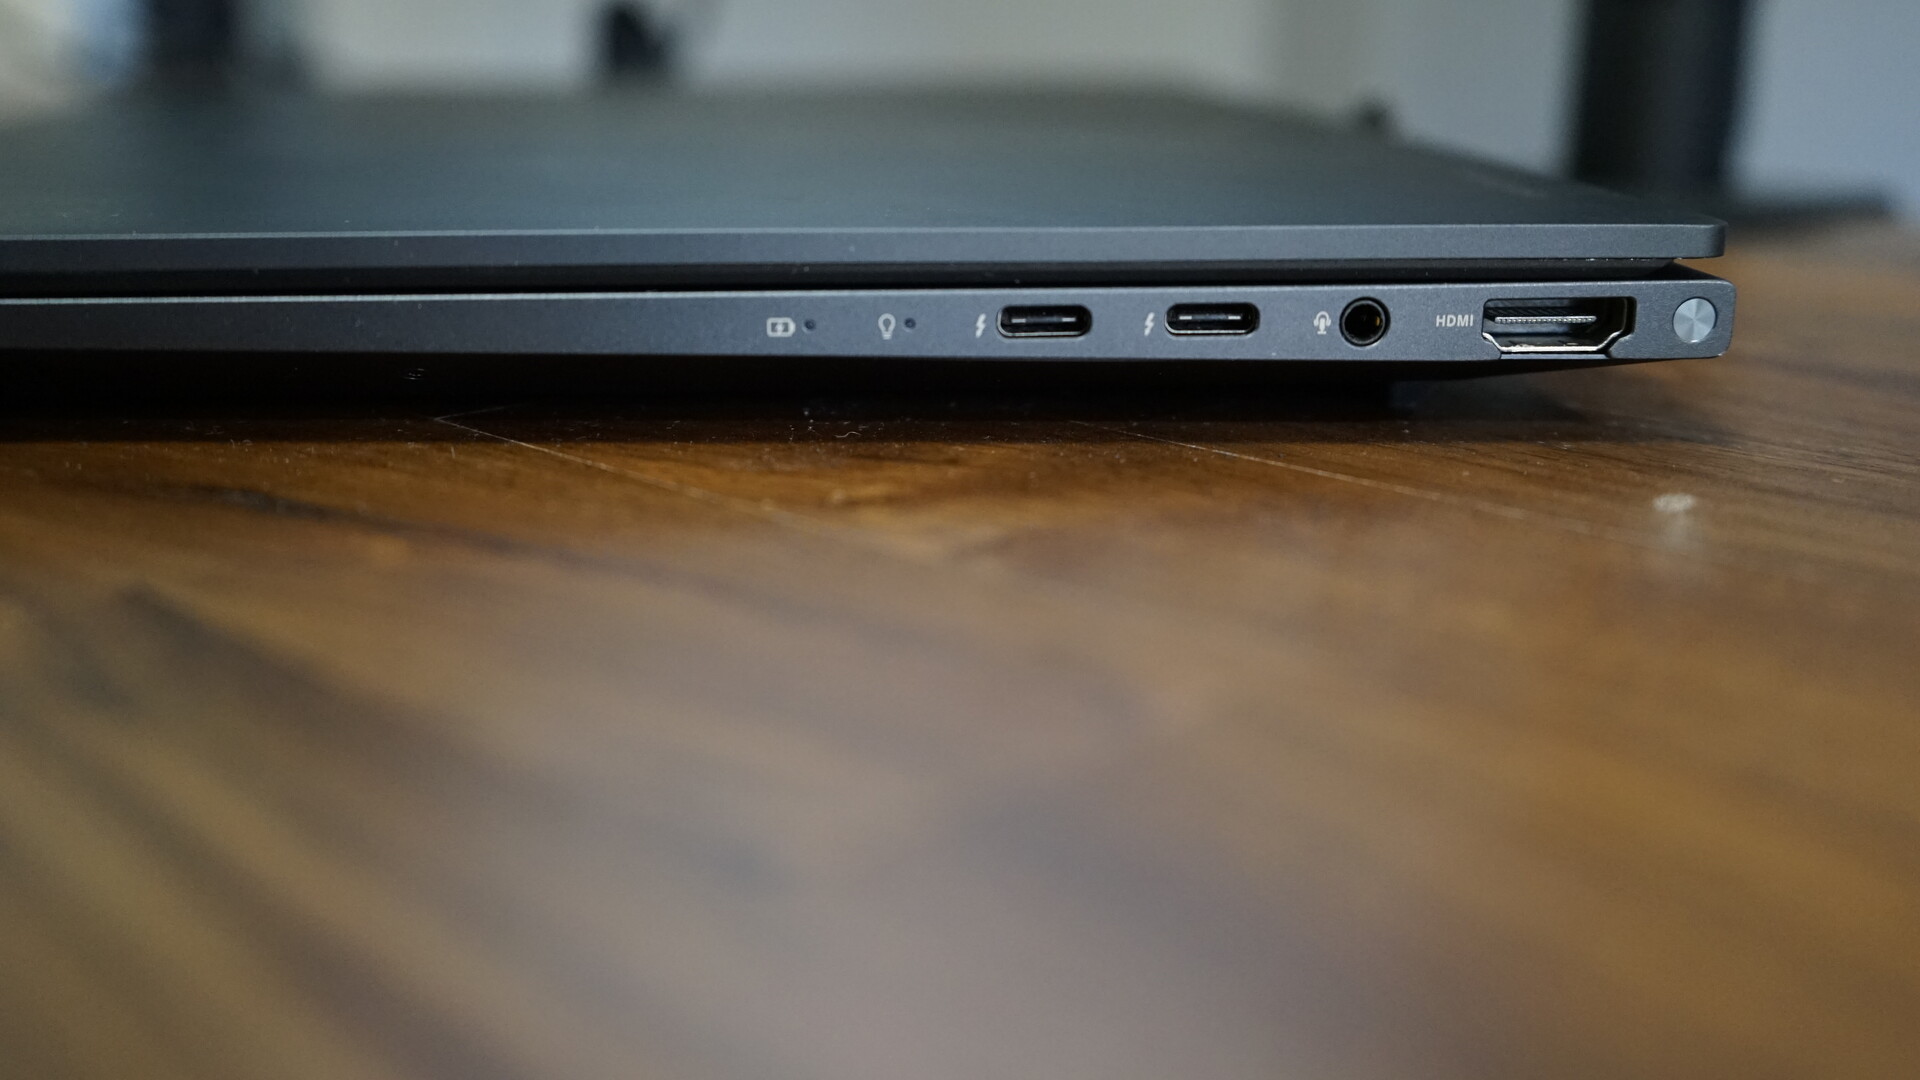
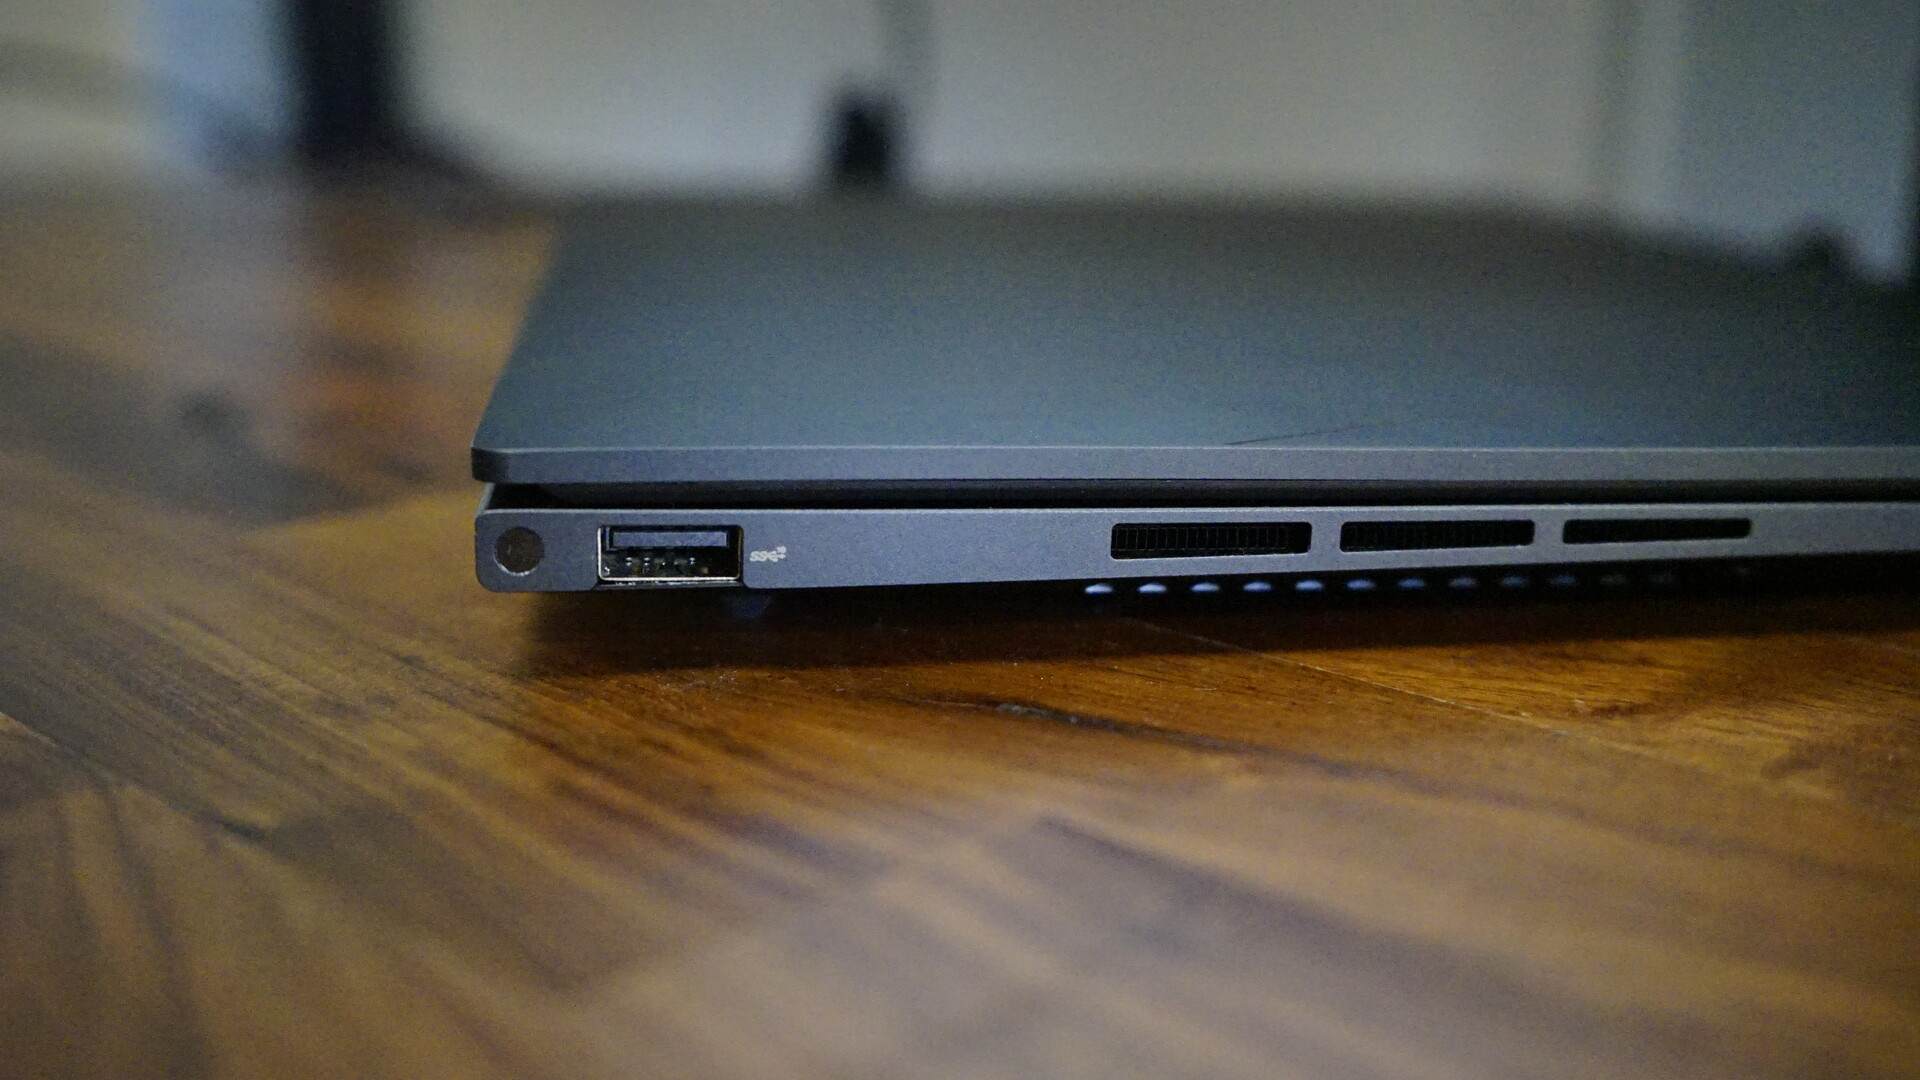
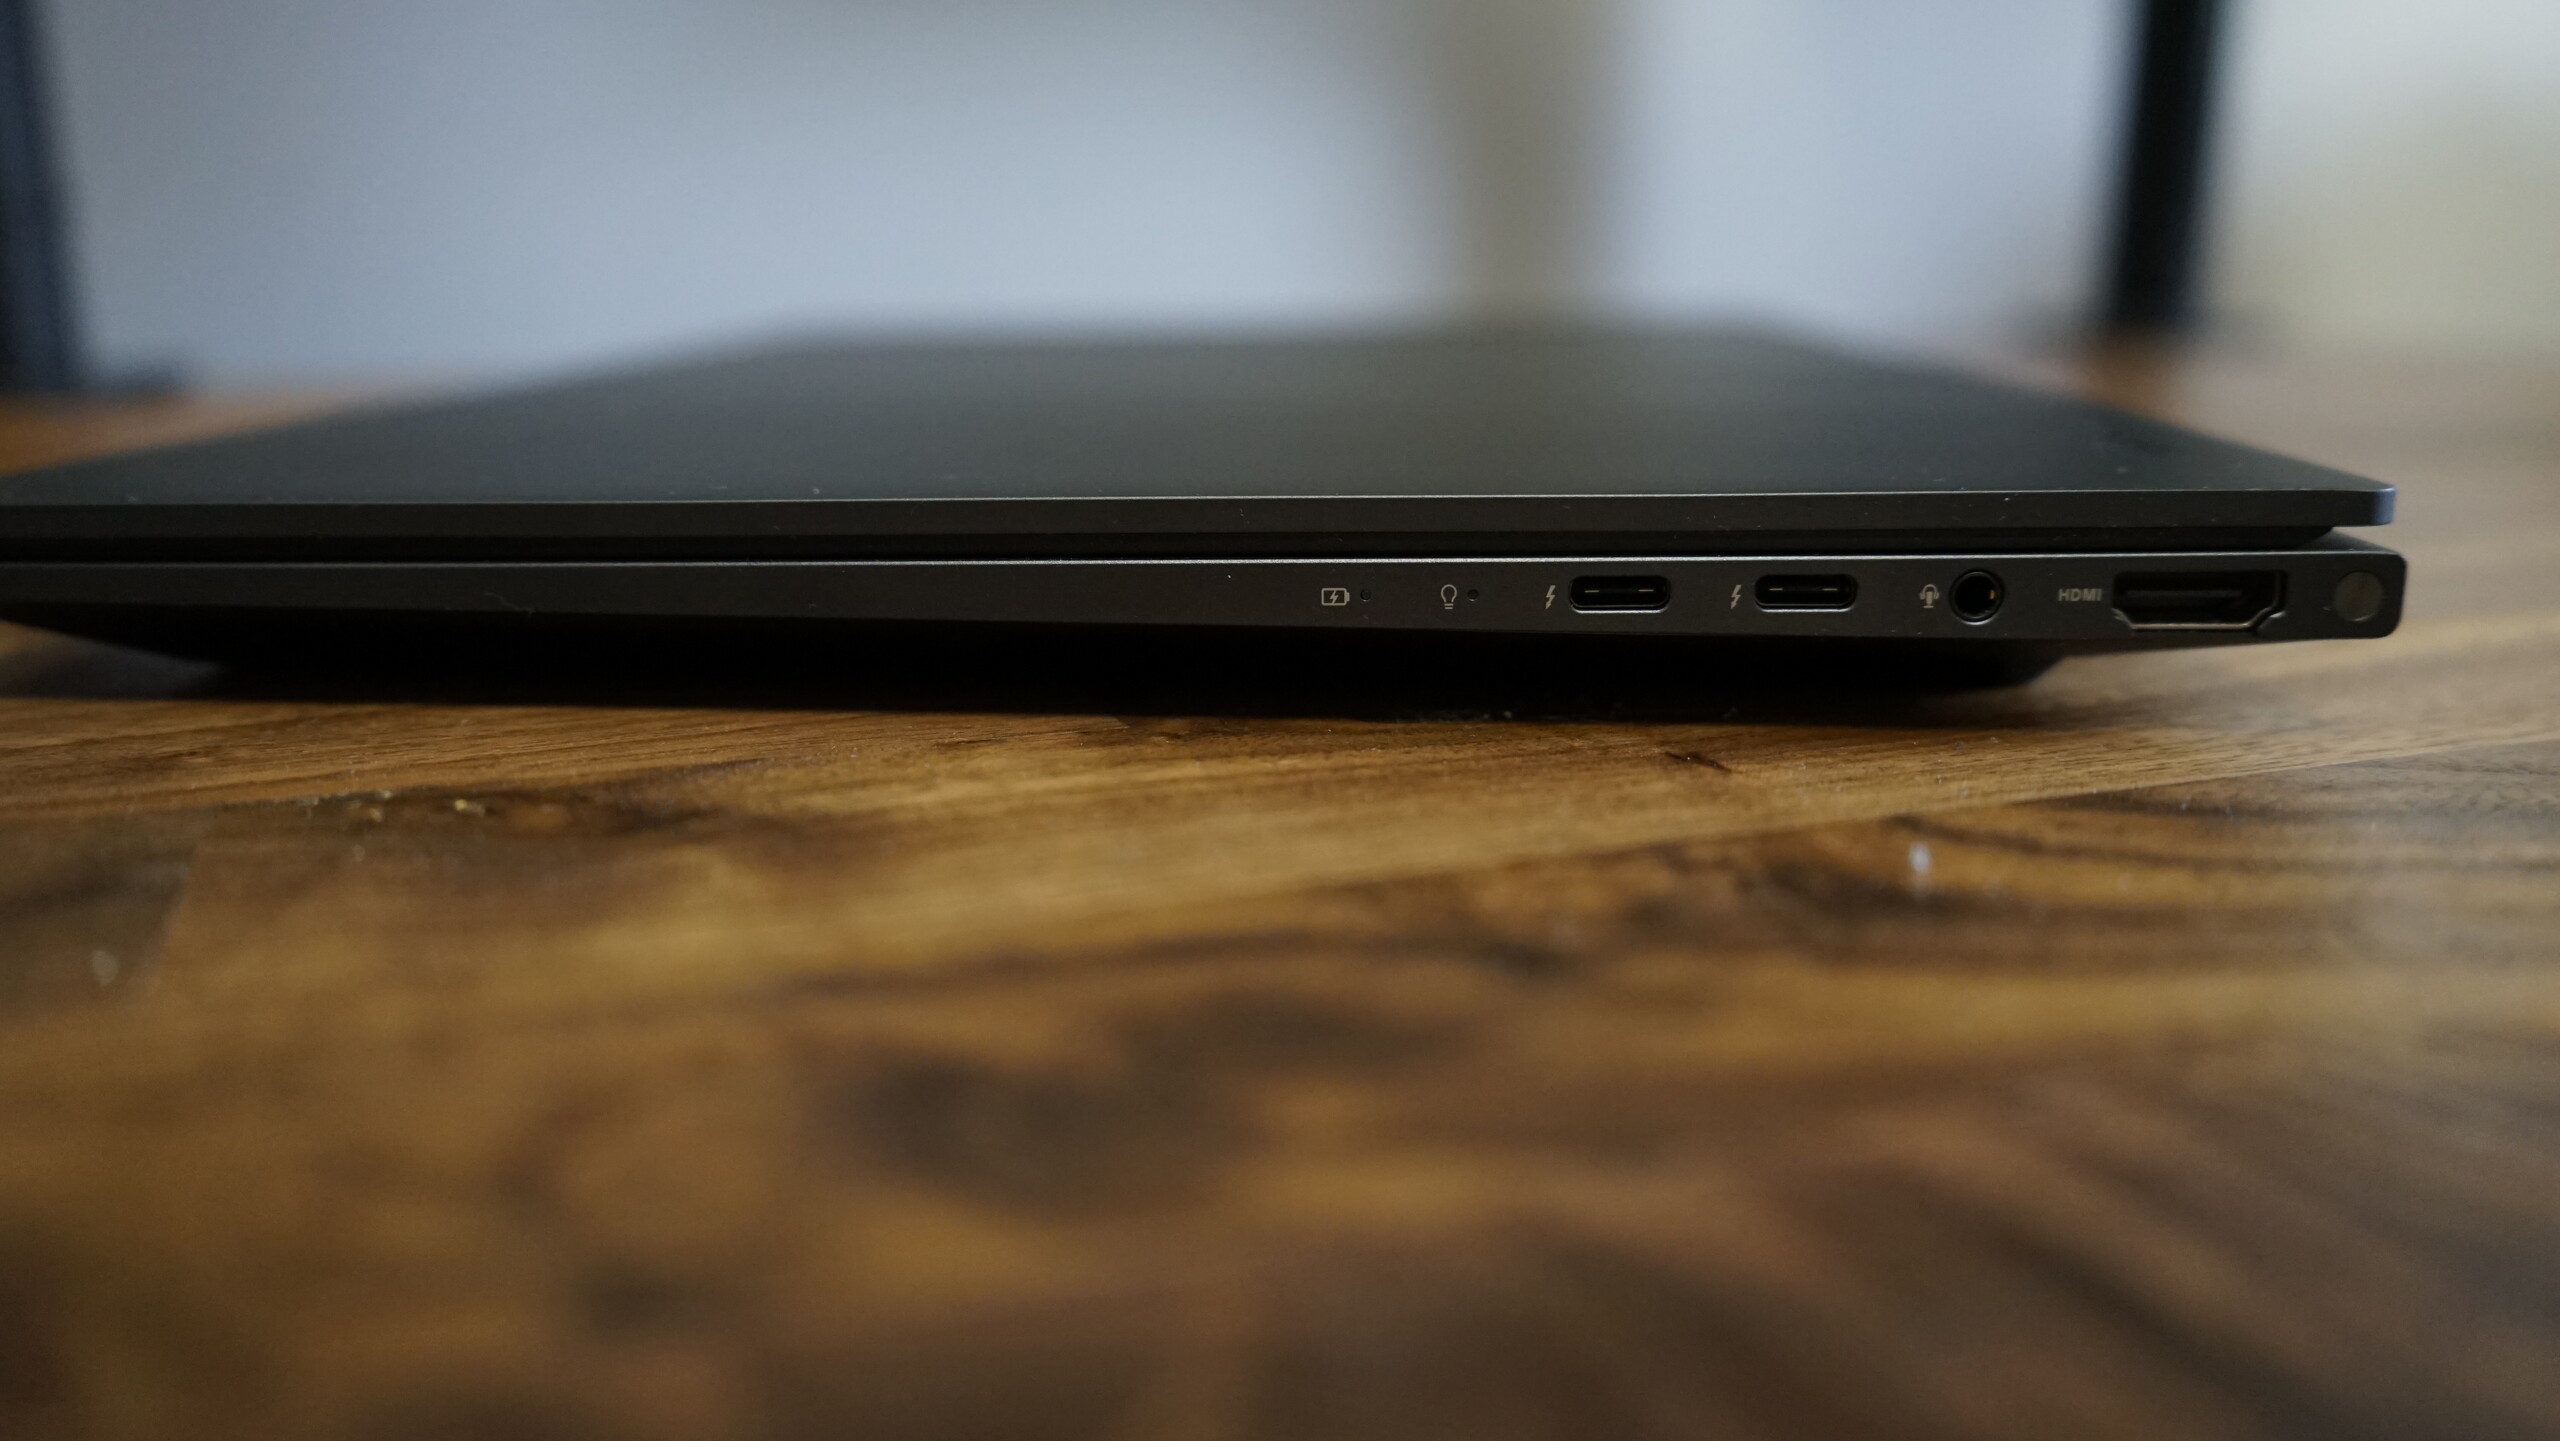
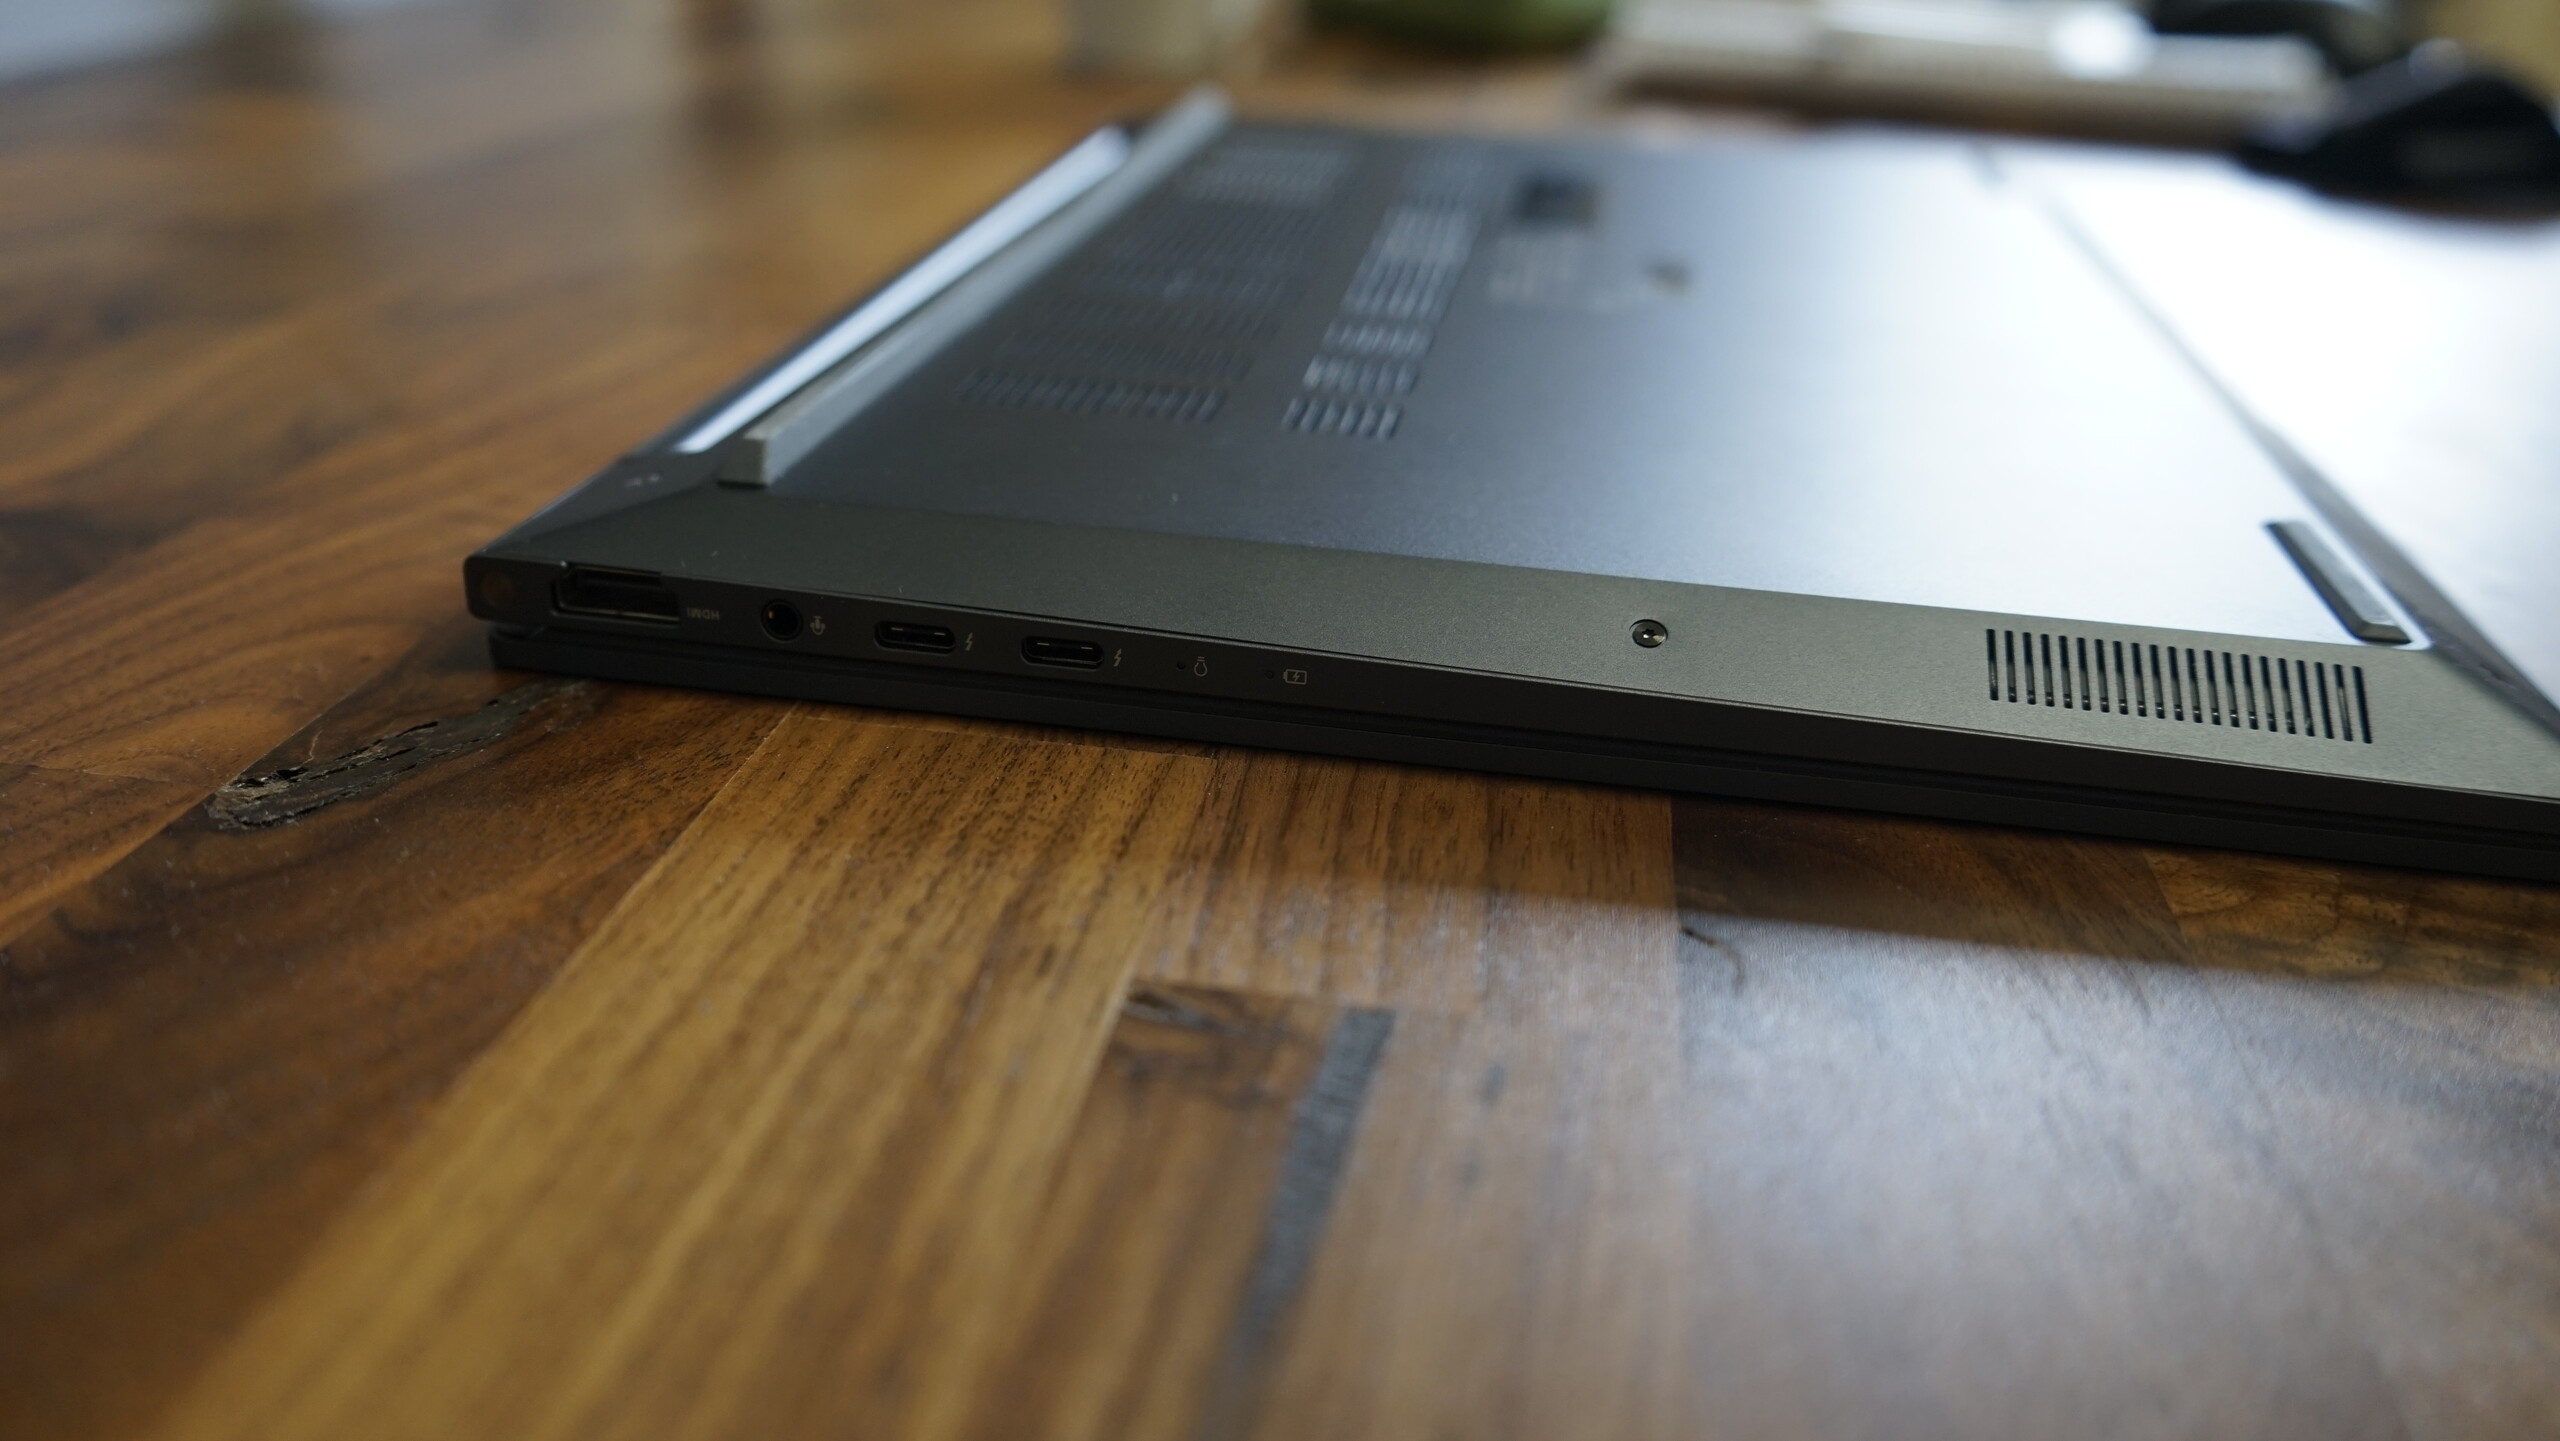
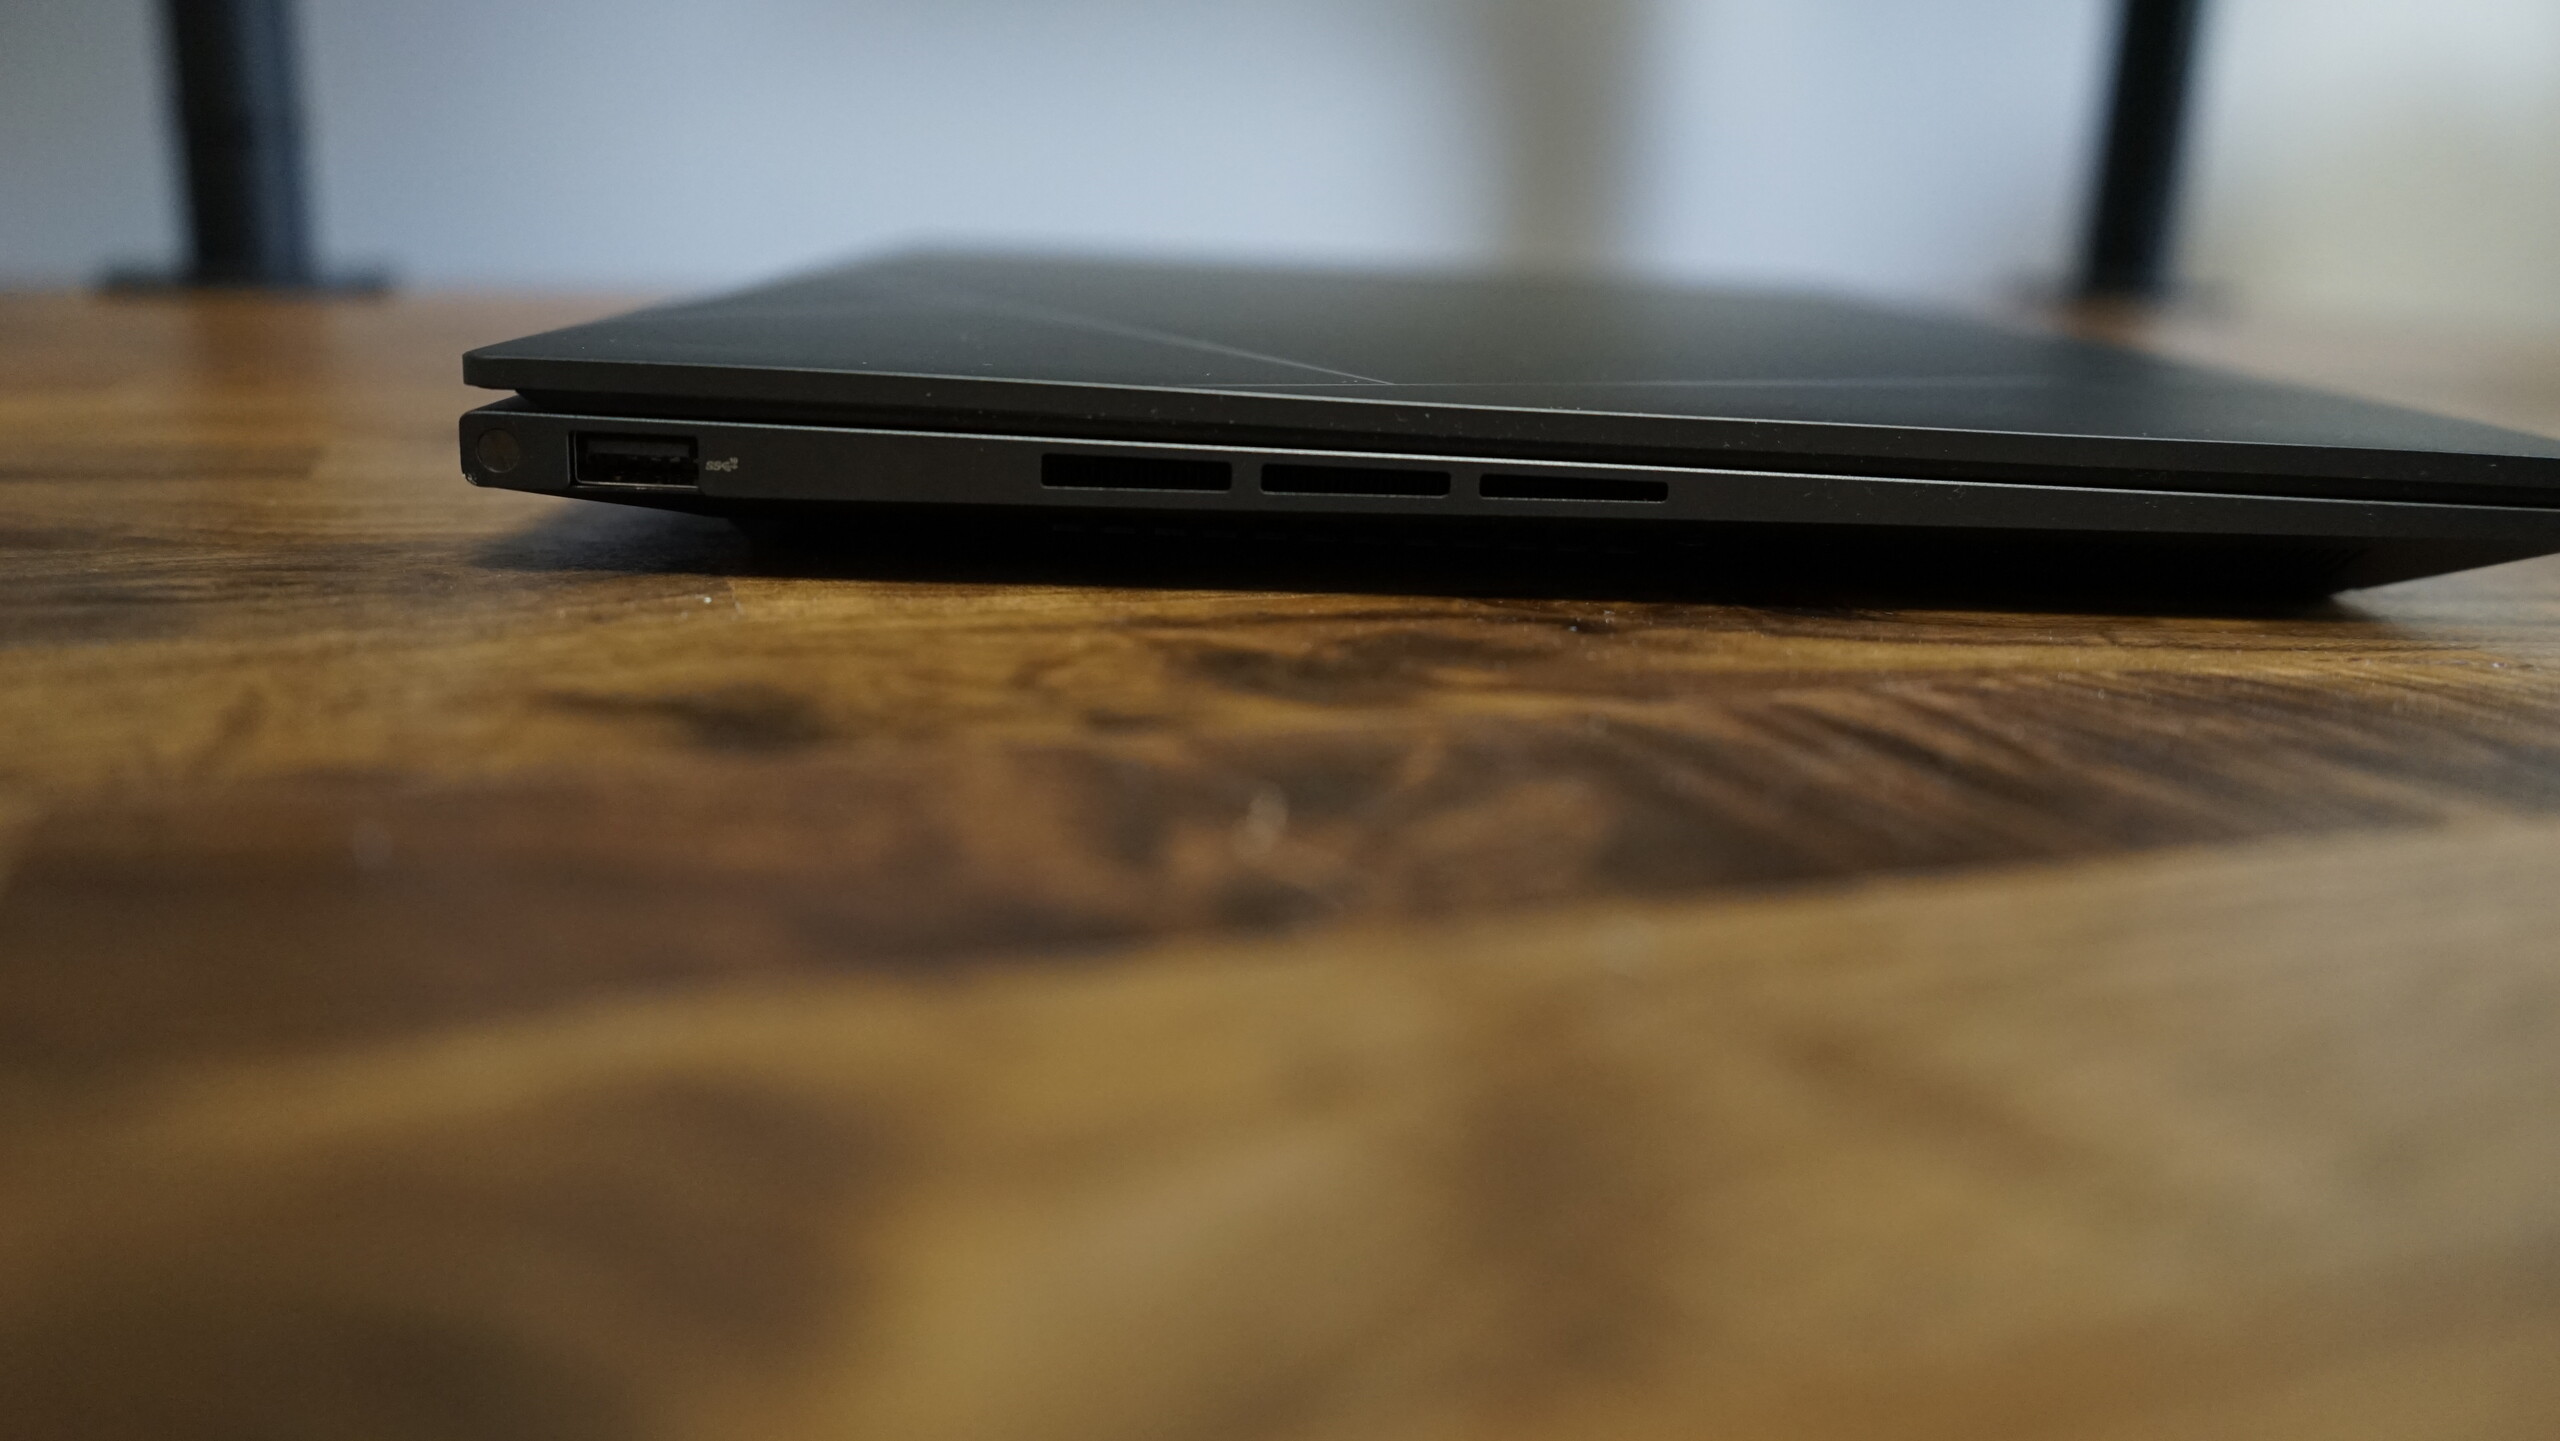
与前代产品相比,遗憾的是不再有microSD读卡器了。其他端口的位置也有变化。在左侧,现在只有一个USB 3.2 Gen 2 Type-A端口。所有其他端口,即两个Thunderbolt端口、一个HDMI 2.1端口和音频组合端口现在都在右侧。两个Thunderbolt端口都可以用来充电,所以我们更希望两边都有。
沟通
所安装的英特尔Wi-Fi 6E-AX211模块是可替换的,并提供了坚实的结果,没有连接问题。该卡的结果高于该机型的平均水平。该模块不仅支持最新的Wi-Fi 6E无线局域网标准,而且还支持蓝牙5.2。
网络摄像头
华硕对网络摄像头进行了升级,现在提供全高清而不是720p。由于集成了用于面部识别的红外传感器,Windows Hello成为可能。与去年相比,图像质量明显提高,但其结果在很大程度上取决于照明条件。


辅料
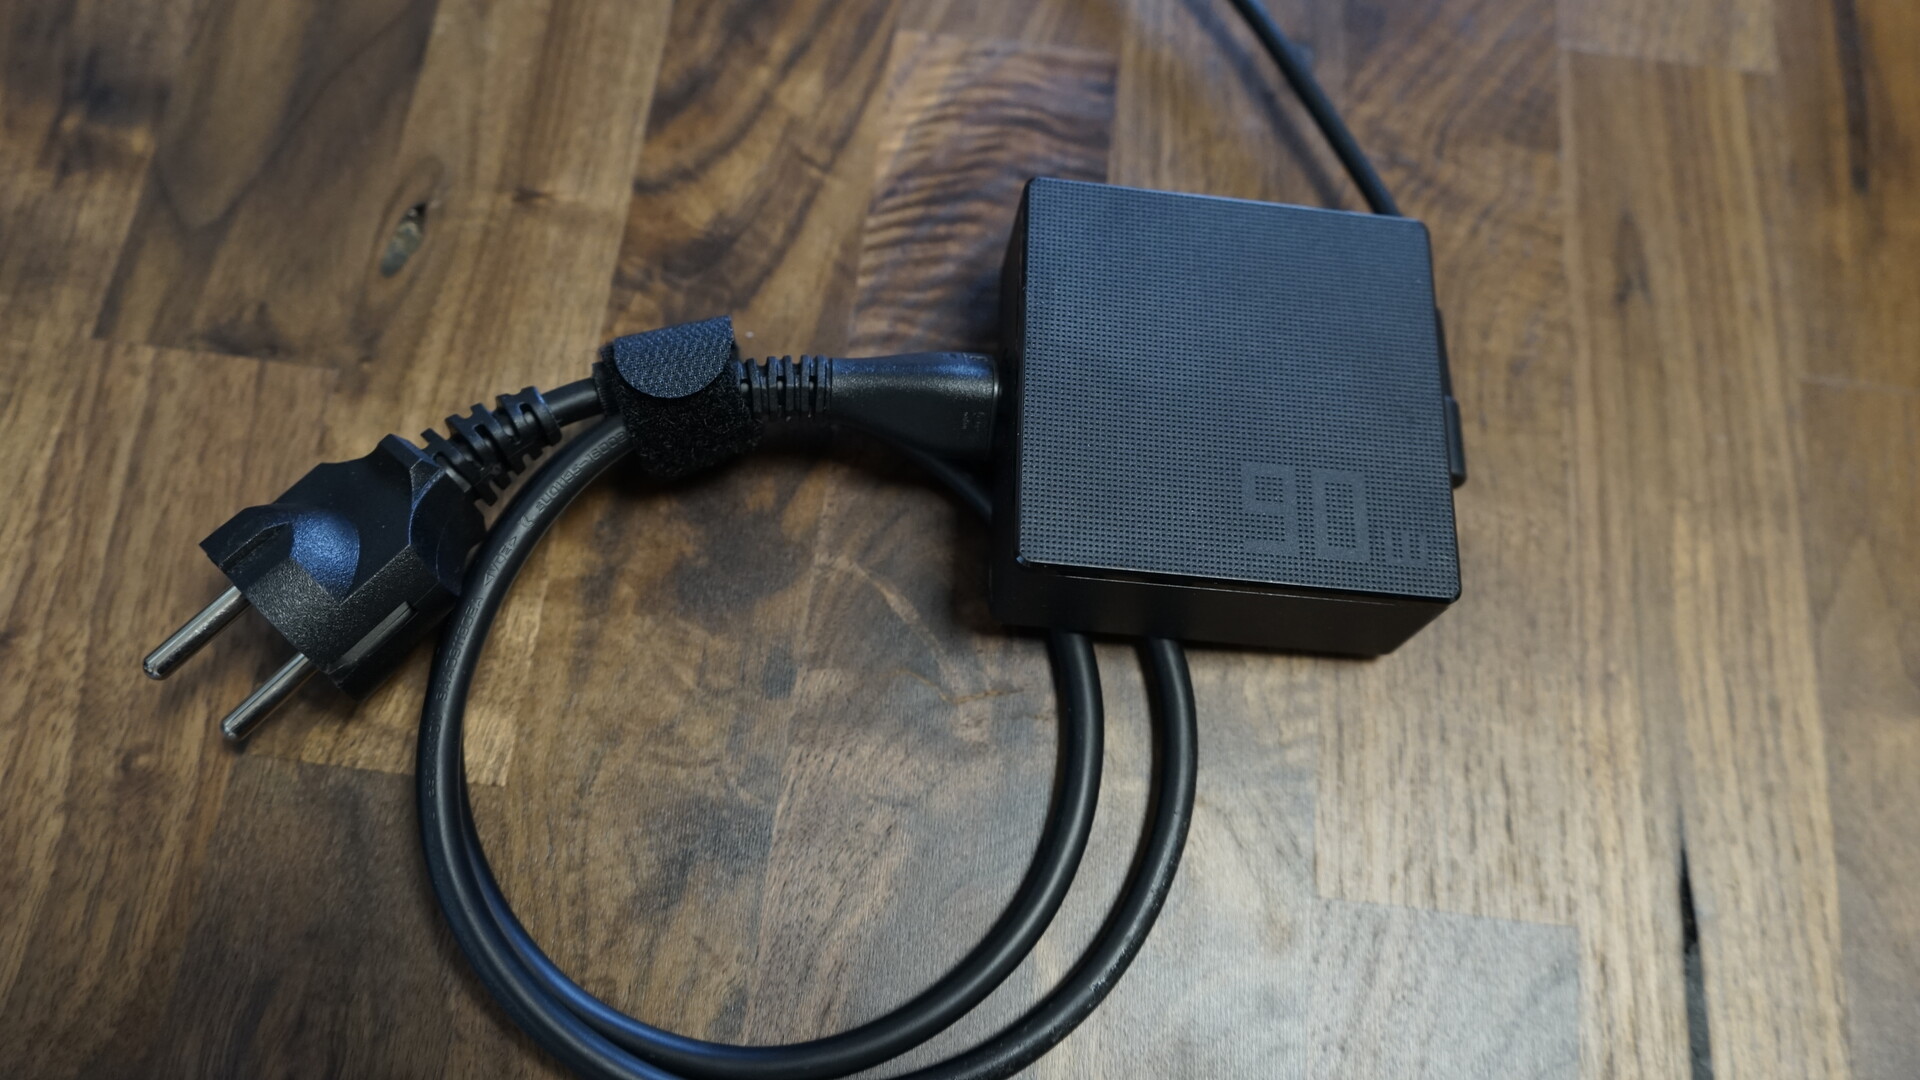
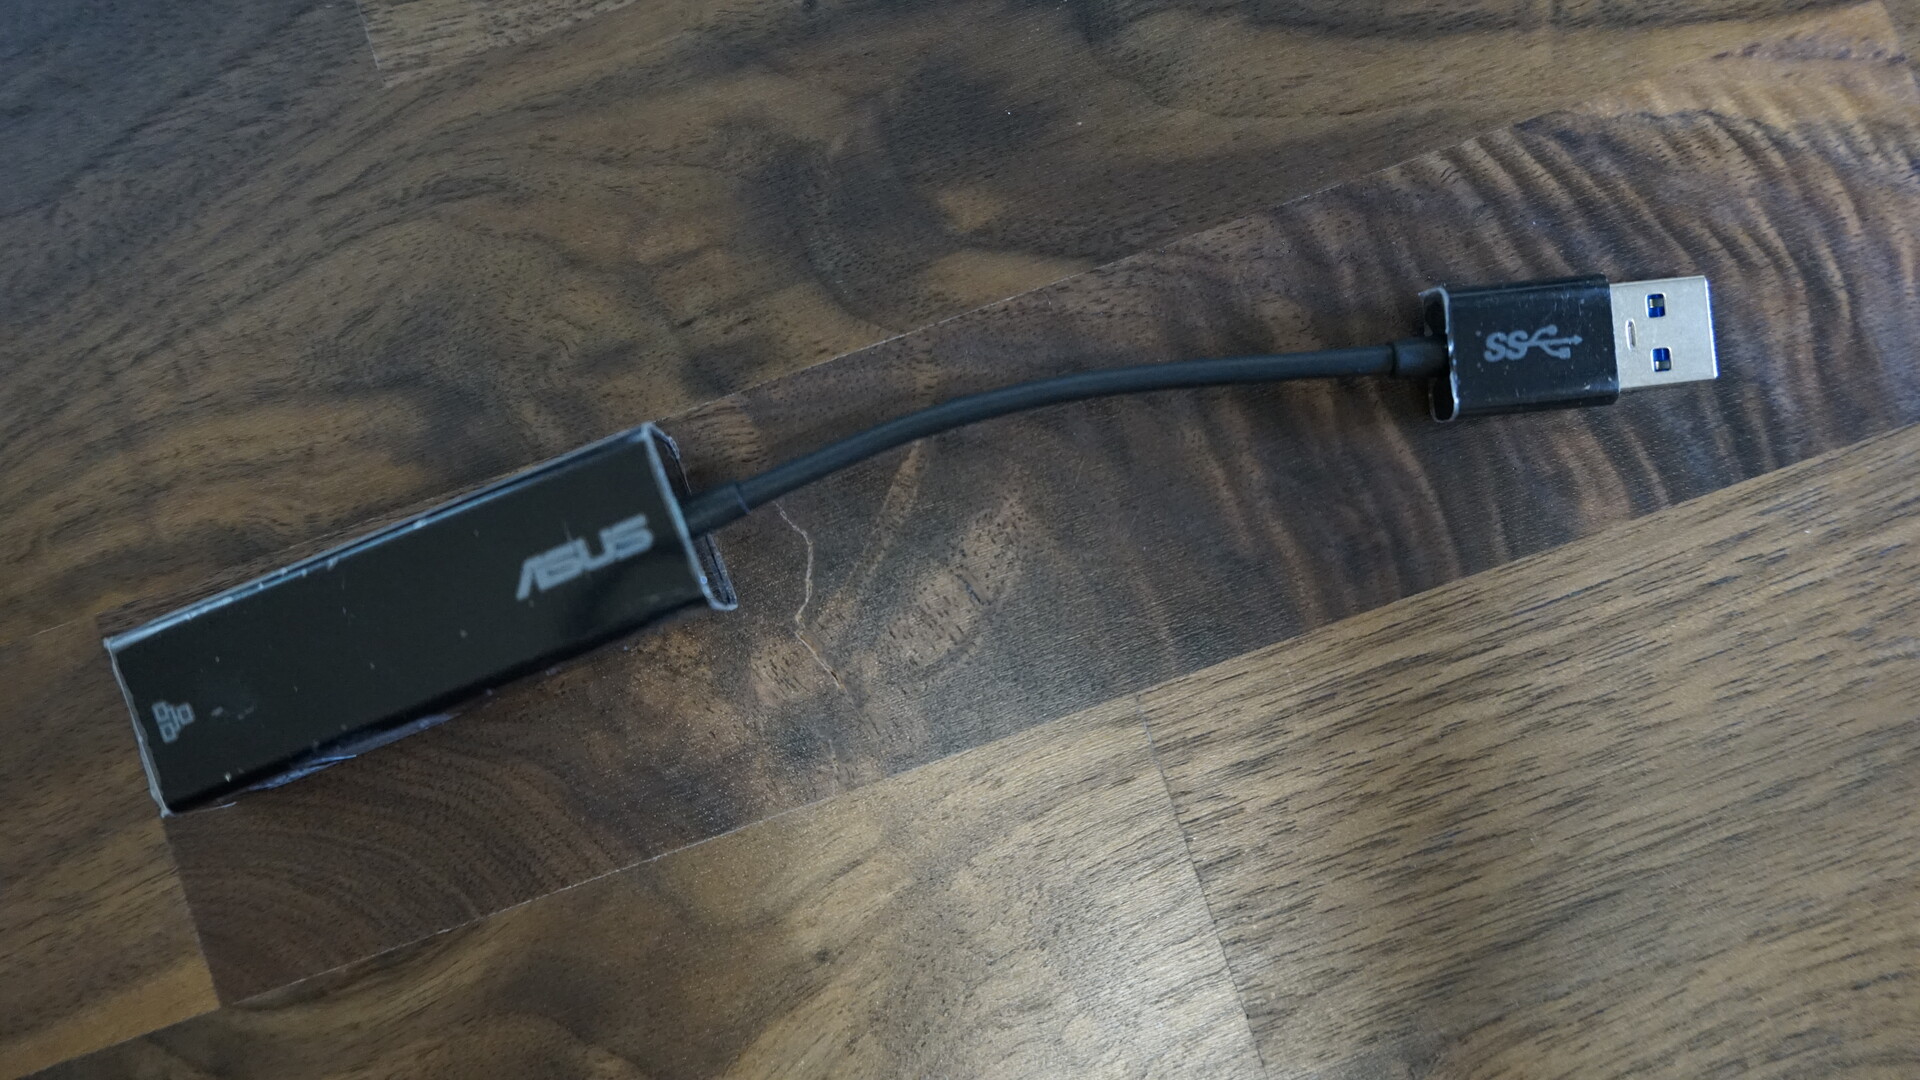
华硕ZenBook 14X的配件包括一个紧凑的90瓦电源,一个USB Type-A以太网适配器和一个实用的保护套。保护套由塑料制成,内部有柔软的触感。
维护
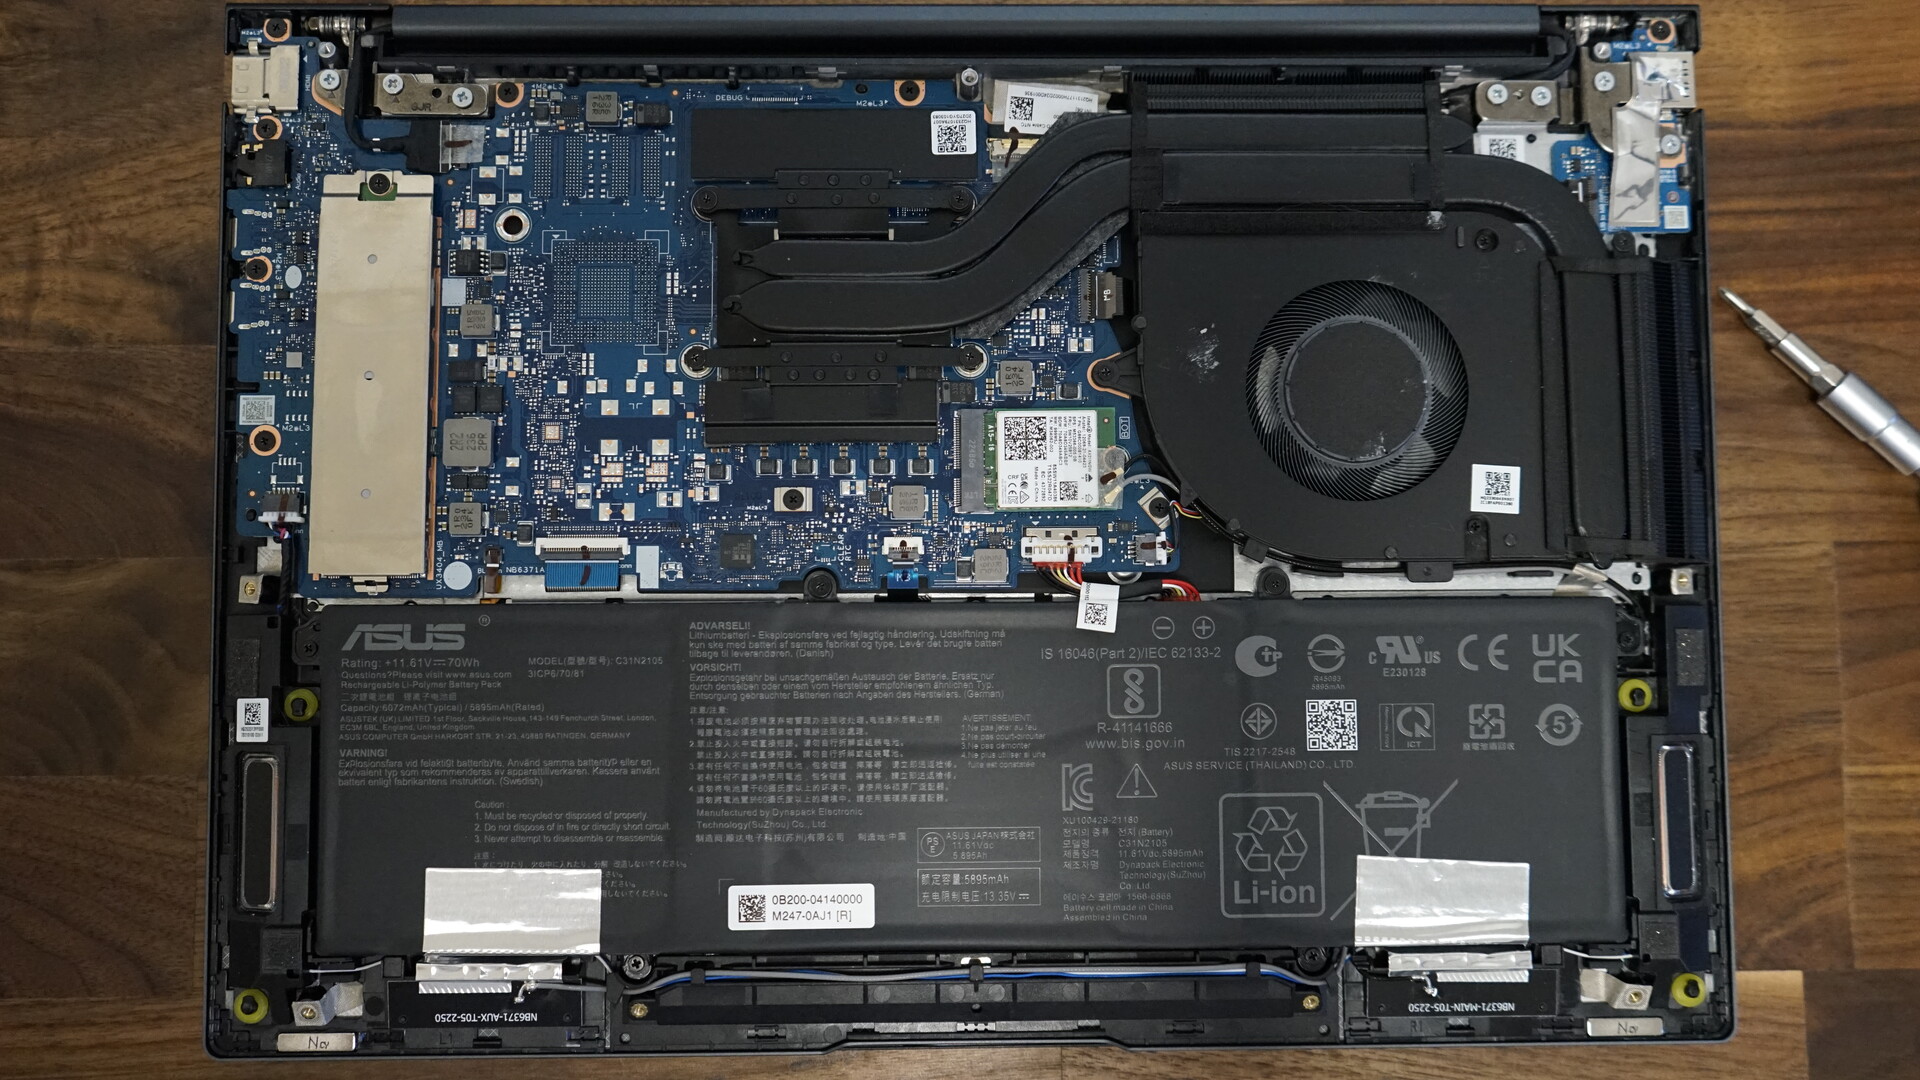
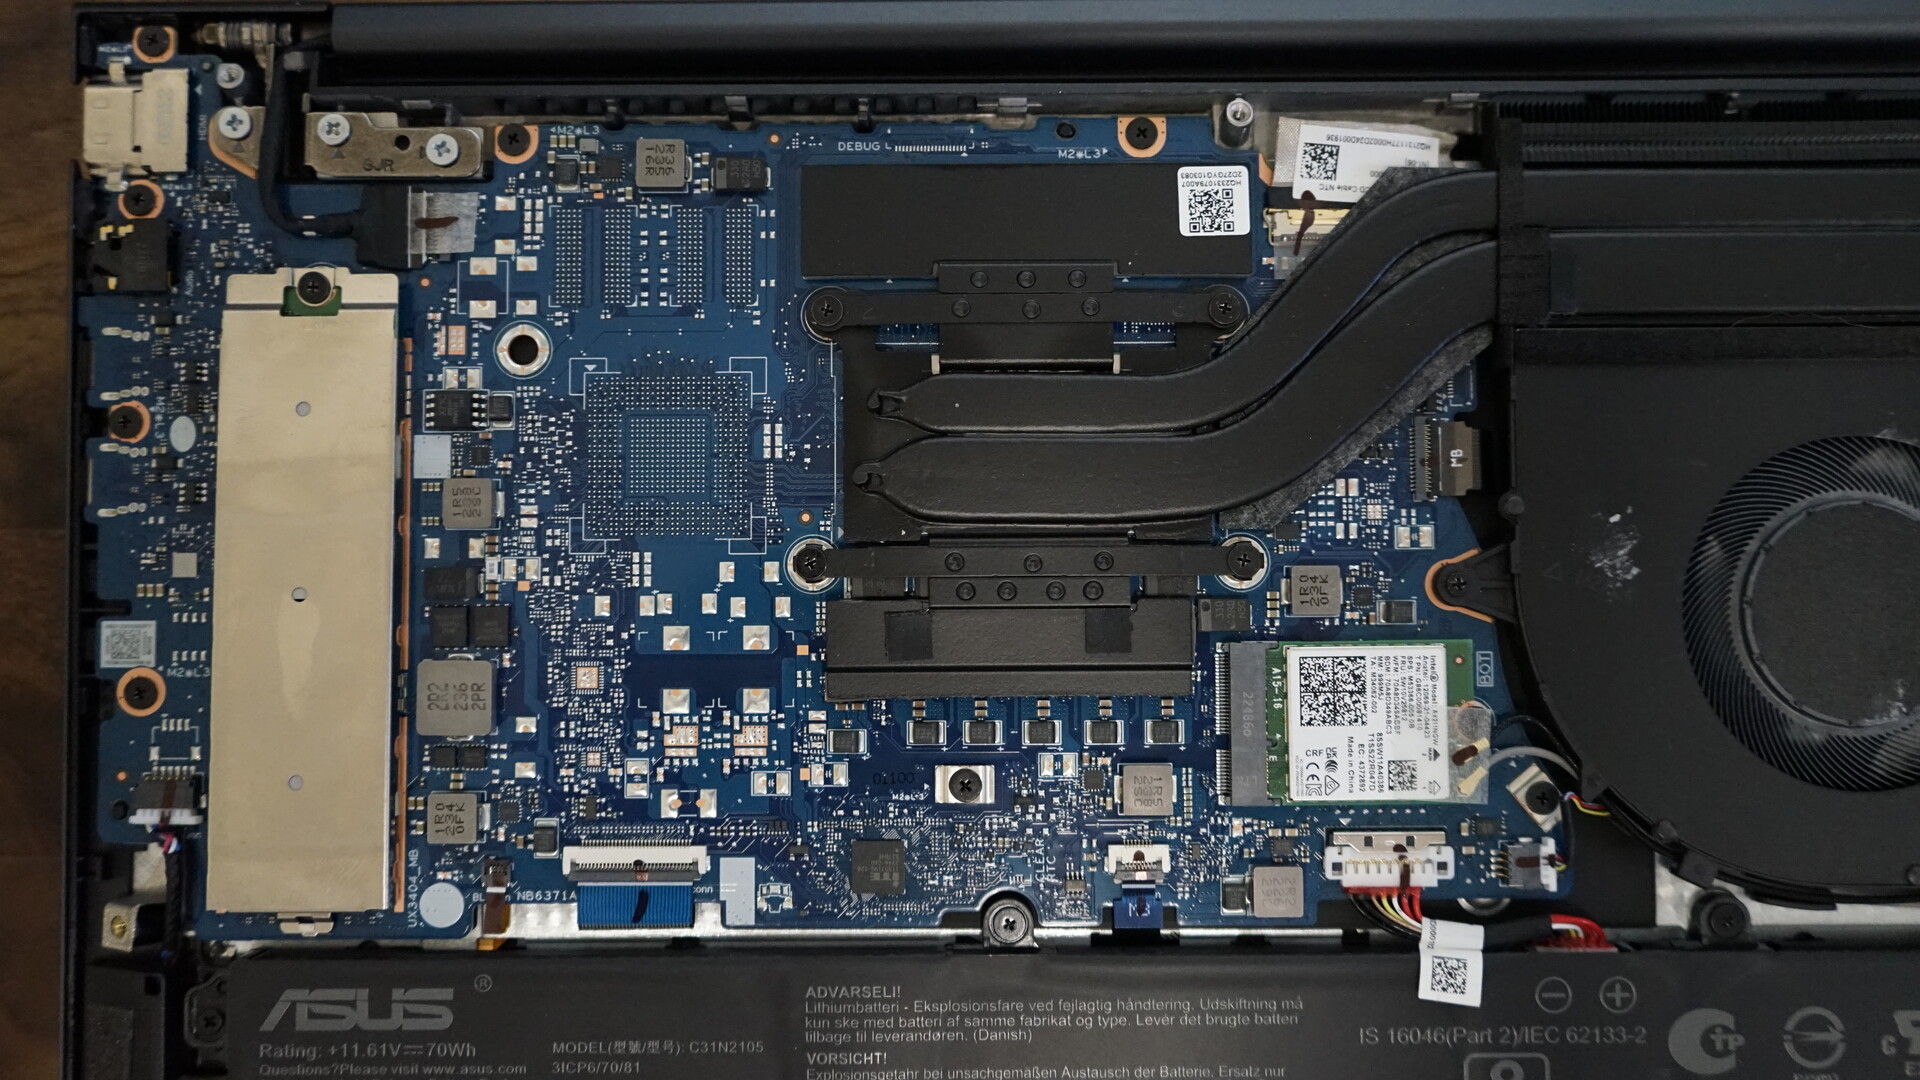
打开ZenBook相对容易,只需从底部卸下九颗容易触及的螺丝。Wi-Fi模块、电池和固态硬盘是可以更换的,而内存是焊接的。内部结构也显示了与前代产品相比在冷却方面的差异,因为2023型只安装了一个风扇。
担保
华硕在德国提供两年的提货和退货保证。这在其他国家可能有所不同,所以有兴趣的买家应该在购买前仔细检查。
输入设备
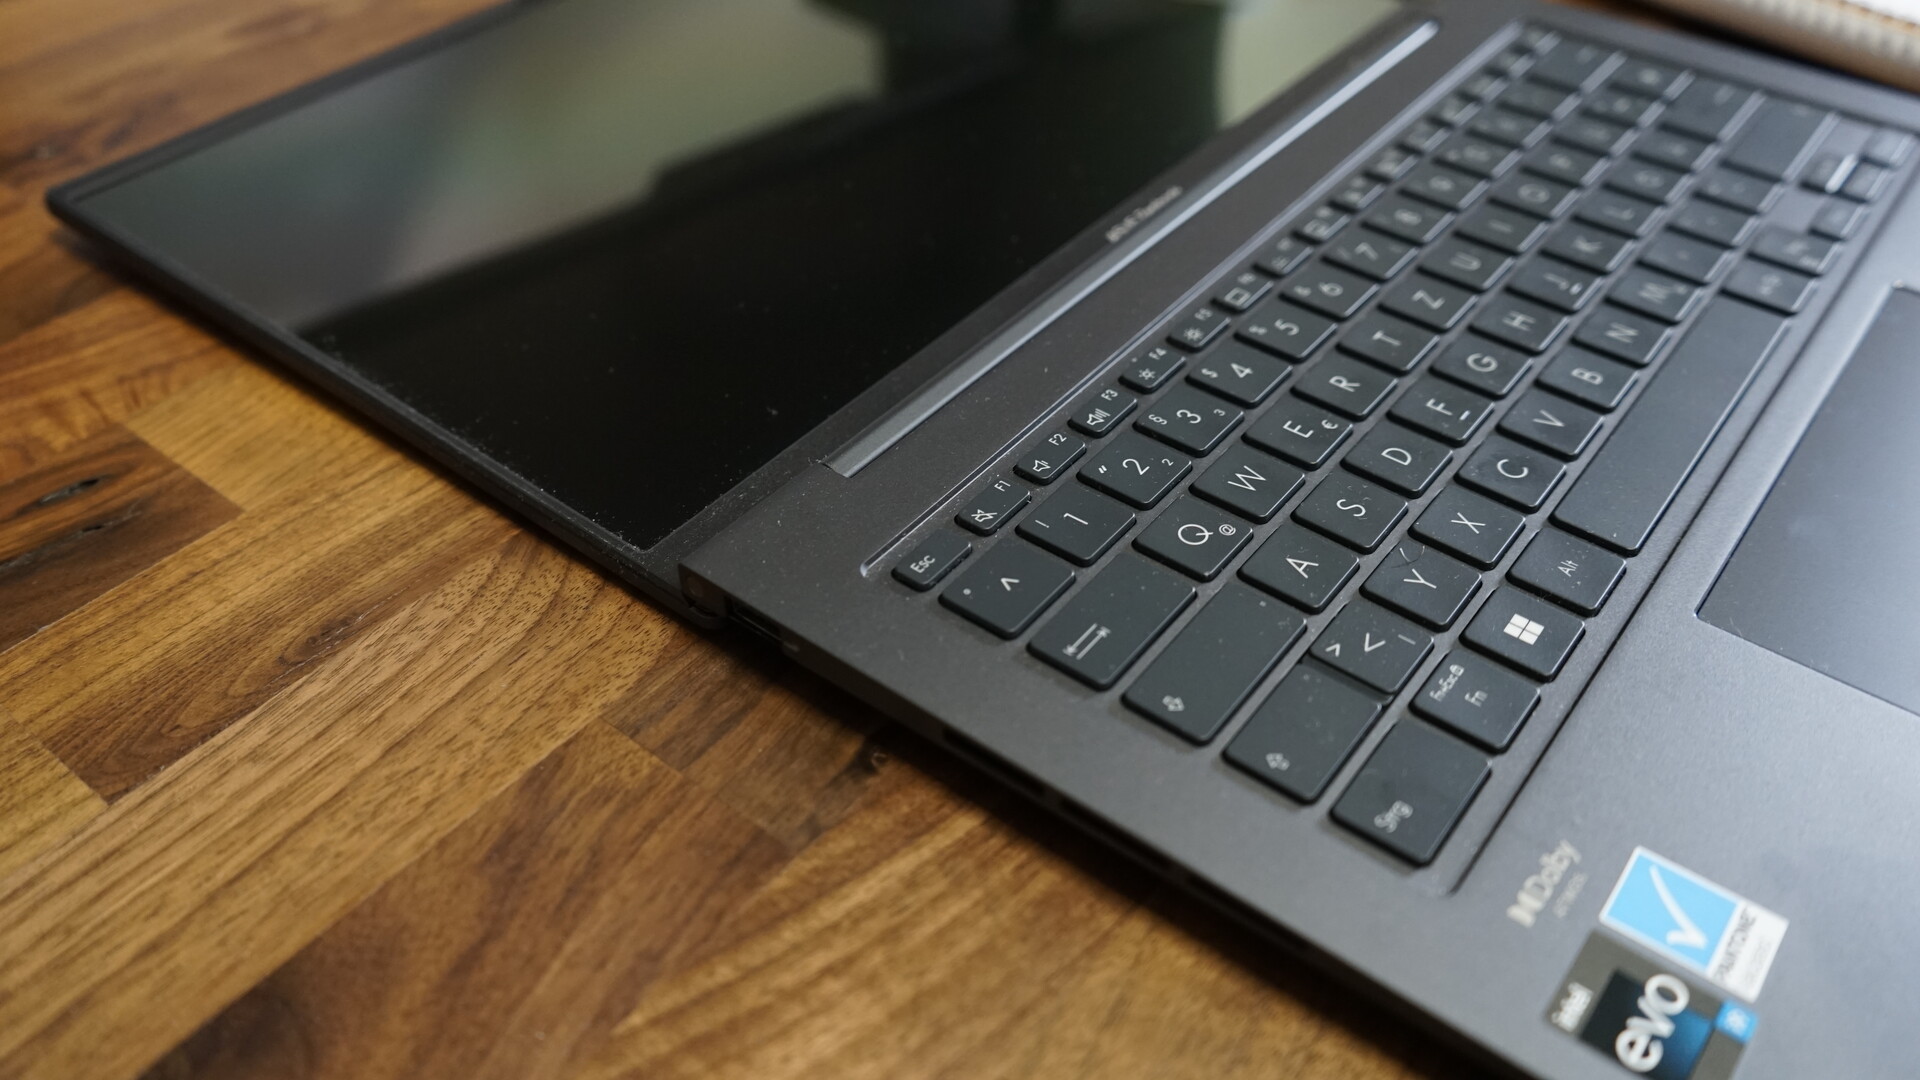
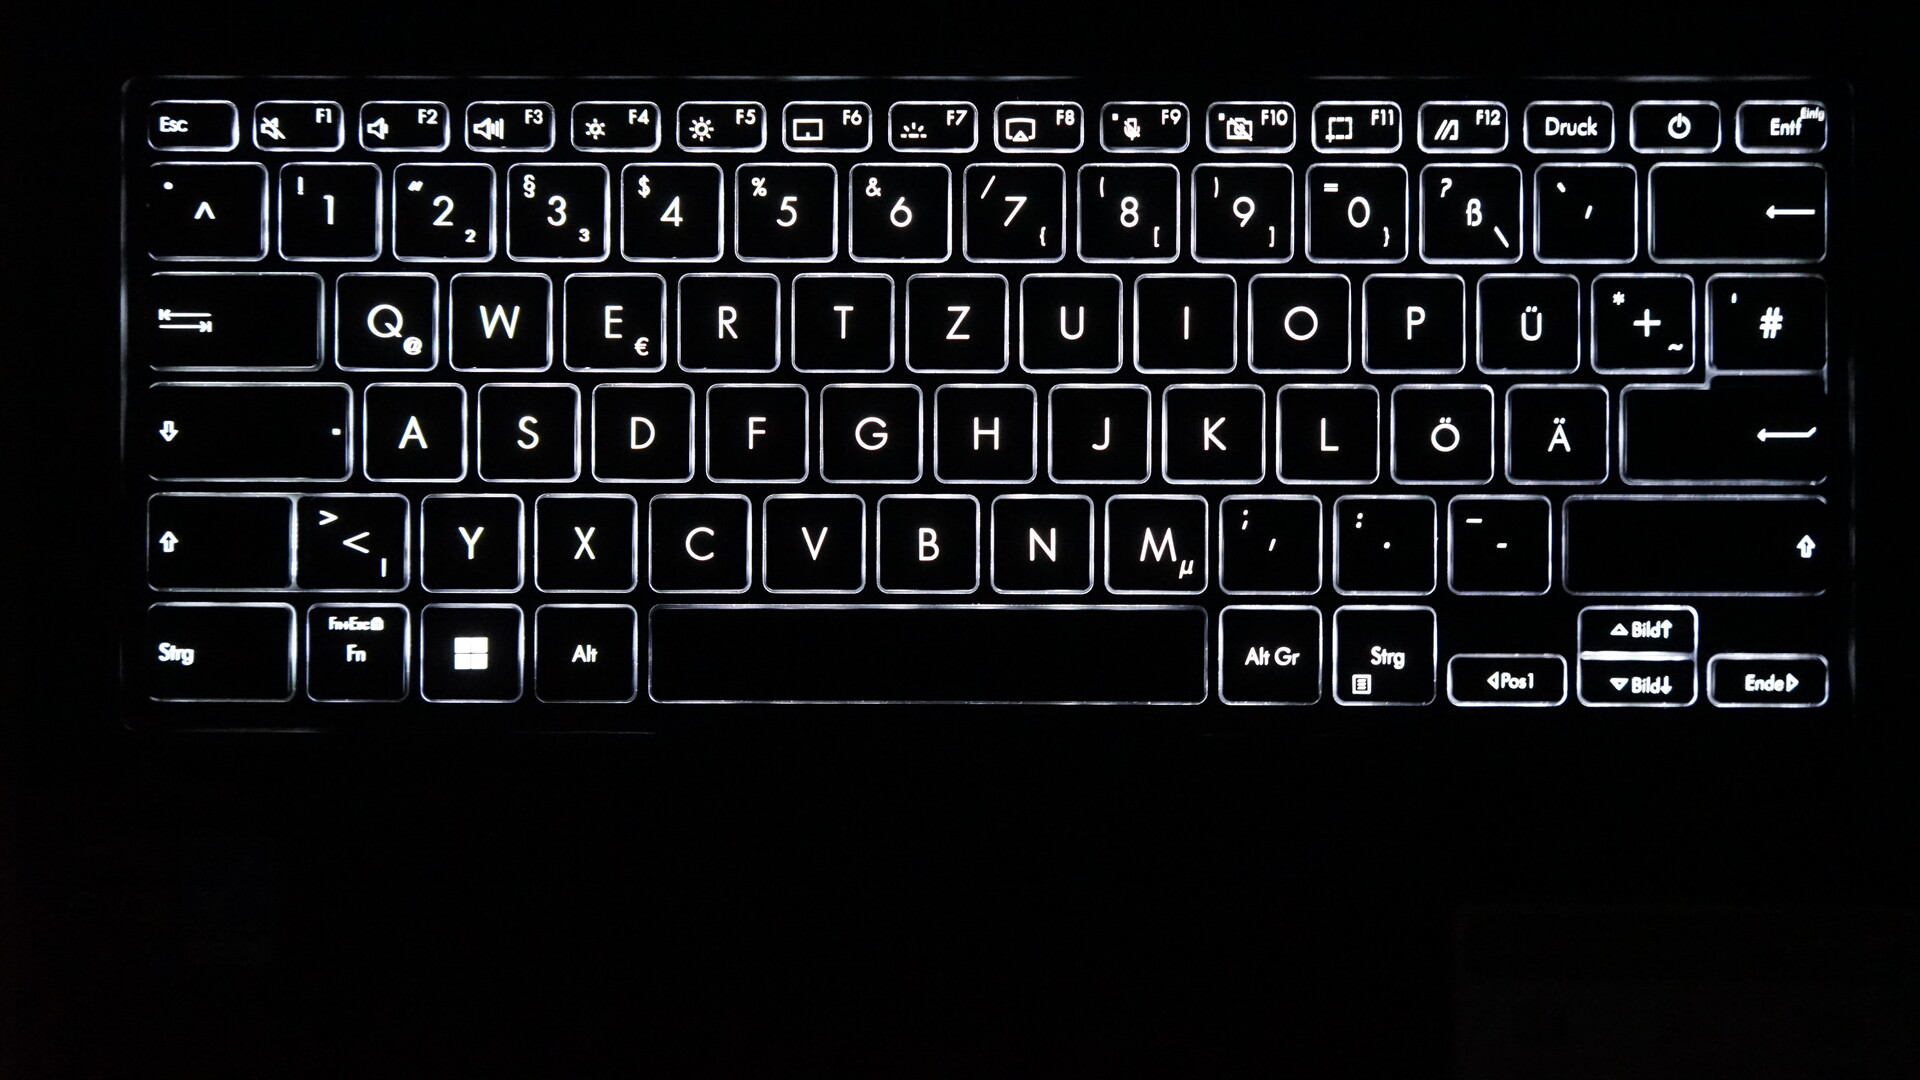
2023型号的键盘没有专门的图像键和结束键。相反,这些是作为次要功能出现在方向键上的。键盘本身是哑光的,防滑的,有非常清晰的压力点,坚实的行程和坚定的行程。我们将打字的感觉描述为非常清晰,打字的噪音适中而安静。白色背光有三个级别,光线分布非常均匀,因此在较暗的环境中工作不是问题。按键间距为2.5毫米,与前代机型一样,提供了愉快的打字感觉,没有限制。ZenBook坚固的底座在打字时也很明显,提供了一个稳定而不屈的表面。
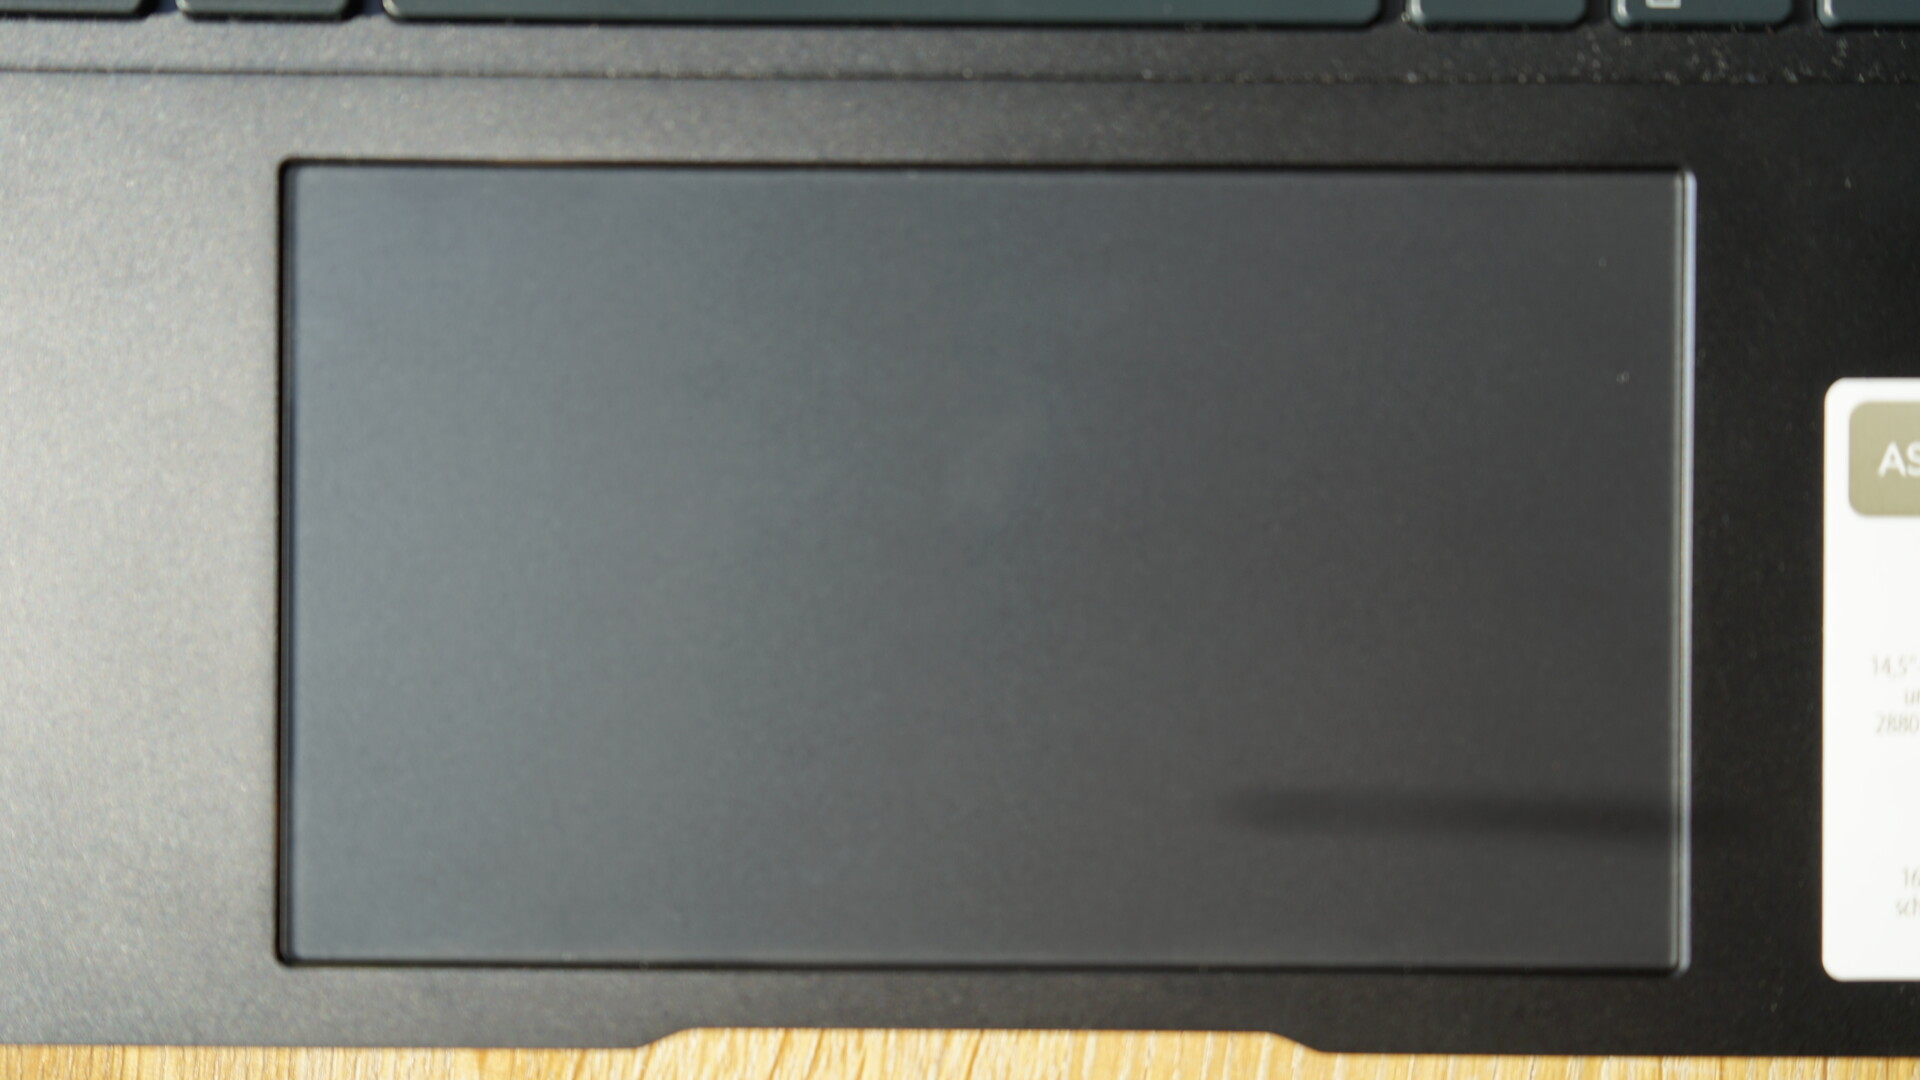
点击板的尺寸为13 x 7.6厘米,因此足够大,可以用四个手指进行指针运动和手势。滑动性能非常好,两边的点击都感觉很稳定,而且质量很高,有坚实的点击声。去年集成在触摸板上的数字键盘,在我们的评测设备中已不再是这样了。
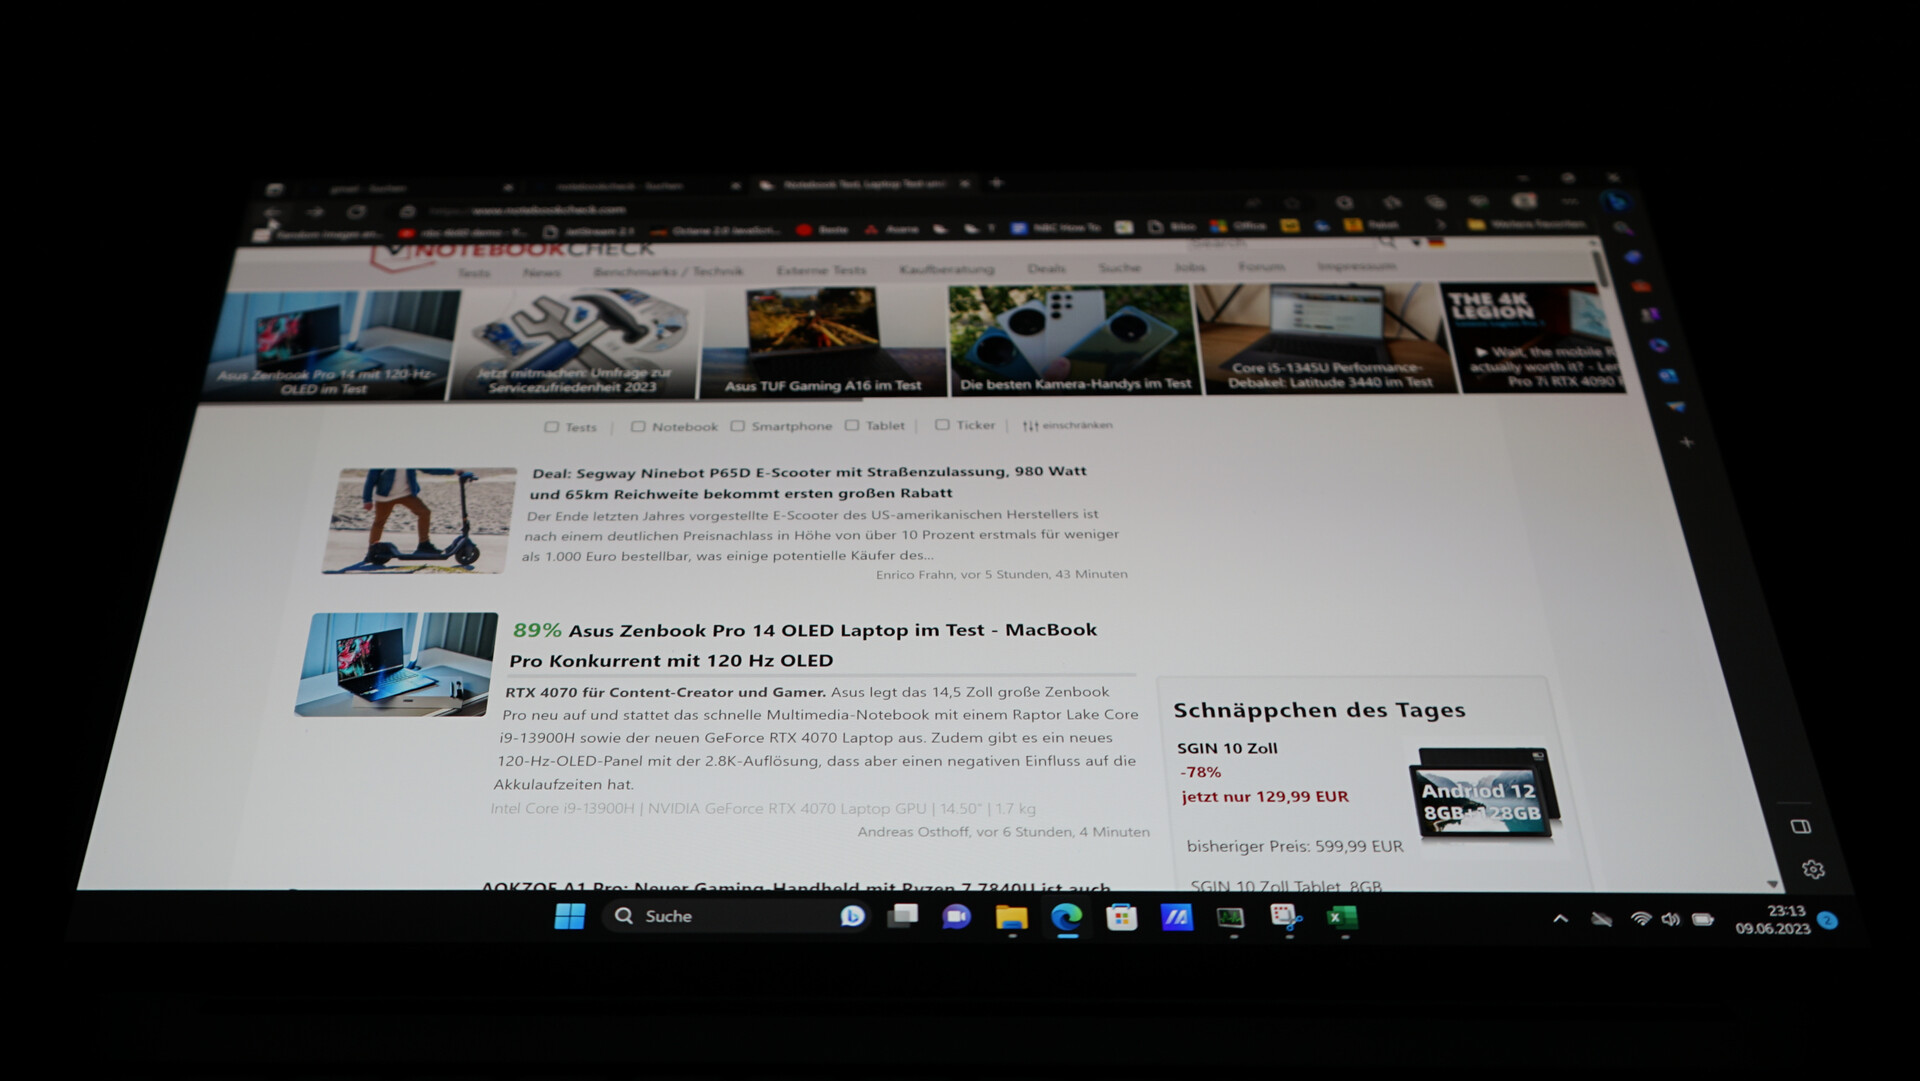
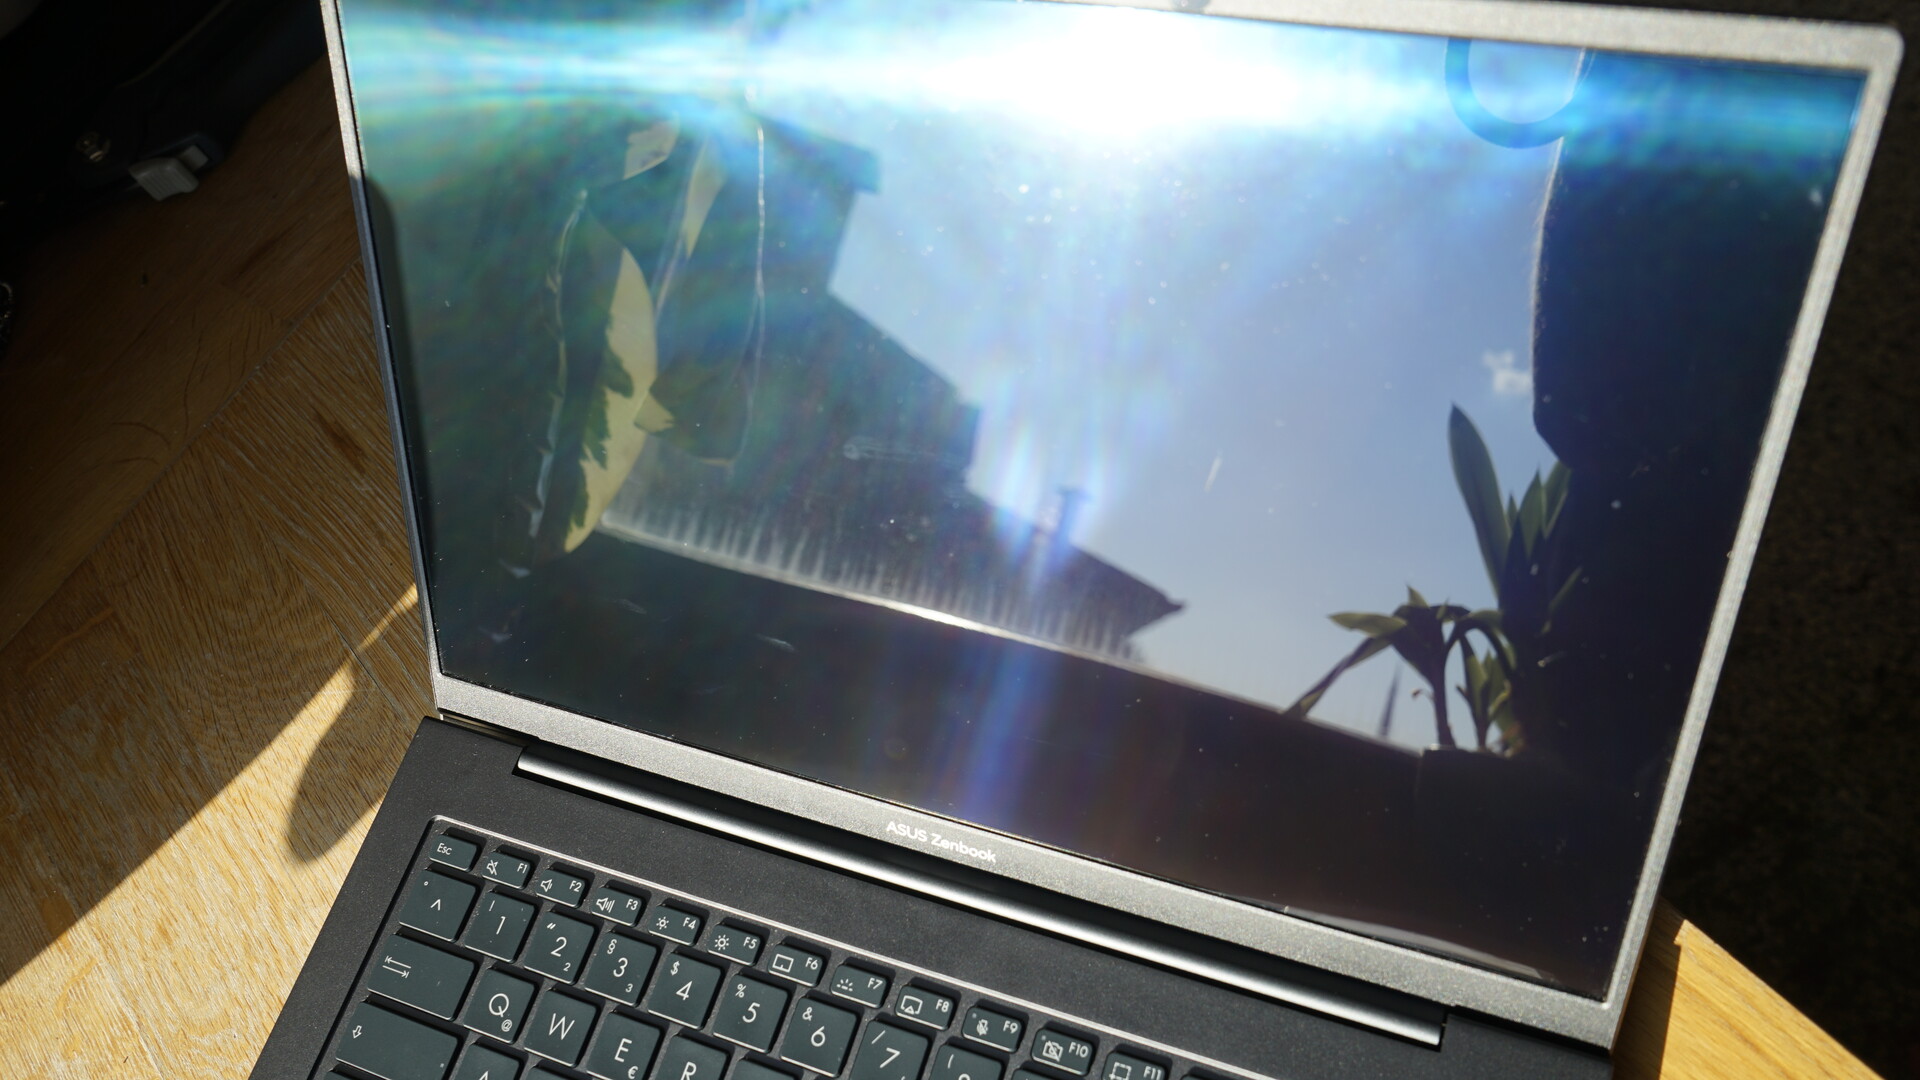
显示 - 2.8K和120赫兹
华硕ZenBook 14X的明星产品是14英寸OLED面板。这块有光泽的显示屏提供了16:10格式的2880*1800的分辨率,120赫兹的刷新率和仅2毫秒的响应时间。我们测试的变体是非触摸变体。另外,华硕还提供带有触摸功能的显示器。
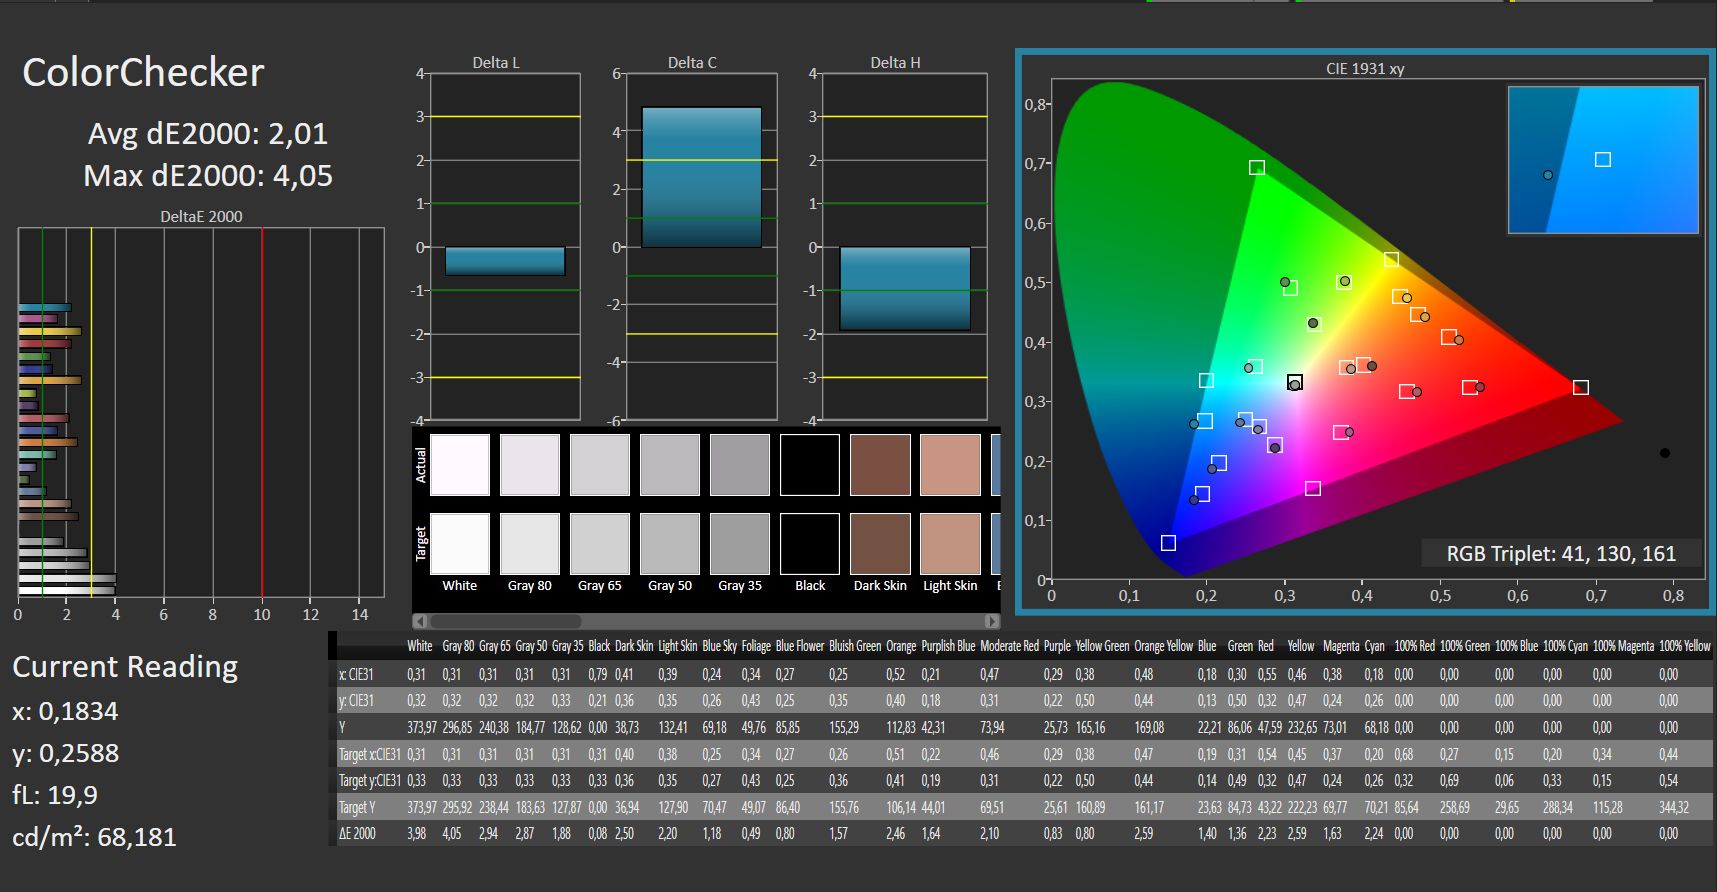
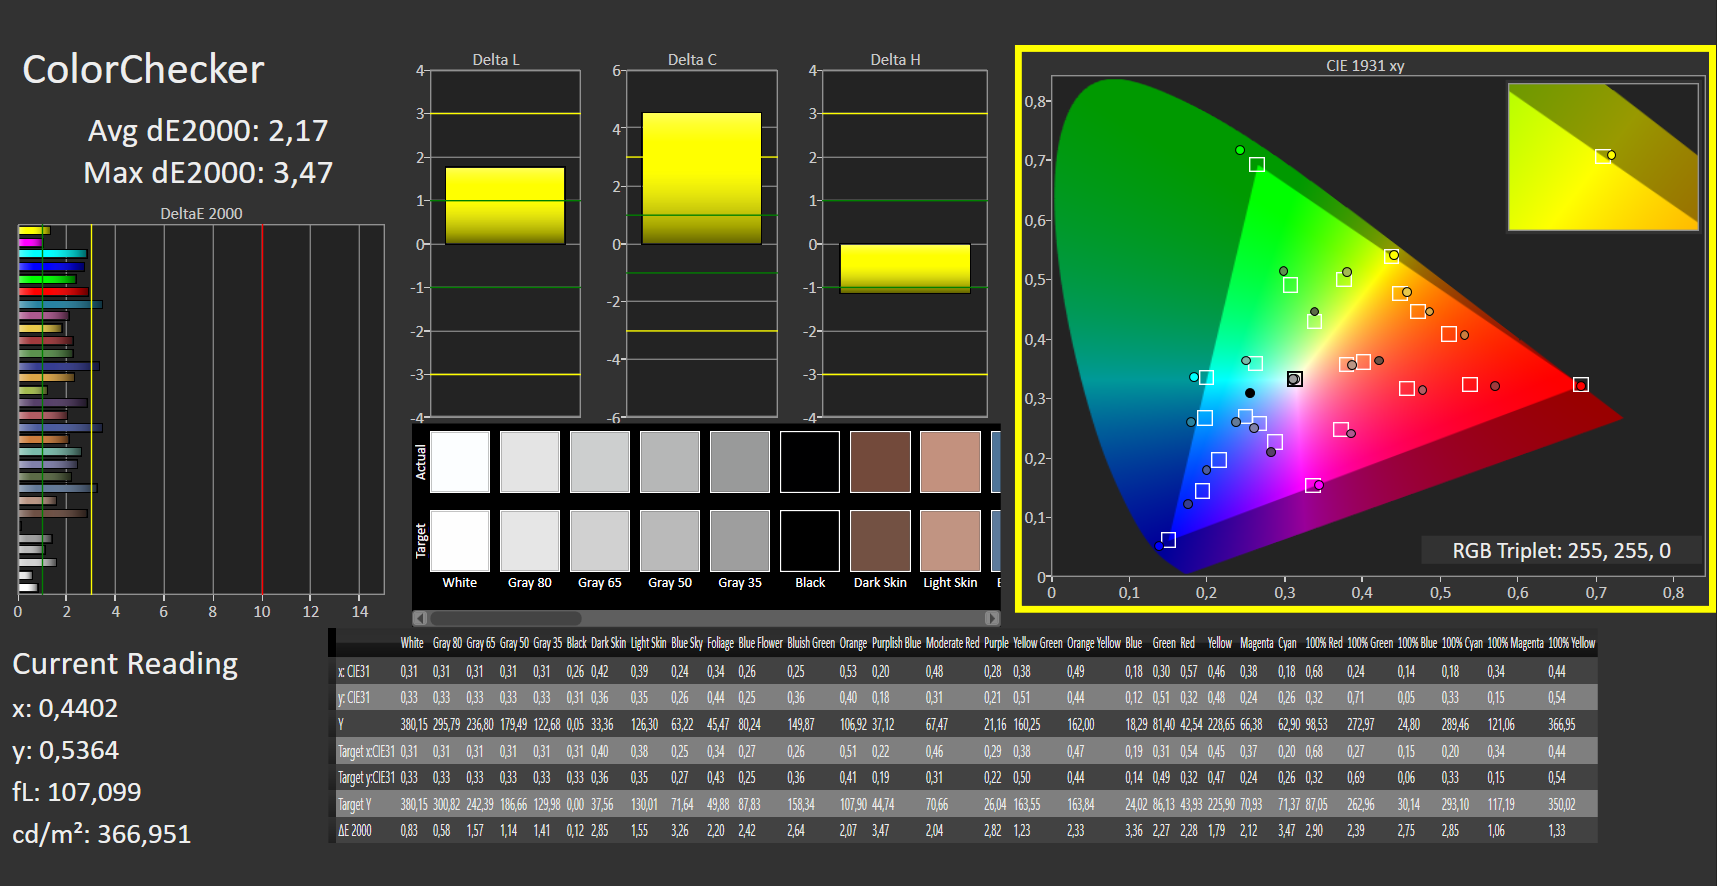
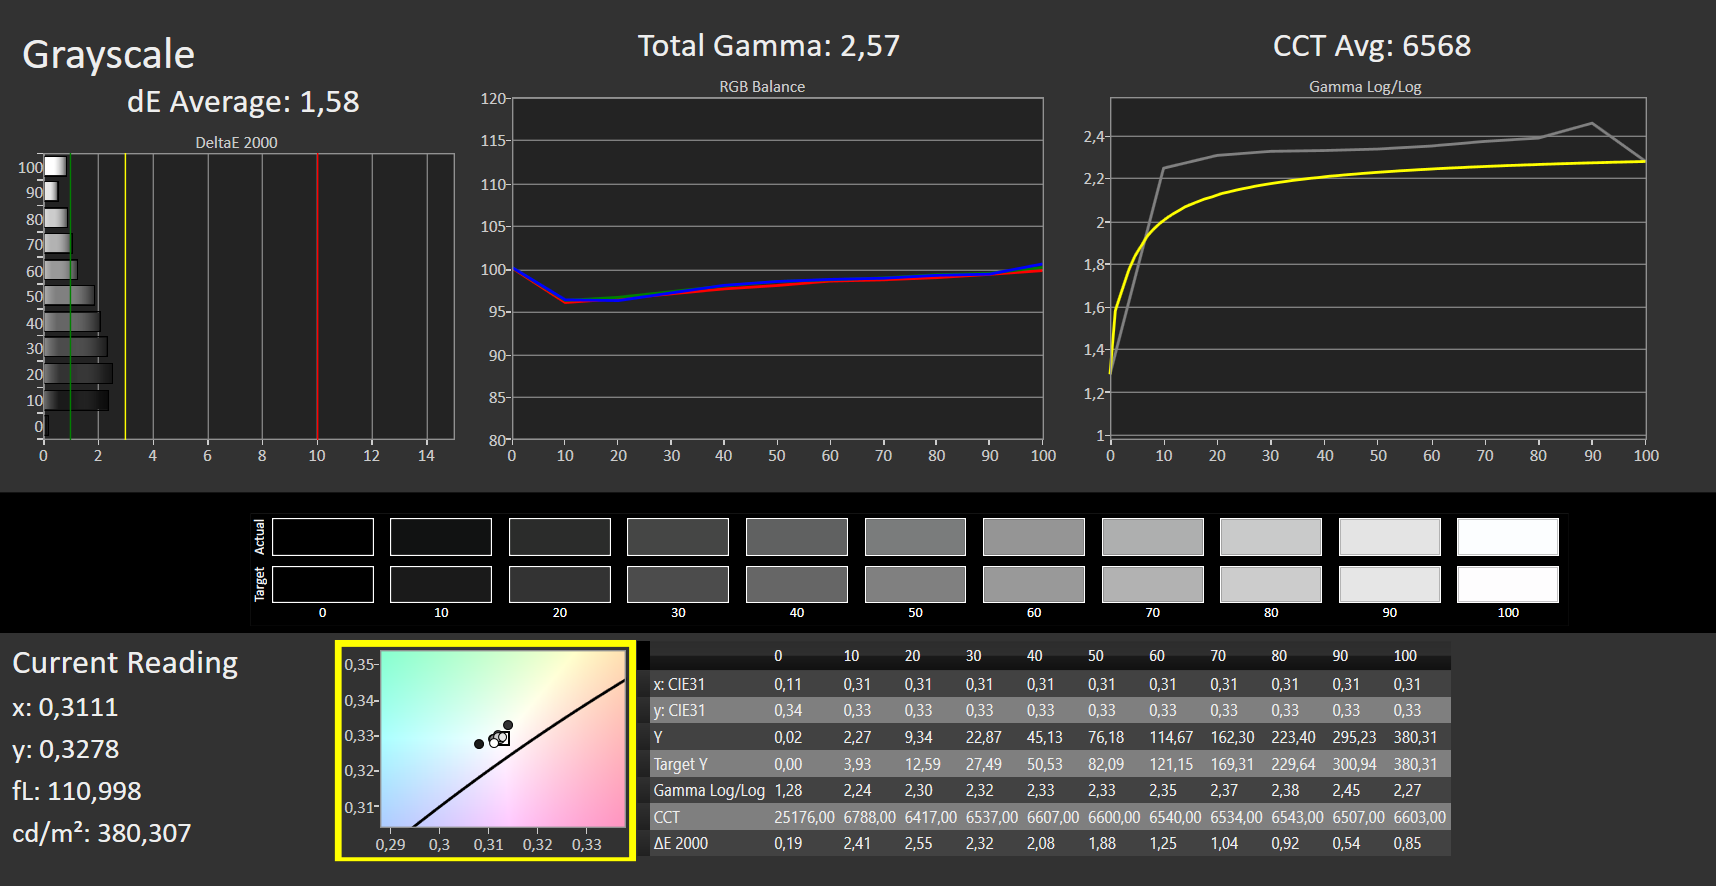
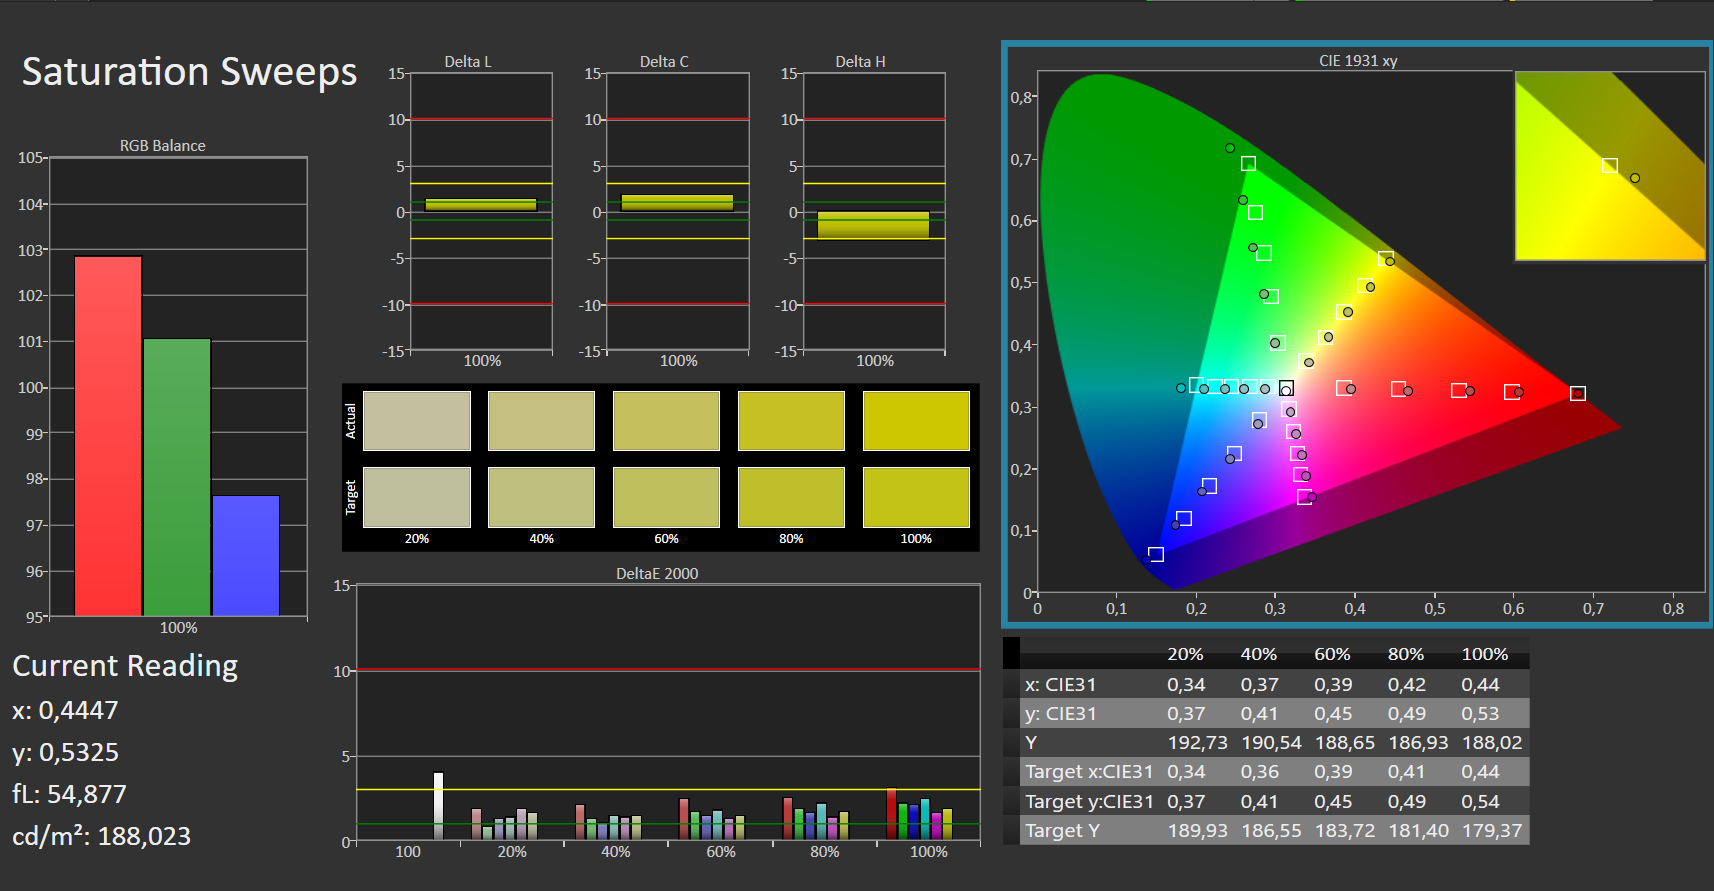
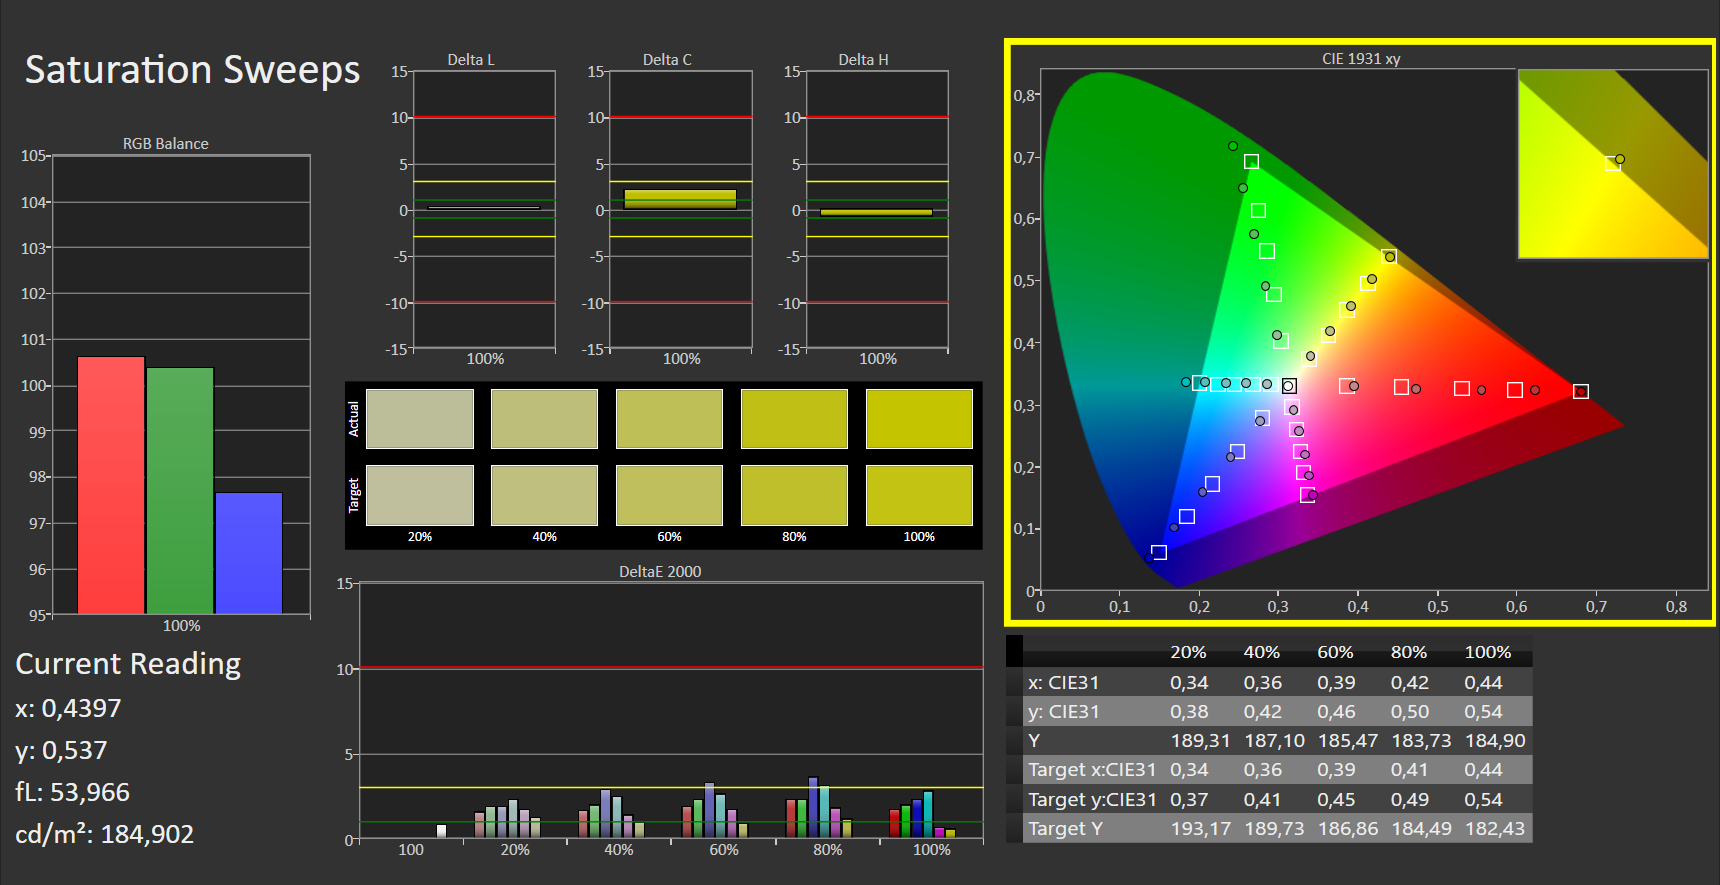
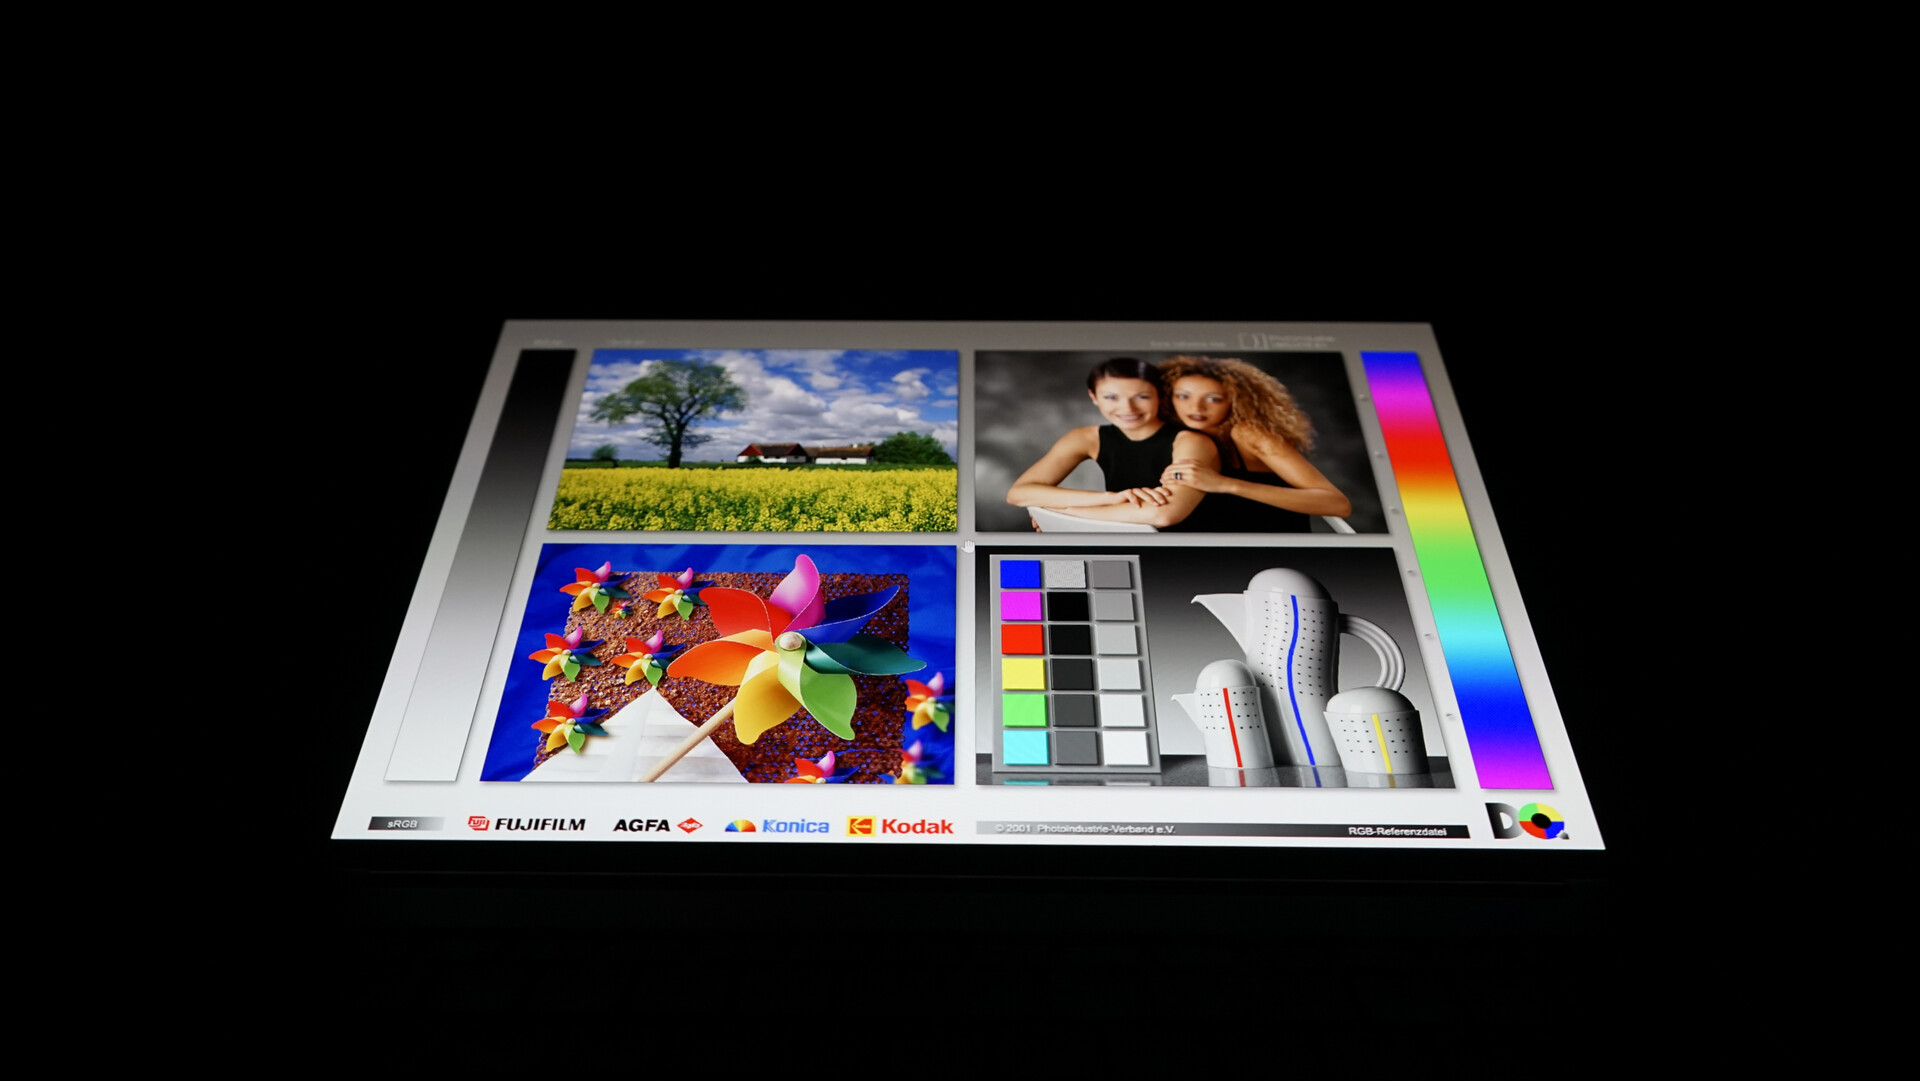
据华硕称,100%的DCI-P3色域是既定的,但我们的测量结果是 "只有 "99%。另一方面,sRGB色彩空间的覆盖率达到100%,AdobeRGB色彩空间的覆盖率为95%。根据制造商的说法,该显示器的亮度估计为平均400尼特。我们测得的平均亮度为376cd/m2,最大亮度为381cd/m2,所以我们不能完全确认华硕的说法。与OLED面板的惯例一样,照明的分布均匀度为98%。
较低的亮度设置减少了OLED显示屏的烧毁风险,像素转移功能默认通过MyAsus应用程序激活。因此,所有像素始终处于最小的运动状态,所以避免了静态图片。该设置可以通过应用程序停用,但我们在测试中没有注意到该功能被激活。
| |||||||||||||||||||||||||
Brightness Distribution: 98 %
Center on Battery: 376 cd/m²
Contrast: 37200:1 (Black: 0.01 cd/m²)
ΔE ColorChecker Calman: 2.01 | ∀{0.5-29.43 Ø4.71}
calibrated: 2.17
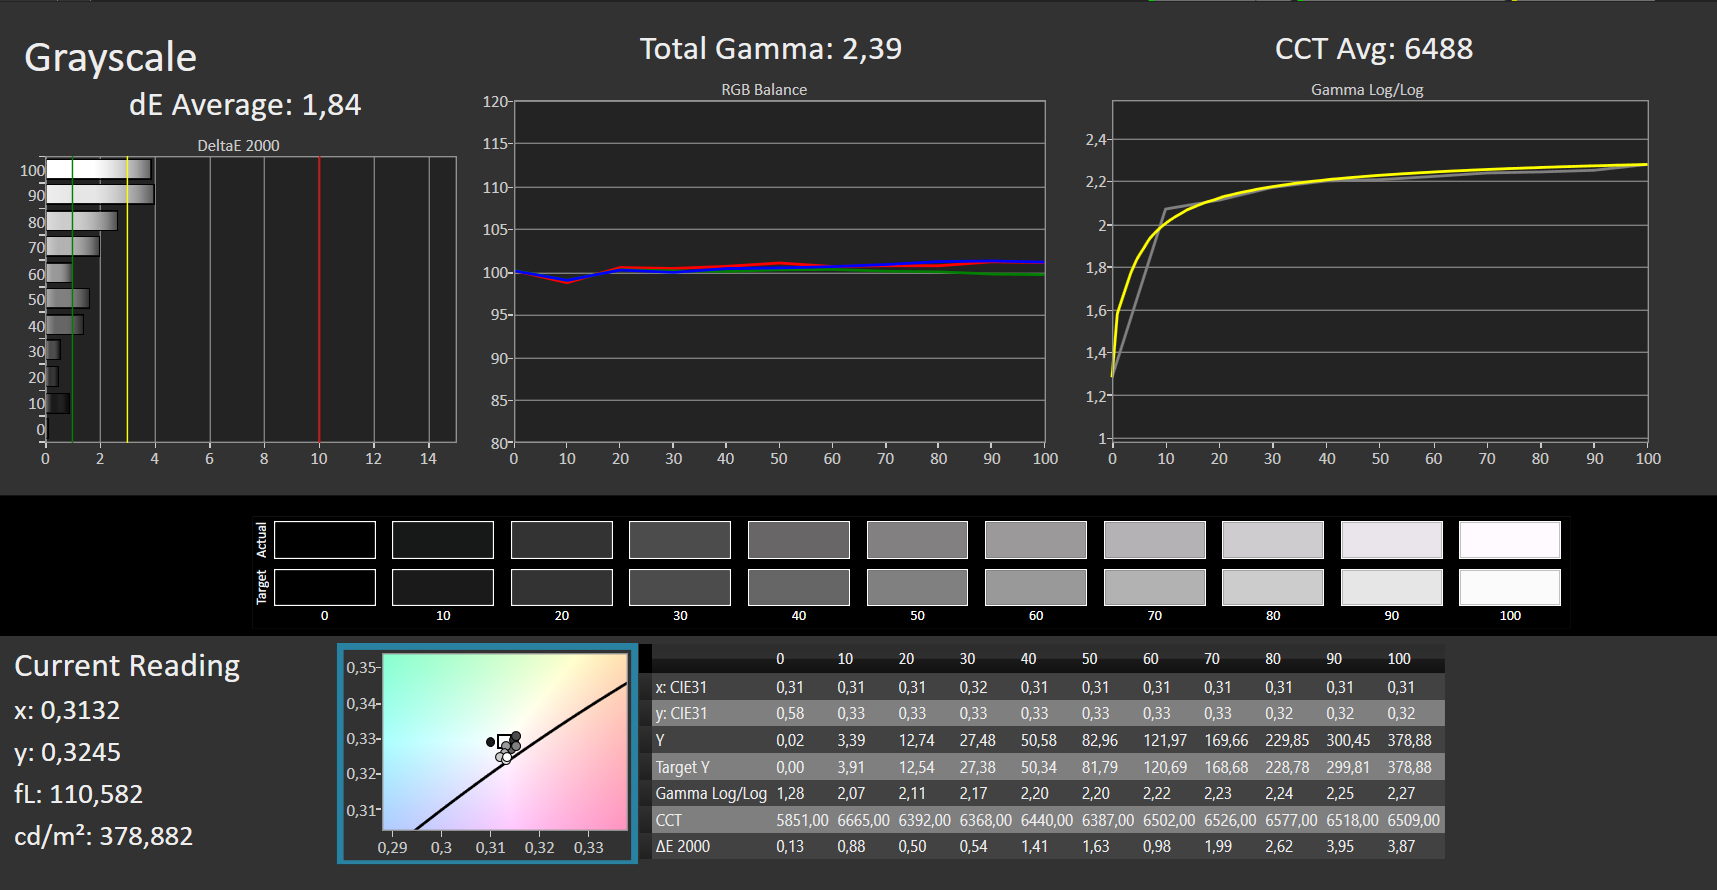
ΔE Greyscale Calman: 1.84 | ∀{0.09-98 Ø4.96}
95% AdobeRGB 1998 (Argyll 3D)
100% sRGB (Argyll 3D)
99% Display P3 (Argyll 3D)
Gamma: 2.39
CCT: 6488 K
| Asus ZenBook 14X UX3404VC Samsung, OLED, 2880x1800, 14.5" | Apple MacBook Pro 13 2022 M2 IPS, 2560x1600, 13.3" | Dell XPS 13 Plus 9320 i7-1280P OLED Samsung 134XK04, OLED, 3456x2160, 13.4" | Lenovo Slim Pro 7 14ARP8 LEN89C1, IPS, 2560x1600, 14.5" | LG Gram 14Z90Q LG LP140WU1-SPF1, IPS, 1920x1200, 14" | Dell Inspiron 14 Plus 7420 InfoVision 140NWHE, IPS, 2240x1400, 14" | Asus ROG Flow Z13 GZ301V TL134ADXP01-0, IPS, 2560x1600, 13.4" | |
|---|---|---|---|---|---|---|---|
| Display | -2% | 2% | -16% | -4% | -20% | -4% | |
| Display P3 Coverage (%) | 99 | 98.8 0% | 99.5 1% | 72.9 -26% | 98.4 -1% | 68.8 -31% | 97 -2% |
| sRGB Coverage (%) | 100 | 100 0% | 100 0% | 98.2 -2% | 99.9 0% | 99.3 -1% | 99.9 0% |
| AdobeRGB 1998 Coverage (%) | 95 | 87.9 -7% | 98.4 4% | 74.6 -21% | 85.9 -10% | 69.5 -27% | 85.3 -10% |
| Response Times | -1645% | -18% | -1178% | -1700% | -1290% | -225% | |
| Response Time Grey 50% / Grey 80% * (ms) | 2 ? | 42 ? -2000% | 2.6 ? -30% | 31.8 ? -1490% | 47.5 ? -2275% | 32.8 ? -1540% | 6.5 ? -225% |
| Response Time Black / White * (ms) | 2 ? | 27.8 ? -1290% | 2.1 ? -5% | 19.3 ? -865% | 24.5 ? -1125% | 22.8 ? -1040% | 6.5 ? -225% |
| PWM Frequency (Hz) | 250 ? | 117780 ? | 59.5 | ||||
| Screen | -319% | -13% | -368% | -324% | -334% | -482% | |
| Brightness middle (cd/m²) | 372 | 514 38% | 371.8 0% | 344.7 -7% | 341 -8% | 331.1 -11% | 537 44% |
| Brightness (cd/m²) | 376 | 497 32% | 374 -1% | 334 -11% | 305 -19% | 326 -13% | 511 36% |
| Brightness Distribution (%) | 98 | 93 -5% | 98 0% | 92 -6% | 87 -11% | 85 -13% | 88 -10% |
| Black Level * (cd/m²) | 0.01 | 0.31 -3000% | 0.31 -3000% | 0.26 -2500% | 0.29 -2800% | 0.45 -4400% | |
| Contrast (:1) | 37200 | 1658 -96% | 1112 -97% | 1312 -96% | 1142 -97% | 1193 -97% | |
| Colorchecker dE 2000 * | 2.01 | 1.1 45% | 2.37 -18% | 3.01 -50% | 3.11 -55% | 2.23 -11% | 1.49 26% |
| Colorchecker dE 2000 max. * | 4.05 | 2.3 43% | 6.1 -51% | 6.3 -56% | 8.29 -105% | 5.44 -34% | 3.68 9% |
| Colorchecker dE 2000 calibrated * | 2.17 | 0.6 72% | 0.83 62% | 0.83 62% | 0.63 71% | 1.12 48% | |
| Greyscale dE 2000 * | 1.84 | 1.8 2% | 2 -9% | 4.6 -150% | 5.3 -188% | 3.6 -96% | 1.66 10% |
| Gamma | 2.39 92% | 2.23 99% | 2.29 96% | 2.28 96% | 2.037 108% | 2.21 100% | 2.43 91% |
| CCT | 6488 100% | 6764 96% | 6261 104% | 6420 101% | 7571 86% | 6022 108% | 6772 96% |
| Total Average (Program / Settings) | -655% /
-440% | -10% /
-10% | -521% /
-409% | -676% /
-452% | -548% /
-403% | -237% /
-343% |
* ... smaller is better
与OLED显示屏一样,对比度非常好。在ZenBook 14X上,黑色是丰富的黑色,颜色也很鲜艳。在响应时间方面,OLED显示屏也明显优于同类设备的IPS显示屏。图像和显示设置可以通过MyAsus软件单独调整。

在校准之前,我们对灰度和颜色的DeltaE的测量产生了非常好的数值,在1.8和2.0之间。校准将灰度的DeltaE提高到1.6,而色彩的DeltaE则恶化到2.2。这些结果表明,显示器已经被校准了,进一步的校准在这里没有提供任何附加价值。
Display Response Times
| ↔ Response Time Black to White | ||
|---|---|---|
| 2 ms ... rise ↗ and fall ↘ combined | ↗ 1 ms rise |  |
| ↘ 1 ms fall | ||
| The screen shows very fast response rates in our tests and should be very well suited for fast-paced gaming. In comparison, all tested devices range from 0.1 (minimum) to 240 (maximum) ms. » 11 % of all devices are better. This means that the measured response time is better than the average of all tested devices (19.8 ms). | ||
| ↔ Response Time 50% Grey to 80% Grey | ||
| 2 ms ... rise ↗ and fall ↘ combined | ↗ 1 ms rise |  |
| ↘ 1 ms fall | ||
| The screen shows very fast response rates in our tests and should be very well suited for fast-paced gaming. In comparison, all tested devices range from 0.165 (minimum) to 636 (maximum) ms. » 10 % of all devices are better. This means that the measured response time is better than the average of all tested devices (31 ms). | ||
Screen Flickering / PWM (Pulse-Width Modulation)
| Screen flickering / PWM detected | 250 Hz | ≤ 70 % brightness setting |  |
The display backlight flickers at 250 Hz (worst case, e.g., utilizing PWM) Flickering detected at a brightness setting of 70 % and below. There should be no flickering or PWM above this brightness setting. The frequency of 250 Hz is relatively low, so sensitive users will likely notice flickering and experience eyestrain at the stated brightness setting and below. In comparison: 52 % of all tested devices do not use PWM to dim the display. If PWM was detected, an average of 7757 (minimum: 5 - maximum: 343500) Hz was measured. | |||


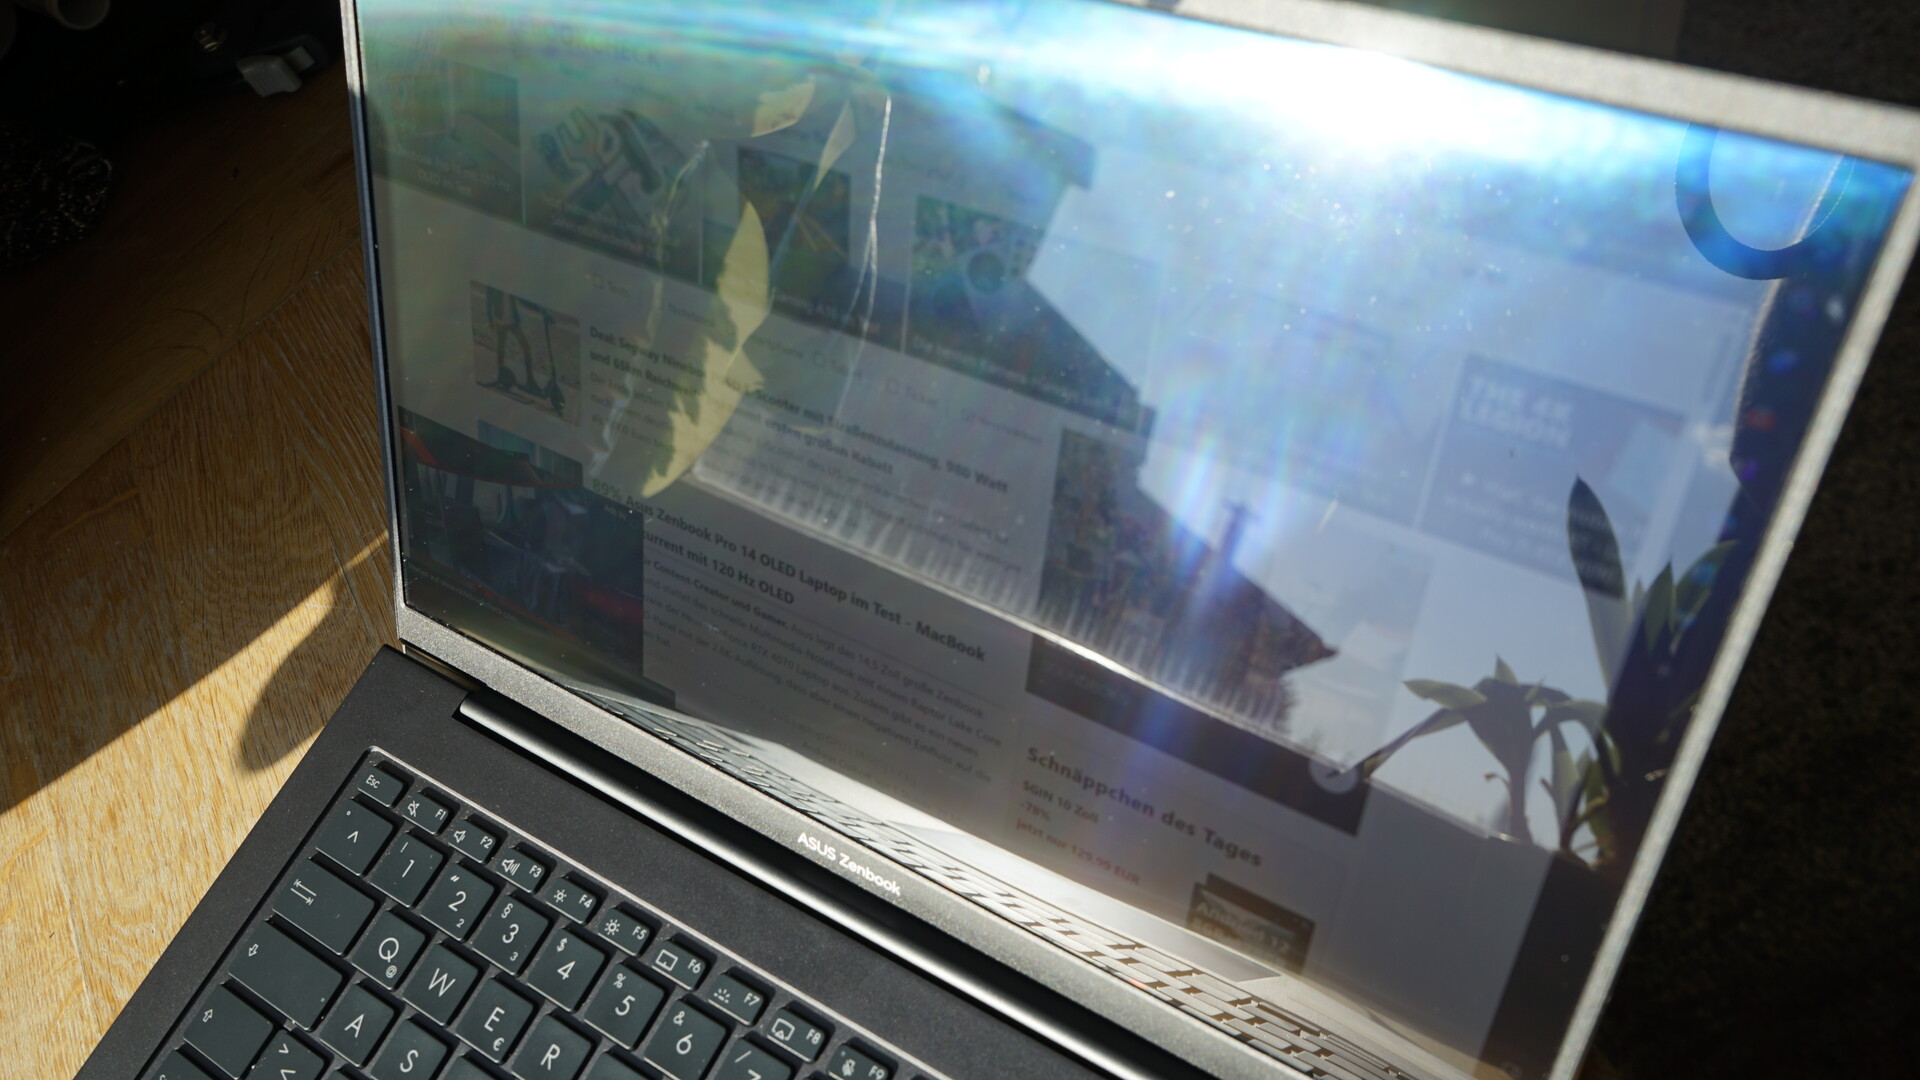
华硕ZenBook 14X的OLED显示屏在阳光直射下有问题。眩光型显示屏在这里难以应付,舒适地观看屏幕已不再可能。与前代产品相比,峰值亮度略高,也无济于事。
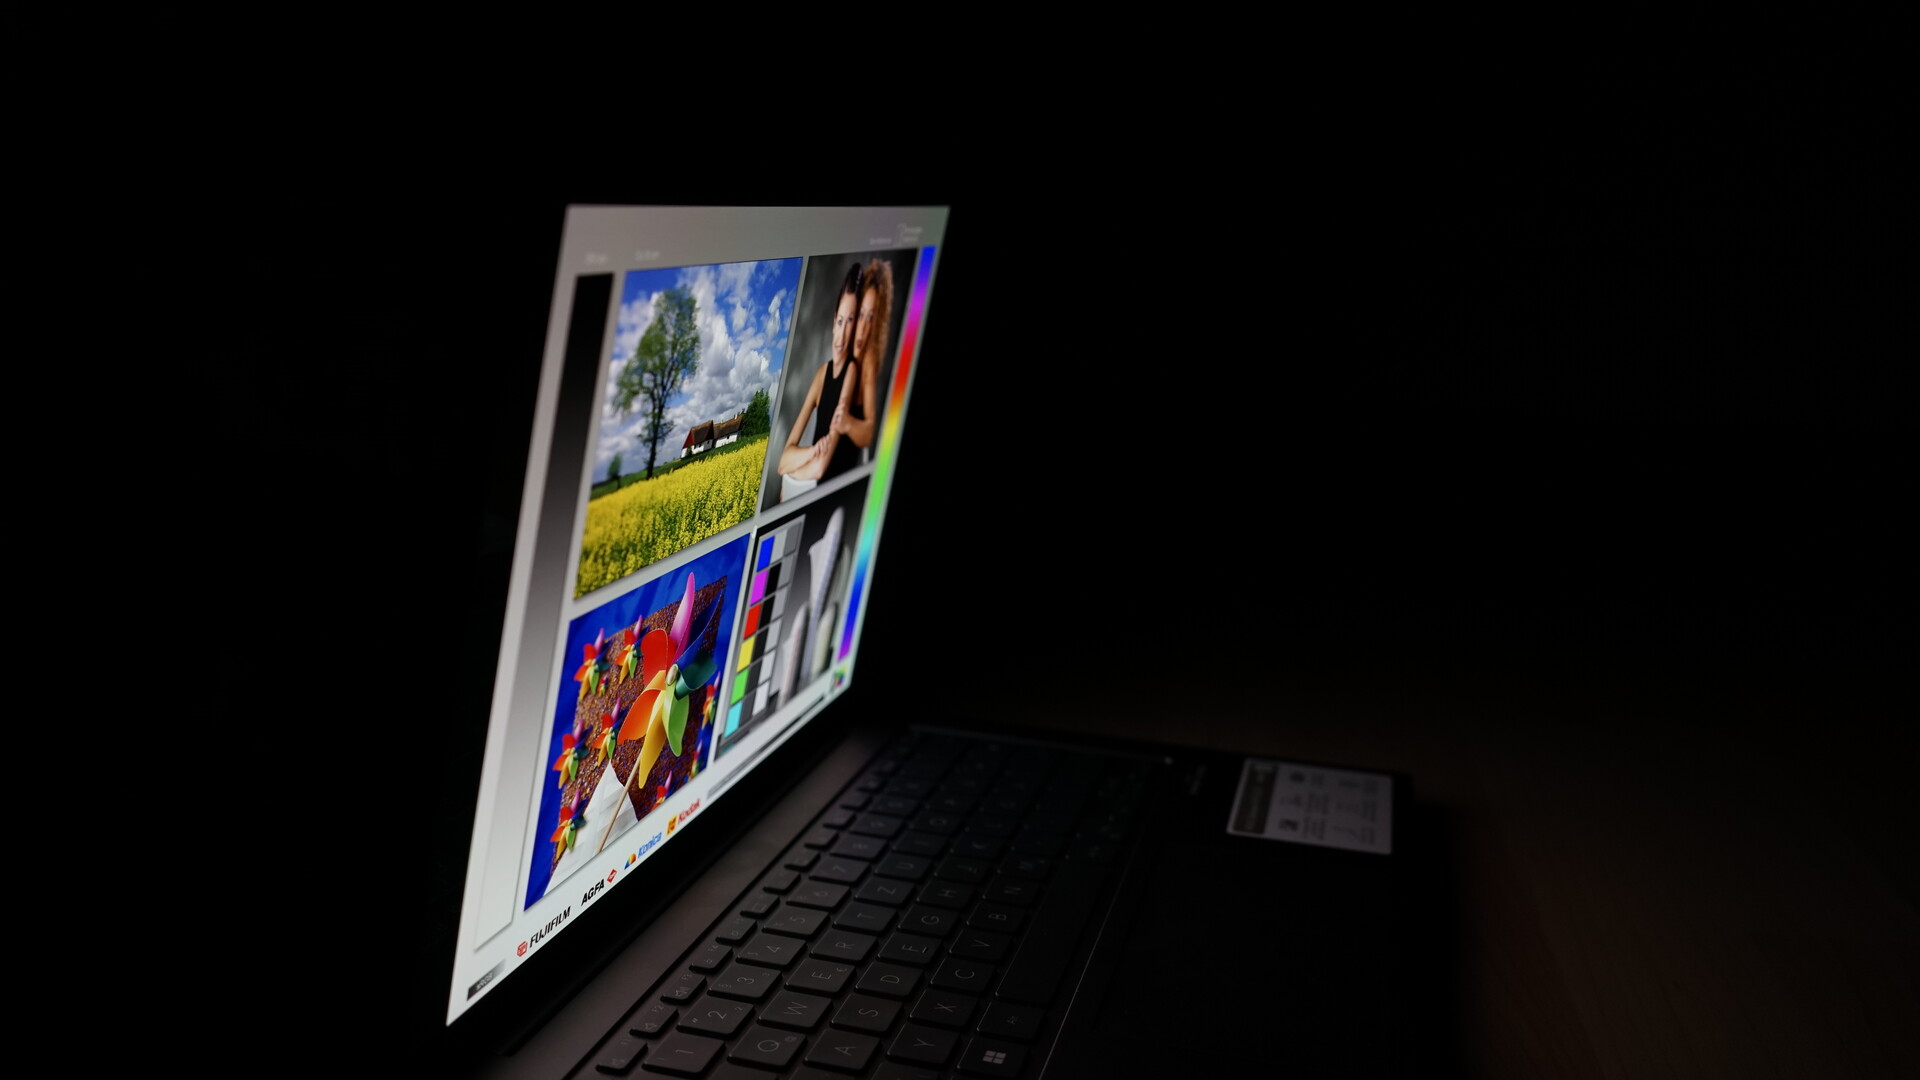
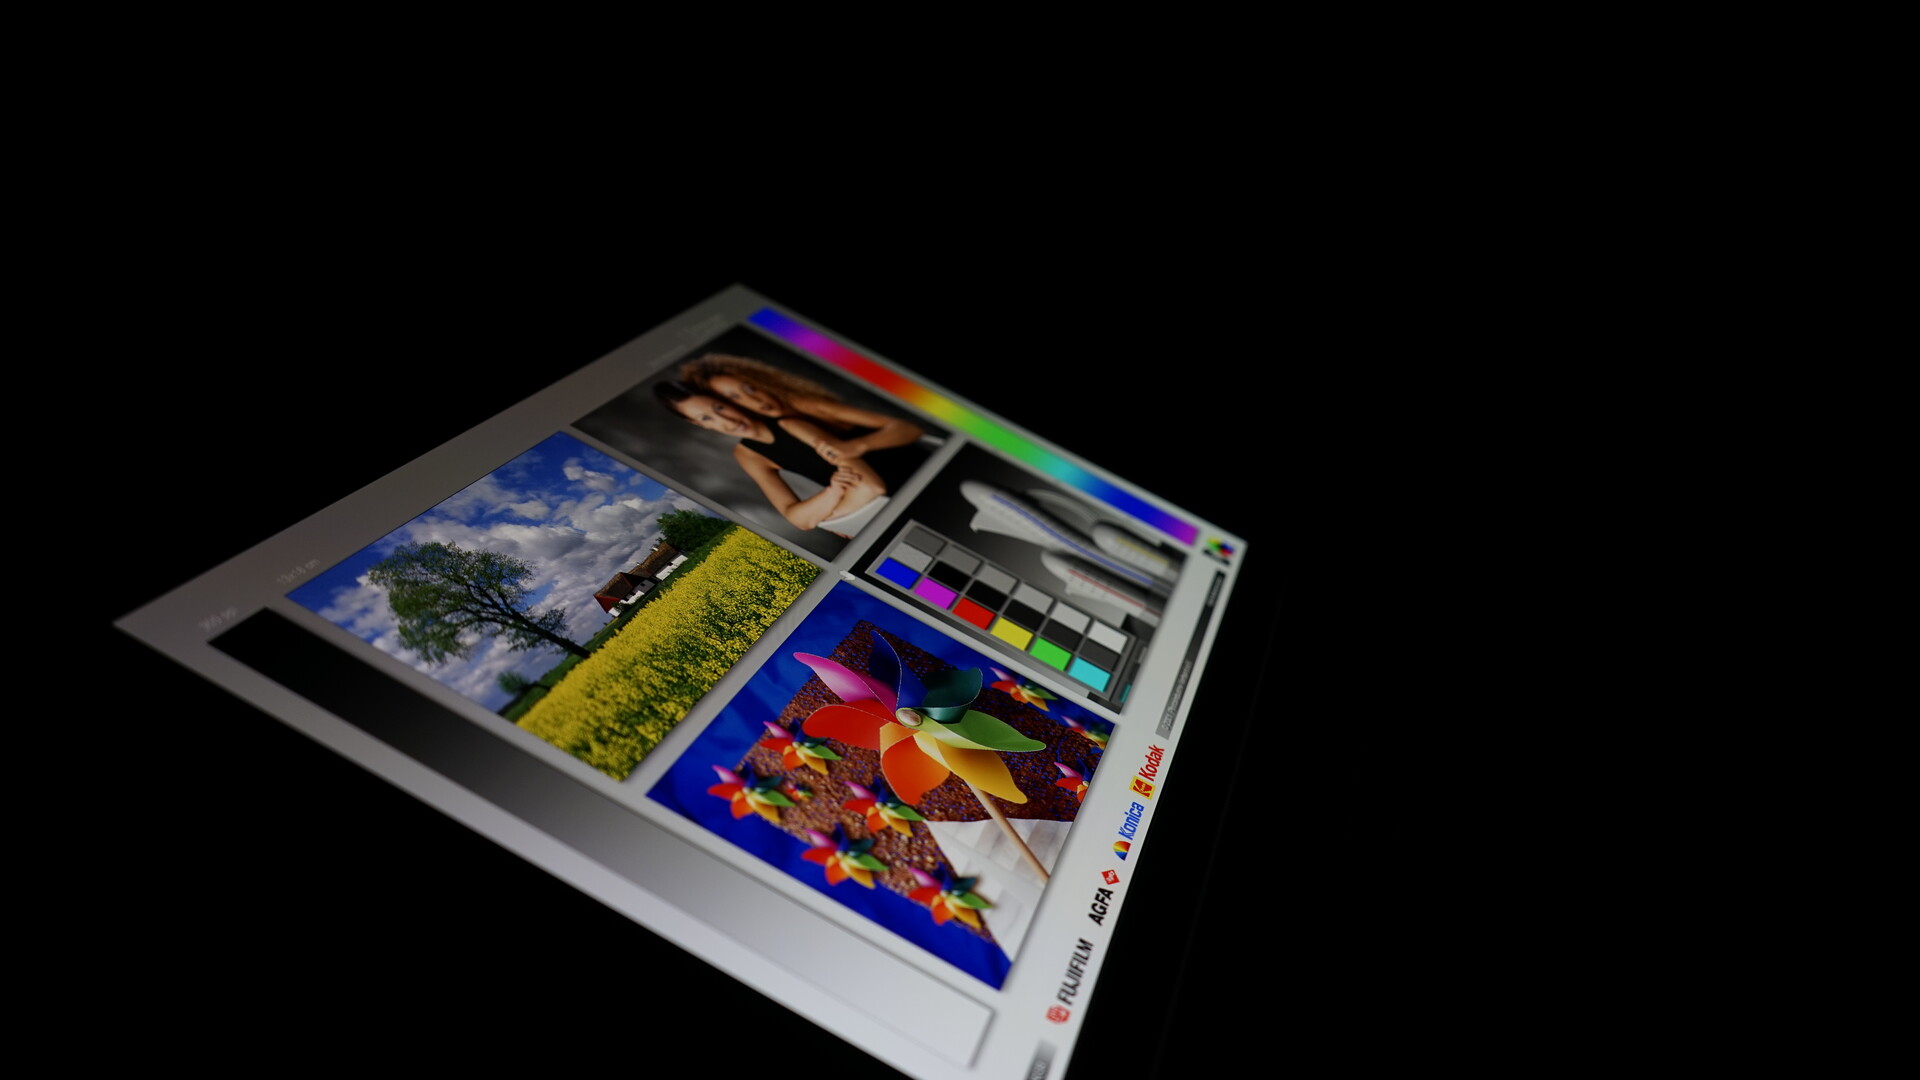
与通常的OLED面板一样,在可视角度的稳定性方面没有什么可批评的。颜色和亮度保持完全稳定,即使在非常陡峭的角度。与OLED面板一样,在非常陡峭的角度下,可以看到某种蓝色的色调。

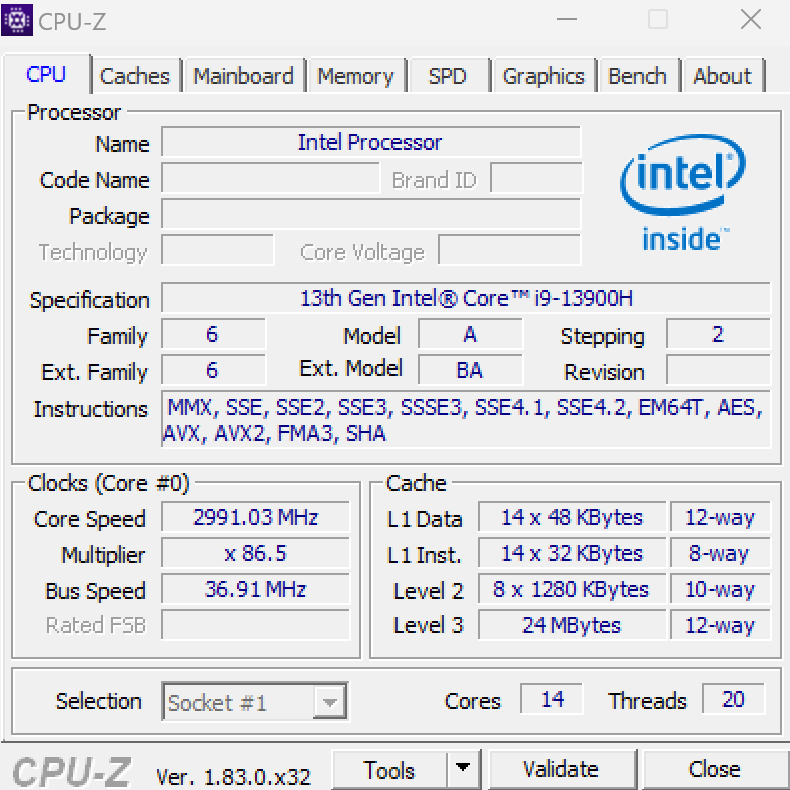
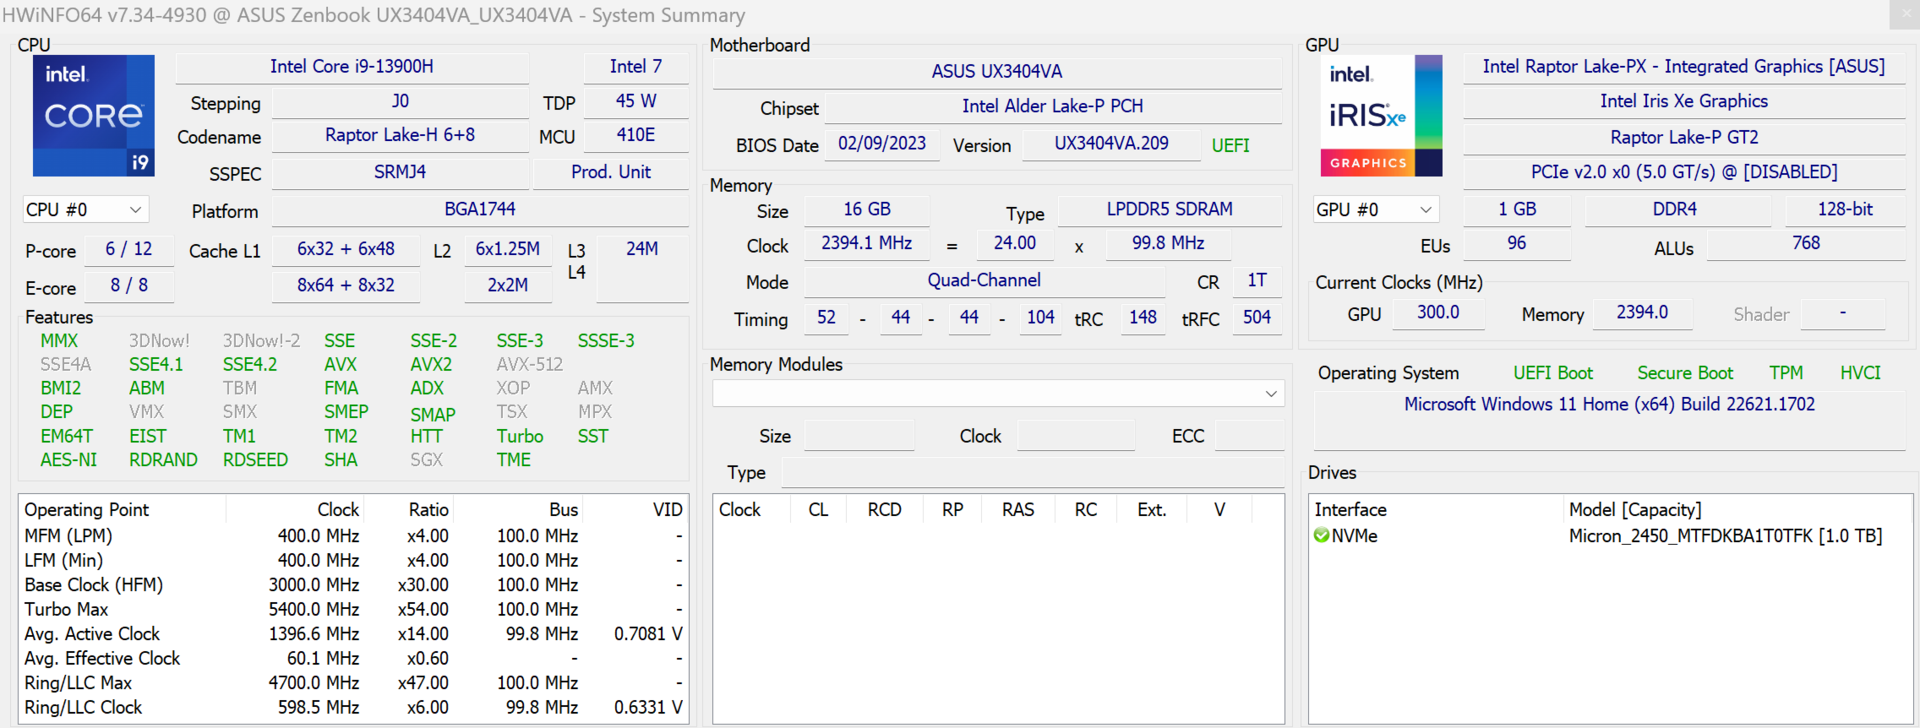
性能 - 强大的英特尔i9-13900H
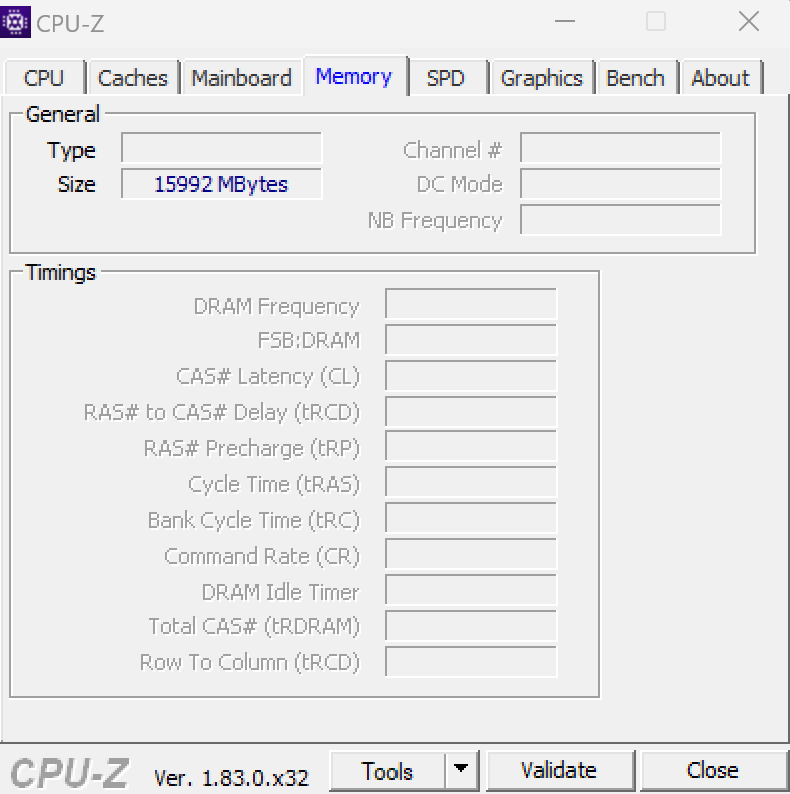
华硕安装了英特尔酷睿英特尔酷睿i9-13900H在新的ZenBook 14X中,除了 华硕ROG Flow Z13,只在较大的笔记本中发现。我们的测试模型是没有专用显卡的变体。因此,这里只使用了内部英特尔Iris X图形。其他硬件包括16GB LPDDR5内存(板载)和一个1TB M.2 NVME PCIe硬盘。
测试条件
通过MyAsus应用程序,可以为ZenBook 14X选择三种不同的性能配置文件:静音、标准和性能。后者只能在插上电源的情况下使用。基准测试是在性能 模式下进行的,而电池耐久性测试是在静音 模式下进行的。性能模式用于最大能耗测试,所有三种模式都检查了噪音排放。
| 性能模式 | 标准模式 | 静音模式 | |
|---|---|---|---|
| CPU PL1 (HWInfo) | 80 watts | 80 watts | 40 watts |
| CPU PL2 (HWInfo) | 80 watts | 80 watts | 80 watts |
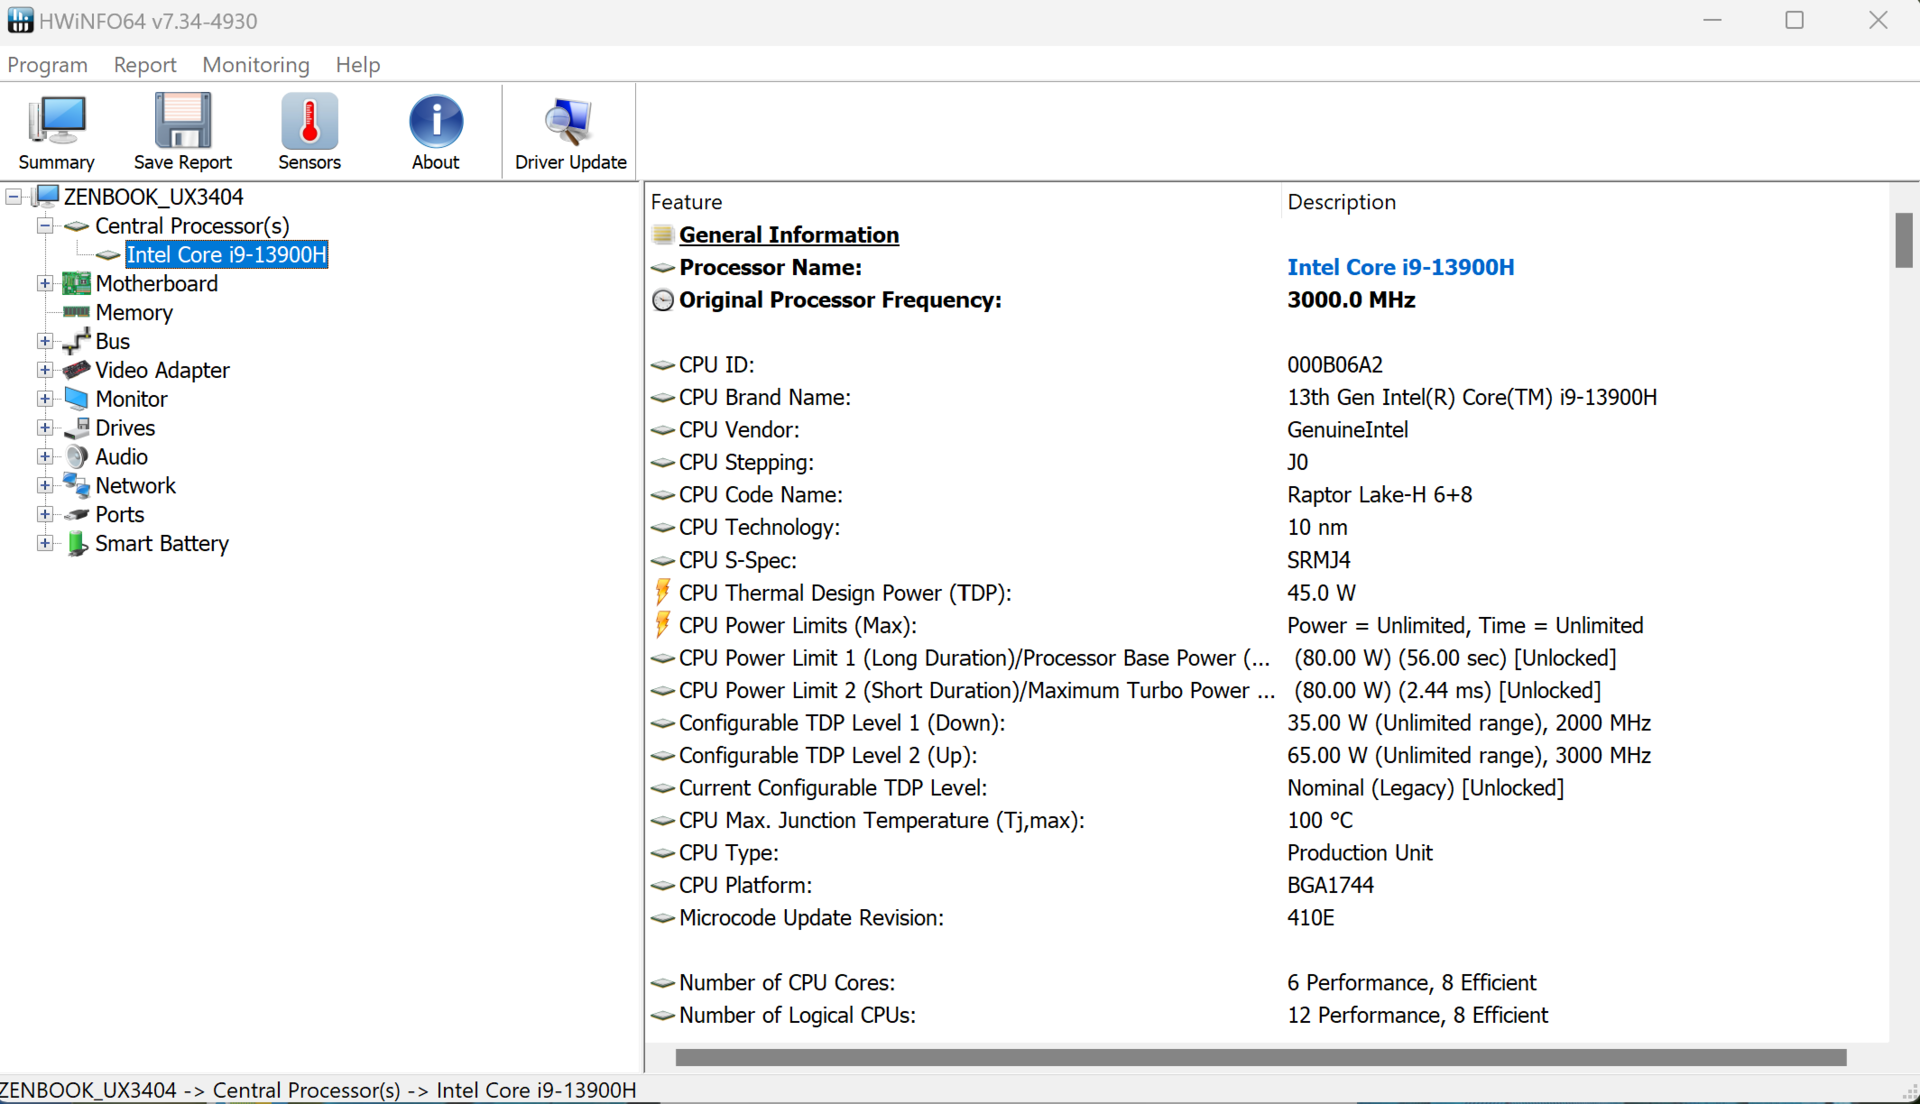
处理器
英特尔酷睿i9-13900H是猛禽湖H系列的一款高端移动CPU。该CPU结合了6个性能核心和8个效率核心。由于P核心支持超线程,该处理器有20个线程。虽然P核的时钟频率为2.6至5.4GHz,但E核的频率在1.9至4.1GHz之间
。
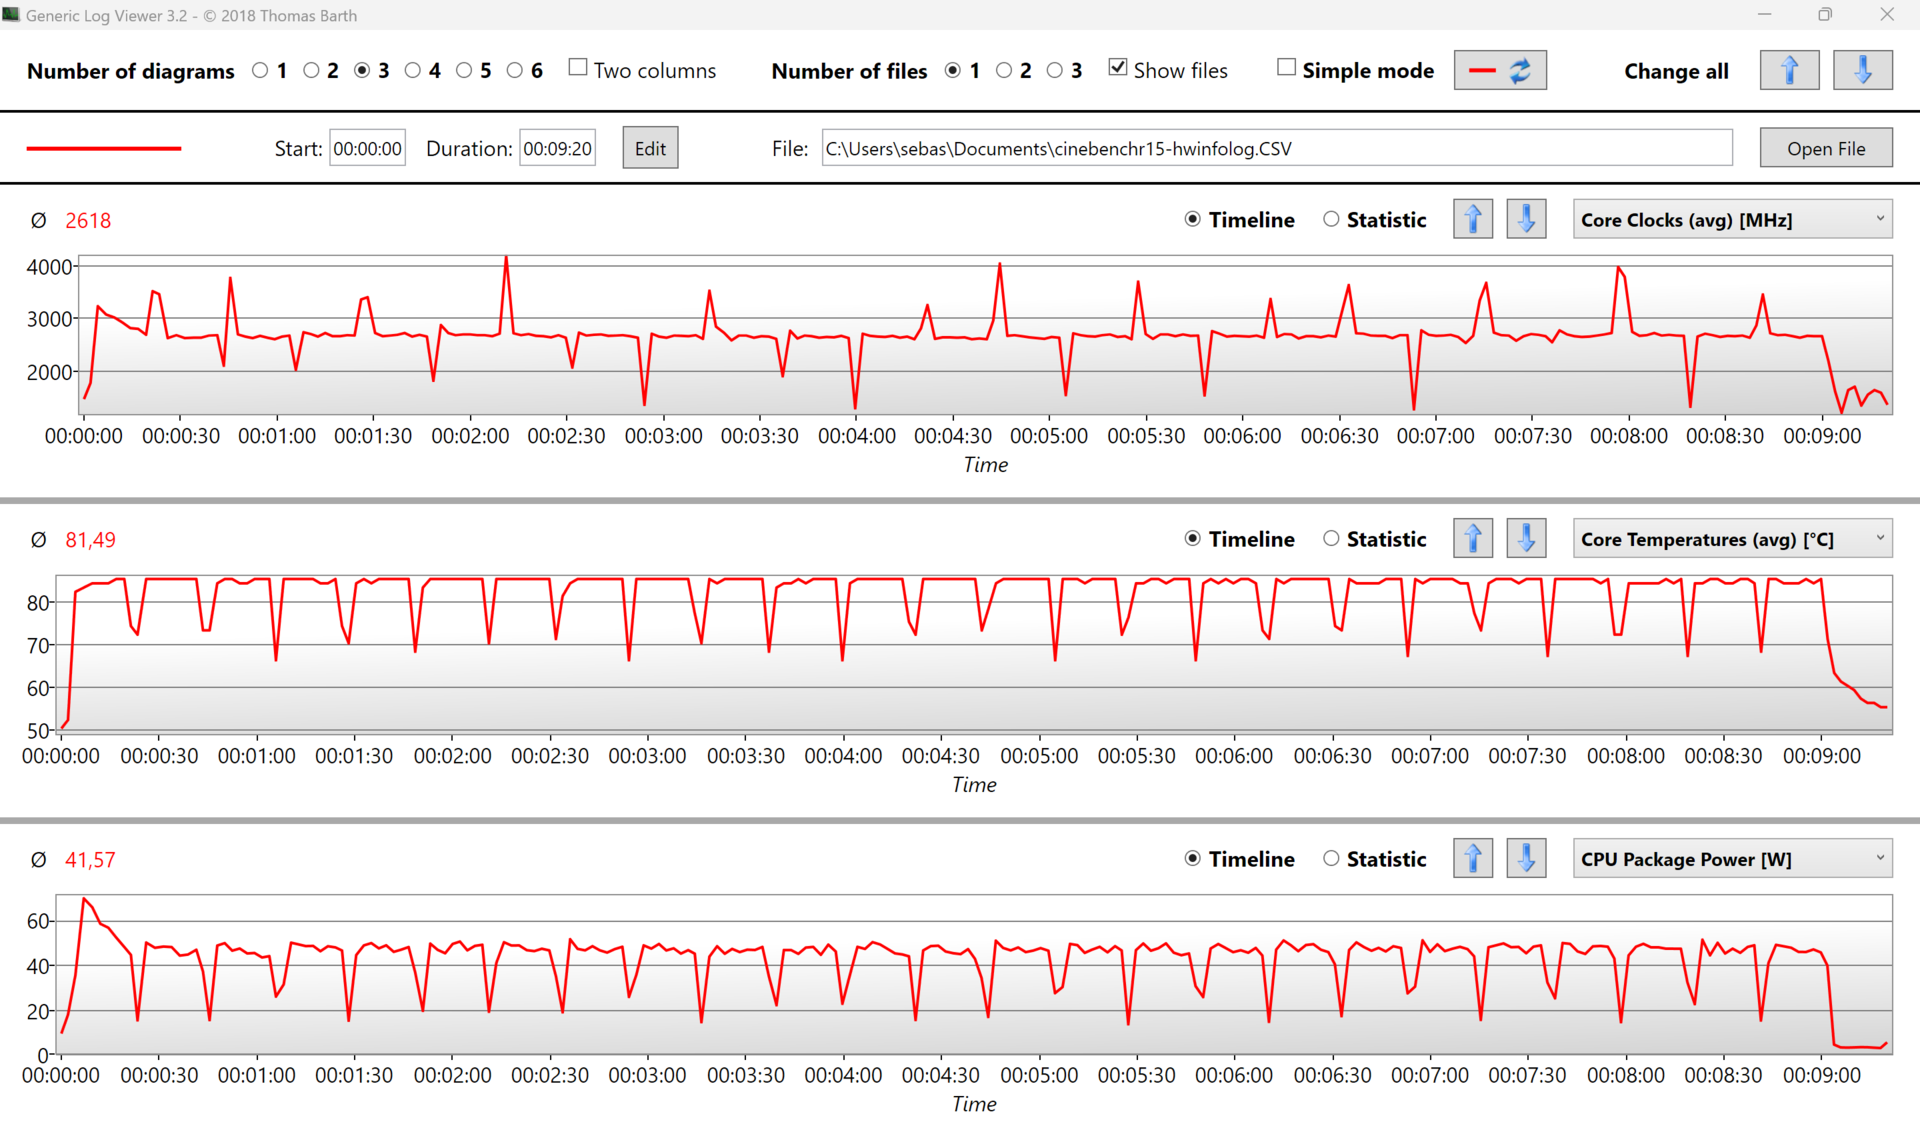
在Cinebench循环中,可以看到第一次运行后分数急剧下降,然后短暂地稳定在2250和2300分之间,但在第五次运行后再次下降,然后稳定在2150分左右。对于ZenBook的小外形来说,如果不是华硕ROG Flow Z13,这仍然是一个很好的结果,因为它作为平板电脑使用相同的处理器,表现更好。由于处理器在负载下迅速达到99℃,可以认为单风扇解决方案限制了这里的性能。
处理器被允许在短时间内消耗近80瓦,但在第一次运行后,平均消耗约40瓦。然而,在大约10分钟后,消耗下降到20瓦左右。因此,在持续负载下,平均为36瓦。Cinebench循环显示,英特尔处理器也能够在持续负载下保持高性能。
Cinebench R15 Multi Sustained Load
Cinebench R23: Multi Core | Single Core
Cinebench R20: CPU (Multi Core) | CPU (Single Core)
Cinebench R15: CPU Multi 64Bit | CPU Single 64Bit
Blender: v2.79 BMW27 CPU
7-Zip 18.03: 7z b 4 | 7z b 4 -mmt1
Geekbench 5.5: Multi-Core | Single-Core
HWBOT x265 Benchmark v2.2: 4k Preset
LibreOffice : 20 Documents To PDF
R Benchmark 2.5: Overall mean
| CPU Performance rating | |
| Asus ROG Flow Z13 GZ301V | |
| Average Intel Core i9-13900H | |
| Asus ZenBook 14X UX3404VC | |
| Dell Inspiron 14 Plus 7420 | |
| Dell XPS 13 Plus 9320 i7-1280P OLED | |
| Average of class Subnotebook | |
| Lenovo Slim Pro 7 14ARP8 | |
| Apple MacBook Pro 13 2022 M2 -5! | |
| LG Gram 14Z90Q | |
| Cinebench R23 / Multi Core | |
| Asus ROG Flow Z13 GZ301V | |
| Average Intel Core i9-13900H (11997 - 20385, n=28) | |
| Asus ZenBook 14X UX3404VC | |
| Dell Inspiron 14 Plus 7420 | |
| Lenovo Slim Pro 7 14ARP8 | |
| Average of class Subnotebook (1555 - 21812, n=60, last 2 years) | |
| Dell XPS 13 Plus 9320 i7-1280P OLED | |
| Apple MacBook Pro 13 2022 M2 | |
| LG Gram 14Z90Q | |
| Cinebench R23 / Single Core | |
| Asus ROG Flow Z13 GZ301V | |
| Asus ZenBook 14X UX3404VC | |
| Average Intel Core i9-13900H (1297 - 2054, n=26) | |
| Dell Inspiron 14 Plus 7420 | |
| Average of class Subnotebook (358 - 2213, n=61, last 2 years) | |
| Dell XPS 13 Plus 9320 i7-1280P OLED | |
| Apple MacBook Pro 13 2022 M2 | |
| Lenovo Slim Pro 7 14ARP8 | |
| LG Gram 14Z90Q | |
| Cinebench R20 / CPU (Multi Core) | |
| Asus ROG Flow Z13 GZ301V | |
| Average Intel Core i9-13900H (4935 - 7716, n=25) | |
| Asus ZenBook 14X UX3404VC | |
| Dell Inspiron 14 Plus 7420 | |
| Lenovo Slim Pro 7 14ARP8 | |
| Average of class Subnotebook (579 - 8541, n=57, last 2 years) | |
| Dell XPS 13 Plus 9320 i7-1280P OLED | |
| Apple MacBook Pro 13 2022 M2 | |
| LG Gram 14Z90Q | |
| Cinebench R20 / CPU (Single Core) | |
| Asus ROG Flow Z13 GZ301V | |
| Asus ZenBook 14X UX3404VC | |
| Average Intel Core i9-13900H (428 - 792, n=25) | |
| Dell Inspiron 14 Plus 7420 | |
| Average of class Subnotebook (128 - 832, n=57, last 2 years) | |
| Dell XPS 13 Plus 9320 i7-1280P OLED | |
| Lenovo Slim Pro 7 14ARP8 | |
| LG Gram 14Z90Q | |
| Apple MacBook Pro 13 2022 M2 | |
| Cinebench R15 / CPU Multi 64Bit | |
| Asus ROG Flow Z13 GZ301V | |
| Average Intel Core i9-13900H (2061 - 3100, n=26) | |
| Asus ZenBook 14X UX3404VC | |
| Dell Inspiron 14 Plus 7420 | |
| Lenovo Slim Pro 7 14ARP8 | |
| Average of class Subnotebook (327 - 3345, n=57, last 2 years) | |
| Dell XPS 13 Plus 9320 i7-1280P OLED | |
| Apple MacBook Pro 13 2022 M2 | |
| LG Gram 14Z90Q | |
| Cinebench R15 / CPU Single 64Bit | |
| Asus ROG Flow Z13 GZ301V | |
| Average Intel Core i9-13900H (211 - 297, n=26) | |
| Asus ZenBook 14X UX3404VC | |
| Average of class Subnotebook (72.4 - 322, n=57, last 2 years) | |
| Dell Inspiron 14 Plus 7420 | |
| Dell XPS 13 Plus 9320 i7-1280P OLED | |
| Apple MacBook Pro 13 2022 M2 | |
| Lenovo Slim Pro 7 14ARP8 | |
| LG Gram 14Z90Q | |
| Blender / v2.79 BMW27 CPU | |
| Apple MacBook Pro 13 2022 M2 | |
| LG Gram 14Z90Q | |
| Average of class Subnotebook (159 - 2271, n=58, last 2 years) | |
| Dell XPS 13 Plus 9320 i7-1280P OLED | |
| Dell Inspiron 14 Plus 7420 | |
| Lenovo Slim Pro 7 14ARP8 | |
| Asus ZenBook 14X UX3404VC | |
| Average Intel Core i9-13900H (166 - 268, n=24) | |
| Asus ROG Flow Z13 GZ301V | |
| 7-Zip 18.03 / 7z b 4 | |
| Asus ROG Flow Z13 GZ301V | |
| Average Intel Core i9-13900H (45045 - 79032, n=25) | |
| Asus ZenBook 14X UX3404VC | |
| Dell Inspiron 14 Plus 7420 | |
| Lenovo Slim Pro 7 14ARP8 | |
| Dell XPS 13 Plus 9320 i7-1280P OLED | |
| Average of class Subnotebook (11668 - 77867, n=57, last 2 years) | |
| LG Gram 14Z90Q | |
| 7-Zip 18.03 / 7z b 4 -mmt1 | |
| Asus ROG Flow Z13 GZ301V | |
| Asus ZenBook 14X UX3404VC | |
| Average Intel Core i9-13900H (3665 - 6600, n=25) | |
| Dell Inspiron 14 Plus 7420 | |
| Average of class Subnotebook (2643 - 6699, n=59, last 2 years) | |
| Dell XPS 13 Plus 9320 i7-1280P OLED | |
| Lenovo Slim Pro 7 14ARP8 | |
| LG Gram 14Z90Q | |
| Geekbench 5.5 / Multi-Core | |
| Asus ROG Flow Z13 GZ301V | |
| Average Intel Core i9-13900H (9094 - 15410, n=26) | |
| Asus ZenBook 14X UX3404VC | |
| Dell Inspiron 14 Plus 7420 | |
| Dell XPS 13 Plus 9320 i7-1280P OLED | |
| Average of class Subnotebook (2557 - 17218, n=48, last 2 years) | |
| Lenovo Slim Pro 7 14ARP8 | |
| Apple MacBook Pro 13 2022 M2 | |
| LG Gram 14Z90Q | |
| Geekbench 5.5 / Single-Core | |
| Asus ROG Flow Z13 GZ301V | |
| Asus ZenBook 14X UX3404VC | |
| Apple MacBook Pro 13 2022 M2 | |
| Average of class Subnotebook (726 - 2224, n=48, last 2 years) | |
| Average Intel Core i9-13900H (1140 - 2043, n=26) | |
| Dell XPS 13 Plus 9320 i7-1280P OLED | |
| Dell Inspiron 14 Plus 7420 | |
| LG Gram 14Z90Q | |
| Lenovo Slim Pro 7 14ARP8 | |
| HWBOT x265 Benchmark v2.2 / 4k Preset | |
| Asus ROG Flow Z13 GZ301V | |
| Average Intel Core i9-13900H (14.1 - 22.3, n=25) | |
| Asus ZenBook 14X UX3404VC | |
| Lenovo Slim Pro 7 14ARP8 | |
| Dell Inspiron 14 Plus 7420 | |
| Dell XPS 13 Plus 9320 i7-1280P OLED | |
| Average of class Subnotebook (0.97 - 25.1, n=57, last 2 years) | |
| LG Gram 14Z90Q | |
| LibreOffice / 20 Documents To PDF | |
| Lenovo Slim Pro 7 14ARP8 | |
| Average of class Subnotebook (39.9 - 220, n=56, last 2 years) | |
| LG Gram 14Z90Q | |
| Dell XPS 13 Plus 9320 i7-1280P OLED | |
| Dell Inspiron 14 Plus 7420 | |
| Asus ZenBook 14X UX3404VC | |
| Average Intel Core i9-13900H (34.4 - 82.8, n=25) | |
| Asus ROG Flow Z13 GZ301V | |
| R Benchmark 2.5 / Overall mean | |
| Lenovo Slim Pro 7 14ARP8 | |
| LG Gram 14Z90Q | |
| Average of class Subnotebook (0.4024 - 1.456, n=58, last 2 years) | |
| Dell XPS 13 Plus 9320 i7-1280P OLED | |
| Dell Inspiron 14 Plus 7420 | |
| Average Intel Core i9-13900H (0.4052 - 0.723, n=25) | |
| Asus ZenBook 14X UX3404VC | |
| Asus ROG Flow Z13 GZ301V | |
* ... smaller is better
AIDA64: FP32 Ray-Trace | FPU Julia | CPU SHA3 | CPU Queen | FPU SinJulia | FPU Mandel | CPU AES | CPU ZLib | FP64 Ray-Trace | CPU PhotoWorxx
| Performance rating | |
| Asus ROG Flow Z13 GZ301V | |
| Average Intel Core i9-13900H | |
| Lenovo Slim Pro 7 14ARP8 | |
| Asus ZenBook 14X UX3404VC | |
| Dell Inspiron 14 Plus 7420 | |
| Average of class Subnotebook | |
| Dell XPS 13 Plus 9320 i7-1280P OLED | |
| LG Gram 14Z90Q | |
| AIDA64 / FP32 Ray-Trace | |
| Asus ROG Flow Z13 GZ301V | |
| Lenovo Slim Pro 7 14ARP8 | |
| Average Intel Core i9-13900H (6788 - 19557, n=25) | |
| Asus ZenBook 14X UX3404VC | |
| Average of class Subnotebook (1135 - 32888, n=58, last 2 years) | |
| Dell Inspiron 14 Plus 7420 | |
| Dell XPS 13 Plus 9320 i7-1280P OLED | |
| LG Gram 14Z90Q | |
| AIDA64 / FPU Julia | |
| Lenovo Slim Pro 7 14ARP8 | |
| Asus ROG Flow Z13 GZ301V | |
| Average Intel Core i9-13900H (22551 - 95579, n=25) | |
| Asus ZenBook 14X UX3404VC | |
| Average of class Subnotebook (5218 - 123315, n=58, last 2 years) | |
| Dell Inspiron 14 Plus 7420 | |
| Dell XPS 13 Plus 9320 i7-1280P OLED | |
| LG Gram 14Z90Q | |
| AIDA64 / CPU SHA3 | |
| Average Intel Core i9-13900H (2491 - 4270, n=25) | |
| Asus ROG Flow Z13 GZ301V | |
| Asus ZenBook 14X UX3404VC | |
| Lenovo Slim Pro 7 14ARP8 | |
| Average of class Subnotebook (444 - 5287, n=58, last 2 years) | |
| Dell Inspiron 14 Plus 7420 | |
| Dell XPS 13 Plus 9320 i7-1280P OLED | |
| LG Gram 14Z90Q | |
| AIDA64 / CPU Queen | |
| Asus ROG Flow Z13 GZ301V | |
| Asus ZenBook 14X UX3404VC | |
| Average Intel Core i9-13900H (65121 - 120936, n=25) | |
| Dell Inspiron 14 Plus 7420 | |
| Dell XPS 13 Plus 9320 i7-1280P OLED | |
| Lenovo Slim Pro 7 14ARP8 | |
| LG Gram 14Z90Q | |
| Average of class Subnotebook (10579 - 95002, n=49, last 2 years) | |
| AIDA64 / FPU SinJulia | |
| Lenovo Slim Pro 7 14ARP8 | |
| Asus ROG Flow Z13 GZ301V | |
| Average Intel Core i9-13900H (6108 - 11631, n=25) | |
| Asus ZenBook 14X UX3404VC | |
| Dell Inspiron 14 Plus 7420 | |
| Dell XPS 13 Plus 9320 i7-1280P OLED | |
| Average of class Subnotebook (744 - 18418, n=58, last 2 years) | |
| LG Gram 14Z90Q | |
| AIDA64 / FPU Mandel | |
| Lenovo Slim Pro 7 14ARP8 | |
| Asus ROG Flow Z13 GZ301V | |
| Average Intel Core i9-13900H (11283 - 48474, n=25) | |
| Asus ZenBook 14X UX3404VC | |
| Average of class Subnotebook (3341 - 65433, n=58, last 2 years) | |
| Dell Inspiron 14 Plus 7420 | |
| Dell XPS 13 Plus 9320 i7-1280P OLED | |
| LG Gram 14Z90Q | |
| AIDA64 / CPU AES | |
| Average Intel Core i9-13900H (3691 - 149377, n=25) | |
| Asus ROG Flow Z13 GZ301V | |
| Asus ZenBook 14X UX3404VC | |
| Dell Inspiron 14 Plus 7420 | |
| Dell XPS 13 Plus 9320 i7-1280P OLED | |
| Average of class Subnotebook (638 - 96917, n=58, last 2 years) | |
| Lenovo Slim Pro 7 14ARP8 | |
| LG Gram 14Z90Q | |
| AIDA64 / CPU ZLib | |
| Asus ROG Flow Z13 GZ301V | |
| Average Intel Core i9-13900H (789 - 1254, n=25) | |
| Asus ZenBook 14X UX3404VC | |
| Dell Inspiron 14 Plus 7420 | |
| Lenovo Slim Pro 7 14ARP8 | |
| Average of class Subnotebook (164.9 - 1379, n=58, last 2 years) | |
| Dell XPS 13 Plus 9320 i7-1280P OLED | |
| LG Gram 14Z90Q | |
| AIDA64 / FP64 Ray-Trace | |
| Asus ROG Flow Z13 GZ301V | |
| Average Intel Core i9-13900H (3655 - 10716, n=25) | |
| Lenovo Slim Pro 7 14ARP8 | |
| Asus ZenBook 14X UX3404VC | |
| Average of class Subnotebook (610 - 17495, n=58, last 2 years) | |
| Dell Inspiron 14 Plus 7420 | |
| Dell XPS 13 Plus 9320 i7-1280P OLED | |
| LG Gram 14Z90Q | |
| AIDA64 / CPU PhotoWorxx | |
| Average of class Subnotebook (6569 - 85600, n=58, last 2 years) | |
| Dell XPS 13 Plus 9320 i7-1280P OLED | |
| Asus ROG Flow Z13 GZ301V | |
| Asus ZenBook 14X UX3404VC | |
| Average Intel Core i9-13900H (10871 - 50488, n=25) | |
| Dell Inspiron 14 Plus 7420 | |
| Lenovo Slim Pro 7 14ARP8 | |
| LG Gram 14Z90Q | |
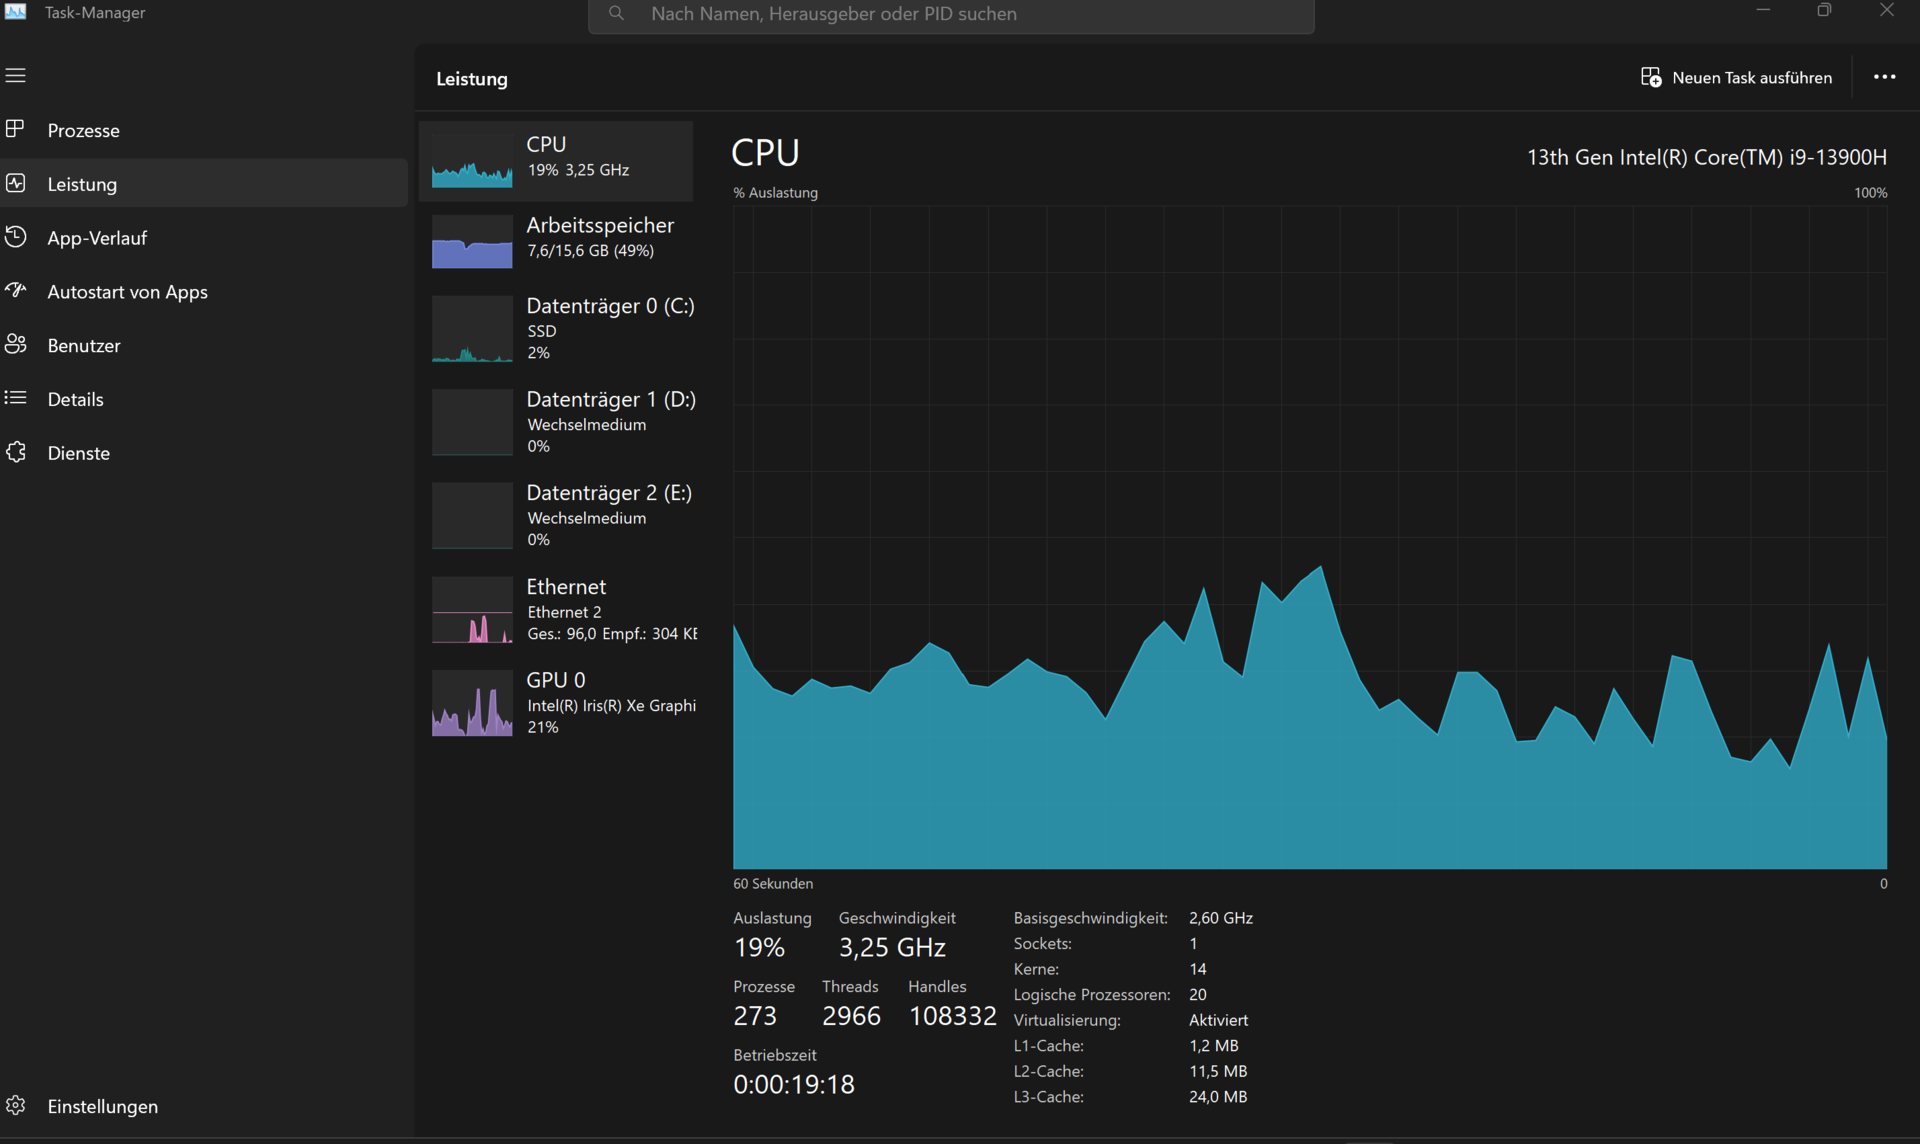
系统性能
我们对ZenBook 14X的主观性能印象非常好,我们在测试中没有发现任何限制或明显的滞后。合成基准测试的结果处于平均范围,但与去年ZenBook的AMD变体相比,这里取得了更好的结果。
CrossMark: Overall | Productivity | Creativity | Responsiveness
| PCMark 10 / Score | |
| Asus ROG Flow Z13 GZ301V | |
| Average of class Subnotebook (4920 - 9939, n=45, last 2 years) | |
| Dell Inspiron 14 Plus 7420 | |
| Lenovo Slim Pro 7 14ARP8 | |
| Asus ZenBook 14X UX3404VC | |
| Average Intel Core i9-13900H, Intel Iris Xe Graphics G7 96EUs (5944 - 6802, n=8) | |
| Dell XPS 13 Plus 9320 i7-1280P OLED | |
| LG Gram 14Z90Q | |
| PCMark 10 / Essentials | |
| Asus ROG Flow Z13 GZ301V | |
| Average Intel Core i9-13900H, Intel Iris Xe Graphics G7 96EUs (10347 - 12286, n=8) | |
| Asus ZenBook 14X UX3404VC | |
| Dell XPS 13 Plus 9320 i7-1280P OLED | |
| Average of class Subnotebook (8552 - 11646, n=45, last 2 years) | |
| Dell Inspiron 14 Plus 7420 | |
| Lenovo Slim Pro 7 14ARP8 | |
| LG Gram 14Z90Q | |
| PCMark 10 / Productivity | |
| Asus ROG Flow Z13 GZ301V | |
| Average of class Subnotebook (5435 - 16606, n=45, last 2 years) | |
| Dell Inspiron 14 Plus 7420 | |
| Lenovo Slim Pro 7 14ARP8 | |
| Asus ZenBook 14X UX3404VC | |
| Average Intel Core i9-13900H, Intel Iris Xe Graphics G7 96EUs (7319 - 8526, n=8) | |
| Dell XPS 13 Plus 9320 i7-1280P OLED | |
| LG Gram 14Z90Q | |
| PCMark 10 / Digital Content Creation | |
| Asus ROG Flow Z13 GZ301V | |
| Average of class Subnotebook (5722 - 13779, n=45, last 2 years) | |
| Lenovo Slim Pro 7 14ARP8 | |
| Dell Inspiron 14 Plus 7420 | |
| Average Intel Core i9-13900H, Intel Iris Xe Graphics G7 96EUs (7527 - 8155, n=8) | |
| Asus ZenBook 14X UX3404VC | |
| Dell XPS 13 Plus 9320 i7-1280P OLED | |
| LG Gram 14Z90Q | |
| CrossMark / Overall | |
| Asus ROG Flow Z13 GZ301V | |
| Average Intel Core i9-13900H, Intel Iris Xe Graphics G7 96EUs (1766 - 2146, n=7) | |
| Asus ZenBook 14X UX3404VC | |
| Dell XPS 13 Plus 9320 i7-1280P OLED | |
| Dell Inspiron 14 Plus 7420 | |
| Average of class Subnotebook (365 - 2356, n=60, last 2 years) | |
| Apple MacBook Pro 13 2022 M2 | |
| Lenovo Slim Pro 7 14ARP8 | |
| CrossMark / Productivity | |
| Asus ROG Flow Z13 GZ301V | |
| Average Intel Core i9-13900H, Intel Iris Xe Graphics G7 96EUs (1684 - 2064, n=7) | |
| Asus ZenBook 14X UX3404VC | |
| Dell XPS 13 Plus 9320 i7-1280P OLED | |
| Dell Inspiron 14 Plus 7420 | |
| Average of class Subnotebook (364 - 2277, n=60, last 2 years) | |
| Apple MacBook Pro 13 2022 M2 | |
| Lenovo Slim Pro 7 14ARP8 | |
| CrossMark / Creativity | |
| Asus ROG Flow Z13 GZ301V | |
| Asus ZenBook 14X UX3404VC | |
| Average Intel Core i9-13900H, Intel Iris Xe Graphics G7 96EUs (1789 - 2224, n=7) | |
| Dell XPS 13 Plus 9320 i7-1280P OLED | |
| Dell Inspiron 14 Plus 7420 | |
| Average of class Subnotebook (372 - 2743, n=60, last 2 years) | |
| Apple MacBook Pro 13 2022 M2 | |
| Lenovo Slim Pro 7 14ARP8 | |
| CrossMark / Responsiveness | |
| Average Intel Core i9-13900H, Intel Iris Xe Graphics G7 96EUs (1474 - 2171, n=7) | |
| Asus ROG Flow Z13 GZ301V | |
| Asus ZenBook 14X UX3404VC | |
| Dell XPS 13 Plus 9320 i7-1280P OLED | |
| Dell Inspiron 14 Plus 7420 | |
| Average of class Subnotebook (312 - 1854, n=60, last 2 years) | |
| Lenovo Slim Pro 7 14ARP8 | |
| Apple MacBook Pro 13 2022 M2 | |
| PCMark 10 Score | 6330 points | |
Help | ||
| AIDA64 / Memory Copy | |
| Average of class Subnotebook (14554 - 131023, n=58, last 2 years) | |
| Asus ZenBook 14X UX3404VC | |
| Average Intel Core i9-13900H (37448 - 74486, n=25) | |
| AIDA64 / Memory Read | |
| Average of class Subnotebook (15948 - 127174, n=58, last 2 years) | |
| Average Intel Core i9-13900H (41599 - 75433, n=25) | |
| Asus ZenBook 14X UX3404VC | |
| AIDA64 / Memory Write | |
| Average of class Subnotebook (15709 - 135141, n=58, last 2 years) | |
| Asus ZenBook 14X UX3404VC | |
| Average Intel Core i9-13900H (36152 - 88505, n=25) | |
| AIDA64 / Memory Latency | |
| Average of class Subnotebook (6.1 - 159.9, n=56, last 2 years) | |
| Asus ZenBook 14X UX3404VC | |
| Average Intel Core i9-13900H (75.8 - 102.3, n=25) | |
* ... smaller is better
DPC延时
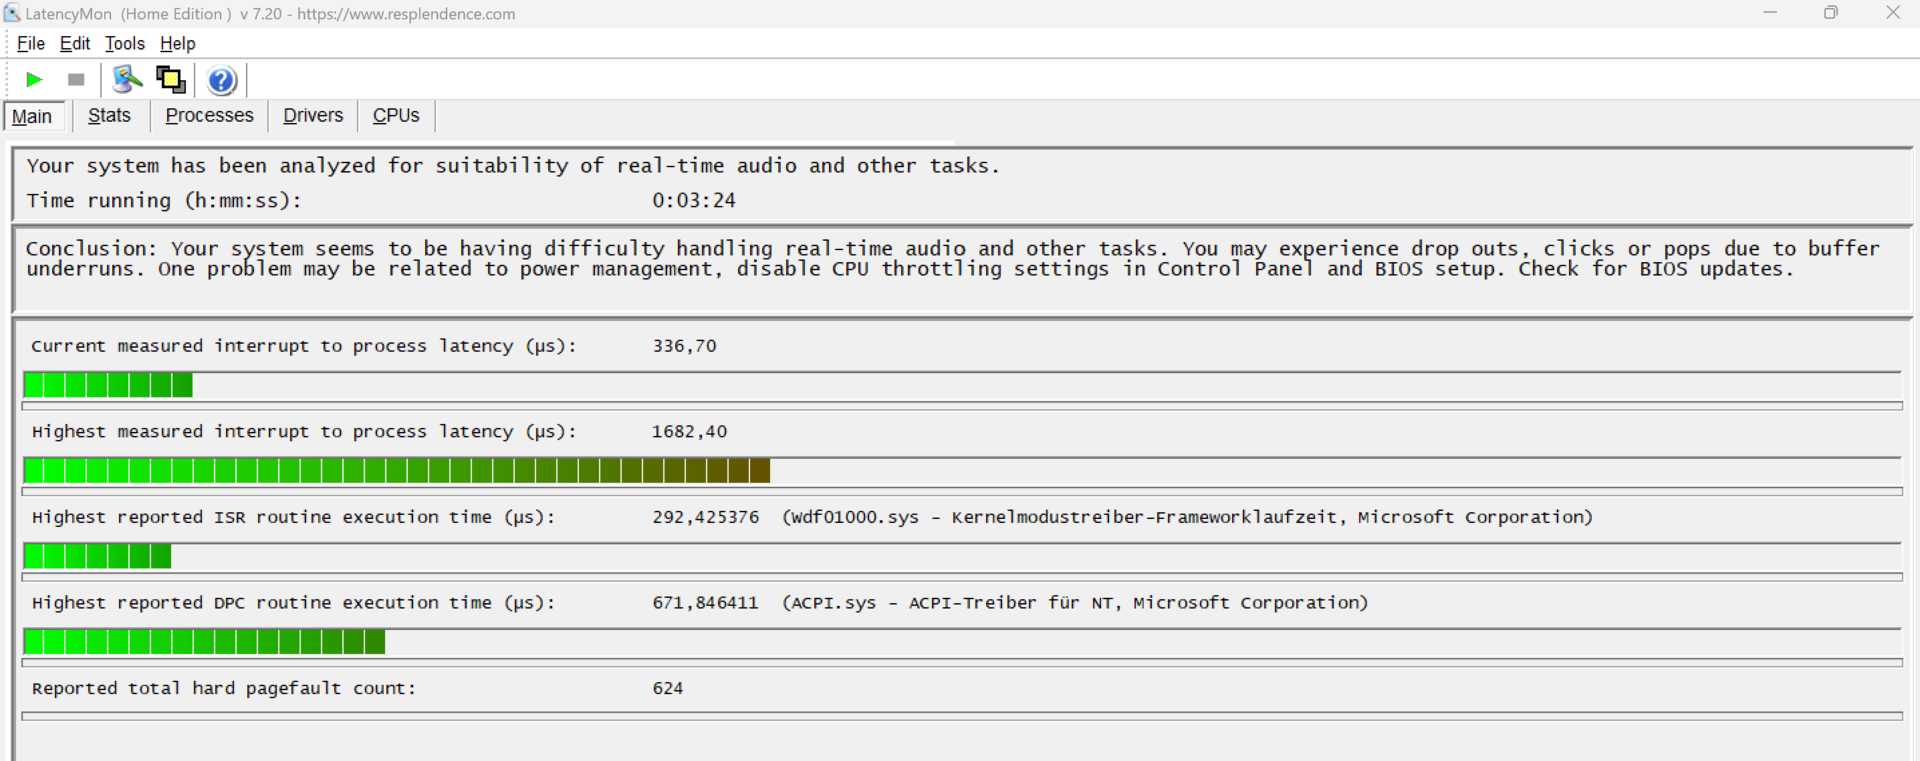
我们的标准化延迟测试(网页浏览、4K YouTube播放、CPU负载)显示了异常情况。因此,该系统不适合无限制地进行实时视频和音频编辑。这可能会随着即将到来的BIOS版本和设备驱动程序而改变。
| DPC Latencies / LatencyMon - interrupt to process latency (max), Web, Youtube, Prime95 | |
| Asus ROG Flow Z13 GZ301V | |
| Asus ZenBook 14X UX3404VC | |
| Lenovo Slim Pro 7 14ARP8 | |
| LG Gram 14Z90Q | |
| Dell Inspiron 14 Plus 7420 | |
| Dell XPS 13 Plus 9320 i7-1280P OLED | |
* ... smaller is better
存储设备
华硕在ZenBook 14X上安装了美光2450 PCIe 4.0固态硬盘,存储容量为1TB。第一次开机时,其中862GB可用。与次笔记本的平均水平相比,该固态硬盘表现良好,但我们的基准表显示,与同类设备相比,有明显的劣势。

* ... smaller is better
Sustained Read Performance: DiskSpd Read Loop, Queue Depth 8
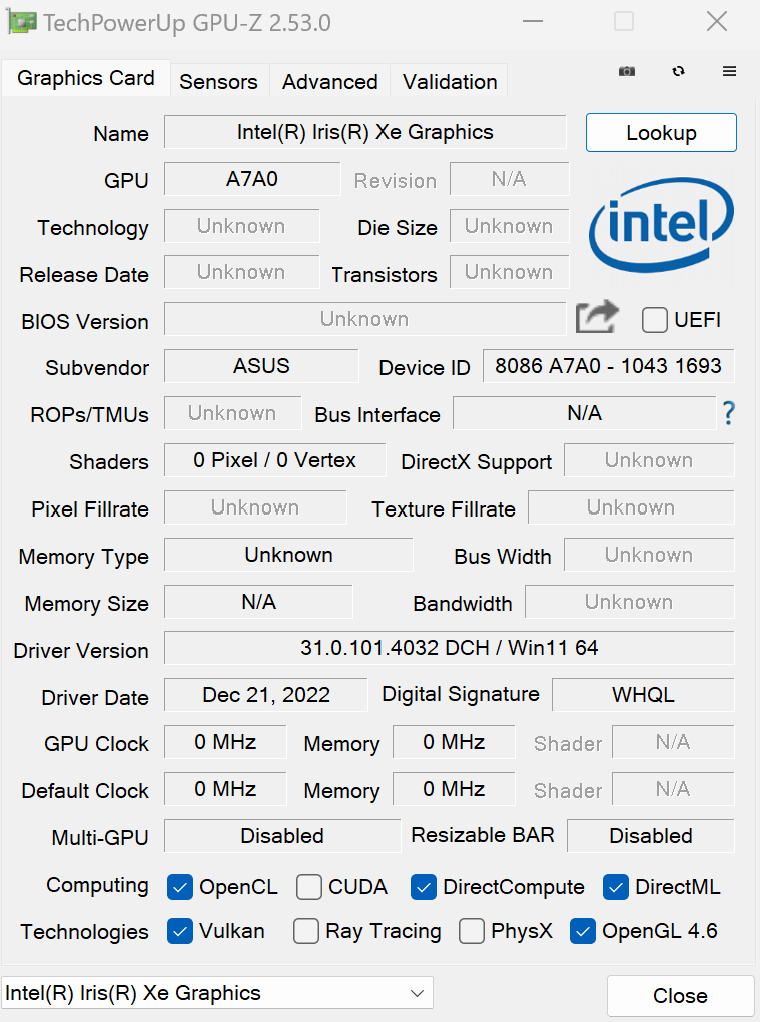
图形卡
华硕ZenBook 14X使用了著名的英特尔集成Iris XE图形G7的更快版本,有96个EUs,最大时钟速度为1300MHz。iGPU很容易满足日常任务的需要,但对于游戏等要求更高的服务,则必须做出明显的妥协。由于AMD的Radeon RX Vega 8,基于AMD的前辈在这里表现得更好。
然而,值得注意的是,新华硕ZenBook 14X的iGPU比英特尔Iris Xe Graphics G7的平均性能高出14%。
| 3DMark Cloud Gate Standard Score | 22427 points | |
| 3DMark Fire Strike Score | 5160 points | |
Help | ||
| Blender - v3.3 Classroom CPU | |
| Average Intel Iris Xe Graphics G7 96EUs (336 - 1259, n=109) | |
| Average of class Subnotebook (241 - 861, n=60, last 2 years) | |
| Asus ZenBook 14X UX3404VC | |
* ... smaller is better
游戏性能
如前所述,英特尔iGPU的游戏性能仍然很平庸。AMD在这里显然有优势,其Radeon680M和 780M......较老的游戏可以在较低的分辨率和较低的图形设置下玩,但华硕ZenBook 14X的120赫兹显示屏的潜力在这里绝不是用尽了。如果你想要更多的性能,你可以为ZenBook配备一个专用的 NvidiaGeForce RTX 3050、这使得大多数游戏都可以玩,至少在较低的图形设置下。
| The Witcher 3 - 1920x1080 Ultra Graphics & Postprocessing (HBAO+) | |
| Asus ROG Flow Z13 GZ301V | |
| Lenovo Slim Pro 7 14ARP8 | |
| Dell Inspiron 14 Plus 7420 | |
| Average of class Subnotebook (13.9 - 34.6, n=13, last 2 years) | |
| Asus ZenBook 14X UX3404VC | |
| Dell XPS 13 Plus 9320 i7-1280P OLED | |
| LG Gram 14Z90Q | |
| GTA V - 1920x1080 Highest AA:4xMSAA + FX AF:16x | |
| Asus ROG Flow Z13 GZ301V | |
| Lenovo Slim Pro 7 14ARP8 | |
| Dell Inspiron 14 Plus 7420 | |
| Average of class Subnotebook (10.7 - 43.7, n=56, last 2 years) | |
| Dell XPS 13 Plus 9320 i7-1280P OLED | |
| Asus ZenBook 14X UX3404VC | |
| Final Fantasy XV Benchmark - 1920x1080 High Quality | |
| Asus ROG Flow Z13 GZ301V | |
| Lenovo Slim Pro 7 14ARP8 | |
| Dell Inspiron 14 Plus 7420 | |
| Average of class Subnotebook (11.6 - 54.5, n=54, last 2 years) | |
| Dell XPS 13 Plus 9320 i7-1280P OLED | |
| LG Gram 14Z90Q | |
| Strange Brigade - 1920x1080 ultra AA:ultra AF:16 | |
| Asus ROG Flow Z13 GZ301V | |
| Dell Inspiron 14 Plus 7420 | |
| Average of class Subnotebook (19 - 101.3, n=50, last 2 years) | |
| Dell XPS 13 Plus 9320 i7-1280P OLED | |
| Asus ZenBook 14X UX3404VC | |
| Asus ZenBook 14X UX3404VC | |
| Dota 2 Reborn - 1920x1080 ultra (3/3) best looking | |
| Asus ROG Flow Z13 GZ301V | |
| Dell Inspiron 14 Plus 7420 | |
| Lenovo Slim Pro 7 14ARP8 | |
| Average of class Subnotebook (13 - 97, n=61, last 2 years) | |
| Asus ZenBook 14X UX3404VC | |
| Dell XPS 13 Plus 9320 i7-1280P OLED | |
| LG Gram 14Z90Q | |
ZenBook 14X的iGPU在Witcher测试中运行稳定。运行 Witcher 3(在Ultra设置和FHD分辨率下(循环)运行,平均速度为17帧。
Witcher 3 FPS chart
| low | med. | high | ultra | QHD | |
|---|---|---|---|---|---|
| GTA V (2015) | 116.7 | 103.9 | 25.2 | 10.6 | 6.79 |
| The Witcher 3 (2015) | 87 | 59 | 33 | 17 | |
| Dota 2 Reborn (2015) | 126.5 | 94.1 | 74.9 | 68.3 | |
| X-Plane 11.11 (2018) | 50.8 | 41.8 | 34.5 | ||
| Far Cry 5 (2018) | 55 | 30 | 28 | 26 | 17 |
| Strange Brigade (2018) | 99.7 | 42.5 | 34 | 27.2 | 19.6 |
| F1 22 (2022) | 52.8 | 48.7 | 34.1 | 26.1 | 18.7 |
排放
噪音 - 显著地安静
ZenBook 14X的最大音量为45.5 dB(A),绝对是市场上最安静的副笔记本之一。在日常使用中,几乎听不到风扇的声音,即使在负载情况下,设备平均也保持在40 dB(A)以下。然而,由于只安装了一个风扇(与去年的型号相比),冷却系统有点弱,所以这限制了英特尔酷睿i9-13900H。在性能 模式下,风扇在正常的办公任务中也会更频繁地旋转起来,而且在标准 模式下也从未保持完全静音。
另一方面,启动静音 模式可以使性能小幅下降,据此,副笔记本几乎听不到声音。
Noise level
| Idle |
| 25.2 / 25.2 / 26.5 dB(A) |
| Load |
| 39.8 / 45.5 dB(A) |
 | ||
30 dB silent 40 dB(A) audible 50 dB(A) loud |
||
min: | ||
| Asus ZenBook 14X UX3404VC Iris Xe G7 96EUs, i9-13900H, Micron 2450 1TB MTFDKBA1T0TFK | Apple MacBook Pro 13 2022 M2 M2 10-Core GPU, M2, Apple SSD AP1024Z | Dell XPS 13 Plus 9320 i7-1280P OLED Iris Xe G7 96EUs, i7-1280P, WDC PC SN810 512GB | Lenovo Slim Pro 7 14ARP8 GeForce RTX 3050 6GB Laptop GPU, R7 7735HS, SK hynix PC801 HFS512GEJ9X115N | LG Gram 14Z90Q Iris Xe G7 80EUs, i5-1240P, Samsung PM9A1 MZVL2512HCJQ | Dell Inspiron 14 Plus 7420 GeForce RTX 3050 4GB Laptop GPU, i7-12700H, SK Hynix BC711 512GB HFM512GD3GX013N | Asus ROG Flow Z13 GZ301V GeForce RTX 4060 Laptop GPU, i9-13900H, WD PC SN740 SDDPTQD-1T00 | |
|---|---|---|---|---|---|---|---|
| Noise | 10% | 10% | 5% | 3% | 1% | 5% | |
| off / environment * (dB) | 25.2 | 23.9 5% | 23.4 7% | 22.7 10% | 25 1% | 23.2 8% | 24 5% |
| Idle Minimum * (dB) | 25.2 | 23.9 5% | 23.4 7% | 22.8 10% | 26 -3% | 23.2 8% | 24 5% |
| Idle Average * (dB) | 25.2 | 23.9 5% | 23.4 7% | 22.8 10% | 27 -7% | 23.2 8% | 24 5% |
| Idle Maximum * (dB) | 26.5 | 23.9 10% | 23.4 12% | 22.8 14% | 28 -6% | 23.2 12% | 24 9% |
| Load Average * (dB) | 39.8 | 23.9 40% | 35 12% | 43.8 -10% | 35 12% | 47.5 -19% | 38.61 3% |
| Load Maximum * (dB) | 45.5 | 49 -8% | 39.9 12% | 47.1 -4% | 36 21% | 51.7 -14% | 43.59 4% |
| Witcher 3 ultra * (dB) | 34.6 | 41.6 | 43.8 | 36 | 51.7 | 41.24 |
* ... smaller is better
温度
在日常使用中(办公室、互联网),温度保持在一个不明显的范围内,只有键盘上方的中间区域在负载下会有一点温度。单个风扇从底部吸入空气,并将左侧和背面的废热排出。因此,掌托始终保持凉爽,而键盘则在31℃左右徘徊,这并没有证明是令人不适的。
(+) The maximum temperature on the upper side is 38.9 °C / 102 F, compared to the average of 35.9 °C / 97 F, ranging from 21.4 to 59 °C for the class Subnotebook.
(±) The bottom heats up to a maximum of 43.4 °C / 110 F, compared to the average of 39.2 °C / 103 F
(+) In idle usage, the average temperature for the upper side is 31.1 °C / 88 F, compared to the device average of 30.8 °C / 87 F.
(±) Playing The Witcher 3, the average temperature for the upper side is 32.7 °C / 91 F, compared to the device average of 30.8 °C / 87 F.
(+) The palmrests and touchpad are reaching skin temperature as a maximum (33.9 °C / 93 F) and are therefore not hot.
(-) The average temperature of the palmrest area of similar devices was 28.2 °C / 82.8 F (-5.7 °C / -10.2 F).
| Asus ZenBook 14X UX3404VC Intel Core i9-13900H, Intel Iris Xe Graphics G7 96EUs | Apple MacBook Pro 13 2022 M2 Apple M2, Apple M2 10-Core GPU | Lenovo Slim Pro 7 14ARP8 AMD Ryzen 7 7735HS, NVIDIA GeForce RTX 3050 6GB Laptop GPU | LG Gram 14Z90Q Intel Core i5-1240P, Intel Iris Xe Graphics G7 80EUs | Dell Inspiron 14 Plus 7420 Intel Core i7-12700H, NVIDIA GeForce RTX 3050 4GB Laptop GPU | Asus ROG Flow Z13 GZ301V Intel Core i9-13900H, NVIDIA GeForce RTX 4060 Laptop GPU | |
|---|---|---|---|---|---|---|
| Heat | 10% | 9% | 6% | 12% | 5% | |
| Maximum Upper Side * (°C) | 38.9 | 45.1 -16% | 42.2 -8% | 43 -11% | 40 -3% | 42 -8% |
| Maximum Bottom * (°C) | 43.4 | 43 1% | 49 -13% | 45 -4% | 36.4 16% | 47 -8% |
| Idle Upper Side * (°C) | 33.5 | 25.2 25% | 24.4 27% | 27 19% | 27 19% | 27 19% |
| Idle Bottom * (°C) | 35.3 | 25.4 28% | 25.2 29% | 28 21% | 29.2 17% | 30 15% |
* ... smaller is better
压力测试 - 时钟率太低
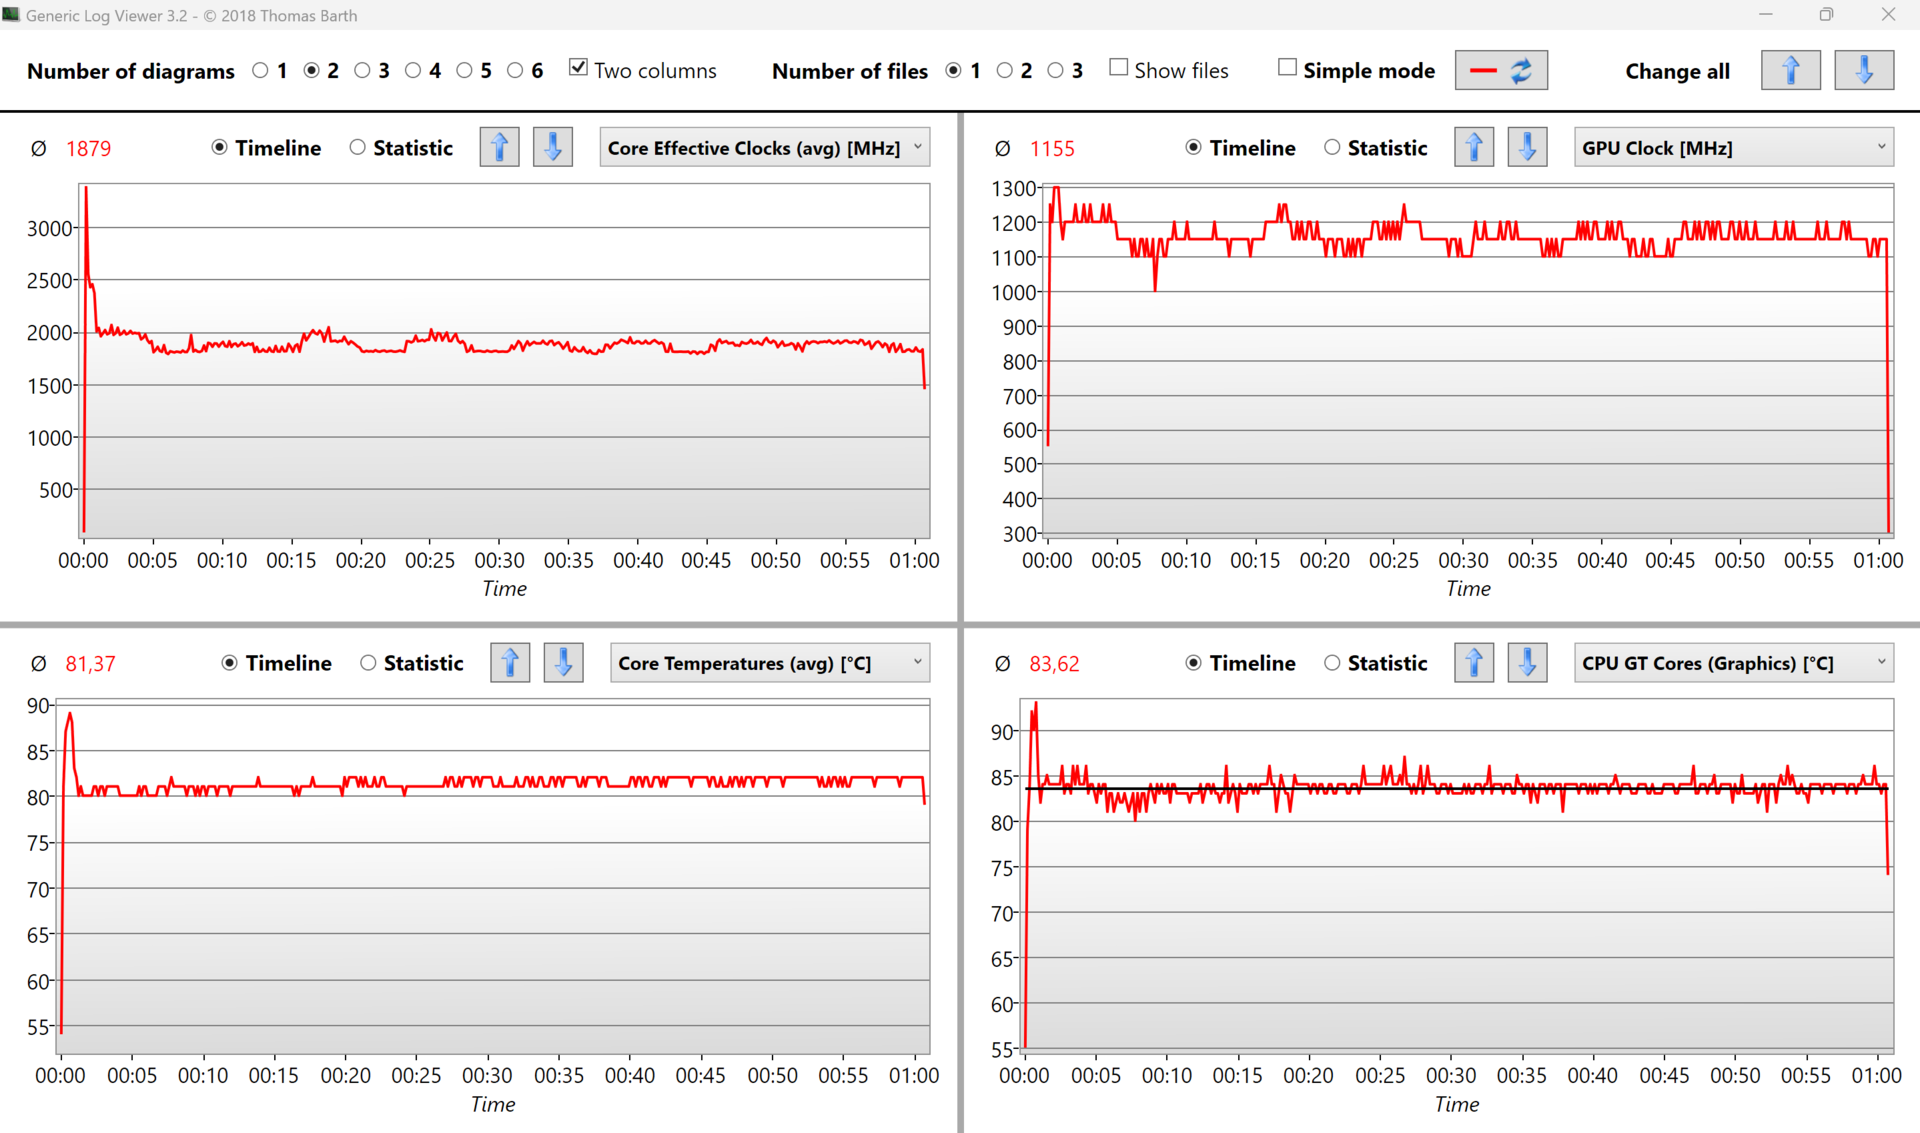
在压力测试(Prime95和Furmark)开始时,CPU的时钟频率短暂地达到3.5GHz,iGPU的时钟频率为1.3GHz。然而,之后时钟频率直接下降,因此CPU稳定在1.9GHz,iGPU稳定在1.2GHz。压力测试代表了一种极端情况,在这种情况下,我们检查系统是否能在全负荷下保持稳定。
发言人
对于一台Windows笔记本电脑来说,扬声器的表现很好:低音和低频甚至可以辨别。扬声器位于掌托下方,向下发射,利用表面作为反射器。例如,如果笔记本电脑放在织物或鼠标垫上,声音质量就会明显下降。
双阵列麦克风工作良好,记录的声音没有噪音,所以质量足以用于视频通话和会议。在录音过程中,可以听到来自键盘的打字噪音,但并不烦人。
Asus ZenBook 14X UX3404VC audio analysis
(+) | speakers can play relatively loud (86.4 dB)
Bass 100 - 315 Hz
(-) | nearly no bass - on average 16.3% lower than median
(-) | bass is not linear (15.8% delta to prev. frequency)
Mids 400 - 2000 Hz
(+) | balanced mids - only 1.2% away from median
(+) | mids are linear (3.1% delta to prev. frequency)
Highs 2 - 16 kHz
(+) | balanced highs - only 4.1% away from median
(+) | highs are linear (3.4% delta to prev. frequency)
Overall 100 - 16.000 Hz
(+) | overall sound is linear (11.3% difference to median)
Compared to same class
» 12% of all tested devices in this class were better, 2% similar, 86% worse
» The best had a delta of 5%, average was 18%, worst was 53%
Compared to all devices tested
» 7% of all tested devices were better, 2% similar, 91% worse
» The best had a delta of 4%, average was 23%, worst was 134%
Apple MacBook Pro 16 2021 M1 Pro audio analysis
(+) | speakers can play relatively loud (84.7 dB)
Bass 100 - 315 Hz
(+) | good bass - only 3.8% away from median
(+) | bass is linear (5.2% delta to prev. frequency)
Mids 400 - 2000 Hz
(+) | balanced mids - only 1.3% away from median
(+) | mids are linear (2.1% delta to prev. frequency)
Highs 2 - 16 kHz
(+) | balanced highs - only 1.9% away from median
(+) | highs are linear (2.7% delta to prev. frequency)
Overall 100 - 16.000 Hz
(+) | overall sound is linear (4.6% difference to median)
Compared to same class
» 0% of all tested devices in this class were better, 0% similar, 100% worse
» The best had a delta of 5%, average was 17%, worst was 45%
Compared to all devices tested
» 0% of all tested devices were better, 0% similar, 100% worse
» The best had a delta of 4%, average was 23%, worst was 134%
能源管理
消耗功率
闲置时,新机型与AMD的前辈一样经济;最大闲置功耗略低于12瓦。这属于带有OLED显示屏的机型的范围,但在有更亮的图像内容时,瓦特消耗量会增加。
在使用Witcher 3 Ultra的最大游戏负荷下,我们测得的功耗略低于43瓦,比使用相同iGPU的可比戴尔XPS 13 Plus 9320 OLED 少6瓦。然而,Prime95和Furmark的压力测试表明,90瓦的电源太紧张了,因为我们在开始时短暂地测量了95瓦。尽管如此,这个阶段并没有持续很久,功耗稳定在65瓦,然后是45瓦,因此,较弱的电源不应该是一个太大的问题。尽管如此,前一个型号的100瓦电源在这里会是更好的选择。
| Off / Standby | |
| Idle | |
| Load |
|
Key:
min: | |
| Asus ZenBook 14X UX3404VC i9-13900H, Iris Xe G7 96EUs, Micron 2450 1TB MTFDKBA1T0TFK, OLED, 2880x1800, 14.5" | Apple MacBook Pro 13 2022 M2 M2, M2 10-Core GPU, Apple SSD AP1024Z, IPS, 2560x1600, 13.3" | Lenovo Slim Pro 7 14ARP8 R7 7735HS, GeForce RTX 3050 6GB Laptop GPU, SK hynix PC801 HFS512GEJ9X115N, IPS, 2560x1600, 14.5" | Asus ROG Flow Z13 GZ301V i9-13900H, GeForce RTX 4060 Laptop GPU, WD PC SN740 SDDPTQD-1T00, IPS, 2560x1600, 13.4" | Dell XPS 13 Plus 9320 i7-1280P OLED i7-1280P, Iris Xe G7 96EUs, WDC PC SN810 512GB, OLED, 3456x2160, 13.4" | Dell Inspiron 14 Plus 7420 i7-12700H, GeForce RTX 3050 4GB Laptop GPU, SK Hynix BC711 512GB HFM512GD3GX013N, IPS, 2240x1400, 14" | LG Gram 14Z90Q i5-1240P, Iris Xe G7 80EUs, Samsung PM9A1 MZVL2512HCJQ, IPS, 1920x1200, 14" | Average Intel Iris Xe Graphics G7 96EUs | Average of class Subnotebook | |
|---|---|---|---|---|---|---|---|---|---|
| Power Consumption | 33% | -56% | -65% | -7% | -72% | 20% | 3% | 23% | |
| Idle Minimum * (Watt) | 6 | 1.77 70% | 7.6 -27% | 8.5 -42% | 6.5 -8% | 6.3 -5% | 3 50% | 5.51 ? 8% | 3.76 ? 37% |
| Idle Average * (Watt) | 7 | 6.7 4% | 12.2 -74% | 12.4 -77% | 7.8 -11% | 10.3 -47% | 6 14% | 8.66 ? -24% | 6.54 ? 7% |
| Idle Maximum * (Watt) | 11.8 | 6.9 42% | 12.8 -8% | 13.3 -13% | 13 -10% | 20 -69% | 12 -2% | 10.9 ? 8% | 7.89 ? 33% |
| Load Average * (Watt) | 44 | 30.9 30% | 76.5 -74% | 93 -111% | 56.6 -29% | 106.2 -141% | 40 9% | 45.6 ? -4% | 42 ? 5% |
| Witcher 3 ultra * (Watt) | 42.6 | 38.9 9% | 89.5 -110% | 87.8 -106% | 49.2 -15% | 96.1 -126% | 36.5 14% | ||
| Load Maximum * (Watt) | 95 | 56 41% | 135.7 -43% | 135 -42% | 63 34% | 136.5 -44% | 63 34% | 67.8 ? 29% | 64.8 ? 32% |
* ... smaller is better
Power consumption Witcher 3 / Stress test
Power consumption with an external monitor
许可证有效期
考虑到高端英特尔酷睿i9处理器,华硕ZenBook 14X的电池寿命确实很强。在我们的WLAN测试中,这台14英寸的电脑取得了正好10小时的运行时间。这项测试使用一个脚本来测量访问网站时的负载。
Apple MacBook Pro 13 2022 M2 ,联想Slim Pro 7 14ARP8 和LG Gram 14Z90Q 在我们的基准测试表中表现更好,但它们没有OLED显示屏。与采用OLED显示屏的戴尔XPS 13 Plus 9320 相比,ZenBook强大的电池性能明显明显,因为戴尔机型只能维持5:30小时左右。
| Asus ZenBook 14X UX3404VC i9-13900H, Iris Xe G7 96EUs, 70 Wh | Apple MacBook Pro 13 2022 M2 M2, M2 10-Core GPU, 58.2 Wh | Dell XPS 13 Plus 9320 i7-1280P OLED i7-1280P, Iris Xe G7 96EUs, 55 Wh | Lenovo Slim Pro 7 14ARP8 R7 7735HS, GeForce RTX 3050 6GB Laptop GPU, 73 Wh | LG Gram 14Z90Q i5-1240P, Iris Xe G7 80EUs, 72 Wh | Dell Inspiron 14 Plus 7420 i7-12700H, GeForce RTX 3050 4GB Laptop GPU, 64 Wh | Asus ROG Flow Z13 GZ301V i9-13900H, GeForce RTX 4060 Laptop GPU, 56 Wh | Average of class Subnotebook | |
|---|---|---|---|---|---|---|---|---|
| Battery runtime | 91% | -42% | 5% | 49% | -36% | -46% | 40% | |
| Reader / Idle (h) | 17.6 | 28.9 64% | 11.9 -32% | 28.6 ? 63% | ||||
| WiFi v1.3 (h) | 10 | 19.1 91% | 5.8 -42% | 10.5 5% | 11.9 19% | 7.2 -28% | 5 -50% | 14 ? 40% |
| Load (h) | 1.7 | 2.8 65% | 0.9 -47% | 1 -41% | 1.969 ? 16% | |||
| H.264 (h) | 19.2 | 4.7 | 15.4 ? | |||||
| Witcher 3 ultra (h) | 0.8 |
Pros
Cons
结论--新的处理器无法完全展开其翅膀
ZenBook 14X总体上是一款非常扎实的笔记本电脑,只是处理器的性能有些令人失望,这让人感到失望。它肯定会受益于一个额外的风扇,如去年的模型。 去年的型号。另一方面,120赫兹OLED显示屏、快速响应时间和高于平均水平的电池寿命是非常积极的一点。尽管安装了英特尔酷睿i9-13900H,我们在WLAN测试中测得的时间正好是10小时。显示屏的DeltaE值低于3,因此这款笔记本适用于照片和视频编辑。
铝制机箱的质量也很好,确保了高于平均水平的稳定性,这在打字时也很明显。各种各样的端口是坚实的,但由于省略了microSD读卡器,所以不如前代产品。端口的位置也不是很理想。
华硕新的ZenBook 14X是一个强大的全能型产品,具有非常好的电池寿命,出色的OLED显示屏和坚实的性能。
风扇噪音适中,由于MyAsus应用程序中的静音 模式选项,该设备在正常的办公任务中基本上听不到声音。
与前代产品相比,基本配置的价格在AMD版本和英特尔版本中都有所增加。我们评测的版本,没有专用显卡,价格为1699欧元(约合1850美元)。如果你想要NvidiaGeForce RTX 3050,你将不得不额外支付400欧元(440美元)。
如果OLED显示屏在笔记本的选择中并不占主要地位,还有两款更便宜的14英寸设备,分别是 联想Slim Pro 7 14ARP8和 戴尔Inspiron 14 Plus 7420、由于联想的AMD Radeon 680M或戴尔的RTX 3050,它们提供了更好的图形性能。
价格和可用性
在美国,华硕Zenbook 14X UX3404的基本配置在华硕的网店上售价为 1,799.00美元.
Asus ZenBook 14X UX3404VC
- 06/01/2023 v7 (old)
Philip Macdonald
Transparency
The selection of devices to be reviewed is made by our editorial team. The test sample was provided to the author as a loan by the manufacturer or retailer for the purpose of this review. The lender had no influence on this review, nor did the manufacturer receive a copy of this review before publication. There was no obligation to publish this review. As an independent media company, Notebookcheck is not subjected to the authority of manufacturers, retailers or publishers.
This is how Notebookcheck is testing
Every year, Notebookcheck independently reviews hundreds of laptops and smartphones using standardized procedures to ensure that all results are comparable. We have continuously developed our test methods for around 20 years and set industry standards in the process. In our test labs, high-quality measuring equipment is utilized by experienced technicians and editors. These tests involve a multi-stage validation process. Our complex rating system is based on hundreds of well-founded measurements and benchmarks, which maintains objectivity. Further information on our test methods can be found here.
Price comparison

