


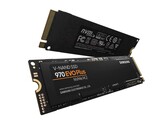
三星970 Evo Plus SSD (NVMe, M.2) 评测
自970 Evo发布以来已经过去了大约一年,而三星现在已经发布了其SSD家族中最新的970 Evo。三星承诺,由于其改进的V5 NAND和控制器优化,该SSD的速度提高了53%。继续阅读本文以了解三星的承诺是否符合Evo 970 Plus在我们的基准测试中的表现。
Intel Core i5-6300HQ, NVIDIA GeForce GTX 1060 Mobile, 13"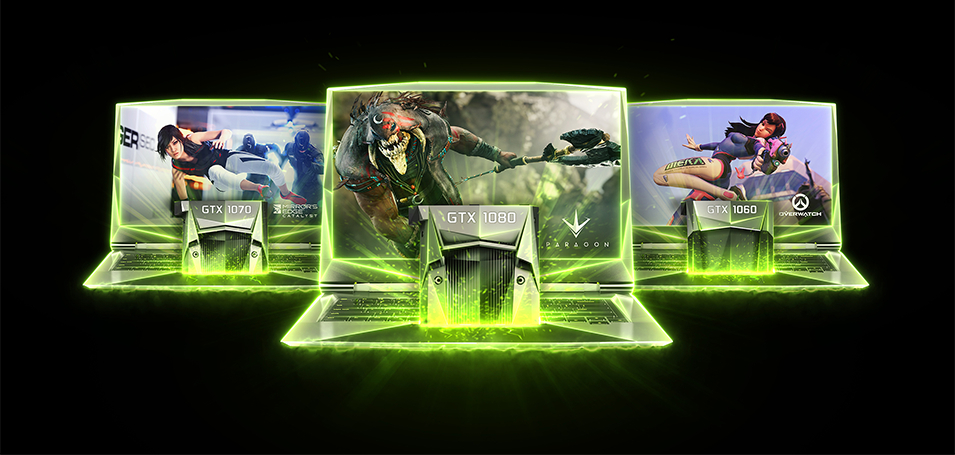
移动版英伟达GeForce GTX 1060是一块高端笔记本电脑显卡。它基于帕斯卡架构采用16纳米FinFET技术在台积电制造。这块显卡采用了较小的GP106芯片。相比于GTX 1060桌面版,笔记本电脑版本提供相同数量的着色器,但采用稍低的时钟频率。它的TDP比前代GTX 970M略低。
移动版GTX 1060的性能低于标准版GTX 1060桌面式显卡几个百分点。搭配6 GB GDDR5的桌面版GeForce GTX 1060 Founder's Edition的详尽评测可以在这里找到。
GeForce GTX 1000 Series
| ||||||||||||||||||||||||||||||||||||||||||||||||||||||||||||||||
| Codename | N17E-G1 | |||||||||||||||||||||||||||||||||||||||||||||||||||||||||||||||
| Architecture | Pascal | |||||||||||||||||||||||||||||||||||||||||||||||||||||||||||||||
| Pipelines | 1280 - unified | |||||||||||||||||||||||||||||||||||||||||||||||||||||||||||||||
| TMUs | 80 | |||||||||||||||||||||||||||||||||||||||||||||||||||||||||||||||
| ROPs | 48 | |||||||||||||||||||||||||||||||||||||||||||||||||||||||||||||||
| Core Speed | 1404 - 1670 (Boost) MHz | |||||||||||||||||||||||||||||||||||||||||||||||||||||||||||||||
| Memory Speed | 8000 effective = 2002 MHz | |||||||||||||||||||||||||||||||||||||||||||||||||||||||||||||||
| Memory Bus Width | 192 Bit | |||||||||||||||||||||||||||||||||||||||||||||||||||||||||||||||
| Memory Type | GDDR5 | |||||||||||||||||||||||||||||||||||||||||||||||||||||||||||||||
| Max. Amount of Memory | 6 GB | |||||||||||||||||||||||||||||||||||||||||||||||||||||||||||||||
| Shared Memory | no | |||||||||||||||||||||||||||||||||||||||||||||||||||||||||||||||
| Memory Bandwidth | 192 GB/s | |||||||||||||||||||||||||||||||||||||||||||||||||||||||||||||||
| API | DirectX 12_1, OpenGL 4.5 | |||||||||||||||||||||||||||||||||||||||||||||||||||||||||||||||
| Power Consumption | 80 Watt | |||||||||||||||||||||||||||||||||||||||||||||||||||||||||||||||
| Transistor Count | 4.4 Billion | |||||||||||||||||||||||||||||||||||||||||||||||||||||||||||||||
| Man. Technology | 16 nm | |||||||||||||||||||||||||||||||||||||||||||||||||||||||||||||||
| PCIe | 3.0 | |||||||||||||||||||||||||||||||||||||||||||||||||||||||||||||||
| Features | Multi-Projection, VR Ready, G-SYNC, Vulkan, Multi Monitor | |||||||||||||||||||||||||||||||||||||||||||||||||||||||||||||||
| Notebook Size | large | |||||||||||||||||||||||||||||||||||||||||||||||||||||||||||||||
| Date of Announcement | 18.08.2016 | |||||||||||||||||||||||||||||||||||||||||||||||||||||||||||||||
| Link to Manufacturer Page | www.nvidia.de | |||||||||||||||||||||||||||||||||||||||||||||||||||||||||||||||
The following benchmarks stem from our benchmarks of review laptops. The performance depends on the used graphics memory, clock rate, processor, system settings, drivers, and operating systems. So the results don't have to be representative for all laptops with this GPU. For detailed information on the benchmark results, click on the fps number.


For more games that might be playable and a list of all games and graphics cards visit our Gaming List
Schenker XMG A517: Intel Core i7-7700HQ, 15.60", 2.4 kg
Review » Schenker Technologies XMG A517 (Clevo N850HP6) 笔记本电脑简短评测
Acer Aspire V17 Nitro BE VN7-793-738J: Intel Core i7-7700HQ, 17.30", 3.1 kg
Review » 宏碁 Aspire V17 Nitro BE (7700HQ, GTX 1060, 4k) 笔记本电脑简短评测
MSI GS73VR 7RF: Intel Core i7-7700HQ, 17.30", 2.4 kg
Review » 微星 GS73VR 7RF (7700HQ, GTX 1060, 4K) 笔记本电脑简短评测
Acer Aspire V17 Nitro BE VN7-793G-52XN: Intel Core i5-7300HQ, 17.30", 3.1 kg
Review » 宏碁 Aspire V17 Nitro BE VN7-793G (7300HQ, GTX 1060, 全高清, 眼球追踪) 笔记本电脑简短评测
Aorus x3 Plus v7: Intel Core i7-7820HK, 13.90", 1.8 kg
Review » Aorus X3 Plus v7 (i7-7820HK, GTX 1060) Xotic PC Edition 笔记本电脑简短评测
Lenovo Legion Y720 80VR002XGE: Intel Core i7-7700HQ, 15.60", 3.1 kg
Review » 联想 Legion Y720 (7700HQ,全高清, GTX 1060) 笔记本电脑简短评测
Gigabyte Aero 15: Intel Core i7-7700HQ, 15.60", 2.1 kg
Review » 技嘉 Aero 15 (7700HQ, GTX 1060, 全高清) 笔记本电脑简短评测
Razer Blade (2017): Intel Core i7-7700HQ, 14.00", 1.8 kg
Review » 雷蛇 Blade 2017 (GTX 1060, 7700HQ, 全高清) 笔记本电脑简短评测
Gigabyte Aero 14: Intel Core i7-7700HQ, 14.00", 1.9 kg
Review » 技嘉 Aero 14 (7700HQ, GTX 1060) 笔记本电脑简短评测
MSI GS63VR 7RF-228US: Intel Core i7-7700HQ, 15.60", 1.9 kg
Review » 微星 GS63VR 7RF (7700HQ, 4K超高清, GTX 1060) 笔记本电脑简短评测
Acer Aspire VN7-593G-73HP V15 Nitro BE: Intel Core i7-7700HQ, 15.60", 2.5 kg
Review » 宏碁 Aspire V15 Nitro BE VN7-593G (7700HQ, GTX 1060) 笔记本电脑简短评测
Gigabyte P55W v7: Intel Core i7-7700HQ, 15.60", 2.6 kg
Review » 技嘉 P55W v7 笔记本简短评测
Asus FX502VM-AS73: Intel Core i7-7700HQ, 15.60", 2.6 kg
Review » 华硕 FX502VM-AS73 笔记本电脑简短评测
Alienware 13 R3: Intel Core i7-7700HQ, 13.30", 2.5 kg
Review » Alienware 13 R3 笔记本电脑简短评测
Asus Strix GL502VM-DS74: Intel Core i7-7700HQ, 15.60", 2.5 kg
Review » 华硕 Strix GL502VM-DS74 Xotic PC Edition 笔记本电脑简短评测
Gigabyte P55W v6: Intel Core i7-6700HQ, 15.60", 2.7 kg
Review » 技嘉 P55W v6 笔记本电脑简短评测
HP Omen 17-w100ng: Intel Core i5-6300HQ, 17.30", 3.2 kg
Review » 惠普 Omen 17 (GTX 1060) 笔记本电脑简短评测
Acer Aspire V17 Nitro BE VN7-793G-706L: Intel Core i7-7700HQ, 17.30", 3.1 kg
Review » 宏碁 Aspire V17 Nitro BE VN7-793G 笔记本电脑 (GTX 1060 黑色版) 简短评测
MSI GE72VR-6RF16H21: Intel Core i7-6700HQ, 17.30", 3 kg
Review » 微星 GE72VR 6RF Apache Pro 笔记本电脑简短评测
Razer Blade (2016) FHD: Intel Core i7-6700HQ, 14.00", 1.9 kg
Review » 雷蛇 灵刃(2016) FHD 笔记本电脑简短评测
Asus Strix GL502VM-FY039T: Intel Core i7-6700HQ, 15.60", 2.5 kg
Review » 华硕 ROG Strix GL502VM 笔记本电脑简短评测
Asus GL702VM-GC102D: Intel Core i7-6700HQ, 17.30", 2.7 kg
Review » 华硕 GL702VM-GC102D 笔记本电脑简短评测
Razer Blade (2016): Intel Core i7-6700HQ, 14.00", 2 kg
Review » 雷蛇 Blade (2016) 笔记本电脑简短评测
MSI GS63VR-6RF16H22 Stealth Pro: Intel Core i7-6700HQ, 15.60", 1.9 kg
Review » 微星 GS63VR 6RF Stealth Pro 笔记本电脑简短评测
MSI GT72VR 6RD-063US: Intel Core i7-6700HQ, 17.30", 3.8 kg
Review » 微星 GT72VR 6RD Dominator Pro 笔记本电脑简短评测
MSI GE62VR 6RF-001US: Intel Core i7-6700HQ, 15.60", 2.5 kg
Review » 微星 GE62VR 6RF Apache Xotic PC版 笔记本电脑简短评测
MSI GS43VR 6RE-006US: Intel Core i7-6700HQ, 14.00", 1.9 kg
Review » 微星 GS43VR 6RE Phantom Pro 笔记本电脑简短评测
Schenker XMG P507: Intel Core i7-6700HQ, 15.60", 2.8 kg
Review » Schenker XMG P507 (Clevo P651RP6-G) 笔记本电脑简短评测
MSI GS73VR 6RF: Intel Core i7-6700HQ, 17.30", 2.4 kg
Review » 微星 GS73VR 6RF 笔记本电脑简短评测
MSI GS73VR 7RF-217BE: Intel Core i7-7700HQ, 17.30", 2.5 kg
External Review » MSI GS73VR 7RF-217BE
Asus TUF FX504GM-EN479: Intel Core i7-8750H, 15.60", 2.2 kg
External Review » Asus TUF FX504GM-EN479
Asus ROG Strix HERO II GL504GM-ES237T: Intel Core i7-8750H, 15.60", 2.4 kg
External Review » Asus ROG Strix HERO II GL504GM-ES237T
HP Omen 17-an102nd: Intel Core i7-8750H, 15.60", 3.8 kg
External Review » HP Omen 17-an102nd
MSI GS63 Stealth 8RE-063XES: Intel Core i7-8750H, 15.60", 1.8 kg
External Review » MSI GS63 Stealth 8RE-063XES
Asus TUF FX505GM-BQ189T: Intel Core i7-8750H, 15.60", 2.2 kg
External Review » Asus TUF FX505GM-BQ189T
Asus ROG Strix Hero II GL504GM-ES157T: Intel Core i7-8750H, 15.60", 2.4 kg
External Review » Asus ROG Strix Hero II GL504GM-ES157T
Asus TUF FX705GM-EV020: Intel Core i7-8750H, 17.30", 2.6 kg
External Review » Asus TUF FX705GM-EV020
HP OMEN 15-dc0012ns: Intel Core i7-8750H, 15.60", 2.5 kg
External Review » HP OMEN 15-dc0012ns
MSI GF62 8RE-041NL: Intel Core i7-8750H, 15.60", 2.2 kg
External Review » MSI GF62 8RE-041NL
Asus TUF FX504GM-EN480: Intel Core i7-8750H, 15.60", 2.3 kg
External Review » Asus TUF FX504GM-EN480
Lenovo Legion Y530-15ICH-81LB007CSP: Intel Core i7-8750H, 15.60", 2.3 kg
External Review » Lenovo Legion Y530-15ICH-81LB007CSP
Asus ROG Strix SCAR II GL504GM-ES363T: Intel Core i7-8750H, 15.60", 2.4 kg
External Review » Asus ROG Strix SCAR II GL504GM-ES363T
Asus TUF FX565GM-ES277T: Intel Core i7-8750H, 15.60", 2.3 kg
External Review » Asus TUF FX565GM-ES277T
HP Pavilion 15-cx0025nf: Intel Core i5-8300H, 15.60", 2.4 kg
External Review » HP Pavilion 15-cx0025nf
MSI GP73 Leopard 8RE-658XES: Intel Core i7-8750H, 17.30", 2.7 kg
External Review » MSI GP73 Leopard 8RE-658XES
BTO Notebooks X-Book 17CL875: Intel Core i7-8750H, 17.30", 3 kg
External Review » BTO Notebooks X-Book 17CL875
HP Pavilion 15-cx0510nd: Intel Core i7-8750H, 15.60", 2.4 kg
External Review » HP Pavilion 15-cx0510nd
Asus ROG Strix Scar II GL504GM-ES040T: Intel Core i7-8750H, 15.60", 2.4 kg
External Review » Asus ROG Strix Scar II GL504GM-ES040T
Asus TUF FX705GM-BI7N5: Intel Core i7-8750H, 17.30", 2.8 kg
External Review » Asus TUF FX705GM-BI7N5
Lenovo Legion Y7000P-1060: Intel Core i7-8750H, 15.60", 2.4 kg
External Review » Lenovo Legion Y7000P-1060
Asus TUF FX505GM-ES011T: Intel Core i7-8750H, 15.60", 2.3 kg
External Review » Asus TUF FX505GM-ES011T
Gigabyte Sabre 15-K v8: Intel Core i7-8750H, 15.60", 2.5 kg
External Review » Gigabyte Sabre 15-K v8
Asus ROG Strix GL504GM-ES158T: Intel Core i7-8750H, 15.60", 2.4 kg
External Review » Asus ROG Strix GL504GM-ES158T
Asus Strix GL504GM-ES157T: Intel Core i7-8750H, 15.60", 2.4 kg
External Review » Asus Strix GL504GM-ES157T
Asus Zephyrus S GX531GM-ES037T: Intel Core i7-8750H, 15.60", 2.1 kg
External Review » Asus Zephyrus S GX531GM-ES037T
Medion Erazer X6807-i7-512F16: Intel Core i7-8750H, 15.60", 2 kg
External Review » Medion Erazer X6807-i7-512F16
MSI GE63 8RE-021XES: Intel Core i7-8750H, 15.60", 2.4 kg
External Review » MSI GE63 8RE-021XES
HP Omen 15-dc0024nl: Intel Core i7-8750H, 15.60", 2.5 kg
External Review » HP Omen 15-dc0024nl
Xiaomi Mi Gaming Laptop 8750H 1060: Intel Core i7-8750H, 15.60", 2.7 kg
External Review » Xiaomi Mi Gaming Laptop 8750H 1060
MSI GF72 8RE-062XES: Intel Core i7-8750H, 17.30", 2.8 kg
External Review » MSI GF72 8RE-062XES
Asus TUF FX705GM: Intel Core i7-8750H, 17.30", 2.8 kg
External Review » Asus TUF FX705GM
Asus TUF FX765GM-EV191T: Intel Core i7-8750H, 17.30", 2.7 kg
External Review » Asus TUF FX765GM-EV191T
Lenovo Legion Y530-15ICH: Intel Core i7-8750H, 15.60", 2.3 kg
External Review » Lenovo Legion Y530-15ICH
Lenovo Legion Y530-15ICH-81LB0033GE: Intel Core i7-8750H, 15.60", 2.3 kg
External Review » Lenovo Legion Y530-15ICH-81LB0033GE
Asus ROG Strix Scar II GL704GM-EV027T: Intel Core i7-8750H, 17.30", 2.9 kg
External Review » Asus ROG Strix Scar II GL704GM-EV027T
Asus TUF FX705GM-EW163T: Intel Core i5-8300H, 17.30", 2.7 kg
External Review » Asus TUF FX705GM-EW163T
MSI P65 8RE-005ES: Intel Core i7-8750H, 15.60", 1.9 kg
External Review » MSI P65 8RE-005ES
MSI P65 8RE-006ES: Intel Core i7-8750H, 15.60", 1.9 kg
External Review » MSI P65 8RE-006ES
Acer Predator Helios 300 PH315-51-762W: Intel Core i7-8750H, 15.60", 2.7 kg
External Review » Acer Predator Helios 300 PH315-51-762W
Asus TUF FX504GM-EN003: Intel Core i5-8300H, 15.60", 2.3 kg
External Review » Asus TUF FX504GM-EN003
Asus ROG Strix GL504GM-ES070T: Intel Core i7-8750H, 15.60", 2.4 kg
External Review » Asus ROG Strix GL504GM-ES070T
Asus TUF FX505GM-ES088T: Intel Core i7-8750H, 15.60", 2.3 kg
External Review » Asus TUF FX505GM-ES088T
Acer Predator Helios 300 Special Edition PH315-51-78UA: Intel Core i7-8750H, 15.60", 2.7 kg
External Review » Acer Predator Helios 300 Special Edition PH315-51-78UA
Acer Predator Helios 300 PH315-51-78NP: Intel Core i7-8750H, 15.60", 2.7 kg
External Review » Acer Predator Helios 300 PH315-51-78NP
Acer Predator Helios 300 PH315-51-757A: Intel Core i7-8750H, 15.60", 2.7 kg
External Review » Acer Predator Helios 300 PH315-51-757A
Asus GL704GM-DH74: Intel Core i7-8750H, 17.30", 2.9 kg
External Review » Asus GL704GM-DH74
HP Omen 15-dc0029na: Intel Core i7-8750H, 15.60", 2.5 kg
External Review » HP Omen 15-dc0029na
Acer Predator Helios 300 PH315-51-76VB: Intel Core i7-8750H, 15.60", 2.7 kg
External Review » Acer Predator Helios 300 PH315-51-76VB
Acer Predator Helios 300 PH315-51-7581: Intel Core i7-8750H, 15.60", 2.7 kg
External Review » Acer Predator Helios 300 PH315-51-7581
MSI GE73 Raider 8RE-023XES: Intel Core i7-8750H, 17.30", 2.8 kg
External Review » MSI GE73 Raider 8RE-023XES
Medion Erazer X7851-MD60706: Intel Core i7-7700HQ, 17.30", 3.5 kg
External Review » Medion Erazer X7851-MD60706
Asus Strix Scar II GL704GM-DH74: Intel Core i7-8750H, 17.30", 3 kg
External Review » Asus Strix Scar II GL704GM-DH74
HP Omen 15-dc0096nd: Intel Core i7-8750H, 15.60", 2.5 kg
External Review » HP Omen 15-dc0096nd
MSI GE63 8RE-045NL: Intel Core i7-8750H, 15.60", 2.5 kg
External Review » MSI GE63 8RE-045NL
HP Omen 15-ce082ns: Intel Core i5-7300HQ, 15.60", 2.6 kg
External Review » HP Omen 15-ce082ns
MSI GS65 Stealth Thin 8RE-051US: Intel Core i7-8750H, 15.60", 1.8 kg
External Review » MSI GS65 Stealth Thin 8RE-051US
Acer Nitro 5 AN515-52-73Y8: Intel Core i7-8750H, 15.60", 2.7 kg
External Review » Acer Nitro 5 AN515-52-73Y8
Asus TUF FX504GM-E4326T: Intel Core i7-8750H, 15.60", 2.3 kg
External Review » Asus TUF FX504GM-E4326T
Asus Strix Scar II GL504GM-ES155T: Intel Core i7-8750H, 15.60", 2.4 kg
External Review » Asus Strix Scar II GL504GM-ES155T
HP Omen 15-ce083ns: Intel Core i7-7700HQ, 15.60", 2.6 kg
External Review » HP Omen 15-ce083ns
Asus TUF FX705GM-EW019T: Intel Core i7-8750H, 17.30", 2.8 kg
External Review » Asus TUF FX705GM-EW019T
Medion Erazer X6805-MD61085: Intel Core i7-8750H, 15.60", 2.5 kg
External Review » Medion Erazer X6805-MD61085
MSI GE62VR-7RF 651NE Camo Edition: Intel Core i7-7700HQ, 15.60", 2.4 kg
External Review » MSI GE62VR-7RF 651NE Camo Edition
HP Pavilion 15-cx0815no: Intel Core i7-8750H, 15.60", 2.4 kg
External Review » HP Pavilion 15-cx0815no
Asus ROG STRIX GL504GM-ES244T: Intel Core i5-8300H, 15.60", 2.4 kg
External Review » Asus ROG STRIX GL504GM-ES244T
MSI GE63 Raider 8RE-020ES: Intel Core i7-8750H, 15.60", 2.3 kg
External Review » MSI GE63 Raider 8RE-020ES
Acer Predator Helios 300 PH315-51-50Y7: Intel Core i5-8300H, 15.60", 2.7 kg
External Review » Acer Predator Helios 300 PH315-51-50Y7
Asus Strix GL504GM: Intel Core i7-8750H, 15.60", 2.5 kg
External Review » Asus Strix GL504GM
Acer Predator Helios 300 PH317-52-571B: Intel Core i5-8300H, 17.30", 3 kg
External Review » Acer Predator Helios 300 PH317-52-571B
Xiaomi Mi Notebook Pro GTX-G58725D6D/CN: Intel Core i7-8750H, 15.60", 2.7 kg
External Review » Xiaomi Mi Notebook Pro GTX-G58725D6D/CN
Acer Predator Helios 300 PH315-51-53MZ: Intel Core i5-8300H, 15.60", 2.7 kg
External Review » Acer Predator Helios 300 PH315-51-53MZ
Acer Aspire Nitro 5 AN515-52-5825: Intel Core i5-8300H, 15.60", 2.7 kg
External Review » Acer Aspire Nitro 5 AN515-52-5825
MSI GS63 Stealth 8RE-012XES: Intel Core i7-8750H, 15.60", 1.8 kg
External Review » MSI GS63 Stealth 8RE-012XES
MSI Stealth Pro GS63VR 7RF-634XES: Intel Core i7-7700HQ, 15.60", 1.8 kg
External Review » MSI Stealth Pro GS63VR 7RF-634XES
HP Omen 15-dc0980nd: Intel Core i7-8750H, 15.60", 2.5 kg
External Review » HP Omen 15-dc0980nd
BTO Notebooks X-Book 15CL875: Intel Core i7-8750H, 15.60", 2 kg
External Review » BTO Notebooks X-Book 15CL875
Acer Predator Helios 300 PH315-51-73C5: Intel Core i7-8750H, 15.60", 2.7 kg
External Review » Acer Predator Helios 300 PH315-51-73C5
Asus Zephyrus S GX531GM: Intel Core i7-8750H, 15.60", 2.1 kg
External Review » Asus GX531GM (Zephyrus S)
Gigabyte Sabre 17-W8: Intel Core i7-8750H, 17.30", 2.8 kg
External Review » Gigabyte Sabre 17-W8
Asus GL504GM-DS74 Strix Hero II: Intel Core i7-8750H, 15.60", 2.4 kg
External Review » Asus GL504GM-DS74 Strix Hero II
Acer Predator Helios 300 PH317-52-75L8: Intel Core i7-8750H, 17.30", 2.9 kg
External Review » Acer Predator Helios 300 PH317-52-75L8
Schenker XMG Neo 15: Intel Core i7-8750H, 15.60", 2 kg
External Review » Schenker XMG Neo 15
MSI GP73 Leopard 8RE-039XES: Intel Core i7-8750H, 17.30", 2.7 kg
External Review » MSI GP73 Leopard 8RE-039XES
HP Pavilion 15-cx0675nd: Intel Core i7-8750H, 15.60", 2.4 kg
External Review » HP Pavilion 15-cx0675nd
EVGA SC15: Intel Core i7-7700HQ, 15.60", 2.9 kg
External Review » EVGA SC15
Hyperbook Pulsar Z15: Intel Core i7-8750H, 15.60", 2 kg
External Review » Hyperbook Pulsar Z15
Asus Strix GL703GM-DS74: Intel Core i7-8750H, 17.30", 2.9 kg
External Review » Asus Strix GL703GM-DS74
Cyberpower Tracer III, i7-8750H, GTX 1060: Intel Core i7-8750H, 15.60"
External Review » Cyberpower Tracer III, i7-8750H, GTX 1060
Asus Rog Strix Scar Edition GL703GM-E5016: Intel Core i7-8750H, 17.30", 3 kg
External Review » Asus Rog Strix Scar Edition GL703GM-E5016
MSI GL62MVR 7RFX-1272XES: Intel Core i7-7700HQ, 15.60", 2.2 kg
External Review » MSI GL62MVR 7RFX-1272XES
MSI GP63 8RE-041XES: Intel Core i7-8750H, 15.60", 2.2 kg
External Review » MSI GP63 8RE-041XES
MSI GL72MVR 7RFX-864XES: Intel Core i7-7700HQ, 17.30", 2.7 kg
External Review » MSI GL72MVR 7RFX-864XES
MSI GV62 8RE-016US: Intel Core i5-8300H, 15.60", 2.2 kg
External Review » MSI GV62 8RE-016US
Xiaomi Mi Gaming Laptop 7700HQ 1060: Intel Core i7-7700HQ, 15.60", 2.7 kg
External Review » Xiaomi Mi Gaming Laptop 7700HQ 1060
MSI GP63 Leopard 8RE-013US: Intel Core i7-8750H, 15.60", 2.3 kg
External Review » MSI GP63 Leopard 8RE-013US
Xiaomi Mi Gaming Laptop 7300HQ 1060: Intel Core i5-7300HQ, 15.60", 2.7 kg
External Review » Xiaomi Mi Gaming Laptop 7300HQ 1060
Asus ROG GU501GM-BI7N8: Intel Core i7-8750H, 15.60", 2.5 kg
External Review » Asus ROG GU501GM-BI7N8
MSI GE63 8RE-222DE: Intel Core i7-8750H, 15.60", 2.5 kg
External Review » MSI GE63 8RE-222DE
MSI GL62MVR 7RFX-1271XES: Intel Core i5-7300HQ, 15.60", 2.2 kg
External Review » MSI GL62MVR 7RFX-1271XES
Acer Predator Helios 300 PH315-51-78TP: Intel Core i7-8750H, 15.60", 2.7 kg
External Review » Acer Predator Helios 300 PH315-51-78TP
Gigabyte Aero 15W v8-DE025PB: Intel Core i7-8750H, 15.60", 2 kg
External Review » Gigabyte Aero 15W v8-DE025PB
HP OMEN 15-ce006ns: Intel Core i7-7700HQ, 15.60", 2.6 kg
External Review » HP OMEN 15-ce006ns
HP Omen 15-cn018ns: Intel Core i7-7700HQ, 15.60", 2.6 kg
External Review » HP Omen 15-cn018ns
Asus GL503VM-GZ098T Strix Hero Edition: Intel Core i7-7700HQ, 15.60", 2.6 kg
External Review » Asus GL503VM-GZ098T Strix Hero Edition
Razer Blade (2017) UHD: Intel Core i7-7700HQ, 14.00", 1.9 kg
External Review » Razer Blade (2017) UHD
Asus FX503VM-EH73: Intel Core i7-7700HQ, 15.60", 2.2 kg
External Review » Asus FX503VM-EH73
MSI GS65 8RE-079 Stealth Thin: Intel Core i7-8750H, 15.60", 1.8 kg
External Review » MSI GS65 8RE-079 Stealth Thin
Acer Predator Helios 300 G3-572-74QP: Intel Core i7-7700HQ, 15.60", 2.7 kg
External Review » Acer Predator Helios 300 G3-572-74QP
MSI GF62VR 7RF-1013NL: Intel Core i7-7700HQ, 15.60", 2.2 kg
External Review » MSI GF62VR 7RF-1013NL
Asus GL503VM-ED091T Strix Scar Edition: Intel Core i7-7700HQ, 15.60", 2.5 kg
External Review » Asus GL503VM-ED091T Strix Scar Edition
Asus Strix GL503VM-GZ128T Hero Edition: Intel Core i5-7300HQ, 15.60", 2.5 kg
External Review » Asus Strix GL503VM-GZ128T Hero Edition
Asus Strix GL703VM-DB74: Intel Core i7-7700HQ, 17.30", 2.7 kg
External Review » Asus Strix GL703VM-DB74
MSI GP62MVR 7RF-451DE: Intel Core i5-7300HQ, 15.60", 2.2 kg
External Review » MSI GP62MVR 7RF-451DE
Acer Predator Helios 300 G3-572-77XZ: Intel Core i7-7700HQ, 15.60", 2.7 kg
External Review » Acer Predator Helios 300 G3-572-77XZ
Lenovo Legion Y720-15IKB-80VR002MFR: Intel Core i7-7700HQ, 15.60", 3.1 kg
External Review » Lenovo Legion Y720-15IKB-80VR002MFR
Gigabyte Sabre 17W-DE022T: Intel Core i7-7700HQ, 17.30", 2.5 kg
External Review » Gigabyte Sabre 17W-DE022T
MSI GP62MVR 7RFX-1227XES: Intel Core i5-7300HQ, 15.60", 2.2 kg
External Review » MSI GP62MVR 7RFX-1227XES
MSI GE62VR 7RF-298NL Apache Pro: Intel Core i7-7700HQ, 15.60", 2.4 kg
External Review » MSI GE62VR 7RF-298NL Apache Pro
Lenovo Legion Y720-15IKB-80VR007USP: Intel Core i7-7700HQ, 15.60", 3.2 kg
External Review » Lenovo Legion Y720-15IKB-80VR007USP
Schenker Key 15: Intel Core i7-7700HQ, 15.60", 2.2 kg
External Review » Schenker Key 15
Microsoft Surface Book 2 15: Intel Core i7-8650U, 15.00", 1.9 kg
External Review » Microsoft Surface Book 2 15
MSI GE62VR 7RF-652 Camo Squad Limited Edition: Intel Core i7-7700HQ, 15.60", 2.4 kg
External Review » MSI GE62VR 7RF-652 Camo Squad Limited Edition
HP Omen 15-CE007NT: Intel Core i7-7700HQ, 15.60", 2.6 kg
External Review » HP Omen 15-CE007NT
Lenovo Legion Y720-80VR001YMX: Intel Core i5-7300HQ, 15.60", 3.2 kg
External Review » Lenovo Legion Y720-80VR001YMX
Acer Predator Helios 300 G3-572-763V: Intel Core i7-7700HQ, 15.60", 2.7 kg
External Review » Acer Predator Helios 300 G3-572-763V
HP OMEN 15-ce002ns: Intel Core i7-7700HQ, 15.60", 2.6 kg
External Review » HP OMEN 15-ce002ns
MSI GT72VR 7RD-441BE: Intel Core i7-7700HQ, 17.30", 3.8 kg
External Review » MSI GT72VR 7RD-441BE
Acer Predator Helios 300 G3-572-56FD: Intel Core i5-7300HQ, 15.60", 2.7 kg
External Review » Acer Predator Helios 300 G3-572-56FD
Acer Aspire 7 A717-71G-72VY: Intel Core i7-7700HQ, 17.30", 2.9 kg
External Review » Acer Aspire 7 A717-71G-72VY
Acer Aspire V17 Nitro BE VN7-793-738J: Intel Core i7-7700HQ, 17.30", 3.1 kg
External Review » Acer Aspire V17 Nitro BE VN7-793-738J
HP Omen 17-w105nf: Intel Core i7-6700HQ, 17.30", 4.4 kg
External Review » HP Omen 17-w105nf
Gigabyte Aero 15W-CF2 : Intel Core i7-7700HQ, 15.60", 2.1 kg
External Review » Gigabyte Aero 15W-CF2
Asus Strix GL503VM-DB74 Hero Edition: Intel Core i7-7700HQ, 15.60", 2.5 kg
External Review » Asus Strix GL503VM-DB74 Hero Edition
MSI GE63VR 7RE-093XES Raider: Intel Core i7-7700HQ, 15.60", 2.4 kg
External Review » MSI GE63VR 7RE-093XES Raider
MSI GS63VR 7RG-229: Intel Core i7-7700HQ, 15.60", 1.9 kg
External Review » MSI GS63VR 7RG-229
Asus Strix Scar Edition GL703VM-EE129T: Intel Core i7-7700HQ, 17.30", 3 kg
External Review » Asus Strix Scar Edition GL703VM-EE129T
Asus Strix GL702VM-BA323T: Intel Core i7-7700HQ, 17.30", 2.7 kg
External Review » Asus Strix GL702VM-BA323T
Medion Erazer X7847-MD60477: Intel Core i5-6300HQ, 17.30", 2.5 kg
External Review » Medion Erazer X7847-MD60477
MSI GL72VR 7RF-632XES: Intel Core i7-7700HQ, 17.30", 2.7 kg
External Review » MSI GL72VR 7RF-632XES
MSI GL62MVR 7RFX-1046XES: Intel Core i7-7700HQ, 15.60", 2.7 kg
External Review » MSI GL62MVR 7RFX-1046XES
Acer Predator Helios 300 PH317-51-71FF: Intel Core i7-7700HQ, 17.30", 3 kg
External Review » Acer Predator Helios 300 PH317-51-71FF
HP Omen 15-ce087tx: Intel Core i7-7700HQ, 15.60", 2.6 kg
External Review » HP Omen 15-ce087tx
Razer Blade Pro RZ09-0220: Intel Core i7-7700HQ, 17.30", 3.1 kg
External Review » Razer Blade Pro RZ09-0220
Acer Aspire 7 A717-71G-721V: Intel Core i7-7700HQ, 17.30", 2.9 kg
External Review » Acer Aspire 7 A717-71G-721V
Asus GL502VM-FY377T: Intel Core i7-7700HQ, 15.60", 2.2 kg
External Review » Asus GL502VM-FY377T
MSI GS63VR 6RF-023NL Stealth Pro: Intel Core i7-6700HQ, 15.60", 1.8 kg
External Review » MSI GS63VR 6RF-023NL Stealth Pro
MSI GE73VR 7RE-203XES Raider : Intel Core i7-7700HQ, 17.30", 2.8 kg
External Review » MSI GE73VR 7RE-203XES Raider
Gigabyte SabrePro 15W-KB3: Intel Core i7-7700HQ, 15.60", 2.5 kg
External Review » Gigabyte SabrePro 15W-KB3
Hyperbook SL950VR : Intel Core i7-7700HQ, 15.60", 1.9 kg
External Review » Hyperbook SL950VR
HP OMEN 15-ce099nf: Intel Core i7-7700HQ, 15.60", 2.6 kg
External Review » HP OMEN 15-ce099nf
Asus Strix GL502VMK: Intel Core i7-7700HQ, 15.60", 2.2 kg
External Review » Asus Strix GL502VMK
Gigabyte SabrePro 15W-DE022T: Intel Core i7-7700HQ, 15.60", 2.5 kg
External Review » Gigabyte SabrePro 15W-DE022T
Lenovo Legion Y720-80VR002HUS: Intel Core i7-7700HQ, 15.60", 3.1 kg
External Review » Lenovo Legion Y720-80VR002HUS
MSI GE63VR 7RE Raider-036: Intel Core i7-7700HQ, 15.60", 2.3 kg
External Review » MSI GE63VR 7RE Raider-036
Acer Predator Helios 300 PH317-51-78SZ: Intel Core i7-7700HQ, 17.30", 3 kg
External Review » Acer Predator Helios 300 PH317-51-78SZ
MSI GP62MVR 7RF-400DE Leopard Pro: Intel Core i7-7700HQ, 15.60", 2.2 kg
External Review » MSI GP62MVR 7RF-400DE Leopard Pro
MSI GS43VR 7RE-203XES: Intel Core i7-7700HQ, 14.00", 1.8 kg
External Review » MSI GS43VR 7RE-203XES
Schenker XMG A517: Intel Core i7-7700HQ, 15.60", 2.4 kg
External Review » Schenker XMG A517
HP Omen 15-ce002no: Intel Core i7-7700HQ, 15.60", 2.6 kg
External Review » HP Omen 15-ce002no
Acer Predator Helios 300 PH317-51-720W: Intel Core i7-7700HQ, 17.30", 3 kg
External Review » Acer Predator Helios 300 PH317-51-720W
Asus G752VM-GC005T: Intel Core i7-6700HQ, 17.30", 4.1 kg
External Review » Asus G752VM-GC005T
Lenovo R720-15IKB: Intel Core i7-7700HQ, 15.60", 2.4 kg
External Review » Lenovo R720-15IKB
HP Omen 17-w202ng: Intel Core i7-7700HQ, 17.30", 3.4 kg
External Review » HP Omen 17-w202ng
Asus FX502VM-DM105T: Intel Core i7-6700HQ, 15.60", 2.5 kg
External Review » Asus FX502VM-DM105T
Asus GL702VM-90NB0DQ1-M00830: Intel Core i7-6700HQ, 17.30", 2.7 kg
External Review » Asus GL702VM-90NB0DQ1-M00830
HP Omen 17-w202nu: Intel Core i7-7700HQ, 17.30", 3.4 kg
External Review » HP Omen 17-w202nu
Acer Aspire V15 Nitro BE VN7-593G-742C: Intel Core i7-7700HQ, 15.60"
External Review » Acer Aspire V15 Nitro BE VN7-593G-742C
MSI GE72VR 7RF-273NL Apache Pro: Intel Core i7-7700HQ, 17.30", 2.7 kg
External Review » MSI GE72VR 7RF-273NL Apache Pro
Asus Strix GL702VM-GC128T: Intel Core i7-7700HQ, 17.30", 2.7 kg
External Review » Asus Strix GL702VM-GC128T
Acer Predator Helios 300-G3-571: Intel Core i7-7700HQ, 15.60", 2.7 kg
External Review » Acer Predator Helios 300-G3-571
MSI GT72VR 7RD-462XES: Intel Core i7-7700HQ, 17.30", 3.8 kg
External Review » MSI GT72VR 7RD-462XES
HP Omen 17-w200ns: Intel Core i7-7700HQ, 17.30", 3.4 kg
External Review » HP Omen 17-w200ns
Lenovo Legion Y720-15IKB 80VR000QRK: Intel Core i5-7300HQ, 15.60", 3.2 kg
External Review » Lenovo Legion Y720-15IKB 80VR000QRK
MSI GS73VR-7RF-273TR: Intel Core i7-7700HQ, 17.30", 2.4 kg
External Review » MSI GS73VR-7RF-273TR
Asus Strix GL502VM-FY198T: Intel Core i7-7700HQ, 15.60", 2.2 kg
External Review » Asus Strix GL502VM-FY198T
LG 15GD870-XX70K: Intel Core i7-7700HQ, 15.60", 2.5 kg
External Review » LG 15GD870-XX70K
Acer Aspire V17 Nitro BE VN7-793G-52XN: Intel Core i5-7300HQ, 17.30", 3.1 kg
External Review » Acer Aspire V17 Nitro BE VN7-793G-52XN
Asus Strix GL502VM-FY110T: Intel Core i7-6700HQ, 15.60", 2.2 kg
External Review » Asus Strix GL502VM-FY110T
Gigabyte P57W V7 : Intel Core i7-7700HQ, 17.30", 4 kg
External Review » Gigabyte P57W V7
Asus FX502VM-FY361T: Intel Core i5-7300HQ, 15.60", 2.2 kg
External Review » Asus FX502VM-FY361T
Lenovo Legion Y720 80VR002XGE: Intel Core i7-7700HQ, 15.60", 3.1 kg
External Review » Lenovo Lenovo Legion Y720 80VR002XGE
MSI GP62MVR 7RF-477XES: Intel Core i7-7700HQ, 15.60", 2.2 kg
External Review » MSI GP62MVR 7RF-477XES
MSI GP62MVR 7RF-454XES: Intel Core i5-7300HQ, 15.60", 2.4 kg
External Review » MSI GP62MVR 7RF-454XES
MSI GE62VR 6RF-081NL Apache Pro: Intel Core i7-6700HQ, 15.60", 2.4 kg
External Review » MSI GE62VR 6RF-081NL Apache Pro
BTO Notebooks X-Book 15CL77: Intel Core i7-7700HQ, 15.60", 2.6 kg
External Review » BTO Notebooks X-Book 15CL77
MSI GE72VR 7RF-439RU Apache Pro: Intel Core i7-7700HQ, 17.30", 2.7 kg
External Review » MSI GE72VR 7RF-439RU Apache Pro
Asus Strix GL502VM-FY163T: Intel Core i7-7700HQ, 15.60", 2.2 kg
External Review » Asus Strix GL502VM-FY163T
Acer Predator Helios 300: Intel Core i7-7700HQ, 17.30", 2.9 kg
External Review » Acer Predator Helios 300
MSI GP72VR 7RFX: Intel Core i7-7700HQ, 17.30", 2.8 kg
External Review » MSI GP72VR 7RFX
Razer Blade (2017): Intel Core i7-7700HQ, 14.00", 1.8 kg
External Review » Razer Blade (2017)
Acer Aspire VN7-593G-73KV: Intel Core i7-7700HQ, 15.60", 2.6 kg
External Review » Acer Aspire VN7-593G-73KV
Razer Blade 2017 UHD, Kaby Lake: Intel Core i7-7700HQ, 14.00", 2 kg
External Review » Razer Blade 2017 UHD, Kaby Lake
MSI GS63VR 7RF-211UK Stealth Pro: Intel Core i7-7700HQ, 15.60", 1.9 kg
External Review » MSI GS63VR 7RF-211UK Stealth Pro
Gigabyte Aero 14-W7-002ID: Intel Core i7-7700HQ, 14.00", 1.9 kg
External Review » Gigabyte Aero 14-W7-002ID
Asus GL702VM-DS74: Intel Core i7-7700HQ, 17.30", 2.7 kg
External Review » Asus GL702VM-DS74
Asus Strix GL702VM-GC194T: Intel Core i7-7700HQ, 17.30", 2.7 kg
External Review » Asus Strix GL702VM-GC194T
Gigabyte Aero 15: Intel Core i7-7700HQ, 15.60", 2.1 kg
External Review » Gigabyte Aero 15
Acer Aspire V17 Nitro BE VN7-793G-767M: Intel Core i7-7700HQ, 17.30", 3.1 kg
External Review » Acer Aspire V17 Nitro BE VN7-793G-767M
Acer Aspire VN7-593G-73HP V15 Nitro BE: Intel Core i7-7700HQ, 15.60", 2.5 kg
External Review » Acer Aspire VN7-593G-73HP V15 Nitro BE
MSI GS73VR 7RF-215NE: Intel Core i7-7700HQ, 17.30", 2.4 kg
External Review » MSI GS73VR 7RF-215NE
MSI GT72VR 6RD-057NL Dominator: Intel Core i7-6700HQ, 17.30", 3.8 kg
External Review » MSI GT72VR 6RD-057NL Dominator
MSI GP62VR 7RF-453XES: Intel Core i7-7700HQ, 15.60", 2.4 kg
External Review » MSI GP62VR 7RF-453XES
Alienware 13 R3: Intel Core i7-7700HQ, 13.30", 2.5 kg
External Review » Alienware 13 R3
MSI GE72VR 7RF-278CZ: Intel Core i7-7700HQ, 17.30", 2.7 kg
External Review » MSI GE72VR 7RF-278CZ
MSI GS43VR 7RE Phantom Pro - 7RE-064DE: Intel Core i7-7700HQ, 14.00", 1.6 kg
External Review » MSI GS43VR 7RE Phantom Pro - 7RE-064DE
Gigabyte Aero 14: Intel Core i7-7700HQ, 14.00", 1.9 kg
External Review » Gigabyte Aero 14
Alienware 13 R3 AW13R303: Intel Core i7-6700HQ, 13.00", 2.6 kg
External Review » Alienware 13 R3 AW13R303
Aorus X3 Plus v7-CF1: Intel Core i7-7820HK, 13.90", 1.8 kg
External Review » Aorus X3 Plus v7-CF1
Razer Blade FHD Matte, Kaby Lake: Intel Core i7-7700HQ, 14.00", 1.9 kg
External Review » Razer Blade FHD Matte, Kaby Lake
Asus FX502VM-DM112T: Intel Core i5-6300HQ, 15.60", 2.6 kg
External Review » Asus FX502VM-DM112T
Asus FX502VM-DM113T: Intel Core i7-6700HQ, 15.60", 2.6 kg
External Review » Asus FX502VM-DM113T
Asus FX502VM-DM114T: Intel Core i7-6700HQ, 15.60", 2.6 kg
External Review » Asus FX502VM-DM114T
Alienware 13 OLED 2017: Intel Core i7-7700HQ, 13.30", 2.6 kg
External Review » Alienware 13 OLED 2017
Cyberpower Vector 17: Intel Core i7-6700HQ, 17.30", 3.8 kg
External Review » Cyberpower Vector 17
Asus FX502VM-AS73: Intel Core i7-7700HQ, 15.60", 2.6 kg
External Review » Asus FX502VM-AS73
Gigabyte Aero 14 P64Wv7-De325Tb: Intel Core i7-7700HQ, 14.00", 1.9 kg
External Review » Gigabyte Aero 14 P64Wv7-De325Tb
Acer Aspire V17 Nitro BE VN7-793G-706L: Intel Core i7-7700HQ, 17.30", 3.1 kg
External Review » Acer Aspire V17 Nitro BE VN7-793G-706L
MSI GT72VR-6RDAC16H21: Intel Core i7-6700HQ, 17.30", 3.8 kg
External Review » MSI GT72VR-6RDAC16H21
MSI GS73VR 7RF-210: Intel Core i7-7700HQ, 17.30", 2.4 kg
External Review » MSI GS73VR 7RF-210
MSI GS43VR 7RE-062: Intel Core i7-7700HQ, 14.00", 1.6 kg
External Review » MSI GS43VR 7RE-062
MSI GS63VR 7RF-219NL: Intel Core i7-7700HQ, 15.60", 1.8 kg
External Review » MSI GS63VR 7RF-219NL
MSI GE62VR 7RF-417ES: Intel Core i7-7700HQ, 15.60", 2.4 kg
External Review » MSI GE62VR 7RF-417ES
MSI GS73VR 7RF-216NL: Intel Core i7-7700HQ, 17.30", 2.4 kg
External Review » MSI GS73VR 7RF-216NL
Asus Strix GL502VM-FY022T: Intel Core i7-6700HQ, 15.60", 2.2 kg
External Review » Asus Strix GL502VM-FY022T
Acer Predator 17 G5-793-7108: Intel Core i7-6700HQ, 17.30", 4.2 kg
External Review » Acer Predator 17 G5-793-7108
MSI GE72VR-7RF-267: Intel Core i7-7700HQ, 17.30", 2.9 kg
External Review » MSI GE72VR-7RF-267
MSI GS73-6RF-006UK: Intel Core i7-6700HQ, 17.30", 2.4 kg
External Review » MSI GS73-6RF-006UK
Acer Predator 15 G9-593-70G8: Intel Core i7-6700HQ, 15.60", 3.4 kg
External Review » Acer Predator 15 G9-593-70G8
Lenovo Legion Y720-15IKB: Intel Core i7-7700HQ, 15.60", 3.2 kg
External Review » Lenovo Legion Y720-15IKB
Asus Strix GL702VM-GC005T: Intel Core i7-6700HQ, 17.30", 2.7 kg
External Review » Asus Strix GL702VM-GC005T
MSI GS63VR 7RF Stealth Pro: Intel Core i7-7700HQ, 15.60", 2.9 kg
External Review » MSI GS63VR 7RF Stealth Pro
MSI GS43VR 6RE-053ES: Intel Core i7-6700HQ, 14.00", 1.8 kg
External Review » MSI GS43VR 6RE-053ES
MSI GS63VR 6RF-029NL Stealth Pro: Intel Core i7-6700HQ, 15.60", 1.8 kg
External Review » MSI GS63VR 6RF-029NL Stealth Pro
HP Omen 17-w100ng: Intel Core i5-6300HQ, 17.30", 3.2 kg
External Review » HP Omen 17-w100ng
Gigabyte Aero 14-P64WV6: Intel Core i7-6700HQ, 14.00", 1.9 kg
External Review » Gigabyte Aero 14-P64WV6
Asus GL702VM-GC017T: Intel Core i7-6700HQ, 17.30", 2.7 kg
External Review » Asus GL702VM-GC017T
Aorus X3 Plus v6: Intel Core i7-6820HK, 13.90", 1.8 kg
External Review » Aorus X3 Plus v6
Razer Blade (2016) FHD: Intel Core i7-6700HQ, 14.00", 1.9 kg
External Review » Razer Blade (2016) FHD
MSI GS43VR 6RE-007RU Phantom Pro: Intel Core i7-6700HQ, 14.00", 1.8 kg
External Review » MSI GS43VR 6RE-007RU Phantom Pro
Asus Strix GL502VM-FY006T-BE: Intel Core i7-6700HQ, 15.60", 2.2 kg
External Review » Asus Strix GL502VM-FY006T-BE
MSI GE62VR 6RF-236XES: Intel Core i5-6300HQ, 15.60", 2.4 kg
External Review » MSI GE62VR 6RF-236XES
Asus Strix GL702VM-GC020T: Intel Core i5-6300HQ, 17.30", 2.7 kg
External Review » Asus Strix GL702VM-GC020T
Alienware 15 R3-3831SLV: Intel Core i7-6700HQ, 15.60", 3.5 kg
External Review » Alienware 15 R3-3831SLV
Alienware 15 R3-0012SLV: Intel Core i5-6300U, 15.60", 3.5 kg
External Review » Alienware 15 R3-0012SLV
Asus G752VM-GC034D: Intel Core i7-6700HQ, 17.30", 4 kg
External Review » Asus G752VM-GC034D
MSI GT62VR 6RD-070XES: Intel Core i7-6700HQ, 15.60", 3 kg
External Review » MSI GT62VR 6RD-070XES
MSI GS63VR-6RF-048 Stealth Pro: Intel Core i7-6700HQ, 15.60", 1.8 kg
External Review » MSI GS63VR-6RF-048 Stealth Pro
Alienware 13 R3 OLED: Intel Core i7-6700HQ, 13.30", 2.4 kg
External Review » Alienware 13 R3 OLED
Razer Blade (2016): Intel Core i7-6700HQ, 14.00", 2 kg
External Review » Razer Blade (2016)
MSI GS63VR-6RFAC16H22: Intel Core i7-6700HQ, 15.60", 1.9 kg
External Review » MSI GS63VR-6RFAC16H22
Origin PC EVO15-S: Intel Core i7-6700HQ, 15.60", 1.8 kg
External Review » Origin PC EVO15-S
MSI GT62VR 6RD-056ES Dominator: Intel Core i7-6700HQ, 15.60", 3 kg
External Review » MSI GT62VR 6RD-056ES Dominator
MSI GE62VR-6RFAC16H21: Intel Core i7-6700HQ, 15.60", 2.5 kg
External Review » MSI GE62VR-6RFAC16H21
Medion Erazer X7847-MD60342: Intel Core i7-6700HQ, 17.30", 3.8 kg
External Review » Medion Erazer X7847-MD60342
Asus Strix GL502VM-FY035T: Intel Core i7-6700HQ, 15.60", 2.2 kg
External Review » Asus Strix GL502VM-FY035T
MSI GE62VR-6RF16H11 Apache Pro: Intel Core i7-6700HQ, 15.60", 2.5 kg
External Review » MSI GE62VR-6RF16H11 Apache Pro
MSI GS73VR-6RF16H22 Stealth Pro: Intel Core i7-6700HQ, 17.30", 2.4 kg
External Review » MSI GS73VR-6RF16H22 Stealth Pro
HP Omen 17-w101ng: Intel Core i7-6700HQ, 17.30", 2.8 kg
External Review » HP Omen 17-w101ng
MSI GS43VR 6RE-008NE: Intel Core i7-6700HQ, 14.00", 1.6 kg
External Review » MSI GS43VR 6RE-008NE
MSI GS43VR 6RE-009NL Phantom Pro: Intel Core i7-6700HQ, 14.00", 1.6 kg
External Review » MSI GS43VR 6RE-009NL Phantom Pro
Nexoc G518II: Intel Core i7-6700HQ, 15.60", 2.5 kg
External Review » Nexoc G518II
MSI GT62VR-6RDAC16H11: Intel Core i7-6700HQ, 15.60", 2.9 kg
External Review » MSI GT62VR-6RDAC16H11
MSI GS73VR 6RF: Intel Core i7-6700HQ, 17.30", 2.4 kg
External Review » MSI GS73VR 6RF
MSI GE72VR-6RF: Intel Core i7-6700HQ, 0.00"
External Review » MSI GE72VR-6RF
Schenker XMG P507: Intel Core i7-6700HQ, 15.60", 2.8 kg
External Review » Schenker XMG P507
Asus Strix GL502VM-FY039T: Intel Core i7-6700HQ, 15.60", 2.5 kg
External Review » Asus Strix GL502VM-FY039T
MSI GT72VR-6RD-16H21: Intel Core i7-6700HQ, 17.30", 3.8 kg
External Review » MSI GT72VR-6RD-16H21
Gigabyte P55W v6: Intel Core i7-6700HQ, 15.60", 2.7 kg
External Review » Gigabyte P55W v6
MSI GS43VR 6RE-006US: Intel Core i7-6700HQ, 14.00", 1.9 kg
External Review » MSI GS43VR 6RE-006US
MSI GS63VR-6RF16H22 Stealth Pro: Intel Core i7-6700HQ, 15.60", 1.9 kg
External Review » MSI GS63VR-6RF16H22 Stealth Pro
» Comparison of GPUs
Detailed list of all laptop GPUs sorted by class and performance.
» Benchmark List
Sort and restrict laptop GPUs based on performance in synthetic benchmarks.
» Notebook Gaming List
Playable games for each graphics card and their average FPS results.
* Approximate position of the graphics adapter
» Notebookcheck多媒体笔记本电脑Top 10排名
» Notebookcheck游戏笔记本电脑Top 10排名
» Notebookcheck低价办公/商务笔记本电脑Top 10排名
» Notebookcheck高端办公/商务笔记本电脑Top 10排名
» Notebookcheck工作站笔记本电脑Top 10排名
» Notebookcheck亚笔记本电脑Top 10排名
» Notebookcheck超级本产品Top 10排名
» Notebookcheck变形本产品Top 10排名
» Notebookcheck平板电脑Top 10排名
» Notebookcheck智能手机Top 10排名
» Notebookcheck评测过最出色的笔记本电脑屏幕
» Notebookcheck售价500欧元以下笔记本电脑Top 10排名
» Notebookcheck售价300欧元以下笔记本电脑Top 10排名