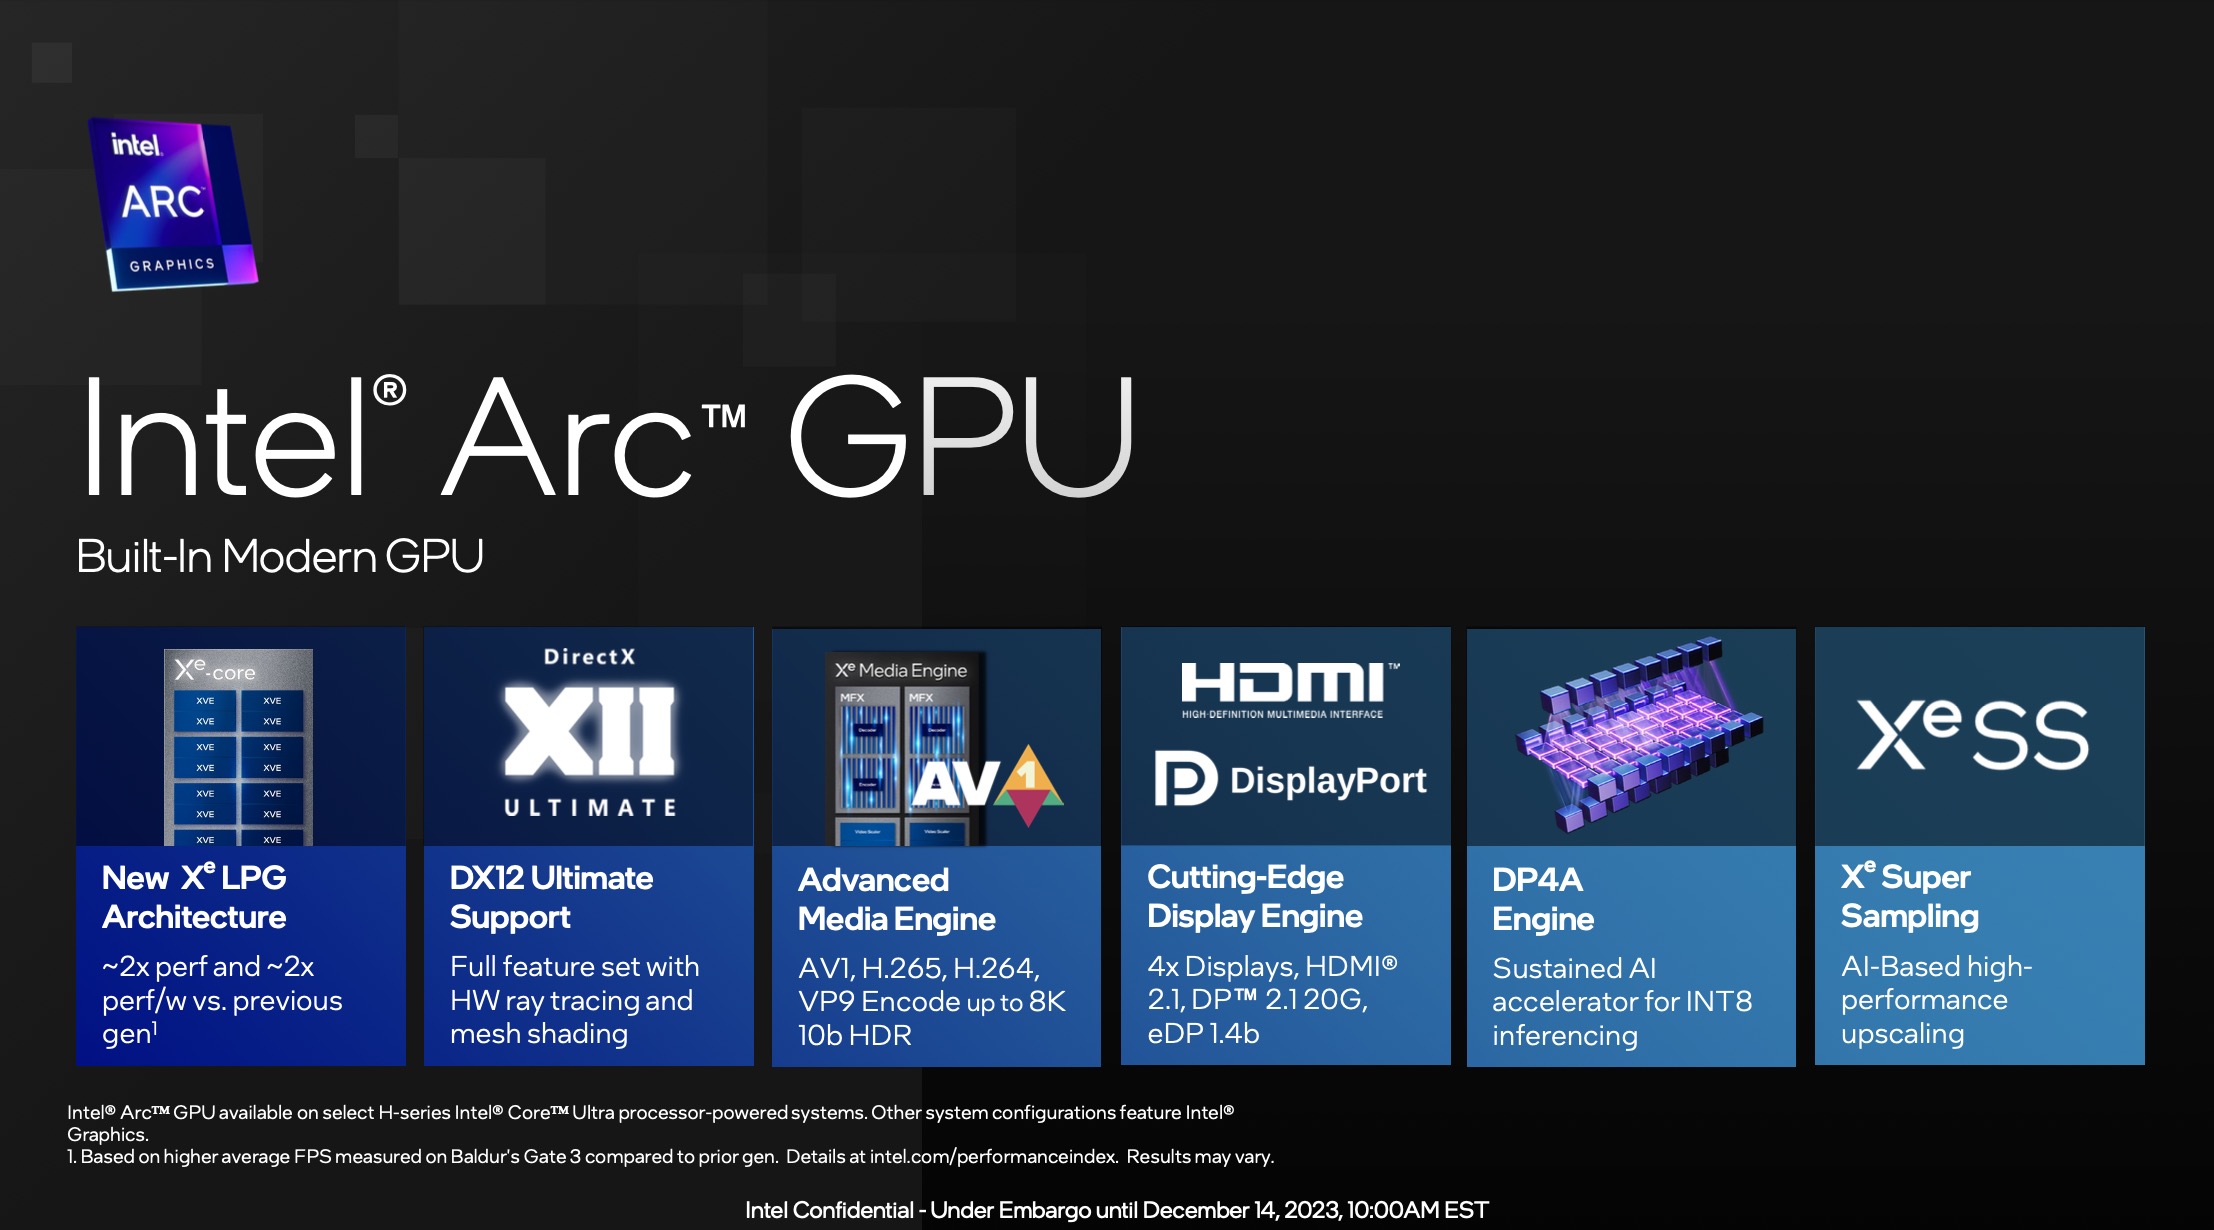
Notebook reviews with Intel Arc 7-Core iGPU graphics card
Alldocube iWork GT Ultra 可折叠平板电脑评测:Android 平板电脑的替代品,真正的 PC 性能
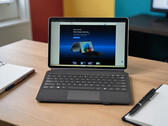
通过 iWork GT Ultra,Alldocube 提供了一款配备英特尔酷睿 Ultra 5 125H 的多功能 Windows 可转换设备。手写笔和键盘盖作为一个完整的套装出售,售价约为 920 美元。但这款设备在日常使用中的性能、移动性和电池续航时间表现如何?我们的测试回答了最重要的问题。
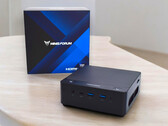
Intel Core Ultra 5 125H, Arc 7-Core, 13", 870 gMinix Elite EU512-AI 评测:超节能酷睿迷你 PC
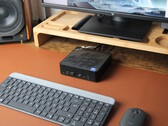
来自远东的迷你电脑往往标榜低价,却配备了英特尔 N100 等性能不强的处理器。Minix 的 Elite 系列却不是这种情况--这些机型配备了英特尔酷睿 Ultra CPU,但起价仅为 668 欧元(约合人民币 780 元)或 829 欧元(约合人民币 967 元)。我们将对这款搭载人工智能的微型电脑进行评测,看看它到底能提供什么。
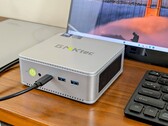
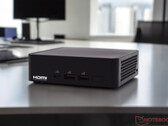
Intel Core Ultra 5 125H, Arc 7-Core, 772 gGMK NucBox K9 迷你电脑评测:配备 Arc 7 图形处理器的酷睿 5 125H
酷睿至尊 5 125H 可以让电脑变得更智能,但并不一定意味着速度更快。原始性能远远落后于更老更便宜的 Ryzen 7 7840HS。
Intel Core Ultra 5 125H, Arc 7-Core, 528 g华硕 NUC 14 Pro 评测:配备 Intel Core Ultra 5 125H、快速 Intel Arc iGPU 和 2x Thunderbolt 4 的 NUC 迷你 PC
华硕接管了英特尔的 NUC 部门,现在提供配备英特尔流星湖处理器的流行迷你 PC。这不仅为小型台式电脑提供了更强大的 CPU 能力,而且由于改进了 iGPU,还能显著提高 3D 性能。我们对搭载英特尔酷睿 5125H 处理器的华硕 NUC 14 Pro 进行了详细测试,并根据大量测量和基准测试对其性能进行了评估。
Intel Core Ultra 5 125H, Arc 7-Core, 525 gMinisforum UH125 Pro 评测:配备英特尔酷睿 Ultra 5 125H、32 GB DDR5 内存和 1 TB 固态硬盘的 AI 迷你 PC,价格不菲
Minisforum 正在更新其基于英特尔流星湖处理器的机型系列:UH125 Pro 基于英特尔酷睿 Ultra 5 125H。您还可以期待丰富的连接功能,目前最先进的连接功能包括 USB4 和 OCuLink。我们对该设备进行了详细了解,并根据大量测量和基准测试分析了其性能。
Intel Core Ultra 5 125H, Arc 7-Core, 797 gLenovo ThinkBook 13x G4 21KR0008GE: Intel Core Ultra 5 125H, 13.50", 1.2 kg
Review » 联想 ThinkBook 13x G4 笔记本电脑评测:除键盘外最好的笔记本之一
Samsung Galaxy Book4 Pro 360: Intel Core Ultra 5 125H, 16.00", 1.7 kg
Review » 三星Galaxy Book4 Pro 360 - 配备酷睿Ultra 5和120 Hz AMOLED的超薄二合一机型
Lenovo IdeaPad Slim 5 14IMH9: Intel Core Ultra 5 125H, 14.00", 1.4 kg
Review » 联想 IdeaPad Slim 5 14 笔记本电脑评测:配备 OLED 显示屏的成功全能型产品
Acer Aspire 5 A514-54H, Core 5 125H: Intel Core Ultra 5 125H, 14.00", 1.2 kg
External Review » Acer Aspire 5 A514-54H, Core 5 125H - 评测与配置
Honor MagicBook X 16 (2026): Intel Core Ultra 5 125H, 16.00", 1.8 kg
External Review » Honor MagicBook X 16 (2026)
Asus ExpertBook B3405: Intel Core Ultra 5 125H, 14.00", 1.4 kg
External Review » Asus ExpertBook B3405
Acer Aspire Lite 16 AI AL16-71P: Intel Core Ultra 5 125H, 16.00", 1.6 kg
External Review » Acer Aspire Lite 16 AI AL16-71P
Acer Aspire 16 A16-71M: Intel Core Ultra 5 125H, 16.00", 1.6 kg
External Review » Acer Aspire 16 A16-71M
MSI Modern 15 H AI C1MG, Ultra 5 125H: Intel Core Ultra 5 125H, 15.60", 1.9 kg
External Review » MSI Modern 15 H AI C1MG, Ultra 5 125H
Dynabook Portégé X30L-M: Intel Core Ultra 5 125H, 13.30", 0.9 kg
External Review » Dynabook Portégé X30L-M
Asus Zenbook 14 OLED Q415MA: Intel Core Ultra 5 125H, 14.00", 1.3 kg
External Review » Asus Zenbook 14 OLED Q415MA
Lenovo ThinkBook 13x G4 21KR0008GE: Intel Core Ultra 5 125H, 13.50", 1.2 kg
External Review » Lenovo ThinkBook 13x G4 21KR0008GE
Lenovo ThinkBook 16 G7 IML, Ultra 5 125H: Intel Core Ultra 5 125H, 16.00", 1.7 kg
External Review » Lenovo ThinkBook 16 G7 IML, Ultra 5 125H
HP Pavilion Plus 14-ew1000: Intel Core Ultra 5 125H, 14.00", 1.4 kg
External Review » HP Pavilion Plus 14-ew1000
LG gram 14 2-in-1 14T90S: Intel Core Ultra 5 125H, 14.00", 1.3 kg
External Review » LG gram 14 2-in-1 14T90S
Lenovo Yoga 7 14IML9, Ultra 5 125H: Intel Core Ultra 5 125H, 14.00", 1.5 kg
External Review » Lenovo Yoga 7 14IML9, Ultra 5 125H
Acer Swift Go 14 SFG14-72, Ultra 5 125H: Intel Core Ultra 5 125H, 14.00", 1.3 kg
External Review » Acer Swift Go 14 SFG14-72, Ultra 5 125H
MSI Prestige 14 AI Evo C1MG: Intel Core Ultra 5 125H, 14.00", 1.7 kg
External Review » MSI Prestige 14 AI Evo C1MG
MSI Prestige 13 AI Evo, Ultra 5: Intel Core Ultra 5 125H, 13.30", 1 kg
External Review » MSI Prestige 13 AI Evo, Ultra 5
Asus VivoBook S 14 OLED S5406MA: Intel Core Ultra 5 125H, 14.00", 1.3 kg
External Review » Asus VivoBook S 14 OLED S5406MA
Lenovo IdeaPad Slim 5 14IMH9: Intel Core Ultra 5 125H, 14.00", 1.4 kg
External Review » Lenovo IdeaPad Slim 5 14IMH9
Asus ZenBook 14 UX3405MA, Ultra 5: Intel Core Ultra 5 125H, 14.00", 1.3 kg
External Review » Asus ZenBook 14 UX3405MA, Ultra 5
Lenovo ThinkBook 13x IMH G4: Intel Core Ultra 5 125H, 13.50", 1.2 kg
External Review » Lenovo ThinkBook 13x IMH G4
Samsung Galaxy Book4 Pro 360: Intel Core Ultra 5 125H, 16.00", 1.7 kg
External Review » Samsung Galaxy Book4 Pro 360
Alldocube iWork GT Ultra: Intel Core Ultra 5 125H, 13.00", 0.9 kg
» 低于 800 欧元的 Windows 可折叠/平板电脑:iWork GT Ultra - 性价比之选还是折中设备?