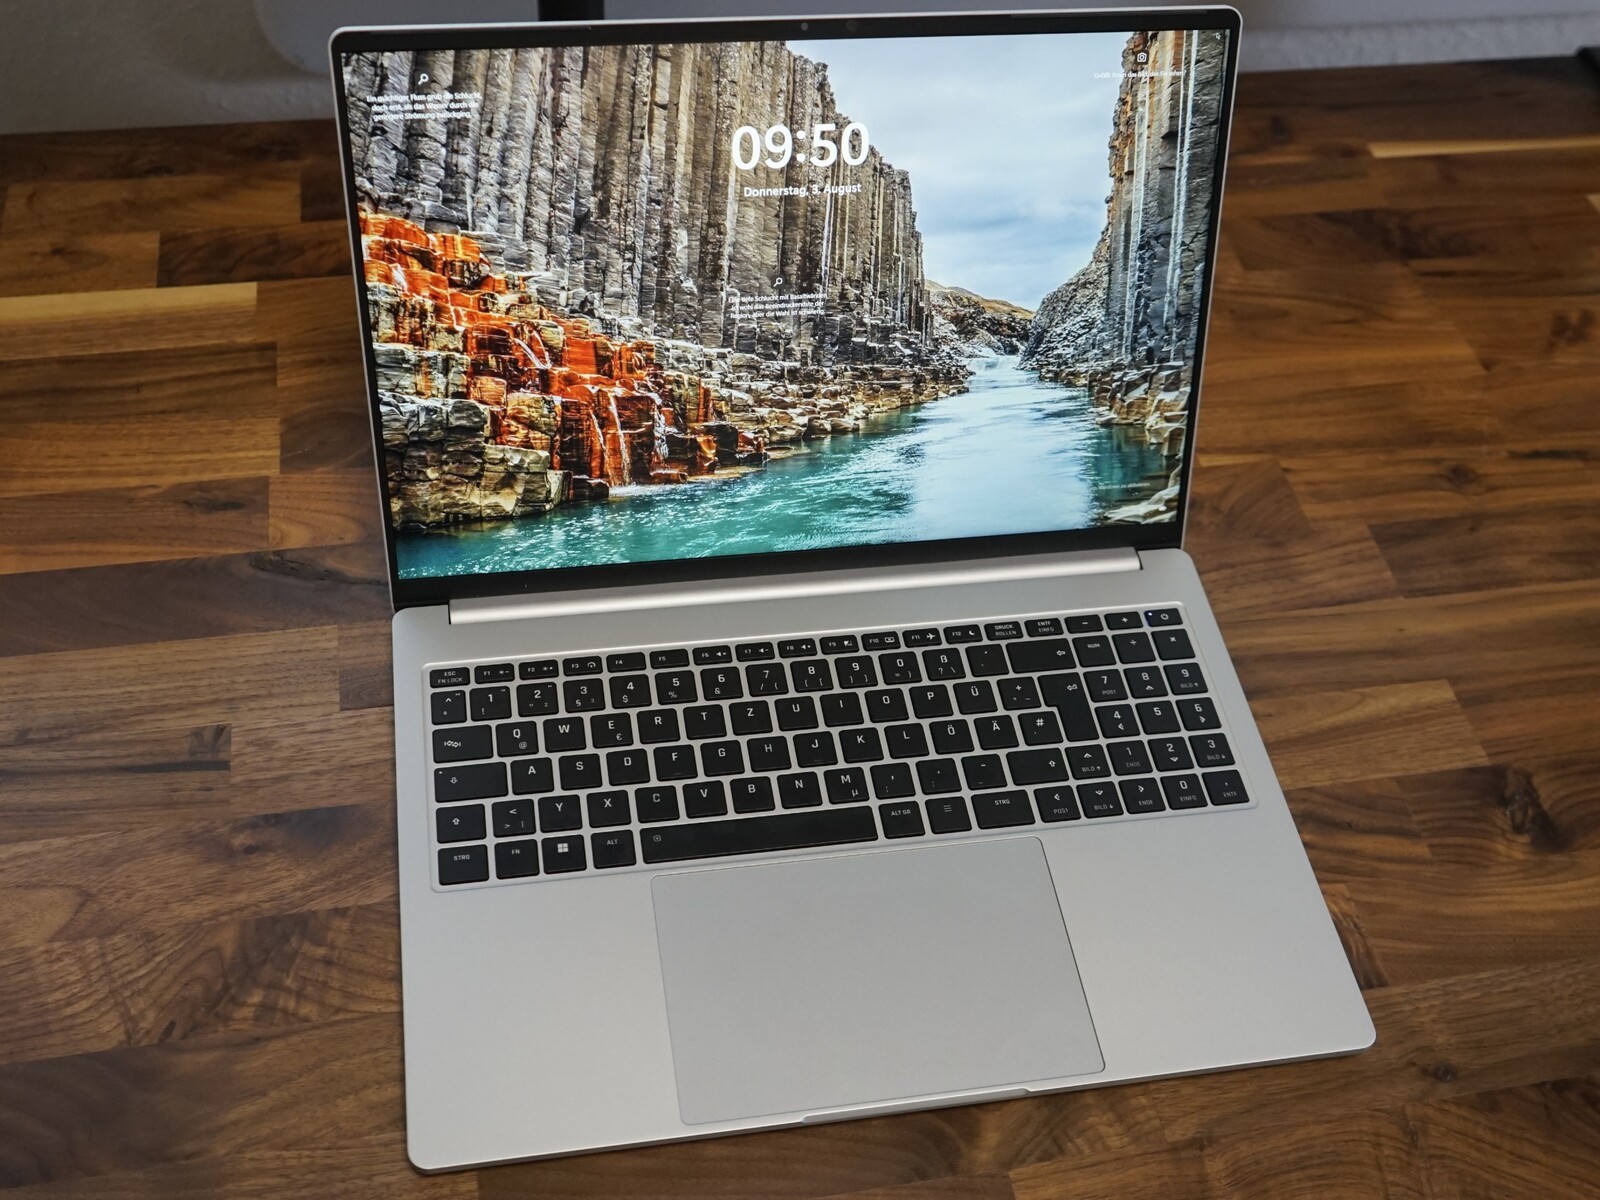
申克 Vision 16 2023 评论:16 英寸轻便型,端口众多

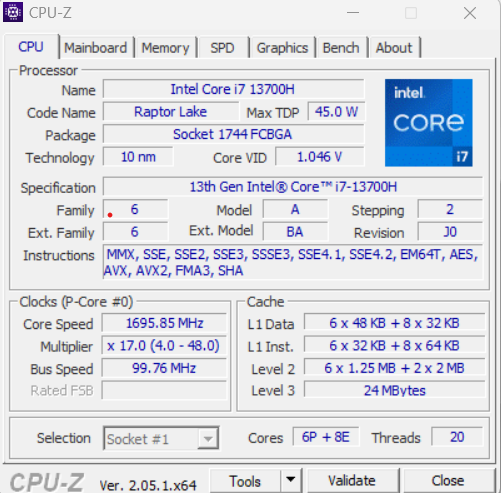
除了 Vision 16 Pro之外,申克还推出了 Vision 16。这款特别轻巧的 16 英寸超极本采用了最新的英特尔猛禽湖芯片酷睿 i7-13700H。专用图形处理器为 Pro 机型保留。去年 Vision 16 的重量为 1.45 千克,而新机型的重量为 1.5 千克,仍然是市场上最轻的 16 英寸笔记本电脑之一。
新款 Vision 16 没有采用去年的 90 Hz 屏幕,而是采用了 Pro 版的 240 Hz WQXGA 面板。尽管对冷却系统进行了重新设计,以降低 Vision 16 在负载情况下的噪音,但它仍然使用液态金属来传递酷睿 i7-13700H 的热量。
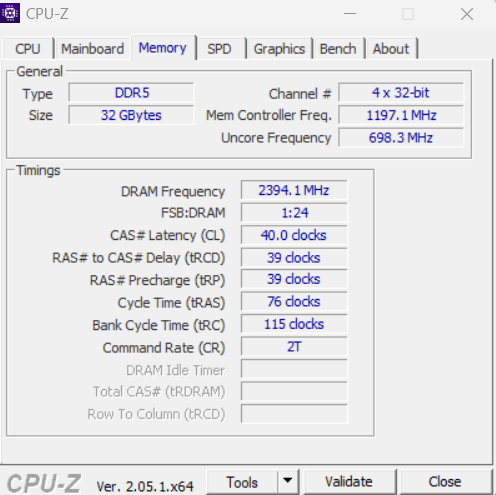
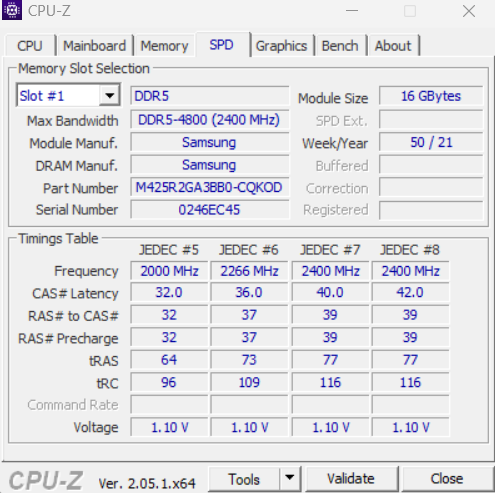
Vision 16 的售价为 1.539 欧元起。这款基本机型配备 16GB DDR5-4800 内存和 500GB 三星 M.2 固态硬盘。我们的评测机型配备了 32 GB 内存和 1 TB M.2 三星 990 Pro 固态硬盘。采用 Windows 系统的评测版本售价约为 1,660 欧元。
潜在的竞争对手比较
Rating | Date | Model | Weight | Height | Size | Resolution | Price |
|---|---|---|---|---|---|---|---|
| 88.6 % v7 (old) | 08 / 2023 | Schenker Vision 16 PH6PRX1 i7-13700H, Iris Xe G7 96EUs | 1.5 kg | 17.1 mm | 16.00" | 2560x1600 | |
| 91.8 % v7 (old) | 06 / 2023 | Apple MacBook Air 15 2023 M2 16 GB M2, M2 10-Core GPU | 1.5 kg | 11.5 mm | 15.30" | 2880x1864 | |
| 86.6 % v7 (old) | 06 / 2023 | Acer Swift Go SFG16-71 i7-13700H, Iris Xe G7 96EUs | 1.6 kg | 19 mm | 16.00" | 3200x2000 | |
| 85 % v7 (old) | 08 / 2023 | LG Gram SuperSlim (2023) i7-1360P, Iris Xe G7 96EUs | 990 g | 10.9 mm | 15.60" | 1920x1080 | |
| 84.3 % v7 (old) | 04 / 2023 | Microsoft Surface Laptop 5 15, i7-1255U i7-1255U, Iris Xe G7 96EUs | 1.6 kg | 14.7 mm | 15.00" | 2496x1664 | |
| 83.2 % v7 (old) | 02 / 2023 | Asus VivoBook S15 M3502RA-L1029W R7 6800H, Radeon 680M | 1.9 kg | 18.8 mm | 15.60" | 1920x1080 |
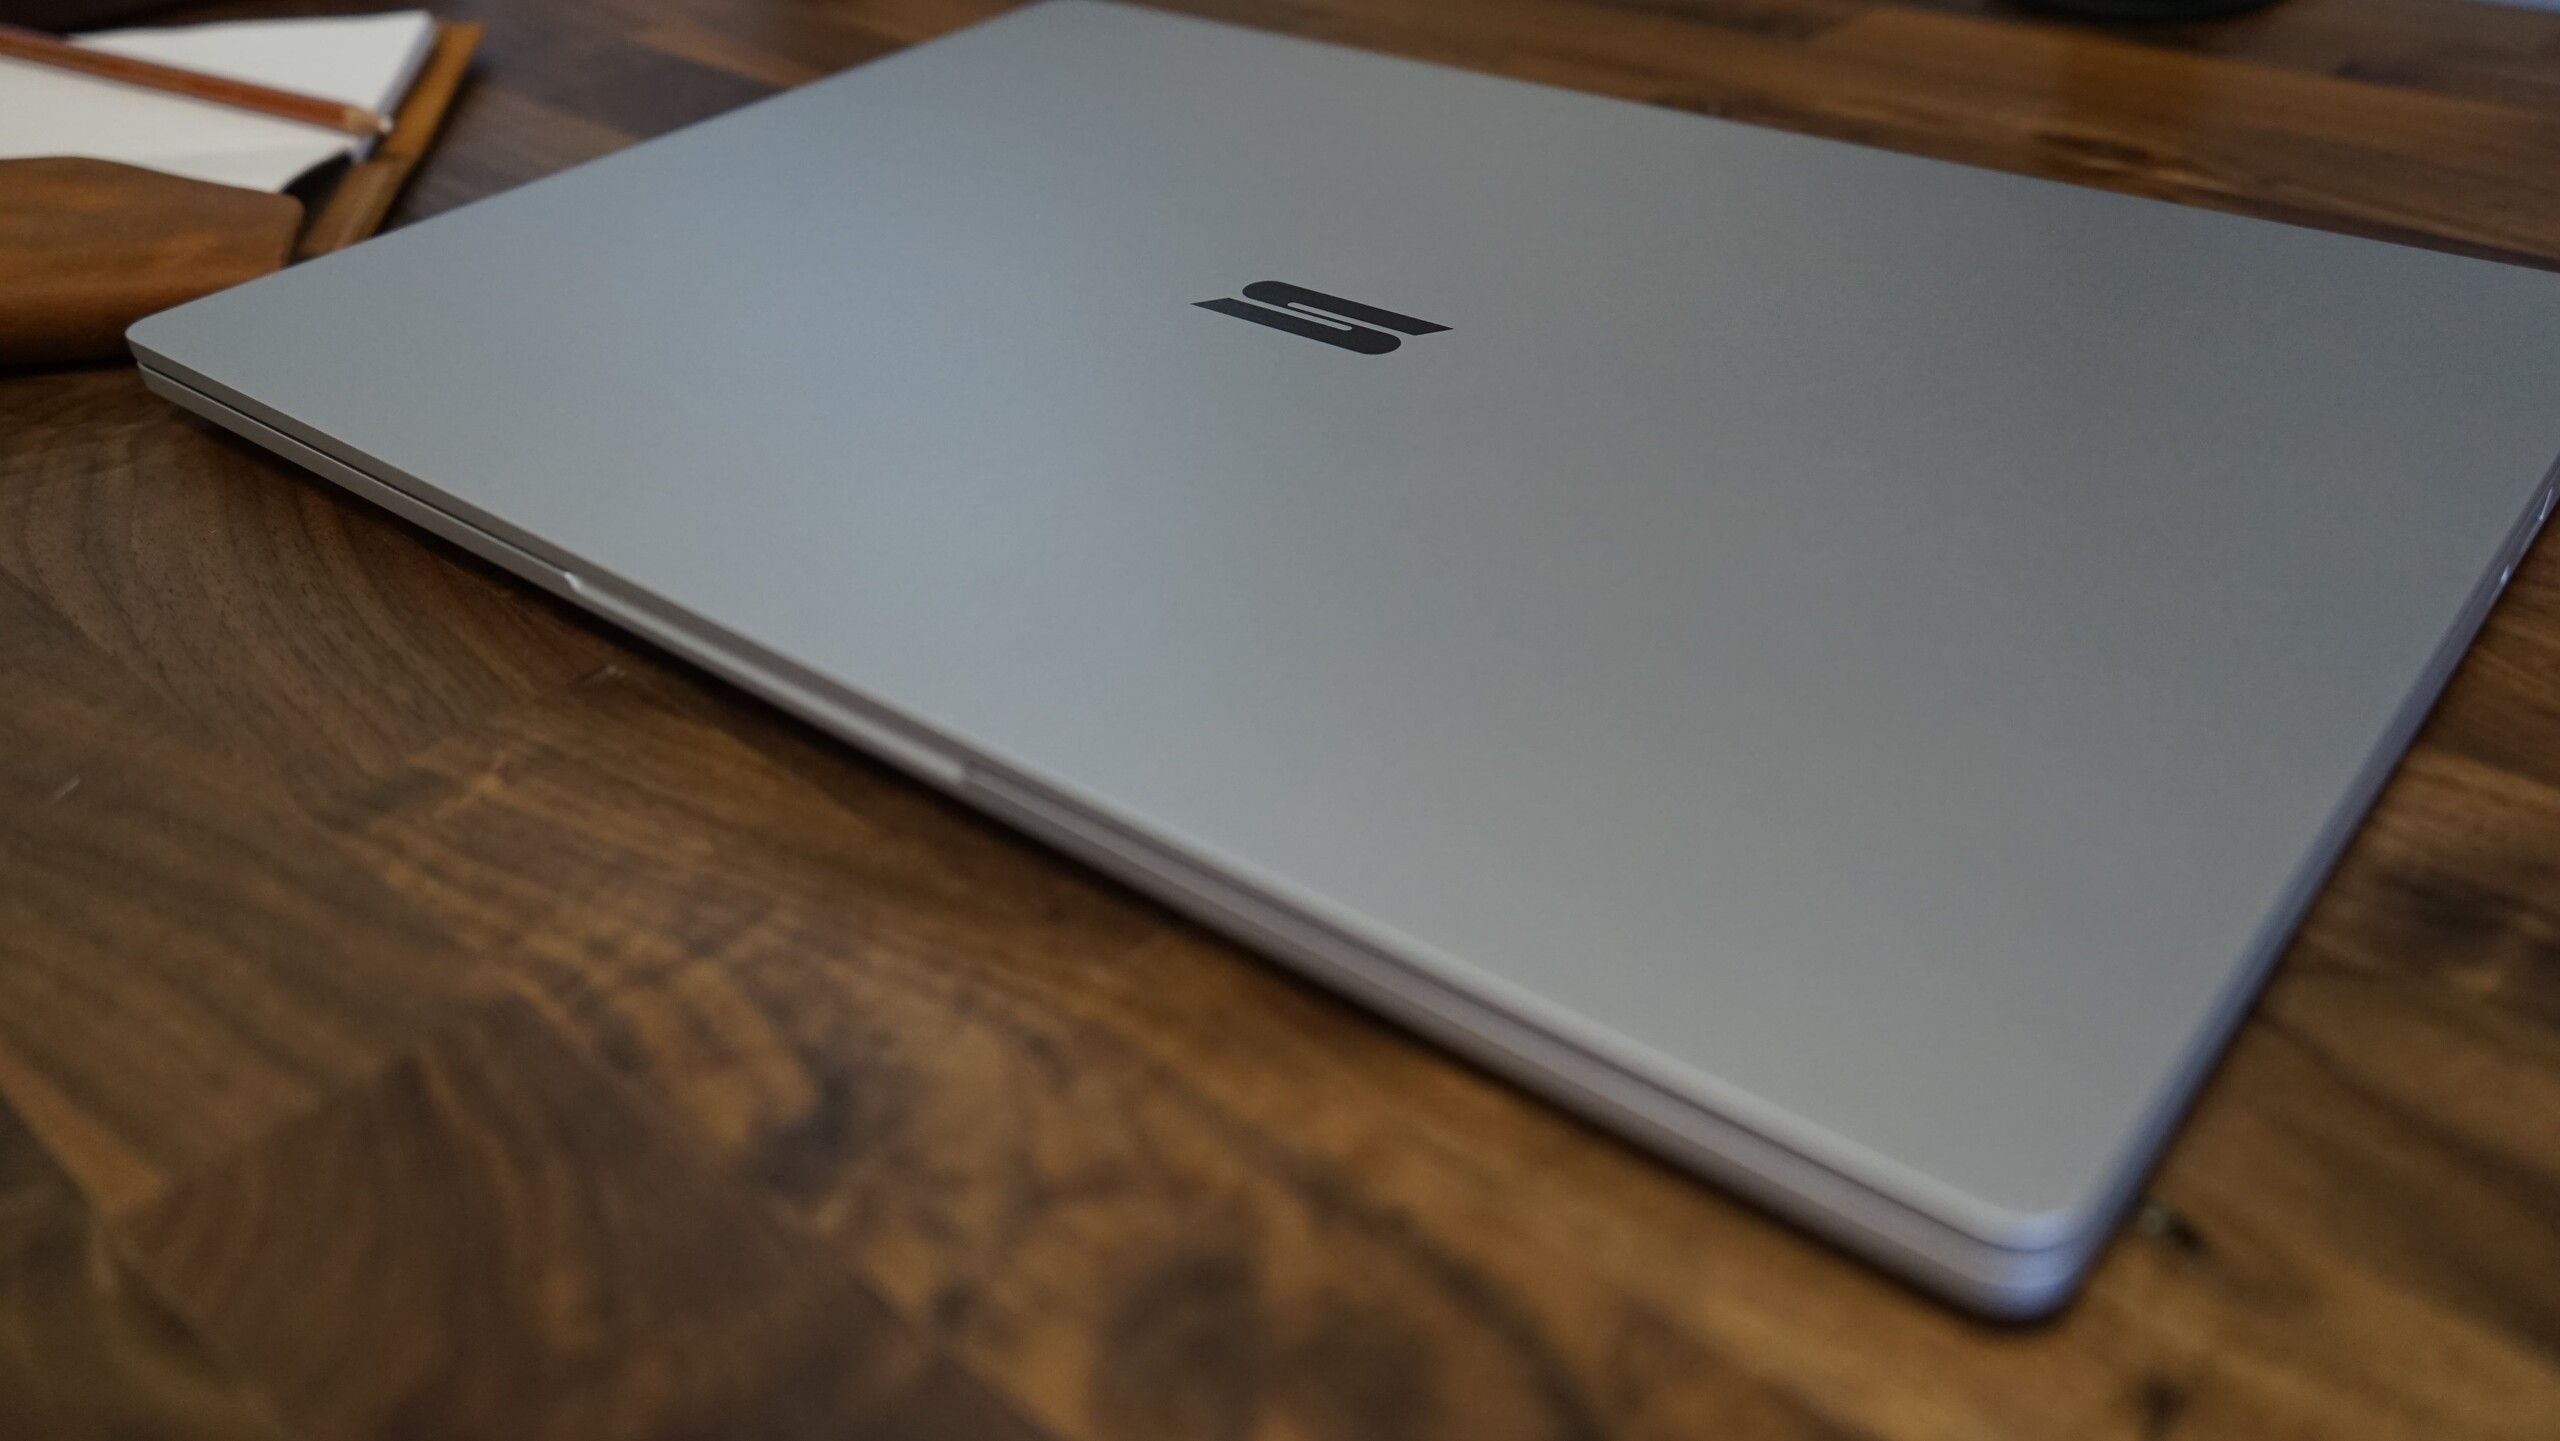
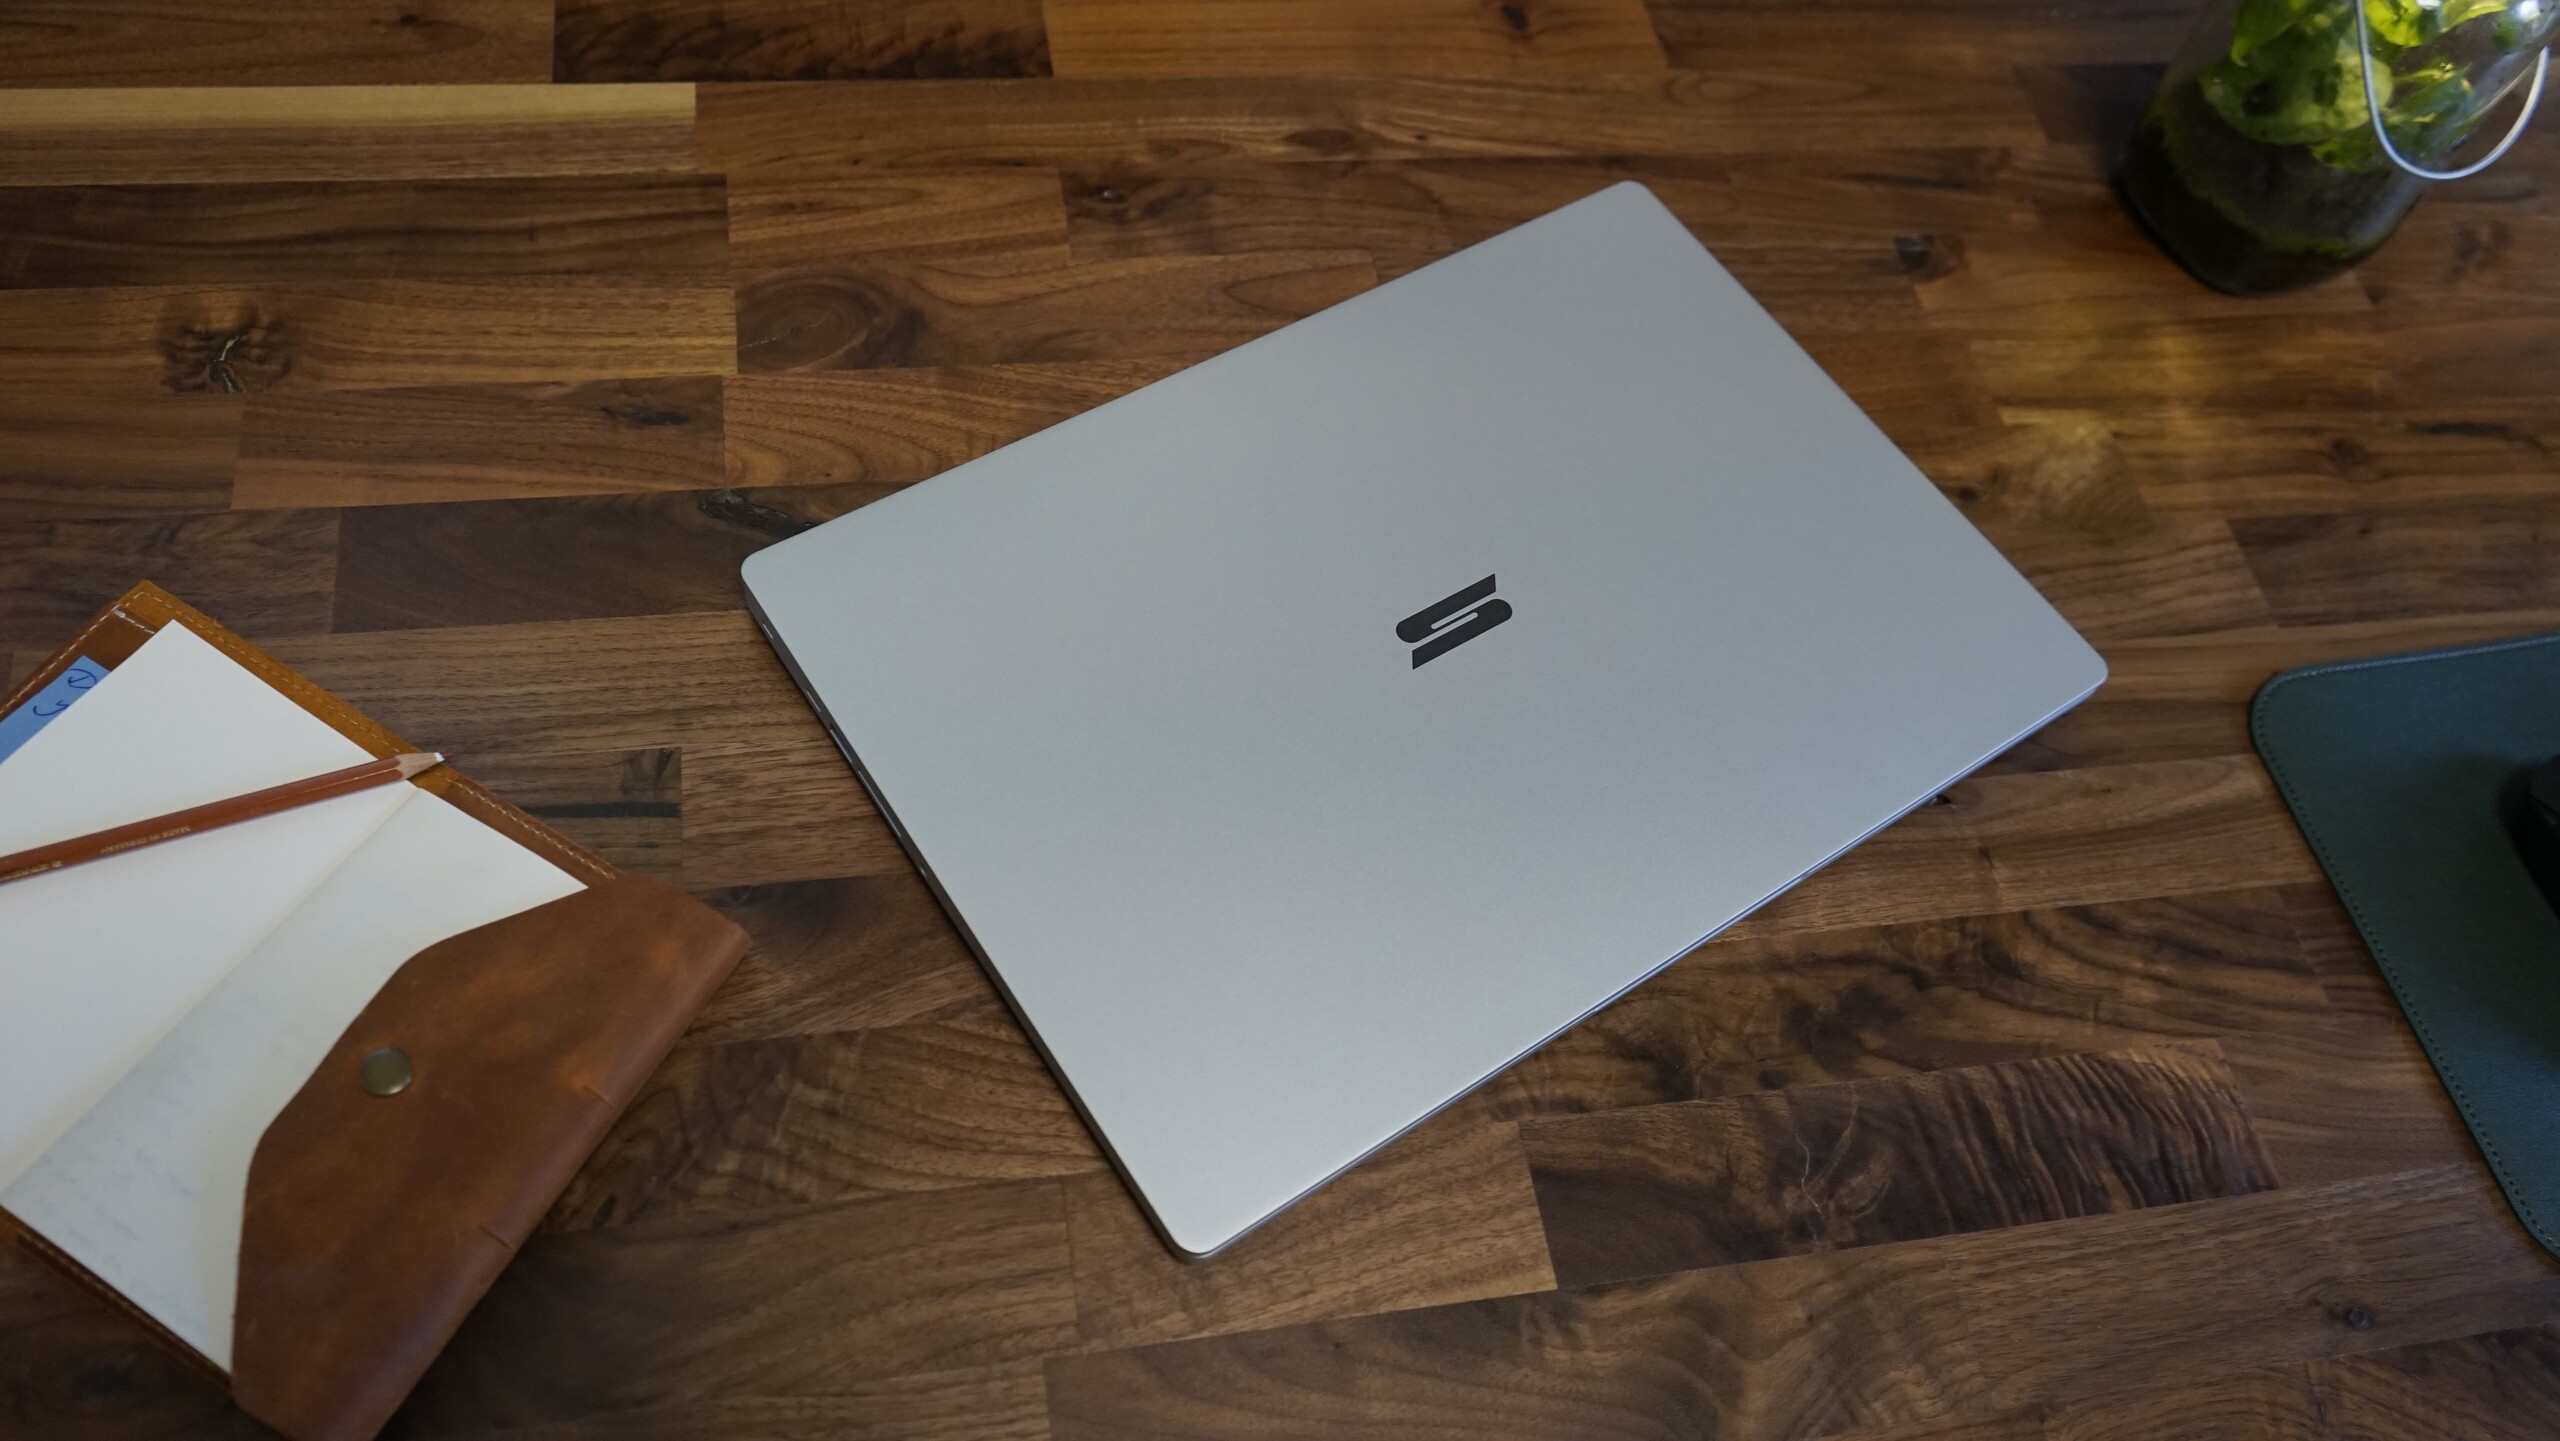
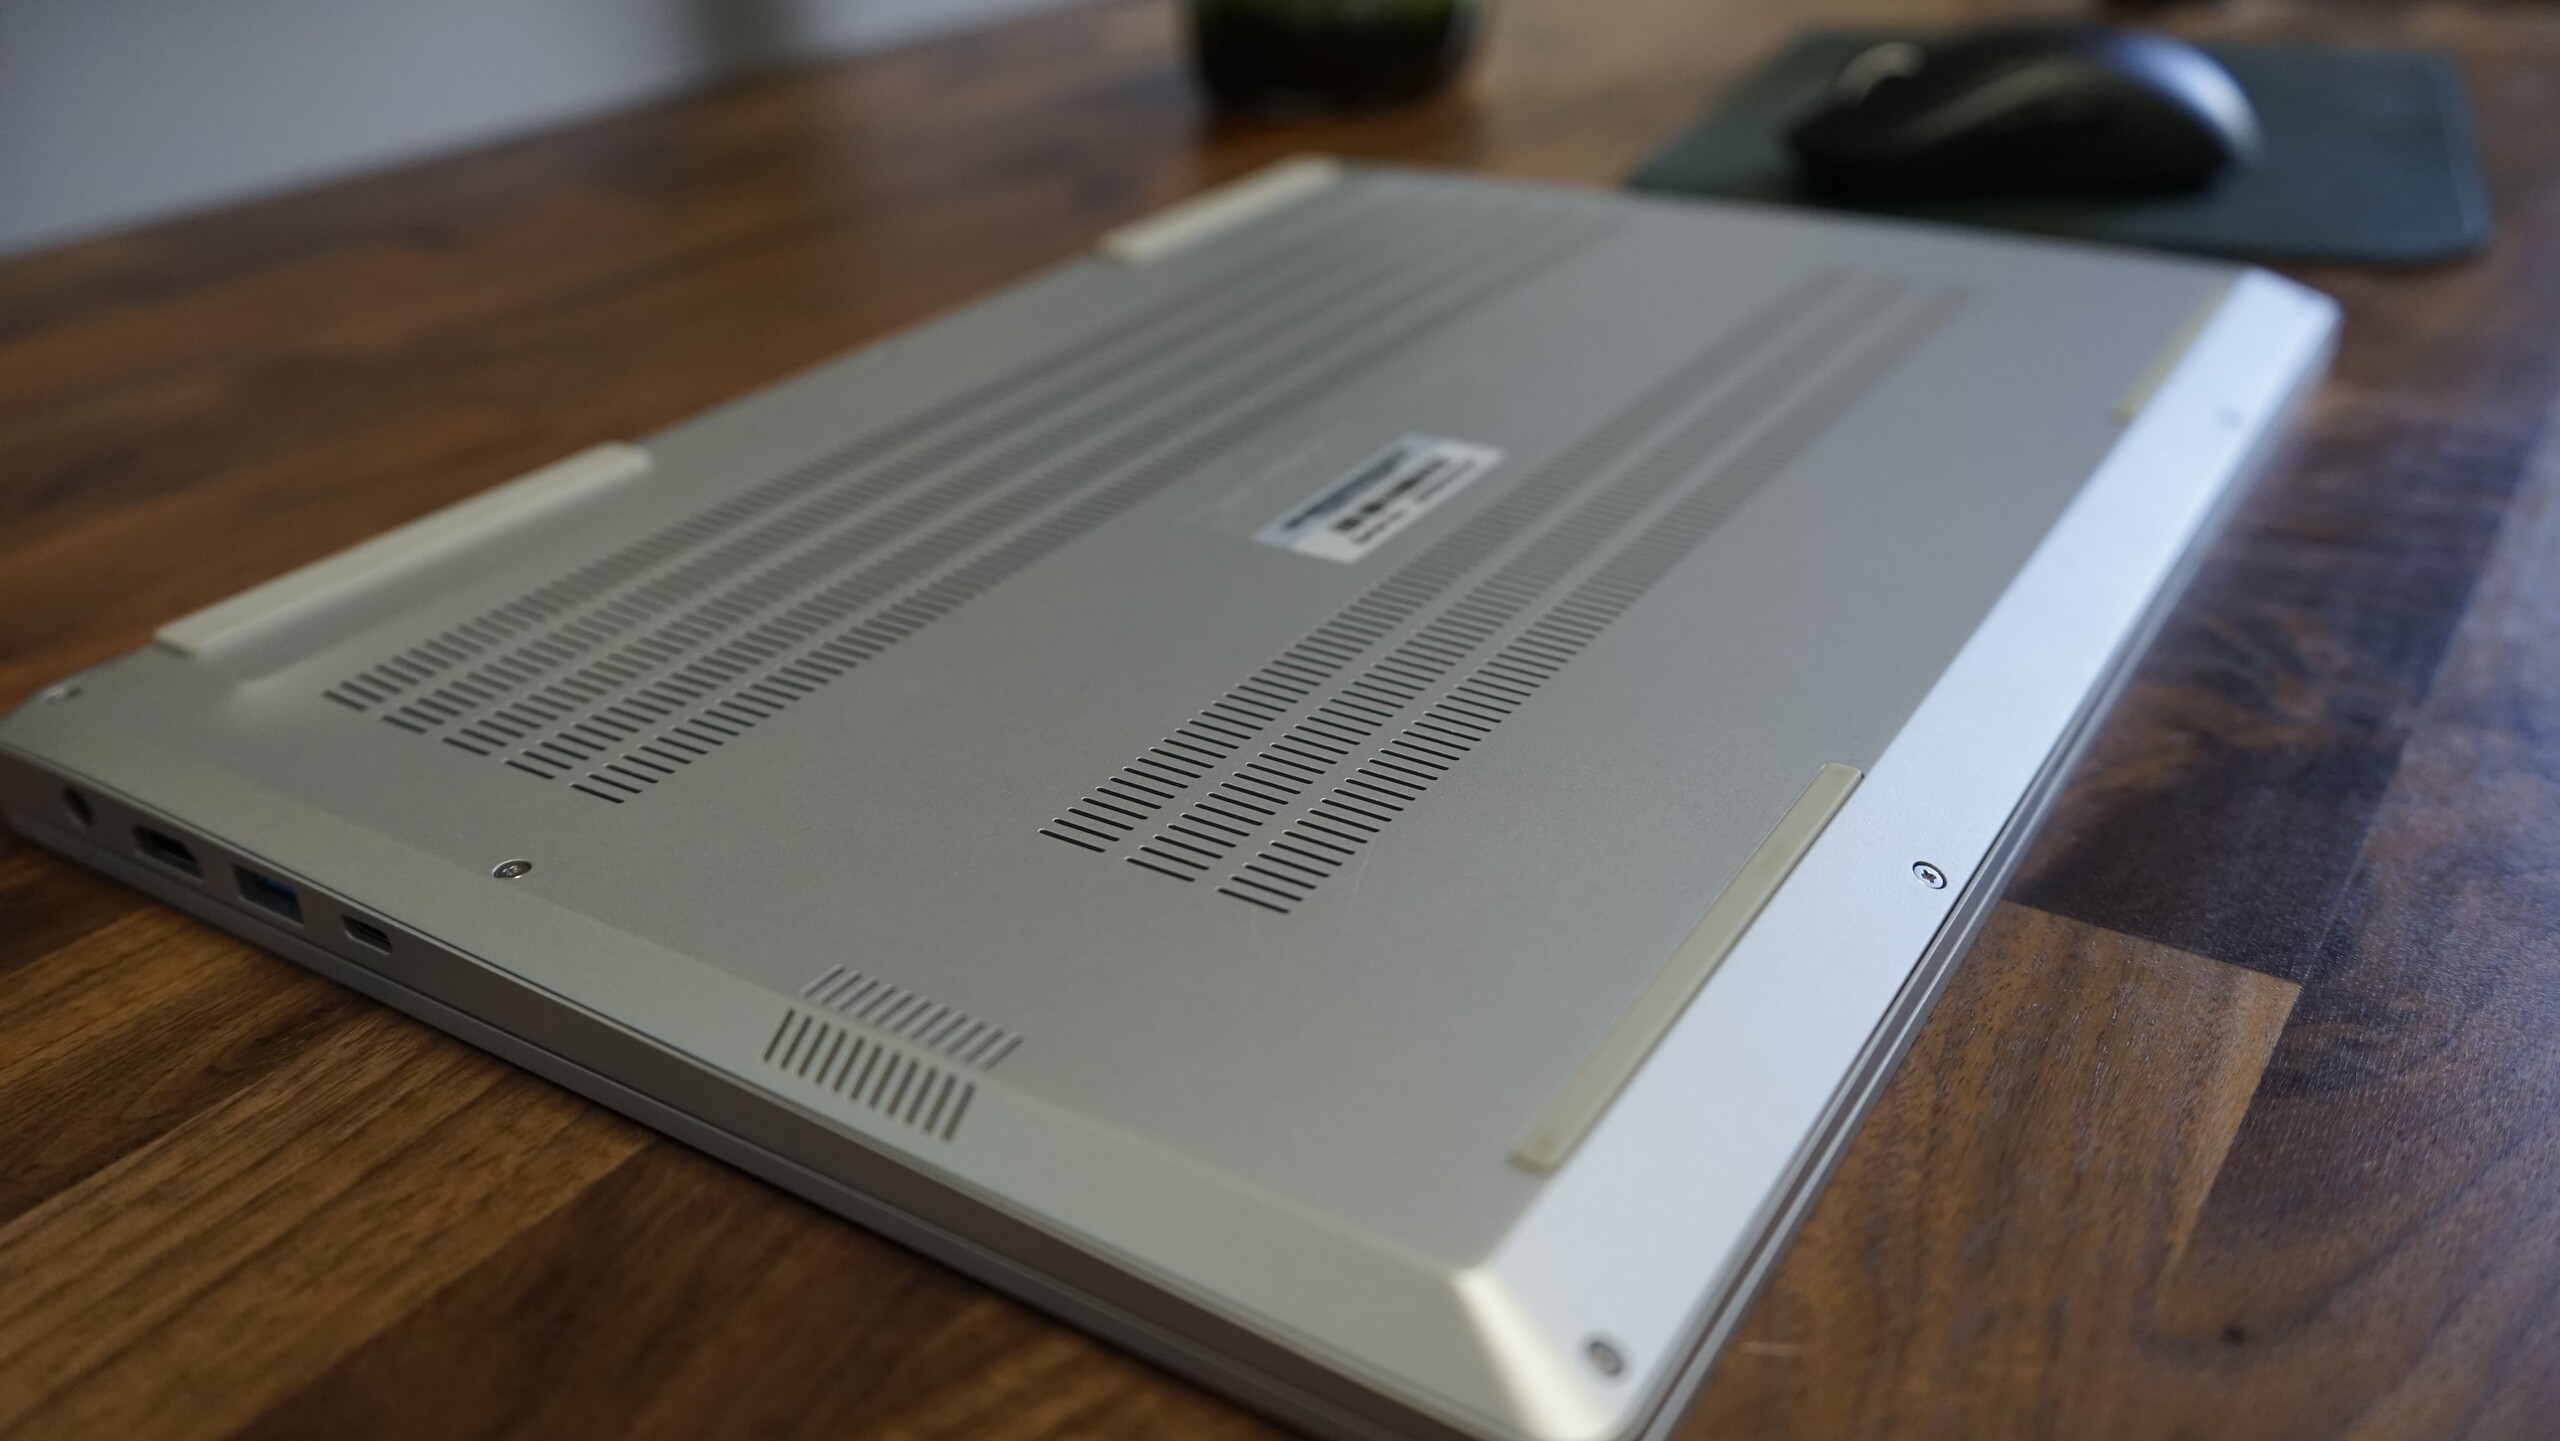
机箱 - 1.5 千克镁合金笔记本电脑
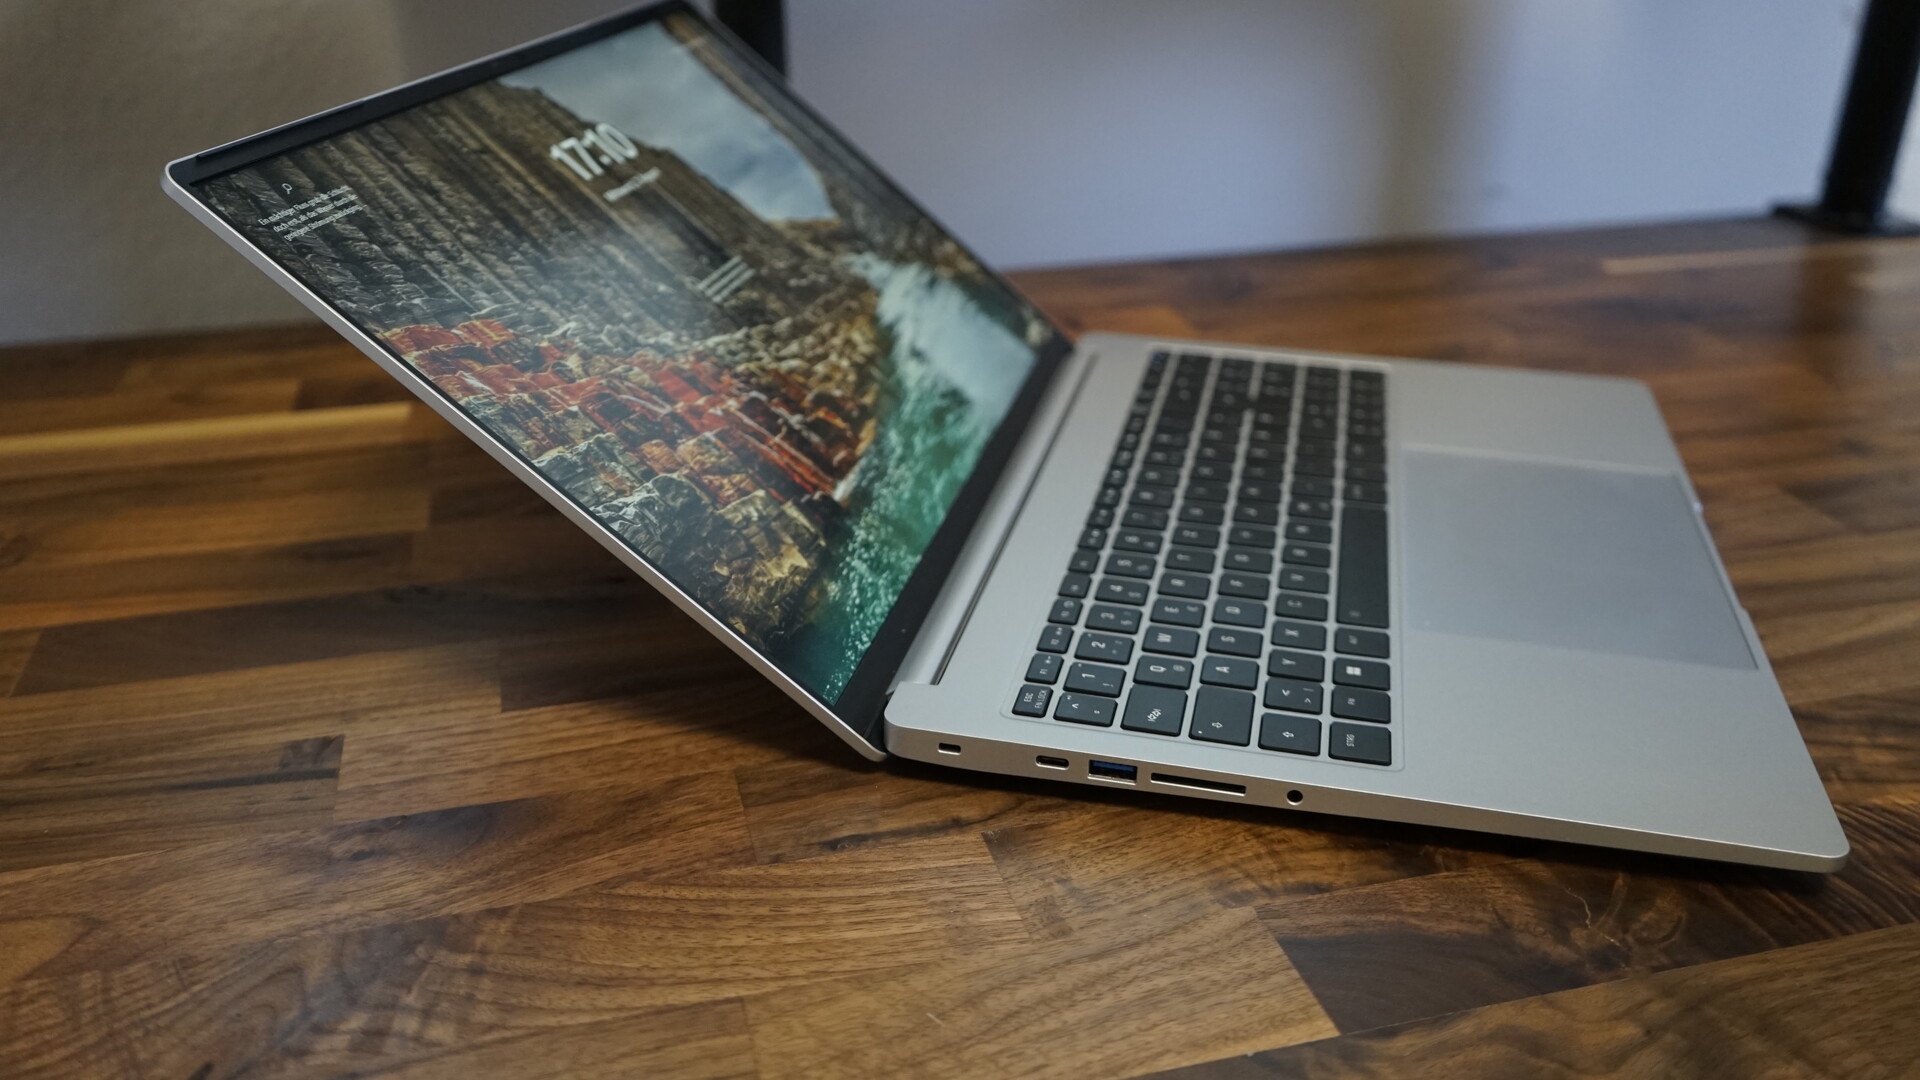
机身与 Vision 16 Pro 完全相同,与前代机型基本保持一致。我们评测的是银色版本,而我们评测的 Vision 16 Pro 是黑色版本。银色版本更加突出,让我们想起了 MacBook Pro 16由于超大的触控板,银色版更显眼,让人联想到 MacBook Pro 16。镁合金机身(底座和屏幕盖)重量仅为 1.5 千克。只有键盘中央有轻微的松动,其他部分都很坚固。铰链不是很牢固,允许屏幕有一定的晃动。
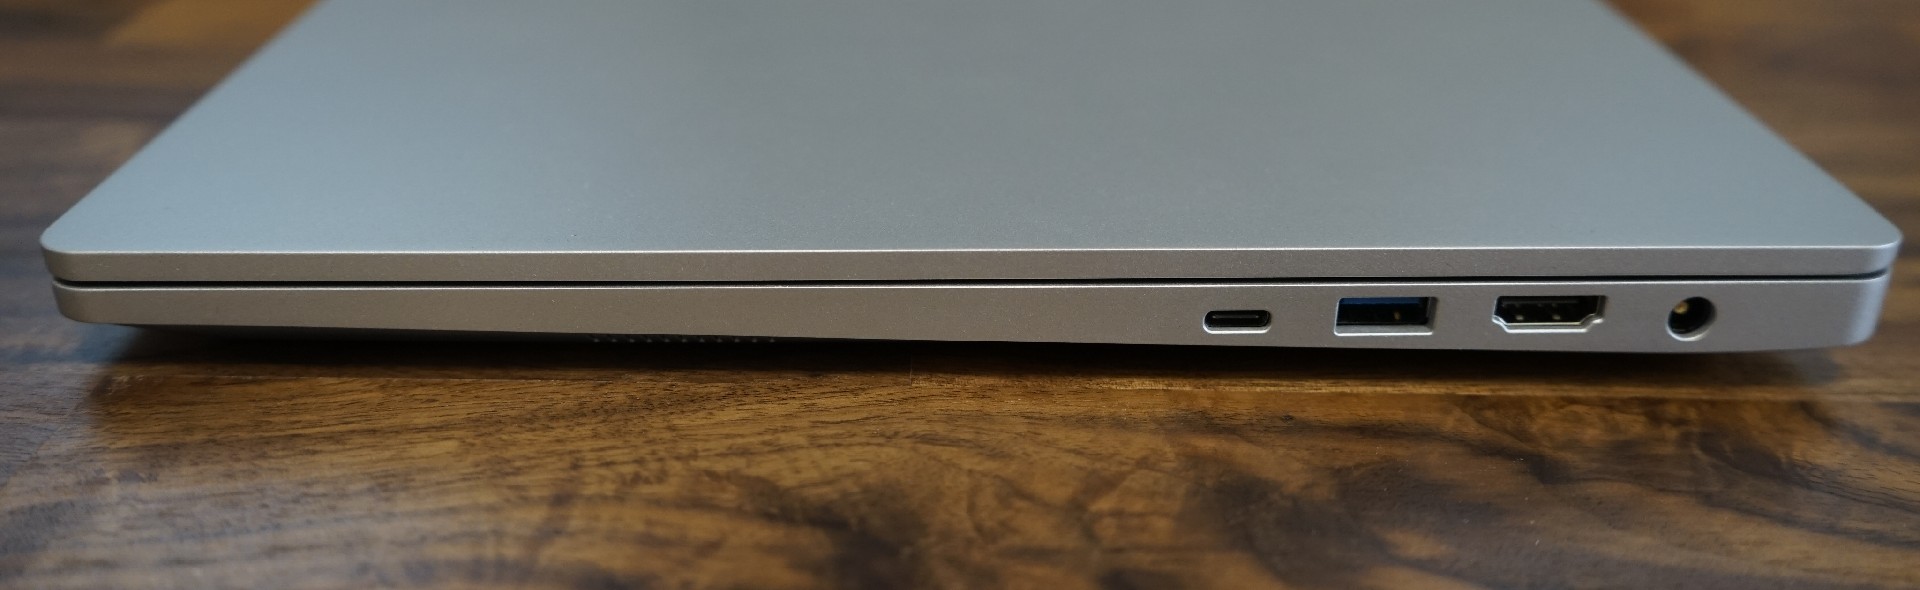
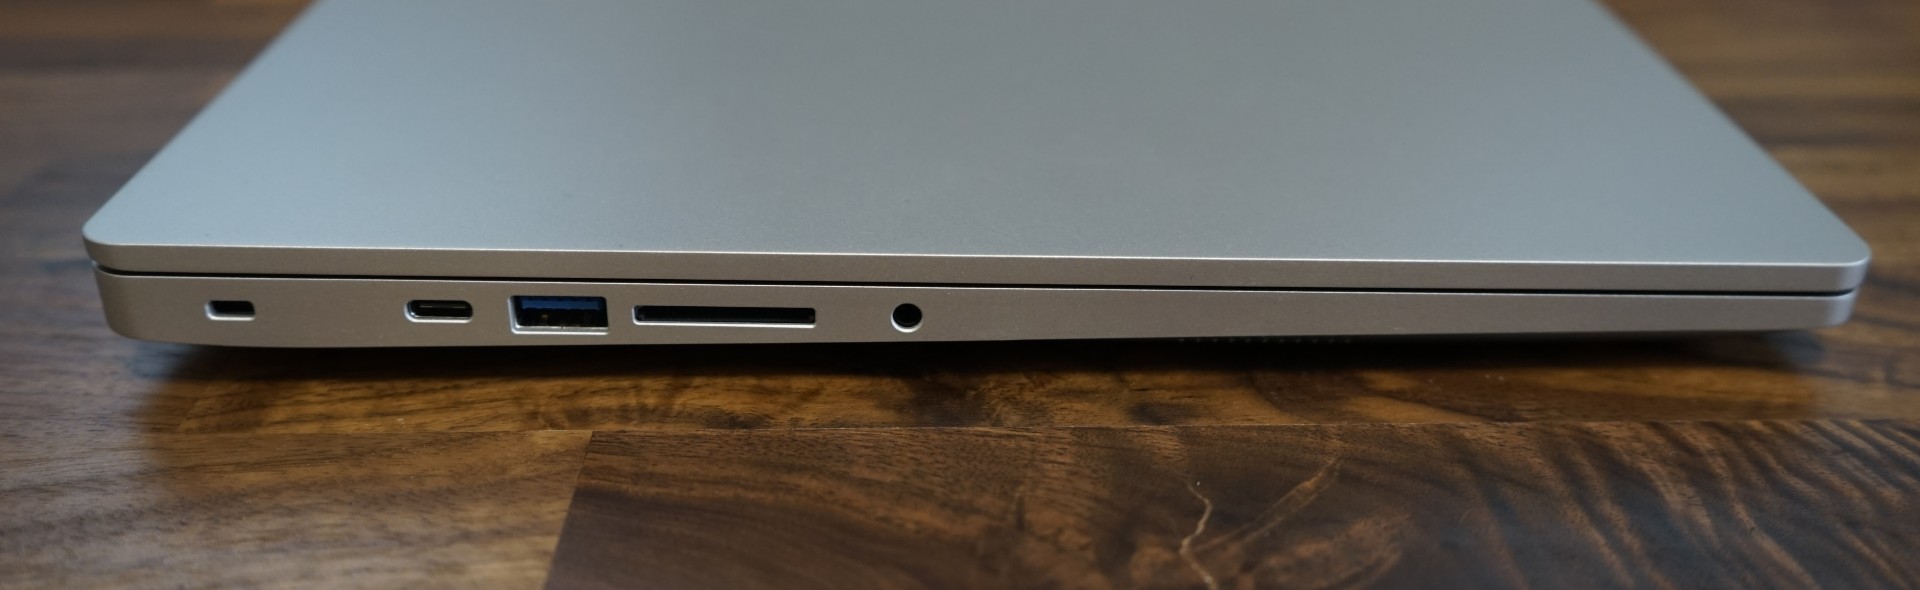
连接性 - Thunderbolt 4、全尺寸 SD 读卡器和多个 USB 端口
端口也与 Vision 16 Pro 相同。由于端口选择得当,这款超极本无需使用加密狗或适配器。与 MacBook Air 相比,Vision 16 基本上拥有大多数人需要的所有端口。左侧有一个 3.5 毫米音频插孔和一个全尺寸 SD 卡插槽。两个 USB A 3.2 Gen 1 端口使鼠标或键盘无需使用加密狗。同样实用的还有 HDMI 端口,不过这只是 HDMI 2.0b,而不是 HDMI 2.1。左侧的 Thunderbolt 4 端口和右侧的 USB C 端口完善了连接选项。由于有专用的专有充电端口,充电时其他端口都不会被占用。唯一缺少的是以太网插孔。
SD 读卡器
申克 Vision 16 配备了 SD 读卡器,但速度相当慢,我们使用参考卡(Angelbird AV Ori V60)测得的写入速度为 22.7 MB/s,读取速度为 27.7 MB/s。对于重度用户来说,外置读卡器可能是更好的选择。对于休闲使用,读卡器就足够了。
| SD Card Reader | |
| average JPG Copy Test (av. of 3 runs) | |
| MSI Stealth 16 Studio A13VG | |
| Dell XPS 15 9530 RTX 4070 (Toshiba Exceria Pro SDXC 64 GB UHS-II) | |
| Average of class Office (19.8 - 198.5, n=22, last 2 years) | |
| Schenker Vision 16 PH6PRX1 (AV Pro V60) | |
| Acer Swift Go SFG16-71 | |
| maximum AS SSD Seq Read Test (1GB) | |
| Dell XPS 15 9530 RTX 4070 (Toshiba Exceria Pro SDXC 64 GB UHS-II) | |
| MSI Stealth 16 Studio A13VG | |
| Average of class Office (27.4 - 249, n=21, last 2 years) | |
| Schenker Vision 16 PH6PRX1 (AV Pro V60) | |
| Acer Swift Go SFG16-71 | |
交流
Vision 16 中的 AX201 WiFi 6 模块在接收数据时效果很好,但在发送数据时却显示出弱点。不过,体验可能会有所不同,因为几乎相同的申克 Vision 16 Pro 中的相同 WLAN 模块能提供更好的效果。
网络摄像头
申克 Vision 16 的 FHD 网络摄像头可以拍摄出合格的照片。只要光线条件不差,它足以满足视频会议的要求。由于集成了红外传感器,200 万像素的网络摄像头可以通过 Windows Hello 进行生物识别登录。


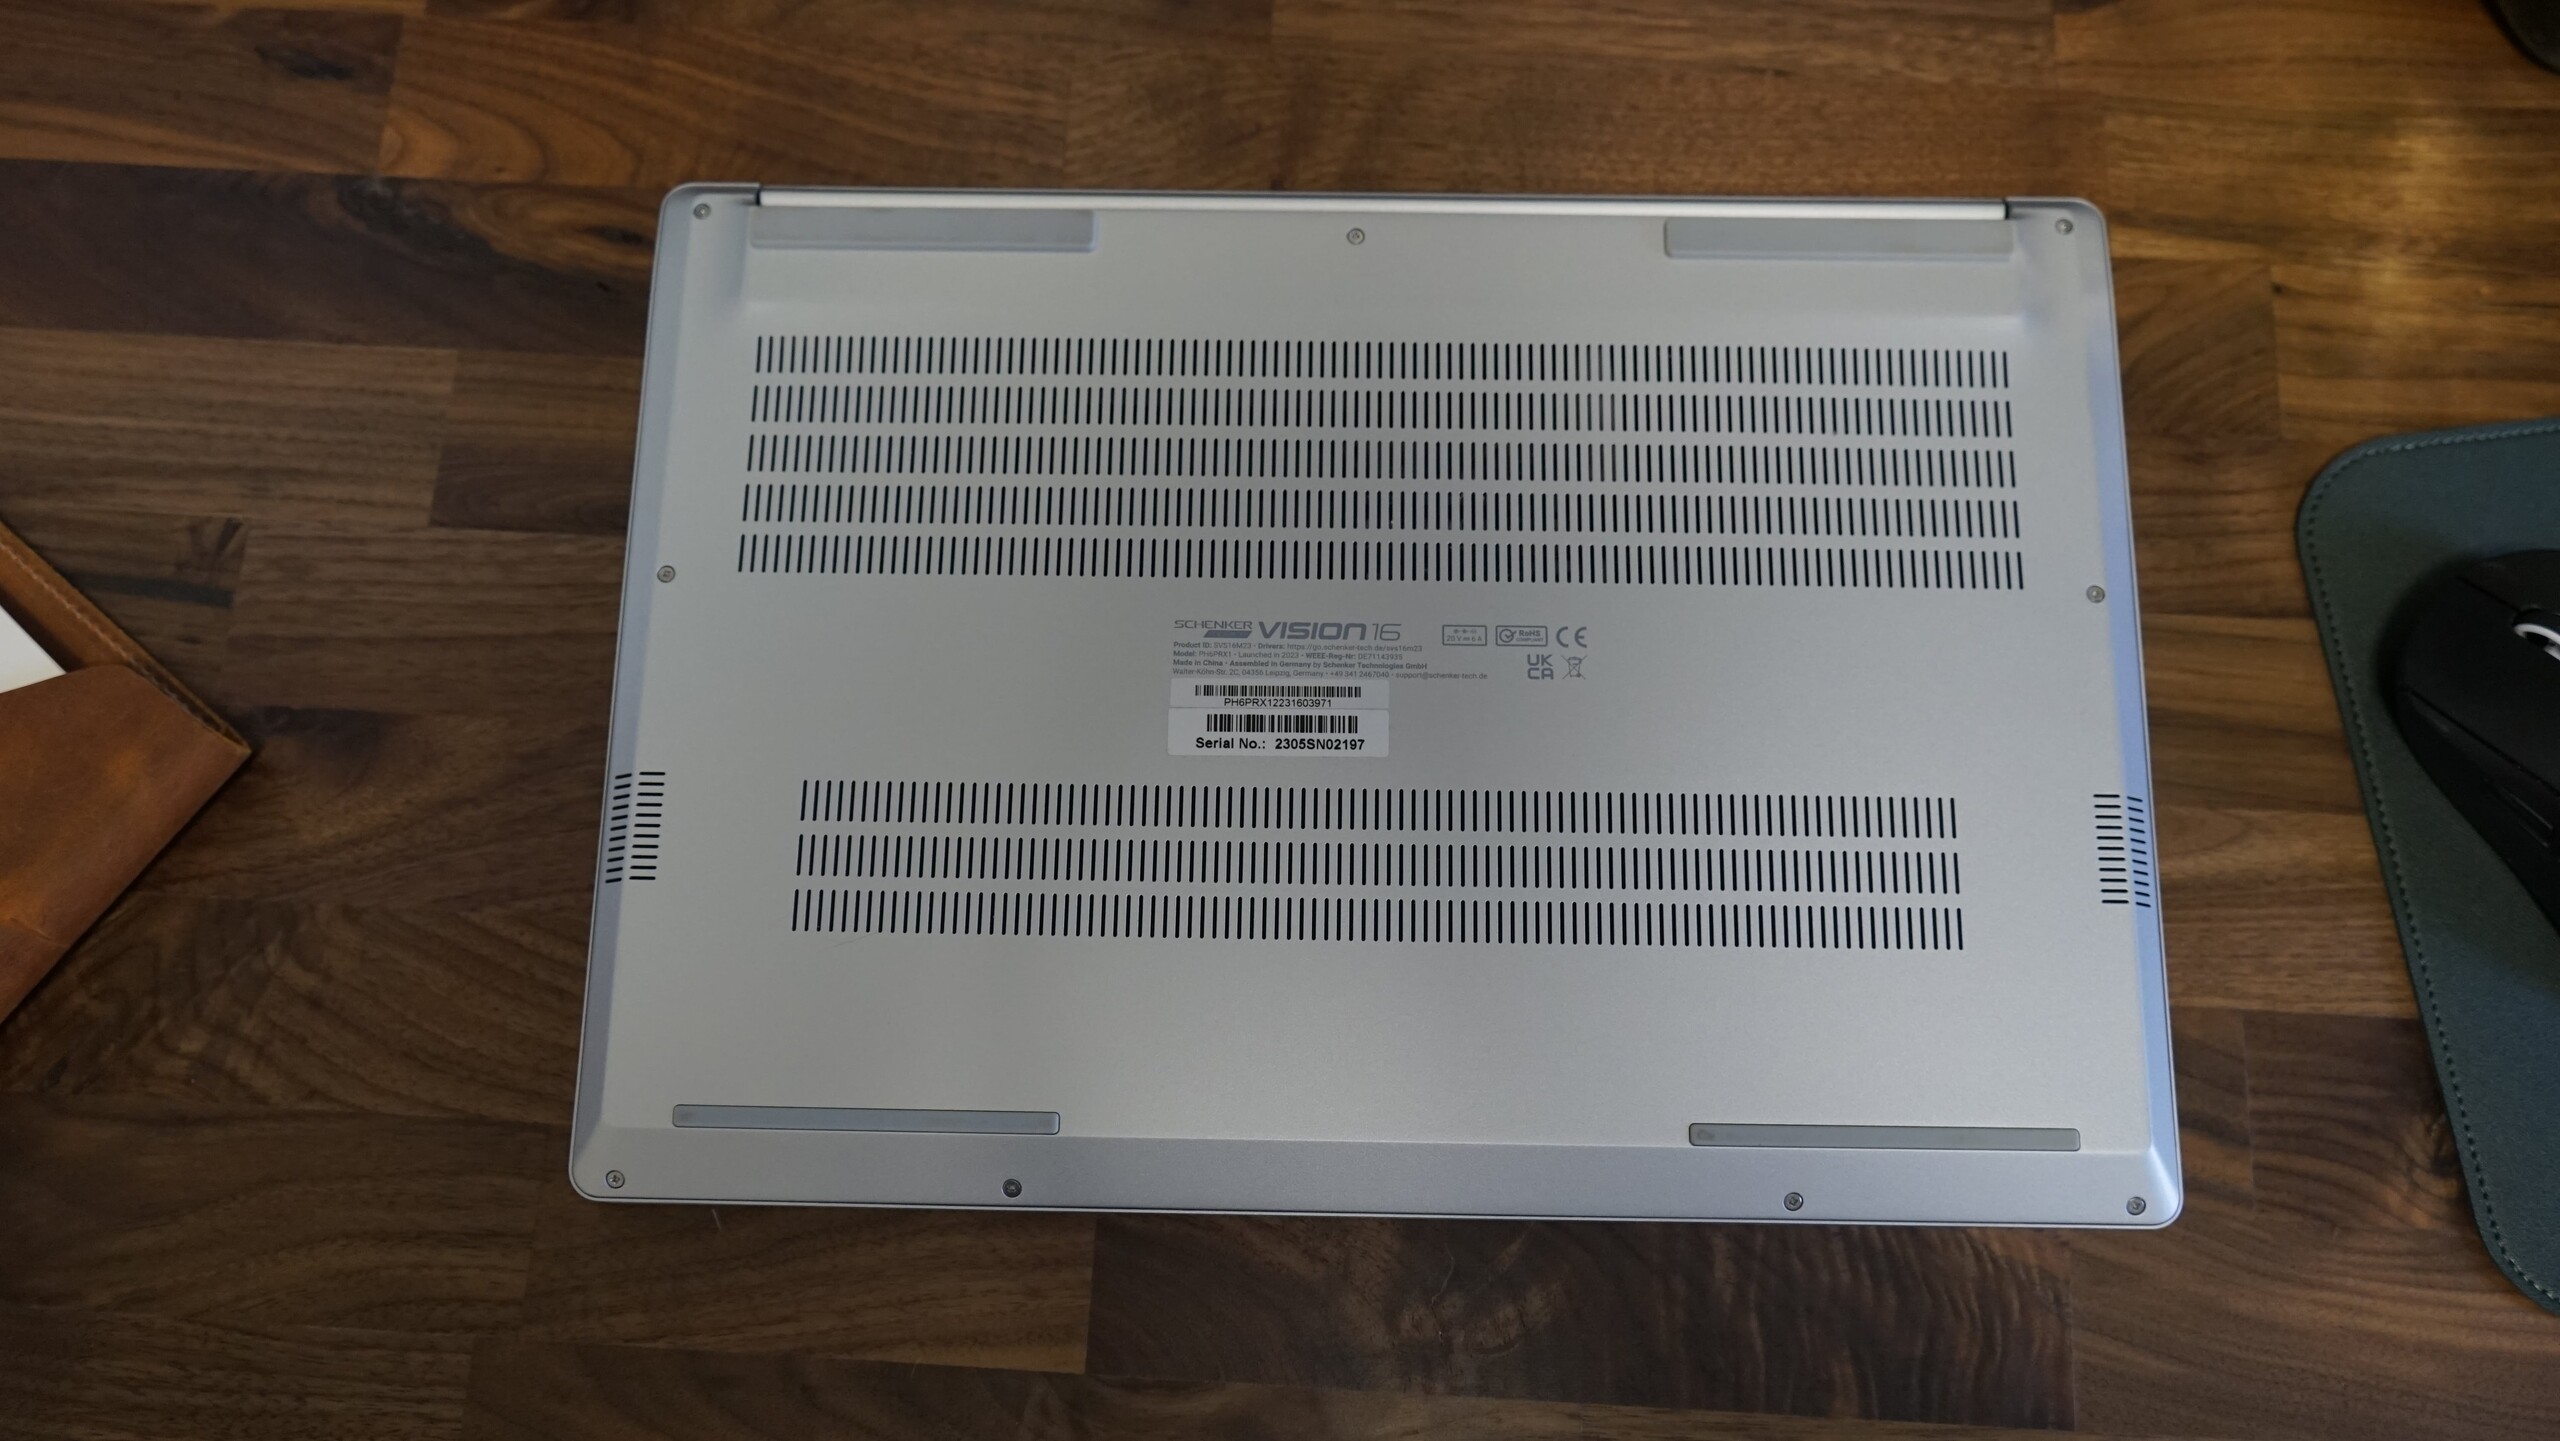
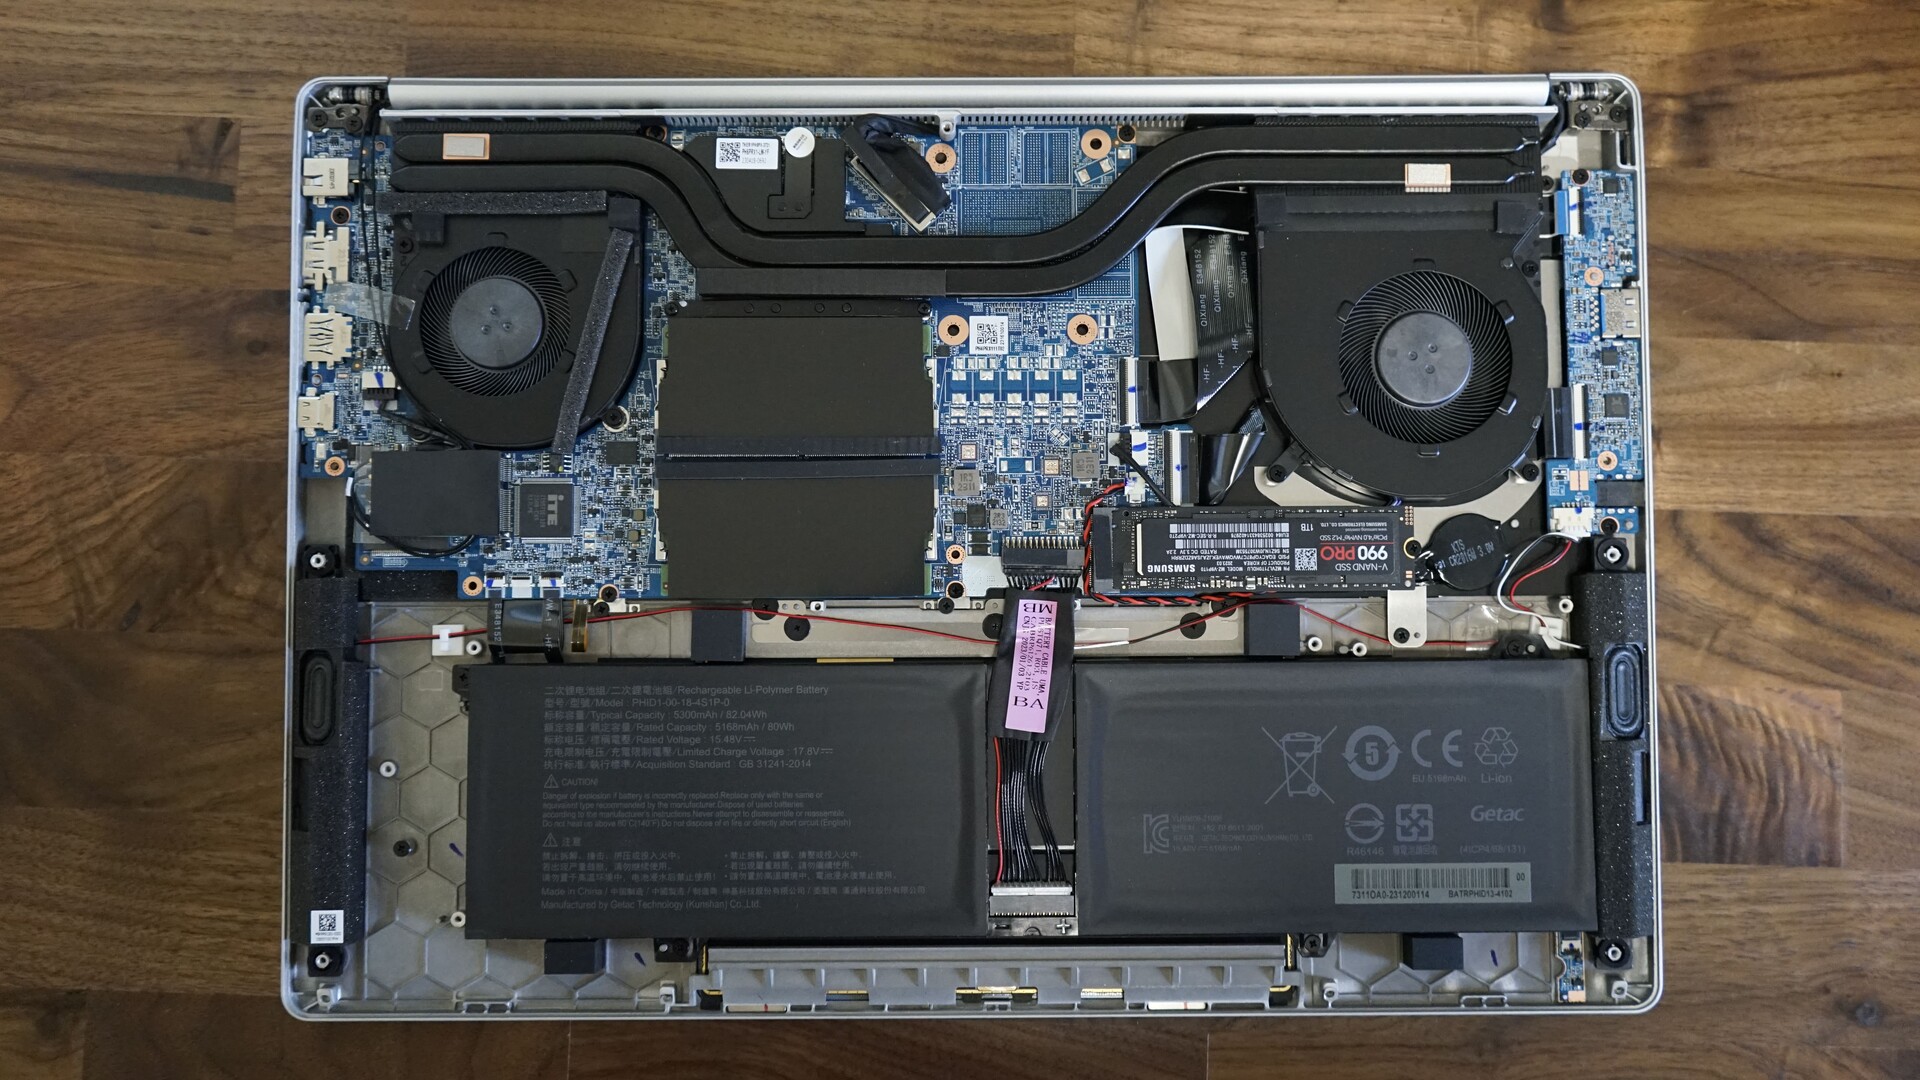
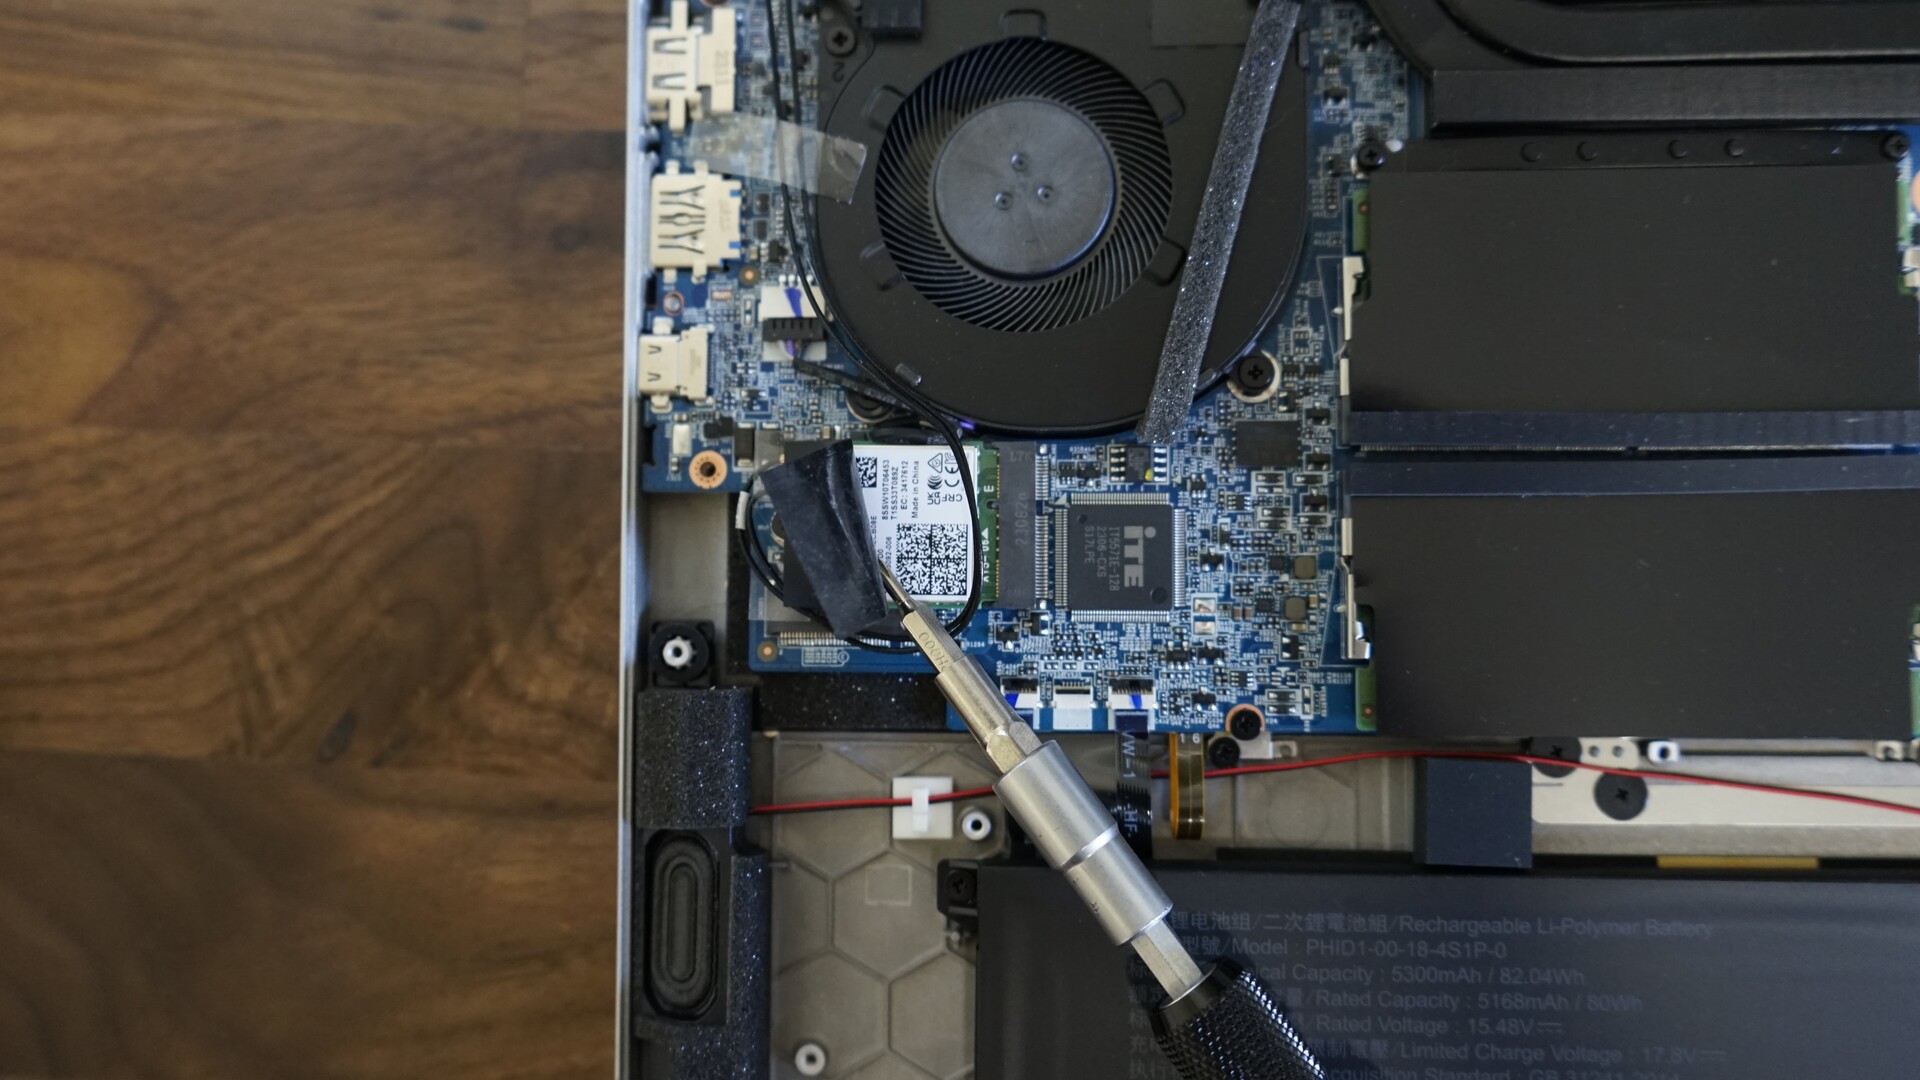
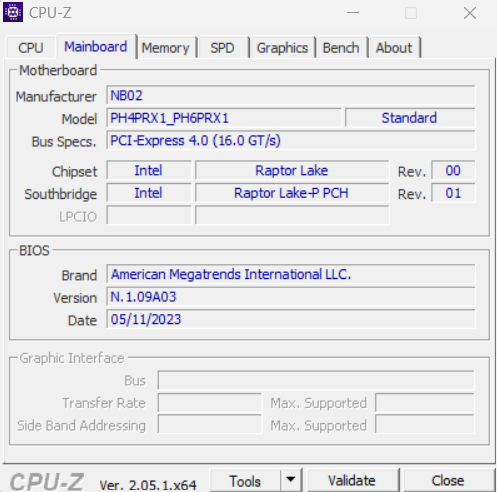
维护
申克 Vision 16 的底盖共用九颗螺丝固定。正面的四颗螺丝和背面中间的螺丝比其他螺丝短。除了缺少 GPU、热管数量较少和右侧风扇较小之外,内部空间与 Vision 16 Pro 非常相似。最后一个方面将与我们的性能测量相关。
Vision 16 用户可以更换内存模块、WiFi 模块、M.2 固态硬盘和电池。此外,还有一个免费的第二个 M.2 固态硬盘插槽。
保修
全球国际货运提供 24 个月的基本保修服务,其中包括取货和退货服务以及前六个月的快速维修服务。您还可以选择 36 个月的保修期,并通过各种保修套餐(如整个保修期内的快速维修)来扩展保修期。
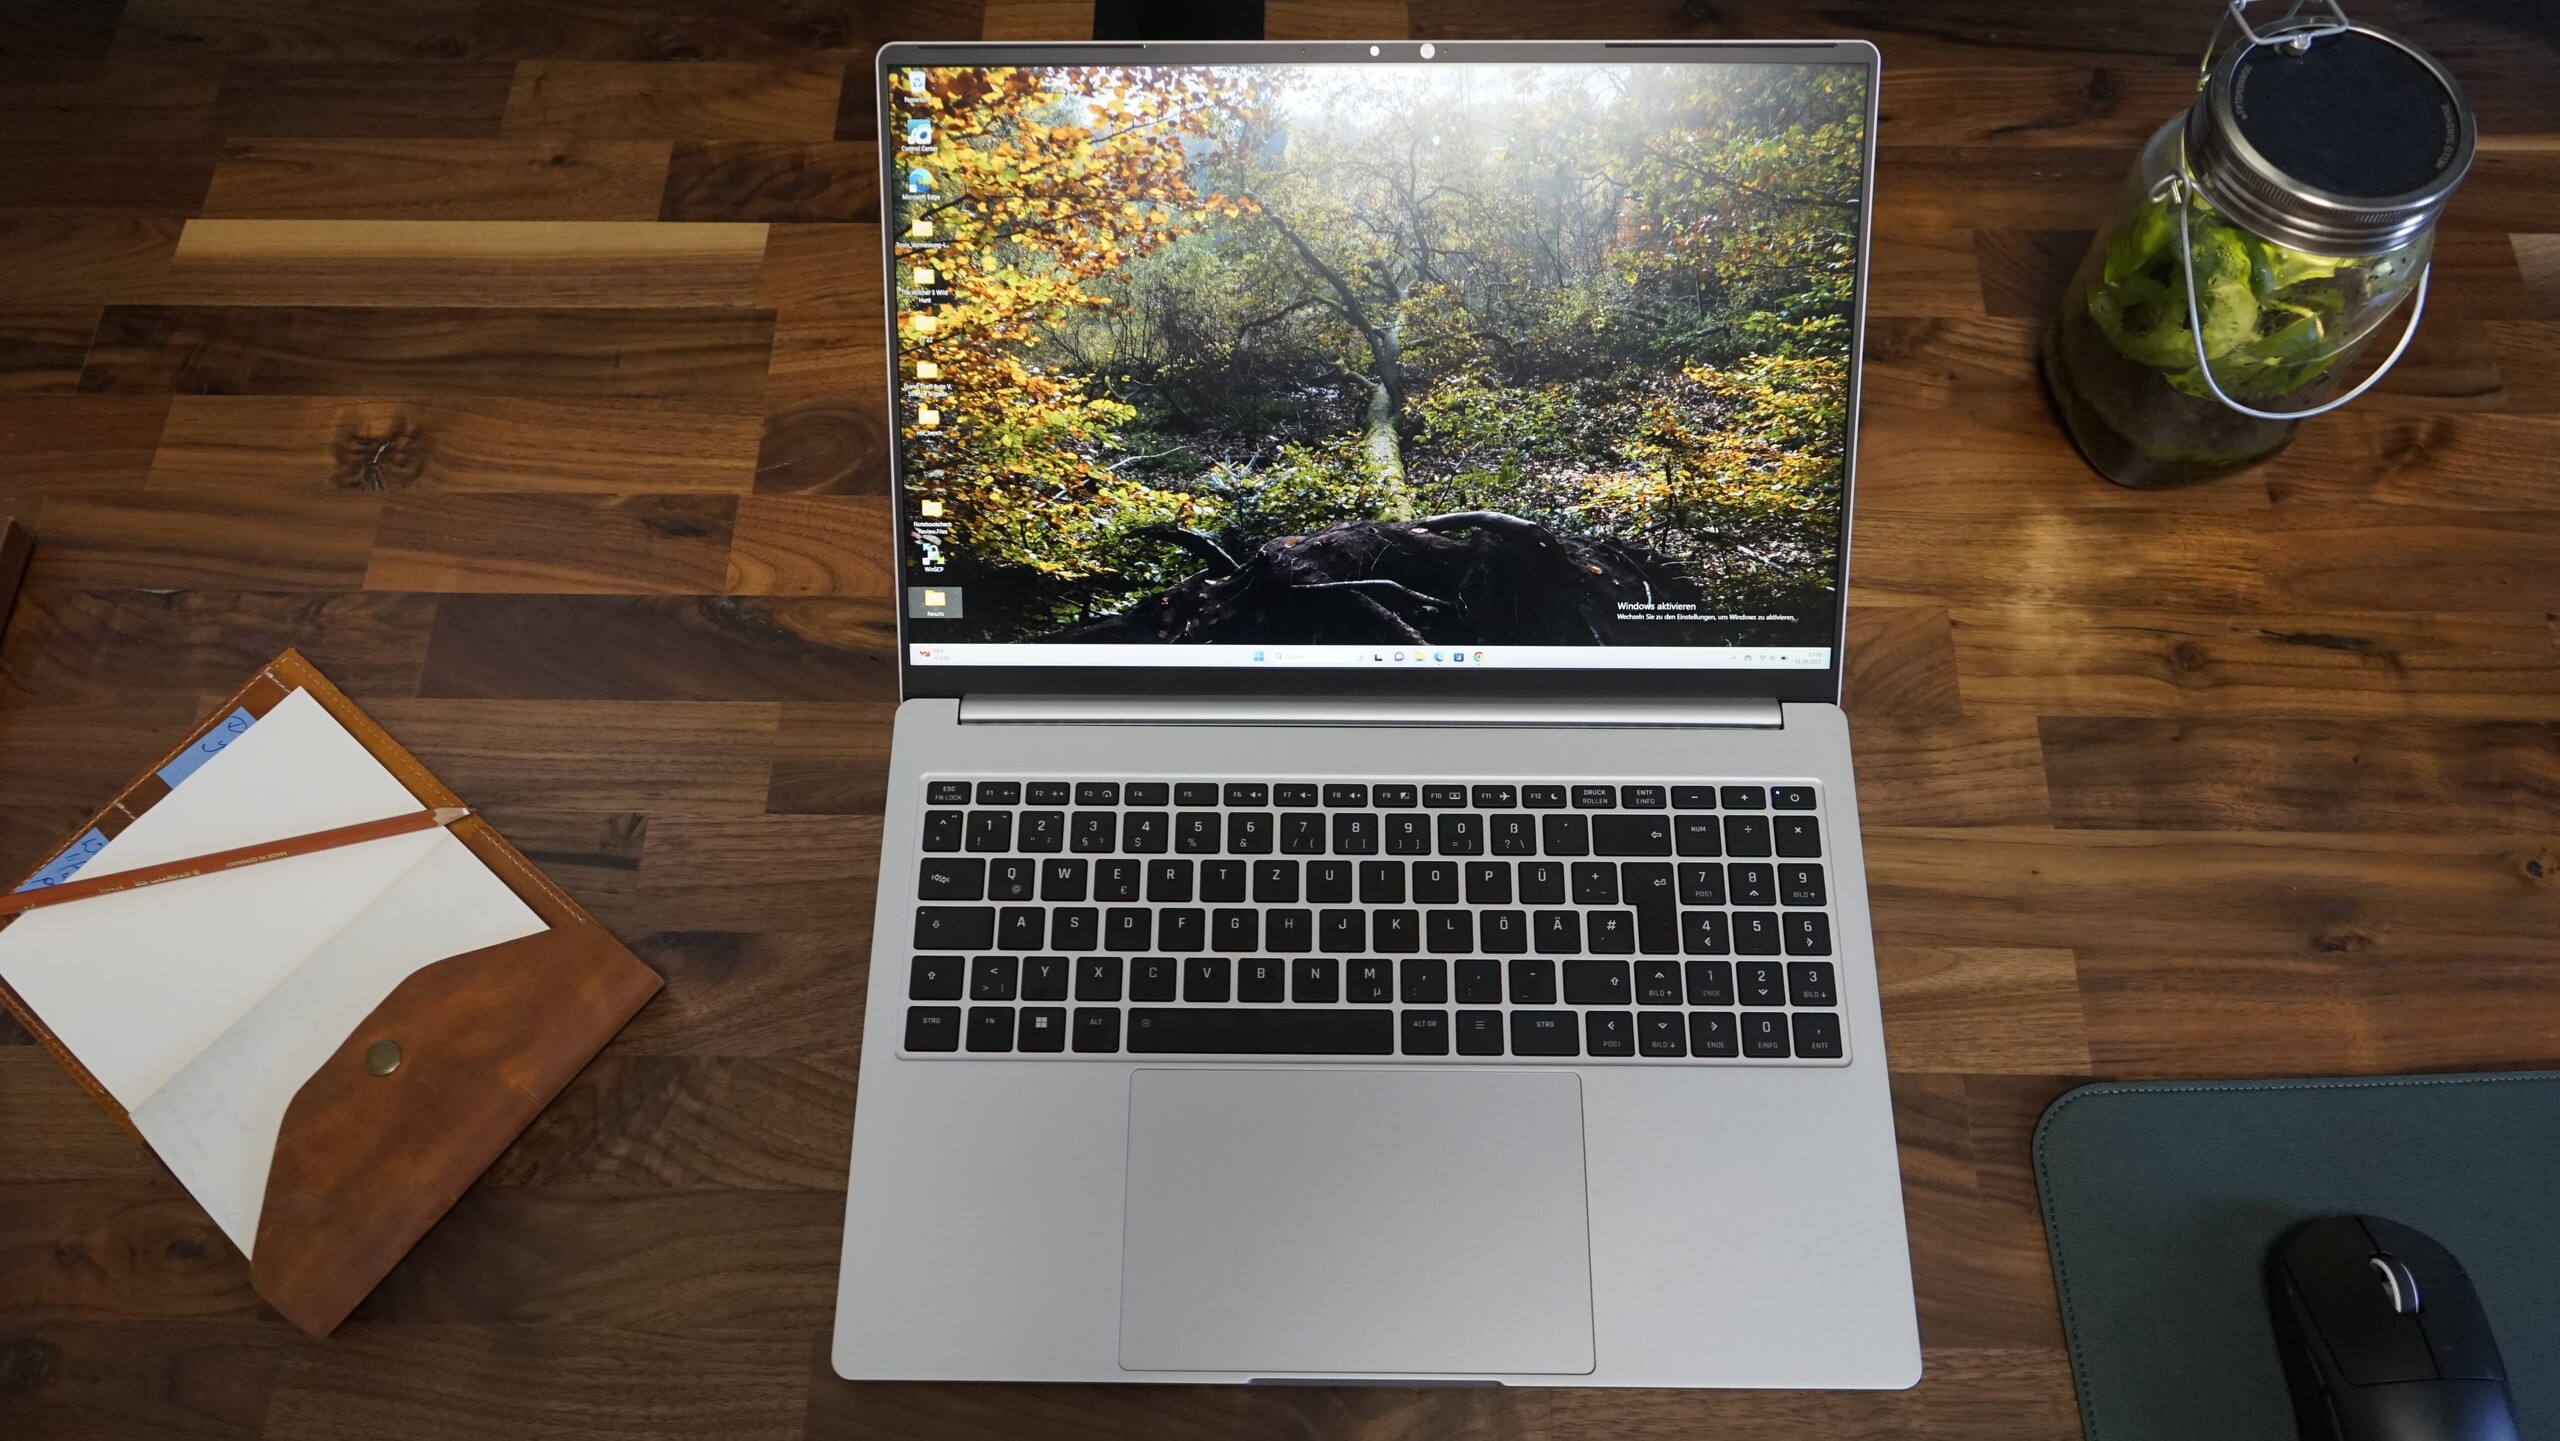
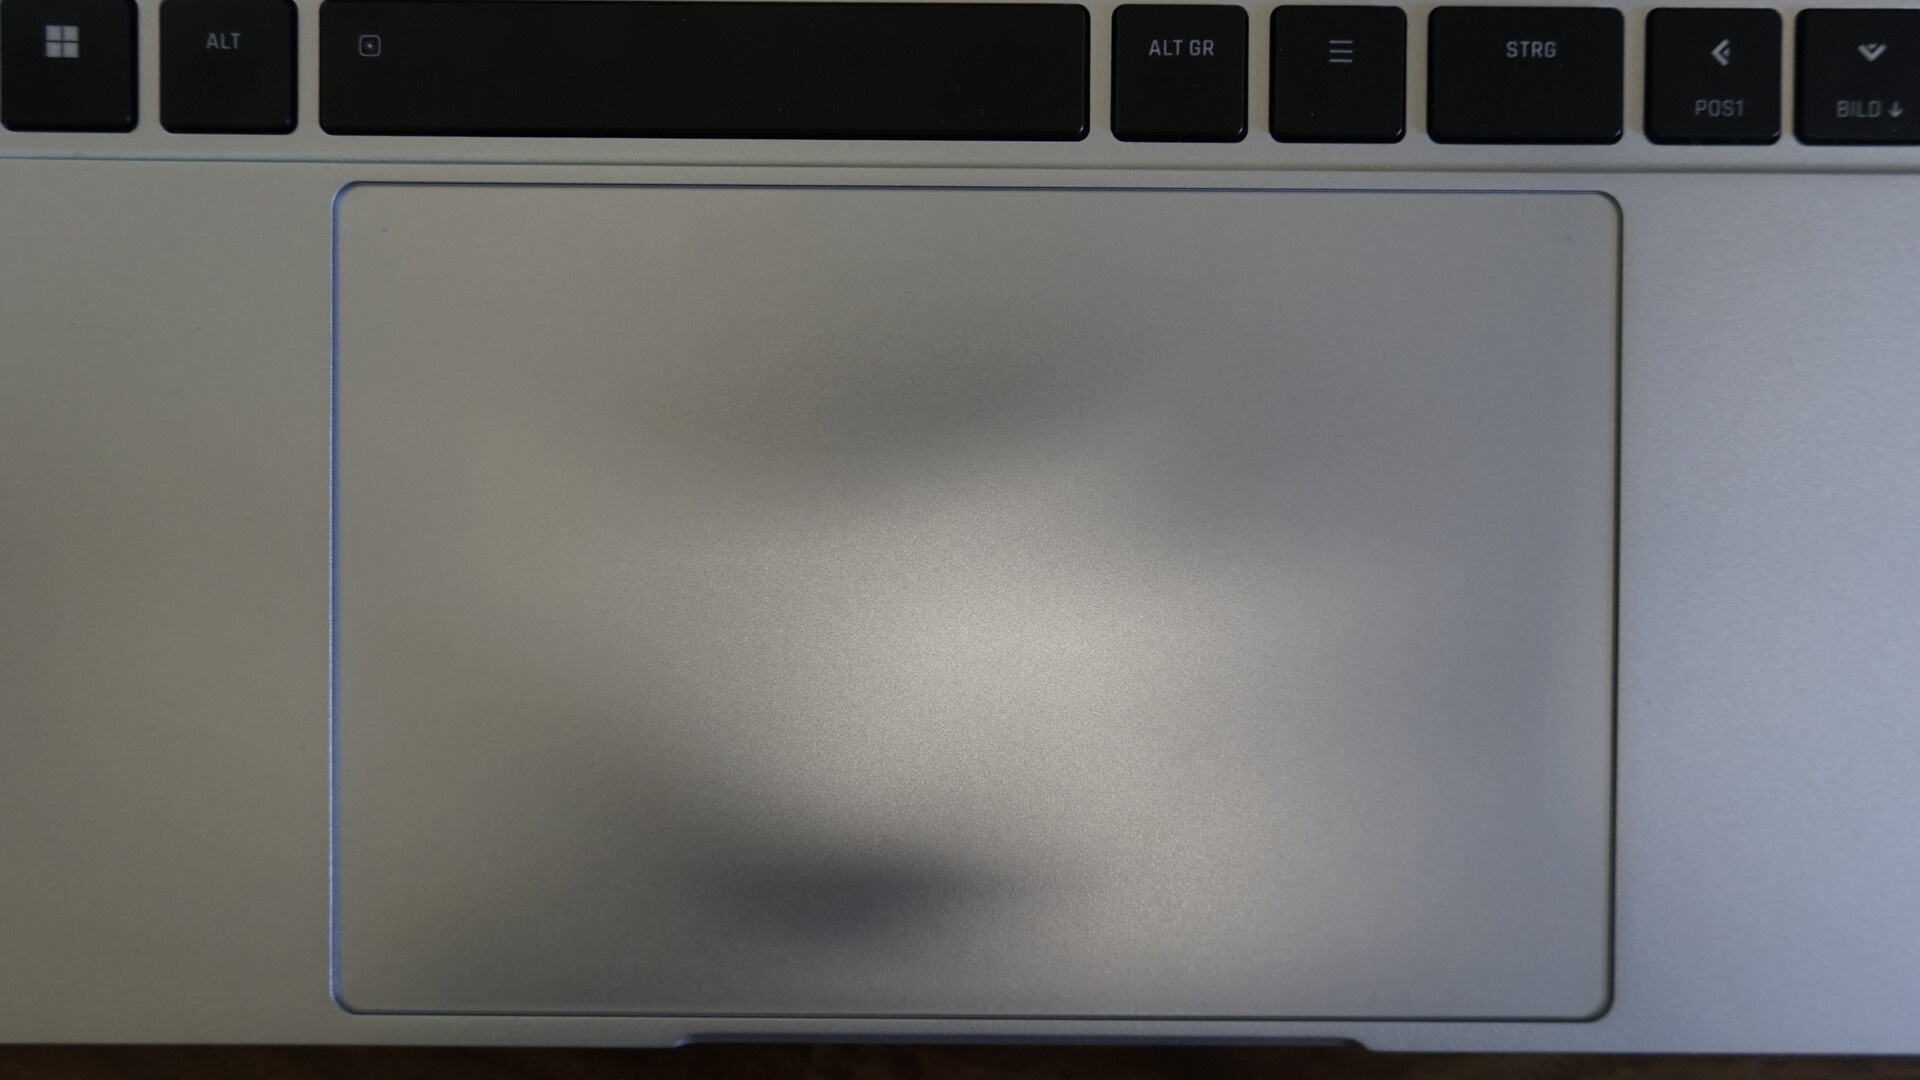
输入设备--巨大的玻璃点击板,但键盘布局不够理想。
Vision 16 的输入设备非常可靠。触摸板非常大且精确,但键盘方面还存在一些不足。
键盘
键盘上有一个带有全尺寸方向键的专用数字键区,缩短了右侧 Shift 键的长度,取代了数字键区的额外回车键。该数字键区是一个相当压缩的版本,不太适合快速输入数字。这不禁让人产生疑问,为什么申克要加入数字键区,因为整个键盘都因此向左移动了。由于键盘左移,右边的 Shift 键变短,打字受到了负面影响,需要较长的时间来适应键盘。
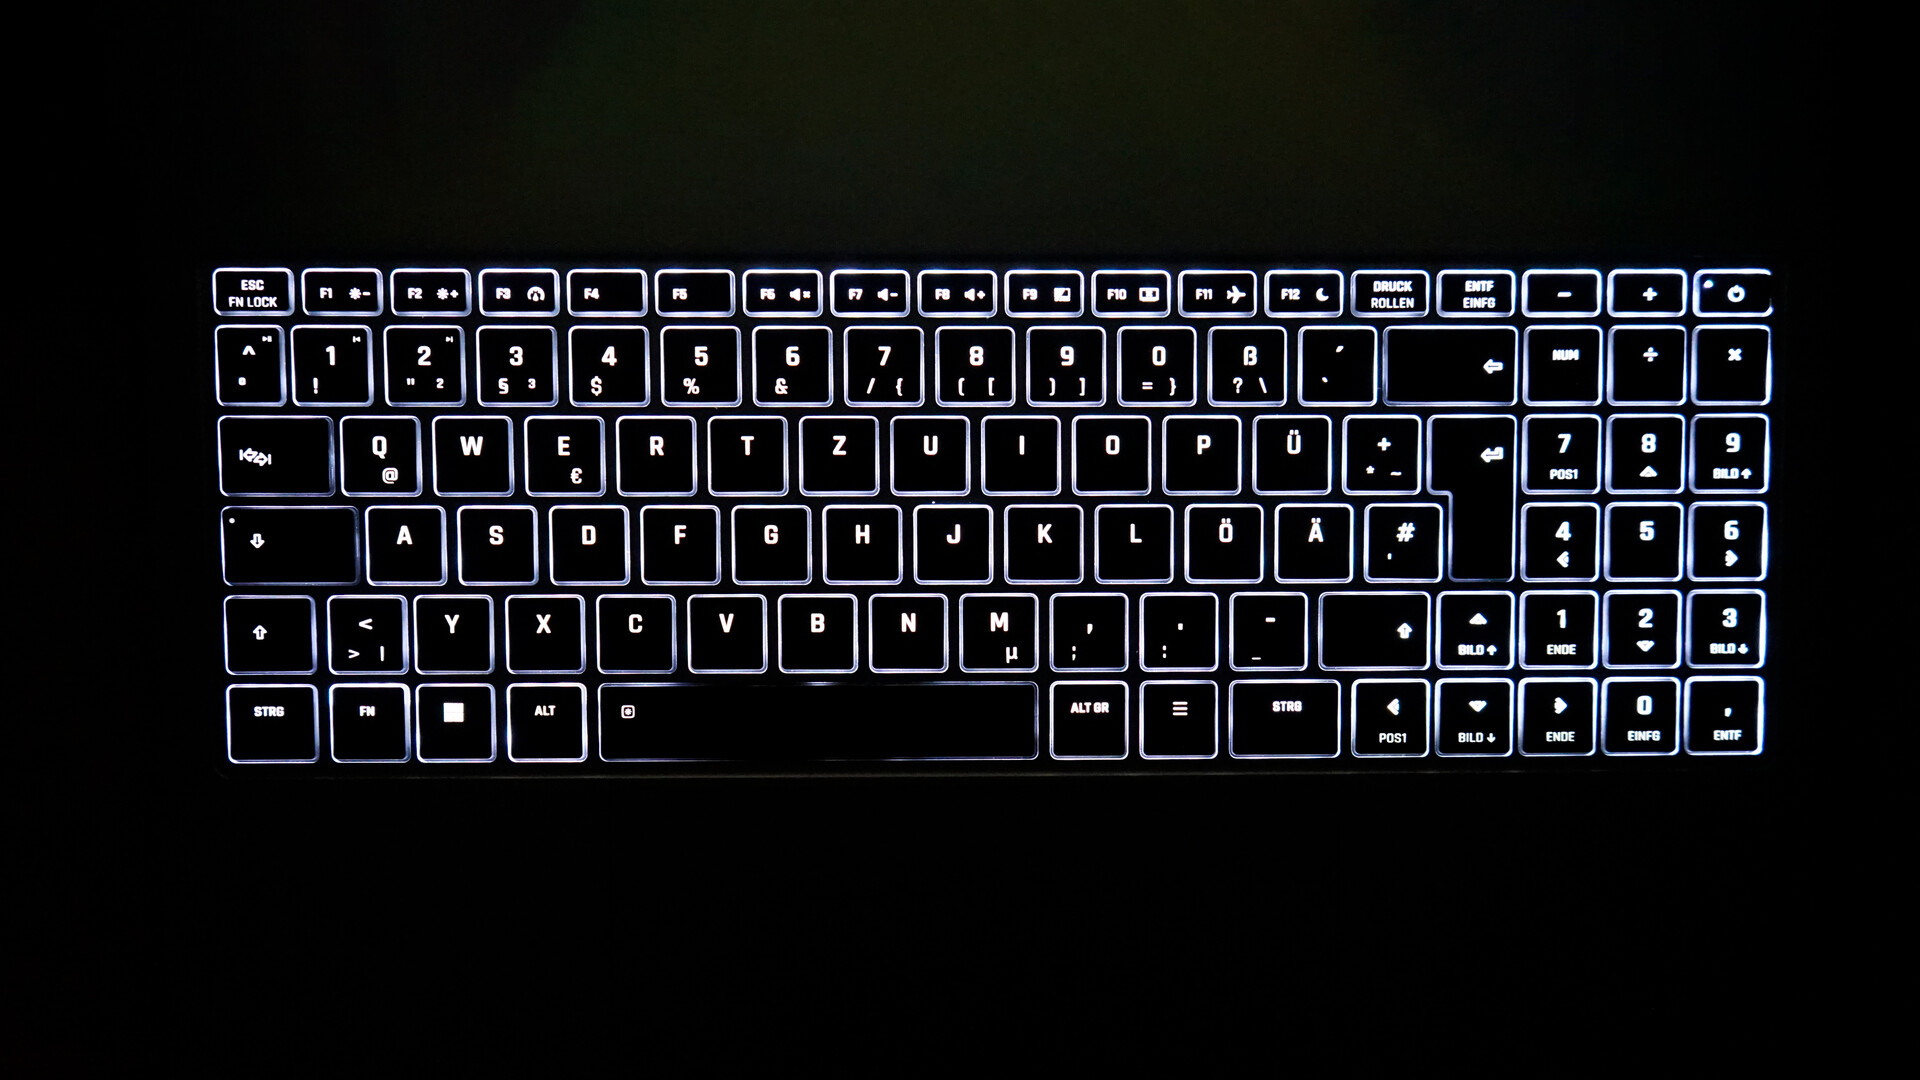
就按键本身而言,它提供了非常良好和精确的键入感,键入噪音不大,但很扎实。键盘有两级背光亮度,所有按键光线均匀。
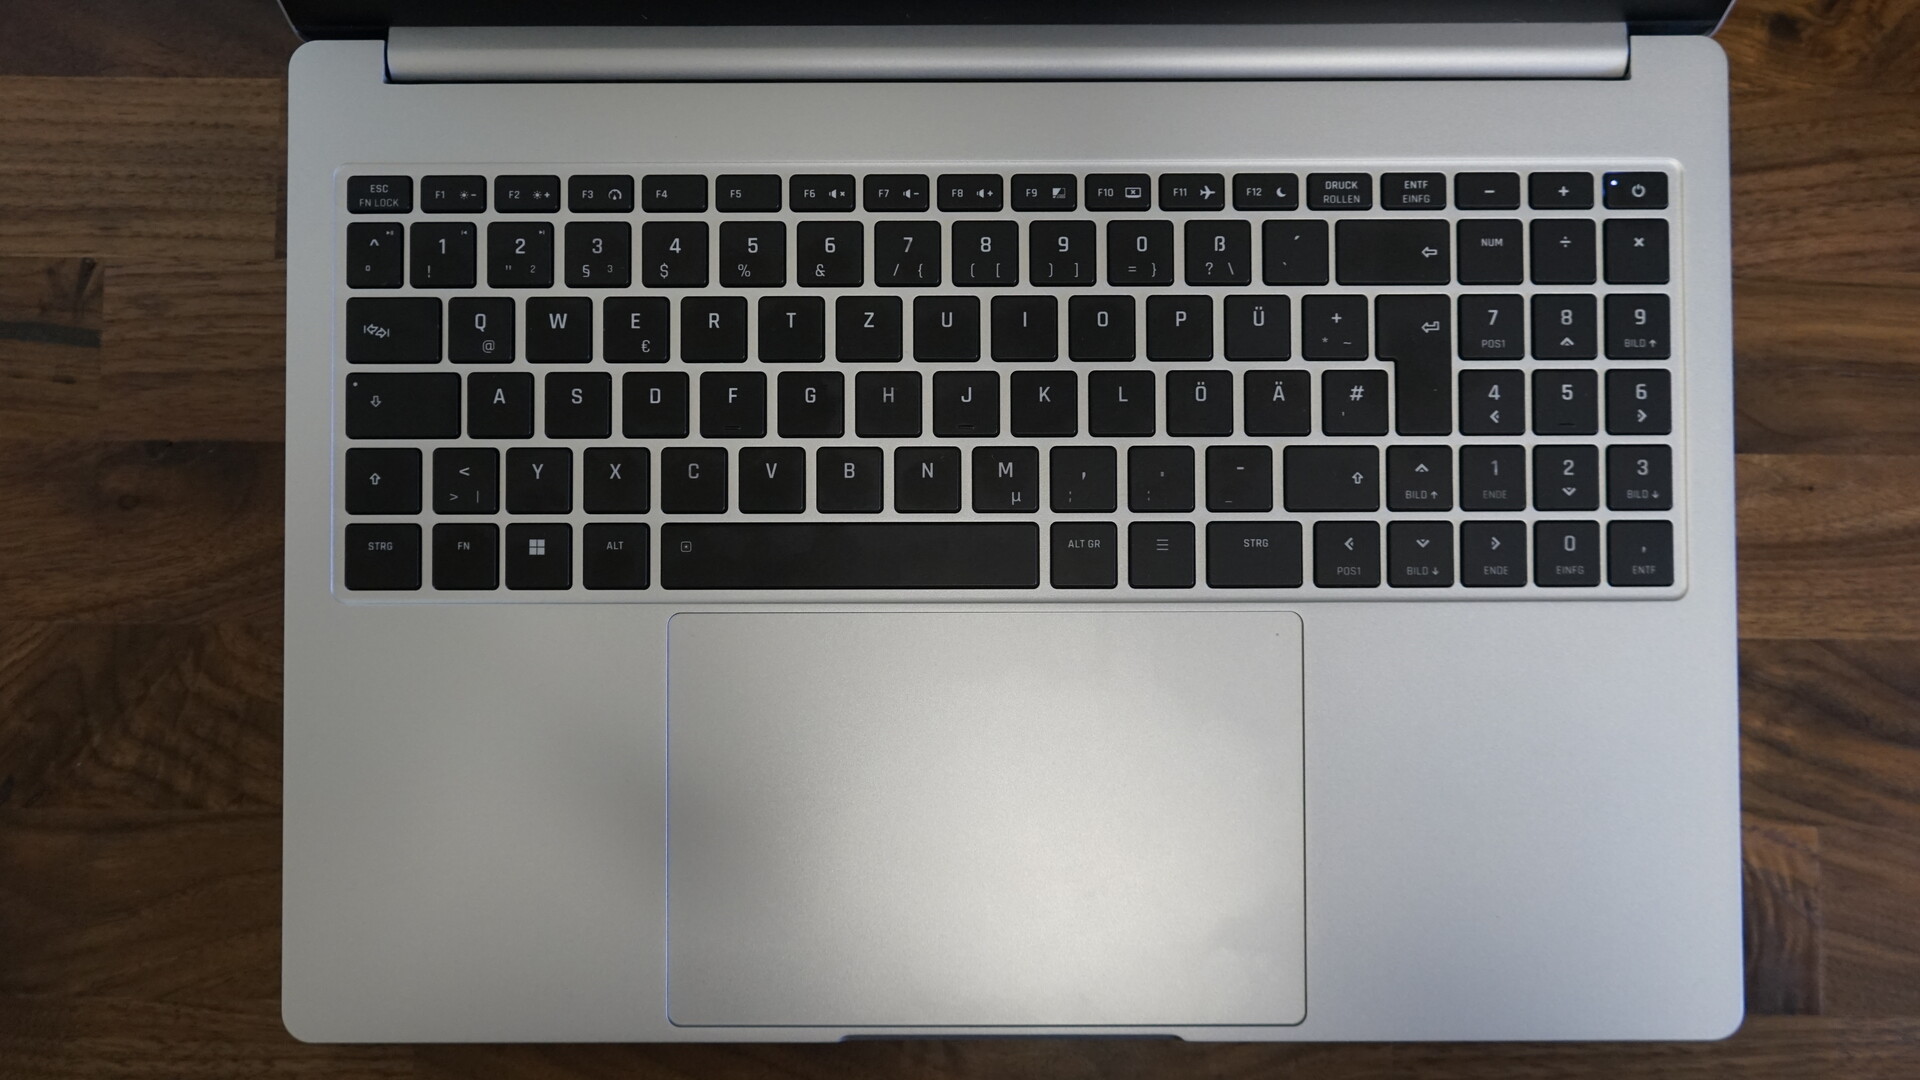
触摸板
Vision 16 和专业版的一大亮点是超大玻璃触控板(15.4 x 10 厘米)。使用触控板非常简单,由于表面较大,手势和光标移动都很流畅。触摸板的精度非常好。不过,点击机构的噪音可能会稍小一些,而且点击右键区域可能会比较麻烦。
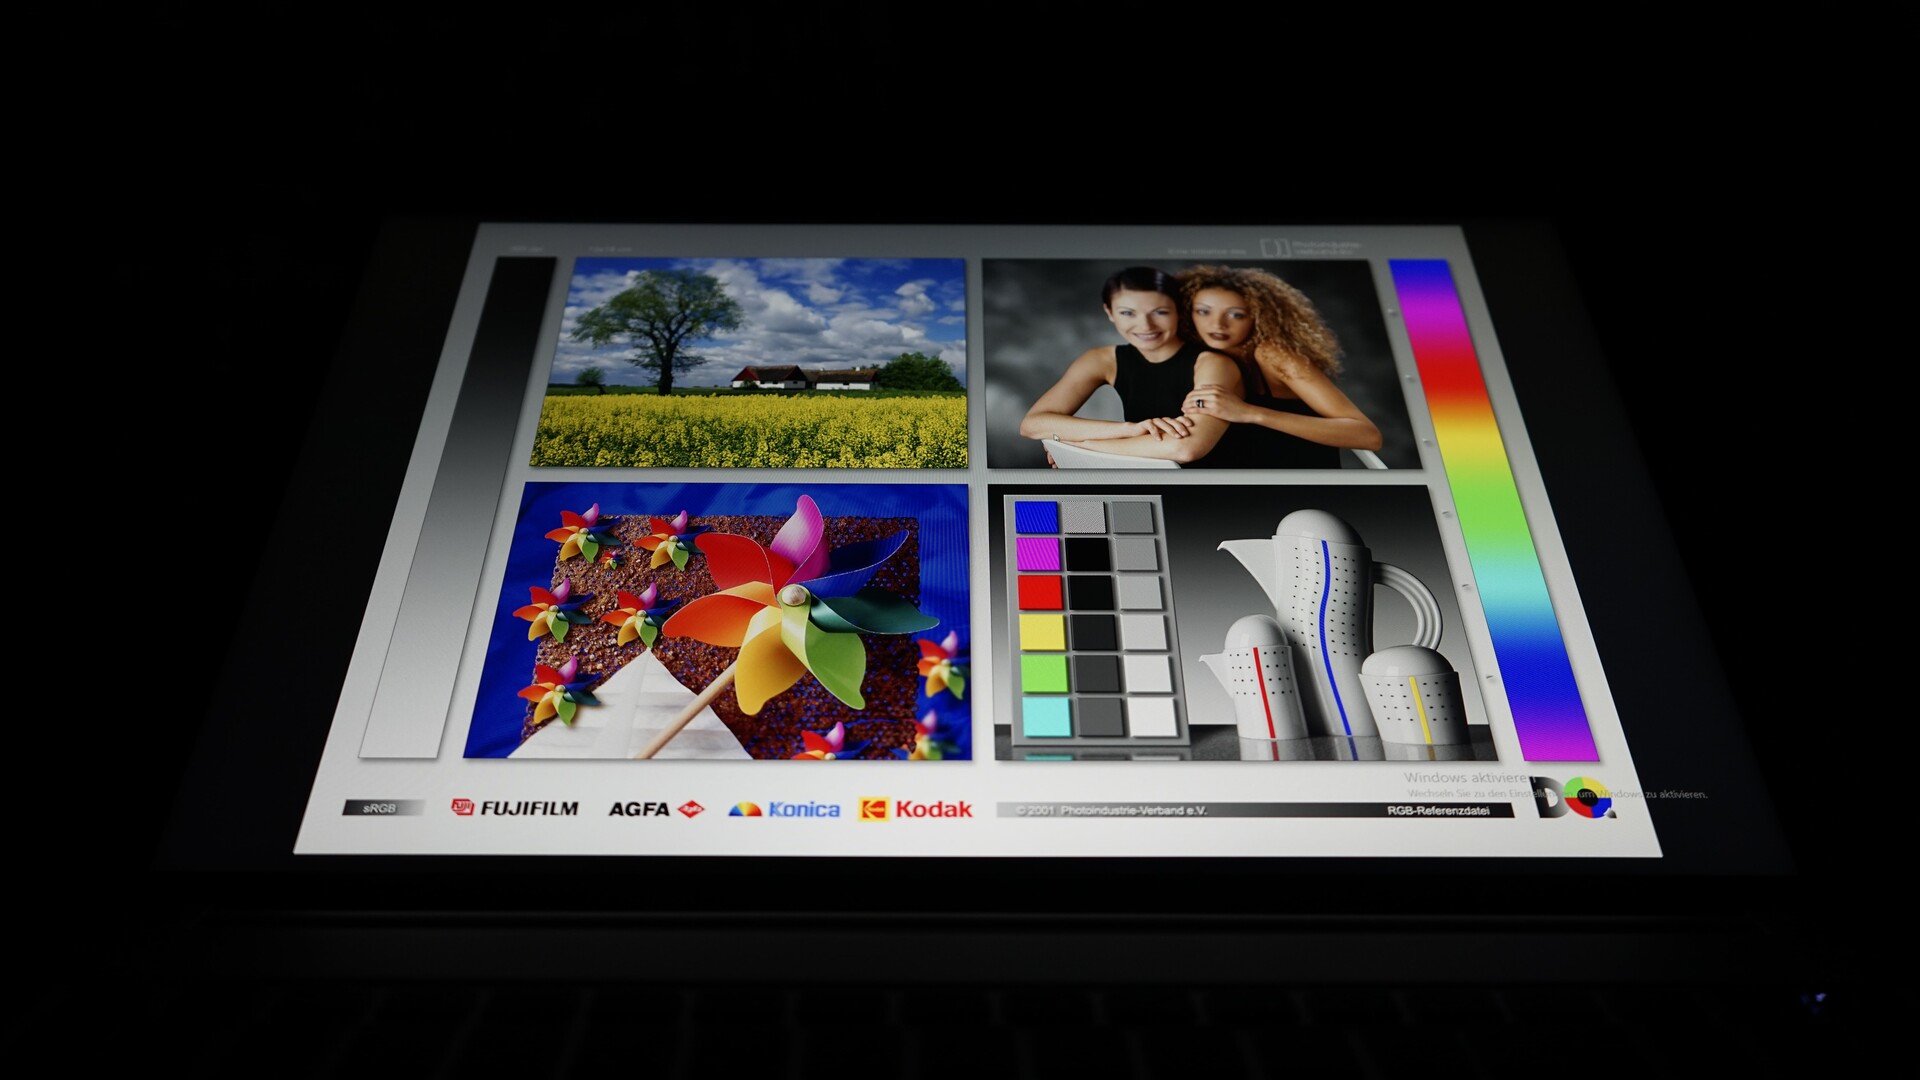
显示屏 - 240 Hz IPS 屏幕,16:10 格式
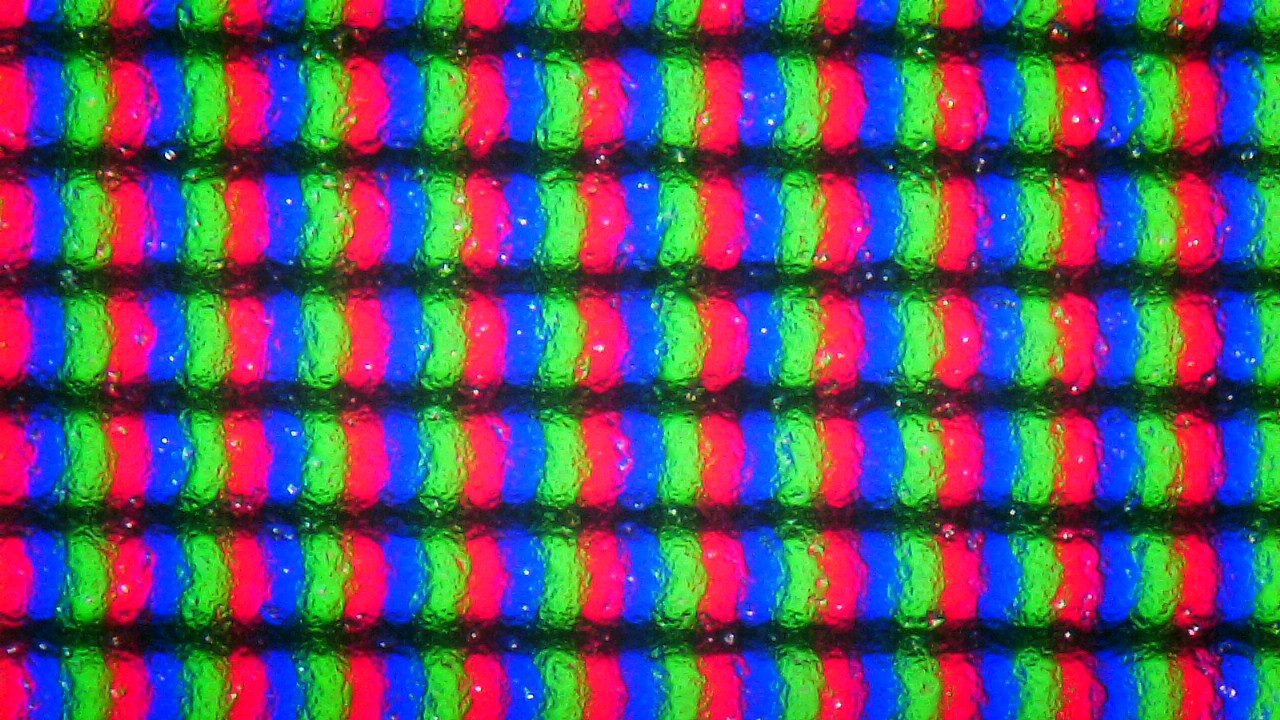
Vision 16 2023 超极本的亮点之一是采用了全新的 WQXGA 面板(2,560 x 1,600),这是去年 Pro 版本所独有的。今年 Vision 16 的刷新率不再是 90 Hz,而是 240 Hz,这在办公笔记本电脑中并不多见。
尽管今年 Vision 16 的两个版本都使用了相同的屏幕,但在我们的评测中,Vision 16 的表现略微优于 Vision 16 Pro。我们将这些差异归因于面板之间的正常质量差异。根据申克公司的说法,屏幕亮度应达到 350 cd/m²,我们的测量结果也证实了这一点。
240 Hz 的高频率带来了流畅的用户体验。不过,除非与外置 Thunderbolt GPU 结合使用,否则 Vision 16 在游戏中的流畅性优势就会付诸东流。
| |||||||||||||||||||||||||
Brightness Distribution: 93 %
Center on Battery: 356 cd/m²
Contrast: 1271:1 (Black: 0.28 cd/m²)
ΔE ColorChecker Calman: 1.7 | ∀{0.5-29.43 Ø4.71}
calibrated: 1
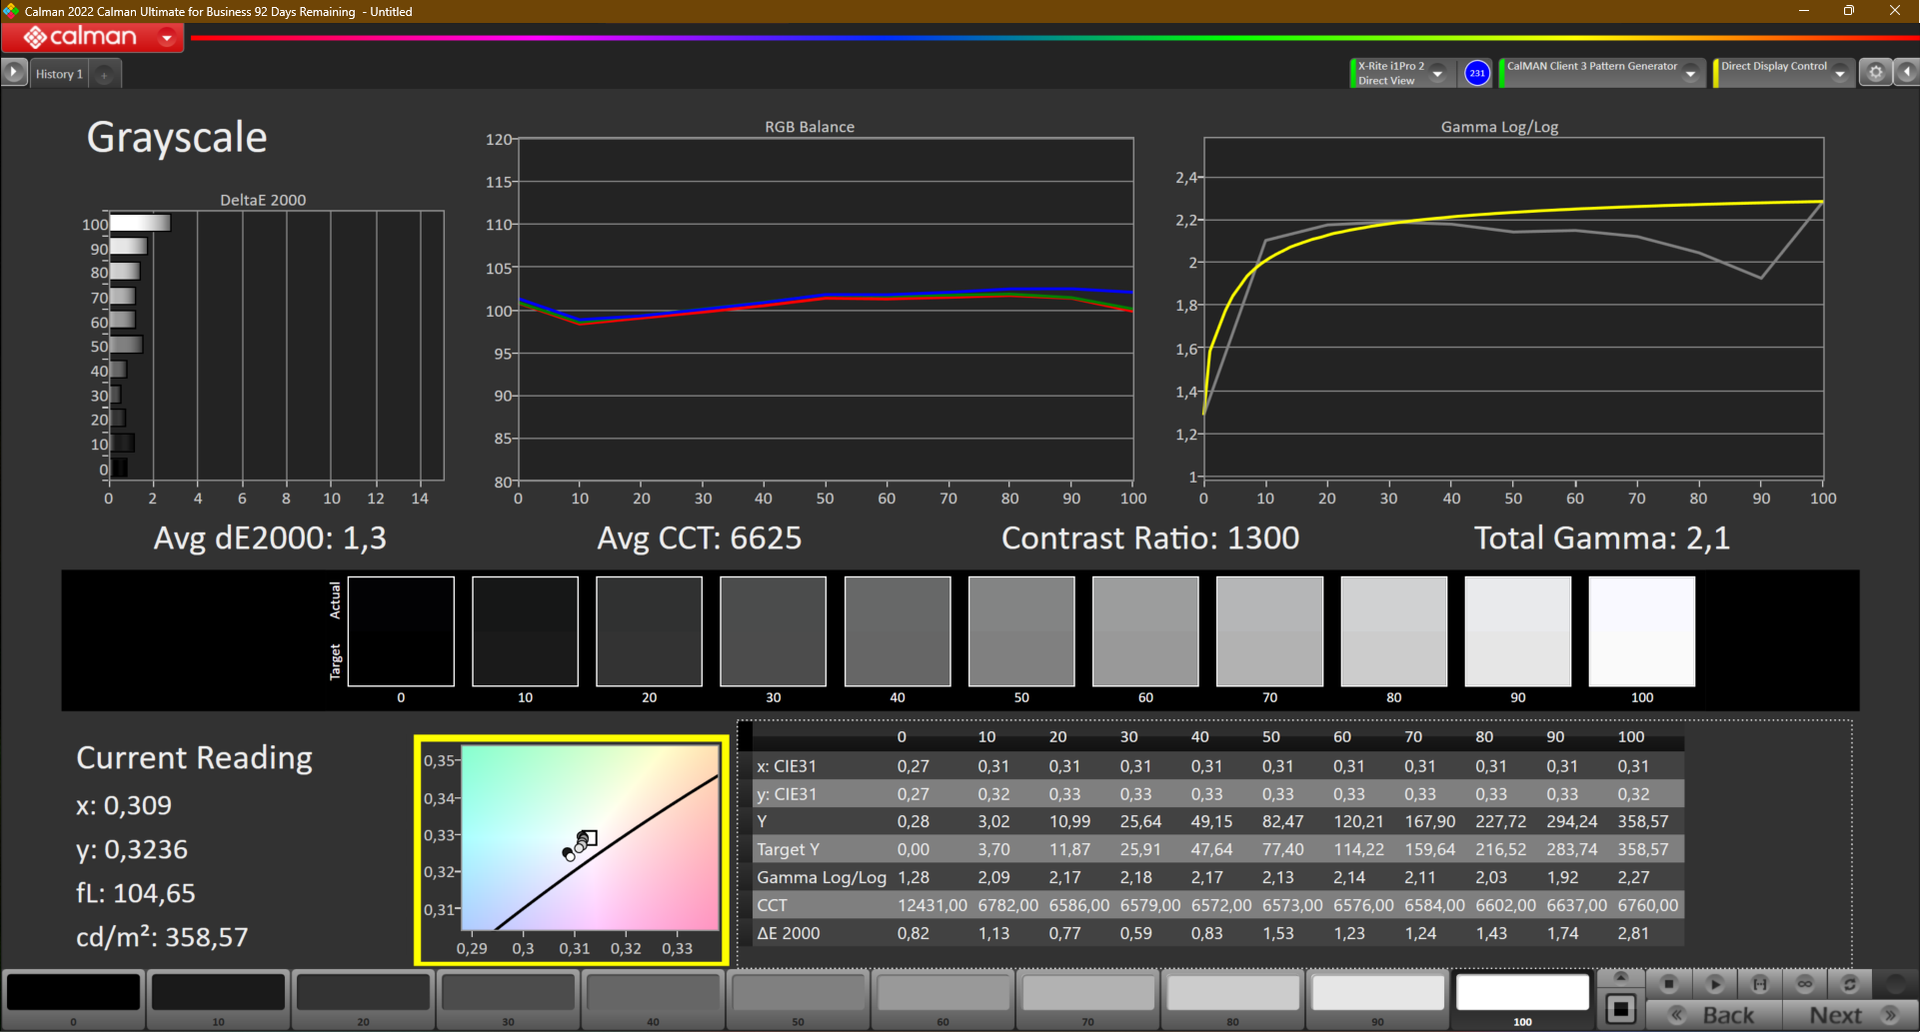
ΔE Greyscale Calman: 1.3 | ∀{0.09-98 Ø4.96}
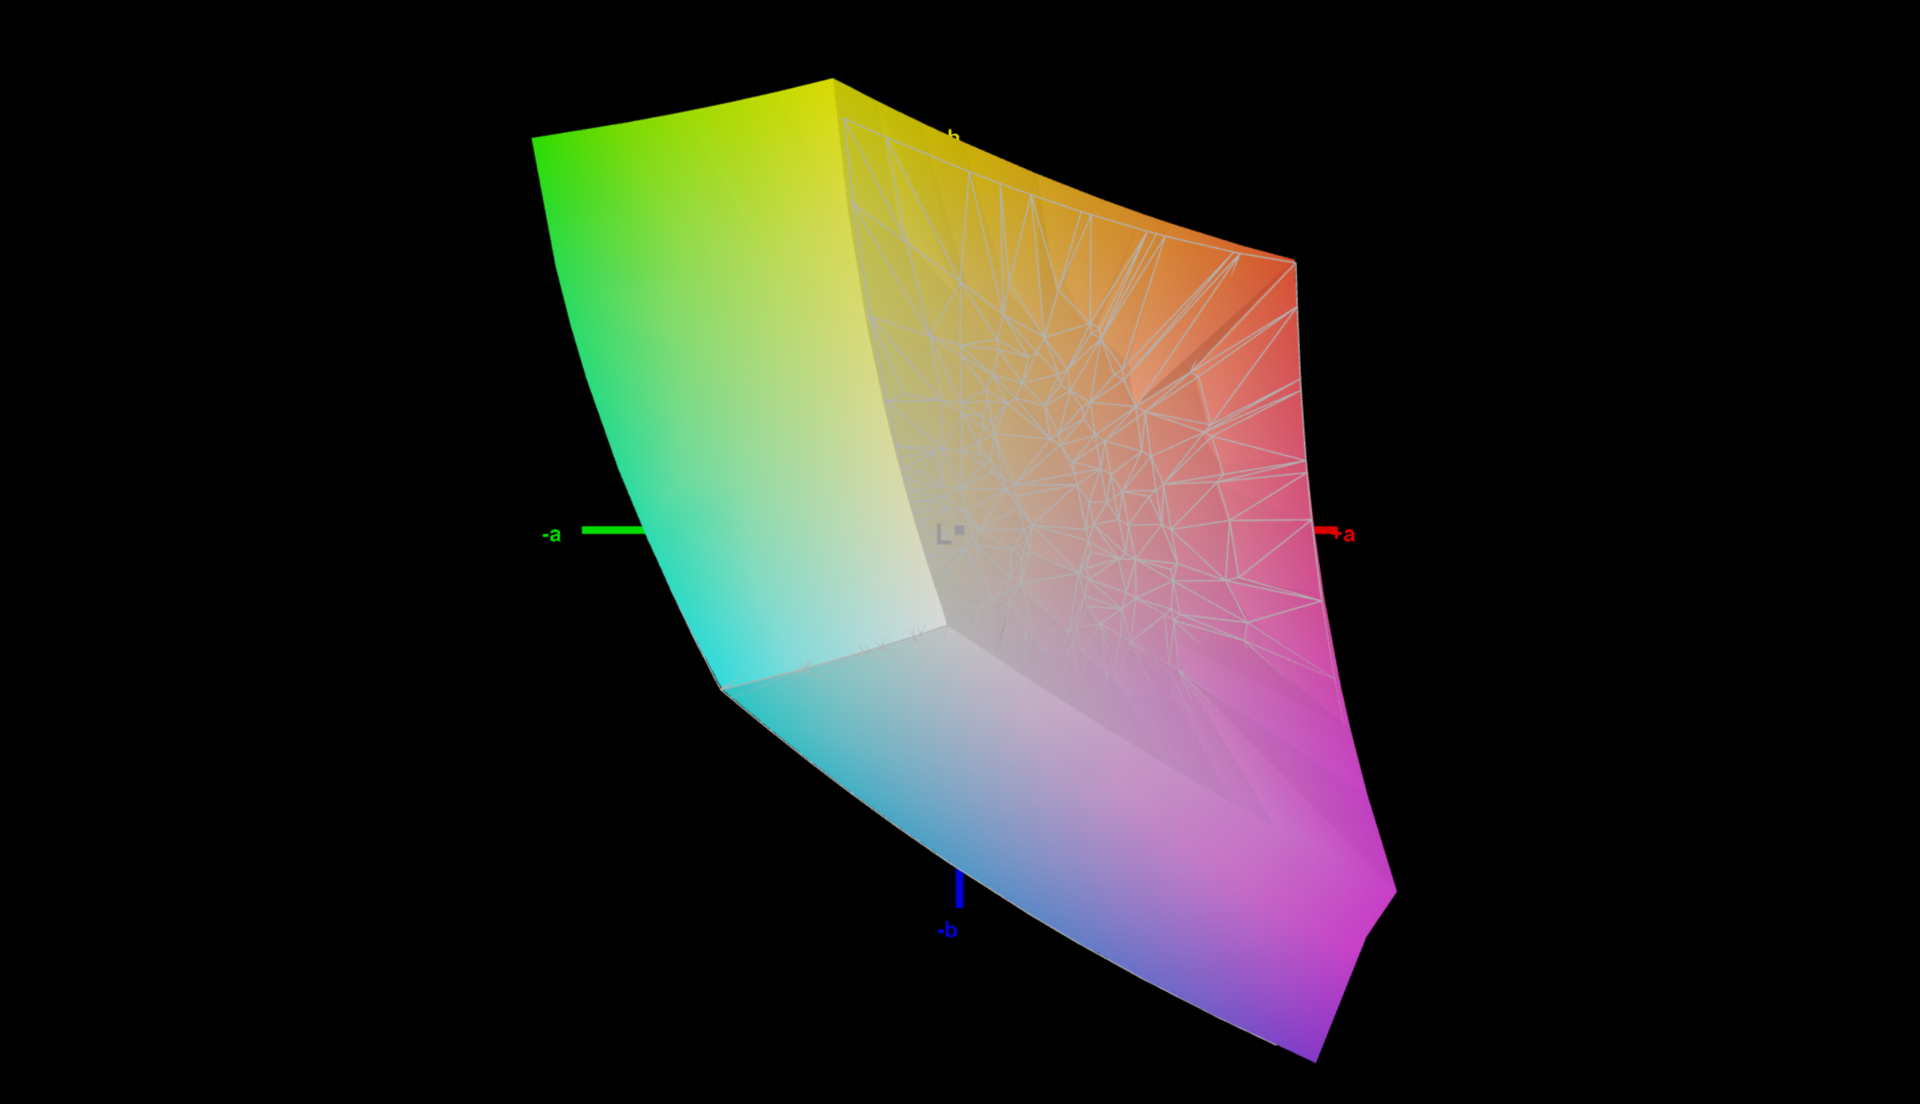
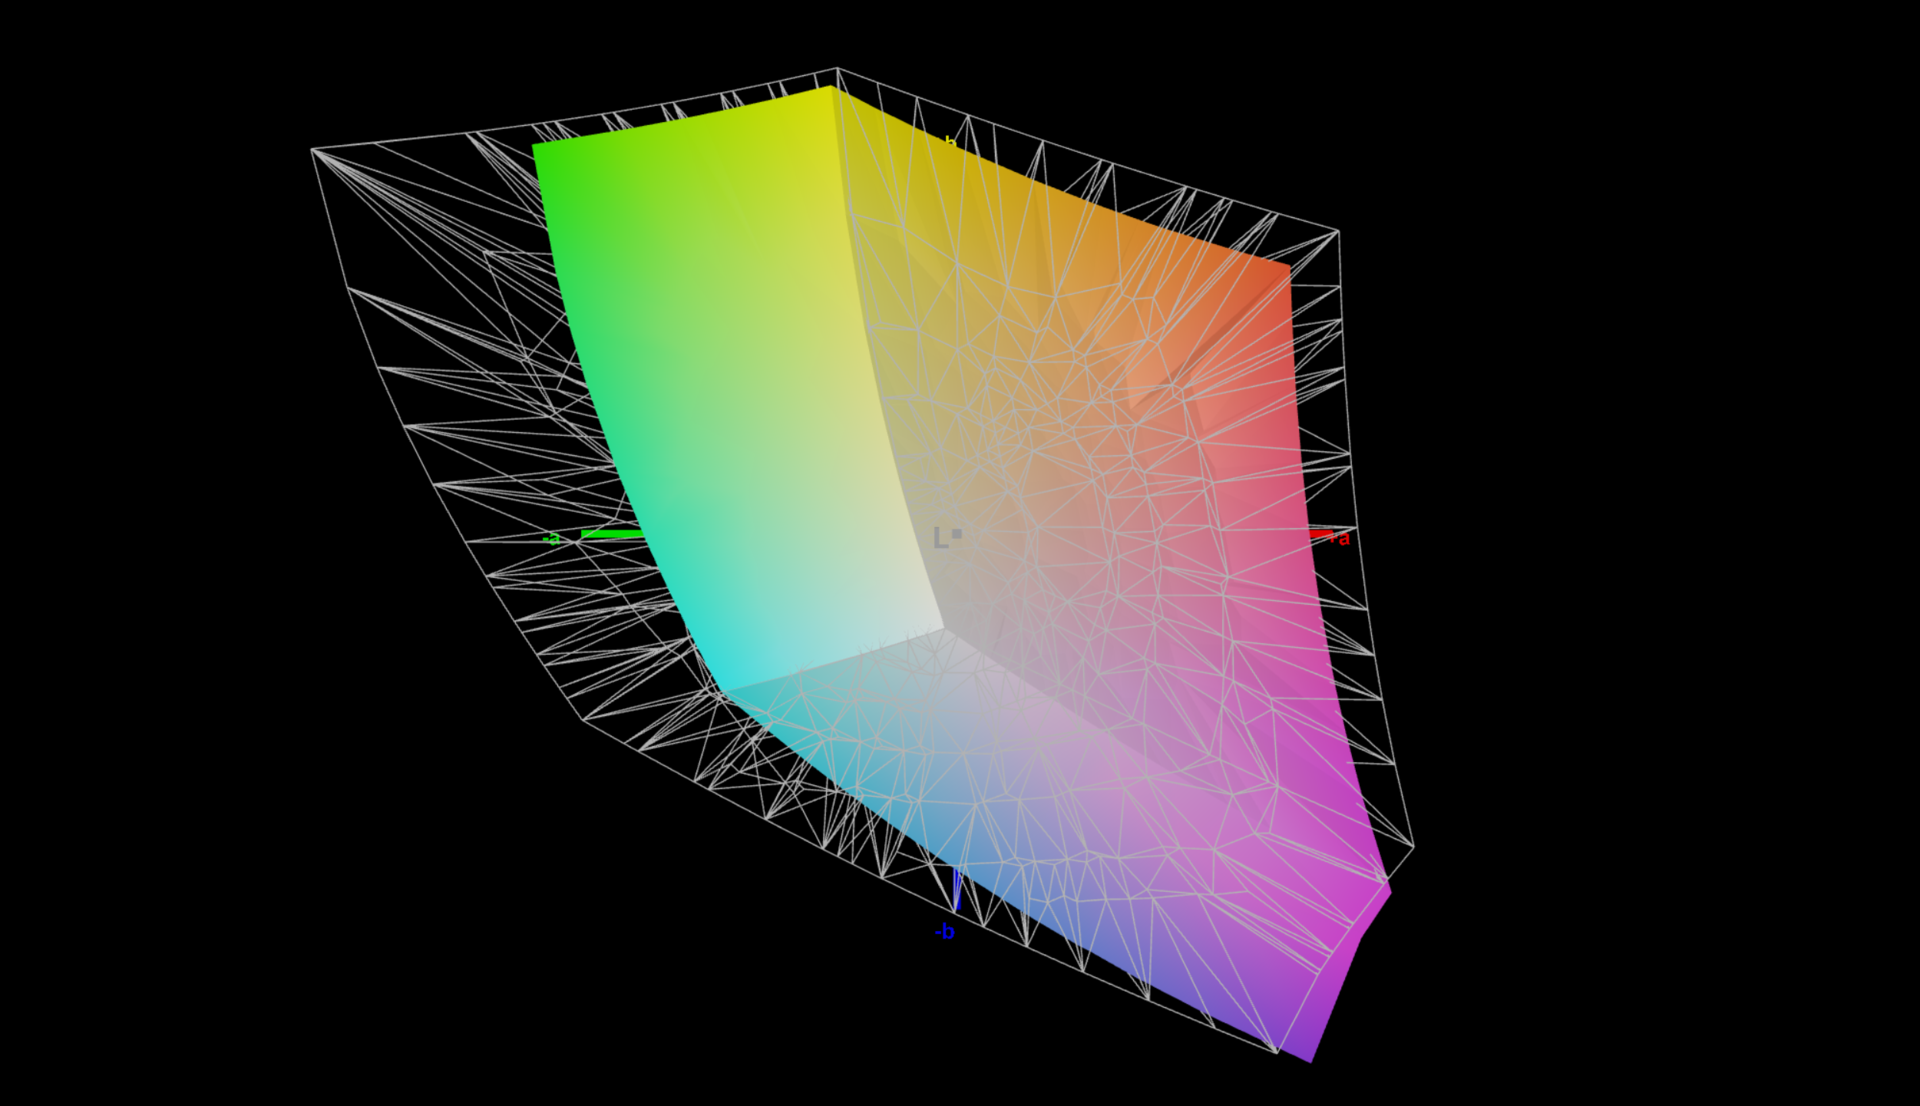
71.2% AdobeRGB 1998 (Argyll 3D)
99.3% sRGB (Argyll 3D)
70% Display P3 (Argyll 3D)
Gamma: 2.1
CCT: 6625 K
| Schenker Vision 16 PH6PRX1 BOE CQ NE160QDM-NZ1 , IPS, 2560x1600, 16" | Apple MacBook Air 15 2023 M2 16 GB IPS, 2880x1864, 15.3" | Acer Swift Go SFG16-71 Samsung SDC418D ATNA60BC03-0, OLED, 3200x2000, 16" | LG Gram SuperSlim (2023) Samsung ATNA56YX08-0, OLED, 1920x1080, 15.6" | Microsoft Surface Laptop 5 15, i7-1255U LQ150P1JX51, IPS, 2496x1664, 15" | Asus VivoBook S15 M3502RA-L1029W Samsung SDC4161, OLED, 1920x1080, 15.6" | |
|---|---|---|---|---|---|---|
| Display | 22% | 28% | 27% | -2% | 27% | |
| Display P3 Coverage (%) | 70 | 98.7 41% | 99.91 43% | 99.8 43% | 68.1 -3% | 99.9 43% |
| sRGB Coverage (%) | 99.3 | 99.9 1% | 100 1% | 100 1% | 97.3 -2% | 100 1% |
| AdobeRGB 1998 Coverage (%) | 71.2 | 87.9 23% | 98.87 39% | 98.09 38% | 70.3 -1% | 98.6 38% |
| Response Times | -149% | 79% | 79% | -318% | 84% | |
| Response Time Grey 50% / Grey 80% * (ms) | 11 ? | 28.8 ? -162% | 2 ? 82% | 2 ? 82% | 52.4 ? -376% | 0.74 93% |
| Response Time Black / White * (ms) | 8 ? | 18.9 ? -136% | 2 ? 75% | 2 ? 75% | 28.7 ? -259% | 2 ? 75% |
| PWM Frequency (Hz) | 227 ? | 22000 ? | 59 ? | |||
| Screen | 9% | -52% | -20% | 18% | -36% | |
| Brightness middle (cd/m²) | 356 | 517 45% | 370 4% | 395 11% | 397 12% | 378 6% |
| Brightness (cd/m²) | 349 | 501 44% | 371 6% | 392 12% | 399 14% | 378 8% |
| Brightness Distribution (%) | 93 | 93 0% | 98 5% | 97 4% | 85 -9% | 98 5% |
| Black Level * (cd/m²) | 0.28 | 0.39 -39% | 0.1 64% | 0.29 -4% | ||
| Contrast (:1) | 1271 | 1326 4% | 3950 211% | 1369 8% | ||
| Colorchecker dE 2000 * | 1.7 | 1.2 29% | 2.77 -63% | 2.2 -29% | 0.8 53% | 2.2 -29% |
| Colorchecker dE 2000 max. * | 3 | 2.5 17% | 4.08 -36% | 4.43 -48% | 1.4 53% | 4.87 -62% |
| Colorchecker dE 2000 calibrated * | 1 | 0.8 20% | 2.83 -183% | 4.65 -365% | 2.68 -168% | |
| Greyscale dE 2000 * | 1.3 | 1.8 -38% | 2.58 -98% | 1.78 -37% | 1.1 15% | 1.43 -10% |
| Gamma | 2.1 105% | 2.24 98% | 2.46 89% | 2.39 92% | 2.18 101% | 2.47 89% |
| CCT | 6625 98% | 6241 104% | 6284 103% | 6705 97% | 6464 101% | |
| Total Average (Program / Settings) | -39% /
-11% | 18% /
-10% | 29% /
4% | -101% /
-38% | 25% /
0% |
* ... smaller is better
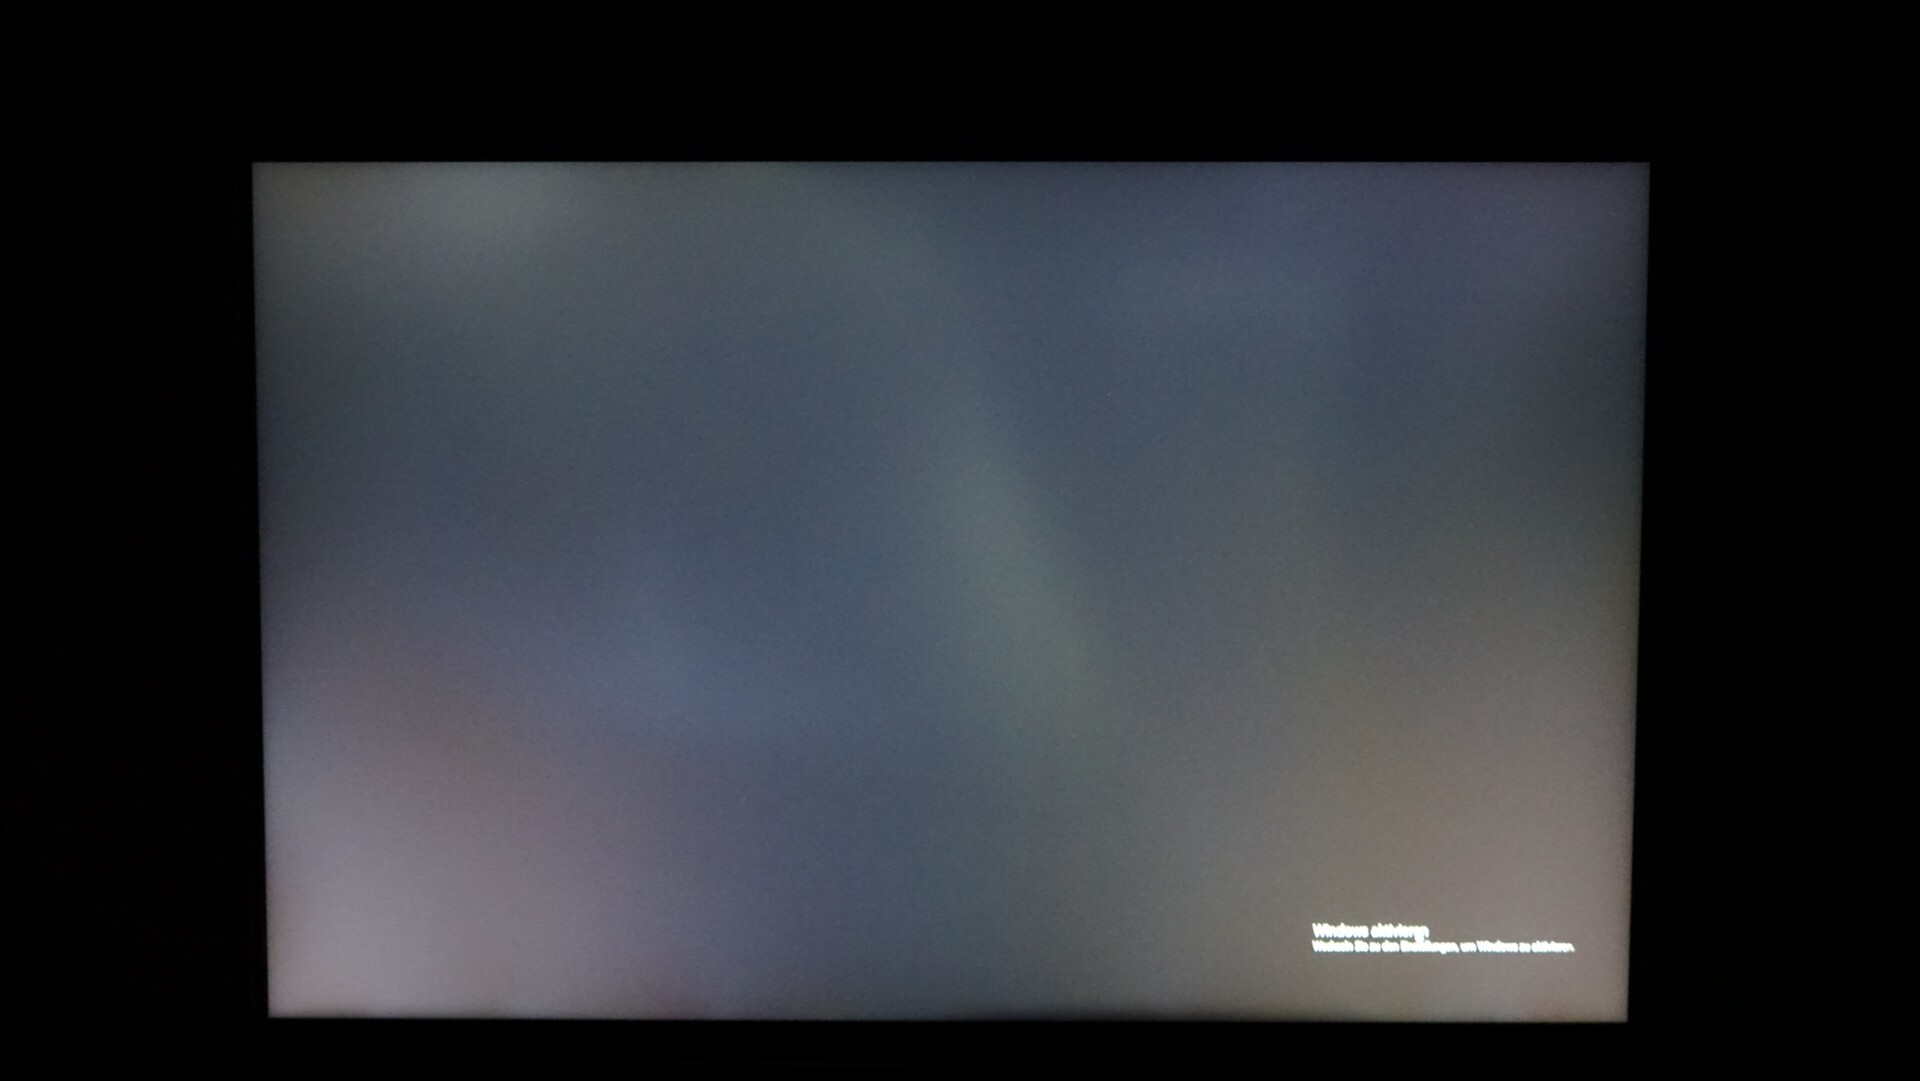
黑色值的测量结果为 0.28 cd/m²,屏幕对比度超过 1,200:1。尽管如此,IPS 显示屏仍无法与 OLED 面板的深黑色值相媲美。
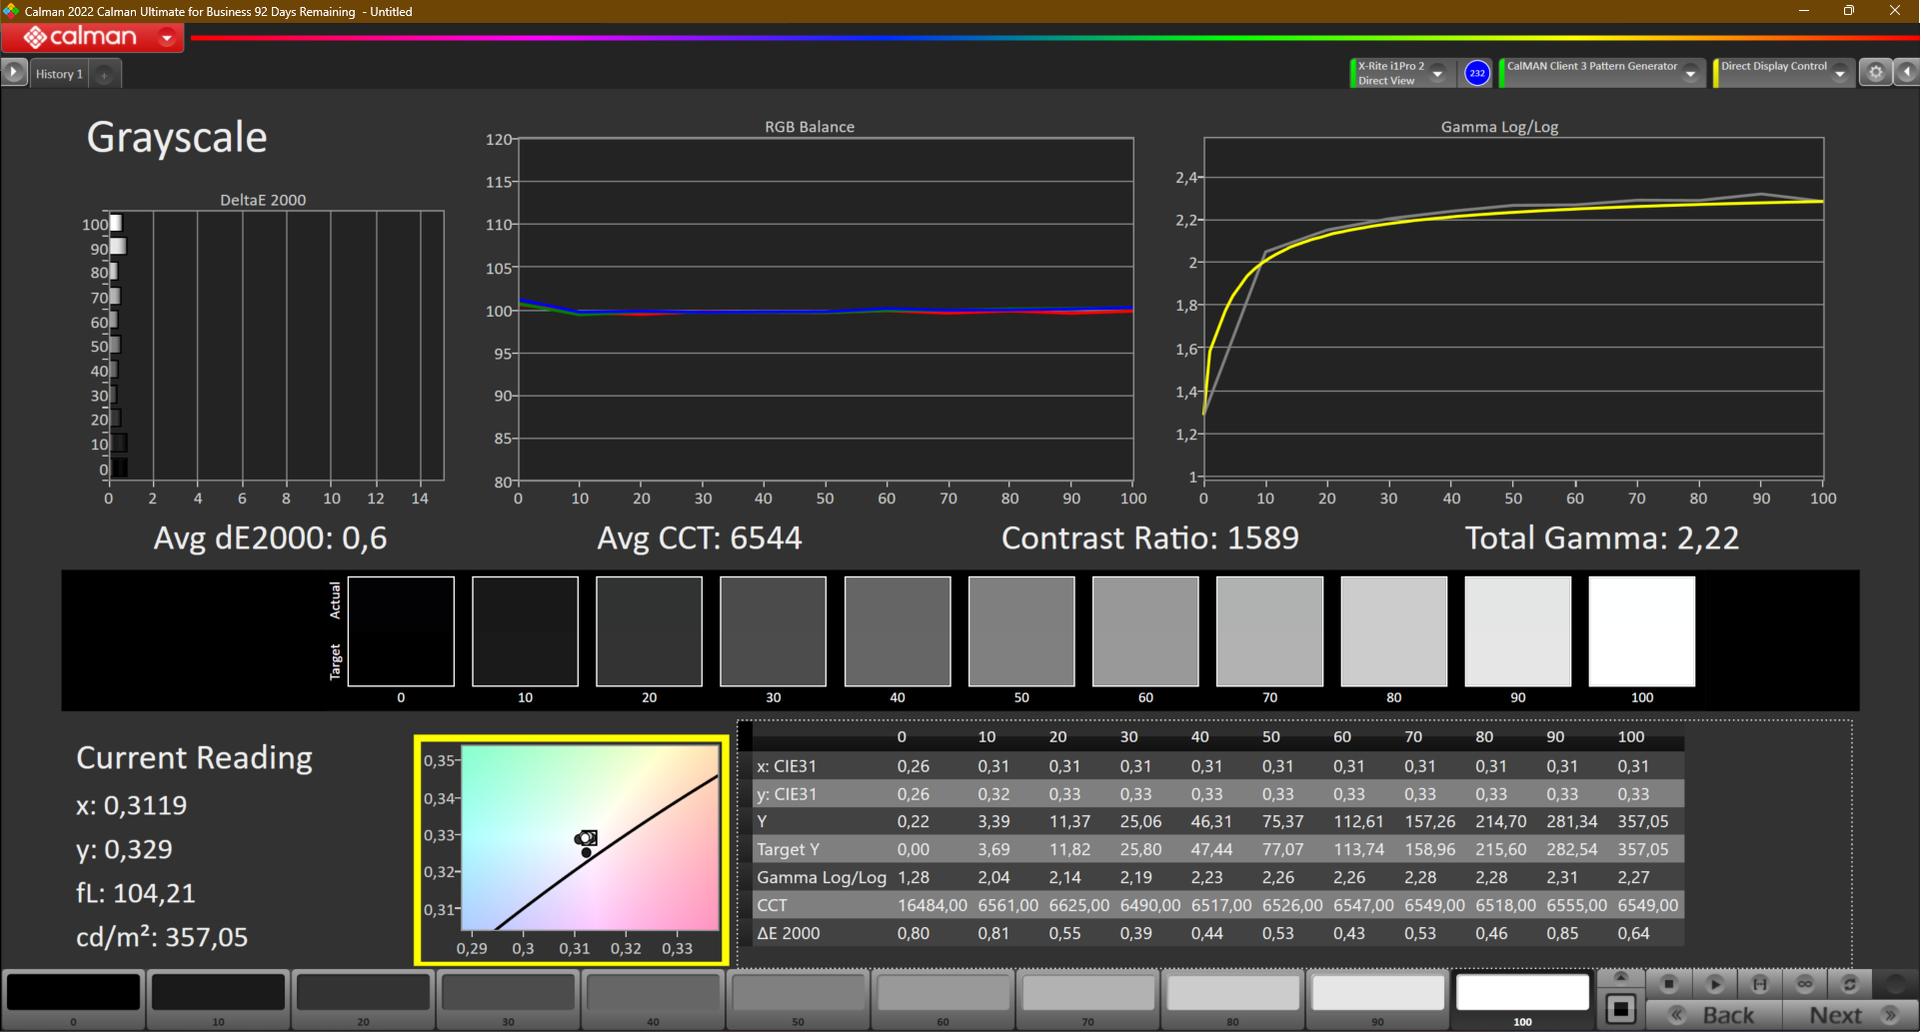
在校准之前,屏幕的 deltaE 值为 1.7,我们可以将其降低到 1.0。相比之下,Vision 16 Pro 的显示屏在校准前的 deltaE 值为 3.4。灰度方面的差异尤为明显。出厂时,Pro 版本的灰阶 deltaE 为 4.9,而我们的 Vision 16 评测样本的灰阶 deltaE 低得多,仅为 1.3。
在 Vision 16 Pro 的屏幕上,我们没有发现类似的蓝色色调。由于出厂校准效果良好,我们没有在控制中心使用申克色彩配置文件。Vision 16 和 Vision 16 Pro 在测量结果上的差异表明,屏幕的质量是幸运的。与往常一样,我们为申克 Vision 16 创建的色彩配置文件可在上面的灰色框中免费下载。
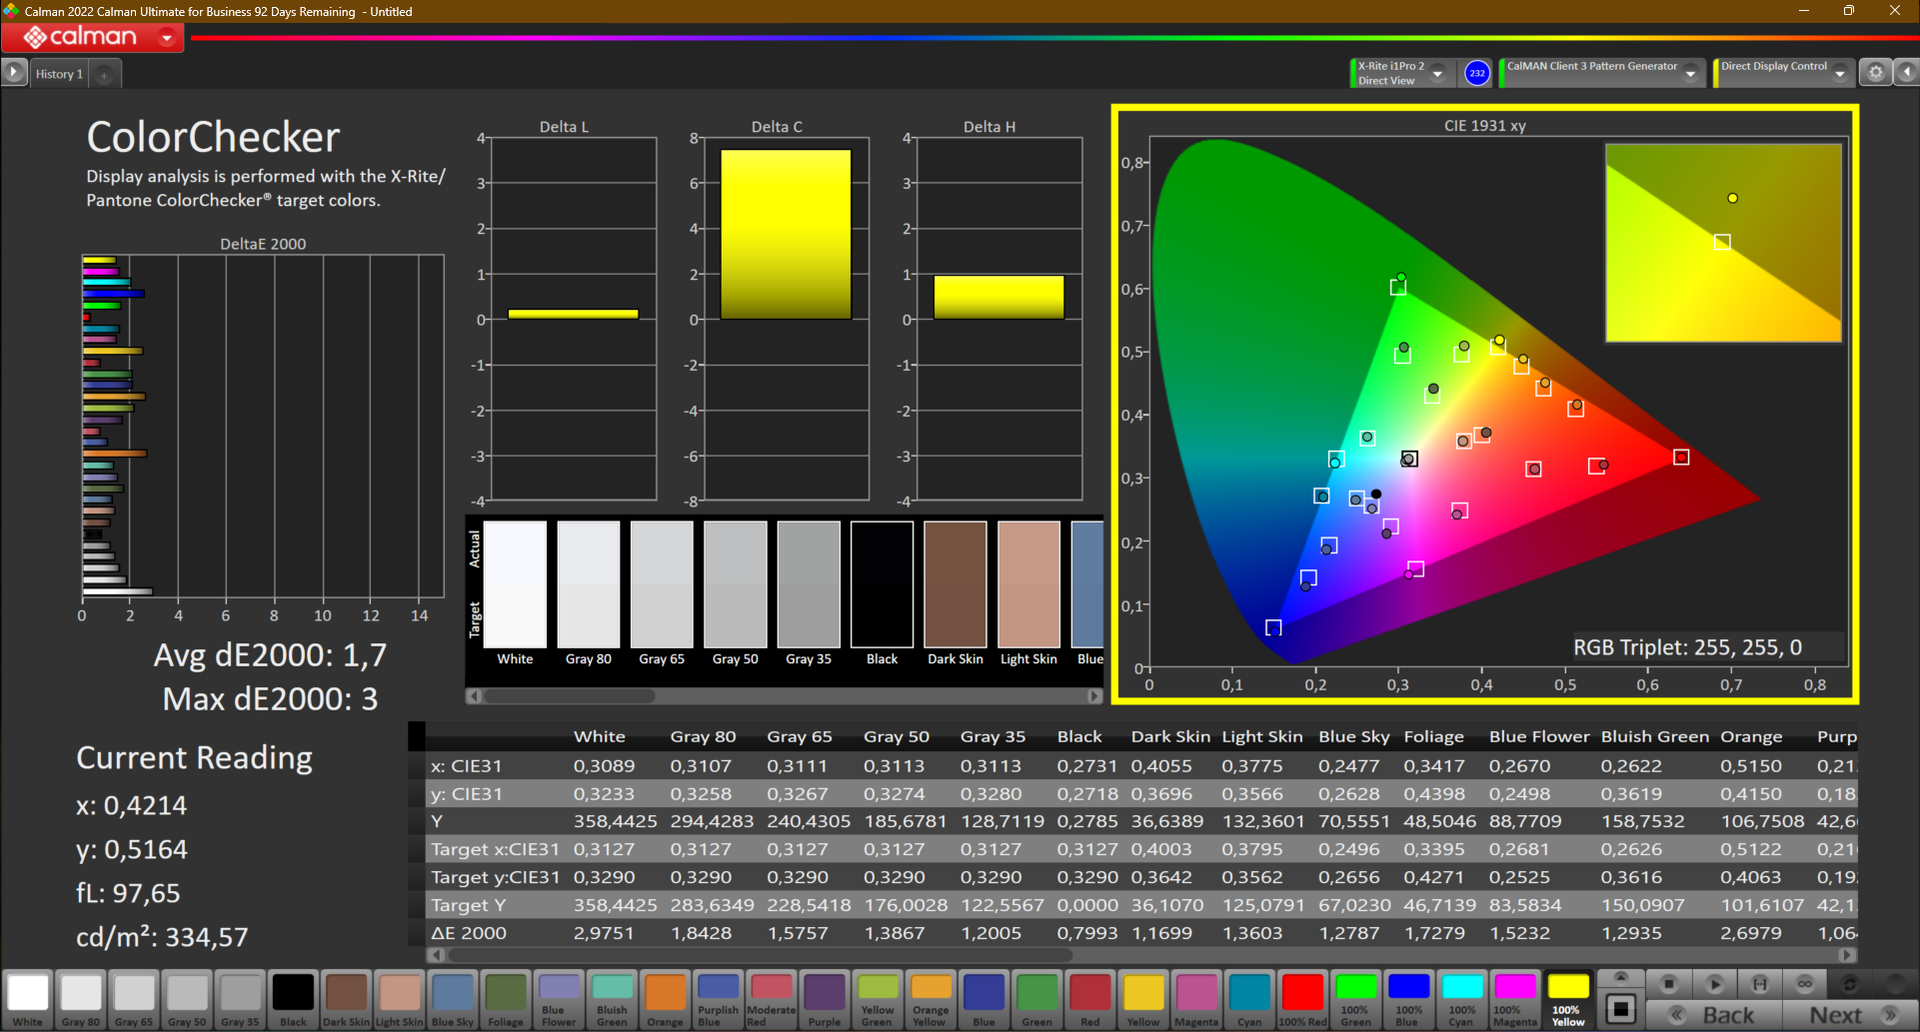
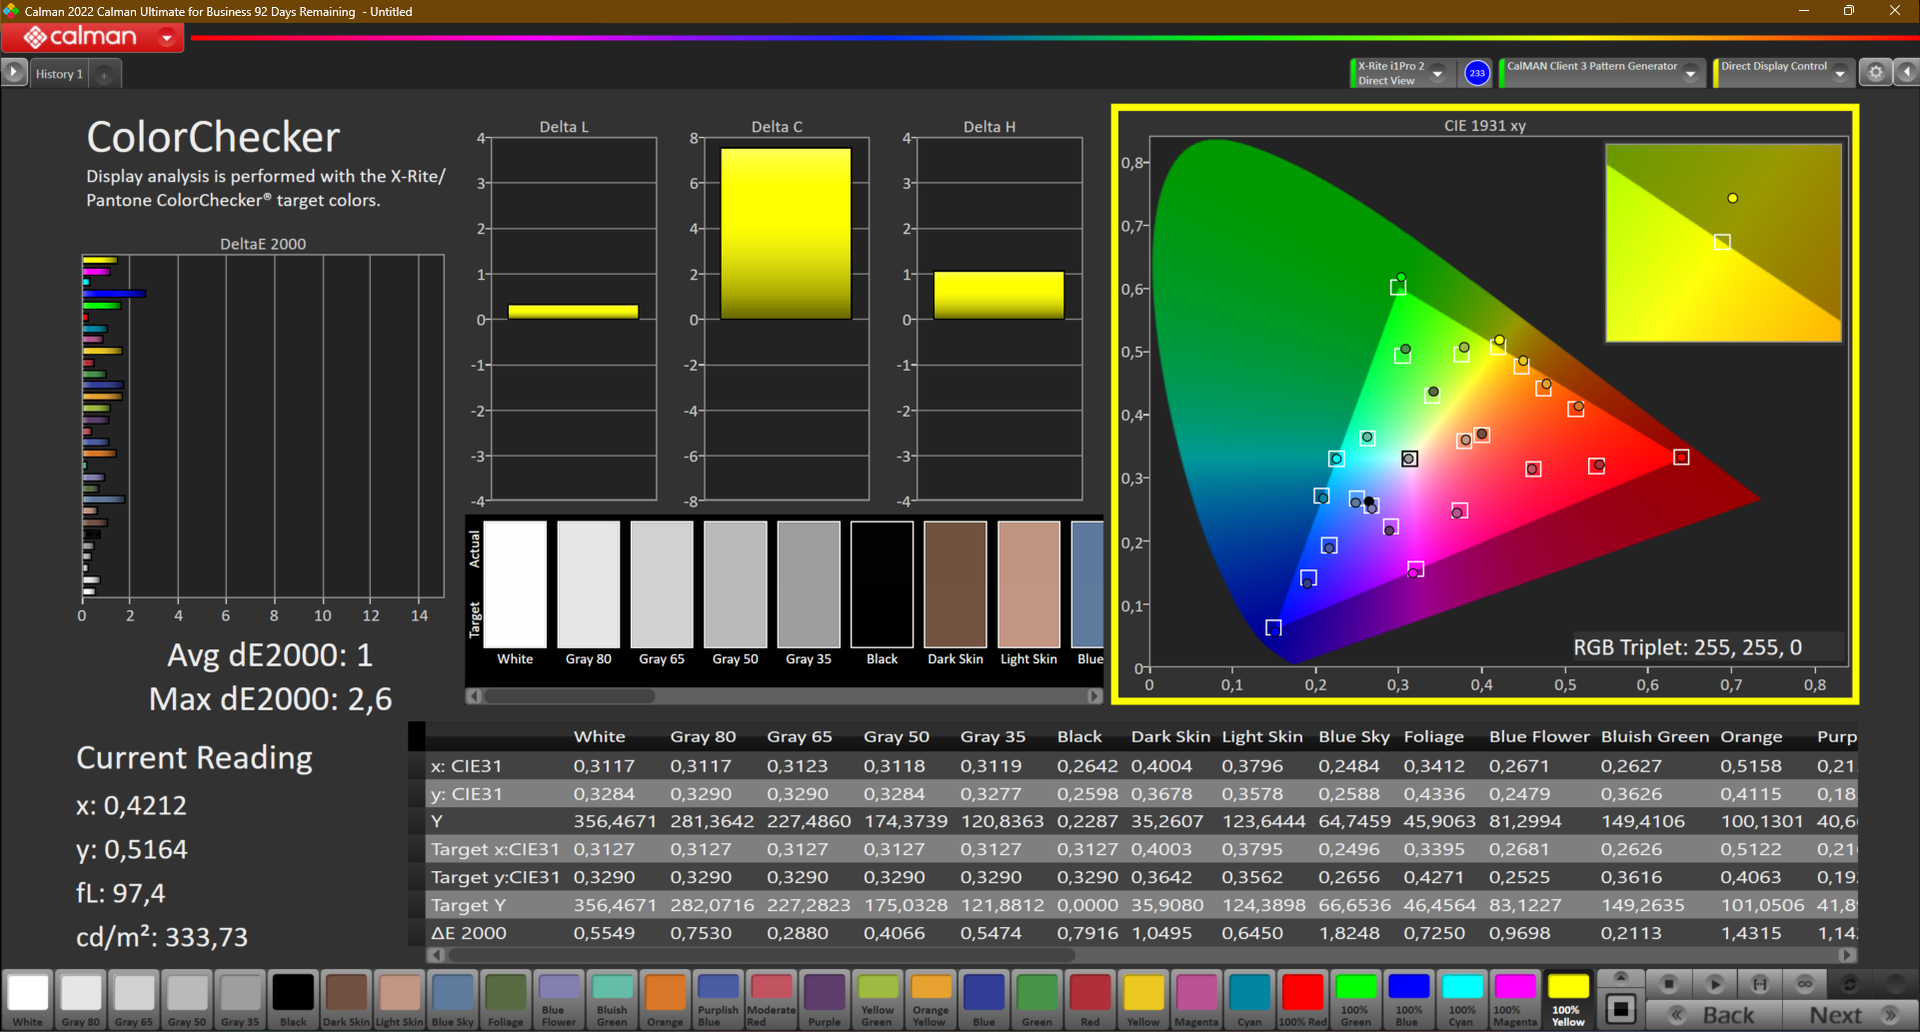

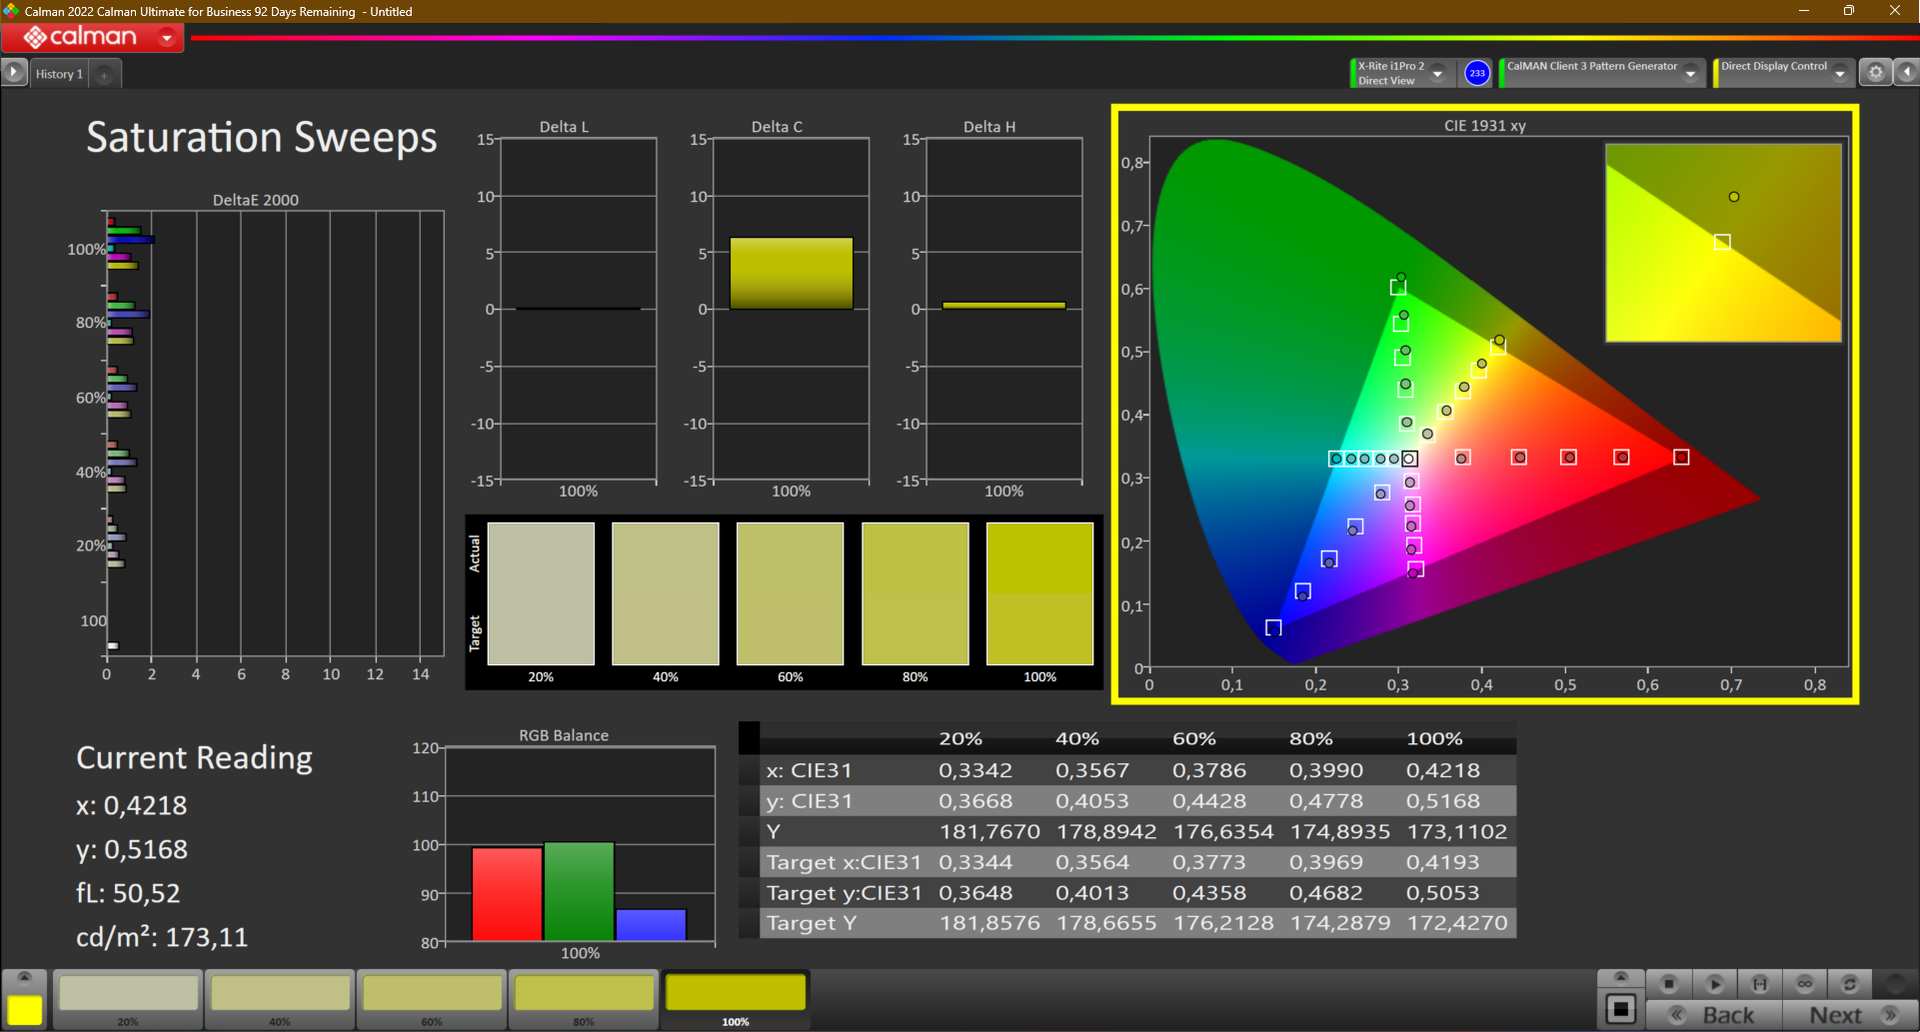
由于屏幕几乎完全覆盖了 sRGB 色域,Vision 16 2023 适合进行简单的照片编辑。对于专业摄影师或摄像师来说,这块屏幕还不够好,因为更宽的 AdobeRGB 和 DCI P3 色域覆盖不足。

Display Response Times
| ↔ Response Time Black to White | ||
|---|---|---|
| 8 ms ... rise ↗ and fall ↘ combined | ↗ 4 ms rise | 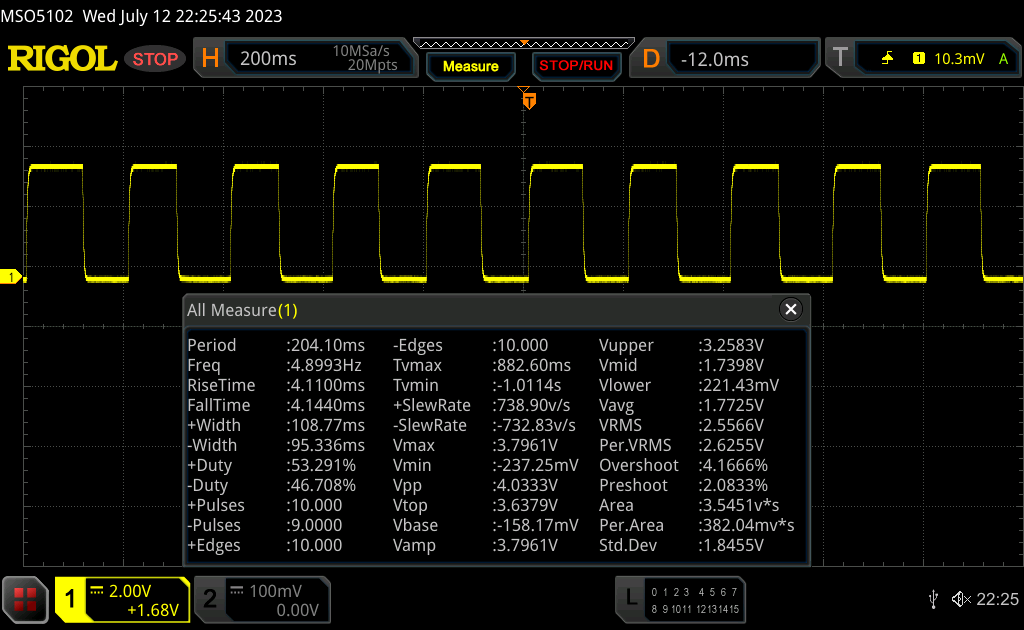 |
| ↘ 4 ms fall | ||
| The screen shows fast response rates in our tests and should be suited for gaming. In comparison, all tested devices range from 0.1 (minimum) to 240 (maximum) ms. » 22 % of all devices are better. This means that the measured response time is better than the average of all tested devices (19.8 ms). | ||
| ↔ Response Time 50% Grey to 80% Grey | ||
| 11 ms ... rise ↗ and fall ↘ combined | ↗ 5 ms rise | 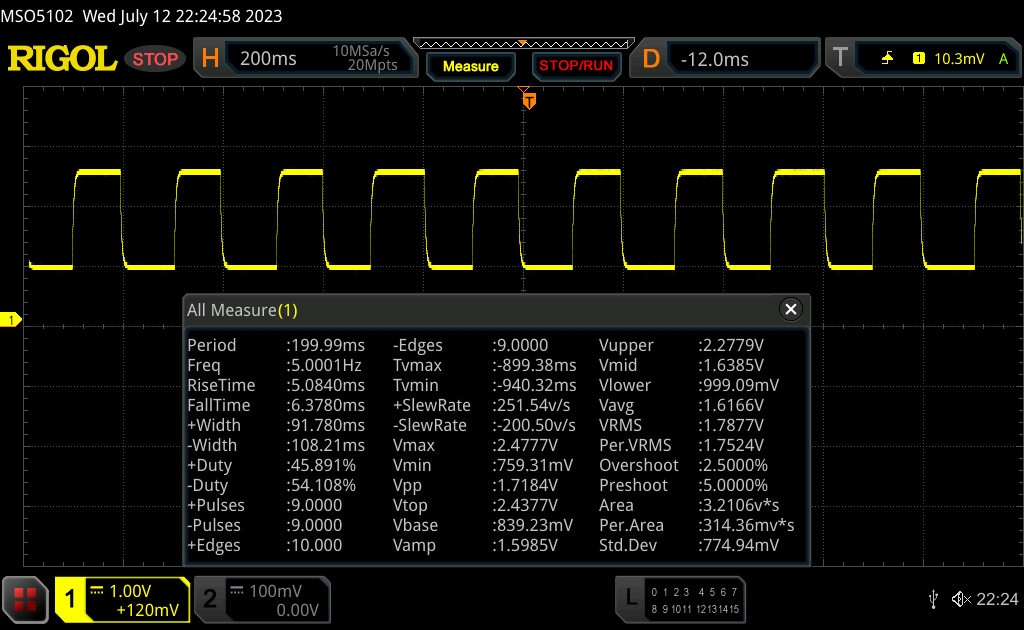 |
| ↘ 6 ms fall | ||
| The screen shows good response rates in our tests, but may be too slow for competitive gamers. In comparison, all tested devices range from 0.165 (minimum) to 636 (maximum) ms. » 25 % of all devices are better. This means that the measured response time is better than the average of all tested devices (31 ms). | ||
Screen Flickering / PWM (Pulse-Width Modulation)
| Screen flickering / PWM not detected |  | ||
In comparison: 52 % of all tested devices do not use PWM to dim the display. If PWM was detected, an average of 7754 (minimum: 5 - maximum: 343500) Hz was measured. | |||
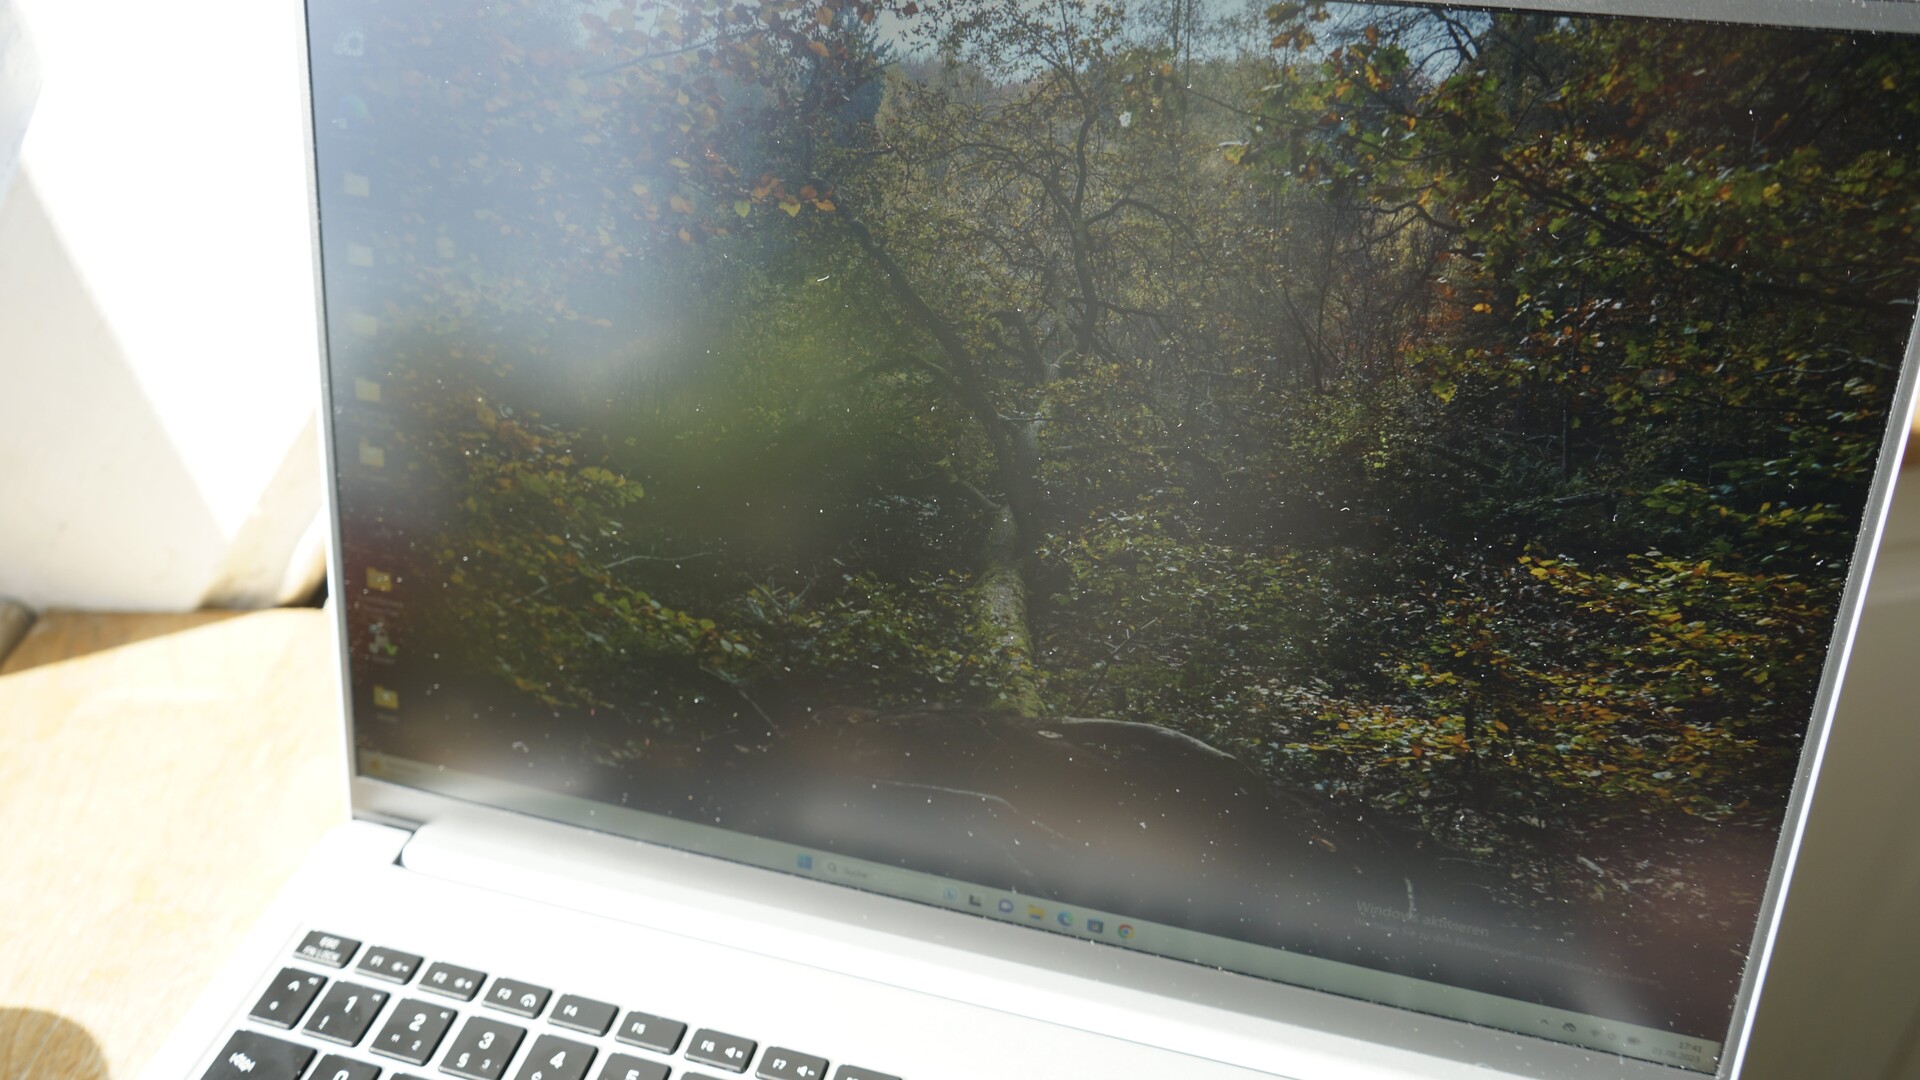
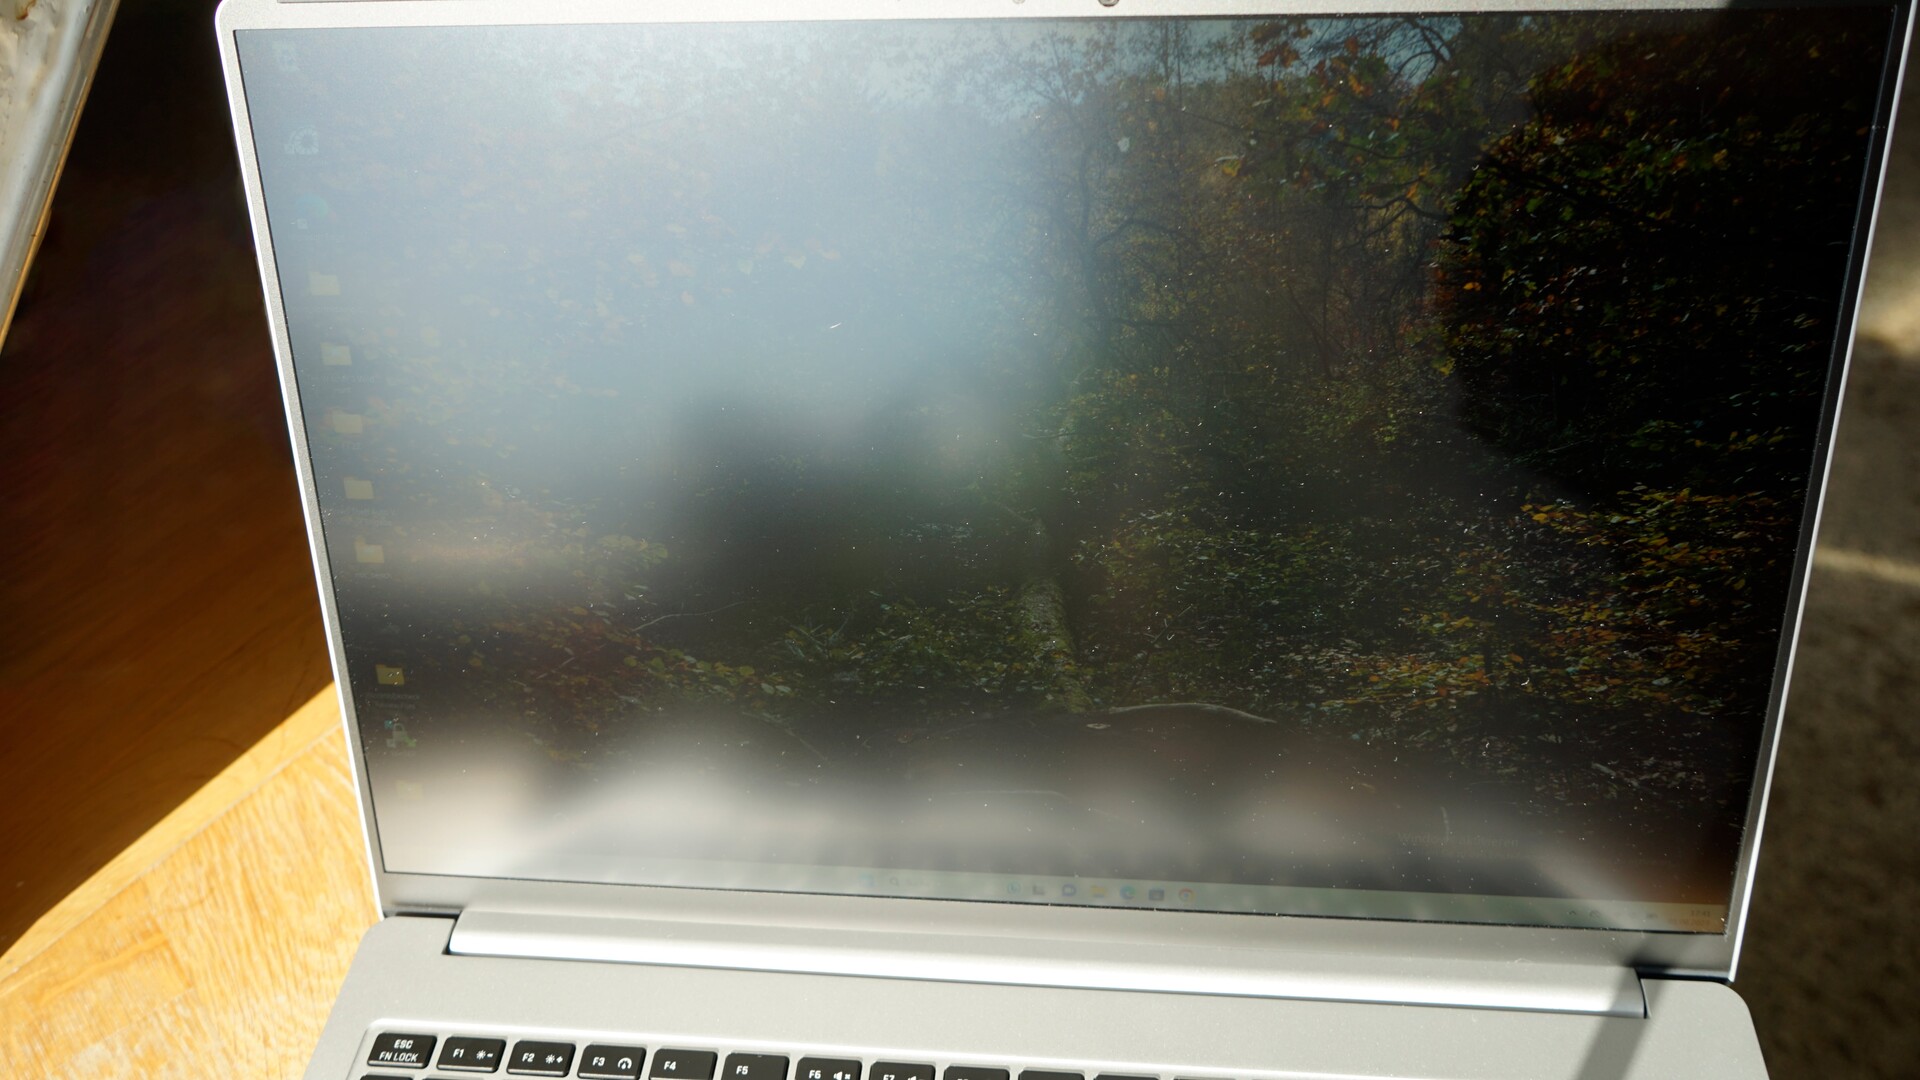
由于采用了哑光屏幕,Vision 16 可以在户外环境中使用。但应避免阳光直射,否则会影响工作效率。
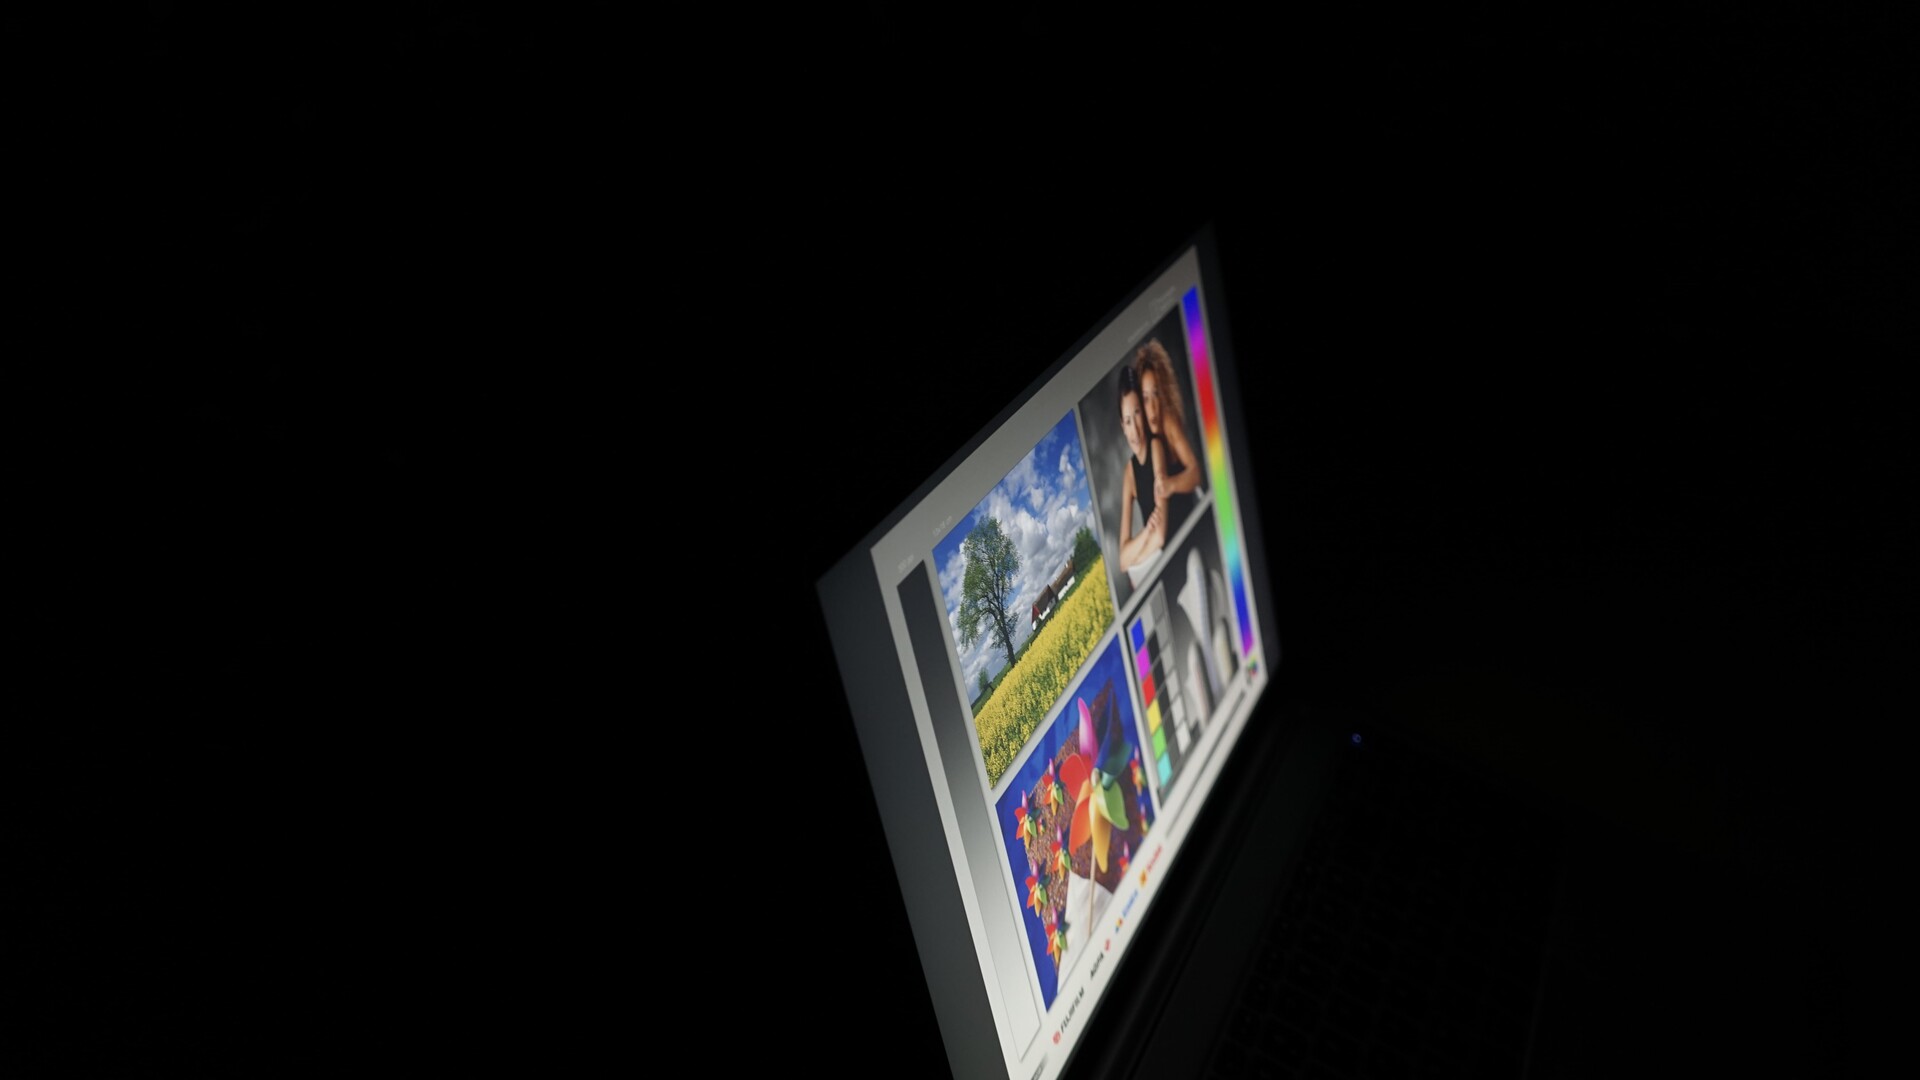
视角稳定性不错,但还达不到 OLED 屏幕的水平。从极端角度观看时,显示屏会失去对比度。

性能 - 酷睿 i7-13700H 无法满负荷运行
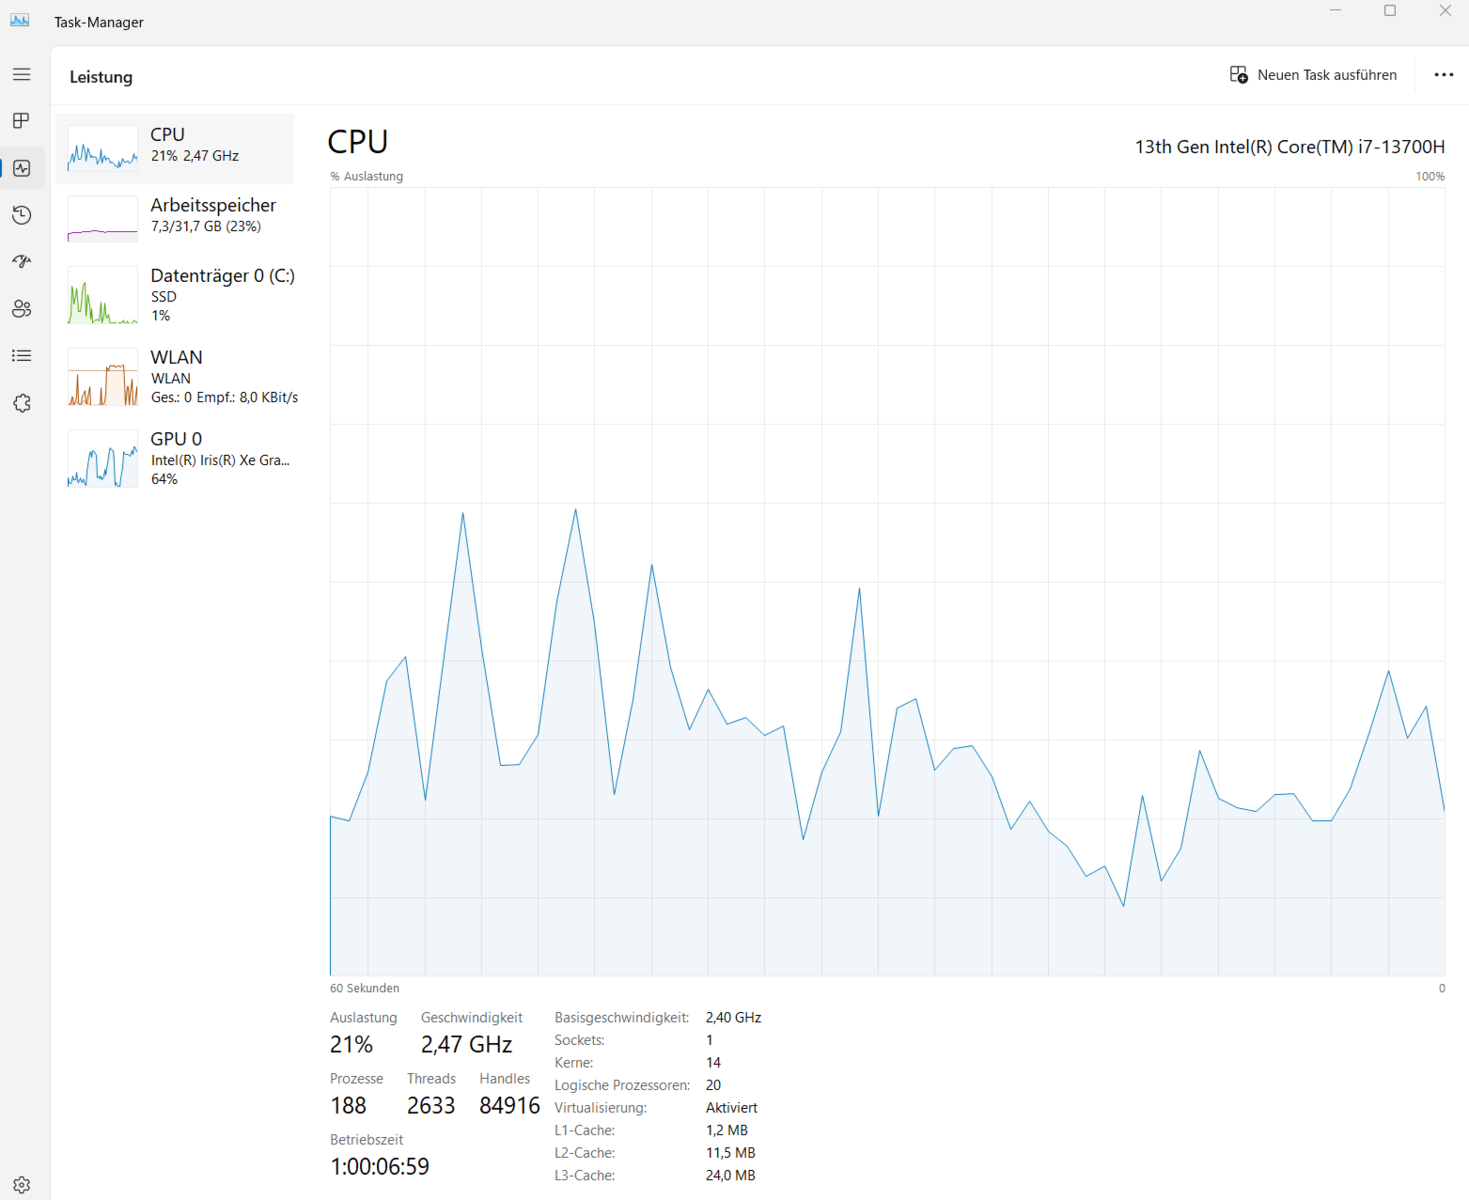
而不是去年的 英特尔酷睿 i7-12700H.Vision16的新机型提供了更新的英特尔酷睿 i7-13700H.虽然前代机型提供了 RTX 3050 Ti,但今年的机型只包含英特尔处理器的集成 GPU。此外,32 GB DDR5 内存和 1 TB M.2 NVMe PCIe SSD 也是软件包的一部分。
测试条件
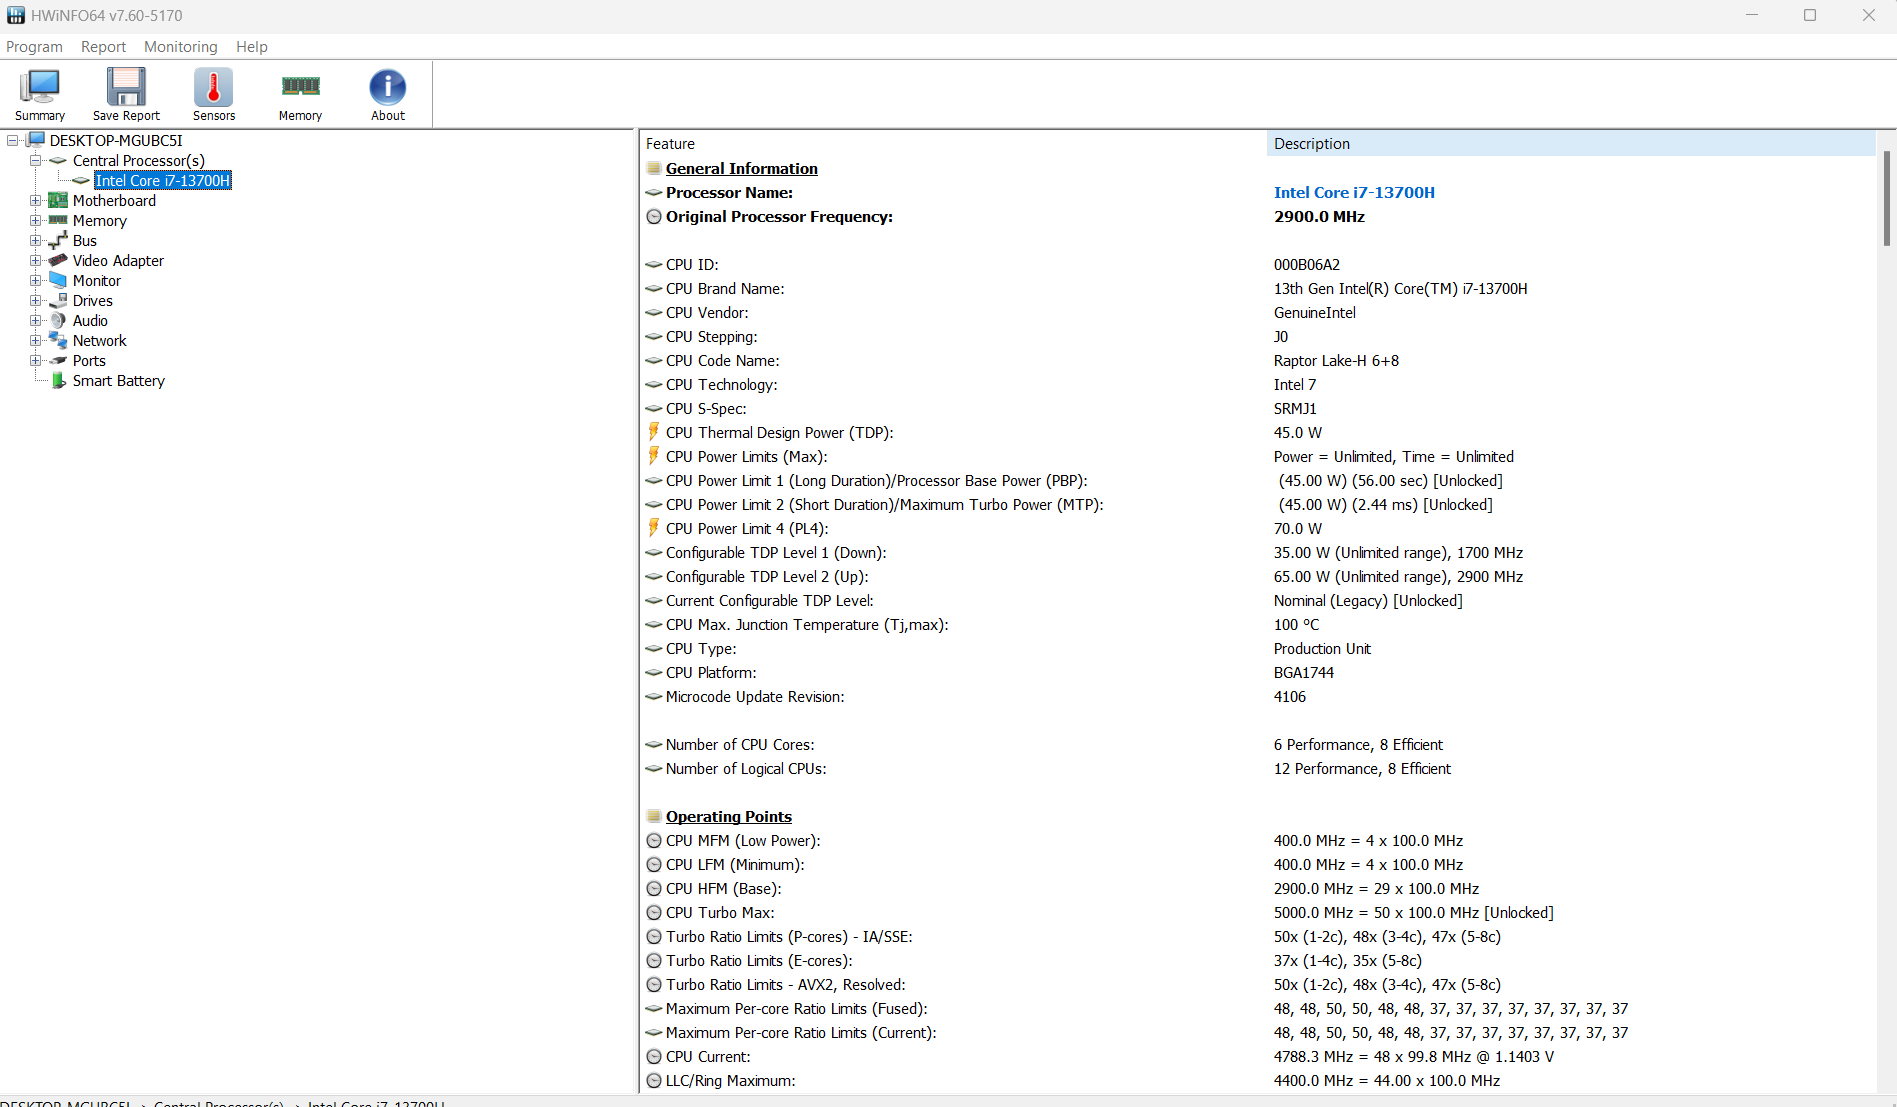
全球国际货运公司在控制中心应用程序中提供多种配置文件,但不再提供手动配置文件。因此,用户无法更改处理器的 TDP 临界值。所有性能基准测试均在 TDP 为 45 W 的 "发烧友 "模式下进行。在申克控制中心应用程序的 "安静 "模式下,TDP 固定为 15 W。
| 发烧级 | 平衡型 | 静音型 | |
|---|---|---|---|
| CPU PL1 (HWInfo) | 45 瓦 | 45 瓦 | 15 瓦 |
| CPU PL2 (HWInfo) | 45 瓦 | 45 瓦 | 15 瓦 |
处理器
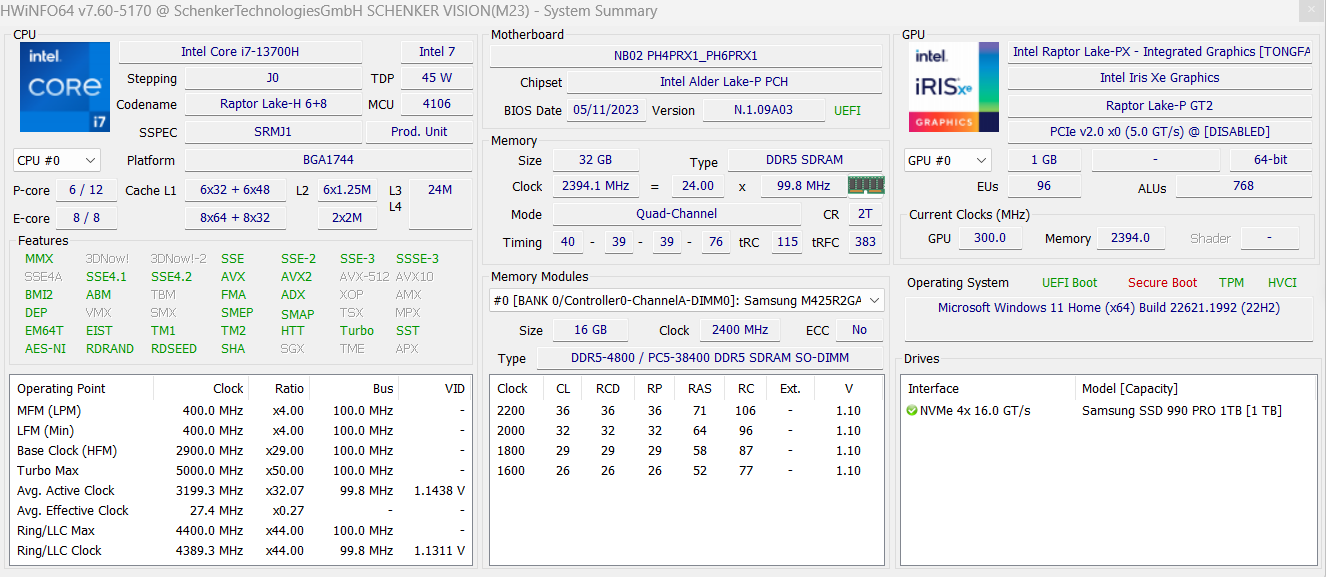
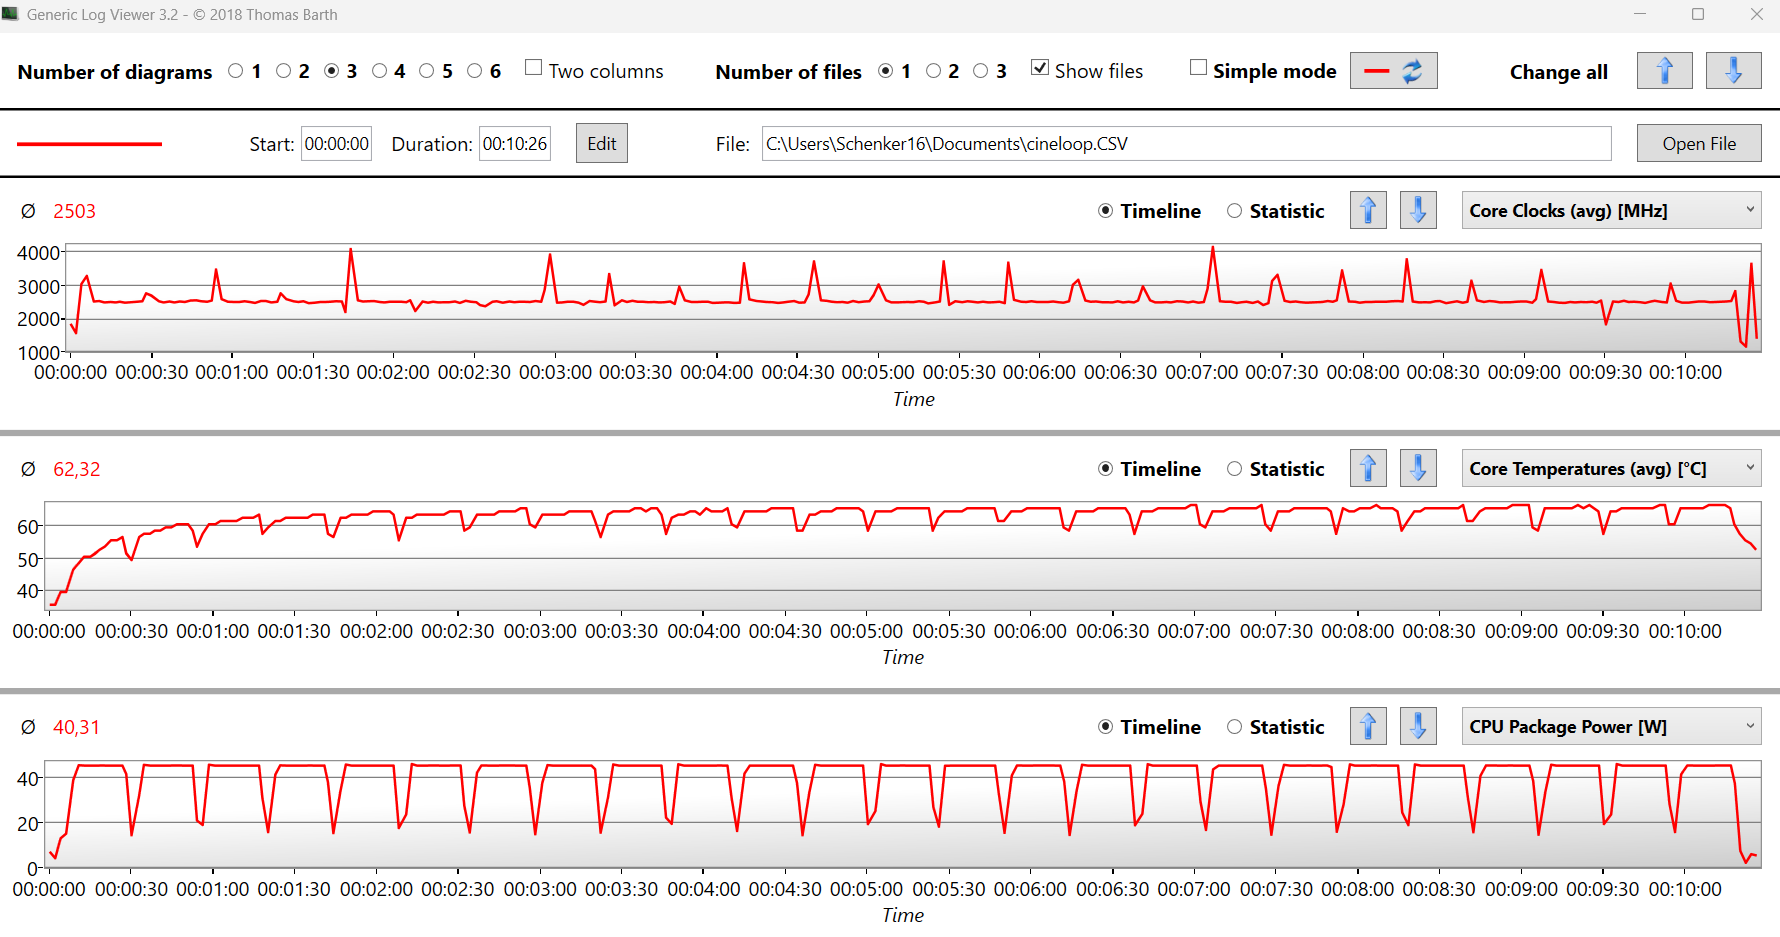
在 Vision 16 中,相同的 酷睿 i7-13700H采用了与 Vision 16 Pro 相同的英特尔猛禽湖一代酷睿 i7-13700H。由于功耗相当有限,温度保持在较低水平,但性能受到了影响,处理器的运行速度与 Vision 16 Pro.在 Cinebench R15 循环中,Vision 16 的多核性能比 Vision 16 Pro 差了约 15%。我们将这一较低的结果归因于 Vision 16 较差的冷却系统。由于我们在 Cinebench 循环中测得的温度较低,仅为 62 度,因此处理器确实有更高的性能表现空间。在电池模式下,CPU 的功耗被限制在 35 W,这使得多核性能降低了 20%。
Cinebench R15 Multi sustained loop
Cinebench R23: Multi Core | Single Core
Cinebench R20: CPU (Multi Core) | CPU (Single Core)
Cinebench R15: CPU Multi 64Bit | CPU Single 64Bit
Blender: v2.79 BMW27 CPU
7-Zip 18.03: 7z b 4 | 7z b 4 -mmt1
Geekbench 5.5: Multi-Core | Single-Core
HWBOT x265 Benchmark v2.2: 4k Preset
LibreOffice : 20 Documents To PDF
R Benchmark 2.5: Overall mean
| CPU Performance rating | |
| Schenker VISION 16 Pro (M23) | |
| Average Intel Core i7-13700H | |
| Acer Swift Go SFG16-71 | |
| Schenker Vision 16 PH6PRX1 | |
| Asus VivoBook S15 M3502RA-L1029W | |
| Average of class Office | |
| LG Gram SuperSlim (2023) | |
| Microsoft Surface Laptop 5 15, i7-1255U | |
| Apple MacBook Air 15 2023 M2 16 GB -5! | |
| Cinebench R23 / Multi Core | |
| Average Intel Core i7-13700H (5890 - 20034, n=29) | |
| Schenker VISION 16 Pro (M23) | |
| Acer Swift Go SFG16-71 | |
| Asus VivoBook S15 M3502RA-L1029W | |
| Schenker Vision 16 PH6PRX1 | |
| Average of class Office (1673 - 22808, n=76, last 2 years) | |
| LG Gram SuperSlim (2023) | |
| Microsoft Surface Laptop 5 15, i7-1255U | |
| Apple MacBook Air 15 2023 M2 16 GB | |
| Cinebench R23 / Single Core | |
| Acer Swift Go SFG16-71 | |
| Schenker VISION 16 Pro (M23) | |
| Schenker Vision 16 PH6PRX1 | |
| Average Intel Core i7-13700H (1323 - 1914, n=29) | |
| LG Gram SuperSlim (2023) | |
| Average of class Office (708 - 2130, n=76, last 2 years) | |
| Microsoft Surface Laptop 5 15, i7-1255U | |
| Apple MacBook Air 15 2023 M2 16 GB | |
| Asus VivoBook S15 M3502RA-L1029W | |
| Cinebench R20 / CPU (Multi Core) | |
| Average Intel Core i7-13700H (2322 - 7674, n=29) | |
| Schenker VISION 16 Pro (M23) | |
| Acer Swift Go SFG16-71 | |
| Asus VivoBook S15 M3502RA-L1029W | |
| Schenker Vision 16 PH6PRX1 | |
| Average of class Office (648 - 8840, n=75, last 2 years) | |
| LG Gram SuperSlim (2023) | |
| Microsoft Surface Laptop 5 15, i7-1255U | |
| Apple MacBook Air 15 2023 M2 16 GB | |
| Cinebench R20 / CPU (Single Core) | |
| Schenker VISION 16 Pro (M23) | |
| Acer Swift Go SFG16-71 | |
| Schenker Vision 16 PH6PRX1 | |
| Average Intel Core i7-13700H (508 - 741, n=29) | |
| LG Gram SuperSlim (2023) | |
| Average of class Office (345 - 816, n=75, last 2 years) | |
| Microsoft Surface Laptop 5 15, i7-1255U | |
| Asus VivoBook S15 M3502RA-L1029W | |
| Apple MacBook Air 15 2023 M2 16 GB | |
| Cinebench R15 / CPU Multi 64Bit | |
| Average Intel Core i7-13700H (905 - 2982, n=29) | |
| Acer Swift Go SFG16-71 | |
| Schenker VISION 16 Pro (M23) | |
| Asus VivoBook S15 M3502RA-L1029W | |
| Schenker Vision 16 PH6PRX1 | |
| Average of class Office (250 - 3380, n=77, last 2 years) | |
| LG Gram SuperSlim (2023) | |
| Microsoft Surface Laptop 5 15, i7-1255U | |
| Apple MacBook Air 15 2023 M2 16 GB | |
| Cinebench R15 / CPU Single 64Bit | |
| Schenker VISION 16 Pro (M23) | |
| Schenker Vision 16 PH6PRX1 | |
| Average Intel Core i7-13700H (213 - 278, n=29) | |
| Acer Swift Go SFG16-71 | |
| Average of class Office (99.5 - 316, n=77, last 2 years) | |
| LG Gram SuperSlim (2023) | |
| Asus VivoBook S15 M3502RA-L1029W | |
| Microsoft Surface Laptop 5 15, i7-1255U | |
| Apple MacBook Air 15 2023 M2 16 GB | |
| Blender / v2.79 BMW27 CPU | |
| Apple MacBook Air 15 2023 M2 16 GB | |
| Microsoft Surface Laptop 5 15, i7-1255U | |
| Average of class Office (158 - 1940, n=76, last 2 years) | |
| LG Gram SuperSlim (2023) | |
| Acer Swift Go SFG16-71 | |
| Asus VivoBook S15 M3502RA-L1029W | |
| Schenker Vision 16 PH6PRX1 | |
| Average Intel Core i7-13700H (169 - 555, n=29) | |
| Schenker VISION 16 Pro (M23) | |
| 7-Zip 18.03 / 7z b 4 | |
| Schenker VISION 16 Pro (M23) | |
| Average Intel Core i7-13700H (27322 - 76344, n=29) | |
| Asus VivoBook S15 M3502RA-L1029W | |
| Acer Swift Go SFG16-71 | |
| Schenker Vision 16 PH6PRX1 | |
| Average of class Office (7098 - 76886, n=77, last 2 years) | |
| LG Gram SuperSlim (2023) | |
| Microsoft Surface Laptop 5 15, i7-1255U | |
| 7-Zip 18.03 / 7z b 4 -mmt1 | |
| Schenker VISION 16 Pro (M23) | |
| Acer Swift Go SFG16-71 | |
| Schenker Vision 16 PH6PRX1 | |
| Average Intel Core i7-13700H (4825 - 6238, n=29) | |
| Asus VivoBook S15 M3502RA-L1029W | |
| Average of class Office (3387 - 6469, n=77, last 2 years) | |
| LG Gram SuperSlim (2023) | |
| Microsoft Surface Laptop 5 15, i7-1255U | |
| Geekbench 5.5 / Multi-Core | |
| Acer Swift Go SFG16-71 | |
| Schenker VISION 16 Pro (M23) | |
| Average Intel Core i7-13700H (6165 - 14215, n=29) | |
| LG Gram SuperSlim (2023) | |
| Average of class Office (1483 - 16999, n=73, last 2 years) | |
| Asus VivoBook S15 M3502RA-L1029W | |
| Schenker Vision 16 PH6PRX1 | |
| Apple MacBook Air 15 2023 M2 16 GB | |
| Microsoft Surface Laptop 5 15, i7-1255U | |
| Geekbench 5.5 / Single-Core | |
| Apple MacBook Air 15 2023 M2 16 GB | |
| Schenker VISION 16 Pro (M23) | |
| Acer Swift Go SFG16-71 | |
| LG Gram SuperSlim (2023) | |
| Schenker Vision 16 PH6PRX1 | |
| Average of class Office (811 - 2175, n=73, last 2 years) | |
| Average Intel Core i7-13700H (1362 - 1919, n=29) | |
| Microsoft Surface Laptop 5 15, i7-1255U | |
| Asus VivoBook S15 M3502RA-L1029W | |
| HWBOT x265 Benchmark v2.2 / 4k Preset | |
| Schenker VISION 16 Pro (M23) | |
| Average Intel Core i7-13700H (6.72 - 21.2, n=29) | |
| Acer Swift Go SFG16-71 | |
| Asus VivoBook S15 M3502RA-L1029W | |
| Schenker Vision 16 PH6PRX1 | |
| Average of class Office (2.21 - 26, n=76, last 2 years) | |
| LG Gram SuperSlim (2023) | |
| Microsoft Surface Laptop 5 15, i7-1255U | |
| LibreOffice / 20 Documents To PDF | |
| Average of class Office (39.9 - 102.3, n=76, last 2 years) | |
| Asus VivoBook S15 M3502RA-L1029W | |
| Average Intel Core i7-13700H (31.3 - 62.4, n=29) | |
| Schenker VISION 16 Pro (M23) | |
| Microsoft Surface Laptop 5 15, i7-1255U | |
| LG Gram SuperSlim (2023) | |
| Acer Swift Go SFG16-71 | |
| Schenker Vision 16 PH6PRX1 | |
| R Benchmark 2.5 / Overall mean | |
| Average of class Office (0.393 - 0.888, n=76, last 2 years) | |
| Microsoft Surface Laptop 5 15, i7-1255U | |
| Asus VivoBook S15 M3502RA-L1029W | |
| LG Gram SuperSlim (2023) | |
| Average Intel Core i7-13700H (0.4308 - 0.607, n=29) | |
| Schenker Vision 16 PH6PRX1 | |
| Acer Swift Go SFG16-71 | |
| Schenker VISION 16 Pro (M23) | |
* ... smaller is better
AIDA64: FP32 Ray-Trace | FPU Julia | CPU SHA3 | CPU Queen | FPU SinJulia | FPU Mandel | CPU AES | CPU ZLib | FP64 Ray-Trace | CPU PhotoWorxx
| Performance rating | |
| Asus VivoBook S15 M3502RA-L1029W | |
| Average Intel Core i7-13700H | |
| Acer Swift Go SFG16-71 | |
| Average of class Office | |
| Schenker Vision 16 PH6PRX1 | |
| Microsoft Surface Laptop 5 15, i7-1255U | |
| LG Gram SuperSlim (2023) | |
| AIDA64 / FP32 Ray-Trace | |
| Asus VivoBook S15 M3502RA-L1029W | |
| Average of class Office (2083 - 31245, n=83, last 2 years) | |
| Average Intel Core i7-13700H (4986 - 18908, n=29) | |
| Acer Swift Go SFG16-71 | |
| Schenker Vision 16 PH6PRX1 | |
| LG Gram SuperSlim (2023) | |
| Microsoft Surface Laptop 5 15, i7-1255U | |
| AIDA64 / FPU Julia | |
| Asus VivoBook S15 M3502RA-L1029W | |
| Average Intel Core i7-13700H (25360 - 92359, n=29) | |
| Acer Swift Go SFG16-71 | |
| Average of class Office (8191 - 125394, n=83, last 2 years) | |
| Schenker Vision 16 PH6PRX1 | |
| Microsoft Surface Laptop 5 15, i7-1255U | |
| LG Gram SuperSlim (2023) | |
| AIDA64 / CPU SHA3 | |
| Average Intel Core i7-13700H (1339 - 4224, n=29) | |
| Asus VivoBook S15 M3502RA-L1029W | |
| Acer Swift Go SFG16-71 | |
| Average of class Office (433 - 5755, n=83, last 2 years) | |
| Schenker Vision 16 PH6PRX1 | |
| Microsoft Surface Laptop 5 15, i7-1255U | |
| LG Gram SuperSlim (2023) | |
| AIDA64 / CPU Queen | |
| Asus VivoBook S15 M3502RA-L1029W | |
| Acer Swift Go SFG16-71 | |
| Average Intel Core i7-13700H (59324 - 107159, n=29) | |
| Schenker Vision 16 PH6PRX1 | |
| LG Gram SuperSlim (2023) | |
| Average of class Office (22784 - 115197, n=67, last 2 years) | |
| Microsoft Surface Laptop 5 15, i7-1255U | |
| AIDA64 / FPU SinJulia | |
| Asus VivoBook S15 M3502RA-L1029W | |
| Average Intel Core i7-13700H (4800 - 11050, n=29) | |
| Acer Swift Go SFG16-71 | |
| Average of class Office (1378 - 18321, n=83, last 2 years) | |
| Schenker Vision 16 PH6PRX1 | |
| LG Gram SuperSlim (2023) | |
| Microsoft Surface Laptop 5 15, i7-1255U | |
| AIDA64 / FPU Mandel | |
| Asus VivoBook S15 M3502RA-L1029W | |
| Average Intel Core i7-13700H (12321 - 45118, n=29) | |
| Acer Swift Go SFG16-71 | |
| Average of class Office (4601 - 66922, n=83, last 2 years) | |
| Schenker Vision 16 PH6PRX1 | |
| Microsoft Surface Laptop 5 15, i7-1255U | |
| LG Gram SuperSlim (2023) | |
| AIDA64 / CPU AES | |
| Asus VivoBook S15 M3502RA-L1029W | |
| Average Intel Core i7-13700H (28769 - 151254, n=29) | |
| Acer Swift Go SFG16-71 | |
| Schenker Vision 16 PH6PRX1 | |
| Average of class Office (4854 - 155900, n=83, last 2 years) | |
| Microsoft Surface Laptop 5 15, i7-1255U | |
| LG Gram SuperSlim (2023) | |
| AIDA64 / CPU ZLib | |
| Average Intel Core i7-13700H (389 - 1215, n=29) | |
| Acer Swift Go SFG16-71 | |
| Schenker Vision 16 PH6PRX1 | |
| Asus VivoBook S15 M3502RA-L1029W | |
| Average of class Office (114.6 - 1366, n=83, last 2 years) | |
| Microsoft Surface Laptop 5 15, i7-1255U | |
| LG Gram SuperSlim (2023) | |
| AIDA64 / FP64 Ray-Trace | |
| Average of class Office (1109 - 17834, n=83, last 2 years) | |
| Asus VivoBook S15 M3502RA-L1029W | |
| Average Intel Core i7-13700H (2540 - 10135, n=29) | |
| Acer Swift Go SFG16-71 | |
| Schenker Vision 16 PH6PRX1 | |
| Microsoft Surface Laptop 5 15, i7-1255U | |
| LG Gram SuperSlim (2023) | |
| AIDA64 / CPU PhotoWorxx | |
| Schenker Vision 16 PH6PRX1 | |
| Microsoft Surface Laptop 5 15, i7-1255U | |
| Acer Swift Go SFG16-71 | |
| Average Intel Core i7-13700H (12872 - 52727, n=29) | |
| LG Gram SuperSlim (2023) | |
| Average of class Office (11090 - 65229, n=83, last 2 years) | |
| Asus VivoBook S15 M3502RA-L1029W | |
系统性能
与宏碁 Swift Go SFG16-71再次表明,Vision 16 的酷睿 i7-13700H 受限于较低的 TDP。该处理器在合成基准测试中的性能略低于平均水平,不过这款超极本的主观性能还是非常不错的。在浏览网页、4K Youtube 视频或同时进行 Office 程序和浏览的多任务处理时,Vision 16 没有显示出任何变慢的迹象。
CrossMark: Overall | Productivity | Creativity | Responsiveness
| PCMark 10 / Score | |
| Asus VivoBook S15 M3502RA-L1029W | |
| Average of class Office (2601 - 9298, n=68, last 2 years) | |
| Acer Swift Go SFG16-71 | |
| Average Intel Core i7-13700H, Intel Iris Xe Graphics G7 96EUs (5531 - 6247, n=5) | |
| LG Gram SuperSlim (2023) | |
| Schenker Vision 16 PH6PRX1 | |
| Microsoft Surface Laptop 5 15, i7-1255U | |
| PCMark 10 / Essentials | |
| LG Gram SuperSlim (2023) | |
| Acer Swift Go SFG16-71 | |
| Average Intel Core i7-13700H, Intel Iris Xe Graphics G7 96EUs (9648 - 11401, n=5) | |
| Asus VivoBook S15 M3502RA-L1029W | |
| Microsoft Surface Laptop 5 15, i7-1255U | |
| Average of class Office (3245 - 11594, n=68, last 2 years) | |
| Schenker Vision 16 PH6PRX1 | |
| PCMark 10 / Productivity | |
| Average of class Office (5336 - 17243, n=68, last 2 years) | |
| Asus VivoBook S15 M3502RA-L1029W | |
| Acer Swift Go SFG16-71 | |
| Average Intel Core i7-13700H, Intel Iris Xe Graphics G7 96EUs (7072 - 7691, n=5) | |
| Microsoft Surface Laptop 5 15, i7-1255U | |
| Schenker Vision 16 PH6PRX1 | |
| LG Gram SuperSlim (2023) | |
| PCMark 10 / Digital Content Creation | |
| Asus VivoBook S15 M3502RA-L1029W | |
| Average of class Office (2049 - 13541, n=68, last 2 years) | |
| Acer Swift Go SFG16-71 | |
| Average Intel Core i7-13700H, Intel Iris Xe Graphics G7 96EUs (6413 - 7727, n=5) | |
| LG Gram SuperSlim (2023) | |
| Schenker Vision 16 PH6PRX1 | |
| Microsoft Surface Laptop 5 15, i7-1255U | |
| CrossMark / Overall | |
| Acer Swift Go SFG16-71 | |
| Schenker Vision 16 PH6PRX1 | |
| Average Intel Core i7-13700H, Intel Iris Xe Graphics G7 96EUs (1548 - 1868, n=5) | |
| LG Gram SuperSlim (2023) | |
| Asus VivoBook S15 M3502RA-L1029W | |
| Apple MacBook Air 15 2023 M2 16 GB | |
| Average of class Office (381 - 2010, n=75, last 2 years) | |
| Microsoft Surface Laptop 5 15, i7-1255U | |
| CrossMark / Productivity | |
| Acer Swift Go SFG16-71 | |
| Schenker Vision 16 PH6PRX1 | |
| Average Intel Core i7-13700H, Intel Iris Xe Graphics G7 96EUs (1500 - 1787, n=5) | |
| LG Gram SuperSlim (2023) | |
| Asus VivoBook S15 M3502RA-L1029W | |
| Microsoft Surface Laptop 5 15, i7-1255U | |
| Average of class Office (464 - 1880, n=75, last 2 years) | |
| Apple MacBook Air 15 2023 M2 16 GB | |
| CrossMark / Creativity | |
| Acer Swift Go SFG16-71 | |
| Apple MacBook Air 15 2023 M2 16 GB | |
| Average Intel Core i7-13700H, Intel Iris Xe Graphics G7 96EUs (1620 - 2009, n=5) | |
| Asus VivoBook S15 M3502RA-L1029W | |
| LG Gram SuperSlim (2023) | |
| Schenker Vision 16 PH6PRX1 | |
| Average of class Office (319 - 2361, n=75, last 2 years) | |
| Microsoft Surface Laptop 5 15, i7-1255U | |
| CrossMark / Responsiveness | |
| Acer Swift Go SFG16-71 | |
| LG Gram SuperSlim (2023) | |
| Schenker Vision 16 PH6PRX1 | |
| Average Intel Core i7-13700H, Intel Iris Xe Graphics G7 96EUs (1439 - 1715, n=5) | |
| Asus VivoBook S15 M3502RA-L1029W | |
| Average of class Office (360 - 1820, n=75, last 2 years) | |
| Microsoft Surface Laptop 5 15, i7-1255U | |
| Apple MacBook Air 15 2023 M2 16 GB | |
| PCMark 10 Score | 5531 points | |
Help | ||
| AIDA64 / Memory Copy | |
| Average of class Office (20075 - 110930, n=80, last 2 years) | |
| Schenker Vision 16 PH6PRX1 | |
| Average Intel Core i7-13700H (24334 - 78081, n=29) | |
| AIDA64 / Memory Read | |
| Schenker Vision 16 PH6PRX1 | |
| Average of class Office (10084 - 128030, n=81, last 2 years) | |
| Average Intel Core i7-13700H (23681 - 79656, n=29) | |
| AIDA64 / Memory Write | |
| Average of class Office (20073 - 119858, n=81, last 2 years) | |
| Average Intel Core i7-13700H (22986 - 99898, n=29) | |
| Schenker Vision 16 PH6PRX1 | |
| AIDA64 / Memory Latency | |
| Average of class Office (7.6 - 162.9, n=76, last 2 years) | |
| Average Intel Core i7-13700H (82.4 - 136.8, n=29) | |
| Schenker Vision 16 PH6PRX1 | |
* ... smaller is better
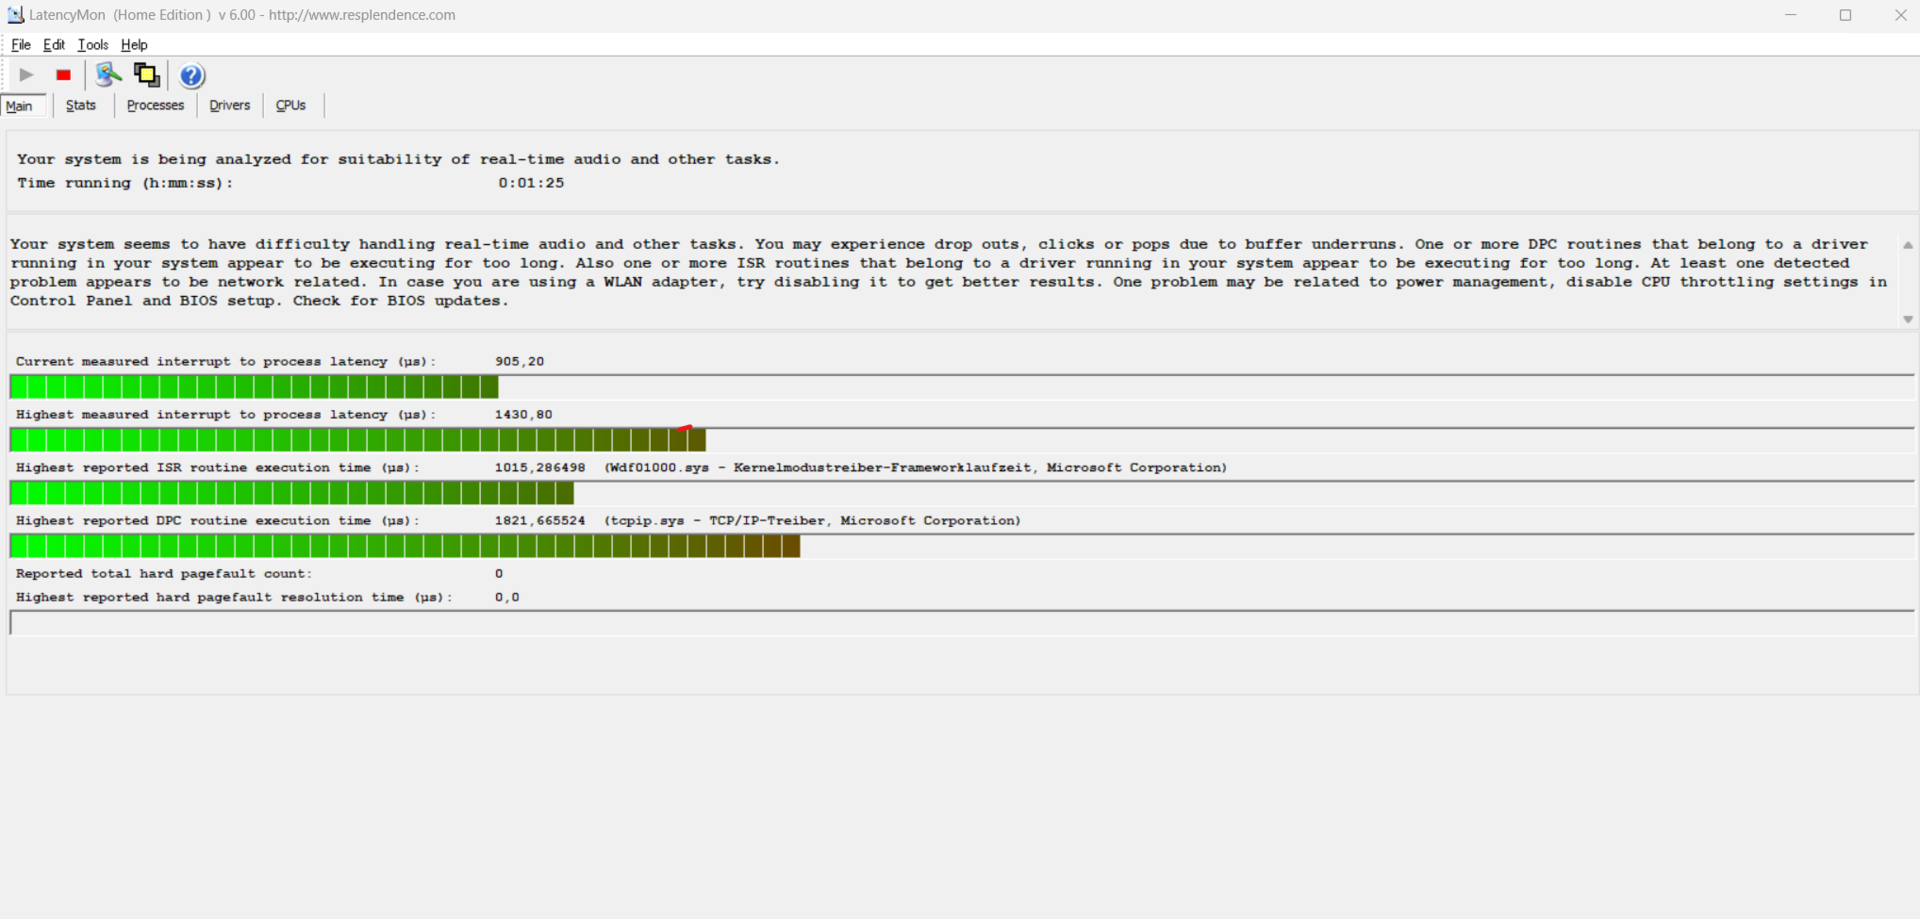
DPC 延迟
我们的标准延迟测试(上网、4K Youtube、CPU 负载)显示了一些 DPC 延迟问题。在测试状态下,Vision 16 不能完全用于实时音频,但 BIOS 更新可以解决这个问题。
| DPC Latencies / LatencyMon - interrupt to process latency (max), Web, Youtube, Prime95 | |
| Acer Swift Go SFG16-71 | |
| LG Gram SuperSlim (2023) | |
| Schenker Vision 16 PH6PRX1 | |
| Microsoft Surface Laptop 5 15, i7-1255U | |
| Asus VivoBook S15 M3502RA-L1029W | |
* ... smaller is better
大容量存储器
申克 Vision 16 有两个用于固态硬盘的 PCIe 4.0 插槽。我们的评测样本是 1 TB 三星 990 Pro M.2 固态硬盘。DiskSpd 的基准测试结果显示,固态硬盘的读写速度明显不足。AS SSD 的测量结果则更好,速度更符合高性能 SSD 的要求。Vision 16 Pro 的评测样品也使用了同样的三星 990 Pro 固态硬盘,并取得了更好的成绩。

* ... smaller is better
Sustained load Read: DiskSpd Read Loop, Queue Depth 8
图形卡
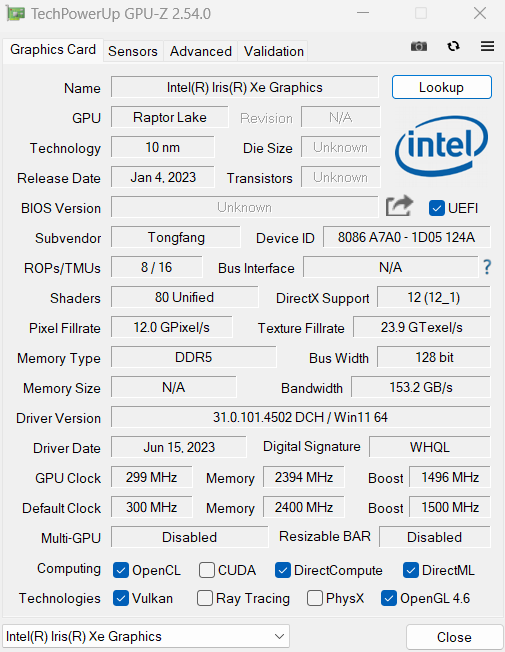
2022 年的 Vision 16 配备了 RTX 3050。今年的机型只集成了英特尔 Iris Xe Graphics G7,有 96 个 EU。日常工作没问题,但不适合游戏。在合成基准测试中,iGPU 的性能至少比 Intel Iris Xe Graphics G7 的平均性能高出 11%。
| 3DMark 11 Performance | 7613 points | |
| 3DMark Cloud Gate Standard Score | 21964 points | |
| 3DMark Fire Strike Score | 5433 points | |
| 3DMark Time Spy Score | 1953 points | |
Help | ||
| Blender - v3.3 Classroom CPU | |
| Average Intel Iris Xe Graphics G7 96EUs (336 - 1259, n=109) | |
| Average of class Office (245 - 3219, n=75, last 2 years) | |
| Schenker Vision 16 PH6PRX1 | |
* ... smaller is better
游戏性能
Iris Xe Graphics G7 是英特尔最强的 iGPU,但游戏性能较低。AMD iGPU 如Radeon 680M或 Radeon 780M都更为强大。只要保持较低的分辨率和图形设置,老游戏仍然可以玩。如果没有外置 GPU(可通过 Thunderbolt 4 连接),240 Hz 的屏幕仍然会被浪费。
| The Witcher 3 - 1920x1080 Ultra Graphics & Postprocessing (HBAO+) | |
| Apple MacBook Air 15 2023 M2 16 GB | |
| Asus VivoBook S15 M3502RA-L1029W | |
| Average of class Office (14.8 - 28.1, n=3, last 2 years) | |
| Schenker Vision 16 PH6PRX1 | |
| Acer Swift Go SFG16-71 | |
| LG Gram SuperSlim (2023) | |
| Microsoft Surface Laptop 5 15, i7-1255U | |
| GTA V - 1920x1080 Highest AA:4xMSAA + FX AF:16x | |
| Asus VivoBook S15 M3502RA-L1029W | |
| Average of class Office (5.77 - 45.3, n=69, last 2 years) | |
| Acer Swift Go SFG16-71 | |
| Schenker Vision 16 PH6PRX1 | |
| Microsoft Surface Laptop 5 15, i7-1255U | |
| Final Fantasy XV Benchmark - 1920x1080 High Quality | |
| Average of class Office (8.09 - 79.5, n=71, last 2 years) | |
| Asus VivoBook S15 M3502RA-L1029W | |
| Schenker Vision 16 PH6PRX1 | |
| Acer Swift Go SFG16-71 | |
| LG Gram SuperSlim (2023) | |
| Microsoft Surface Laptop 5 15, i7-1255U | |
| Strange Brigade - 1920x1080 ultra AA:ultra AF:16 | |
| Asus VivoBook S15 M3502RA-L1029W | |
| Average of class Office (12.9 - 142.1, n=53, last 2 years) | |
| Acer Swift Go SFG16-71 | |
| Schenker Vision 16 PH6PRX1 | |
| Microsoft Surface Laptop 5 15, i7-1255U | |
| LG Gram SuperSlim (2023) | |
Witcher 3 FPS diagramm
| low | med. | high | ultra | QHD | 4K | |
|---|---|---|---|---|---|---|
| GTA V (2015) | 117.4 | 104.3 | 24.8 | 10.4 | 6.7 | |
| The Witcher 3 (2015) | 45 | 35 | 23 | 19 | ||
| Dota 2 Reborn (2015) | 95.5 | 70.8 | 61.3 | 52.4 | ||
| Final Fantasy XV Benchmark (2018) | 44 | 24 | 18 | 12 | 7 | |
| X-Plane 11.11 (2018) | 35 | 33 | 32 | 27 | ||
| Far Cry 5 (2018) | 52 | 28 | 26 | 24 | 17 | |
| Strange Brigade (2018) | 81.7 | 39.7 | 31.7 | 25.1 | ||
| F1 23 (2023) | 39.4 | 35.5 | 24.8 | 18.4 |
排放量
噪音
Vision 16 的排放是可以接受的。空转时,风扇几乎始终运转,在安静的条件下可以听到。在最大负载下,我们测得的噪音为 45 dB(a),这在大多数应用中都达不到。在日常使用中,风扇更有可能以 33.8 dB(a) 的噪音运行,相当安静。在正常办公使用中,超极本几乎从未保持安静,不过风扇噪音频率较低,不会造成干扰。但对噪音比较敏感的用户还是会感到不舒服。
Noise level
| Idle |
| 25.5 / 28.7 / 29.1 dB(A) |
| Load |
| 33.8 / 44.9 dB(A) |
 | ||
30 dB silent 40 dB(A) audible 50 dB(A) loud |
||
min: | ||
| Schenker Vision 16 PH6PRX1 Iris Xe G7 96EUs, i7-13700H, Samsung 990 Pro 1 TB | Apple MacBook Air 15 2023 M2 16 GB M2 10-Core GPU, M2, Apple SSD AP1024Z | Acer Swift Go SFG16-71 Iris Xe G7 96EUs, i7-13700H, Micron 2400 MTFDKBA1T0QFM | LG Gram SuperSlim (2023) Iris Xe G7 96EUs, i7-1360P, SK hynix PC801 HFS001TEJ9X101N | Microsoft Surface Laptop 5 15, i7-1255U Iris Xe G7 96EUs, i7-1255U, SK Hynix BC711 512GB HFM512GD3GX013N | Asus VivoBook S15 M3502RA-L1029W Radeon 680M, R7 6800H, WD PC SN735 SDBPNHH-512G | |
|---|---|---|---|---|---|---|
| Noise | -4% | 1% | 10% | -17% | ||
| off / environment * (dB) | 25.5 | 25.7 -1% | 25.2 1% | 23.3 9% | 26 -2% | |
| Idle Minimum * (dB) | 25.5 | 26.1 -2% | 25.2 1% | 23.3 9% | 26 -2% | |
| Idle Average * (dB) | 28.7 | 26.1 9% | 25.2 12% | 23.3 19% | 26 9% | |
| Idle Maximum * (dB) | 29.1 | 27.2 7% | 25.2 13% | 23.3 20% | 28.1 3% | |
| Load Average * (dB) | 33.8 | 44.2 -31% | 43.1 -28% | 35 -4% | 56.9 -68% | |
| Witcher 3 ultra * (dB) | 37.6 | 38.1 -1% | ||||
| Load Maximum * (dB) | 44.9 | 47.5 -6% | 43.3 4% | 38.1 15% | 62.6 -39% |
* ... smaller is better
热量
尽管风扇声音很小,但 Vision 16 仍然保持了相对低的温度。负载情况下,键盘上方热点的掌托温度达到 28.5 摄氏度/83 华氏度。在负载情况下,热点位于键盘中央,温度达到 42 摄氏度/108 华氏度,是一个令人不舒服的温度。但在日常使用中通常不会达到这一最高负载温度。
两个风扇从底部吸入空气并从背面排出。
(±) The maximum temperature on the upper side is 41.1 °C / 106 F, compared to the average of 34.3 °C / 94 F, ranging from 21.2 to 62.5 °C for the class Office.
(±) The bottom heats up to a maximum of 42 °C / 108 F, compared to the average of 36.8 °C / 98 F
(+) In idle usage, the average temperature for the upper side is 25.7 °C / 78 F, compared to the device average of 29.5 °C / 85 F.
(+) Playing The Witcher 3, the average temperature for the upper side is 28.8 °C / 84 F, compared to the device average of 29.5 °C / 85 F.
(+) The palmrests and touchpad are cooler than skin temperature with a maximum of 28.2 °C / 82.8 F and are therefore cool to the touch.
(±) The average temperature of the palmrest area of similar devices was 27.5 °C / 81.5 F (-0.7 °C / -1.3 F).
| Schenker Vision 16 PH6PRX1 Intel Core i7-13700H, Intel Iris Xe Graphics G7 96EUs | Apple MacBook Air 15 2023 M2 16 GB Apple M2, Apple M2 10-Core GPU | Acer Swift Go SFG16-71 Intel Core i7-13700H, Intel Iris Xe Graphics G7 96EUs | LG Gram SuperSlim (2023) Intel Core i7-1360P, Intel Iris Xe Graphics G7 96EUs | Microsoft Surface Laptop 5 15, i7-1255U Intel Core i7-1255U, Intel Iris Xe Graphics G7 96EUs | Asus VivoBook S15 M3502RA-L1029W AMD Ryzen 7 6800H, AMD Radeon 680M | |
|---|---|---|---|---|---|---|
| Heat | 1% | -13% | -23% | 3% | -21% | |
| Maximum Upper Side * (°C) | 41.1 | 45.1 -10% | 44.4 -8% | 43.9 -7% | 44.6 -9% | 50.2 -22% |
| Maximum Bottom * (°C) | 42 | 42.5 -1% | 48 -14% | 50.4 -20% | 47.4 -13% | 50.2 -20% |
| Idle Upper Side * (°C) | 28.5 | 25.9 9% | 31.9 -12% | 35.8 -26% | 22.6 21% | 32.1 -13% |
| Idle Bottom * (°C) | 26.8 | 25.8 4% | 31.9 -19% | 37.5 -40% | 23.3 13% | 34.6 -29% |
* ... smaller is better
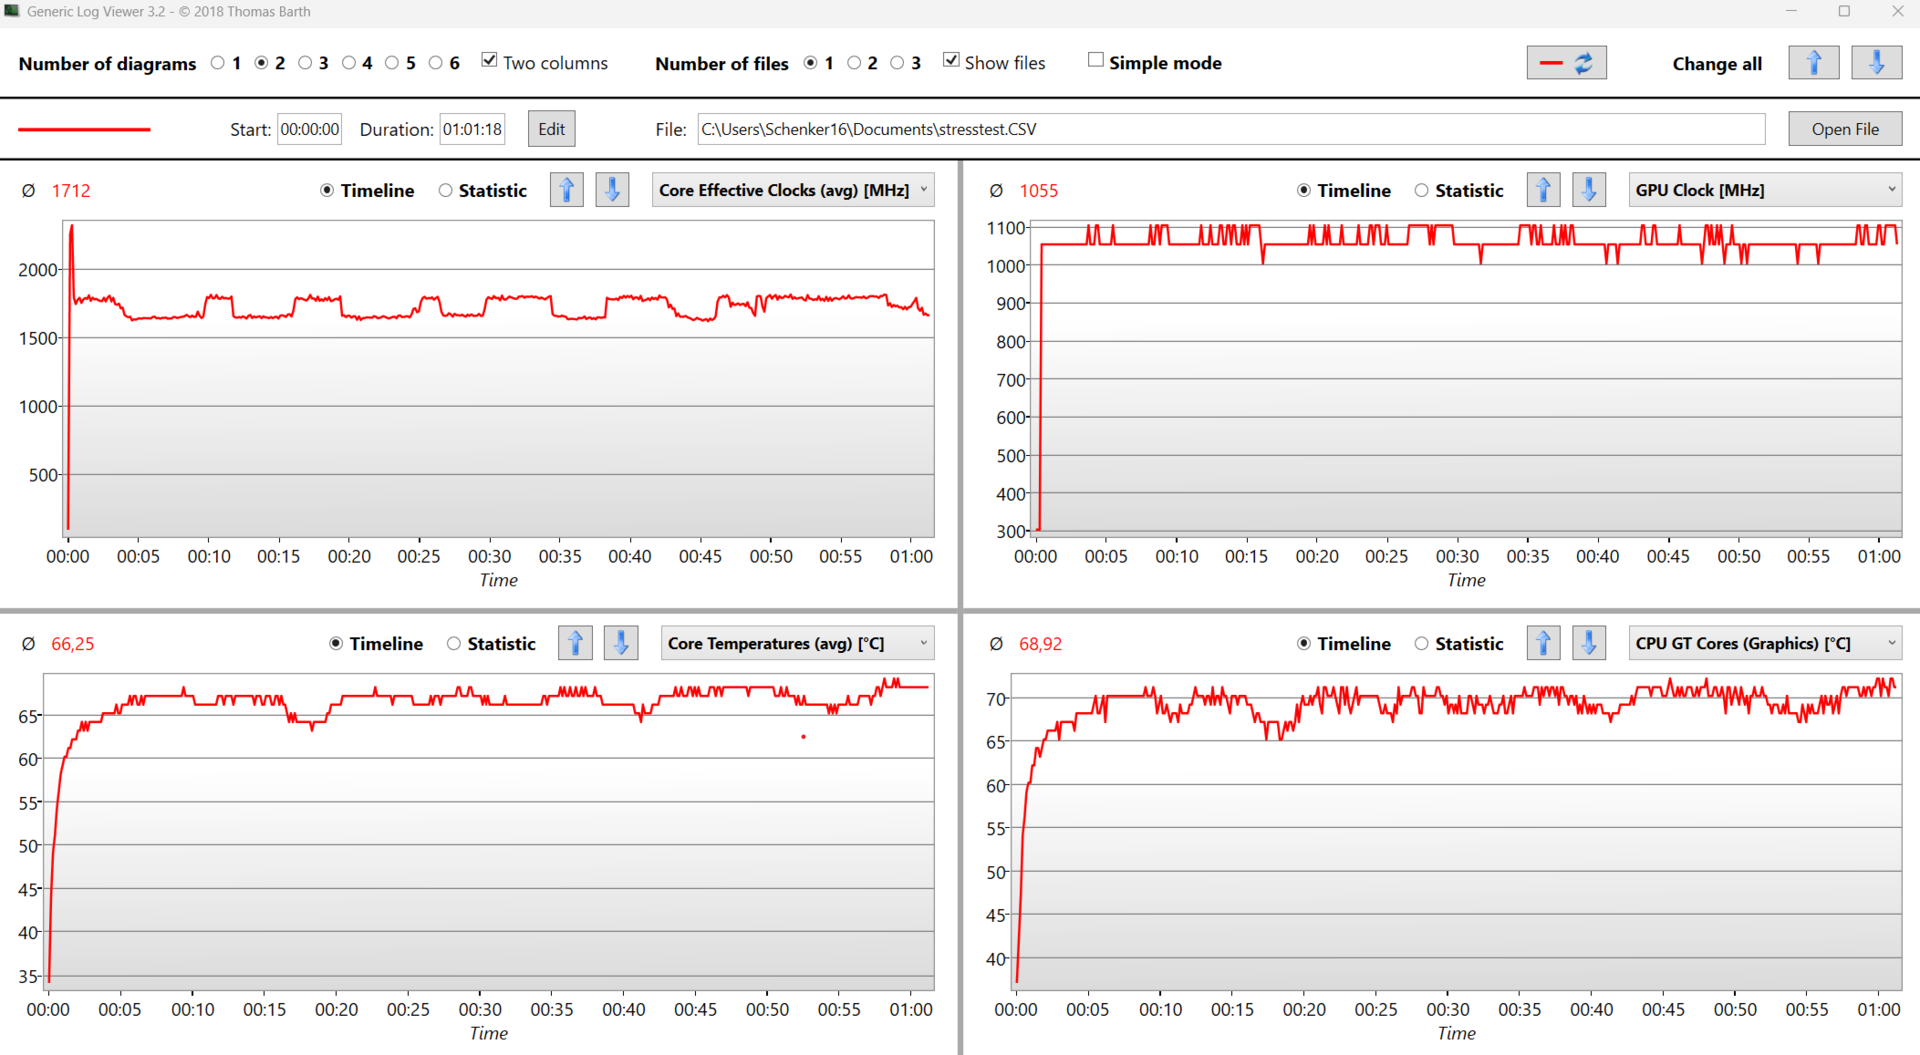
压力测试
在压力测试(Prime95 和 Furmark)开始时,CPU 频率达到 2.5 GHz,但很快就稳定在 1.6 至 1.7 GHz 之间。在 Witcher 循环测试中,性能在压力测试后期趋于稳定,保持在 1.7 GHz。CPU 的温度保持在较低水平,平均温度为 66 摄氏度/150 华氏度,这可能与低 TDP 有关。
发言人
扬声器系统与 Vision 16 Pro 相同,与前代产品相比没有变化。高音精准,但底音不足。
Schenker Vision 16 PH6PRX1 audio analysis
(±) | speaker loudness is average but good (78.4 dB)
Bass 100 - 315 Hz
(-) | nearly no bass - on average 15.5% lower than median
(±) | linearity of bass is average (11.9% delta to prev. frequency)
Mids 400 - 2000 Hz
(+) | balanced mids - only 3.6% away from median
(+) | mids are linear (3.2% delta to prev. frequency)
Highs 2 - 16 kHz
(+) | balanced highs - only 2.9% away from median
(+) | highs are linear (3.9% delta to prev. frequency)
Overall 100 - 16.000 Hz
(+) | overall sound is linear (14.7% difference to median)
Compared to same class
» 13% of all tested devices in this class were better, 4% similar, 83% worse
» The best had a delta of 7%, average was 21%, worst was 53%
Compared to all devices tested
» 19% of all tested devices were better, 4% similar, 77% worse
» The best had a delta of 4%, average was 23%, worst was 134%
Acer Swift Go SFG16-71 audio analysis
(±) | speaker loudness is average but good (81.6 dB)
Bass 100 - 315 Hz
(-) | nearly no bass - on average 18.1% lower than median
(±) | linearity of bass is average (10% delta to prev. frequency)
Mids 400 - 2000 Hz
(+) | balanced mids - only 1% away from median
(+) | mids are linear (4.9% delta to prev. frequency)
Highs 2 - 16 kHz
(+) | balanced highs - only 2.4% away from median
(+) | highs are linear (6.6% delta to prev. frequency)
Overall 100 - 16.000 Hz
(+) | overall sound is linear (13% difference to median)
Compared to same class
» 26% of all tested devices in this class were better, 5% similar, 70% worse
» The best had a delta of 5%, average was 17%, worst was 45%
Compared to all devices tested
» 13% of all tested devices were better, 3% similar, 85% worse
» The best had a delta of 4%, average was 23%, worst was 134%
能源管理 - 作为办公笔记本电脑,耗电量太大
耗电量
对于没有专用图形处理器的超极本来说,空闲时的耗电量明显高于同类设备。功耗较高的原因可能是英特尔的 H 处理器,因为办公笔记本电脑通常使用 U/P CPU。AMD 处理器在这方面更具优势。华硕华硕 VivoBook S15尽管采用了 OLED 显示屏,但由于采用了功耗更低的处理器,因此效率更高。在负载情况下,耗电量趋于正常,有时甚至低于其他笔记本电脑。
| Off / Standby | |
| Idle | |
| Load |
|
Key:
min: | |
| Schenker Vision 16 PH6PRX1 i7-13700H, Iris Xe G7 96EUs, Samsung 990 Pro 1 TB, IPS, 2560x1600, 16" | Apple MacBook Air 15 2023 M2 16 GB M2, M2 10-Core GPU, Apple SSD AP1024Z, IPS, 2880x1864, 15.3" | Acer Swift Go SFG16-71 i7-13700H, Iris Xe G7 96EUs, Micron 2400 MTFDKBA1T0QFM, OLED, 3200x2000, 16" | LG Gram SuperSlim (2023) i7-1360P, Iris Xe G7 96EUs, SK hynix PC801 HFS001TEJ9X101N, OLED, 1920x1080, 15.6" | Microsoft Surface Laptop 5 15, i7-1255U i7-1255U, Iris Xe G7 96EUs, SK Hynix BC711 512GB HFM512GD3GX013N, IPS, 2496x1664, 15" | Asus VivoBook S15 M3502RA-L1029W R7 6800H, Radeon 680M, WD PC SN735 SDBPNHH-512G, OLED, 1920x1080, 15.6" | Average Intel Iris Xe Graphics G7 96EUs | Average of class Office | |
|---|---|---|---|---|---|---|---|---|
| Power Consumption | 44% | 11% | 26% | 27% | 8% | 21% | 31% | |
| Idle Minimum * (Watt) | 6.3 | 2.2 65% | 5.8 8% | 4.2 33% | 3.8 40% | 4.4 30% | 5.51 ? 13% | 4.26 ? 32% |
| Idle Average * (Watt) | 14.4 | 10 31% | 6 58% | 8.9 38% | 8.2 43% | 5.1 65% | 8.66 ? 40% | 7.31 ? 49% |
| Idle Maximum * (Watt) | 16.2 | 10.1 38% | 6.9 57% | 10.3 36% | 8.4 48% | 9.3 43% | 10.9 ? 33% | 8.55 ? 47% |
| Load Average * (Watt) | 46.2 | 33.6 27% | 59 -28% | 47 -2% | 50.1 -8% | 67 -45% | 45.6 ? 1% | 43.8 ? 5% |
| Witcher 3 ultra * (Watt) | 49.4 | 27.8 44% | 61.1 -24% | 43.8 11% | 38.8 21% | 66.4 -34% | ||
| Load Maximum * (Watt) | 85.2 | 37.2 56% | 92 -8% | 49 42% | 69.6 18% | 93.5 -10% | 67.8 ? 20% | 64.5 ? 24% |
* ... smaller is better
Power consumption Witcher 3 / stress test
Power consumption external monitor
电池寿命
尽管配备了 80 Wh 的电池,Vision 16 的电池续航时间并不理想。在我们的 WiFi 测试中,屏幕亮度为 150 cd/m²,笔记本电脑的续航时间几乎正好为 8 小时。对于一款办公笔记本电脑来说,H 处理器实在是太耗电了。与配备 RTX 4070 的 Vision 16 pro 相比,去掉专用 GPU 的 Vision 16 在电池续航时间方面没有任何优势。
在 WiFi 脚本最大亮度下,Vision 16 的电池续航时间进一步缩短至 6 小时 30 分钟。
| Schenker Vision 16 PH6PRX1 i7-13700H, Iris Xe G7 96EUs, 80 Wh | Apple MacBook Air 15 2023 M2 16 GB M2, M2 10-Core GPU, 66.5 Wh | Acer Swift Go SFG16-71 i7-13700H, Iris Xe G7 96EUs, 65 Wh | LG Gram SuperSlim (2023) i7-1360P, Iris Xe G7 96EUs, 60 Wh | Microsoft Surface Laptop 5 15, i7-1255U i7-1255U, Iris Xe G7 96EUs, 47.4 Wh | Asus VivoBook S15 M3502RA-L1029W R7 6800H, Radeon 680M, 70 Wh | Schenker VISION 16 Pro (M23) i7-13700H, GeForce RTX 4070 Laptop GPU, 80 Wh | Average of class Office | |
|---|---|---|---|---|---|---|---|---|
| Battery runtime | 68% | -13% | 40% | -2% | -9% | -26% | 18% | |
| WiFi v1.3 (h) | 8 | 16.6 108% | 7.8 -2% | 12.5 56% | 8.6 8% | 11.5 44% | 7.8 -2% | 13.2 ? 65% |
| Load (h) | 2.6 | 3.3 27% | 2 -23% | 3.2 23% | 2.3 -12% | 1 -62% | 1.3 -50% | 1.808 ? -30% |
| H.264 (h) | 16.8 | 14.7 | 9.7 | 12.8 | 7.8 | 15.5 ? | ||
| Reader / Idle (h) | 27.5 | 24.5 ? |
Pros
Cons
评语:Vision 16 拥有丰富的端口选择,但处理器性能有限
今年的 Vision 16 配备了最新的英特尔 Raptor Lake CPU、改进的冷却系统和更快的 240 Hz 屏幕。处理器的 TDP 限制在 45 W,从而保持了较低的温度。不过,这也限制了英特尔 H 处理器的性能。Vision 16 的机身由镁合金制成,质感上乘。这使得这款 16 英寸笔记本电脑的重量仅为 1.5 千克,在同类产品中属于轻量级。
与以往型号不同的是,TDP 不再由用户在申克控制中心进行控制。由于 CPU 在压力测试(Prime95 和 FurMark)中只能达到 70 摄氏度,该设备可能会有更好的表现。可定制的 TDP 可以带来更好的性能。
除键盘中心区域外,Vision 16 的散热效果相当不错。即使在负载情况下,风扇噪音也是可以承受的。不过,风扇几乎从未保持真正的安静,即使在空转时也总是以较低的噪音运行。考虑到低 TDP 对英特尔 H 芯片的限制,P/U 系列 CPU 可能更适合 Vision 16。酷睿 i7-13700H 在功耗方面存在劣势,因此申克 16 的功耗高于同类竞争对手。
在评测中,我们还发现了内部 M.2 固态硬盘和 SD 读卡器的问题。两者在速度上都存在缺陷。
尽管机身轻薄,但申克 Vision 16 的性能、端口选择和可升级性都达到了很好的水平。
新的哑光 IPS 显示屏有了明显改善,校准效果很好,甚至在我们自己校准之前就已经校准好了,非常适合简单的照片编辑。对于办公笔记本电脑来说,240 Hz 的刷新率并不常见。它创造了流畅的用户体验,但笔记本电脑的游戏功能不够强大,浪费了面板的部分潜力。该面板没有覆盖更广的色域,也不支持 HDR,但没有 PWM。
作为申克 Vision 16 的替代产品,Vision 16 Pro 是一个更强大的变体,尽管处理器相同,但 CPU 速度更快,还可选配 RTX 4070 CPU。Acer Swift Go 16 使用相同的处理器,但允许更高的 TDP(80 瓦)。此外,Acer 还使用 OLED 屏幕。不过,这两款产品都没有 Vision 16 重量轻。
定价和可用性
新款 Vision 16 2023 在德国 Bestware 有售,起价 1424 欧元。我们的评测配置为 32 GB 内存和 1 TB M.2 Samsung 990 Pro SSD,价格为 1,661 欧元。
Schenker Vision 16 PH6PRX1
- 08/30/2023 v7 (old)
Philip Macdonald
Transparency
The selection of devices to be reviewed is made by our editorial team. The test sample was provided to the author as a loan by the manufacturer or retailer for the purpose of this review. The lender had no influence on this review, nor did the manufacturer receive a copy of this review before publication. There was no obligation to publish this review. As an independent media company, Notebookcheck is not subjected to the authority of manufacturers, retailers or publishers.
This is how Notebookcheck is testing
Every year, Notebookcheck independently reviews hundreds of laptops and smartphones using standardized procedures to ensure that all results are comparable. We have continuously developed our test methods for around 20 years and set industry standards in the process. In our test labs, high-quality measuring equipment is utilized by experienced technicians and editors. These tests involve a multi-stage validation process. Our complex rating system is based on hundreds of well-founded measurements and benchmarks, which maintains objectivity. Further information on our test methods can be found here.
Price comparison

