Notebook reviews with AMD Radeon RX Vega 8 (Ryzen 4000/5000) graphics card
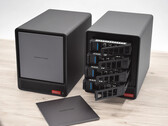
测试中的 88 TB 存储怪物:集 NAS 和迷你 PC 于一身的 Aoostar WTR Pro
功能强大的 NAS 和 Mini-PC 混合设备,可灵活使用,既适用于简单的任务,也适用于高要求的任务--这正是 Aoostar WTR Pro 所承诺的。该设备采用两种处理器,分别是经济实惠的英特尔 N100 和功能强大的 AMD Ryzen 7 5825U,面向不同的用户群。我们对 Aoostar WTR Pro 进行了测试,检查了它的性能、噪音水平和能效。
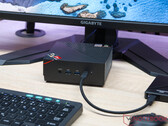
AMD Ryzen 7 5825U, Vega 8, 4.6 kg适合中小学、大学和办公室使用的经济型迷你 PC - 配备 AMD Ryzen 7 的 NiPoGi AM06 Pro 评测
小巧、安静、节俭--NiPoGi AM06 Pro 为在家、学校或办公室工作提供了可靠的性能。它配备了 Ryzen 7 5700U,结构紧凑,旨在证明良好的性能并不需要很大的空间。我们对它进行了测试。
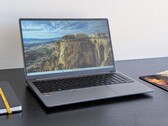
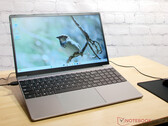
AMD Ryzen 7 5700U, Vega 8, 484 gThinkeagle VigoBook G7 评测:500 美元的价格还不错
当然,VigoBook G7 也有很多不足之处,但它能满足基本任务、视频流和网页浏览的最低要求,而且速度不会慢得令人难以忍受。
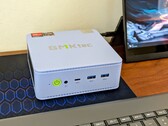
AMD Ryzen 7 5700U, Vega 8, 15.6", 1.7 kgGMK NucBox M5 迷你电脑评测:AMD Zen 2 已显老态
NucBox M5 的内存和存储容量为 300 美元,为了达到这个诱人的价位,它在性能方面走了不少弯路。从各方面考虑,这款产品都还不错,但在 400 美元到 500 美元之间,会有更好的选择。
AMD Ryzen 7 5700U, Vega 8, 505 gNinkear A15 Plus 笔记本电脑评测:出人意料的出色和实惠
我们这个版本的 Ninkear A15 Plus 可在多家零售商处购买,售价为 500 欧元。在我们的测试中,采用轻质金属外壳的 Ninkear A15 Plus 在性价比方面显然是佼佼者,尽管与其他配备 AMD Ryzen 7 的廉价设备相比,在某些方面还需要做出一些妥协。
AMD Ryzen 7 5700U, Vega 8, 15.6", 1.8 kgLenovo ThinkPad L15 Gen 4 21H70021GE: AMD Ryzen 7 PRO 7730U, 15.60", 1.9 kg
Review » 联想 ThinkPad L15 Gen 4 评测:省电、静音的 Ryzen 笔记本电脑
Geekom A5: AMD Ryzen 7 5800H, 0.6 kg
Review » Geekom A5 评测:玫瑰色迷你 PC,NUC 的替代品,配备 AMD Ryzen 7 APU 和 32 GB 内存
HP Envy x360 15-fh0077ng: AMD Ryzen 7 7730U, 15.60", 1.8 kg
Review » 惠普 Envy x360 15 Ryzen 7 7730U 可折叠笔记本电脑评测:首款 IMAX 增强型笔记本电脑
Lenovo ThinkPad E16 G1-21JUS08X00: AMD Ryzen 7 7730U, 16.00", 1.8 kg
Review » 联想 ThinkPad E16 G1 AMD 评测--配备 AMD 处理器和 WQHD 显示屏的大型办公笔记本电脑
Lenovo ThinkPad E14 G5-21JSS05C00: AMD Ryzen 7 7730U, 14.00", 1.4 kg
Review » 联想 ThinkPad E14 G5 AMD 评测:价格实惠、显示效果更佳的办公笔记本电脑
Geekom AS 5: AMD Ryzen 9 5900HX, 0.7 kg
Review » Geekom AS 5评测:苛刻项目的完美伴侣,包括AMD Ryzen 9 5900HX和AMD Radeon Vega 8
Schenker VIA 15 Pro M22: AMD Ryzen 7 5700U, 15.60", 1.4 kg
Review » 申科威盛15 Pro评测--电池寿命长的AMD办公笔记本电脑
Asus ZenBook 14 UM3402Y: AMD Ryzen 7 7730U, 14.00", 1.4 kg
Review » 华硕Zenbook 14 UM3402Y笔记本评测:新的Ryzen 7 7730U名称,旧的Zen 3性能
Lenovo ThinkPad E14 G4 21EB0041GE: AMD Ryzen 7 5825U, 14.00", 1.6 kg
Review » 联想ThinkPad E14 G4 AMD笔记本电脑评论:经济实惠,没有大的弱点
HP EliteBook 645 G9, Ryzen 7 5825U: AMD Ryzen 7 5825U, 14.00", 1.4 kg
Review » 惠普EliteBook 645 G9笔记本电脑评论:一个紧凑和强大的办公笔记本电脑与(未使用)的潜力
Lenovo IdeaPad Flex 5 16ABR G8: AMD Ryzen 7 7730U, 16.00", 2 kg
Review » 联想IdeaPad Flex 5 16回顾--经济实惠的16英寸2合1,配备Ryzen 7000
Lenovo Yoga 6 13 83B2001SGE: AMD Ryzen 7 7730U, 13.30", 1.4 kg
Review » 联想Yoga 6 Gen8评测。配备新的Ryzen 7-7730U和织物盖的可折叠机
LG UltraPC 14 14U70Q-G.AA79G: AMD Ryzen 7 5825U, 14.00", 1.3 kg
Review » LG Ultra PC 14回顾。耐力与性能的结合
HP Envy x360 15-ey0023dx: AMD Ryzen 7 5825U, 15.60", 1.9 kg
Review » AMD Ryzen 7 5825U首次亮相。惠普Envy x360 15 2022敞篷车评测
Asus ZenBook 14 UM425U: AMD Ryzen 7 5700U, 14.00", 1.2 kg
Review » 华硕ZenBook 14 UM425U笔记本电脑回顾。AMD和英特尔之间的对决
Dell Inspiron 15 5515-H8P8F: AMD Ryzen 7 5700U, 15.60", 1.6 kg
Review » 戴尔Inspiron 15 5515笔记本电脑评测。经久不衰的办公笔记本,潜力未被开发
Asus ZenBook 14X UM5401QA-KN162: AMD Ryzen 7 5800H, 14.00", 1.4 kg
Review » 华硕ZenBook 14X OLED AMD笔记本电脑评测中。颜色多,电池寿命长,价格低
Prime Computer Primestation Pulsar: AMD Ryzen 7 PRO 5750G, 4.2 kg
Review » Primestation Pulsar台式电脑评论。带有被动冷却和可持续生产的AMD Ryzen Pro
Minisforum EliteMini B550: AMD Ryzen 7 5700G, 1.1 kg
Review » Minisforum EliteMini B550评论。带外置显卡的紧凑型迷你电脑
Asus ZenBook Flip 14 UN5401QA-KN085W: AMD Ryzen 7 5800H, 14.00", 1.4 kg
Review » 华硕Zenbook Flip 14 OLED回顾。归功于AMD和OLED的绝对感觉
Asus VivoBook 15 OLED M513UA-L1282W: AMD Ryzen 7 5700U, 15.60", 1.8 kg
Review » 华硕VivoBook 15 OLED回顾。安静的办公笔记本,强大的屏幕
Beelink SER4: AMD Ryzen 7 4800U, 0.5 kg
Review » Beelink SER4迷你电脑评测。AMD Zen 2仍在给英特尔NUC一个交代
Lenovo ThinkPad T14s G2 20XGS01100: AMD Ryzen 7 PRO 5850U, 14.00", 1.3 kg
Review » 联想ThinkPad T14s G2 AMD笔记本电脑评测。超极本的效率与工作站的力量相结合
Acer Aspire 5 A515-45-R4R1: AMD Ryzen 7 5700U, 15.60", 1.7 kg
Review » 宏碁Aspire 5 A515-45回顾。一个具有AMD Ryzen 7功能的笔记本电脑,但...
Beelink GTR5: AMD Ryzen 9 5900HX, 0.7 kg
Review » 2022年Beelink GTR5迷你电脑回顾。带有AMD Ryzen 9的英特尔NUC
Minisforum EliteMini HX90: AMD Ryzen 9 5900HX
Review » Minisforum EliteMini HX90回顾。带有AMD Ryzen 9 5900HX的紧凑型高性能迷你电脑
Morefine S500+: AMD Ryzen 9 5900HX, 0.7 kg
Review » Morefine S500+在审查中。AMD Ryzen 9 5900HX配备32GB内存和1TB SSD的迷你电脑
AMD Ryzen 7 5700G: AMD Ryzen 7 5700G, 32.00"
Review » AMD Ryzen 7 5700G的回顾。基于Zen3的8核桌面APU,带Vega图形单元
Lenovo ThinkBook 13s G3 20YA0005GE: AMD Ryzen 7 5800U, 13.30", 1.3 kg
Review » 联想ThinkBook 13s G3 AMD笔记本电脑回顾。带有快速Ryzen CPU的副笔记本
Minisforum HM90: AMD Ryzen 9 4900H
Review » 配备快速AMD Ryzen APU的MINISFORUM EliteMini HM90台式电脑评测
Huawei MateBook 16 R7 5800H: AMD Ryzen 7 5800H, 16.00", 2 kg
Review » 华为MateBook 16 AMD评测--多媒体笔记本电脑以其Ryzen 7 CPU给人留下深刻印象
Lenovo Yoga 6 13ALC6: AMD Ryzen 7 5700U, 13.30", 1.3 kg
Review » AMD Ryzen 7 5700U vs. Ryzen 5 5500U:联想Yoga 6 13敞篷车评测
Dell Inspiron 14 7400 7415 2-in-1: AMD Ryzen 7 5700U, 14.00", 1.5 kg
Review » 戴尔Inspiron 14 7400 7415 2合1评论。预算中的高性能
Lenovo ThinkPad P14s G2 AMD: AMD Ryzen 7 PRO 5850U, 14.00", 1.5 kg
Review » 联想ThinkPad P14s G2 AMD笔记本电脑评论。拥有哑光4K液晶显示器和Ryzen 5000
GPD Win Max 2021: AMD Ryzen 7 4800U, 8.00", 0.9 kg
Review » GPD Win Max 2021手持式游戏笔记本电脑评测。Ryzen 7比Core i7更慢
Lenovo Yoga Slim 7 Pro 14ACH5: AMD Ryzen 9 5900HX, 14.00", 1.3 kg
Review » 联想Yoga Slim 7 Pro 14ACH5在审查中。具有良好电池寿命的14英寸动力源
Lenovo ThinkPad L14 G2 AMD: AMD Ryzen 7 PRO 5850U, 14.00", 1.7 kg
Review » 联想ThinkPad L14第二代AMD笔记本电脑评测。可升级性符合AMD Ryzen 5000
HP ProBook x360 435 G8 R7-5800U: AMD Ryzen 7 5800U, 13.30", 1.5 kg
Review » 惠普ProBook x360 435 G8 AMD评测--入门级商务敞篷车配备Zen 3 Ryzen CPU
HP Pavilion Aero 13 be0097nr: AMD Ryzen 7 5800U, 13.30", 1 kg
Review » 惠普Pavilion Aero 13评论。Pavilion 系列正在成长起来
Lenovo ThinkPad E15 G3-20YG003UGE: AMD Ryzen 7 5700U, 15.60", 1.8 kg
Review » 联想ThinkPad E15 G3 AMD评测。采用Ryzen 7的廉价商务笔记本电脑
Lenovo Yoga Slim 7-14ARE: AMD Ryzen 7 4800U, 14.00", 1.4 kg
Review » 联想Yoga Slim 7 14笔记本电脑评测:Ryzen 7 4800U太强了
Acer Aspire Go 15 AG15-42P: AMD Ryzen 7 5825U, 15.60", 1.8 kg
External Review » 宏碁 Aspire Go 15 AG15-42P
Lenovo V15 G4 AMN, R7 7730U: AMD Ryzen 7 7730U, 15.60", 1.7 kg
External Review » Lenovo V15 G4 AMN, R7 7730U
HP 17-cp3000: AMD Ryzen 7 7730U, 17.30", 2.1 kg
External Review » HP 17-cp3000
Acer Aspire 3 A314-42P: AMD Ryzen 7 5700U, 14.00", 1.4 kg
External Review » Acer Aspire 3 A314-42P
Acer Aspire 3 A315-44P: AMD Ryzen 7 5700U, 15.60", 1.8 kg
External Review » Acer Aspire 3 A315-44P
Lenovo IdeaPad Slim 3 15ABR8: AMD Ryzen 7 7730U, 15.60", 1.6 kg
External Review » Lenovo IdeaPad Slim 3 15ABR8
Lenovo ThinkBook 14 G6 ABP: AMD Ryzen 7 7730U, 14.00", 1.4 kg
External Review » Lenovo ThinkBook 14 G6 ABP
Lenovo ThinkPad E16 G1-21JUS08X00: AMD Ryzen 7 7730U, 16.00", 1.8 kg
External Review » Lenovo ThinkPad E16 G1-21JUS08X00
Asus Vivobook 16 M1605YA: AMD Ryzen 7 7730U, 16.00", 1.9 kg
External Review » Asus Vivobook 16 M1605YA
Asus ZenBook 14 UM3402Y: AMD Ryzen 7 7730U, 14.00", 1.4 kg
External Review » Asus ZenBook 14 UM3402Y
HP 15s-eq2145ns: AMD Ryzen 7 5700U, 15.60", 1.7 kg
External Review » HP 15s-eq2145ns
Dell Vostro 15 3535: AMD Ryzen 7 7730U, 15.60", 1.9 kg
External Review » Dell Vostro 15 3535
Lenovo IdeaPad 1 15ALC7, R7 5700U: AMD Ryzen 7 5700U, 15.60", 1.6 kg
External Review » Lenovo IdeaPad 1 15ALC7, R7 5700U
Lenovo IdeaPad Slim 5 14ABR8: AMD Ryzen 7 7730U, 14.00", 1.5 kg
External Review » Lenovo IdeaPad Slim 5 14ABR8
HP Envy x360 15-fh0077ng: AMD Ryzen 7 7730U, 15.60", 1.8 kg
External Review » HP Envy x360 15-fh0077ng
Asus Vivobook 15X M1503, R7 5800H: AMD Ryzen 7 5800H, 15.60", 1.7 kg
External Review » Asus Vivobook 15X M1503, R7 5800H
MSI Modern 15 B7M: AMD Ryzen 7 7730U, 15.60", 1.8 kg
External Review » MSI Modern 15 B7M
Lenovo IdeaPad Slim 3 14ABR8: AMD Ryzen 7 7730U, 14.00", 1.8 kg
External Review » Lenovo IdeaPad Slim 3 14ABR8
Acer Aspire 5 A515-48M: AMD Ryzen 7 7730U, 15.60", 1.7 kg
External Review » Acer Aspire 5 A515-48M
Acer Swift Go 14 SFG14-41: AMD Ryzen 7 7730U, 14.00", 1.3 kg
External Review » Acer Swift Go 14 SFG14-41
MSI Modern 14 C7M, R7 7730U: AMD Ryzen 7 7730U, 14.00", 1.4 kg
External Review » MSI Modern 14 C7M, R7 7730U
Lenovo IdeaPad Flex 5 16ABR G8: AMD Ryzen 7 7730U, 16.00", 2 kg
External Review » Lenovo IdeaPad Flex 5 16ABR G8
HP 15-fc0072ns: AMD Ryzen 7 7730U, 15.60", 1.6 kg
External Review » HP 15-fc0072ns
Lenovo IdeaPad 5 14ABA7, R7 5825U: AMD Ryzen 7 5825U, 14.00", 1.4 kg
External Review » Lenovo IdeaPad 5 14ABA7, R7 5825U
Asus Vivobook 15 M1505YA: AMD Ryzen 7 7730U, 15.60", 1.7 kg
External Review » Asus Vivobook 15 M1505YA
MSI Modern 15 B5M, R7 5825U: AMD Ryzen 7 5825U, 15.60", 1.8 kg
External Review » MSI Modern 15 B5M, R7 5825U
HP Pavilion 15-eh3000: AMD Ryzen 7 7730U, 15.60", 1.8 kg
External Review » HP Pavilion 15-eh3000
HP Pavilion Aero 13-be1002ns: AMD Ryzen 7 5800U, 13.30", 1 kg
External Review » HP Pavilion Aero 13-be1002ns
Asus VivoBook 15 M515UA-EJ486W: AMD Ryzen 7 5700U, 15.60", 1.8 kg
External Review » Asus VivoBook 15 M515UA-EJ486W
Asus Vivobook 16X M1603, R7 5800H: AMD Ryzen 7 5800H, 16.00", 1.9 kg
External Review » Asus Vivobook 16X M1603, R7 5800H
Asus ZenBook 14 UM3402YA-KM452W: AMD Ryzen 7 7730U, 14.00", 1.4 kg
External Review » Asus ZenBook 14 UM3402YA-KM452W
Acer Swift 3 SF314-43-R2LX: AMD Ryzen 7 5700U, 14.00", 1.2 kg
External Review » Acer Swift 3 SF314-43-R2LX
Dynabook Satellite Pro C50D-B-11A: AMD Ryzen 7 5800U, 15.60", 1.9 kg
External Review » Dynabook Satellite Pro C50D-B-11A
Dell Inspiron 15 5515-H8P8F: AMD Ryzen 7 5700U, 15.60", 1.6 kg
External Review » Dell Inspiron 15 5515-H8P8F
Acer Aspire 5 A515-45-R3K8: AMD Ryzen 7 5700U, 15.60", 1.8 kg
External Review » Acer Aspire 5 A515-45-R3K8
Acer Aspire 5 A515-45-R4R1: AMD Ryzen 7 5700U, 15.60", 1.7 kg
External Review » Acer Aspire 5 A515-45-R4R1
Lenovo IdeaPad 3 15ABA7, R7 5825U: AMD Ryzen 7 5825U, 15.60", 1.9 kg
External Review » Lenovo IdeaPad 3 15ABA7, R7 5825U
Lenovo IdeaPad 3 17ABA7, R7 5825U: AMD Ryzen 7 5825U, 17.30", 2.2 kg
External Review » Lenovo IdeaPad 3 17ABA7, R7 5825U
HP Envy x360 15-ey0023dx: AMD Ryzen 7 5825U, 15.60", 1.9 kg
External Review » HP Envy x360 15-ey0023dx
Asus ZenBook 14X UM5401, 5800H: AMD Ryzen 7 5800H, 14.00", 1.4 kg
External Review » Asus ZenBook 14X UM5401, 5800H
Dell Inspiron 16 5625, Ryzen 7 5825U: AMD Ryzen 7 5825U, 16.00", 1.9 kg
External Review » Dell Inspiron 16 5625, Ryzen 7 5825U
Lenovo ThinkBook 14 G3 ACL, Ryzen 7 5700U: AMD Ryzen 7 5700U, 14.00", 1.4 kg
External Review » Lenovo ThinkBook 14 G3 ACL, Ryzen 7 5700U
Lenovo Yoga 7 14ACN6-82N7004HGE: AMD Ryzen 7 5800U, 14.00", 1.5 kg
External Review » Lenovo Yoga 7 14ACN6-82N7004HGE
Lenovo ThinkPad X13 G2, Ryzen 7 PRO 5850U: AMD Ryzen 7 PRO 5850U, 13.30", 1.3 kg
External Review » Lenovo ThinkPad X13 G2, Ryzen 7 PRO 5850U
Lenovo ThinkPad E15 G3-20YG003UGE: AMD Ryzen 7 5700U, 15.60", 1.8 kg
External Review » Lenovo ThinkPad E15 G3-20YG003UGE
HP ProBook 455 G9, R7 5825U: AMD Ryzen 7 5825U, 15.60", 1.7 kg
External Review » HP ProBook 455 G9, R7 5825U
HP EliteBook 645 G9, Ryzen 7 5825U: AMD Ryzen 7 5825U, 14.00", 1.4 kg
External Review » HP EliteBook 645 G9, Ryzen 7 5825U
Asus ZenBook 14 UM3402YA-KM115W: AMD Ryzen 7 5825U, 14.00", 1.4 kg
External Review » Asus ZenBook 14 UM3402YA-KM115W
HP Pavilion Aero 13-be0009ns: AMD Ryzen 7 5800U, 13.30", 1 kg
External Review » HP Pavilion Aero 13-be0009ns
Lenovo ThinkBook 15 G3 ACL-21A4002DMH: AMD Ryzen 7 5700U, 15.60", 1.7 kg
External Review » Lenovo ThinkBook 15 G3 ACL-21A4002DMH
Lenovo IdeaPad 3 15ALC6-82KU01EBMH: AMD Ryzen 7 5700U, 15.60", 1.7 kg
External Review » Lenovo IdeaPad 3 15ALC6-82KU01EBMH
Asus Vivobook Pro 14 M3400, R7 5800H: AMD Ryzen 7 5800H, 14.00", 1.4 kg
External Review » Asus Vivobook Pro 14 M3400, R7 5800H
HP Pavilion 15-eh1771nd: AMD Ryzen 7 5700U, 15.60", 1.8 kg
External Review » HP Pavilion 15-eh1771nd
HP Dev One, Ryzen 7 PRO 5850U: AMD Ryzen 7 PRO 5850U, 14.00", 1.5 kg
External Review » HP Dev One, Ryzen 7 PRO 5850U
HP 15s-eq2119ns: AMD Ryzen 7 5700U, 15.60", 1.7 kg
External Review » HP 15s-eq2119ns
Lenovo IdeaPad 3 14ALC6-82KT0042SP: AMD Ryzen 7 5700U, 14.00", 1.4 kg
External Review » Lenovo IdeaPad 3 14ALC6-82KT0042SP
HP 14s-fq1083AU: AMD Ryzen 7 5700U, 14.00", 1.5 kg
External Review » HP 14s-fq1083AU
Asus ZenBook 14 UM3402YA-KM067W: AMD Ryzen 7 5825U, 14.00", 1.4 kg
External Review » Asus ZenBook 14 UM3402YA-KM067W
Asus Zenbook 14 UM425UAZ-KI047: AMD Ryzen 7 5700U, 14.00", 1.3 kg
External Review » Asus Zenbook 14 UM425UAZ-KI047
Asus ZenBook 14 UM425UAZ-KI035T: AMD Ryzen 7 5700U, 14.00", 1.1 kg
External Review » Asus ZenBook 14 UM425UAZ-KI035T
HP Pavilion 14-ec0006ns: AMD Ryzen 7 5700U, 14.00", 2.1 kg
External Review » HP Pavilion 14-ec0006ns
Asus VivoBook 15 M513UA-L1568W: AMD Ryzen 7 5700U, 15.60", 1.8 kg
External Review » Asus VivoBook 15 M513UA-L1568W
Acer Swift 3 Pro SF314-43-R8MY: AMD Ryzen 7 5700U, 14.00", 1.2 kg
External Review » Acer Swift 3 Pro SF314-43-R8MY
Asus VivoBook Flip 14 TM420UA-EC110T: AMD Ryzen 7 5700U, 14.00", 1.5 kg
External Review » Asus VivoBook Flip 14 TM420UA-EC110T
Lenovo IdeaPad 5 Pro 14ACN6-82L7004XMH: AMD Ryzen 7 5800U, 14.00", 1.4 kg
External Review » Lenovo IdeaPad 5 Pro 14ACN6-82L7004XMH
HP 15s-eq2120ns: AMD Ryzen 7 5700U, 15.60", 1.7 kg
External Review » HP 15s-eq2120ns
HP Pavilion Aero 13-be0008ns: AMD Ryzen 7 5800U, 13.30", 1 kg
External Review » HP Pavilion Aero 13-be0008ns
HP 15s-eq2113ns: AMD Ryzen 7 5700U, 15.60", 1.7 kg
External Review » HP 15s-eq2113ns
MSI Modern 15 A5M-009XES: AMD Ryzen 7 5700U, 15.60", 1.6 kg
External Review » MSI Modern 15 A5M-009XES
Asus ZenBook 14 Flip OLED UN5401QA-K181W: AMD Ryzen 9 5900HX, 14.00", 1.4 kg
External Review » Asus ZenBook Flip 14 UN5401QA-K181W
Asus ZenBook Flip 14 UN5401QA-KN085W: AMD Ryzen 7 5800H, 14.00", 1.4 kg
External Review » Asus ZenBook Flip 14 UN5401QA-KN085W
HP Envy x360 13-ay1054AU: AMD Ryzen 7 5800U, 13.30", 1.3 kg
External Review » HP Envy x360 13-ay1054AU
HP Pavilion 14-ec0013ns: AMD Ryzen 7 5700U, 14.00", 1.4 kg
External Review » HP Pavilion 14-ec0013ns
HP ProBook 455 G8-45R47ES: AMD Ryzen 7 5800U, 15.60", 1.7 kg
External Review » HP ProBook 455 G8-45R47ES
Lenovo Thinkbook 14p G2 ACH, 5800H: AMD Ryzen 7 5800H, 14.00", 1.4 kg
External Review » Lenovo Thinkbook 14p G2 ACH, 5800H
Lenovo Yoga Slim 7 Carbon 14ACN6-82L0005DGE: AMD Ryzen 7 5800U, 14.00", 1.1 kg
External Review » Lenovo Yoga Slim 7 Carbon 14ACN6-82L0005DGE
Lenovo Yoga Slim 7 Pro 14ACH5 O-82N5003TGE: AMD Ryzen 7 5800H, 14.00", 1.4 kg
External Review » Lenovo Yoga Slim 7 Pro 14ACH5 O-82N5003TGE
HP Pavilion Aero 13-be0002AU: AMD Ryzen 7 5800U, 13.30", 1 kg
External Review » HP Pavilion Aero 13-be0002AU
HP 15s-eq2059ns: AMD Ryzen 7 5700U, 15.60", 1.7 kg
External Review » HP 15s-eq2059ns
Acer TravelMate P2 P215-41-G2-R7PB: AMD Ryzen 7 PRO 5850U, 15.60", 1.8 kg
External Review » Acer TravelMate P2 P215-41-G2-R7PB
Asus Vivobook 15 M513UA-L1282T: AMD Ryzen 7 5700U, 15.60", 1.8 kg
External Review » Asus Vivobook 15 M513UA-L1282T
Lenovo ThinkPad P14s G2 AMD FHD: AMD Ryzen 7 PRO 5850U, 14.00"
External Review » Lenovo ThinkPad P14s G2 AMD FHD
Asus Zenbook 14 UM425UAZ-KI016T: AMD Ryzen 7 5700U, 14.00", 1.2 kg
External Review » Asus Zenbook 14 UM425UAZ-KI016T
HP Envy x360 13-ay1001ns: AMD Ryzen 7 5800U, 13.30", 1.3 kg
External Review » HP Envy x360 13-ay1001ns
Lenovo IdeaPad 5 Pro 16ACH6-82L5003UMH: AMD Ryzen 7 5800H, 16.00", 2.5 kg
External Review » Lenovo IdeaPad 5 Pro 16ACH6-82L5003UMH
HP Envy x360 13-ay1074ng: AMD Ryzen 7 5800U, 13.30", 1.3 kg
External Review » HP Envy x360 13-ay1074ng
Lenovo Thinkbook 14p, 5900HX OLED: AMD Ryzen 9 5900HX, 14.00", 1.4 kg
External Review » Lenovo Thinkbook 14p, 5900HX OLED
Asus VivoBook Pro 15 M3500QA-L1082W: AMD Ryzen 7 5800H, 15.60", 1.7 kg
External Review » Asus VivoBook Pro 15 M3500QA-L1082W
Lenovo Yoga 6 13ALC6: AMD Ryzen 7 5700U, 13.30", 1.3 kg
External Review » Lenovo Yoga 6 13ALC6
Lenovo IdeaPad 5 14ALC05-82LM005XGE: AMD Ryzen 7 5700U, 14.00", 1.4 kg
External Review » Lenovo IdeaPad 5 14ALC05-82LM005XGE
Dell Inspiron 14 7415-6JDWR, 2-in-1: AMD Ryzen 7 5700U, 14.00", 1.7 kg
External Review » Dell Inspiron 14 7415-6JDWR, 2-in-1
Asus ZenBook 14 UM425QA, 5800H: AMD Ryzen 7 5800H, 14.00", 1.2 kg
External Review » Asus ZenBook 14 UM425QA, 5800H
HP 15s-eq2032ns: AMD Ryzen 7 5700U, 15.60", 1.7 kg
External Review » HP 15s-eq2032ns
HP Pavilion Aero 13-be0007ns: AMD Ryzen 7 5800U, 13.30", 1 kg
External Review » HP Pavilion Aero 13-be0007ns
HP Pavilion Aero 13-be0240nd: AMD Ryzen 7 5800U, 13.30", 1 kg
External Review » HP Pavilion Aero 13-be0240nd
Lenovo V14 G2 ALC-82KC0001GE: AMD Ryzen 7 5700U, 14.00", 1.6 kg
External Review » Lenovo V14 G2 ALC-82KC0001GE
HP Pavilion 14-ec0004ns: AMD Ryzen 7 5700U, 14.00", 1.4 kg
External Review » HP Pavilion 14-ec0004ns
HP ProBook 635 Aero G8-51C00US: AMD Ryzen 7 PRO 5850U, 13.30", 1.8 kg
External Review » HP ProBook 635 Aero G8-51C00US
Lenovo Yoga Slim 7 Pro 14ACH5: AMD Ryzen 9 5900HX, 14.00", 1.3 kg
External Review » Lenovo Yoga Slim 7 Pro 14ACH5
Asus ZenBook 14X UM5401, 5900HX: AMD Ryzen 9 5900HX, 14.00", 1.4 kg
External Review » Asus ZenBook 14X UM5401, 5900HX
Lenovo ThinkPad E14 G3-20Y7003XGE: AMD Ryzen 7 5700U, 14.00", 1.4 kg
External Review » Lenovo ThinkPad E14 G3-20Y7003XGE
Lenovo IdeaPad 5 Pro 14ACN6-82L7003NGE: AMD Ryzen 7 5800U, 14.00", 1.4 kg
External Review » Lenovo IdeaPad 5 Pro 14ACN6-82L7003NGE
HP Pavilion Aero 13-be0006ns: AMD Ryzen 7 5800U, 13.30", 1 kg
External Review » HP Pavilion Aero 13-be0006ns
Dell Vostro 15 5515, R7 5700U: AMD Ryzen 7 5700U, 15.60", 1.6 kg
External Review » Dell Vostro 15 5515, R7 5700U
HP Pavilion Aero 13 be0097nr: AMD Ryzen 7 5800U, 13.30", 1 kg
External Review » HP Pavilion Aero 13 be0097nr
Asus Vivobook 14 M433UA-EB751TS: AMD Ryzen 7 5700U, 14.00", 1.4 kg
External Review » Asus Vivobook 14 M433UA-EB751TS
Dell Inspiron 15 5515, R7 5700U: AMD Ryzen 7 5700U, 15.60", 1.8 kg
External Review » Dell Inspiron 15 5515, R7 5700U
Lenovo Yoga Slim 7 Pro 14ACH5, R7 5800H: AMD Ryzen 7 5800H, 14.00", 1.3 kg
External Review » Lenovo Yoga Slim 7 Pro 14ACH5, R7 5800H
Lenovo IdeaPad 5 15ALC05-82LN0037SP: AMD Ryzen 7 5700U, 15.60", 1.7 kg
External Review » Lenovo IdeaPad 5 15ALC05-82LN0037SP
Acer Swift 3 SF314-43-R2YY: AMD Ryzen 7 5700U, 14.00", 1.2 kg
External Review » Acer Swift 3 SF314-43-R2YY
Lenovo Yoga Slim 7 13ACN5, R7 5800U: AMD Ryzen 7 5800U, 13.30", 1.2 kg
External Review » Lenovo Yoga Slim 7 13ACN5, R7 5800U
Asus ZenBook 13 OLED UM325UA: AMD Ryzen 7 5700U, 13.30", 1.1 kg
External Review » Asus ZenBook 13 OLED UM325UA
Asus VivoBook 14 M413U, R7 5700U: AMD Ryzen 7 5700U, 14.00", 1.4 kg
External Review » Asus VivoBook 14 M413U, R7 5700U
Lenovo IdeaPad 3 15ALC6-82KU008GSP: AMD Ryzen 7 5700U, 15.60", 1.7 kg
External Review » Lenovo IdeaPad 3 15ALC6-82KU008GSP
HP Envy x360 15-eu0097nr: AMD Ryzen 7 5700U, 15.60", 1.9 kg
External Review » HP Envy x360 15-eu0097nr
Huawei MateBook 16 R7 5800H: AMD Ryzen 7 5800H, 16.00", 2 kg
External Review » Huawei MateBook 16, R7 5800H
Xiaomi RedmiBook Pro 15, R7 5800H: AMD Ryzen 7 5800H, 15.60", 1.8 kg
External Review » Xiaomi RedmiBook Pro 15, R7 5800H
Lenovo IdeaPad Flex 5 14ALC05 82HU002YUS: AMD Ryzen 7 5700U, 14.00", 1.6 kg
External Review » Lenovo IdeaPad Flex 5 14ALC05 82HU002YUS
Asus ZenBook 13 UM325S: AMD Ryzen 7 5800U, 13.30", 1.2 kg
External Review » Asus ZenBook 13 UM325S
Asus ZenBook 13 OLED UM325UA-DS71: AMD Ryzen 7 5700U, 13.30", 1.1 kg
External Review » Asus ZenBook 13 OLED UM325UA-DS71
Dell Inspiron 15 3505, Ryzen 5 3450U: AMD Ryzen 5 3450U, 15.60", 2 kg
External Review » Dell Inspiron 15 3505, Ryzen 5 3450U
Microsoft Surface Laptop 4 15 AMD TFF_00028: AMD Ryzen 7 4980U, 15.00", 1.6 kg
External Review » Microsoft Surface Laptop 4 15 AMD TFF_00028
Lenovo Yoga Slim 7 14ARE05-82A20087MH: AMD Ryzen 7 4800U, 14.00", 1.3 kg
External Review » Lenovo Yoga Slim 7 14ARE05-82A20087MH
Lenovo Yoga Slim 7 14ARE05-82A200A5GE: AMD Ryzen 7 4800U, 14.00", 1.3 kg
External Review » Lenovo Yoga Slim 7 14ARE05-82A200A5GE
Lenovo Yoga Slim 7 14ARH05: AMD Ryzen 7 4800U, 14.00", 1.5 kg
External Review » Lenovo Yoga Slim 7 14ARH05
Lenovo IdeaPad S540-13ARE-82DL002TMH: AMD Ryzen 7 4800U, 13.30", 1.3 kg
External Review » Lenovo IdeaPad S540-13ARE-82DL002TMH
Lenovo IdeaPad Slim 7-14ARE05, Ryzen 7 4800U: AMD Ryzen 7 4800U, 14.00", 1.4 kg
External Review » Lenovo IdeaPad Slim 7-14ARE05, Ryzen 7 4800U
Lenovo Yoga Slim 7-14ARE05-82A2005KMH: AMD Ryzen 7 4800U, 14.00", 1.3 kg
External Review » Lenovo Yoga Slim 7-14ARE05-82A2005KMH
Lenovo Yoga Slim 7-14ARE: AMD Ryzen 7 4800U, 14.00", 1.4 kg
External Review » Lenovo Yoga Slim 7-14ARE