微星Summit E14 Flip Evo A12M敞篷车回顾。惠普、戴尔或联想的合法替代品
不要与 峰会E14蛤壳,Summit E14 Flip是具有360度铰链和整体不同的机箱设计的可转换版本。该模型于 首次亮相是在三月与较小的和更新的13英寸Summit E13 Flip一起亮相。
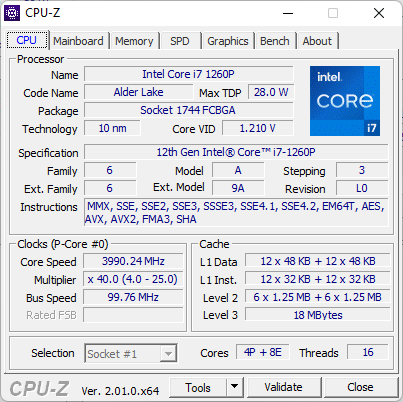
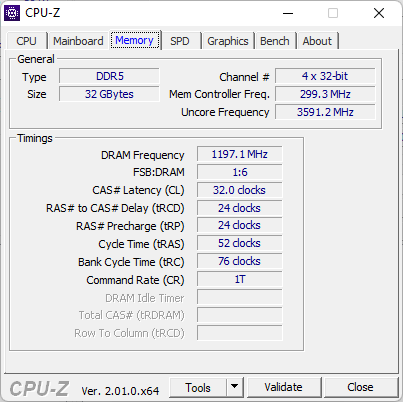
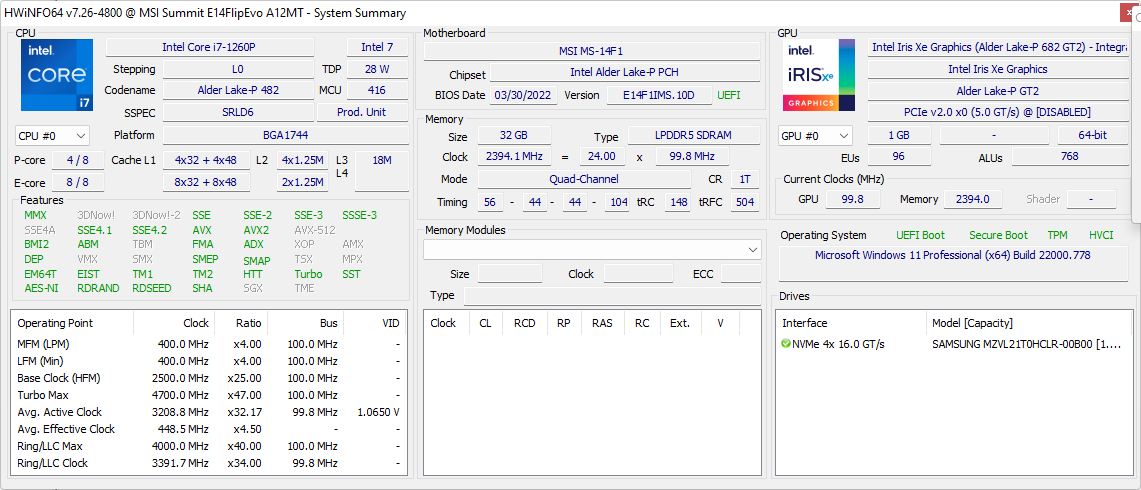
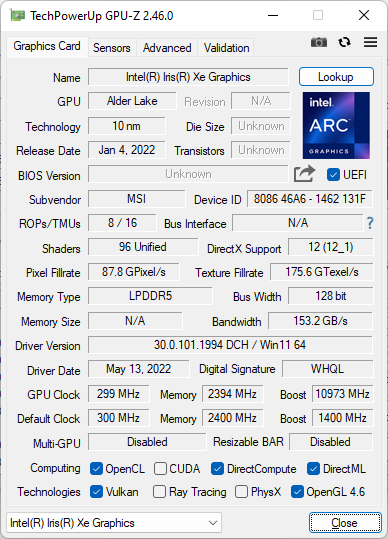
我们的评测单位配置了英特尔Alder Lake-P酷睿i7-1260P处理器,32GB LPDDR5内存,16:10 QHD+ IPS触摸屏,以及1TB NVMe SSD,零售价约为1600至1700美元。计划在不久的将来推出带有独立的GeForce MX选项的其他SKU。
Summit E14 Flip与其他高端专业消费者或以商业为中心的转换机竞争,如联想Yoga 9i 14,戴尔Latitude 9420 2合1,LG Gram 14T90P, 或 华硕ExpertBook B7 Flip.
更多MSI评论。
潜在的竞争对手比较
Rating | Date | Model | Weight | Height | Size | Resolution | Price |
|---|---|---|---|---|---|---|---|
| 86.1 % v7 (old) | 07 / 2022 | MSI Summit E14 Flip Evo A12MT i7-1260P, Iris Xe G7 96EUs | 1.6 kg | 17.9 mm | 14.00" | 2880x1800 | |
| 82.3 % v7 (old) | 09 / 2021 | MSI Summit E14 A11SCS i7-1185G7, GeForce GTX 1650 Ti Max-Q | 1.3 kg | 16 mm | 14.00" | 3840x2160 | |
| 84.1 % v7 (old) | 07 / 2022 | Asus VivoBook S 14X S5402Z i7-12700H, Iris Xe G7 96EUs | 1.6 kg | 17.9 mm | 14.50" | 2880x1800 | |
| 87.5 % v7 (old) | 05 / 2022 | LG Gram 14T90P i5-1135G7, Iris Xe G7 80EUs | 1.2 kg | 17 mm | 14.00" | 1900x1200 | |
| 87.6 % v7 (old) | 06 / 2022 | Lenovo Yoga Slim 7i Pro 14IAP G7 i5-1240P, Iris Xe G7 80EUs | 1.3 kg | 14.6 mm | 14.00" | 2880x1800 | |
| 89 % v7 (old) | 09 / 2021 | Dell Latitude 9420 2-in-1 i7-1185G7, Iris Xe G7 96EUs | 1.5 kg | 13.94 mm | 14.00" | 2560x1600 |
案例 - 比以前更艰难
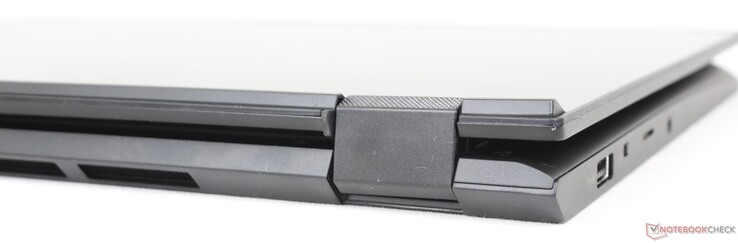
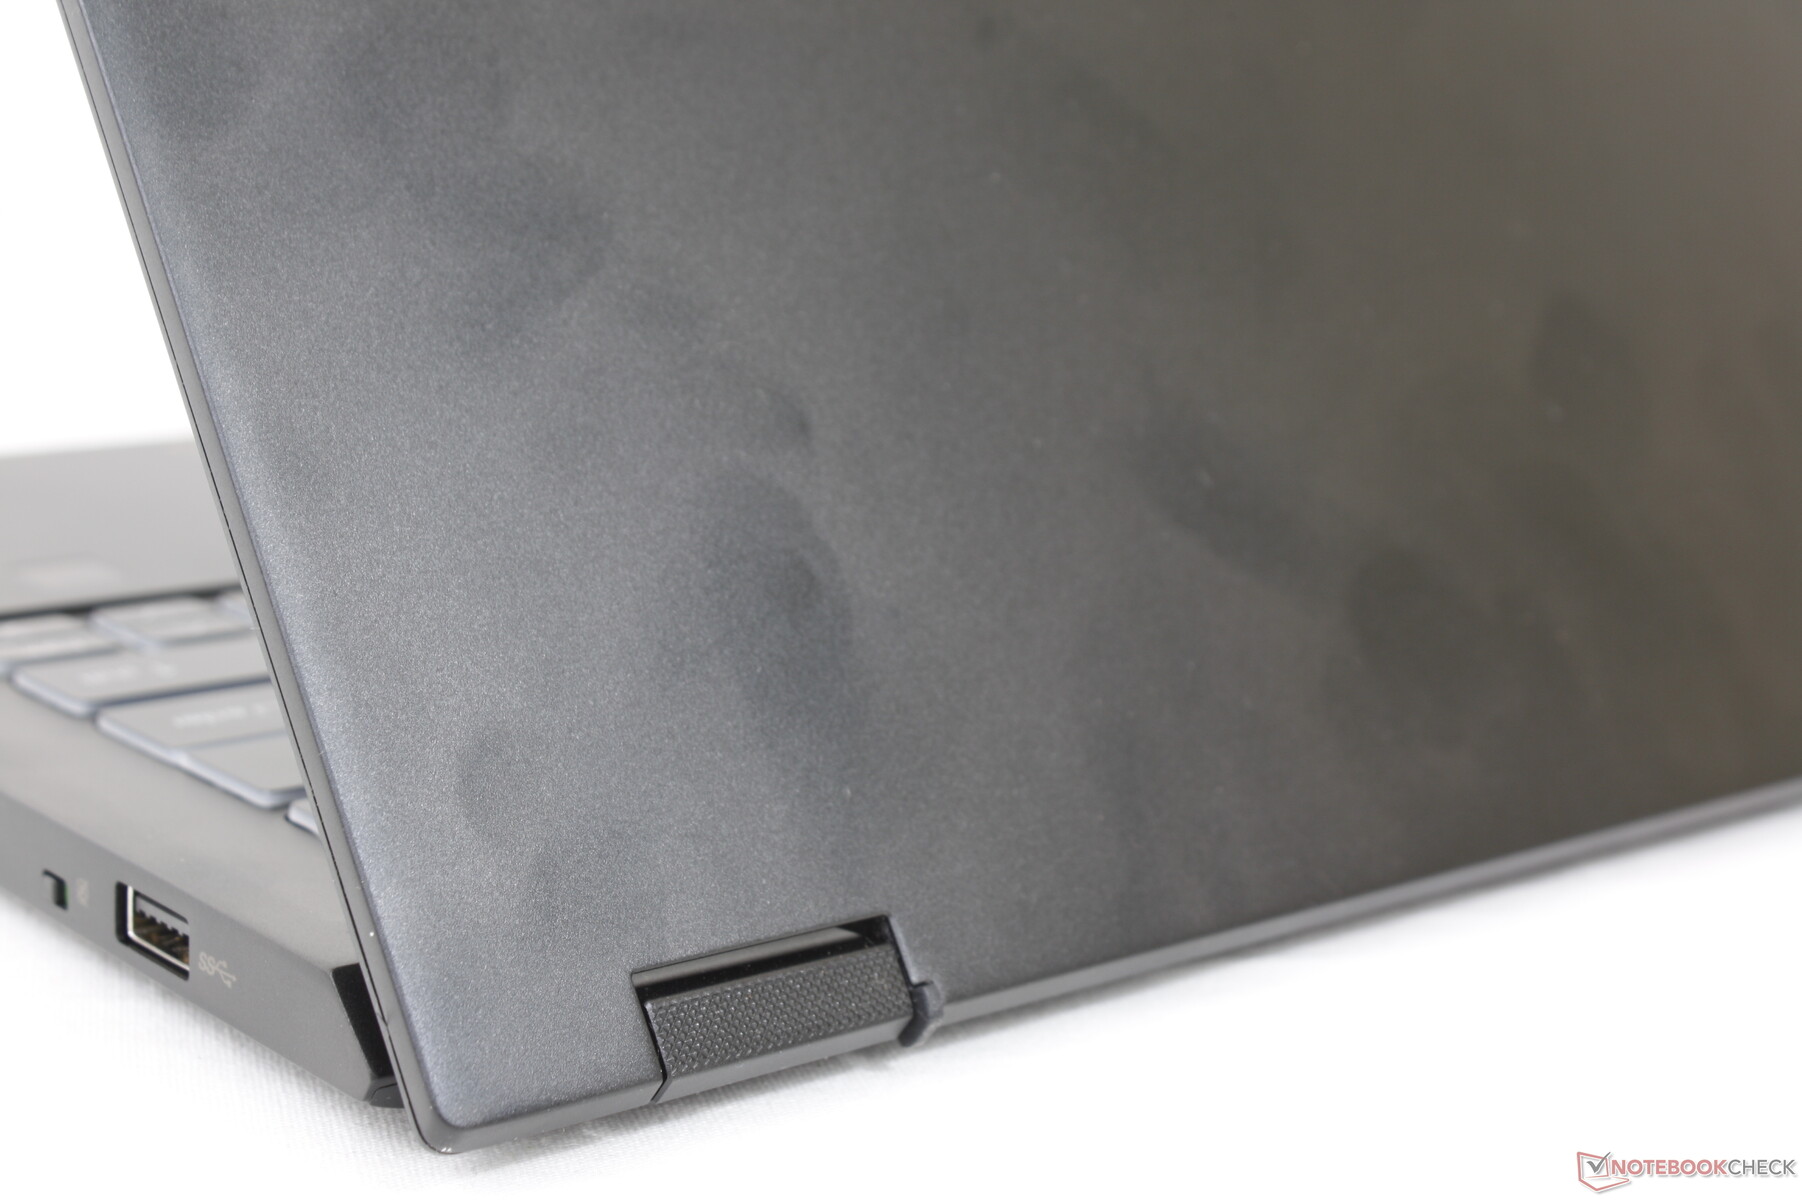
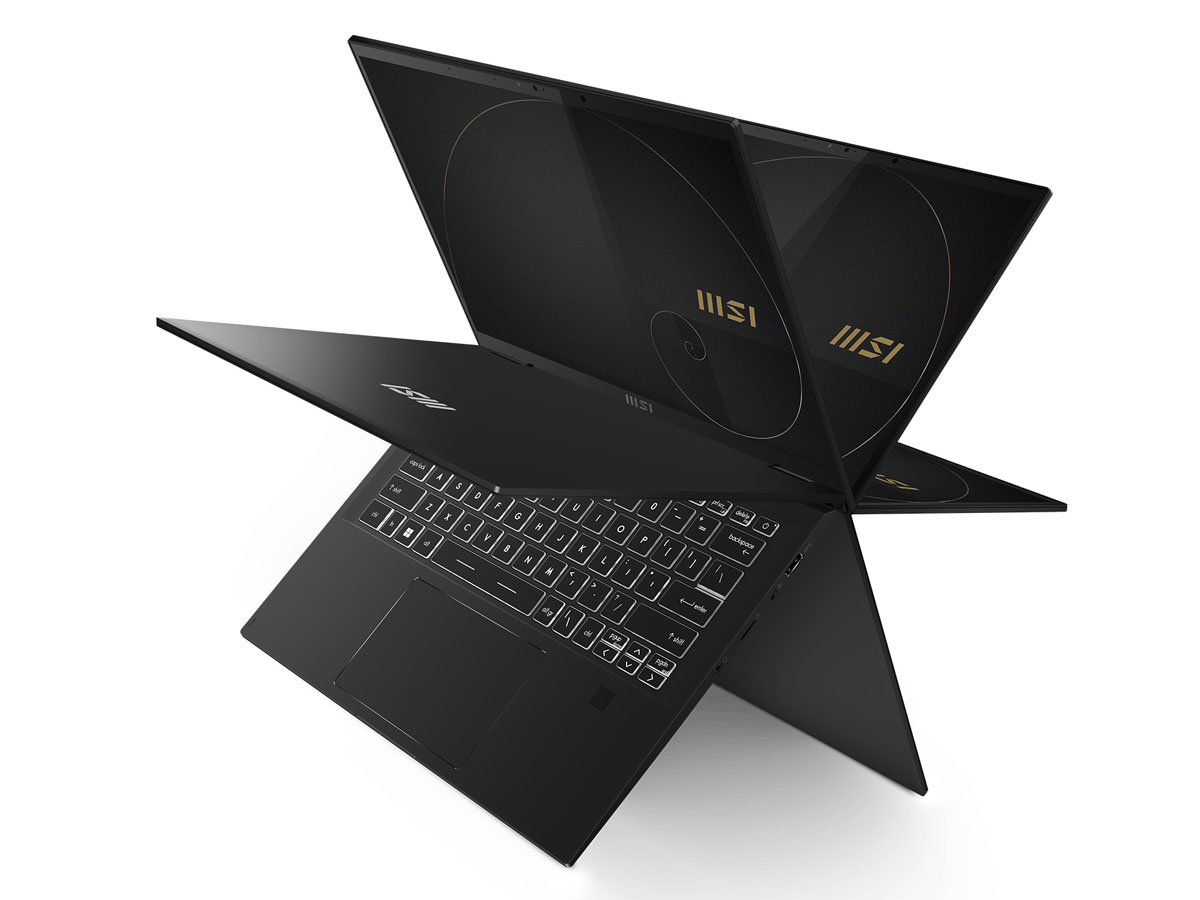
虽然Summit E14 Flip convertible第一眼看上去和Summit E14 clamshell很像,因为它们都有哑光的黑色涂层,但实际上它们在内部和外部都有很大的不同。金色的标志和点击板周围的装饰消失了,看起来更微妙。边缘到边缘的玻璃现在是标准配置,既加强了盖子的刚性,又允许触摸屏/笔输入。铰链,在蛤壳模型上被限制在180度,已经被完全重新设计,为新的360度形式因素而变得更大、更强。然而,我们仍然认为铰链在某些角度可以更硬,特别是在150至180度的范围内,以获得更好的寿命感。
该模型保留了与原始蛤壳共享的MIL-STD-810G认证。底座是刚性的,抗扭曲和凹陷,与许多其他专业消费者的可转换产品如华硕Zenbook Flip ,XPS 13二合一 ,或联想Yoga 9i 14处于类似水平。与便宜的微星现代 笔记本电脑相比,这是一个重大的改进,我们一直认为这些笔记本电脑相对于竞争对手来说比较脆弱。
在尺寸和重量方面,微星的型号比许多其他14英寸的敞篷车都要大和重。这款LG Gram 14T90P和Latitude 9420二合一,例如,都比我们的Summit E14 Flip更轻,更小,甚至更薄。联想Yoga 9i 14敞篷车的占地面积稍大,但它仍然更薄、更轻,分别约为3毫米和200克。
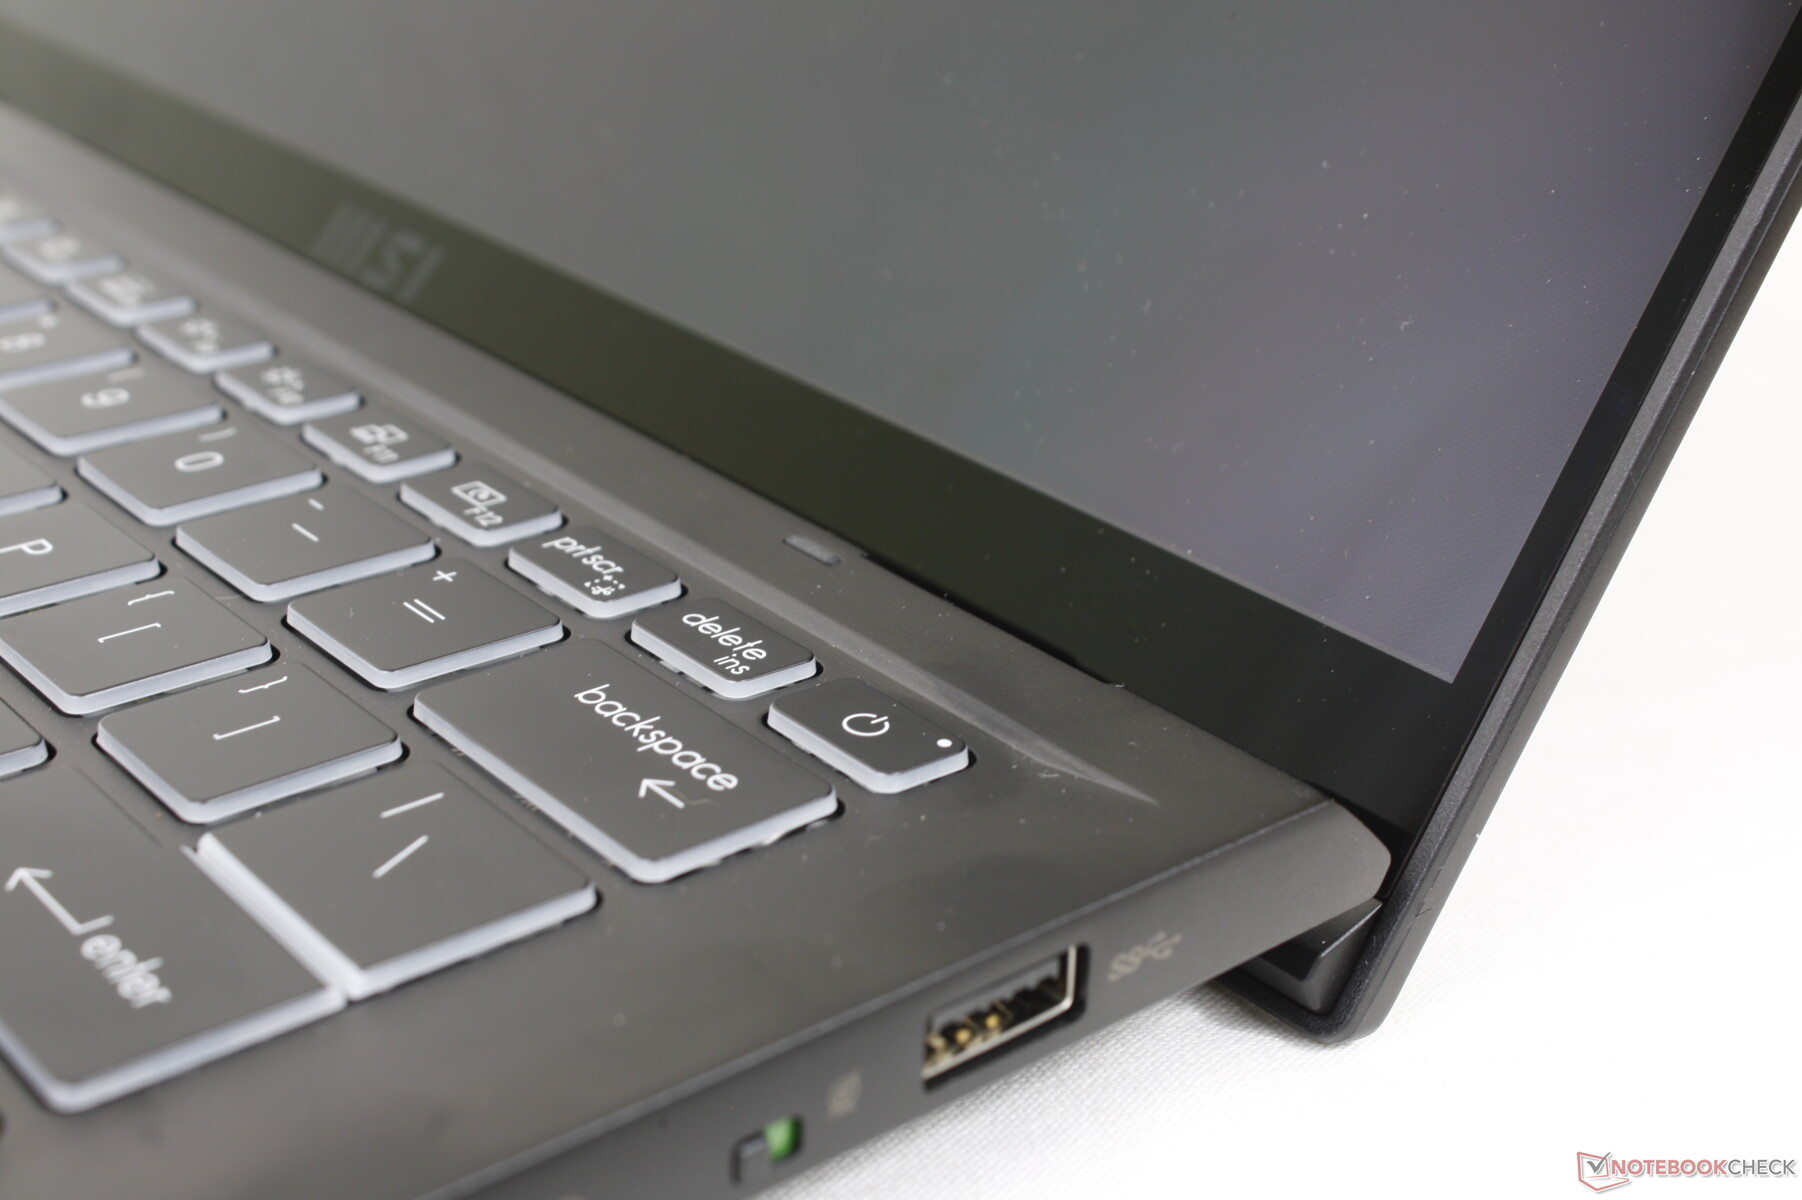
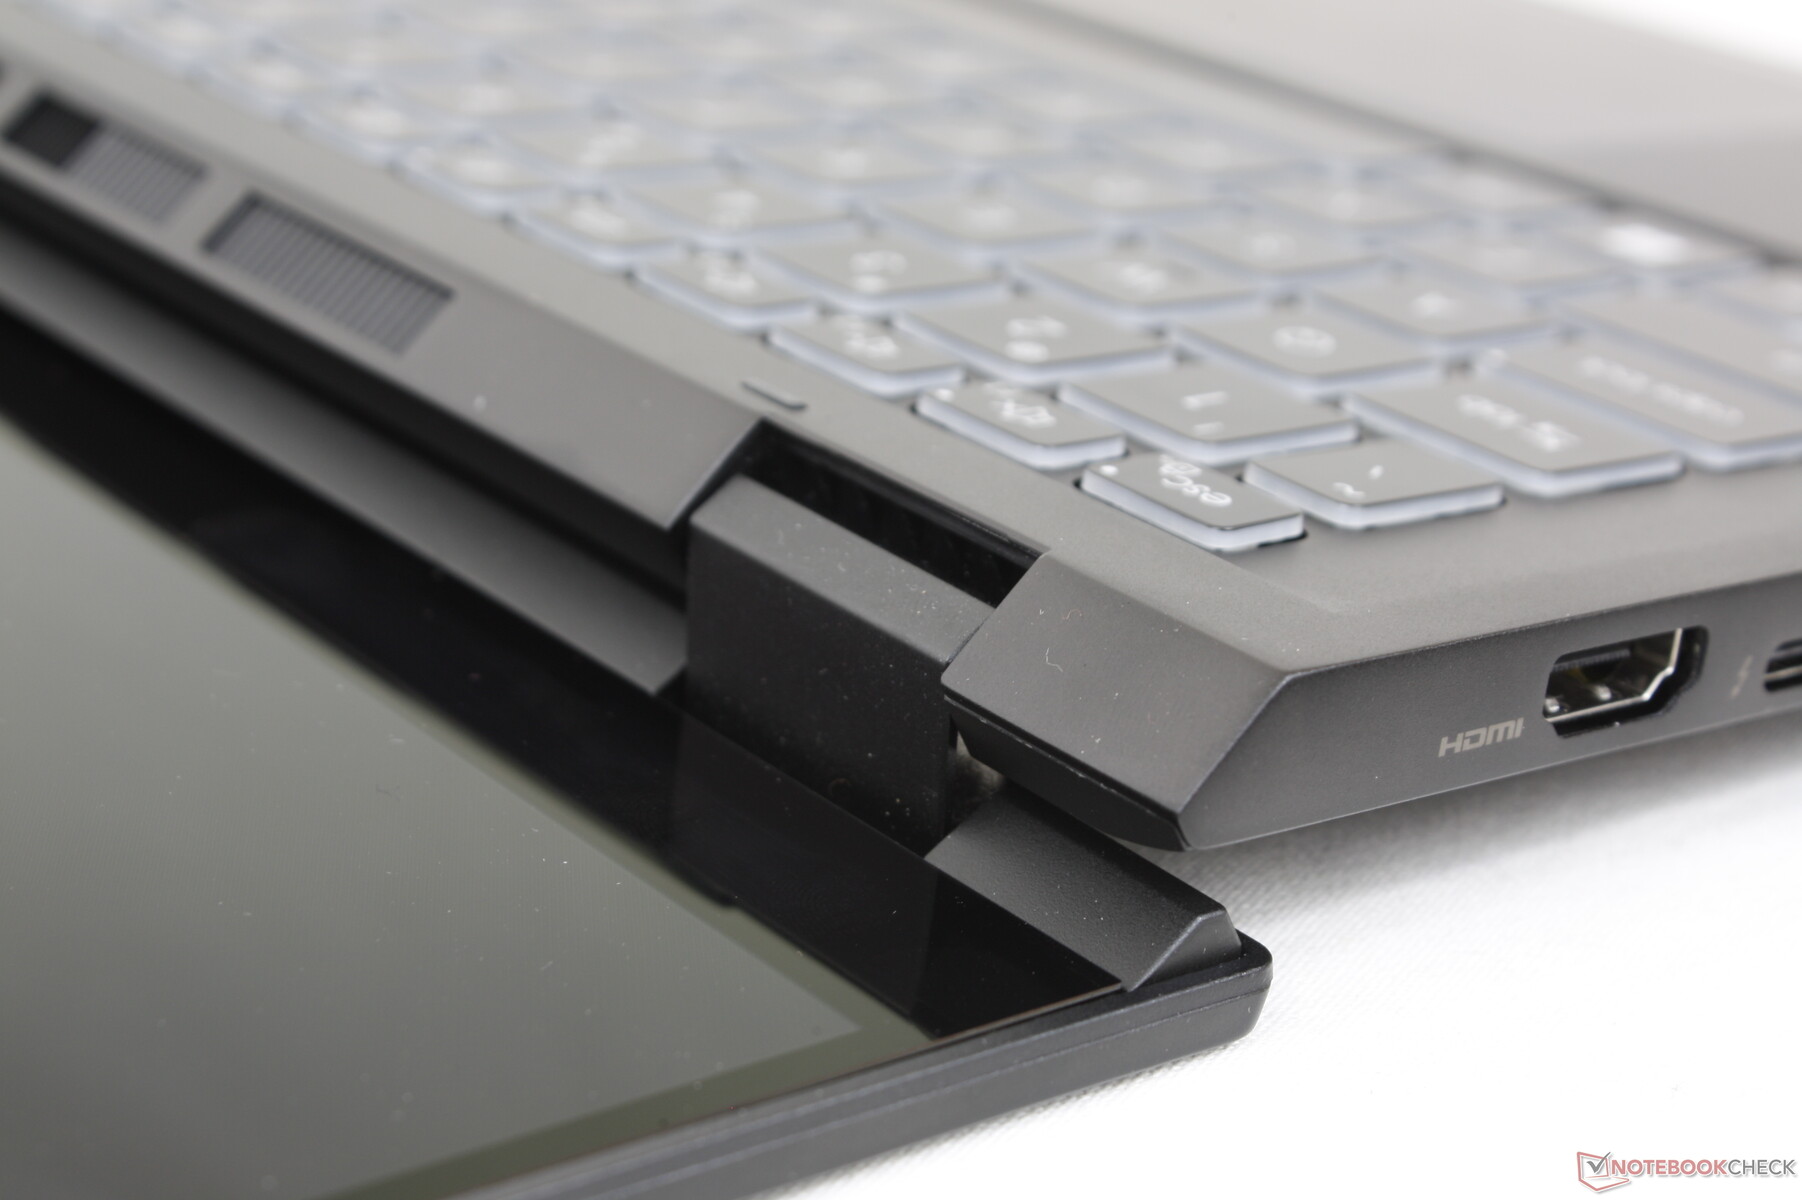
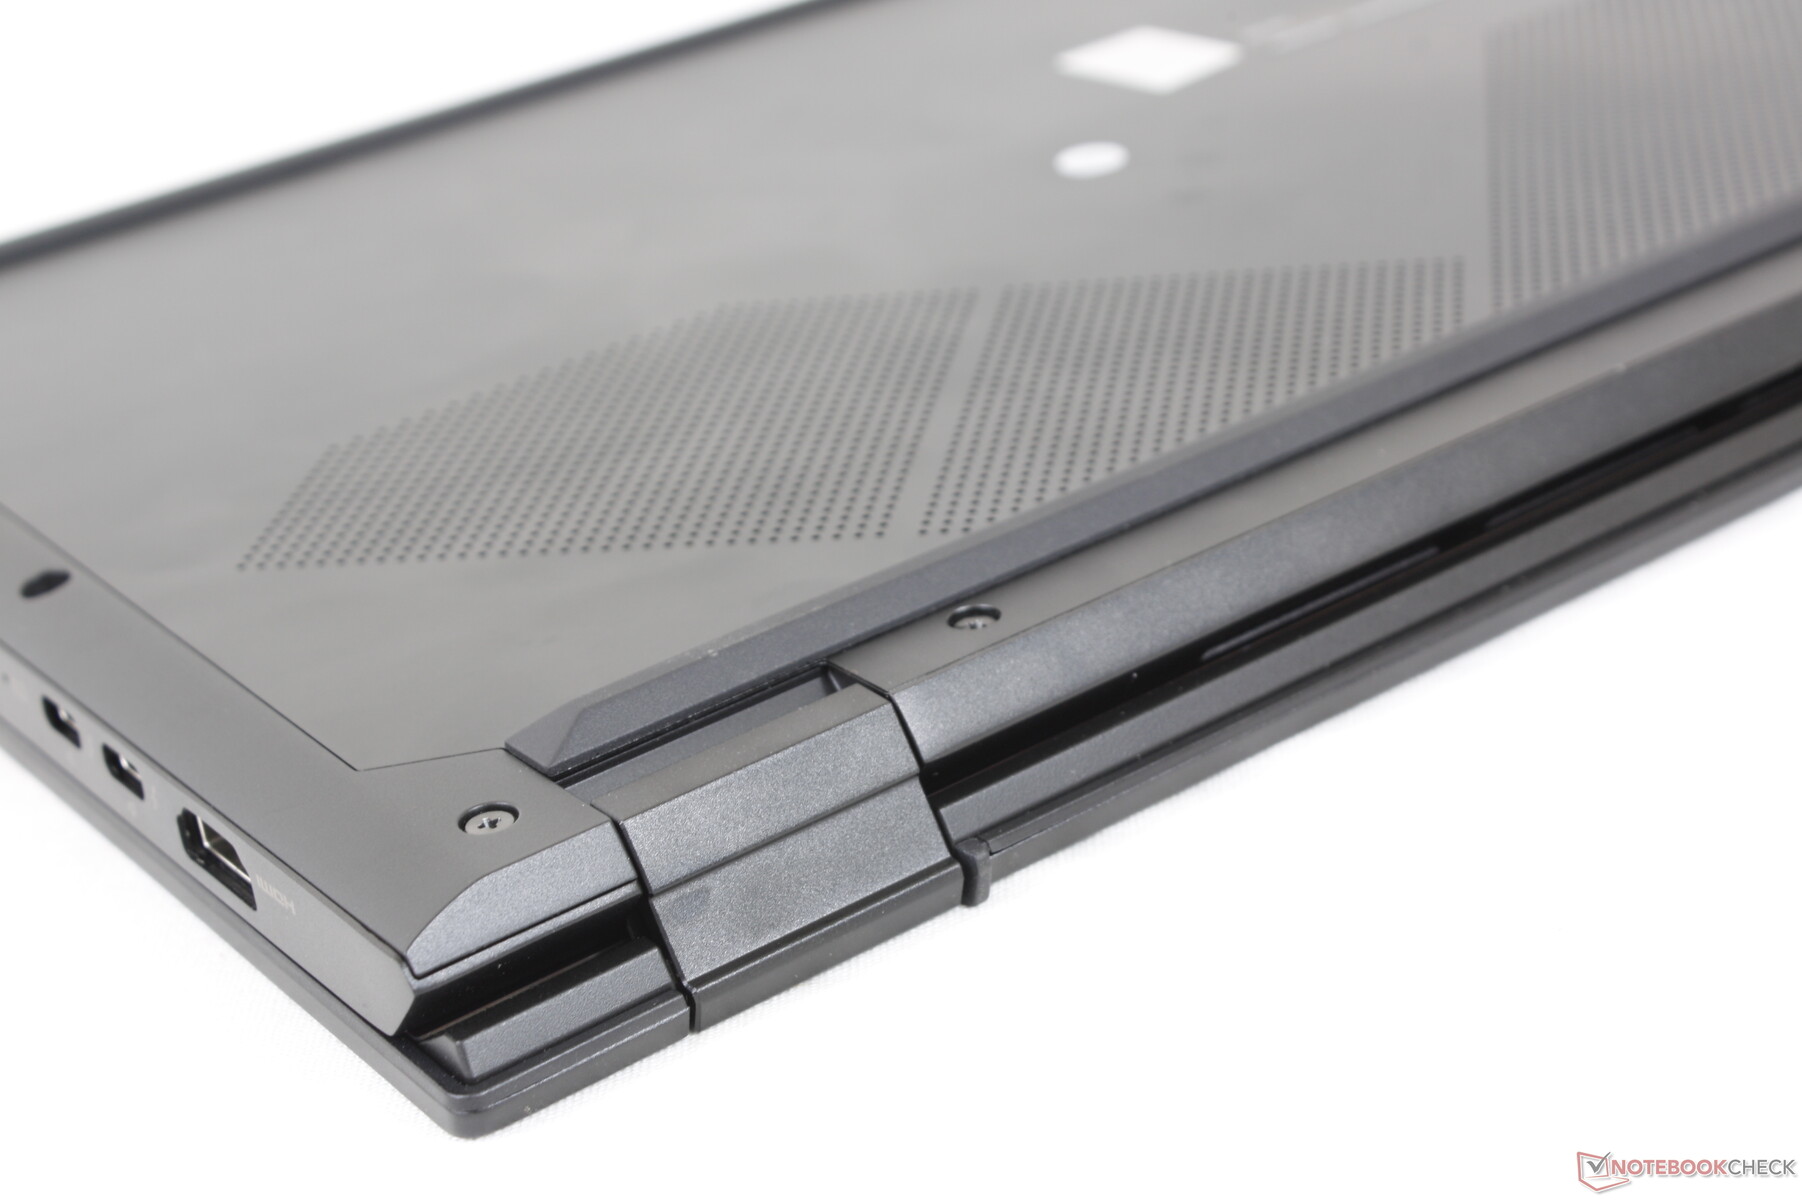
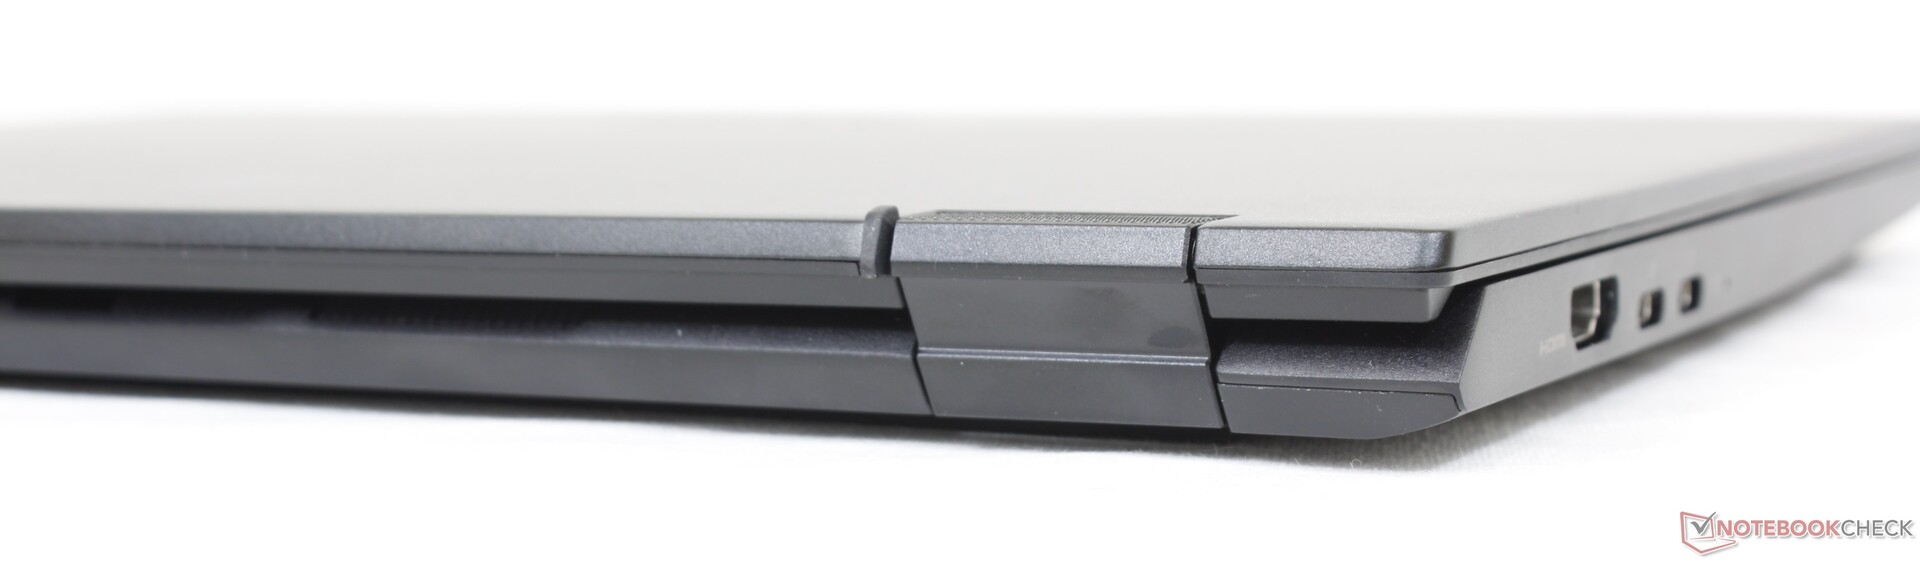
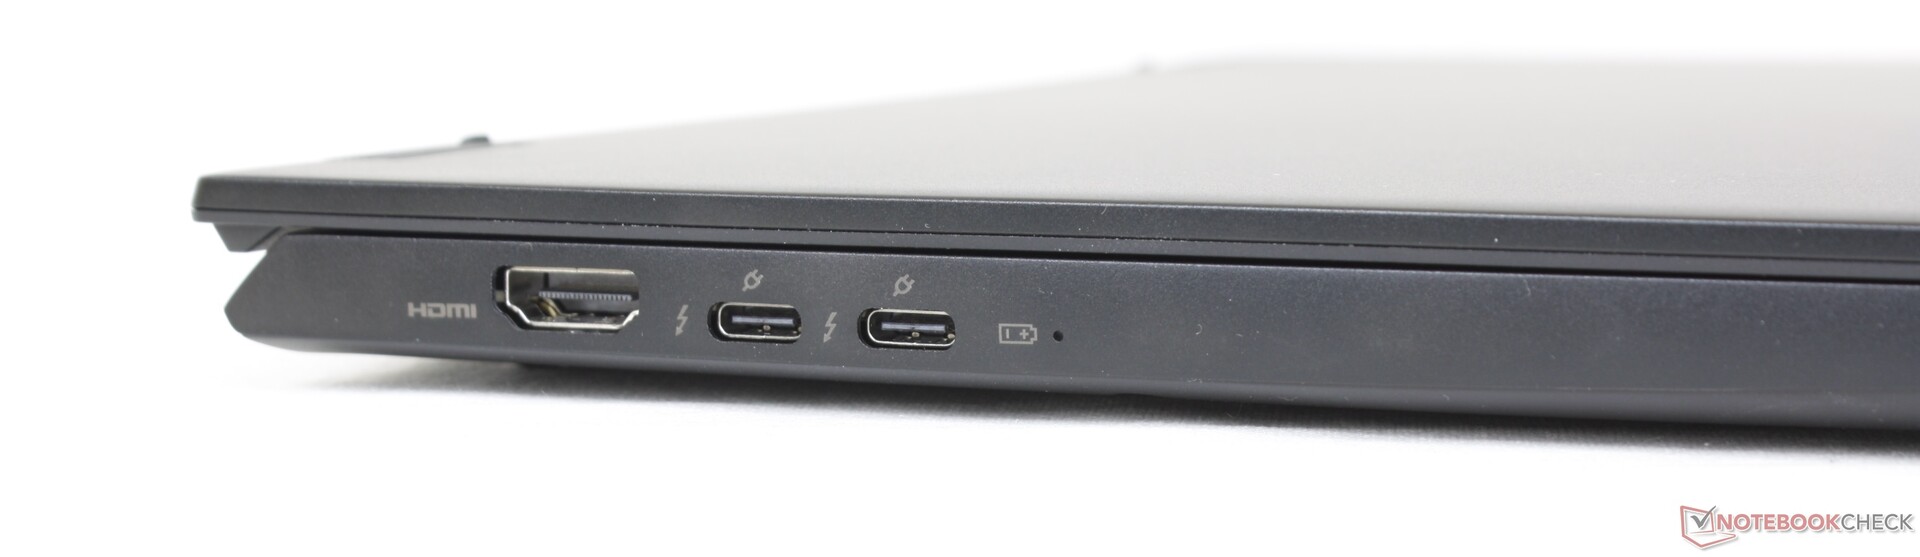
连接性 - 支持Thunderbolt 4
这个可转换的型号包括原来的蛤壳版的所有端口,还有全尺寸的HDMI和一个网络摄像头开关。然而,如果能看到一个Kensington锁就更好了,因为Summit系列更倾向于专业。左侧边缘的端口定位可能会更好,那里的三个端口挤在一起有点太紧了。
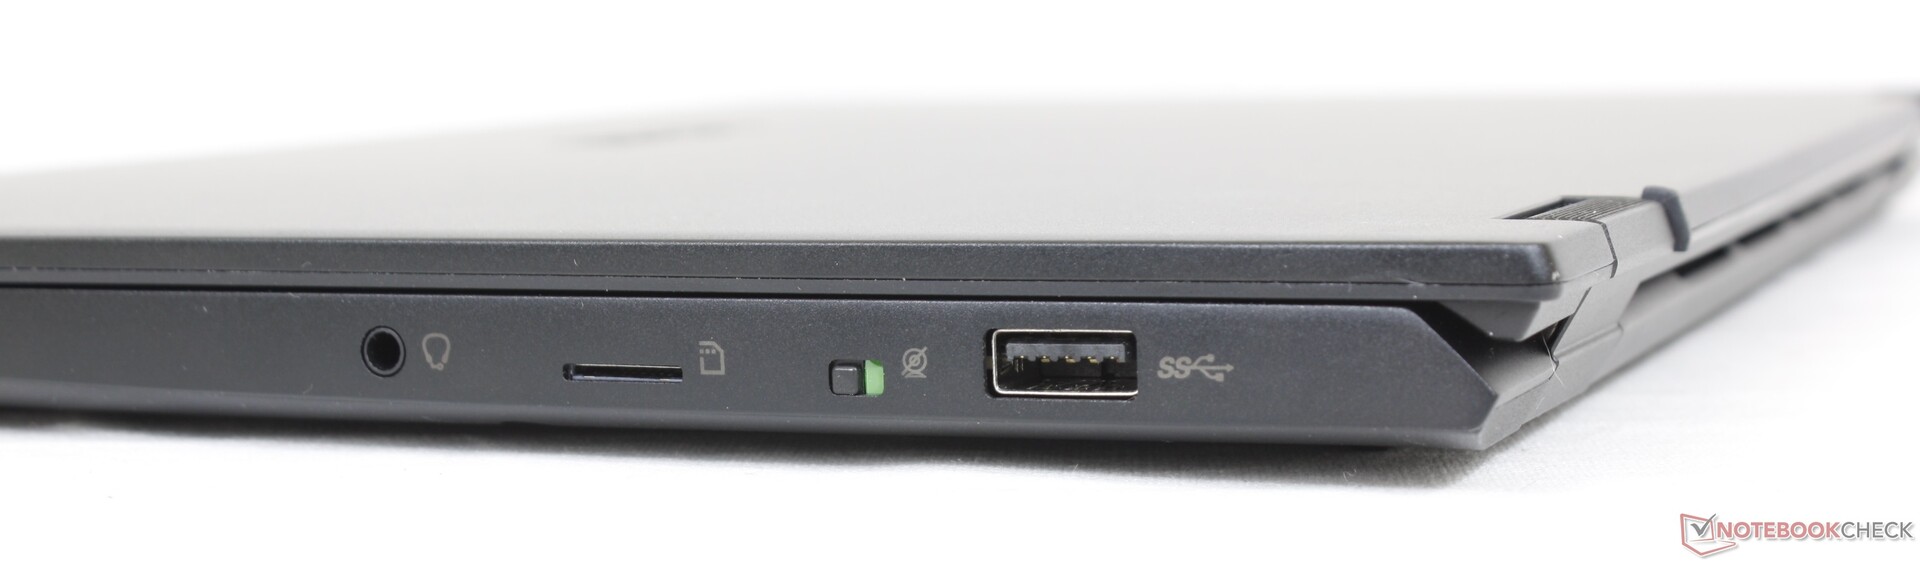
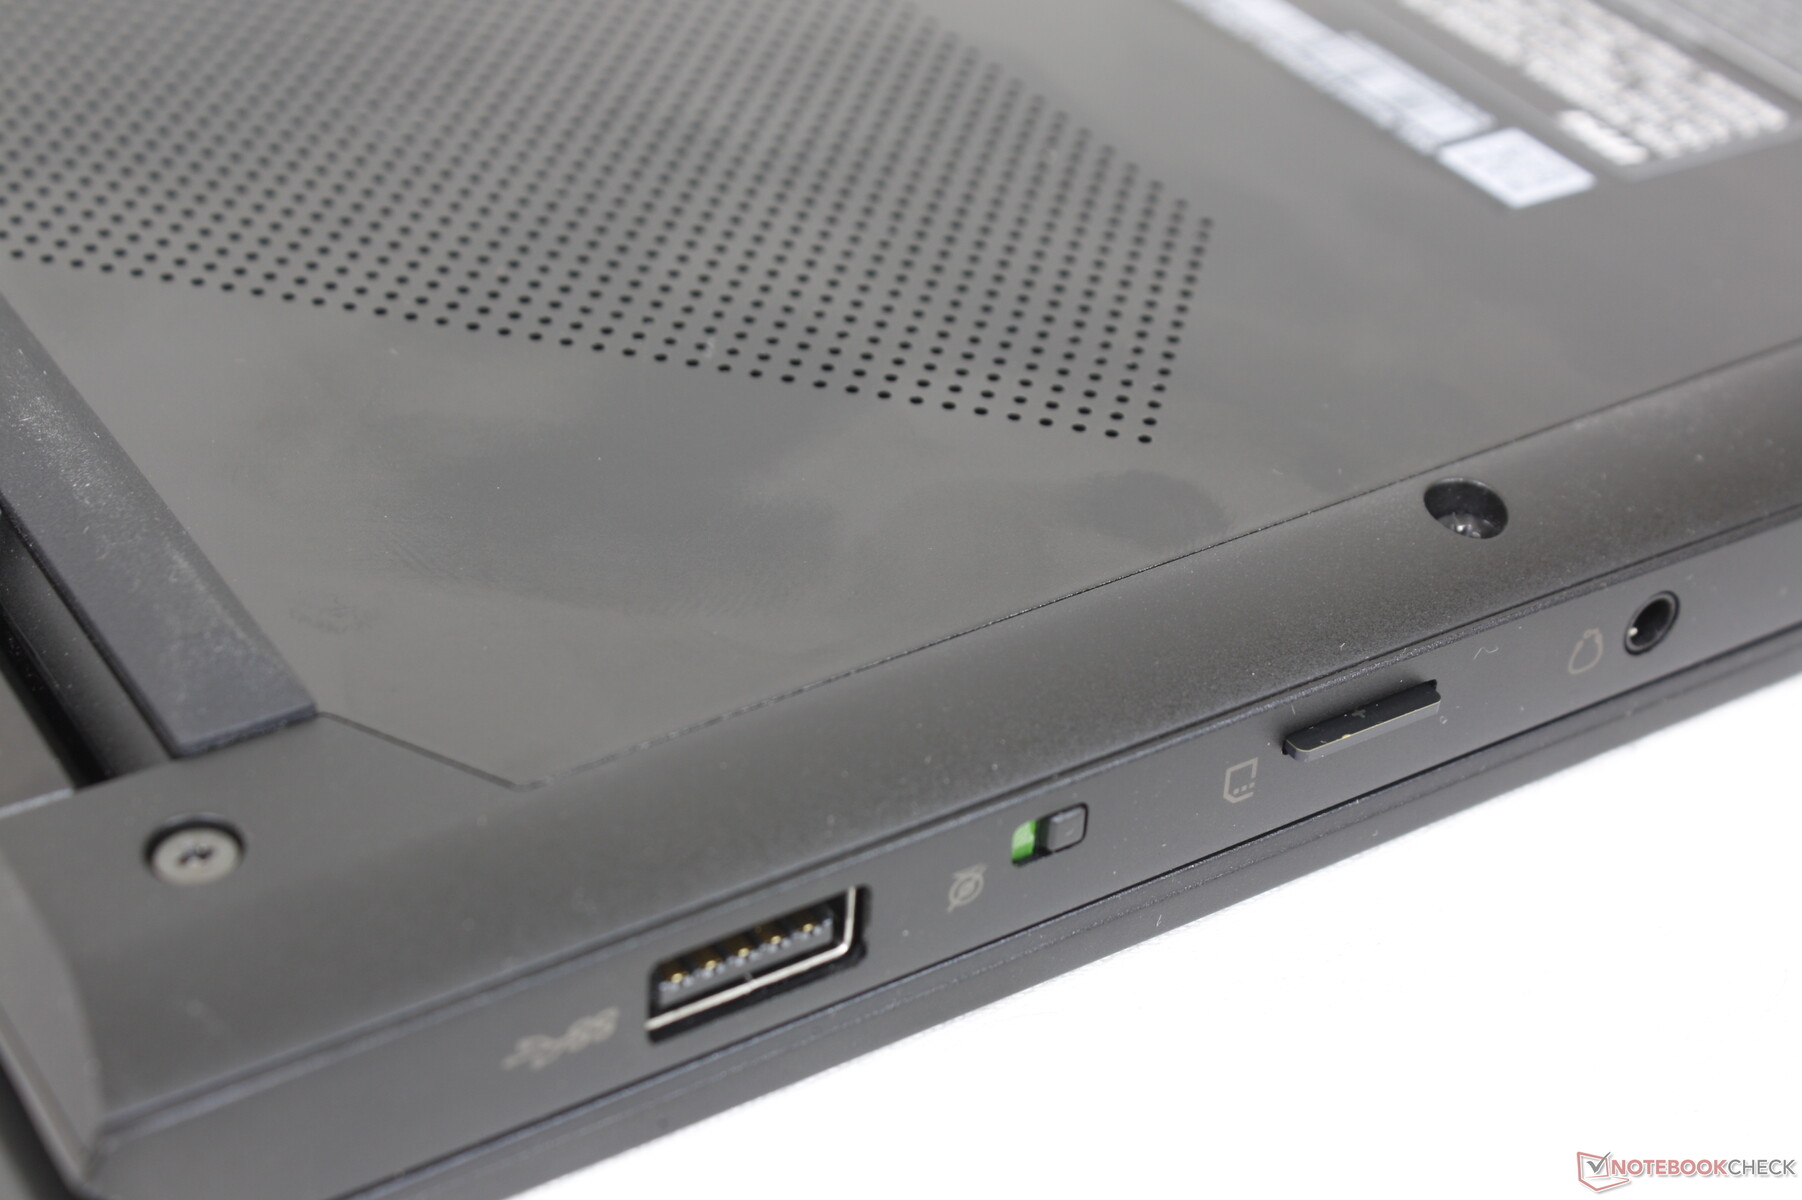
SD卡阅读器
不幸的是,集成的弹簧式MicroSD读卡器比Summit E14蛤壳上的要慢。从我们的UHS-II测试卡顶部桌面移动1GB的图像需要大约21秒,而在Summit E14上只需要6到7秒。
| SD Card Reader | |
| average JPG Copy Test (av. of 3 runs) | |
| MSI Summit E14 A11SCS (AV Pro V60) | |
| Dell Latitude 9420 2-in-1 (AV PRO microSD 128 GB V60) | |
| LG Gram 14T90P (AV Pro V60) | |
| MSI Summit E14 Flip Evo A12MT (AV Pro V60) | |
| maximum AS SSD Seq Read Test (1GB) | |
| MSI Summit E14 A11SCS (AV Pro V60) | |
| Dell Latitude 9420 2-in-1 (AV PRO microSD 128 GB V60) | |
| LG Gram 14T90P (AV Pro V60) | |
| MSI Summit E14 Flip Evo A12MT (AV Pro V60) | |
沟通
英特尔AX1675s是Wi-Fi 6E和蓝牙5.2连接的标准配置。在与我们的6GHz网络配对时,我们没有遇到任何问题。
| Networking | |
| iperf3 transmit AX12 | |
| MSI Summit E14 A11SCS | |
| Dell Latitude 9420 2-in-1 | |
| iperf3 receive AX12 | |
| MSI Summit E14 A11SCS | |
| Dell Latitude 9420 2-in-1 | |
| iperf3 receive AXE11000 6GHz | |
| Asus VivoBook S 14X S5402Z | |
| MSI Summit E14 Flip Evo A12MT | |
| iperf3 transmit AXE11000 6GHz | |
| MSI Summit E14 Flip Evo A12MT | |
| Asus VivoBook S 14X S5402Z | |
网络摄像头
网络摄像头是200万像素,与其他大多数笔记本电脑不同,100万像素的传感器仍然很常见。支持Windows Hello。
为了保护隐私,该模型依靠一个电子开关来禁用网络摄像头,而不是一个物理快门。


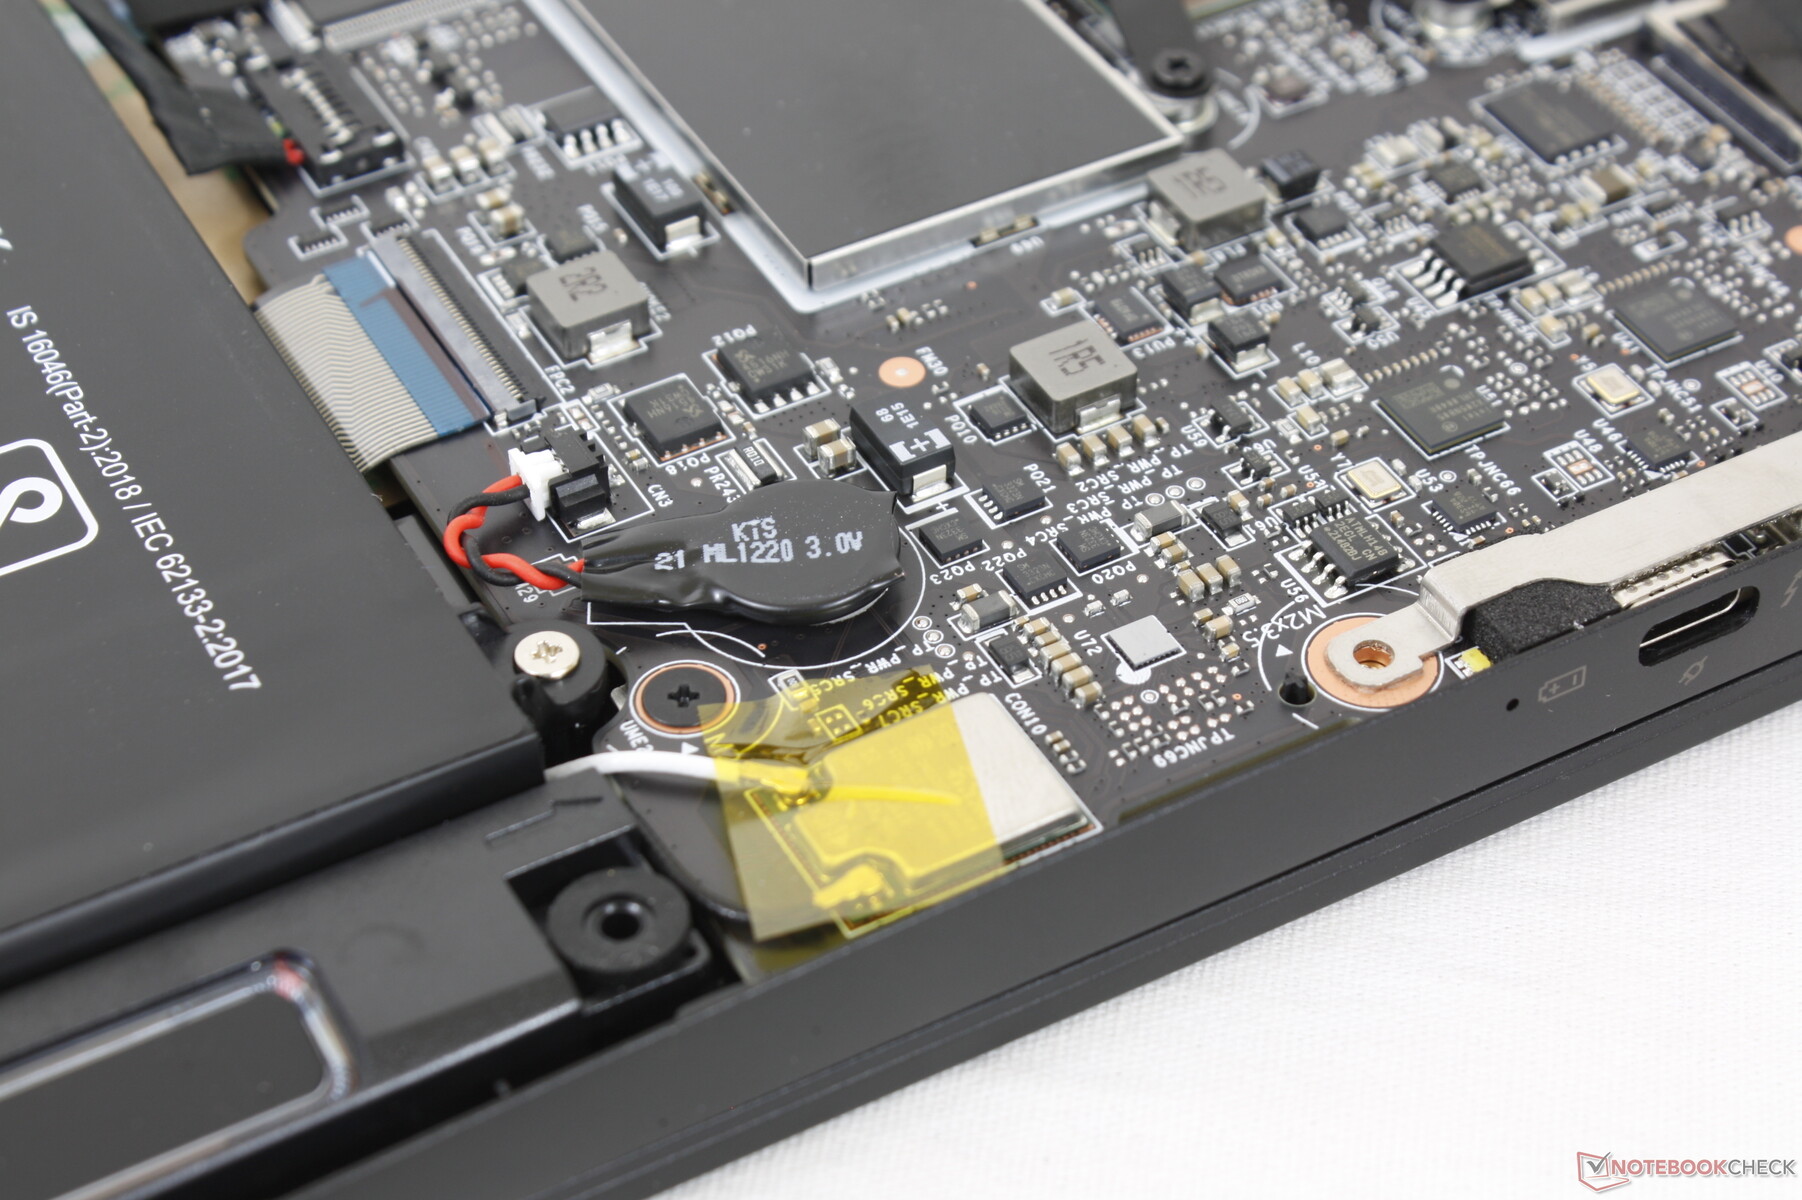
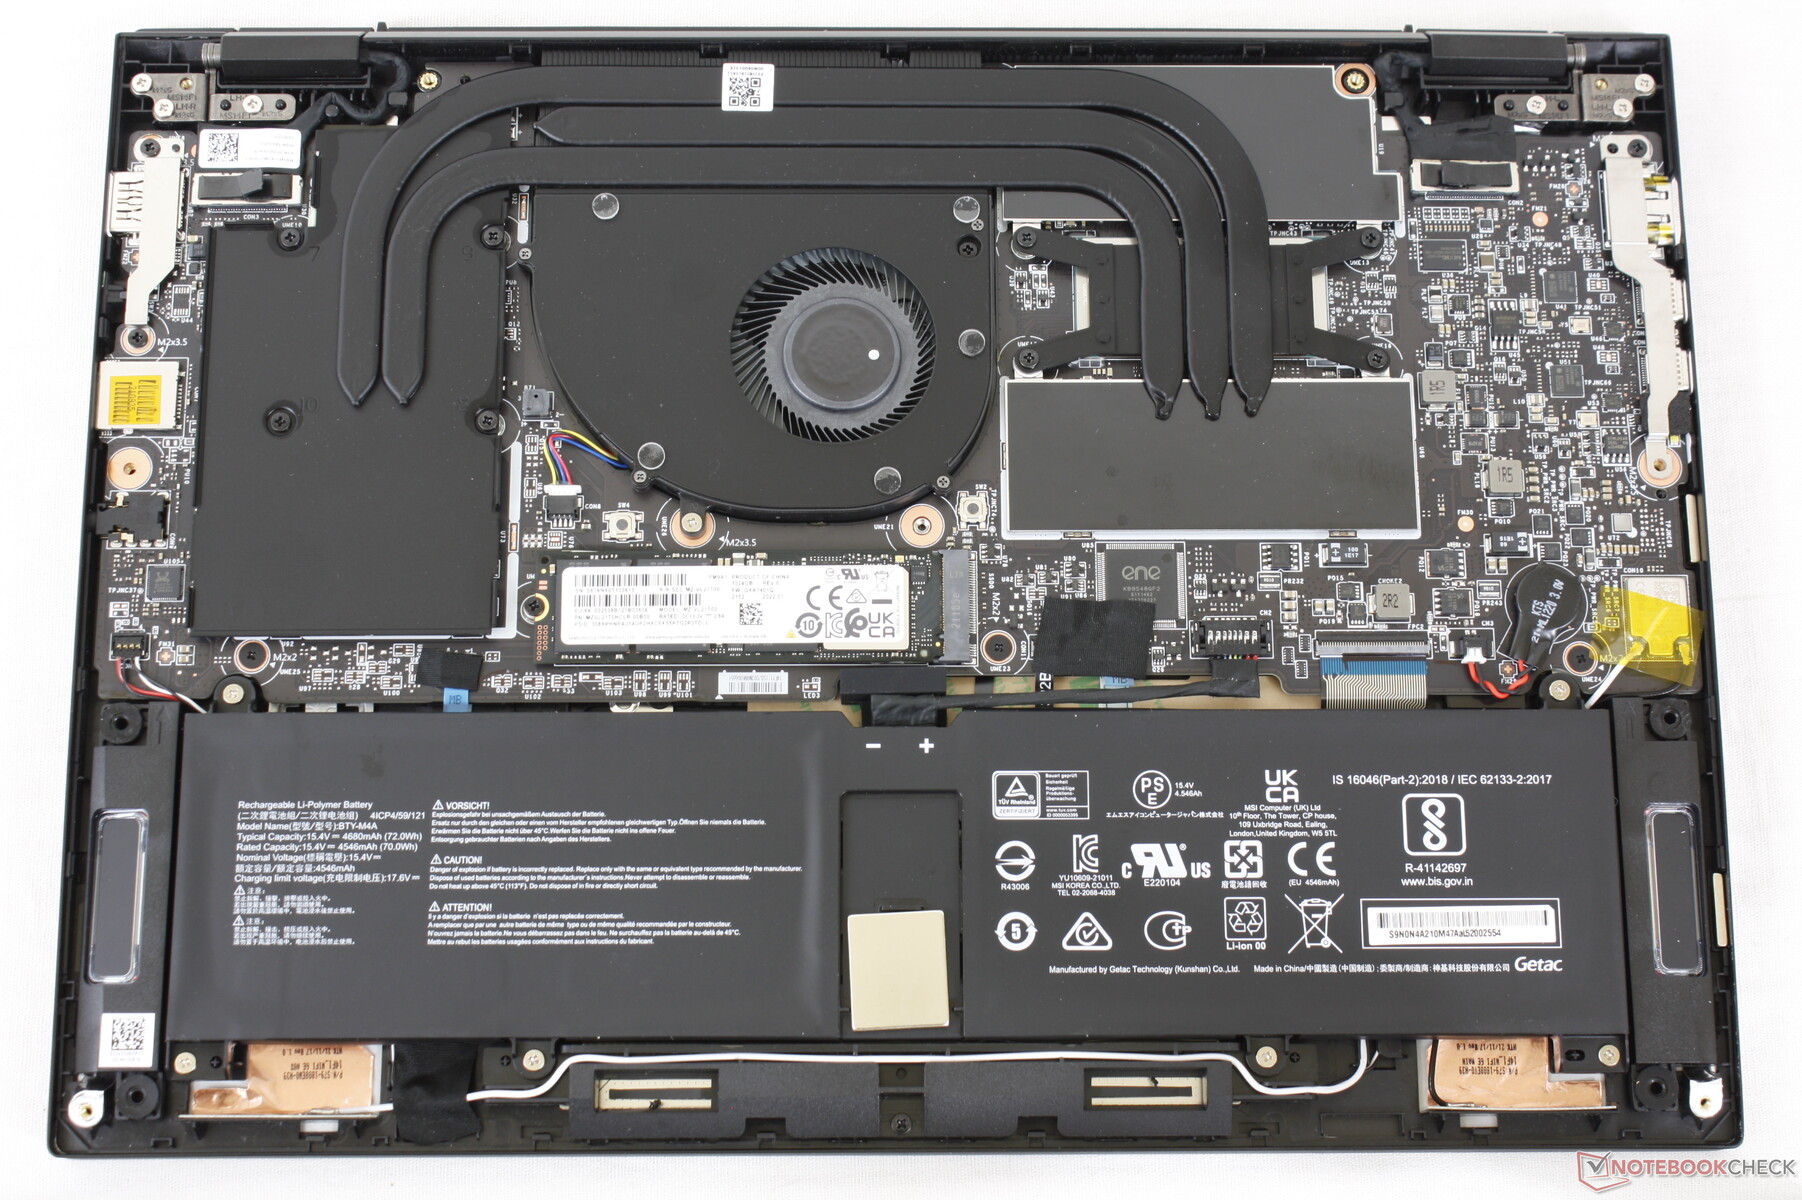
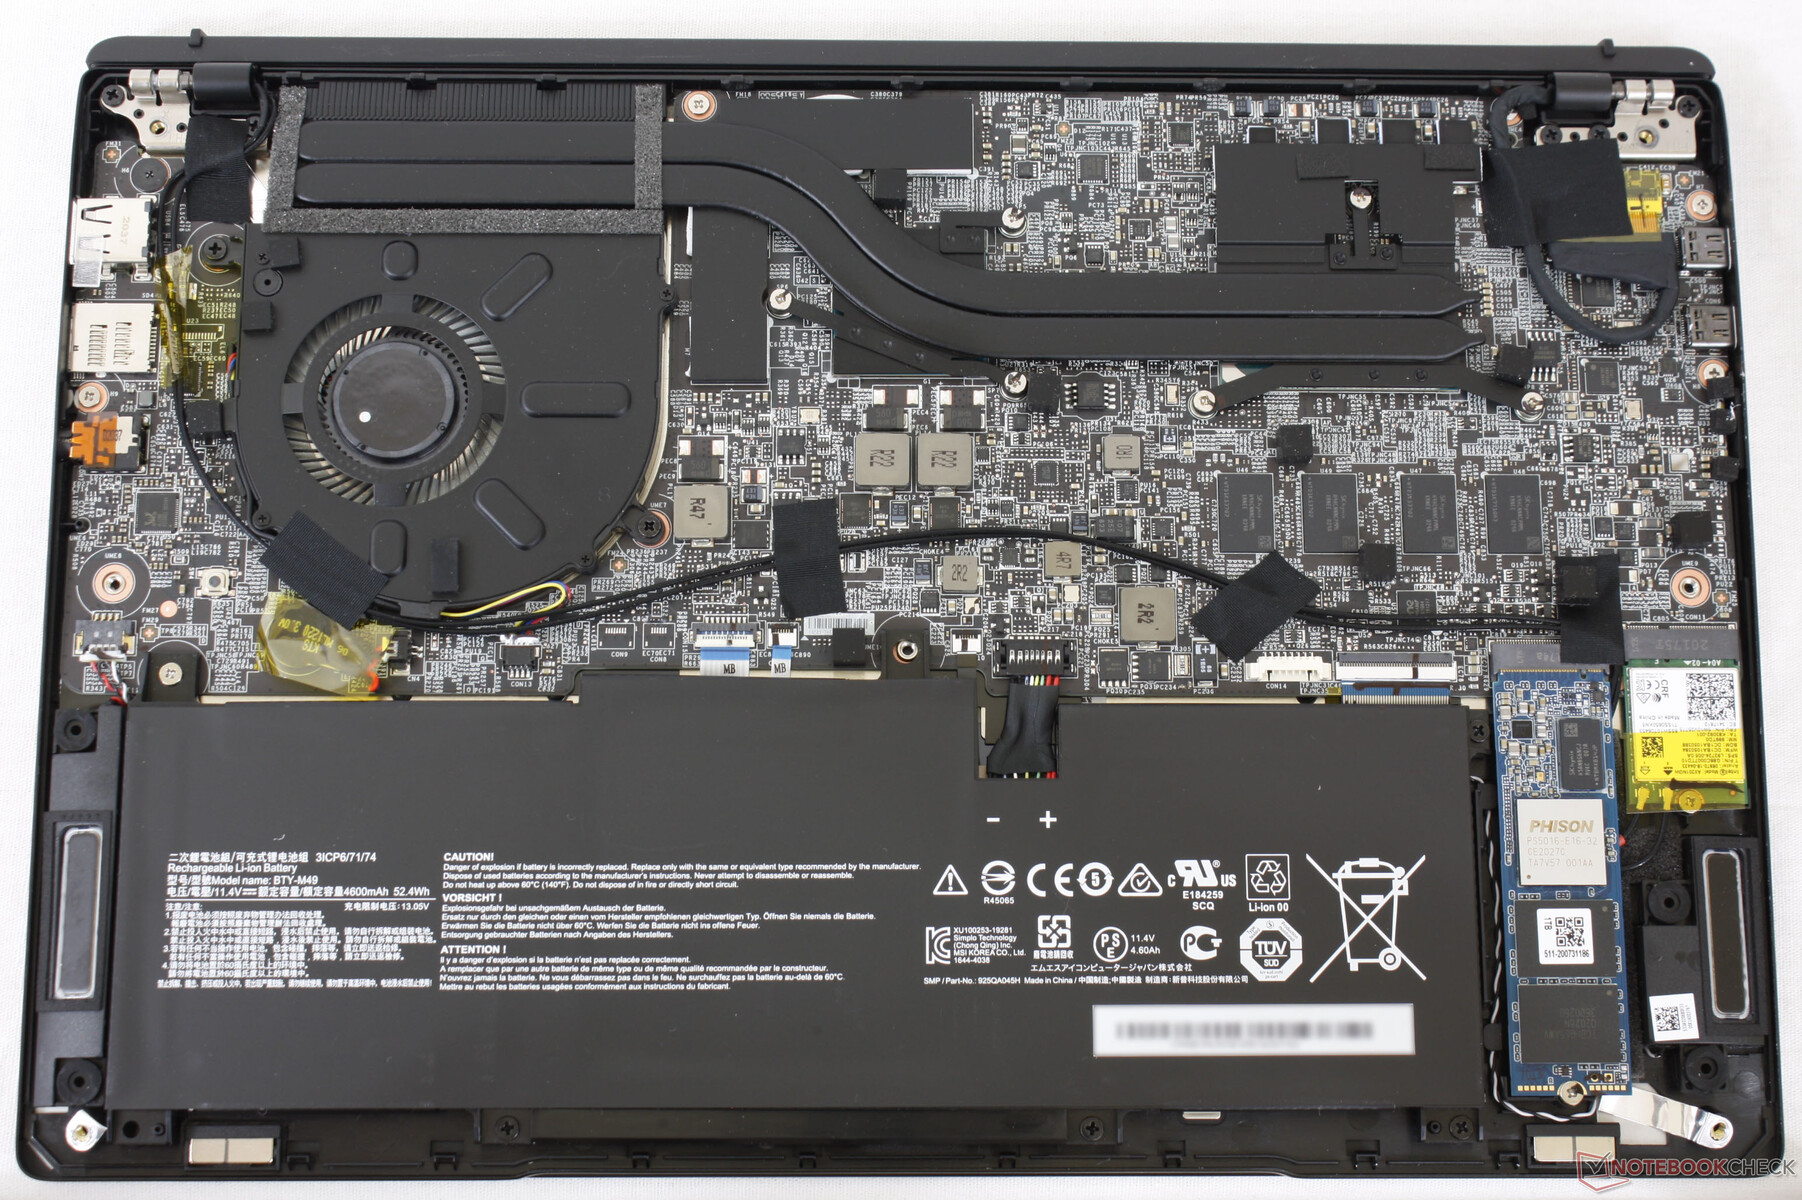
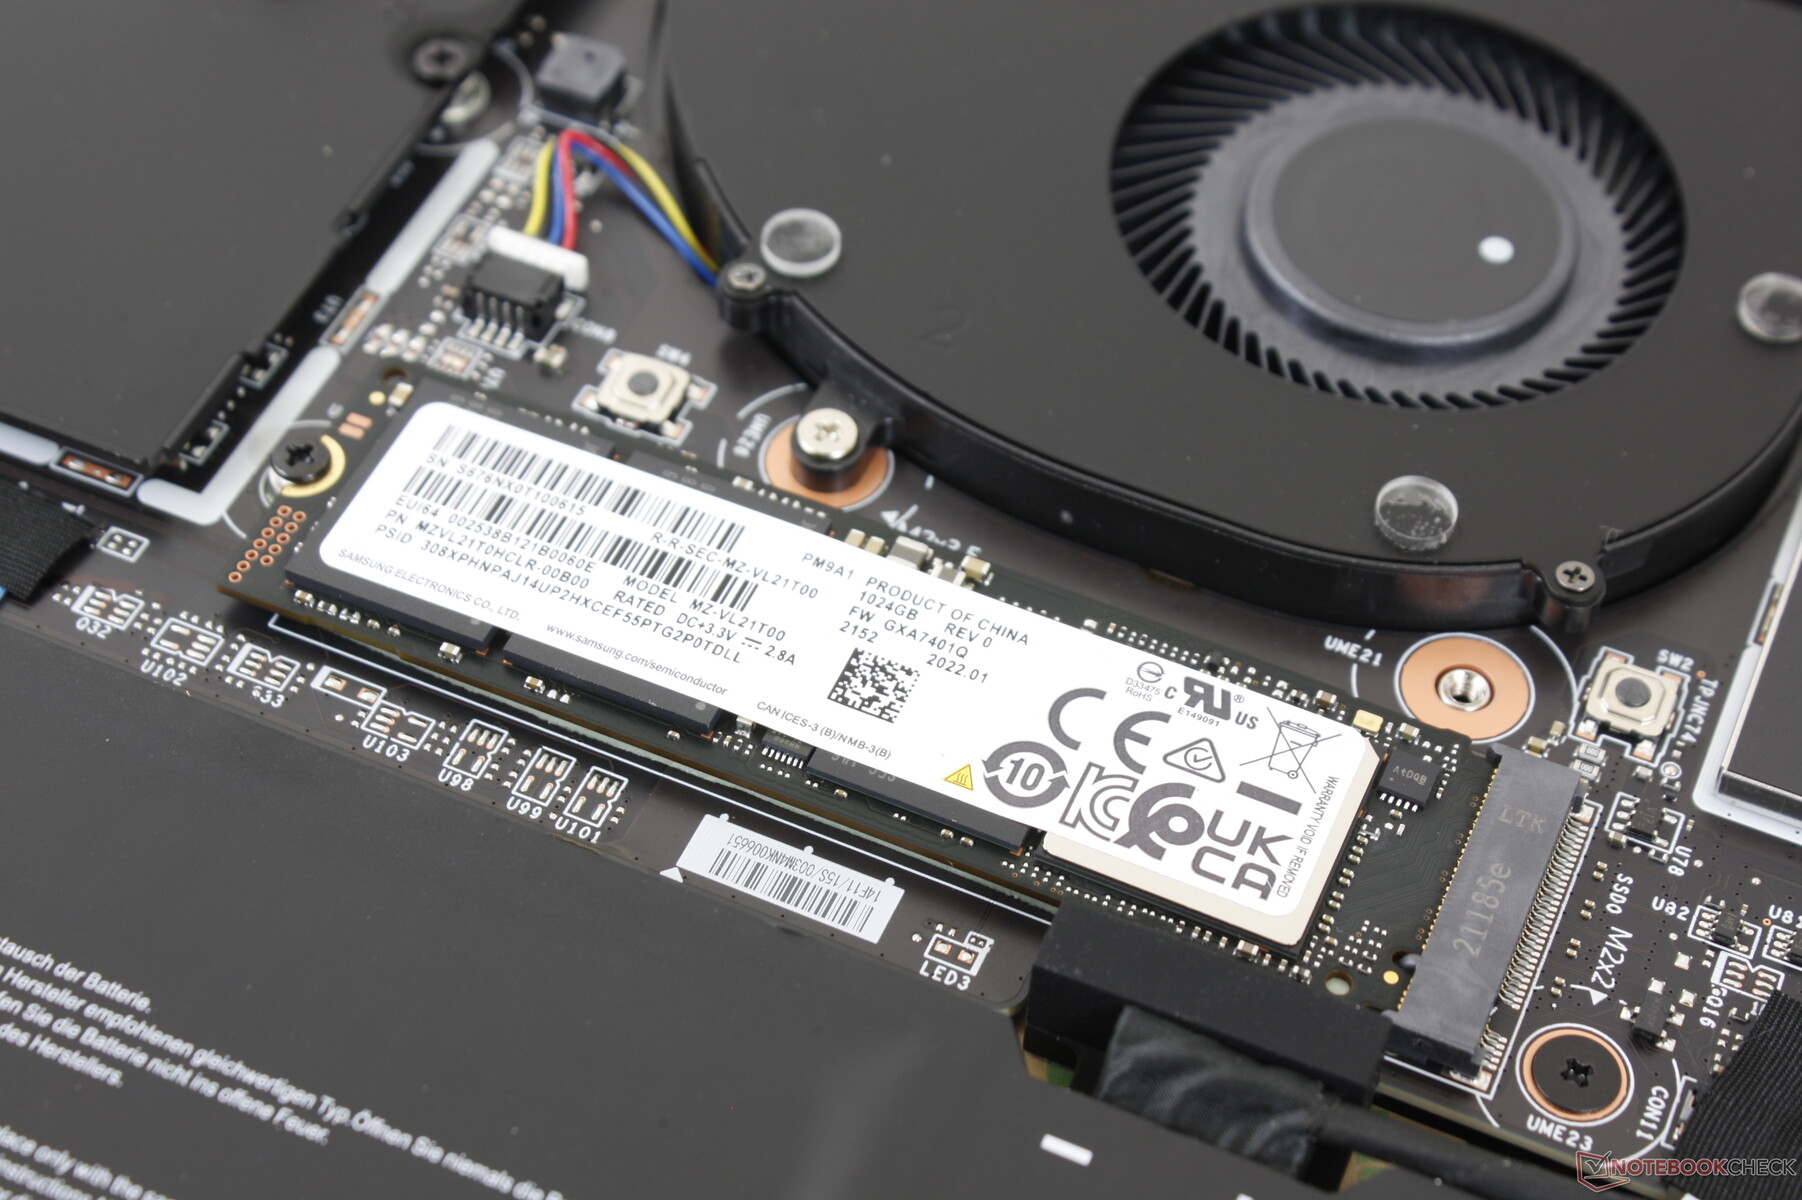
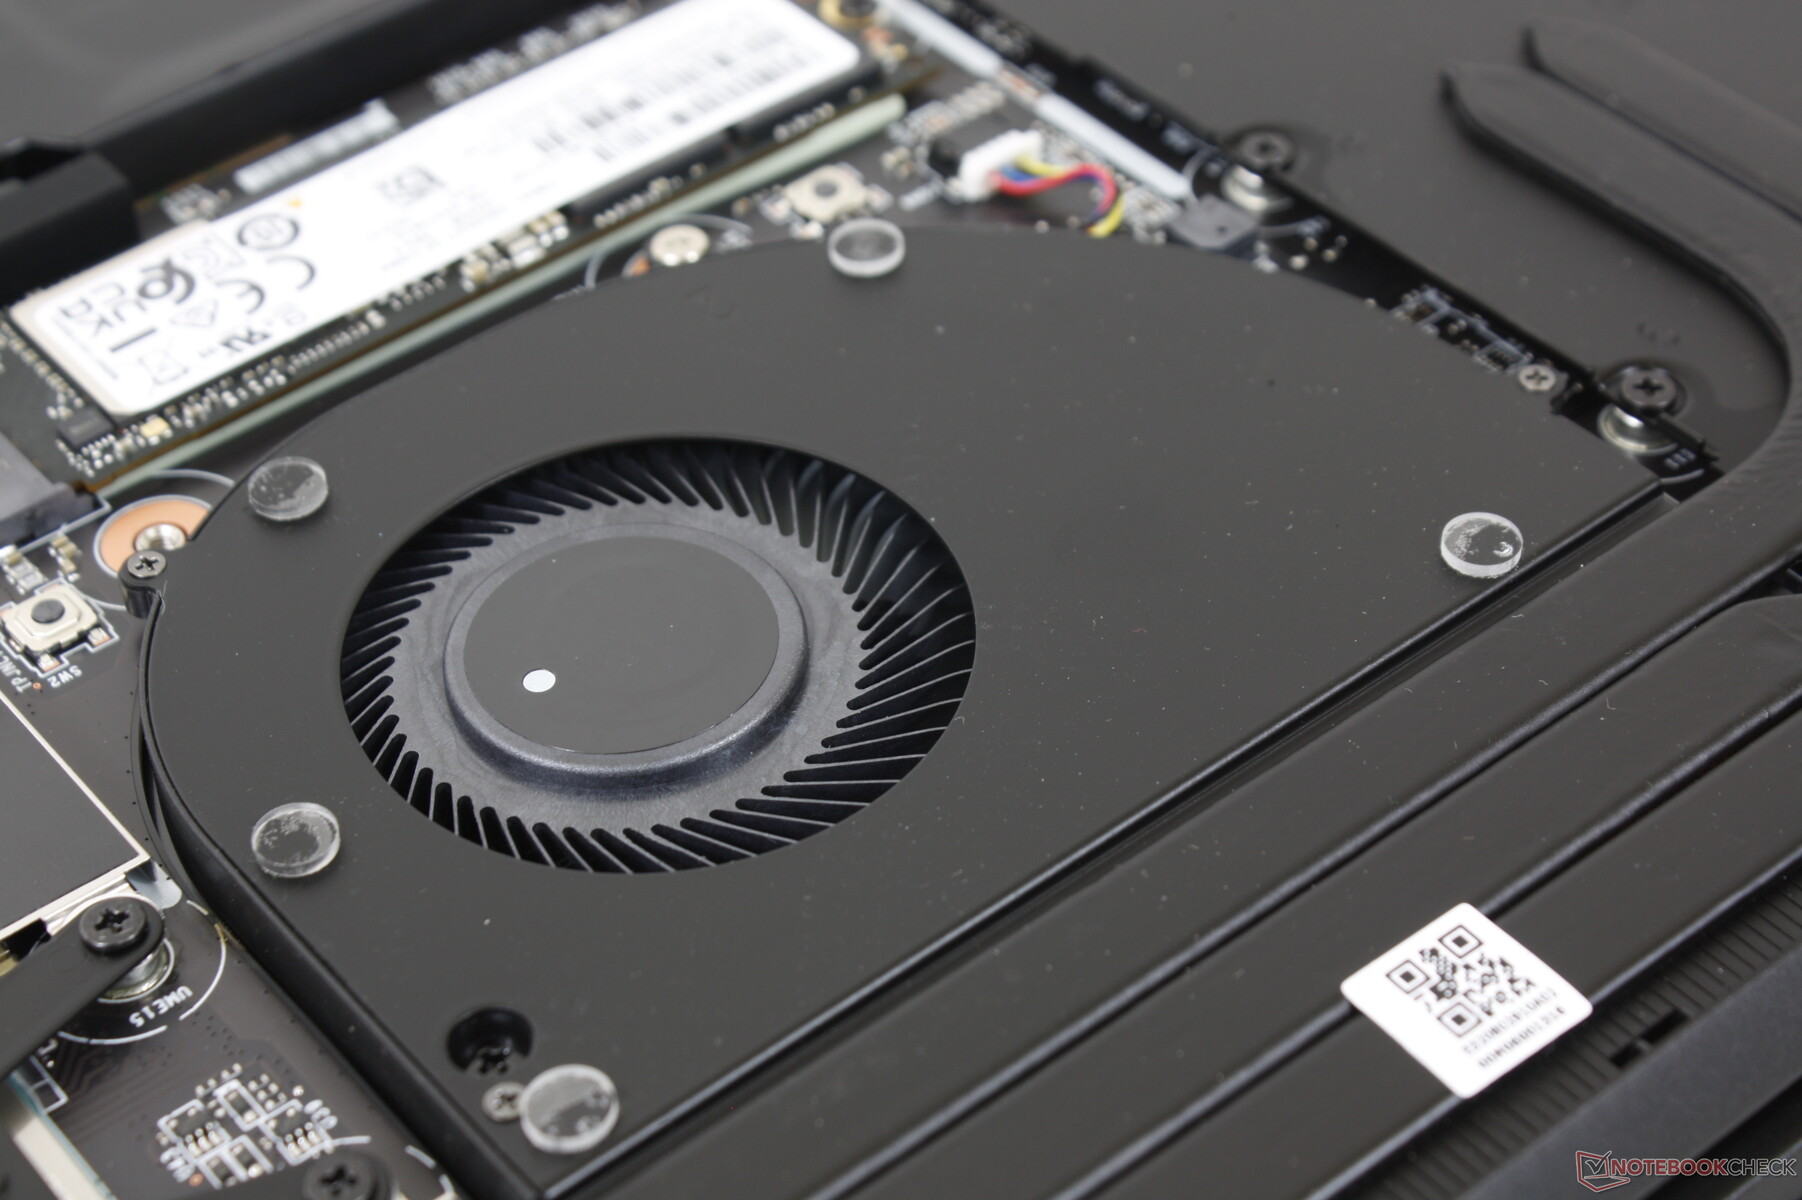
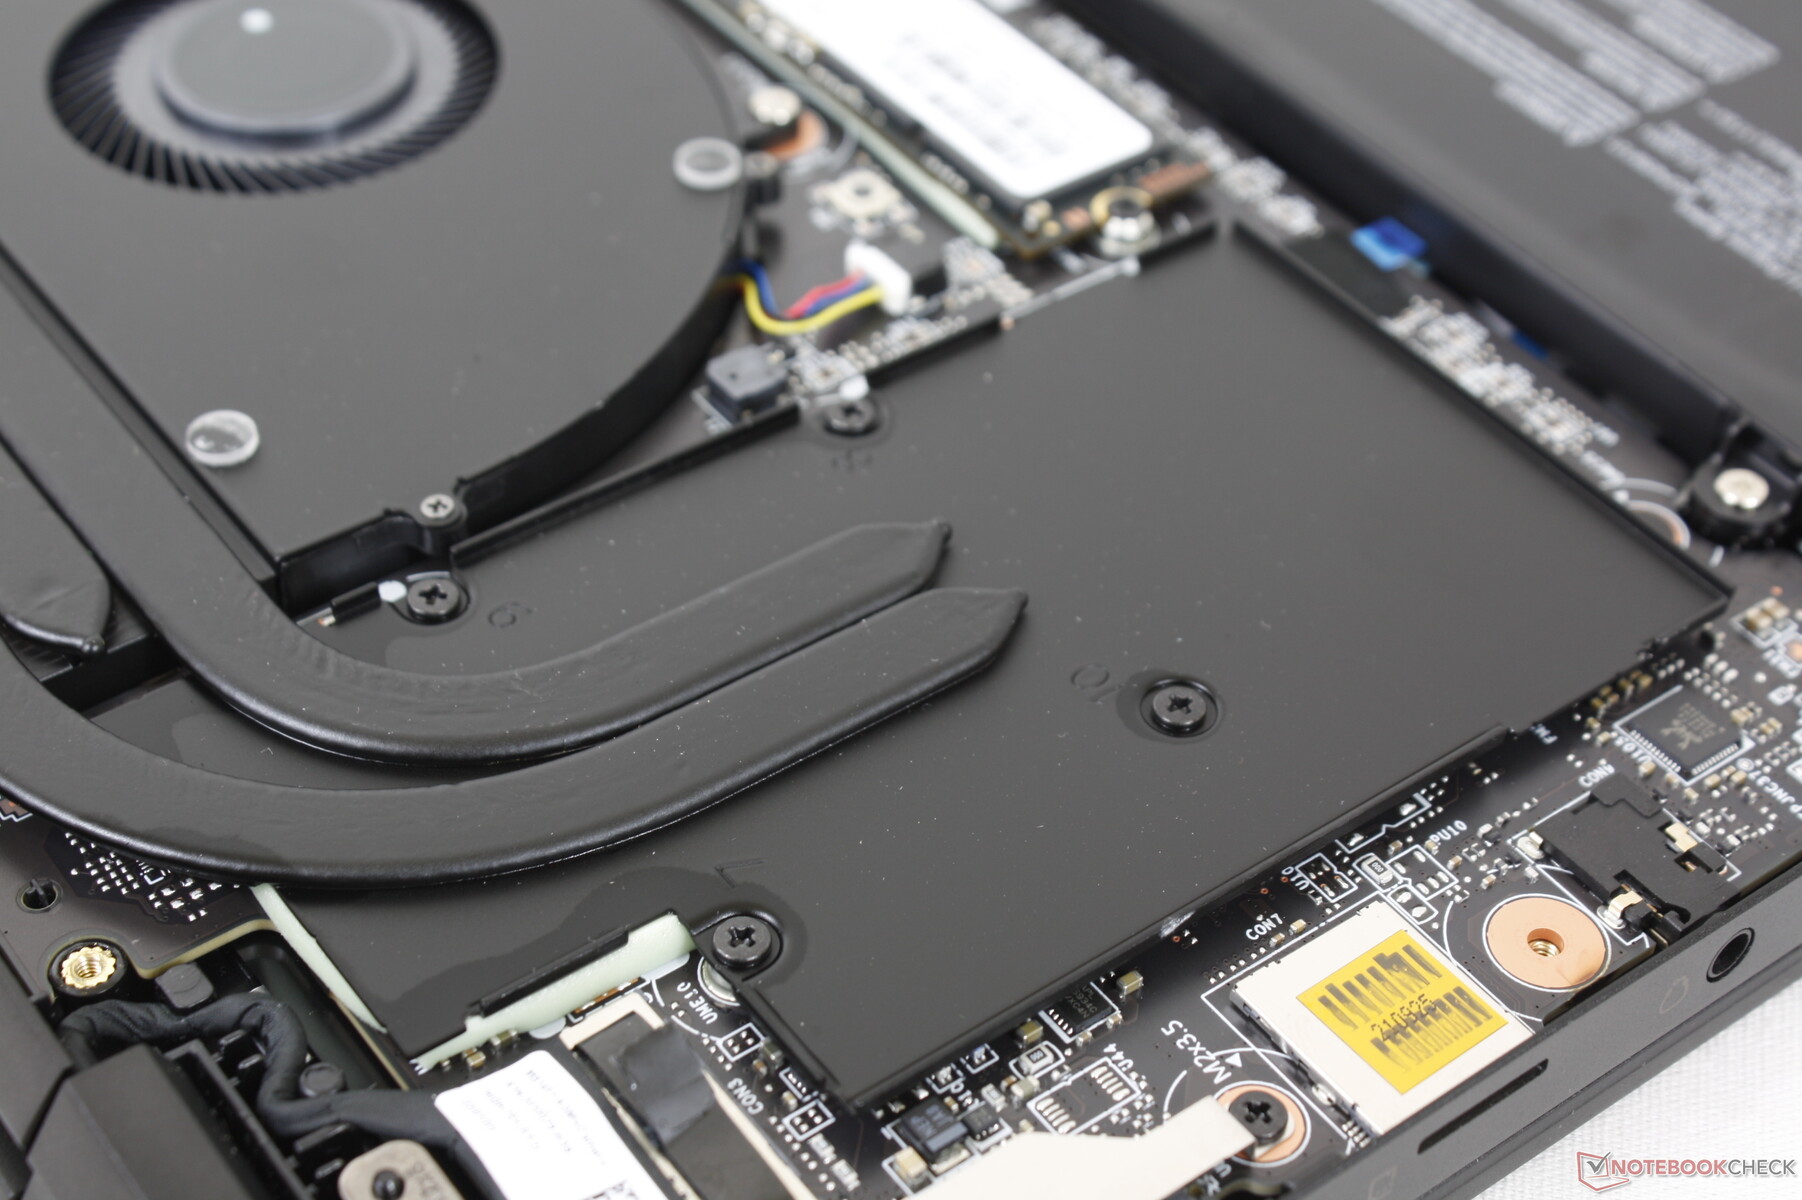
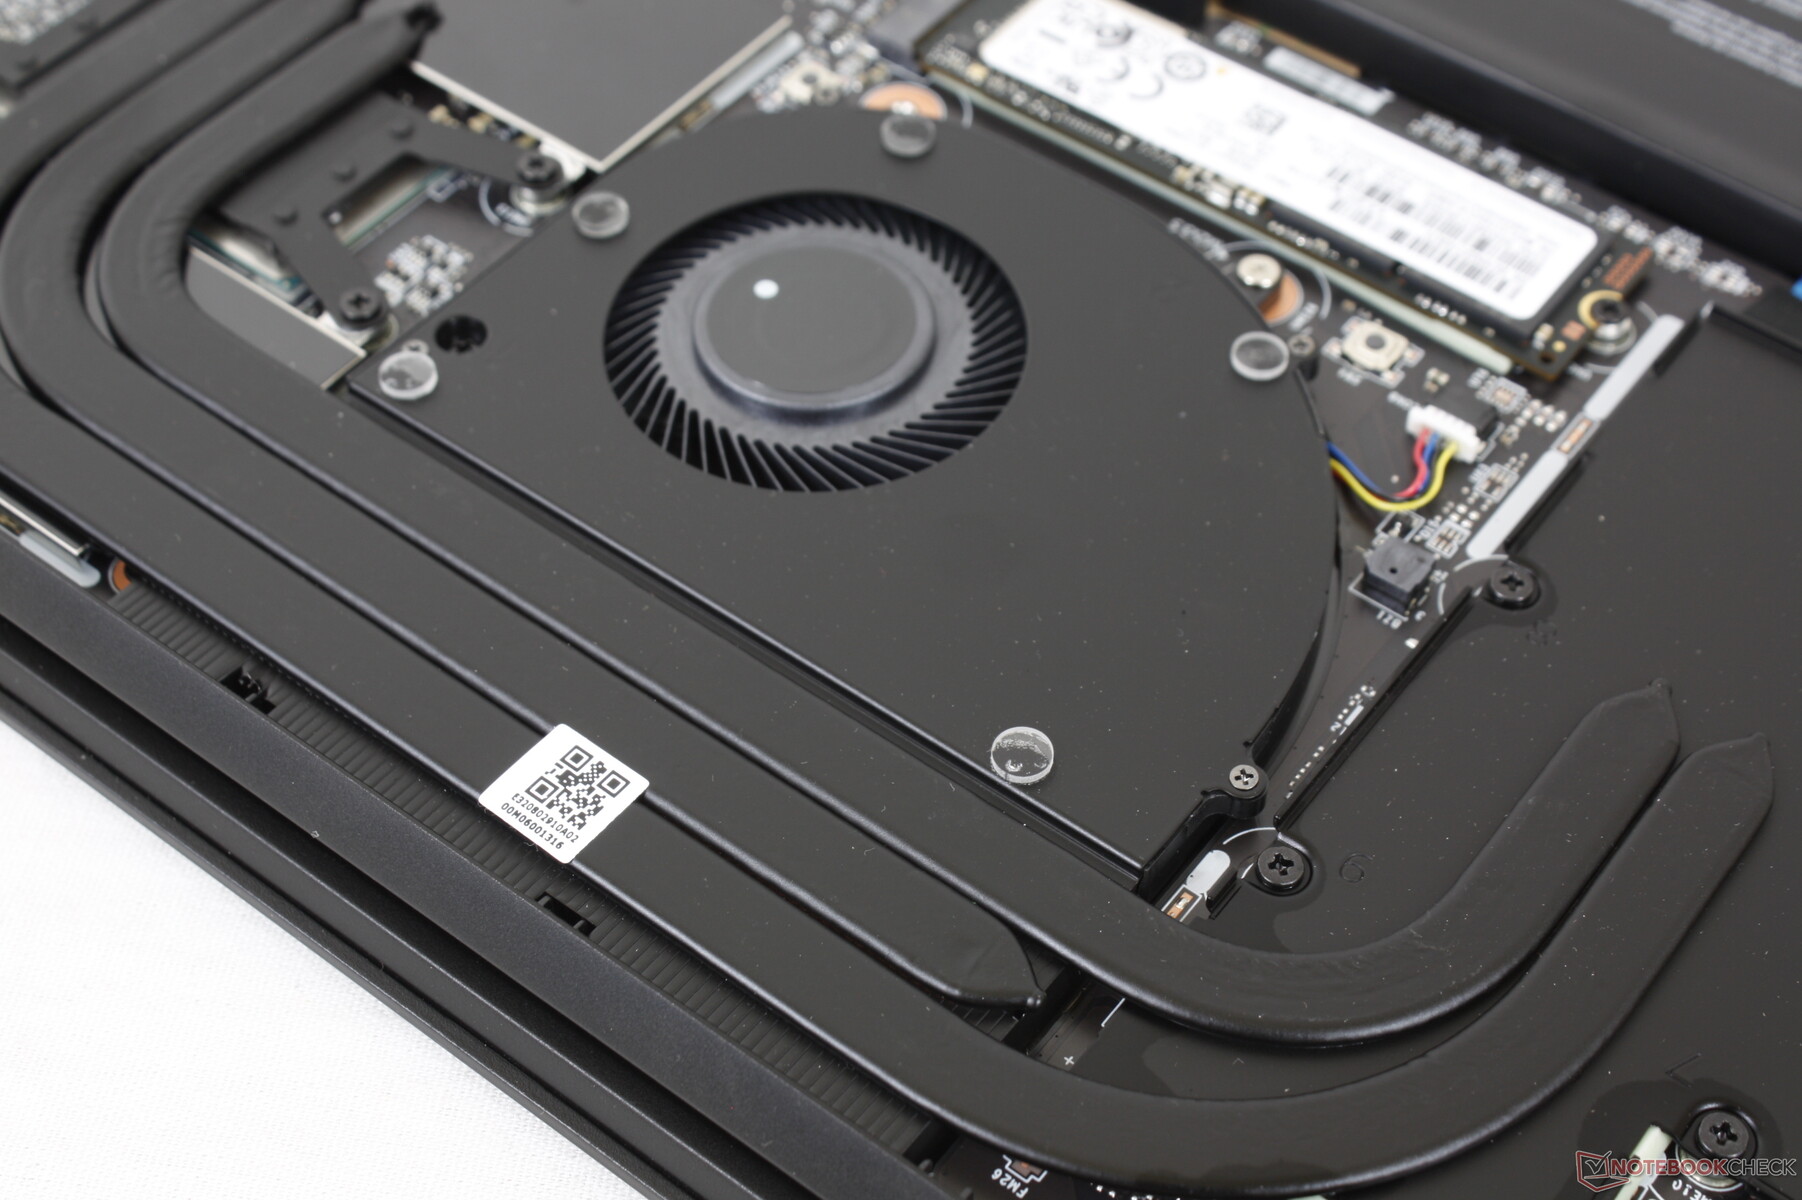
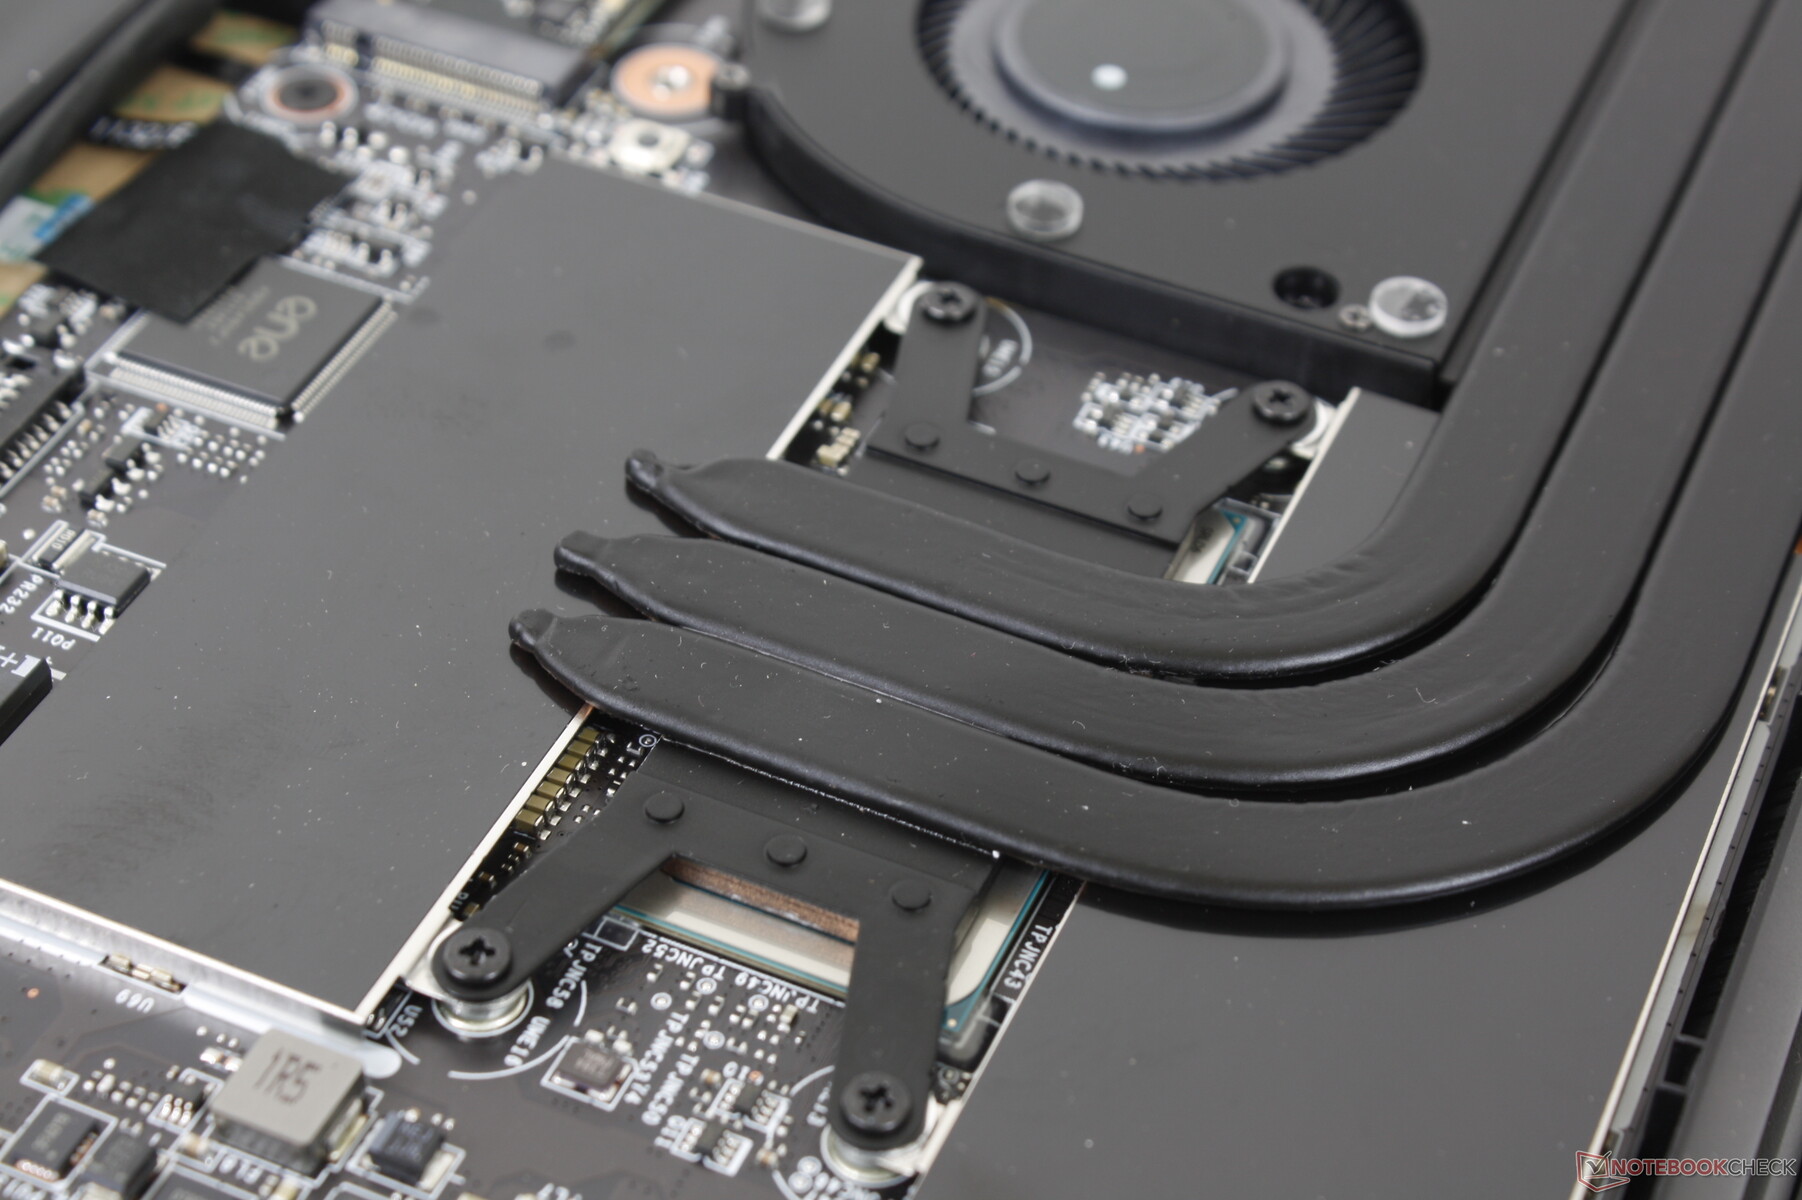
维护
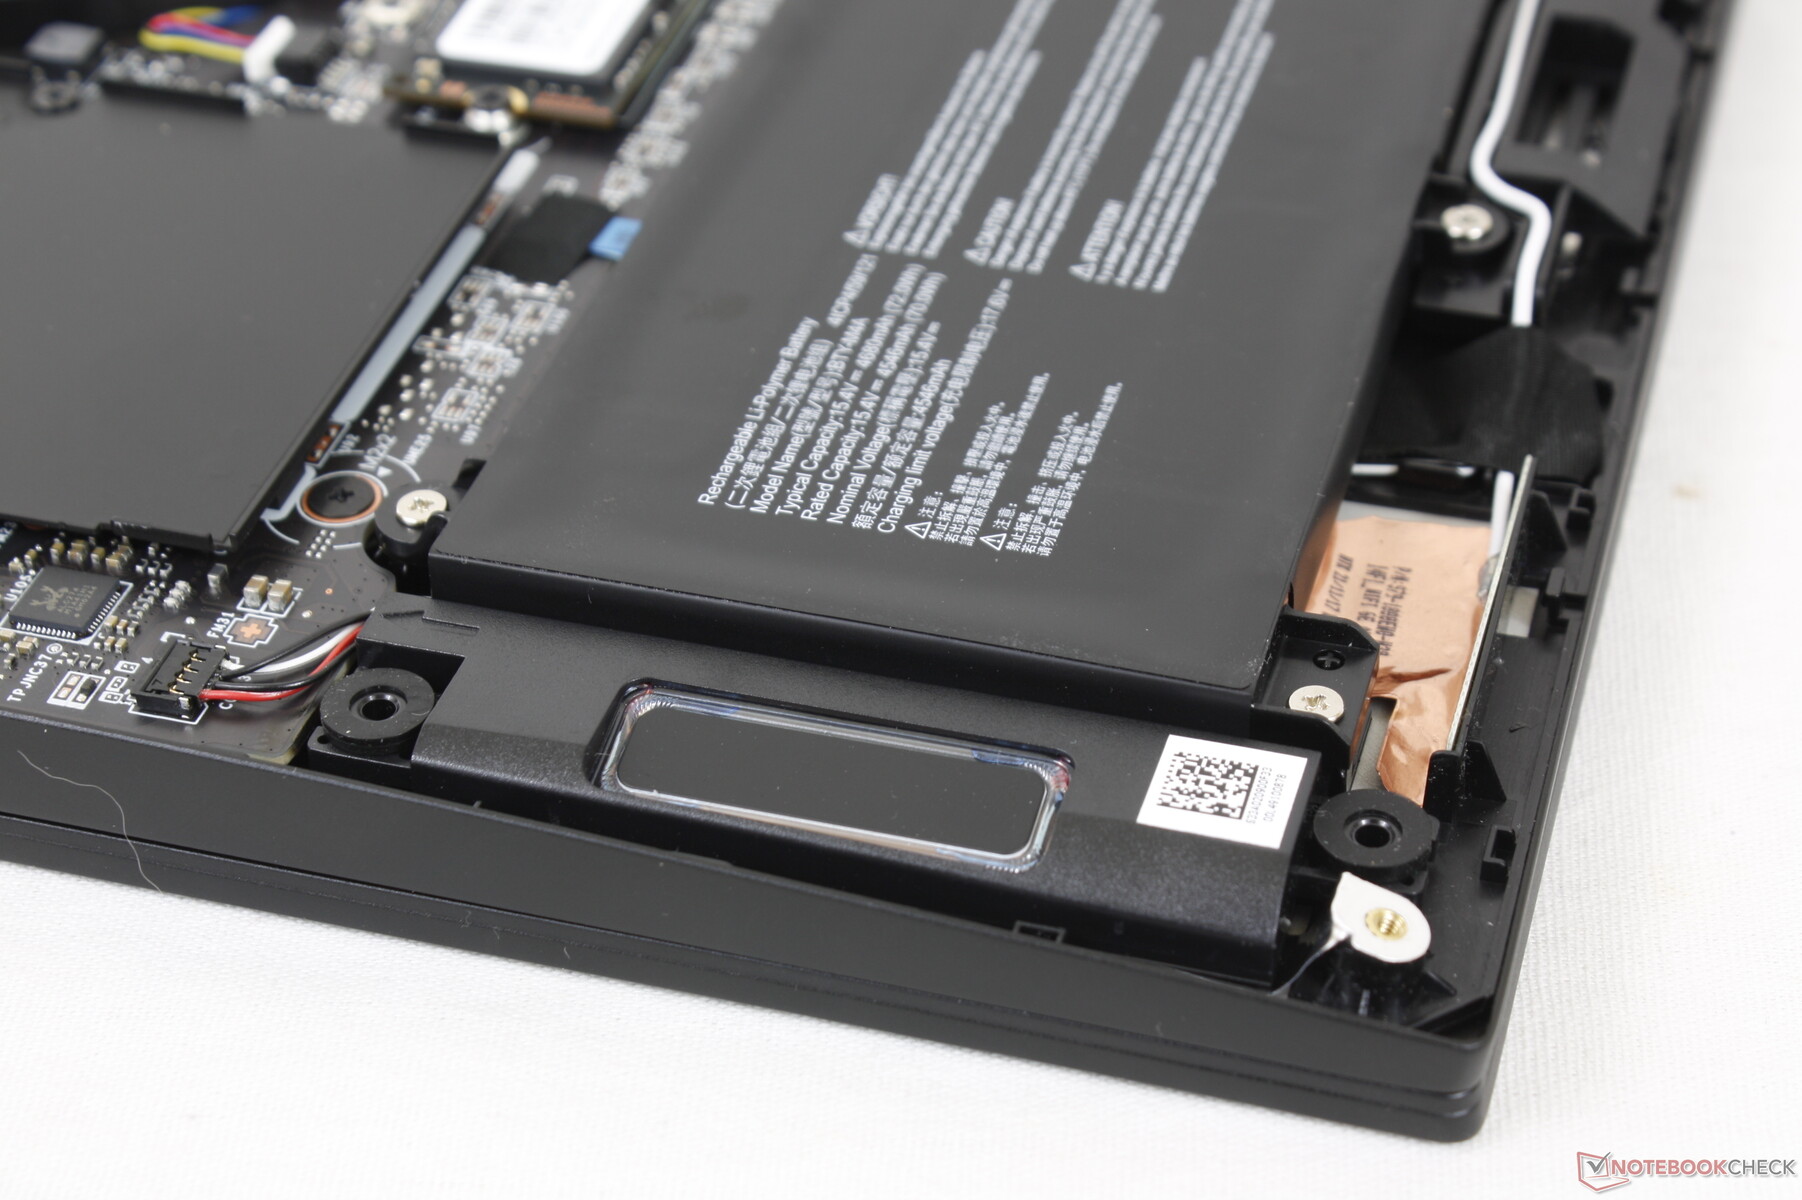
底部面板仅由9颗飞利浦螺钉固定,易于拆卸。然而,请记住,你必须打破工厂的密封贴纸,才能接触到其中一个螺丝。由于只有一个存储槽,而且内存和WLAN模块都焊接在板子上,所以没有什么可升级的。
主板的布局和设计与Summit E14蛤壳式主板完全不同,如下面的对比图所示。
配件和保修
零售包装盒包括目前售价超过100美元的主动式微星笔。标准的一年有限制造商保修适用。
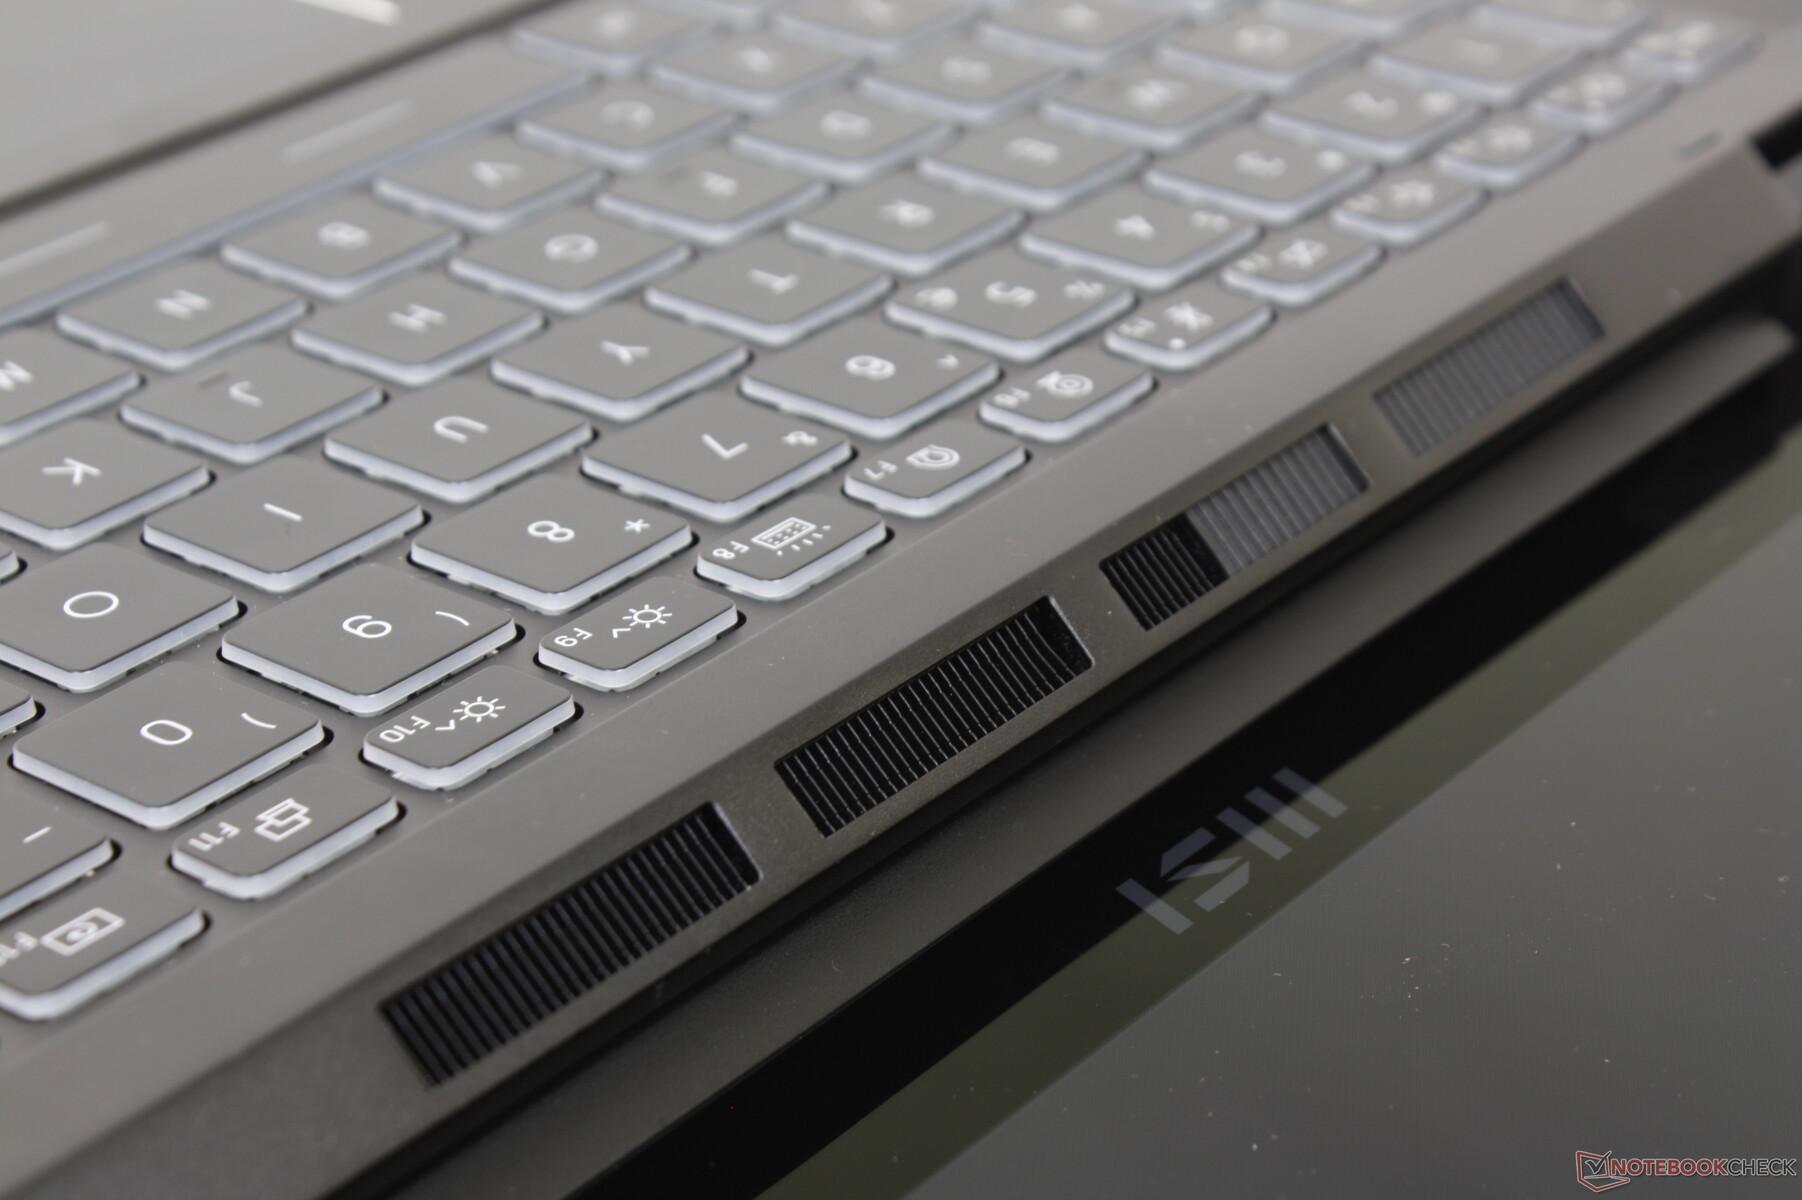
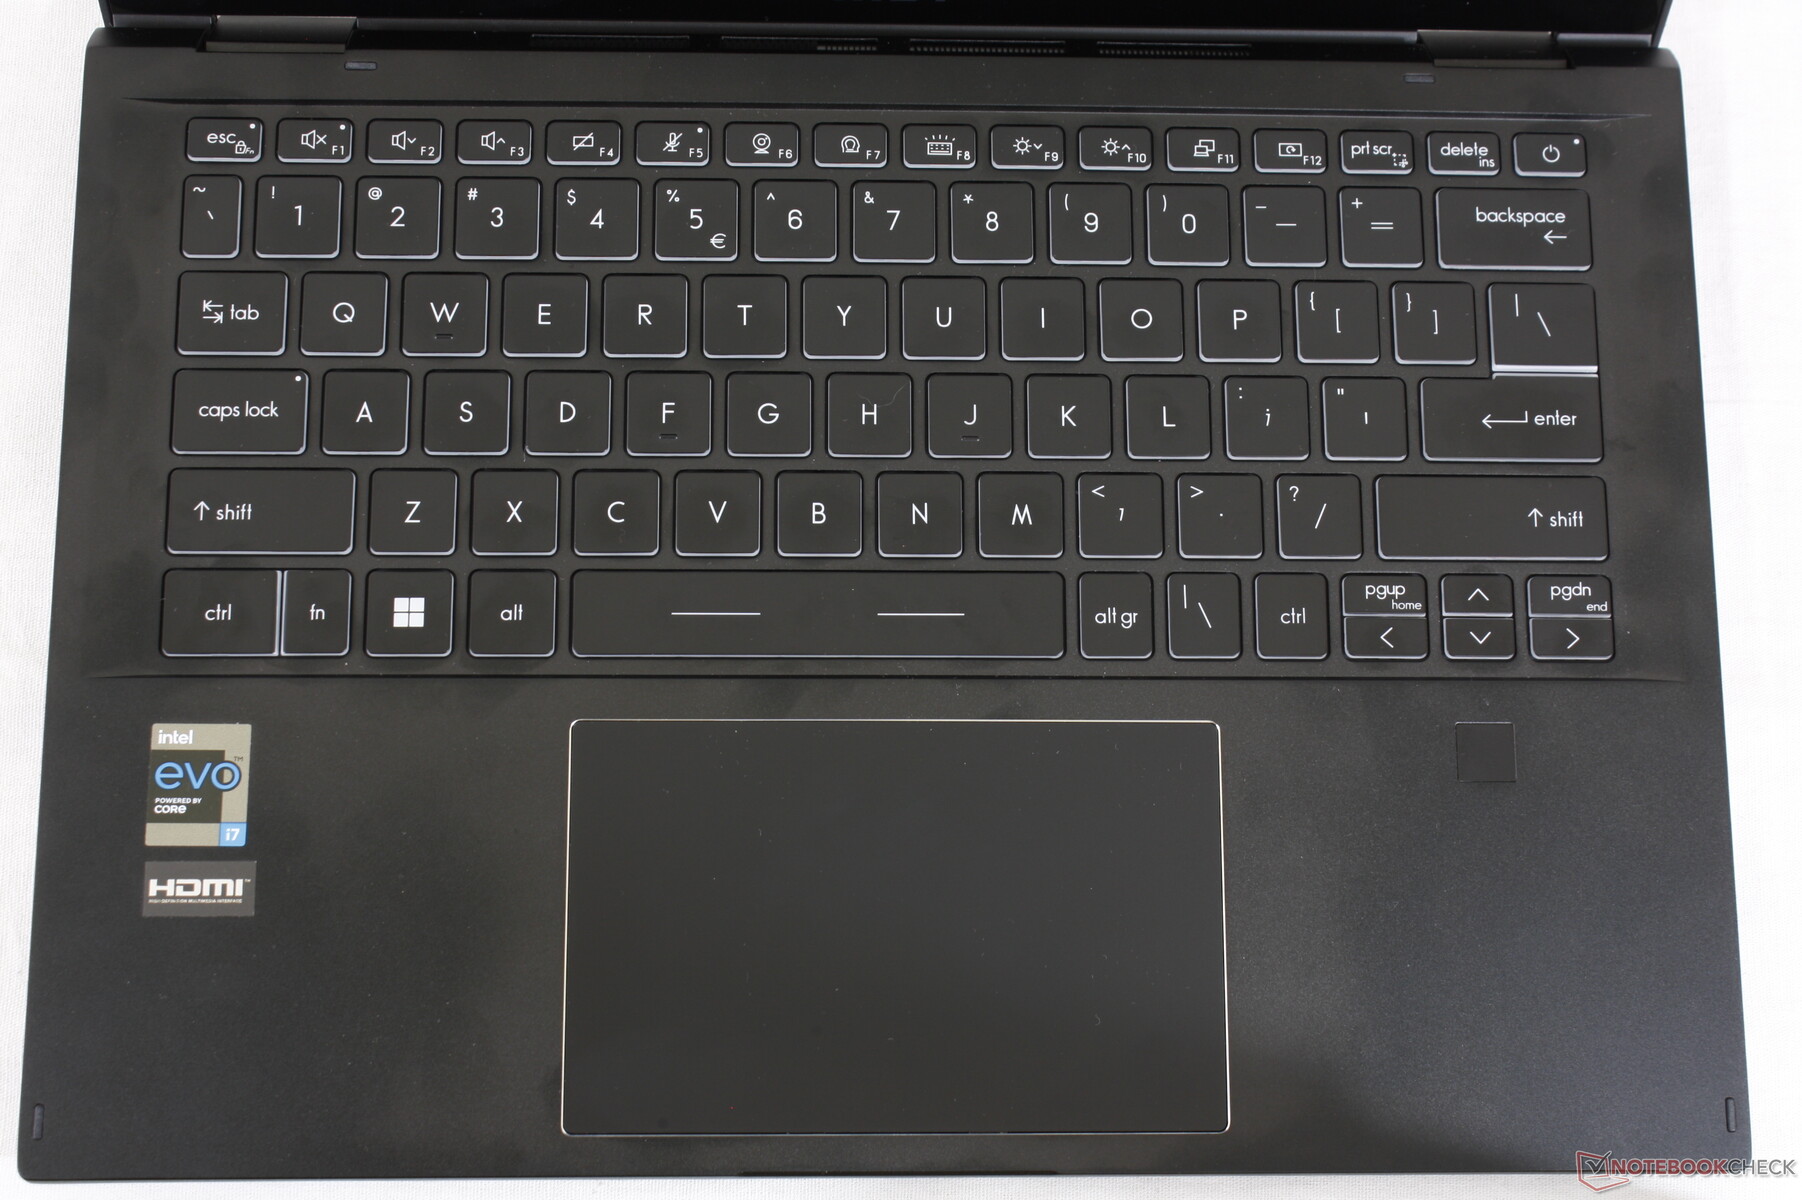
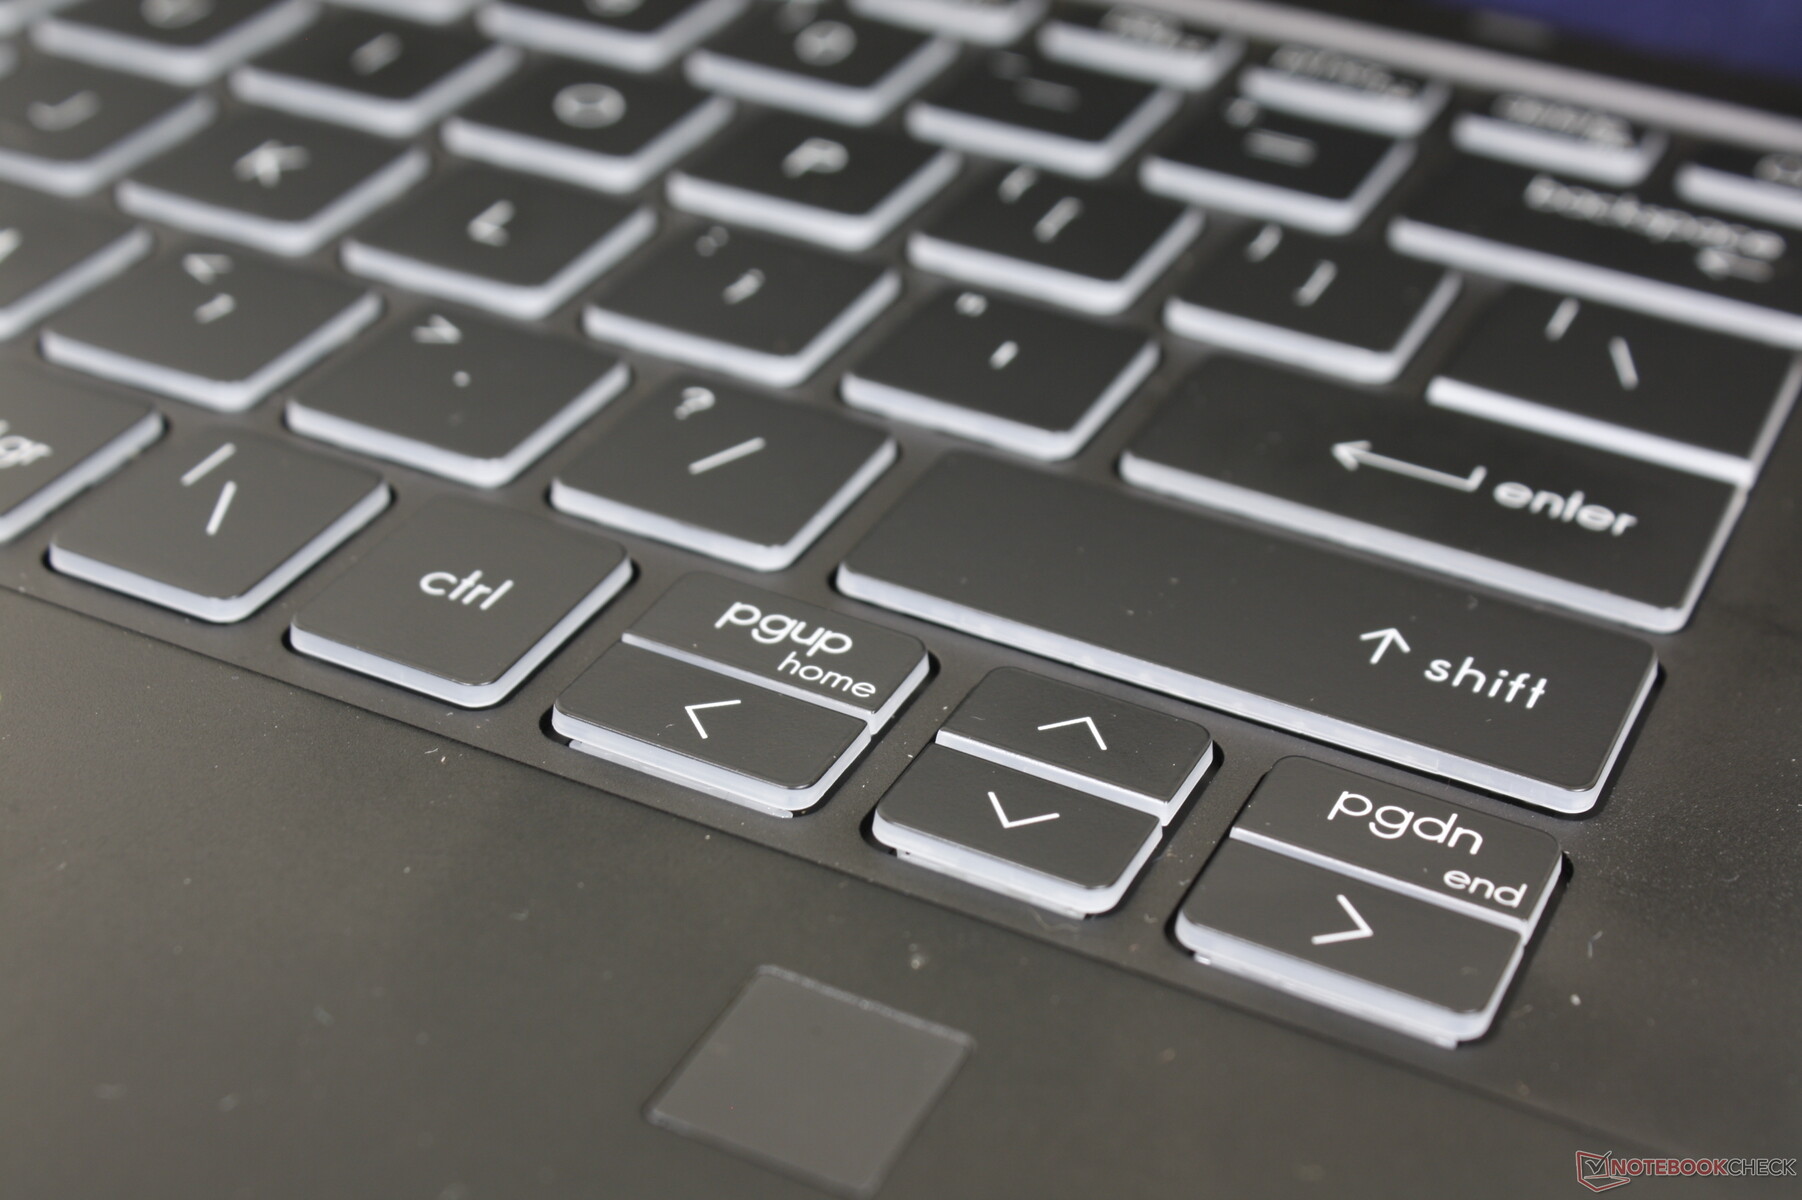
输入设备--没有重大的峰会变化
键盘
键盘布局与Summit E14的蛤壳式键盘不同。例如,右列的Del键、Insert键、PgDn键和PgUp键,现在都没有了,整个键盘宽度更短。打字的体验仍然令人满意,按键的声音比一般的要大,反馈也比一般的键盘要稍微柔和一些。 HP Spectre x360 14.
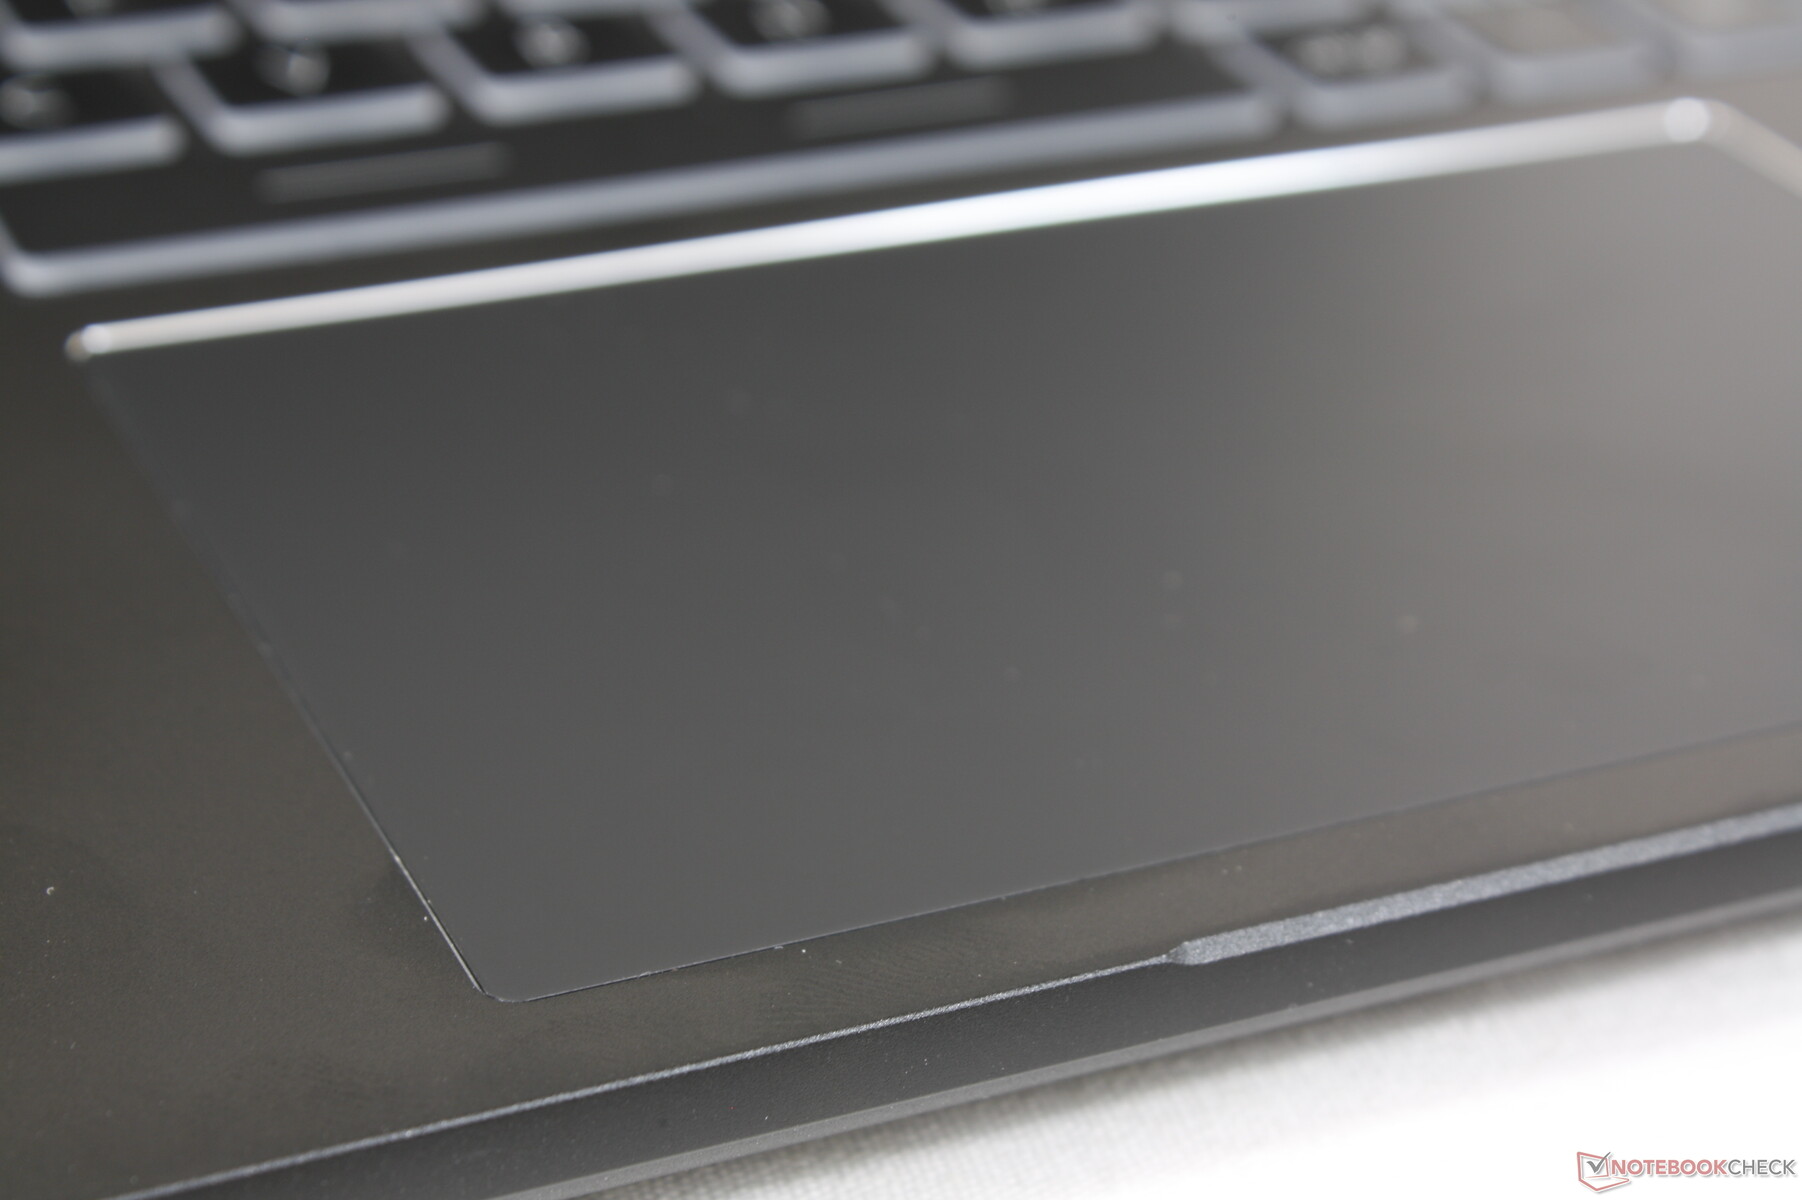
触摸板
微星将点击板的尺寸从Summit E14蛤壳版的10.5 x 6.5厘米增加到可转换版本的12 x 7.5厘米,以获得更舒适的多点触摸输入。它的滑行特性即使在慢速移动时也非常流畅,这可能会使更精细的光标点击变得有些困难。同时,在点击板上点击的反馈是充分的,而且很容易快速连续按下,不会使手指疲劳。
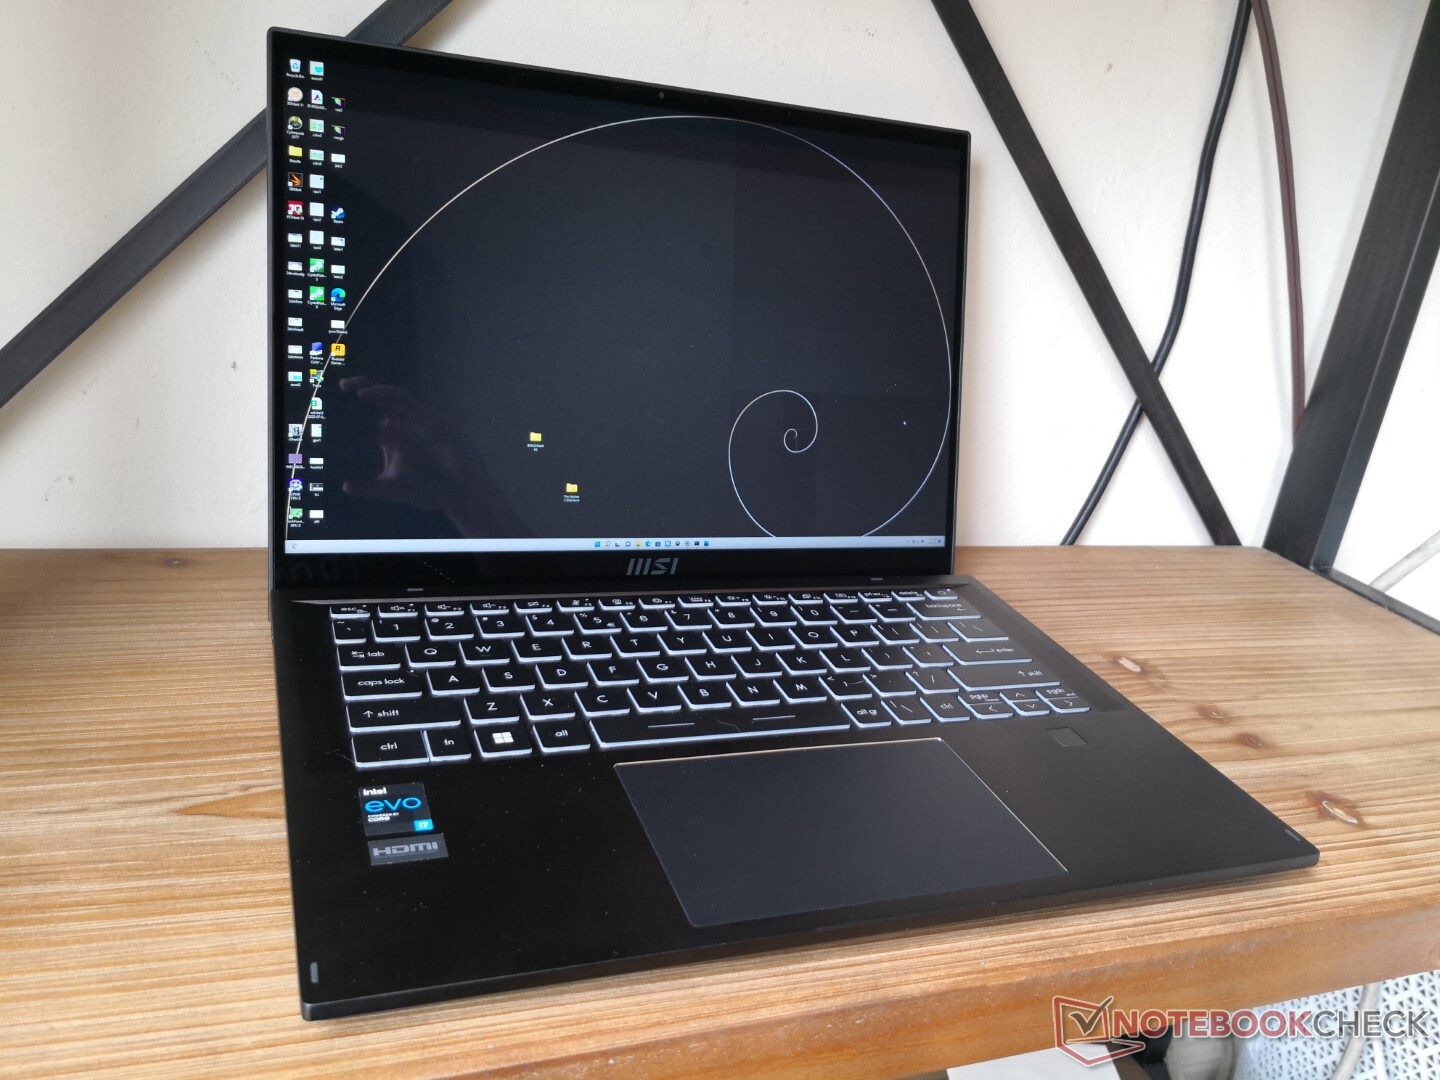
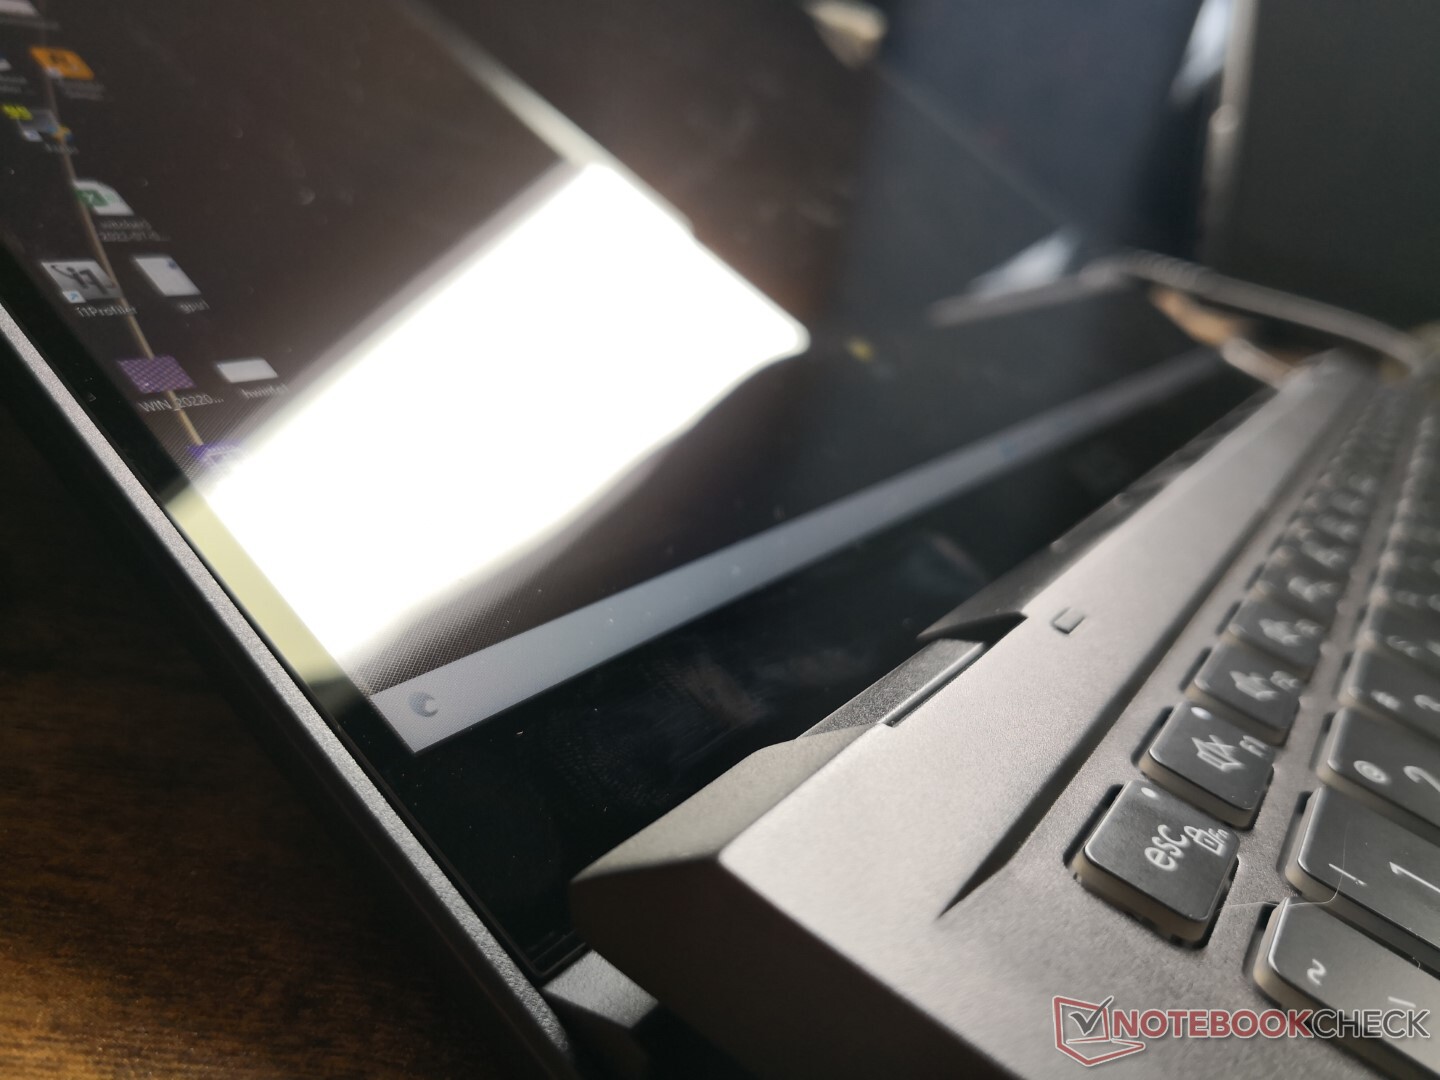
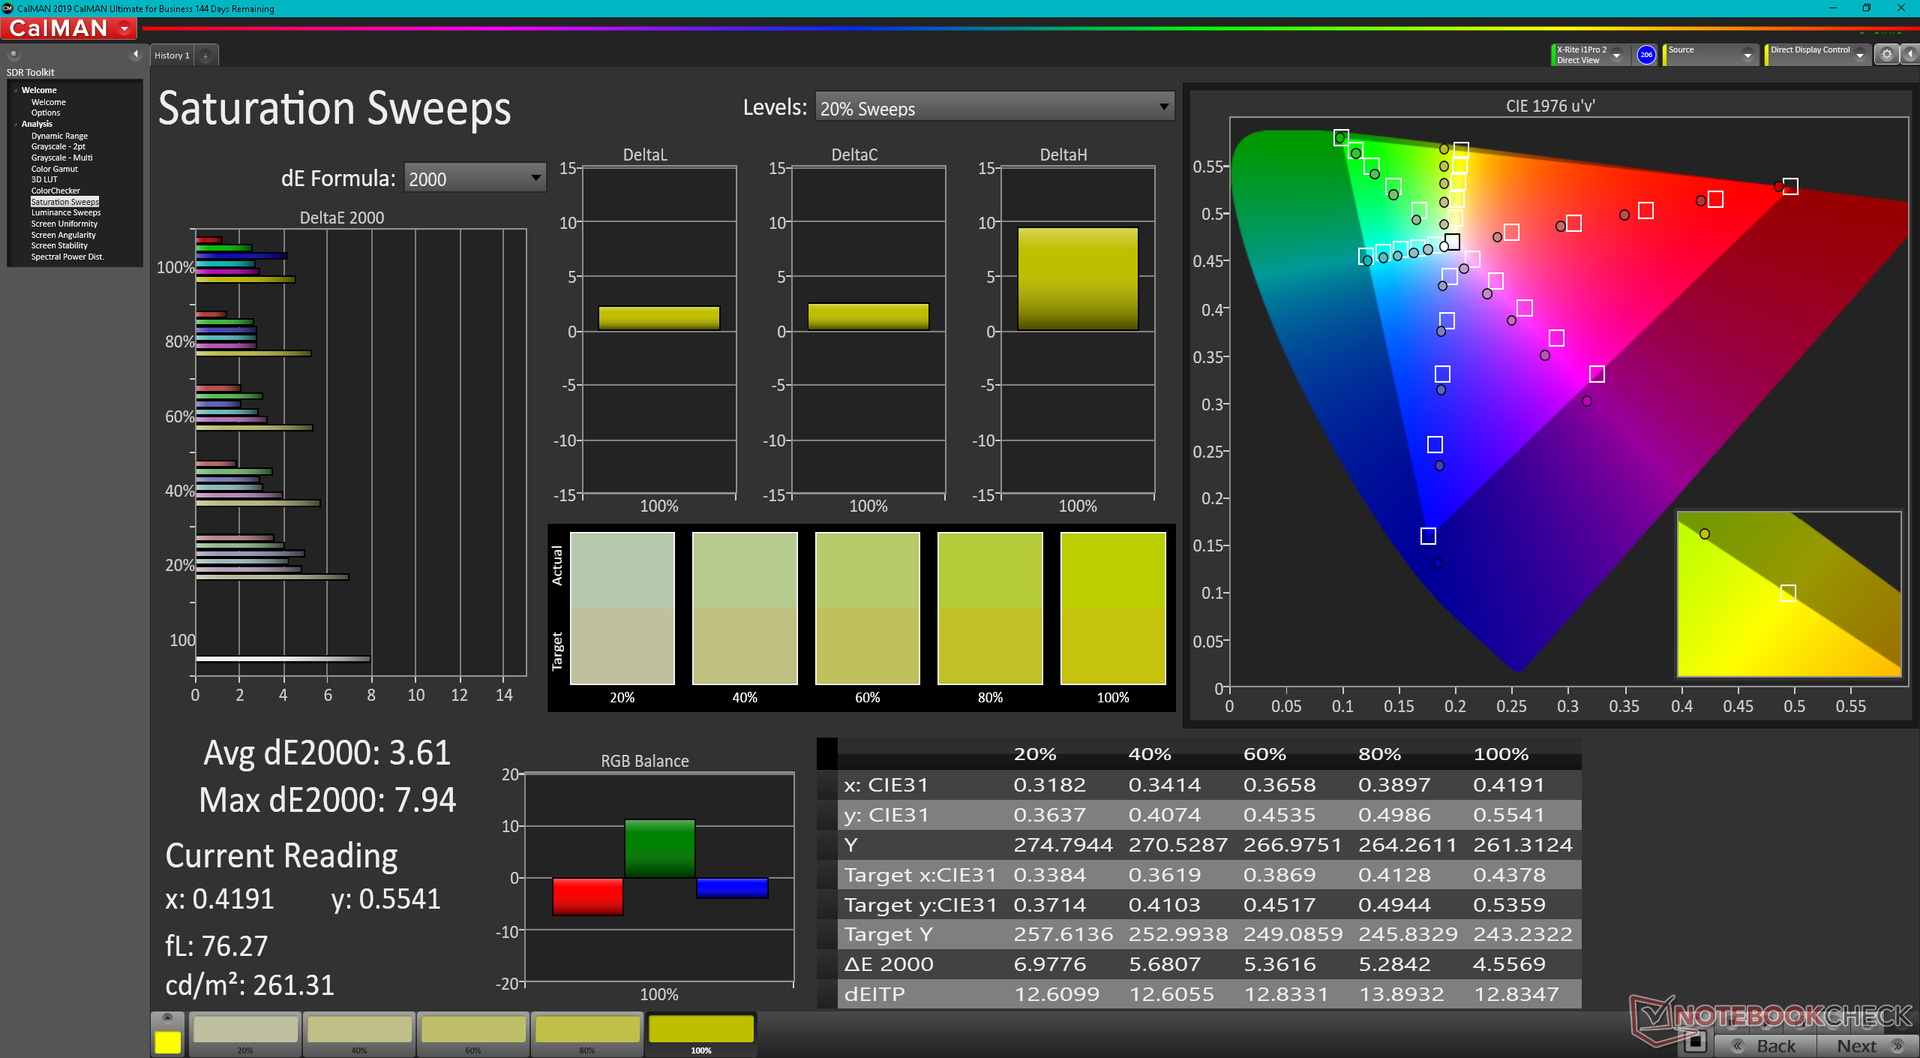
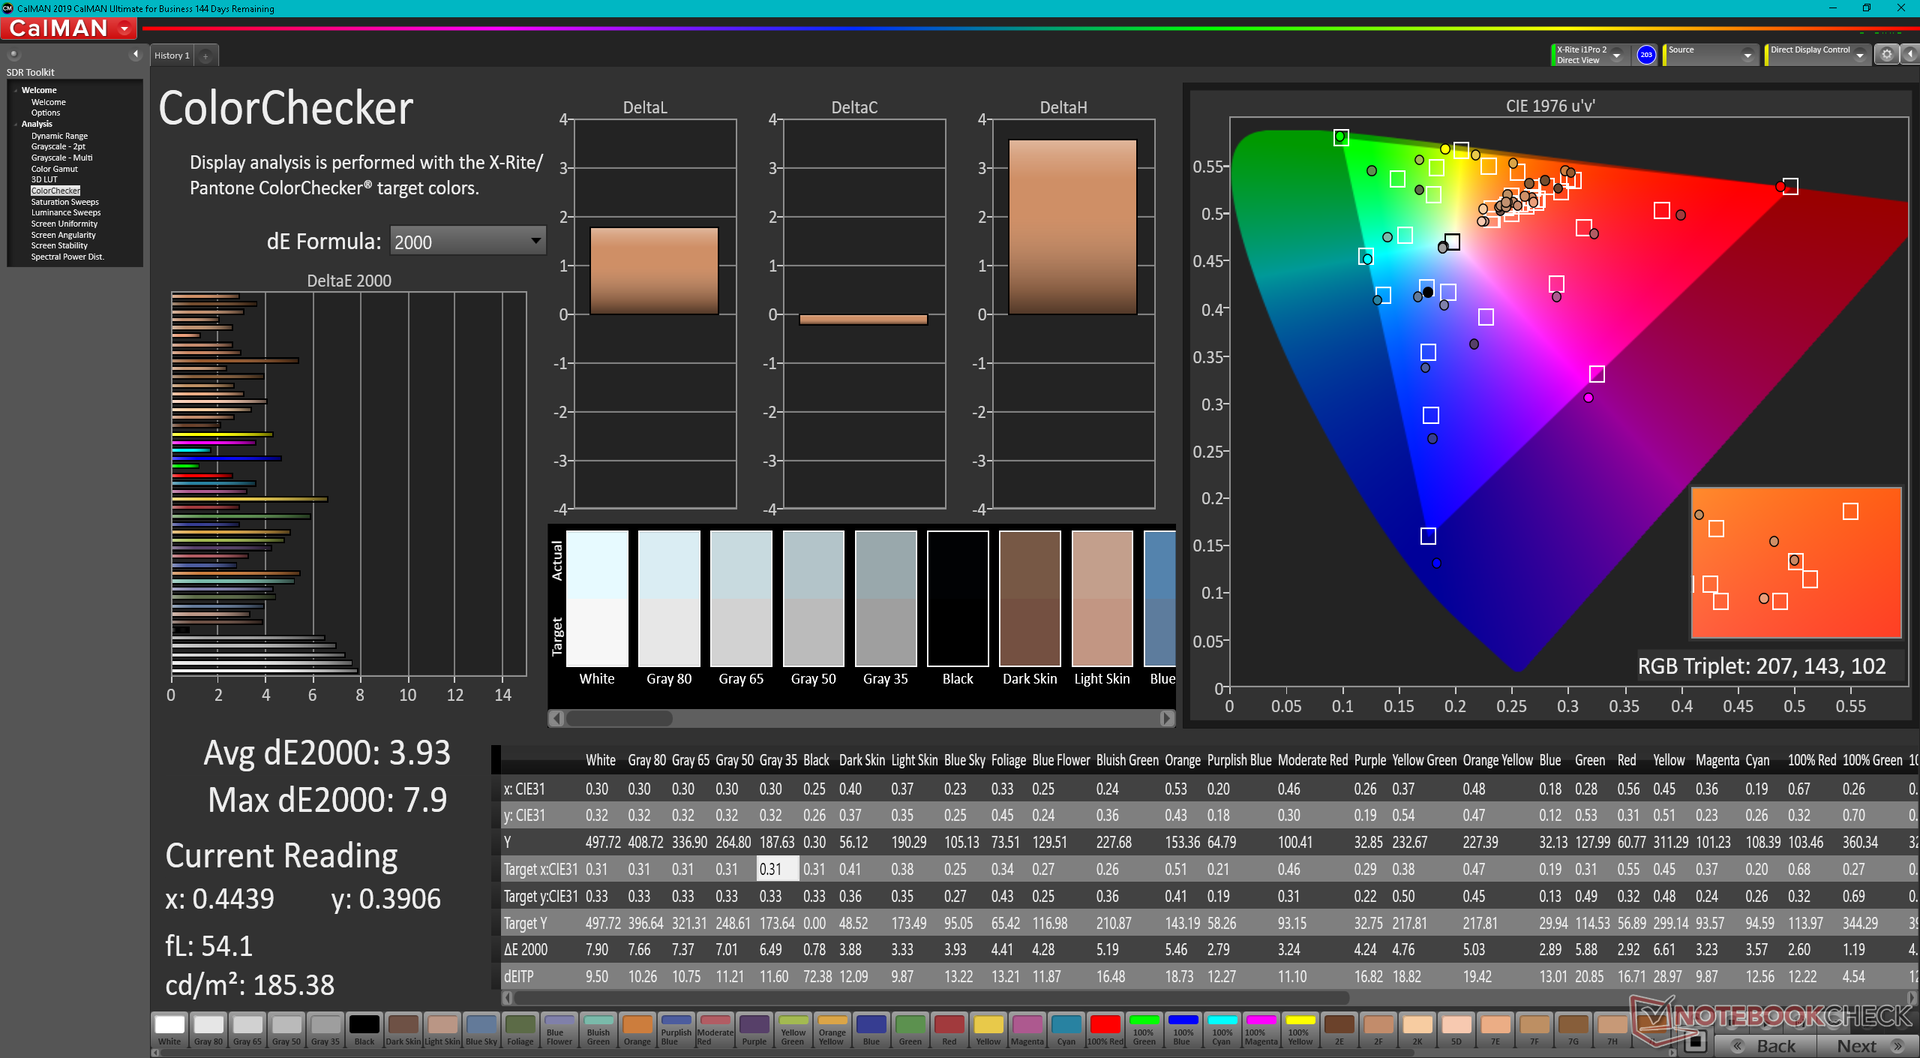
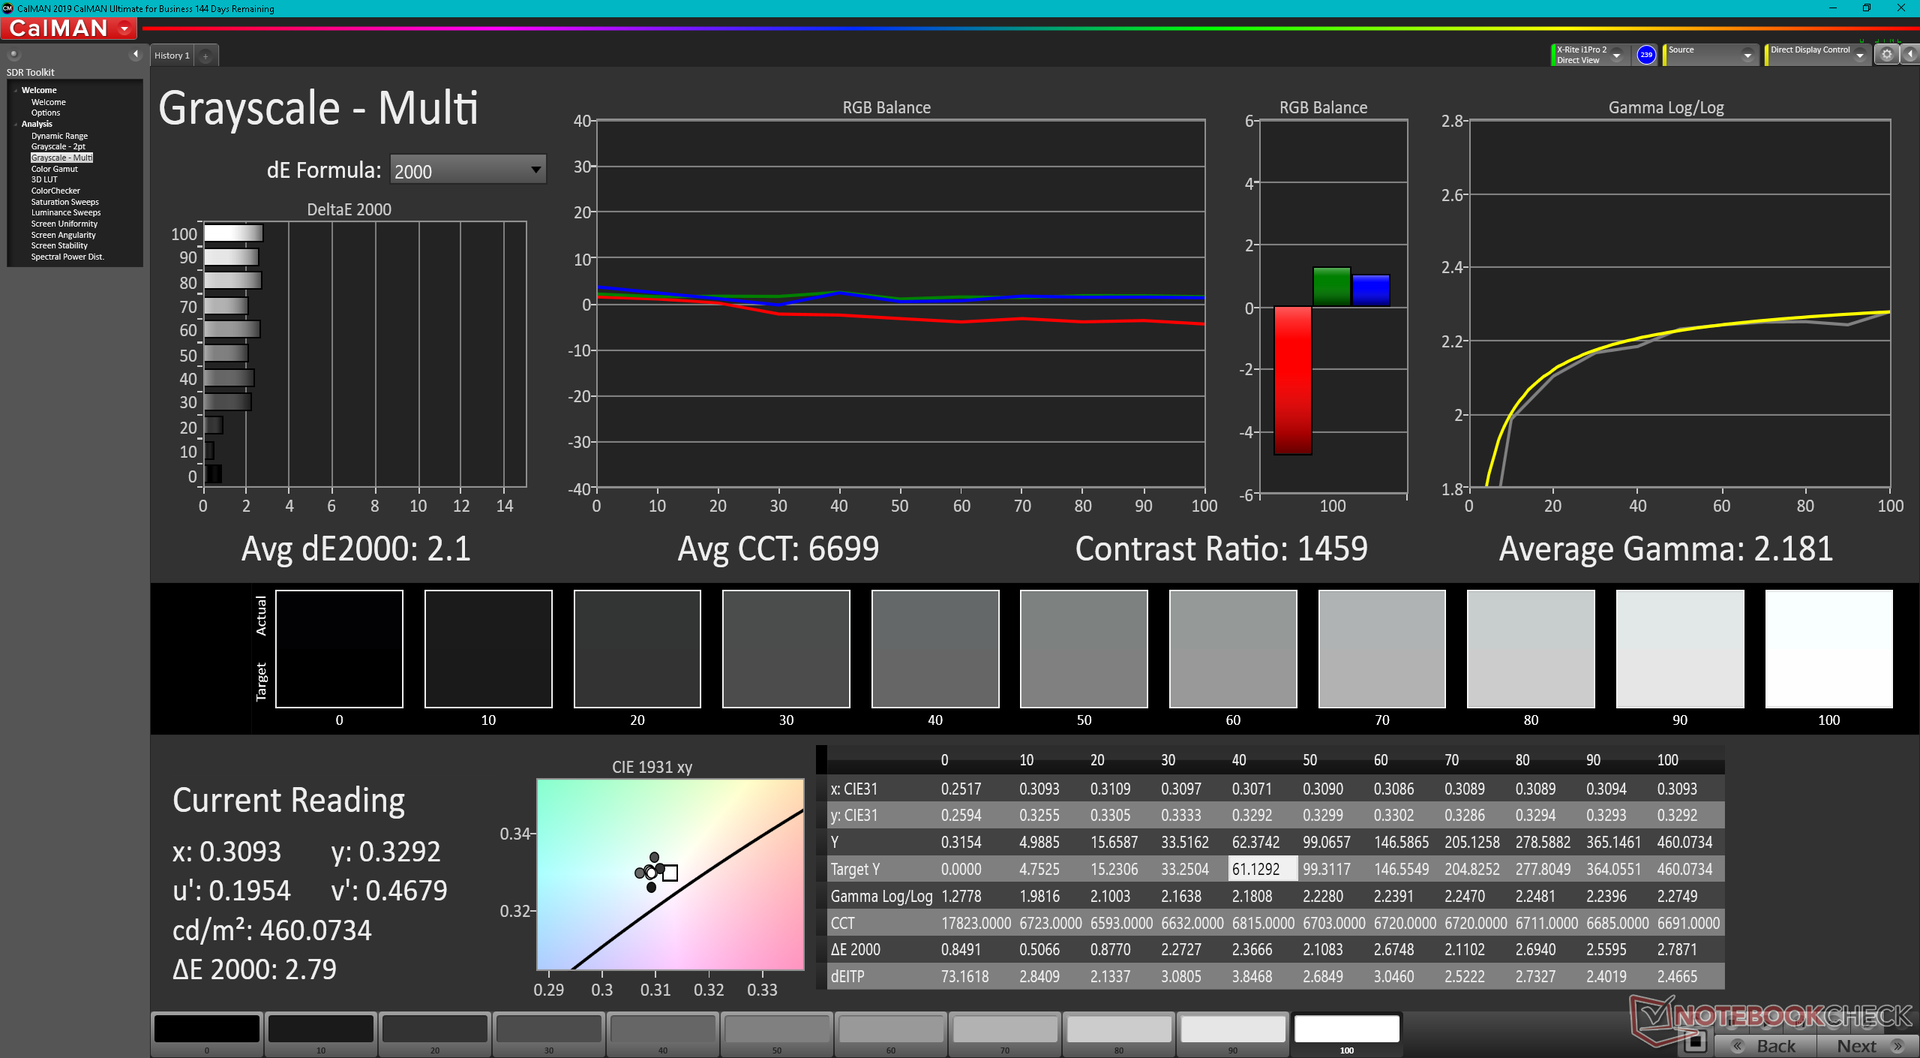
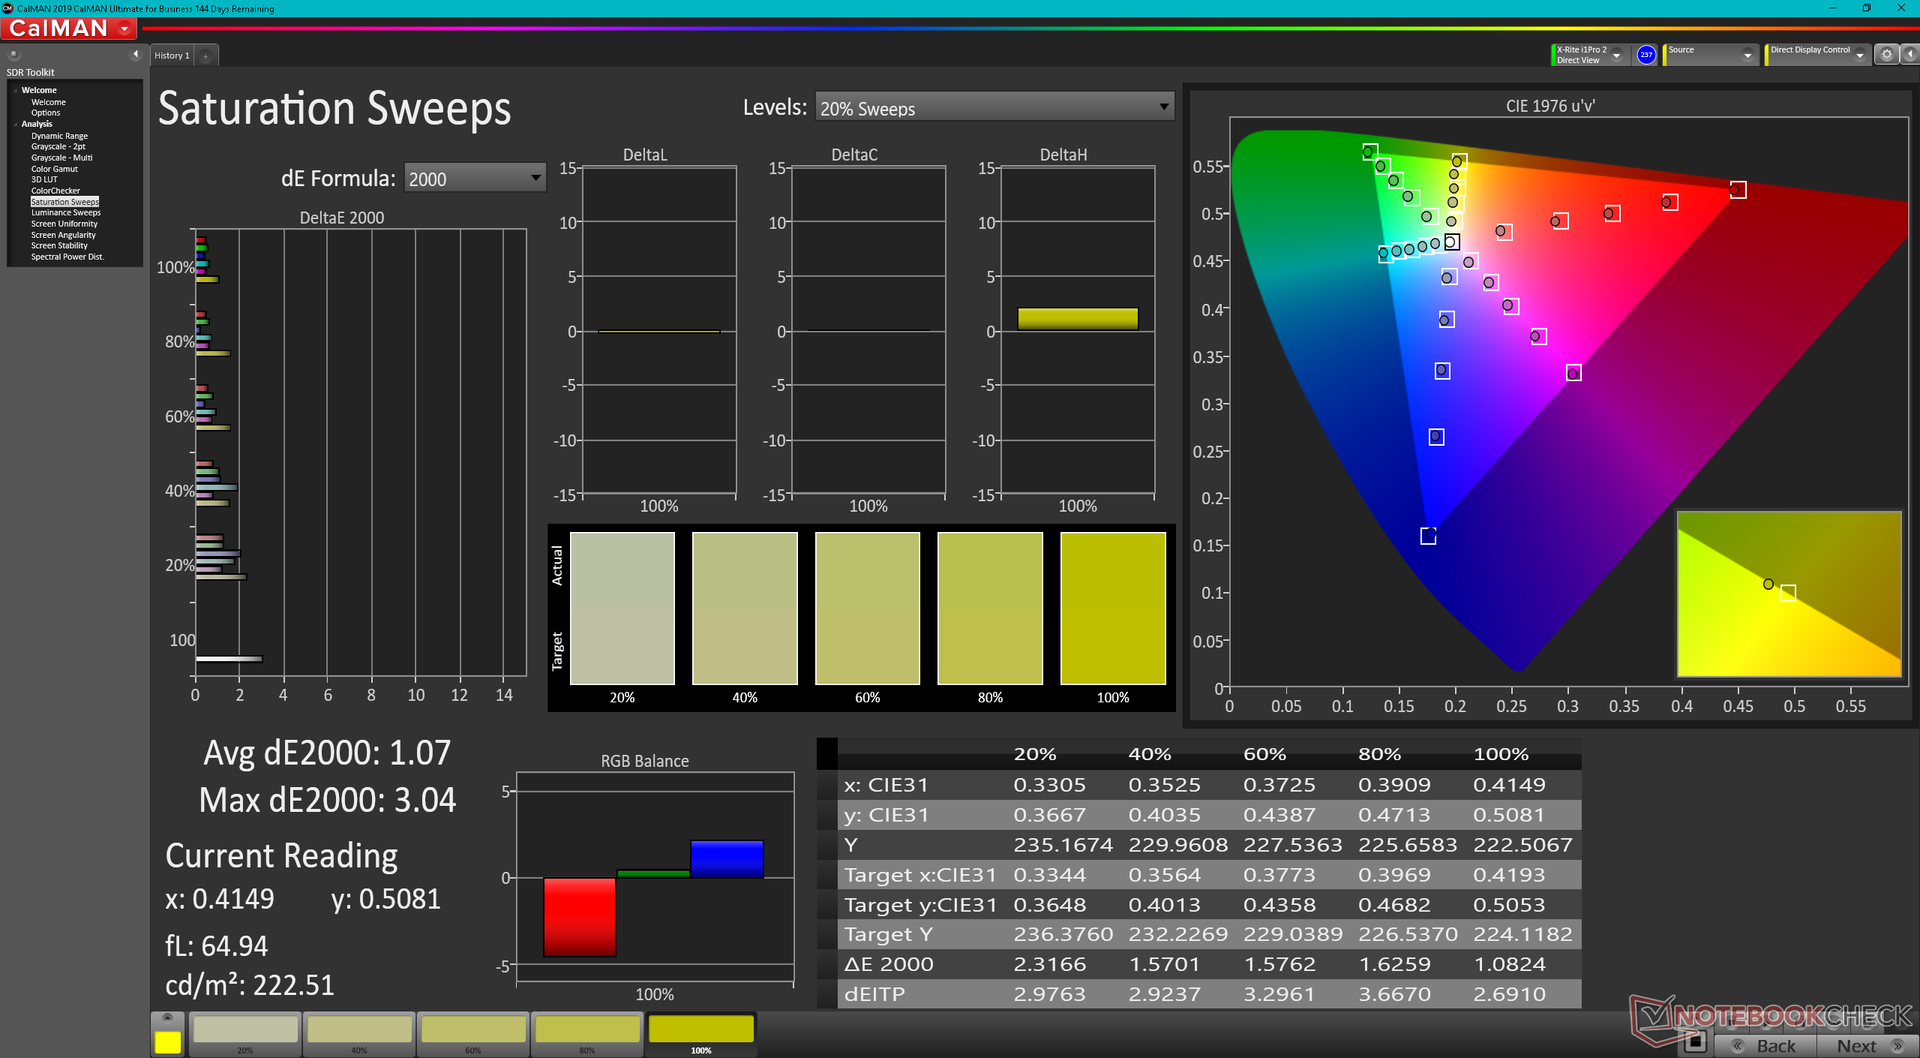
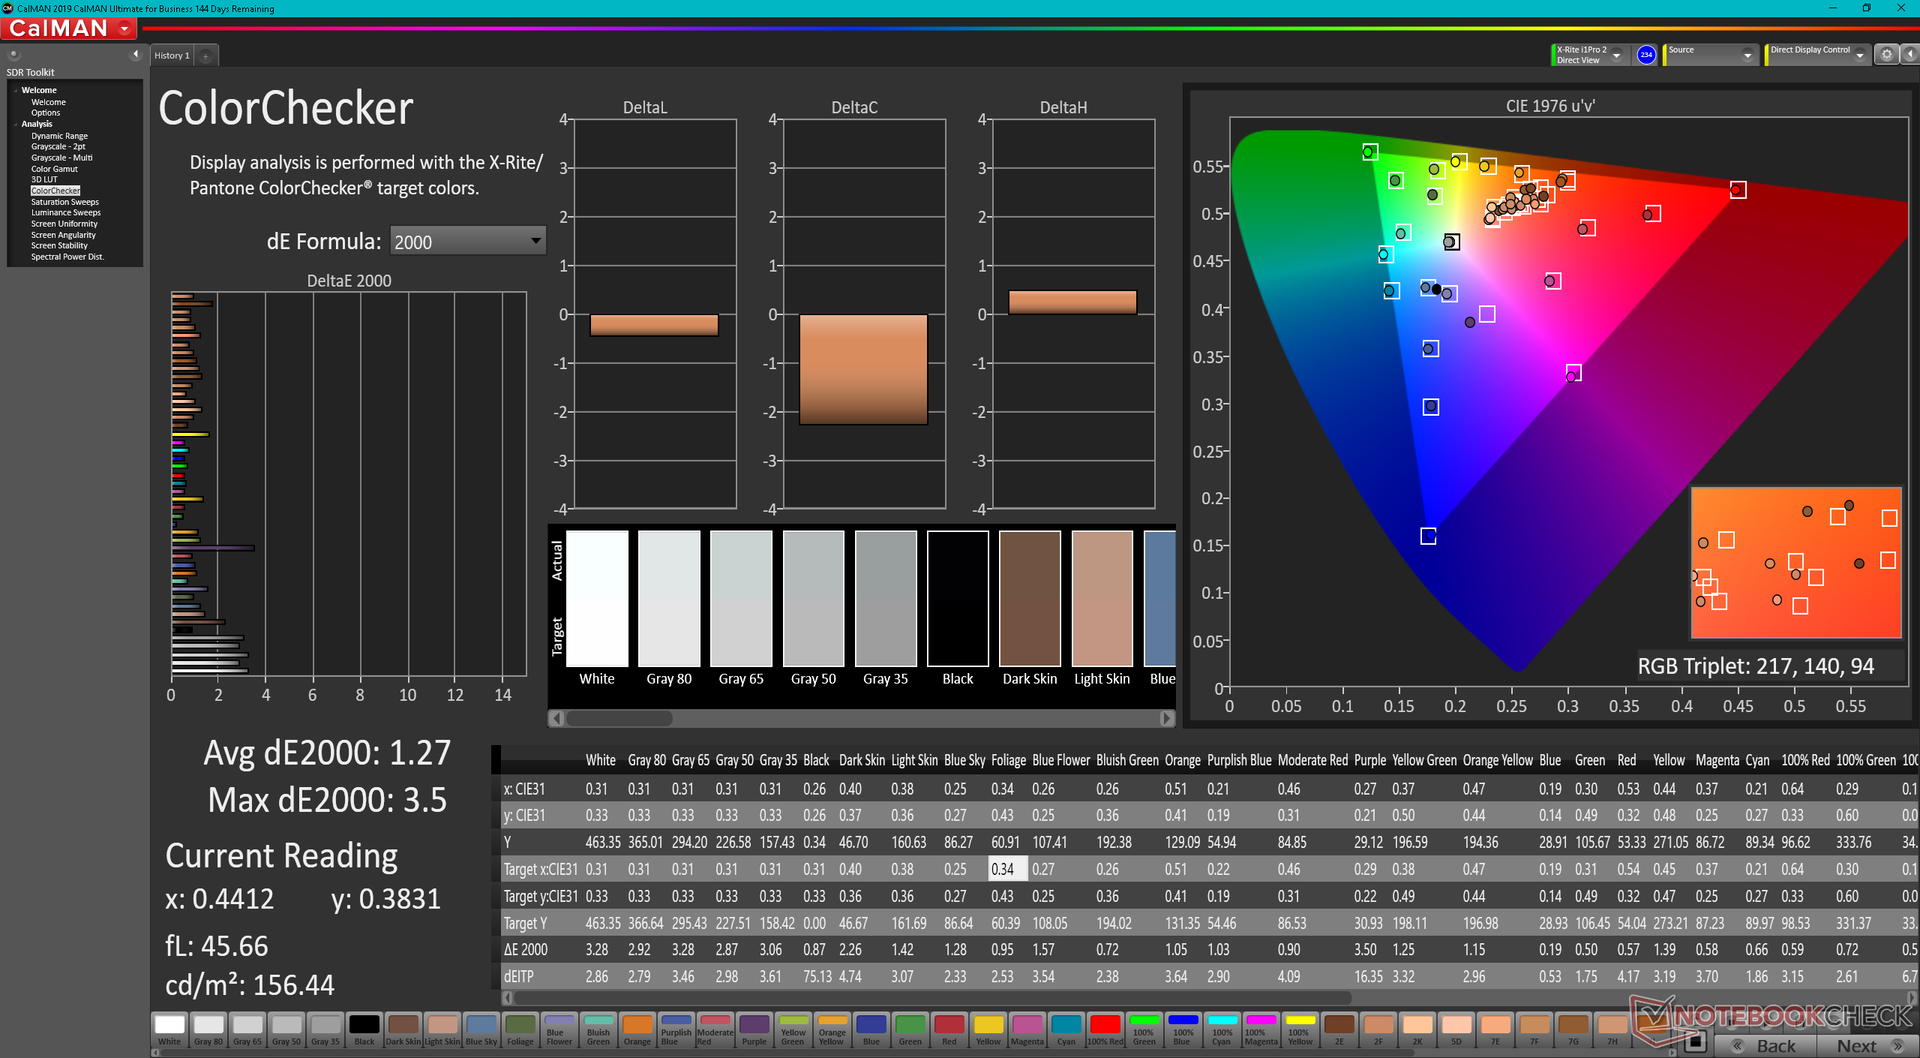
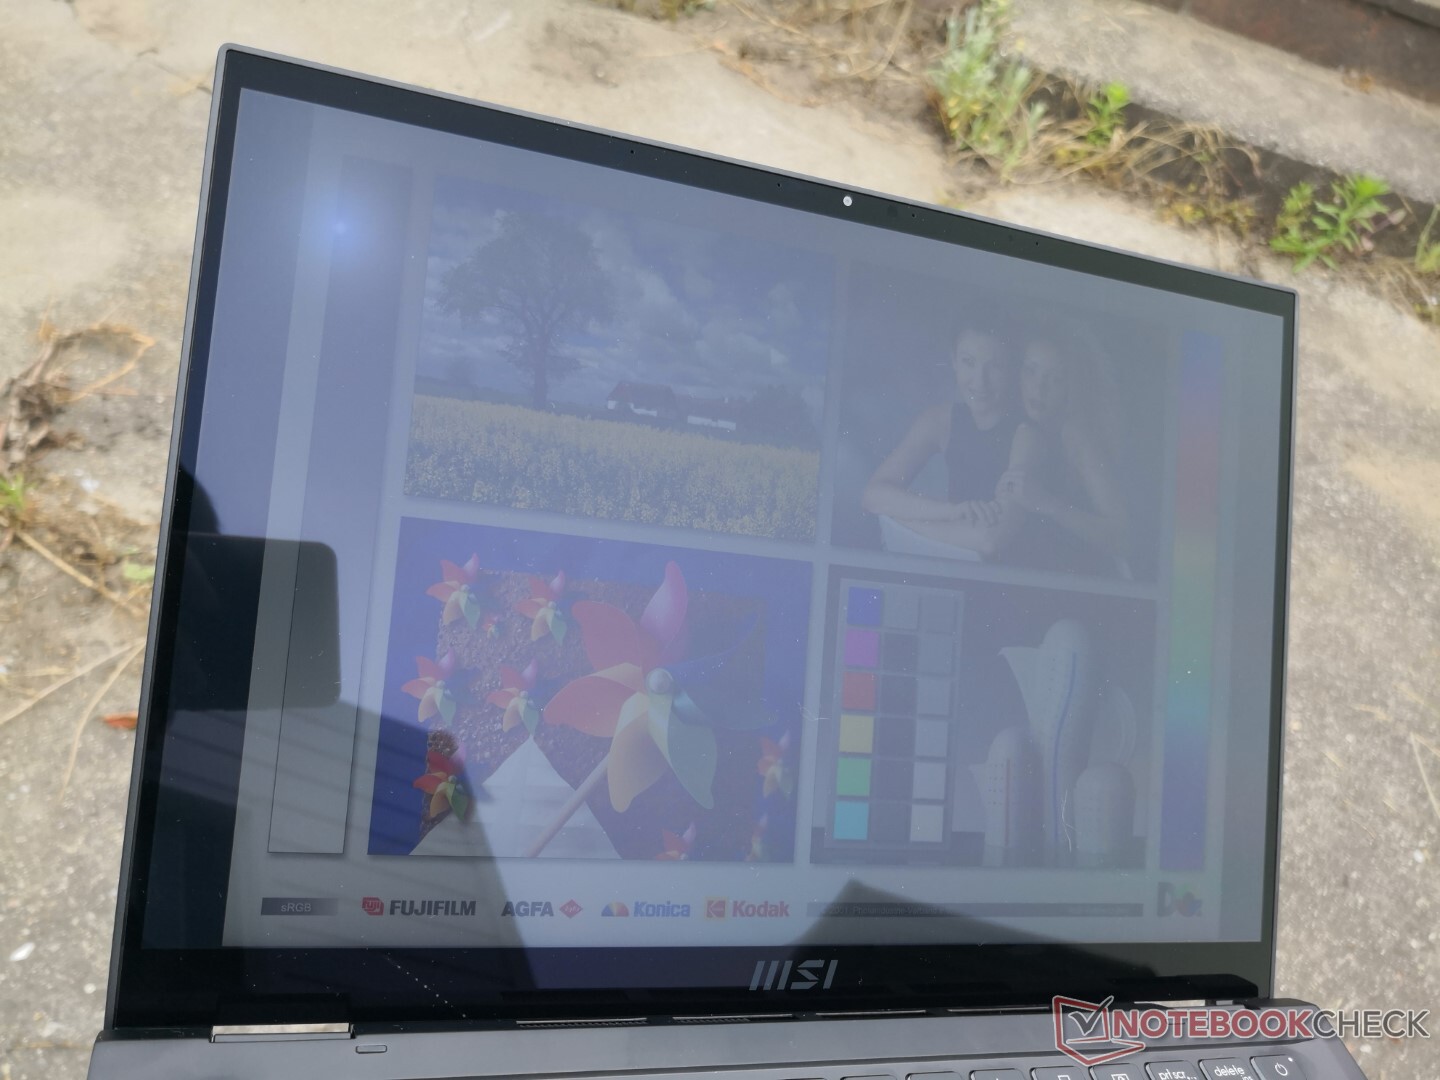
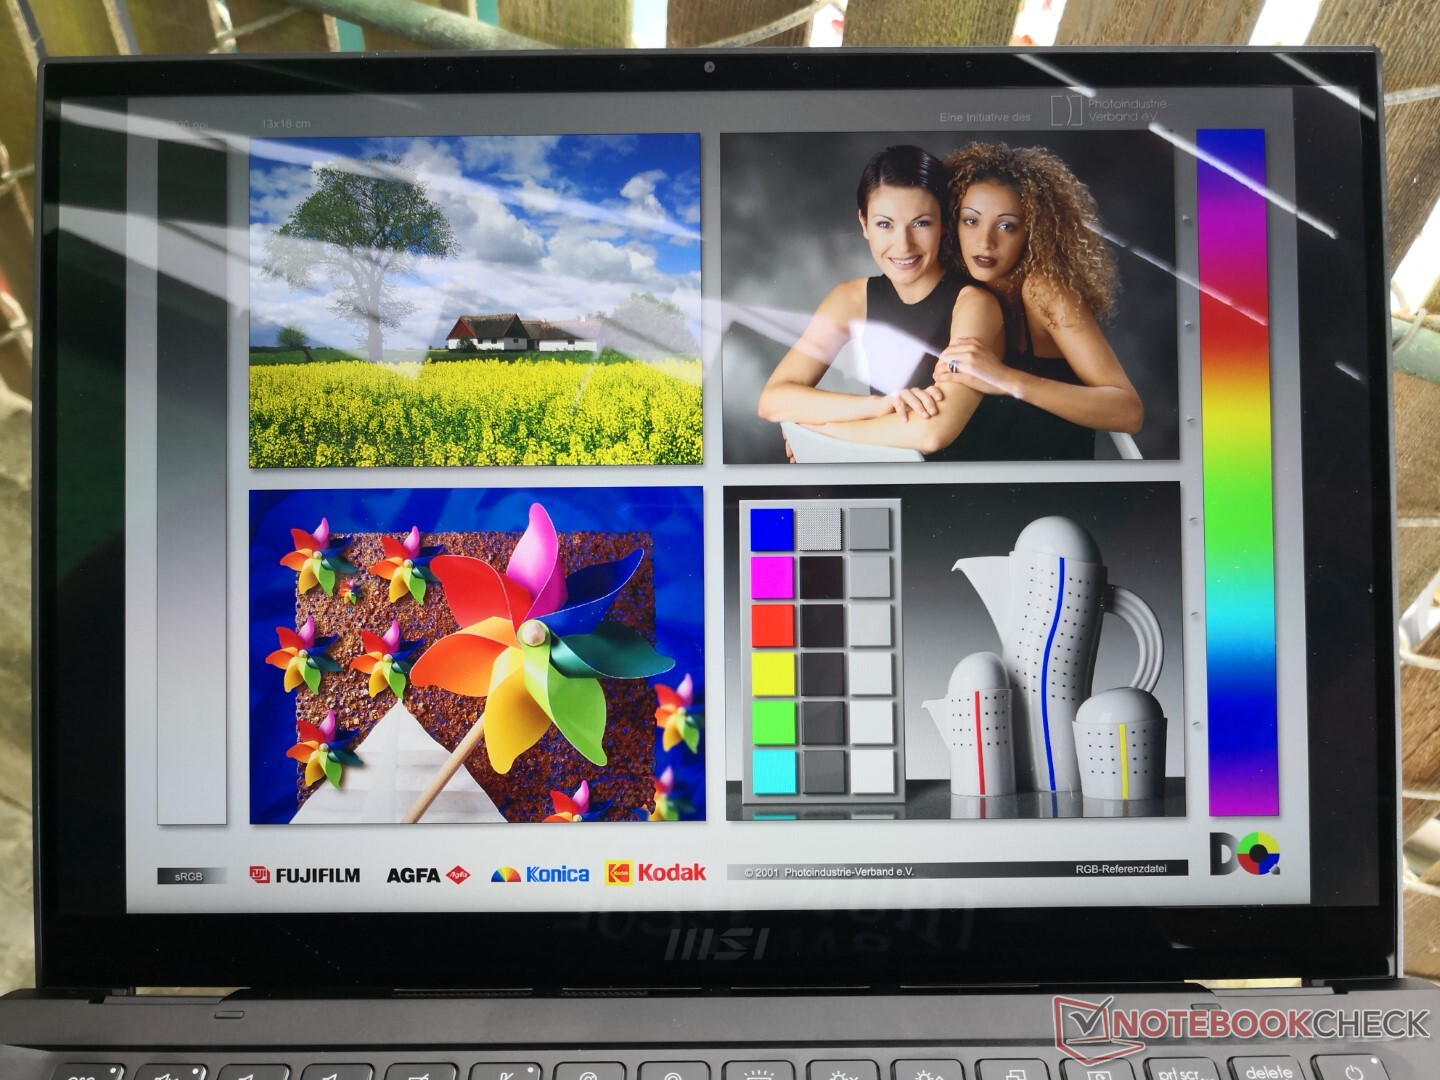
显示屏--颜色很好,但停在60赫兹
该模型提供的原生分辨率与联想YOGA Slim 7i Pro但有更宽的颜色,以支持DCI-P3标准。黑白和灰白的响应时间虽然没有OLED快,但仍比LG Gram 14T90P或Latitude 9420二合一的快,明显减少重影。由于其深邃的色彩、明亮的500尼特背光和合理的响应时间,这款显示器对于游戏和办公任务都非常好。
该显示器的一个关键限制是其原生的60赫兹刷新率,因为其他副笔记本开始提供90赫兹或更高的刷新率。替代产品如 联想IdeaPad Slim 7i Pro或 华硕VivoBook S 14X能以更高的刷新率提供明显更流畅的UI体验。特别是钢笔输入会从比典型的60赫兹更高的显示刷新率中受益。
| |||||||||||||||||||||||||
Brightness Distribution: 87 %
Center on Battery: 496.7 cd/m²
Contrast: 1656:1 (Black: 0.3 cd/m²)
ΔE ColorChecker Calman: 3.93 | ∀{0.5-29.43 Ø4.72}
calibrated: 1.27
ΔE Greyscale Calman: 5.9 | ∀{0.09-98 Ø4.97}
85.9% AdobeRGB 1998 (Argyll 3D)
99.9% sRGB (Argyll 3D)
97.8% Display P3 (Argyll 3D)
Gamma: 2.04
CCT: 7618 K
| MSI Summit E14 Flip Evo A12MT AU Optronics B140QAN04.R, IPS, 2880x1800, 14" | MSI Summit E14 A11SCS AU Optronics AUO123B, IPS, 3840x2160, 14" | Asus VivoBook S 14X S5402Z Samsung ATNA45AF01-0, OLED, 2880x1800, 14.5" | LG Gram 14T90P LG Philips LP140WU1-SPA1, IPS, 1900x1200, 14" | Lenovo Yoga Slim 7i Pro 14IAP G7 LEN140WQ+, IPS, 2880x1800, 14" | Dell Latitude 9420 2-in-1 AU Optronics B140QAN, IPS, 2560x1600, 14" | |
|---|---|---|---|---|---|---|
| Display | 2% | 4% | 1% | -10% | -8% | |
| Display P3 Coverage (%) | 97.8 | 87.5 -11% | 99.9 2% | 98.8 1% | 77.7 -21% | 80.7 -17% |
| sRGB Coverage (%) | 99.9 | 100 0% | 100 0% | 100 0% | 100 0% | 100 0% |
| AdobeRGB 1998 Coverage (%) | 85.9 | 99.4 16% | 95.5 11% | 78.4 -9% | 79.7 -7% | |
| Response Times | -154% | 95% | -128% | -61% | -167% | |
| Response Time Grey 50% / Grey 80% * (ms) | 16.9 ? | 52 ? -208% | 0.73 ? 96% | 44 ? -160% | 35.2 ? -108% | 54 ? -220% |
| Response Time Black / White * (ms) | 15.4 ? | 30.8 ? -100% | 1 ? 94% | 30 ? -95% | 17.6 ? -14% | 32.8 ? -113% |
| PWM Frequency (Hz) | 240.4 ? | |||||
| Screen | -29% | 18% | 1% | 7% | -0% | |
| Brightness middle (cd/m²) | 496.7 | 593.3 19% | 373 -25% | 305.5 -38% | 469 -6% | 483.6 -3% |
| Brightness (cd/m²) | 468 | 571 22% | 375 -20% | 289 -38% | 445 -5% | 465 -1% |
| Brightness Distribution (%) | 87 | 87 0% | 99 14% | 87 0% | 90 3% | 92 6% |
| Black Level * (cd/m²) | 0.3 | 0.53 -77% | 0.27 10% | 0.32 -7% | ||
| Contrast (:1) | 1656 | 1119 -32% | 1131 -32% | 1511 -9% | ||
| Colorchecker dE 2000 * | 3.93 | 4.42 -12% | 2.26 42% | 3.31 16% | 3.5 11% | 3.69 6% |
| Colorchecker dE 2000 max. * | 7.9 | 7.16 9% | 6.22 21% | 6.12 23% | 5.3 33% | 5.97 24% |
| Colorchecker dE 2000 calibrated * | 1.27 | 4.3 -239% | 1.7 -34% | 2.05 -61% | ||
| Greyscale dE 2000 * | 5.9 | 3.2 46% | 1.4 76% | 1.9 68% | 3.3 44% | 3.5 41% |
| Gamma | 2.04 108% | 2.04 108% | 2.22 99% | 2.04 108% | 1.97 112% | 2.04 108% |
| CCT | 7618 85% | 6737 96% | 6417 101% | 6706 97% | 6512 100% | 6158 106% |
| Total Average (Program / Settings) | -60% /
-41% | 39% /
28% | -42% /
-20% | -21% /
-9% | -58% /
-26% |
* ... smaller is better
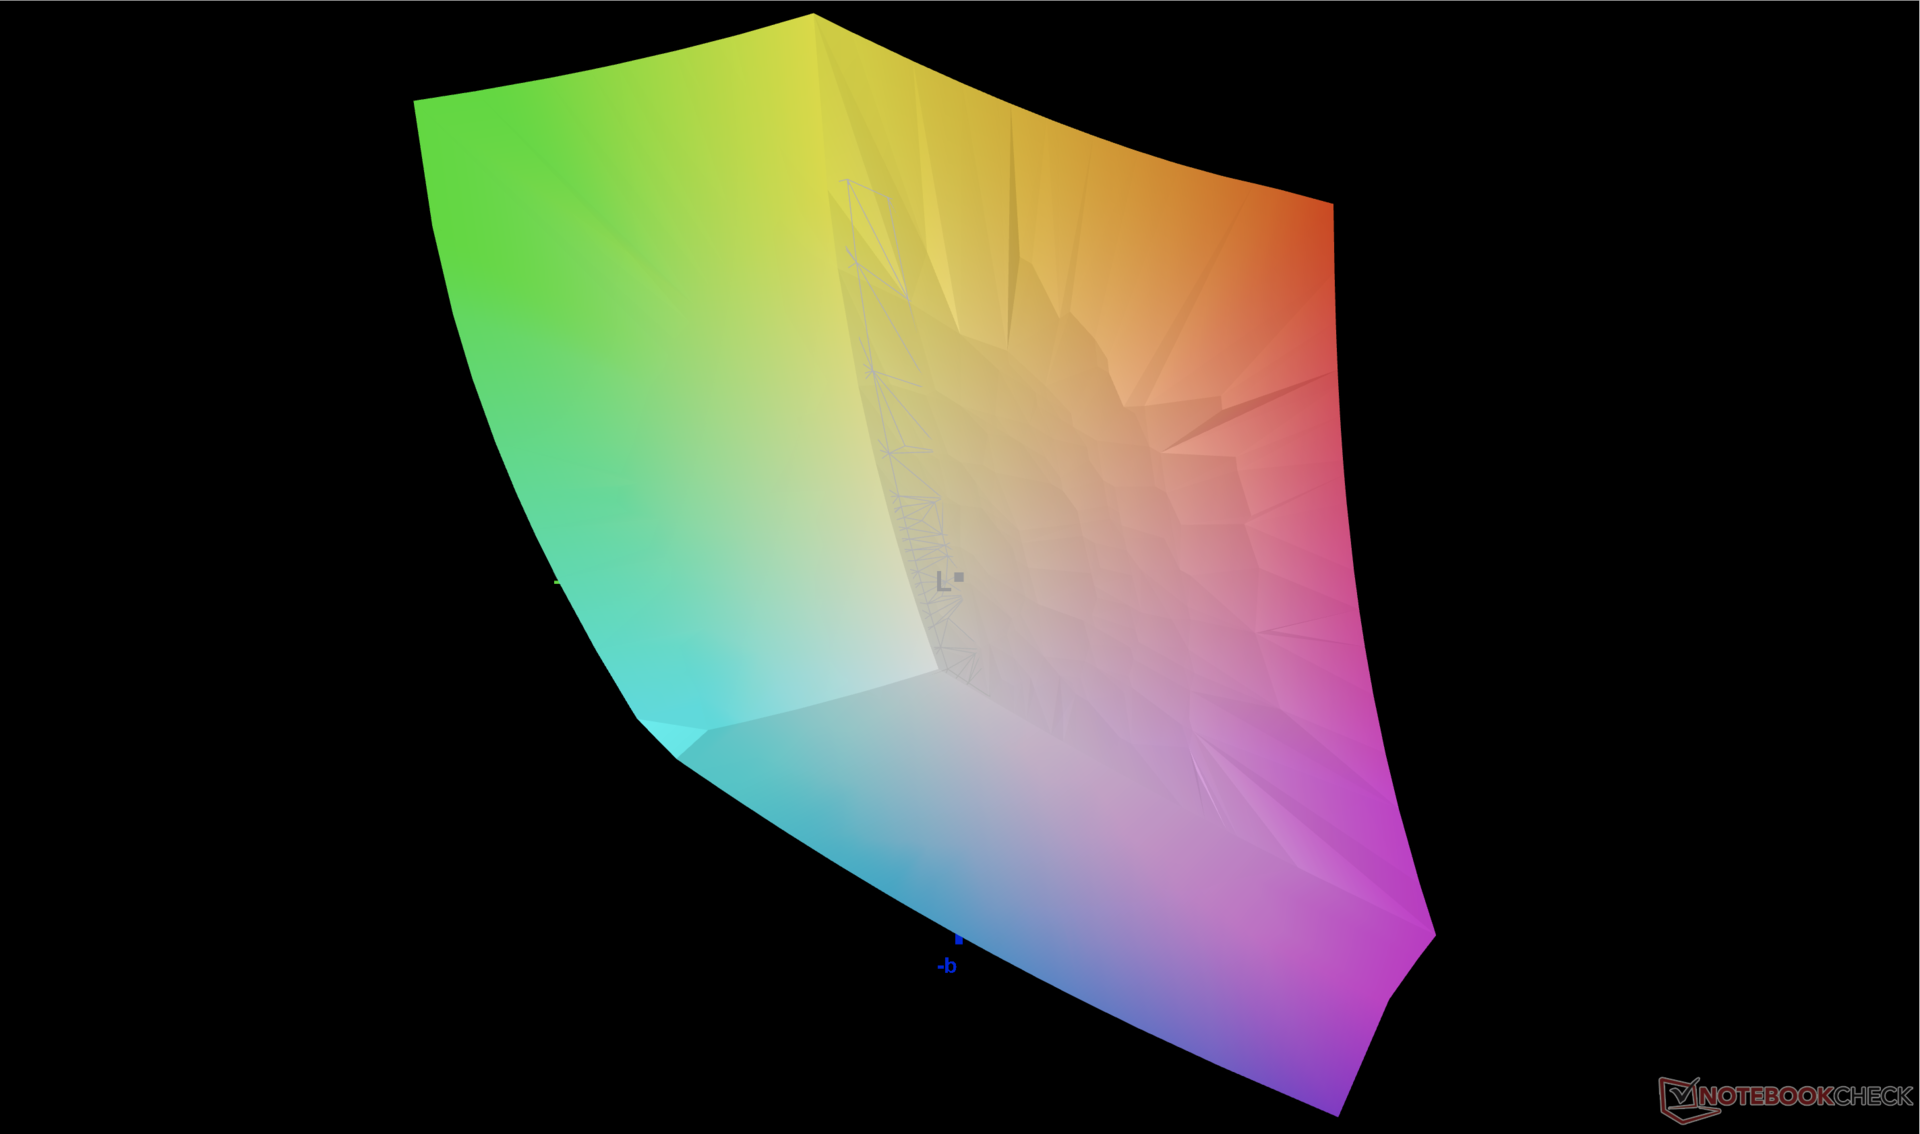
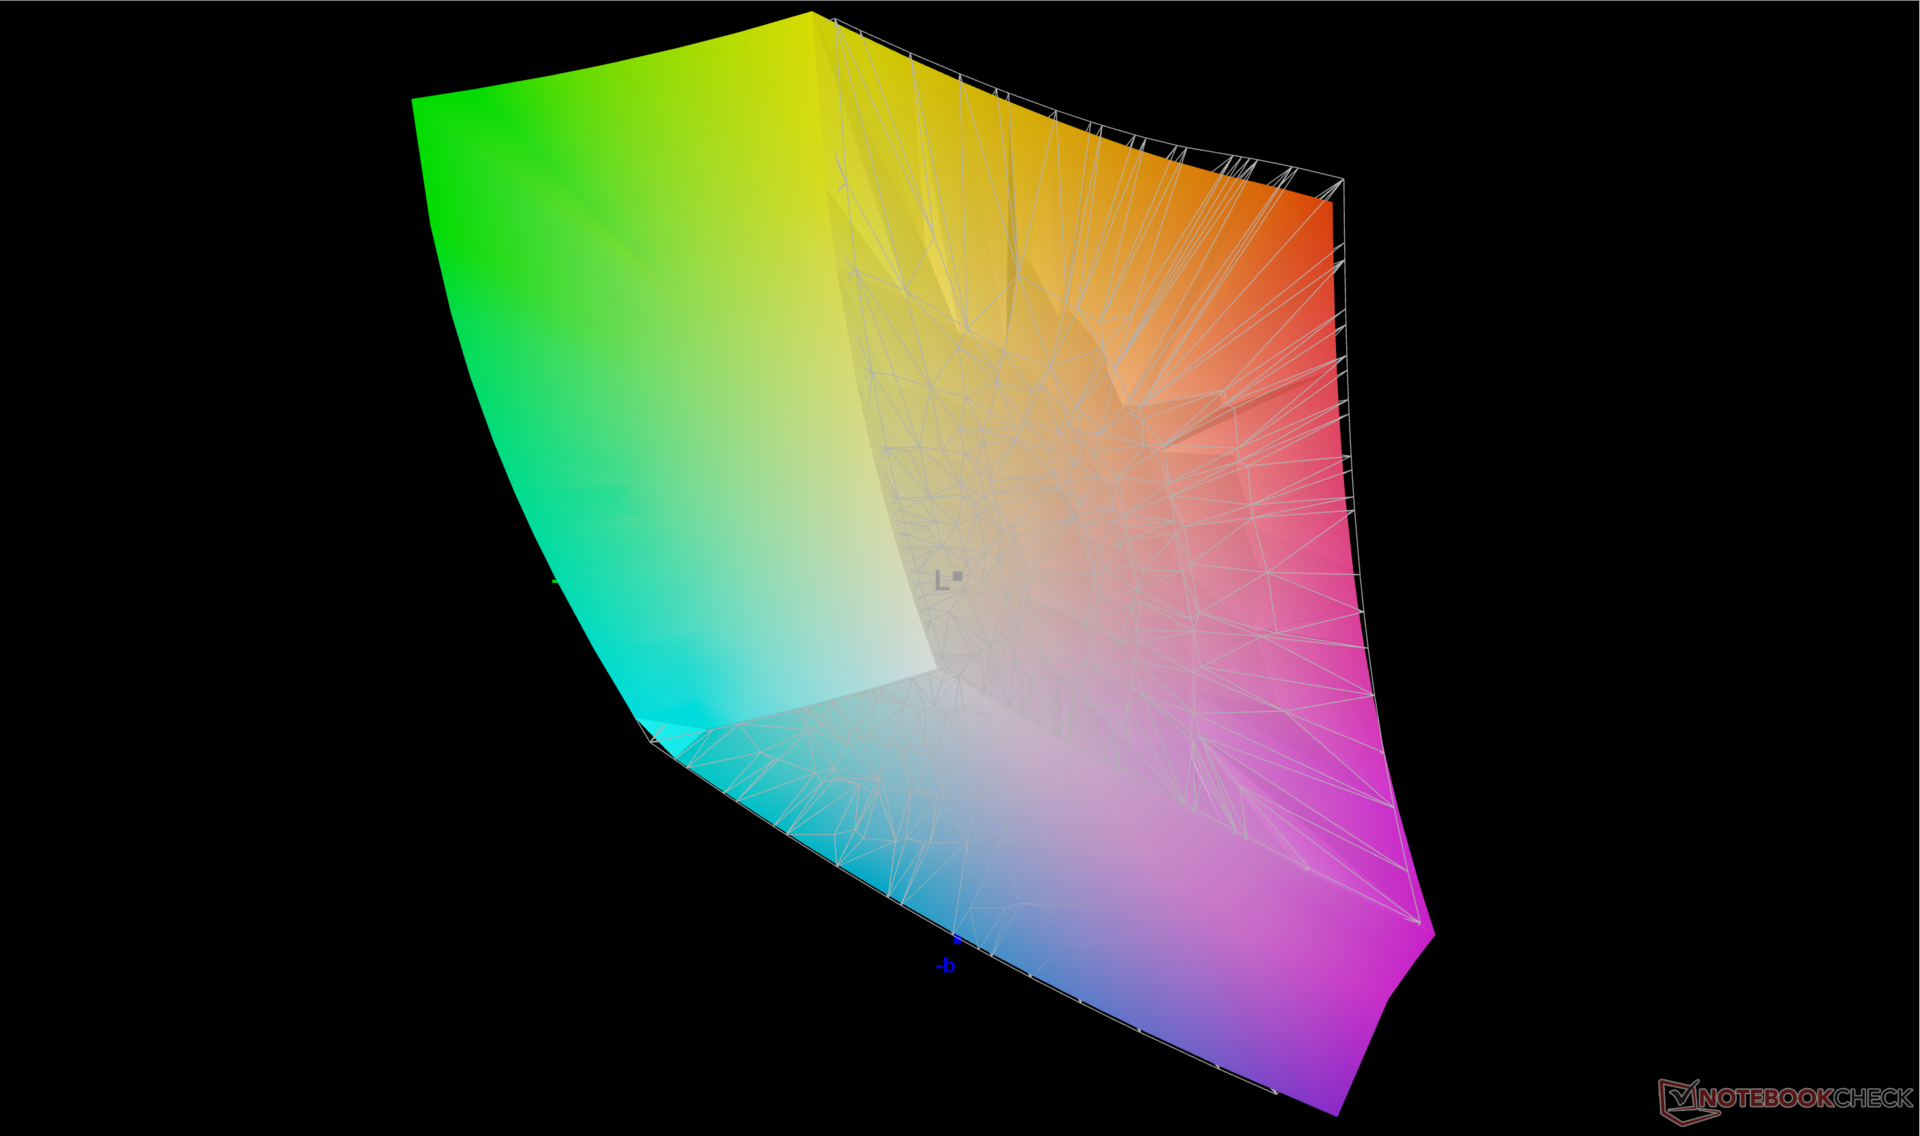
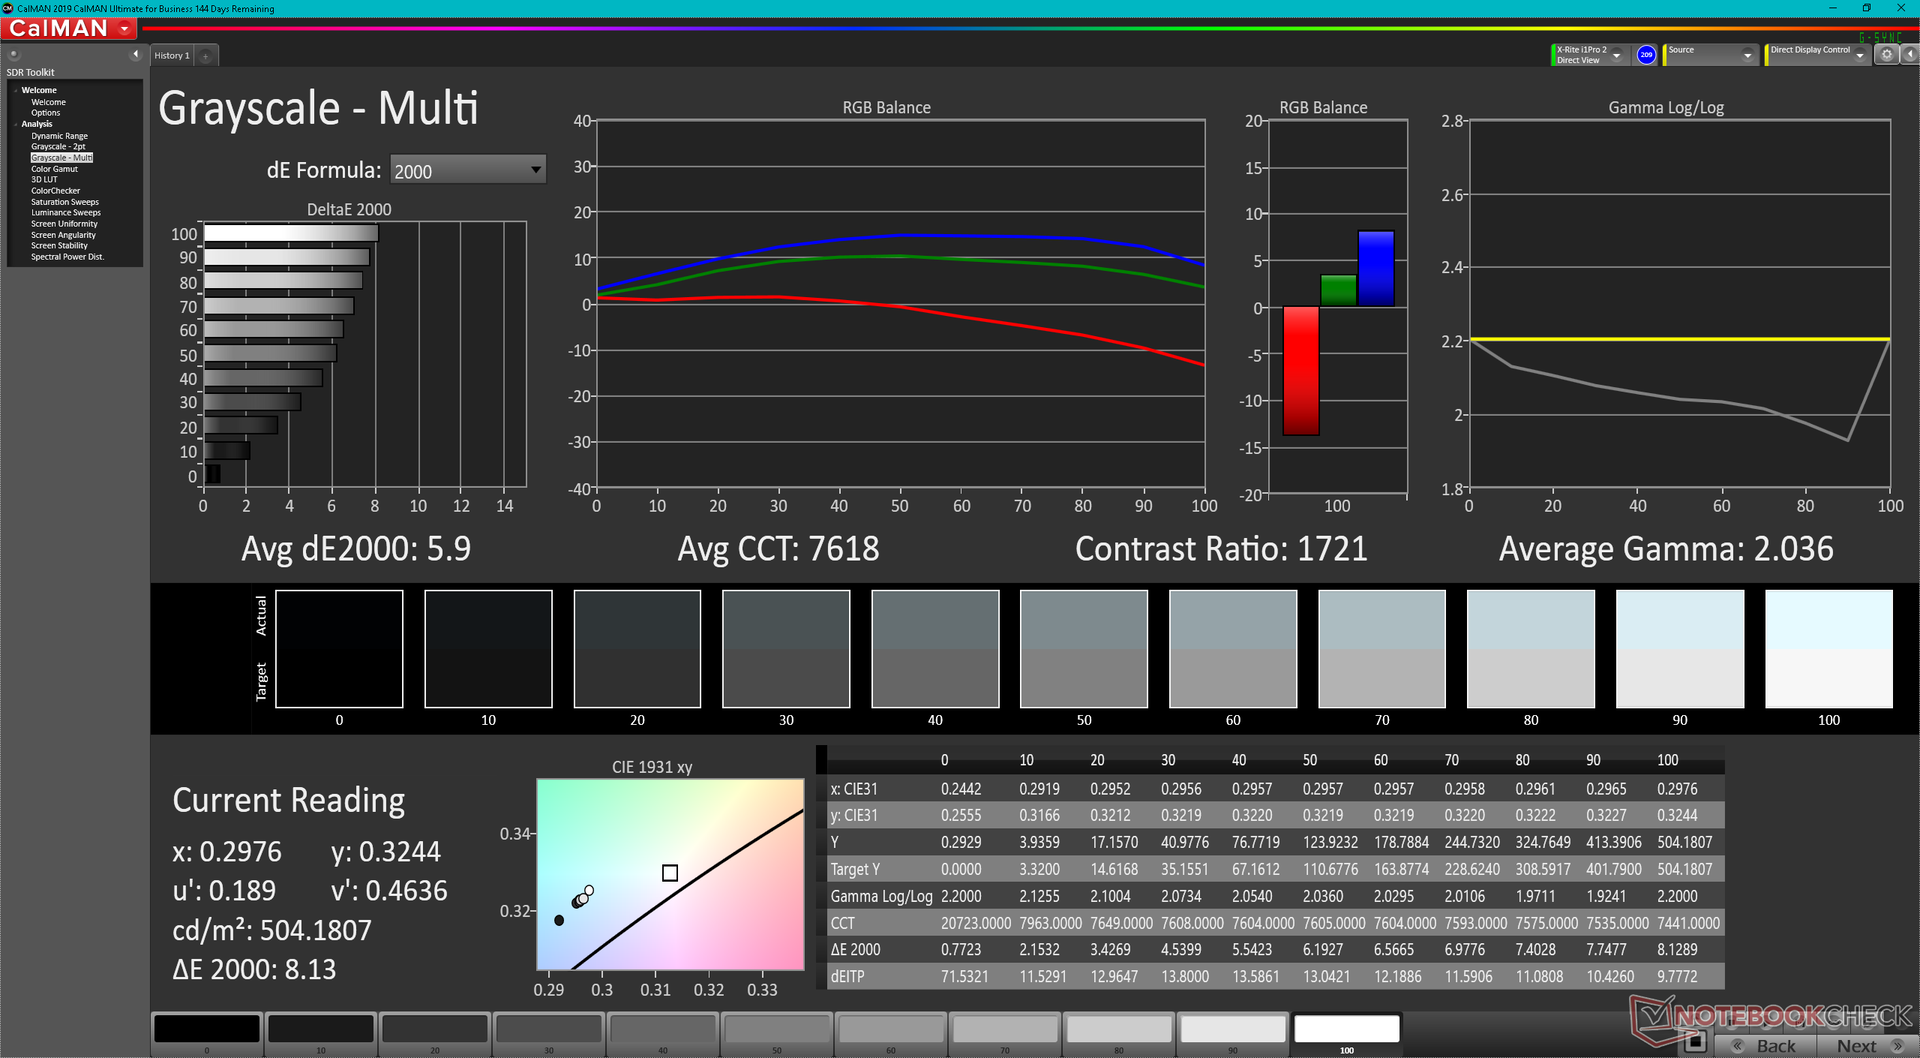
尽管面板提供了完整的DCI-P3覆盖范围,但我们的Summit上的显示屏并没有像许多MSI Creator型号那样在工厂进行校准。因此,平均灰度和彩色DeltaE值是平庸的,分别为5.9和3.93,与P3标准相比。特别是色温比我们希望的7618更冷。用户将需要校准他们的显示器,以更好地利用其色彩范围。
Display Response Times
| ↔ Response Time Black to White | ||
|---|---|---|
| 15.4 ms ... rise ↗ and fall ↘ combined | ↗ 7.3 ms rise | 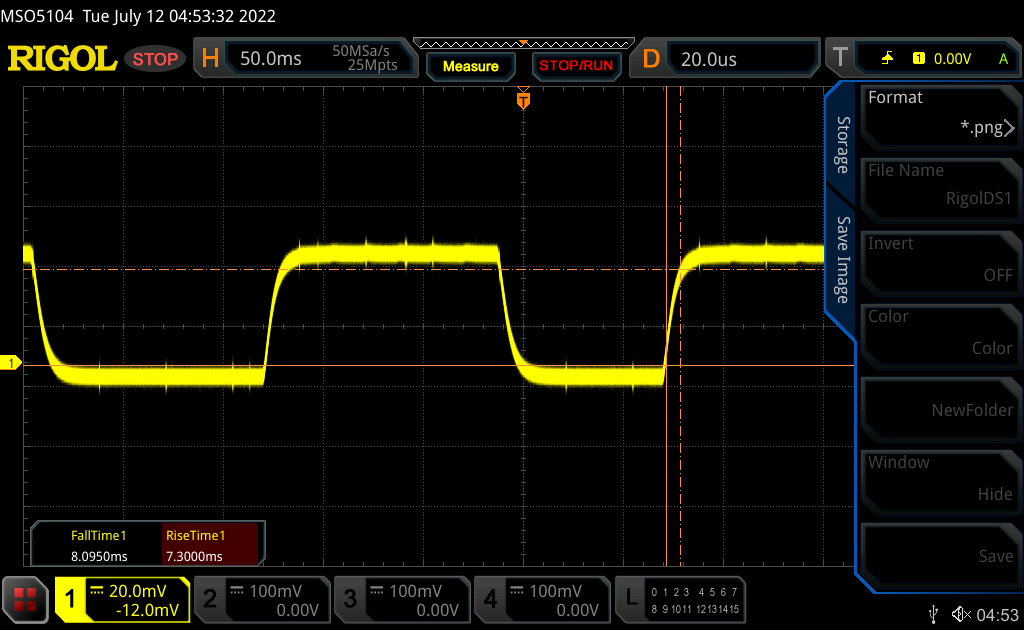 |
| ↘ 8.1 ms fall | ||
| The screen shows good response rates in our tests, but may be too slow for competitive gamers. In comparison, all tested devices range from 0.1 (minimum) to 240 (maximum) ms. » 37 % of all devices are better. This means that the measured response time is better than the average of all tested devices (19.8 ms). | ||
| ↔ Response Time 50% Grey to 80% Grey | ||
| 16.9 ms ... rise ↗ and fall ↘ combined | ↗ 7.3 ms rise | 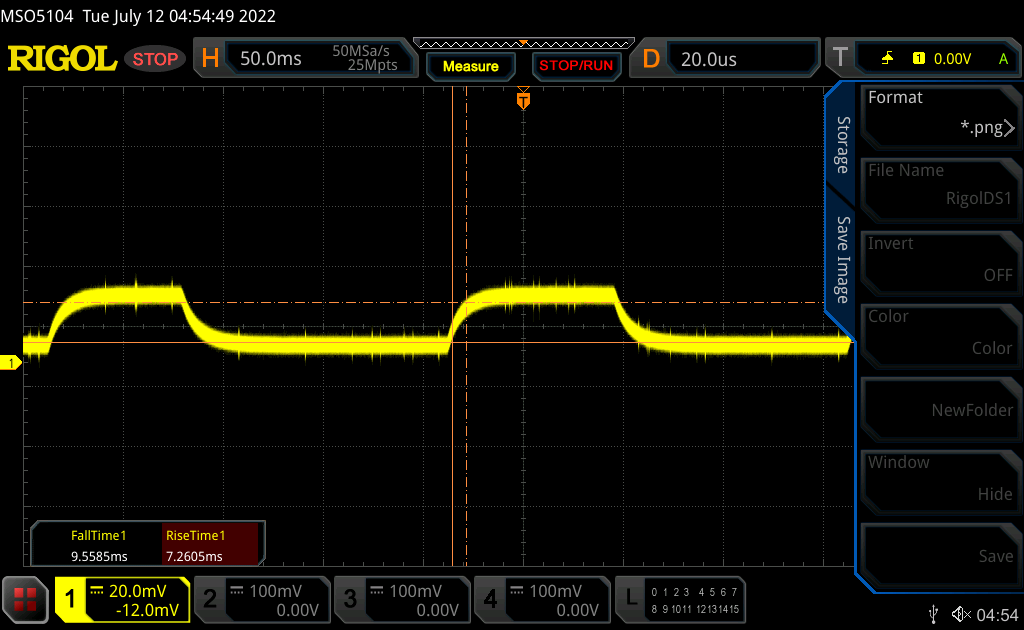 |
| ↘ 9.6 ms fall | ||
| The screen shows good response rates in our tests, but may be too slow for competitive gamers. In comparison, all tested devices range from 0.165 (minimum) to 636 (maximum) ms. » 31 % of all devices are better. This means that the measured response time is better than the average of all tested devices (31 ms). | ||
Screen Flickering / PWM (Pulse-Width Modulation)
| Screen flickering / PWM not detected | 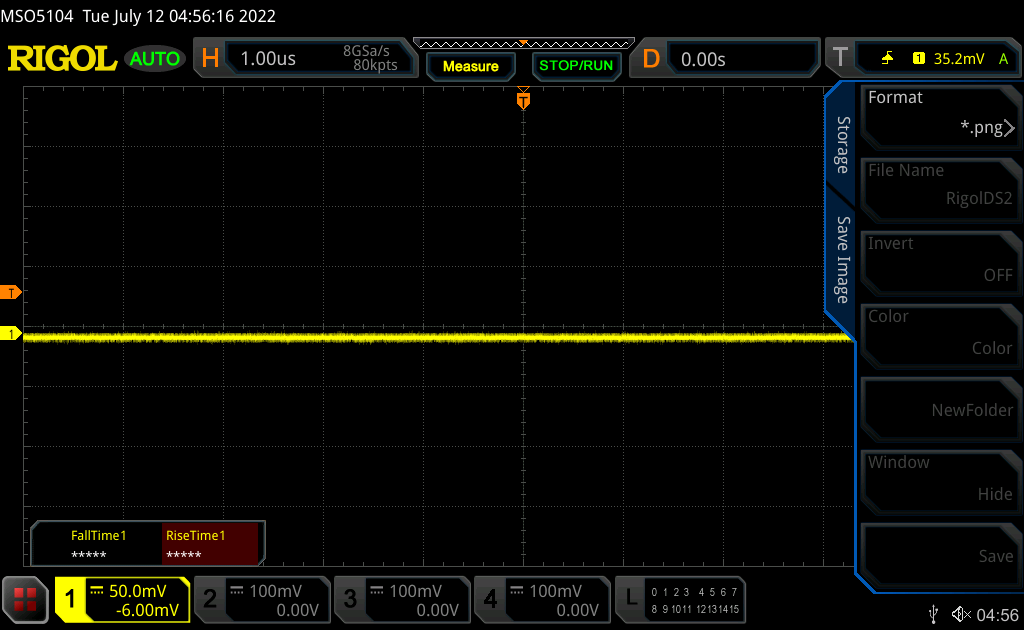 | ||
In comparison: 52 % of all tested devices do not use PWM to dim the display. If PWM was detected, an average of 7753 (minimum: 5 - maximum: 343500) Hz was measured. | |||
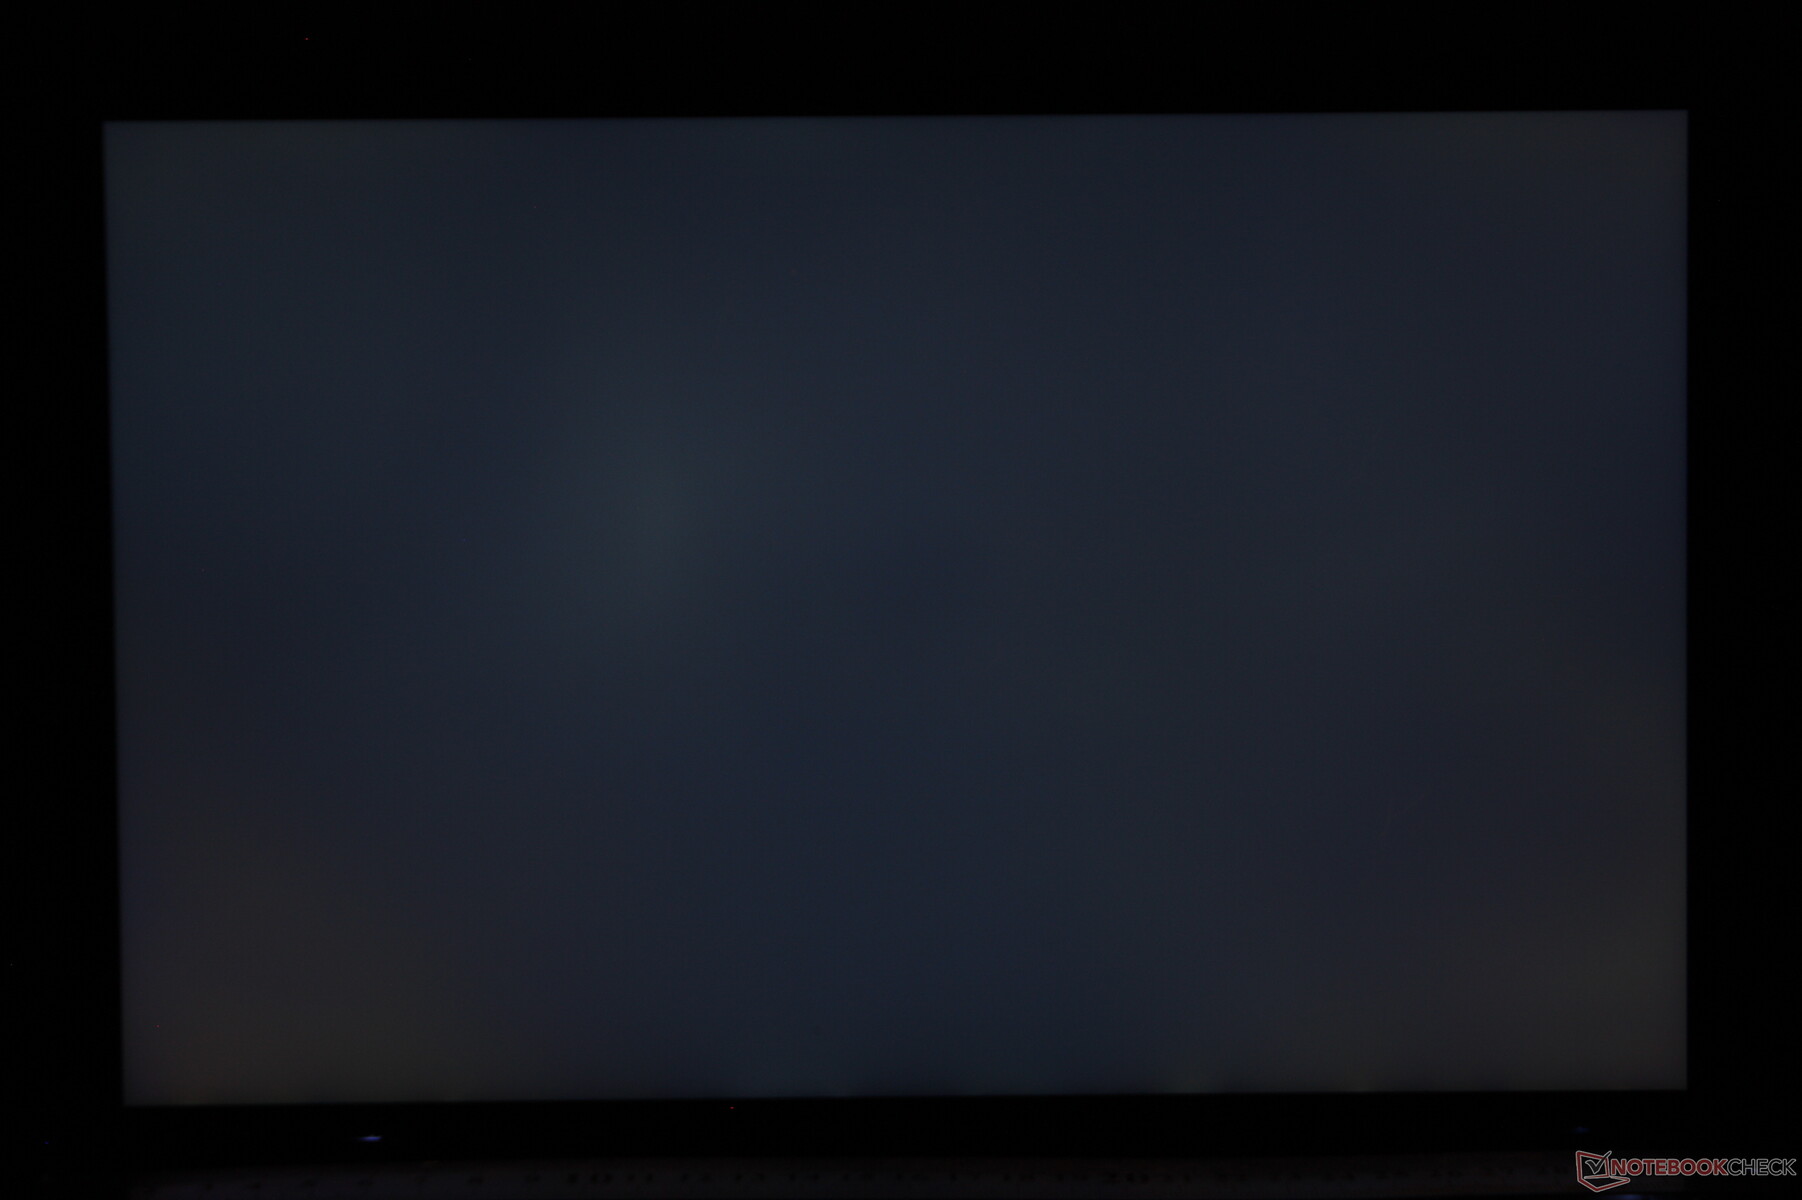
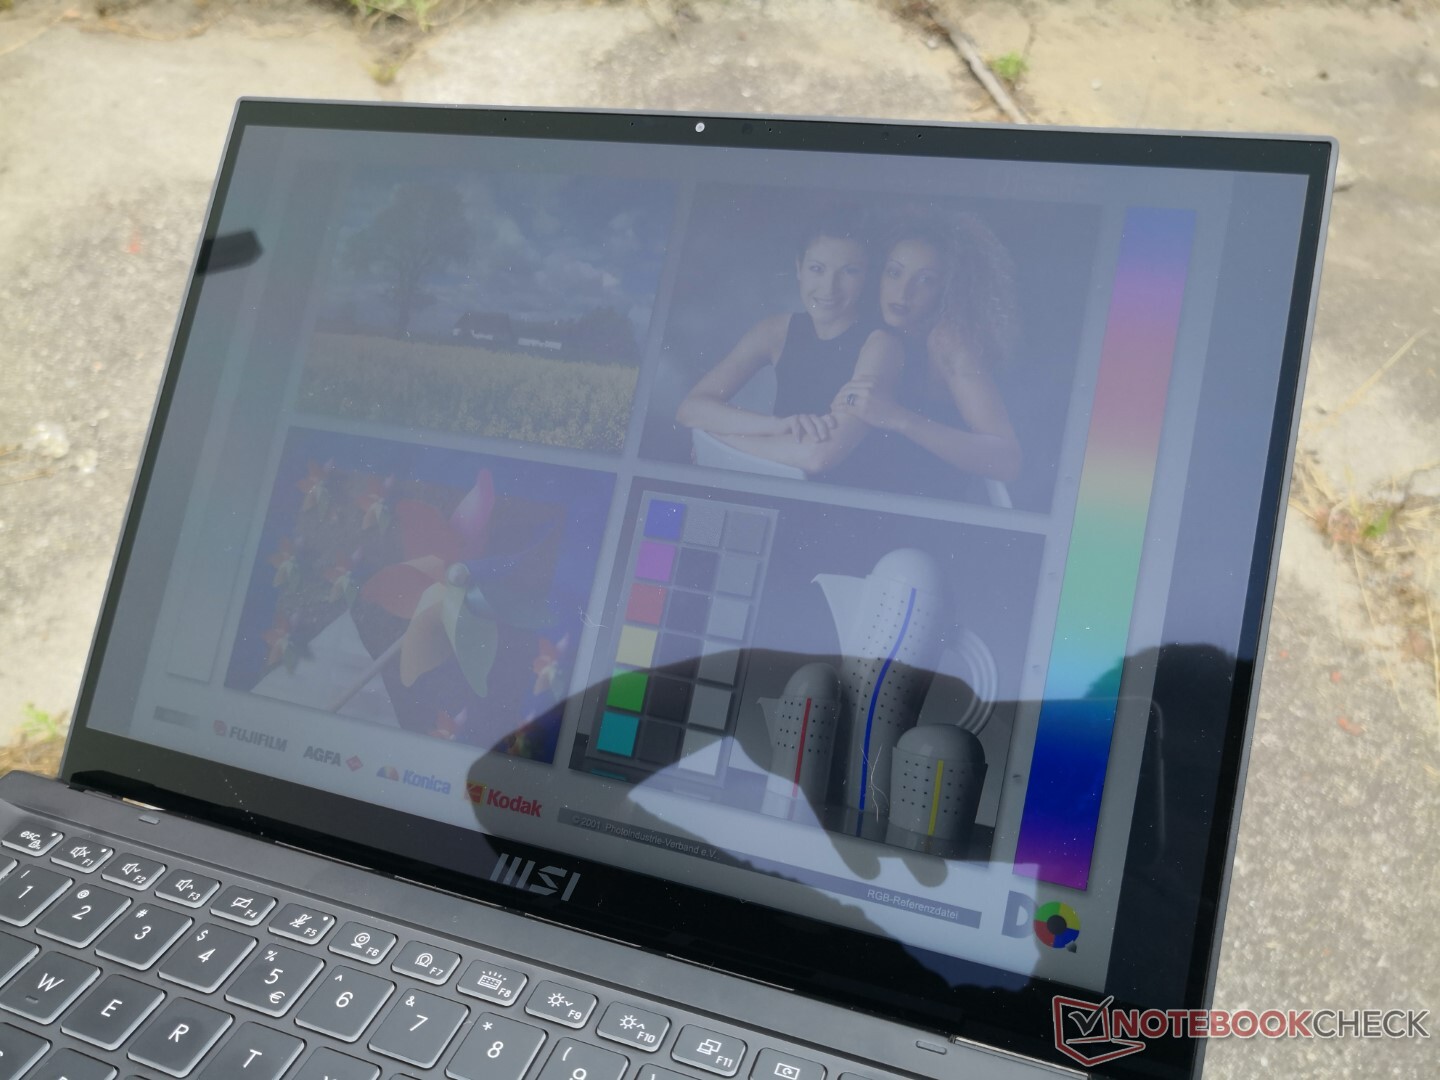
光面屏幕上的眩光是不可避免的,但比平均水平更亮的500尼特背光有助于将眩光降到更可容忍的水平。仍然建议避免在阳光直射下工作。
性能 - 英特尔Core-P系列给人留下深刻印象
测试条件
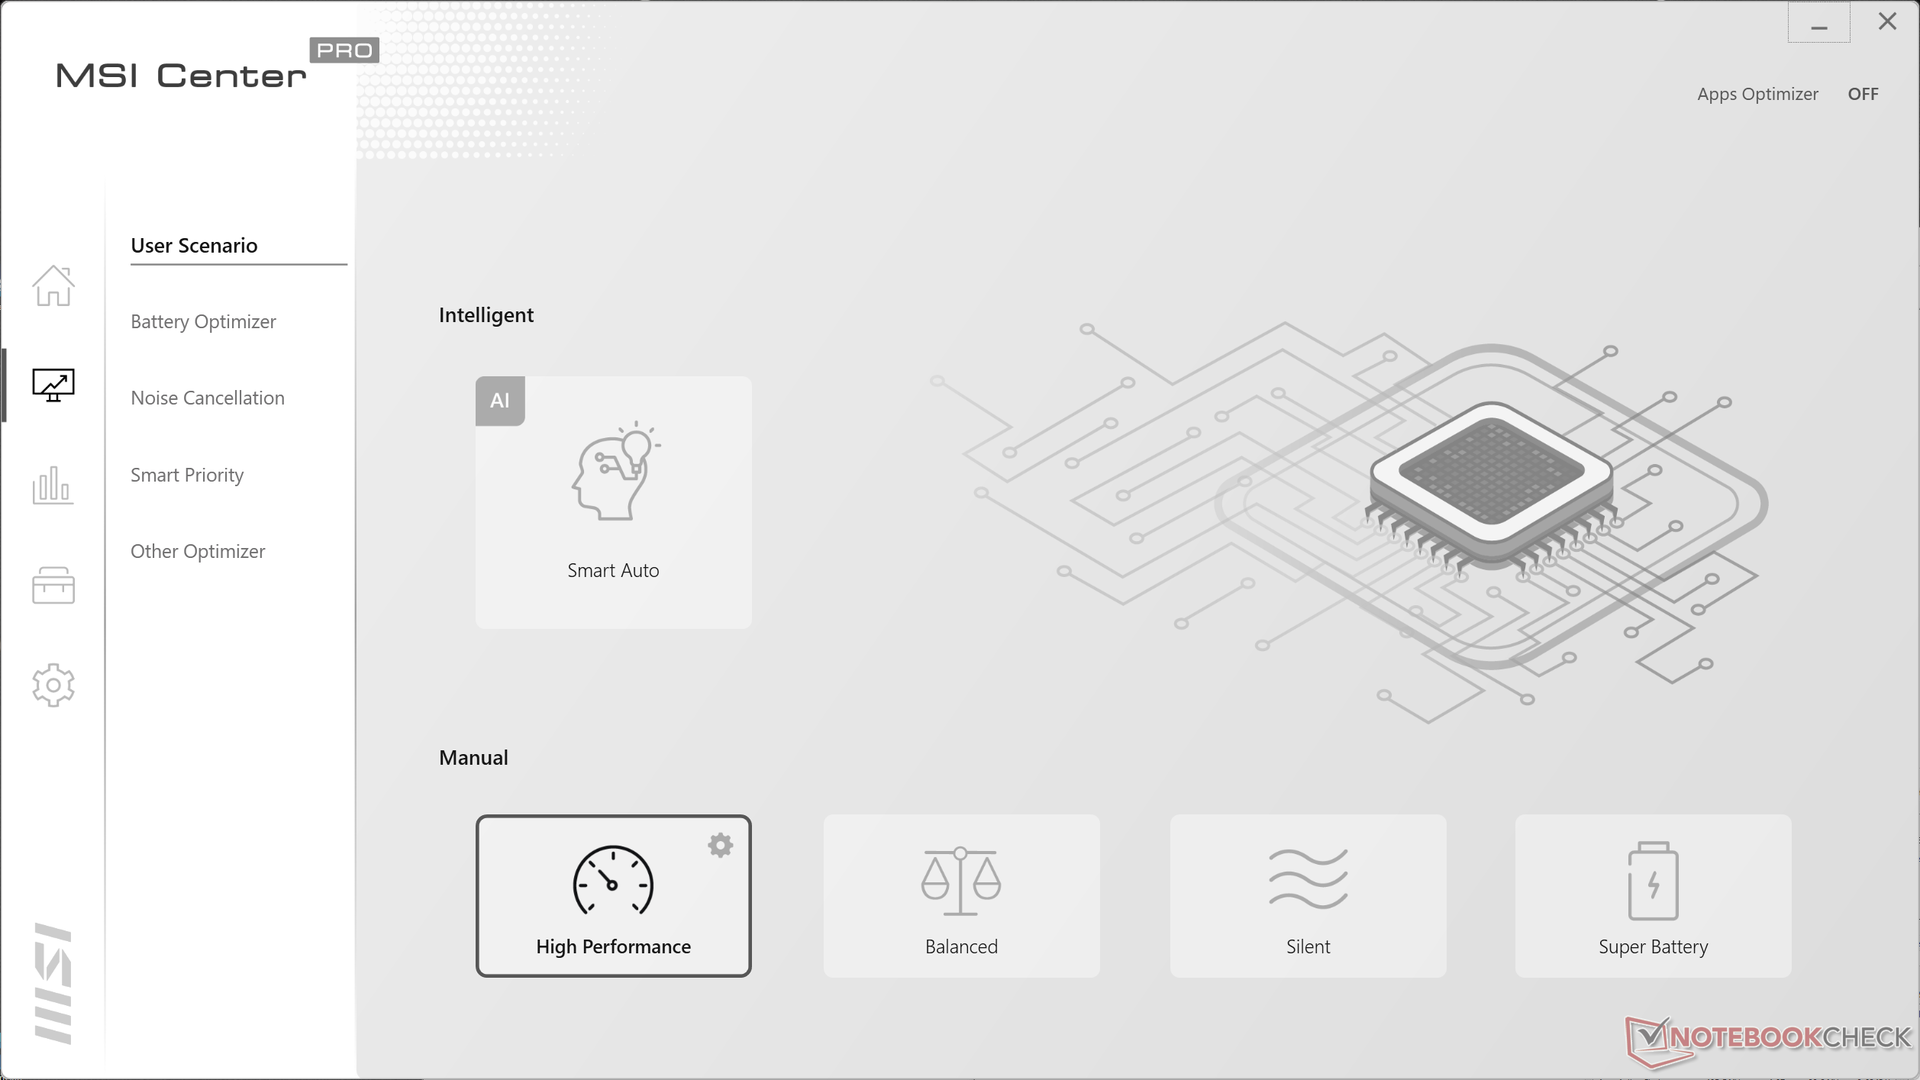
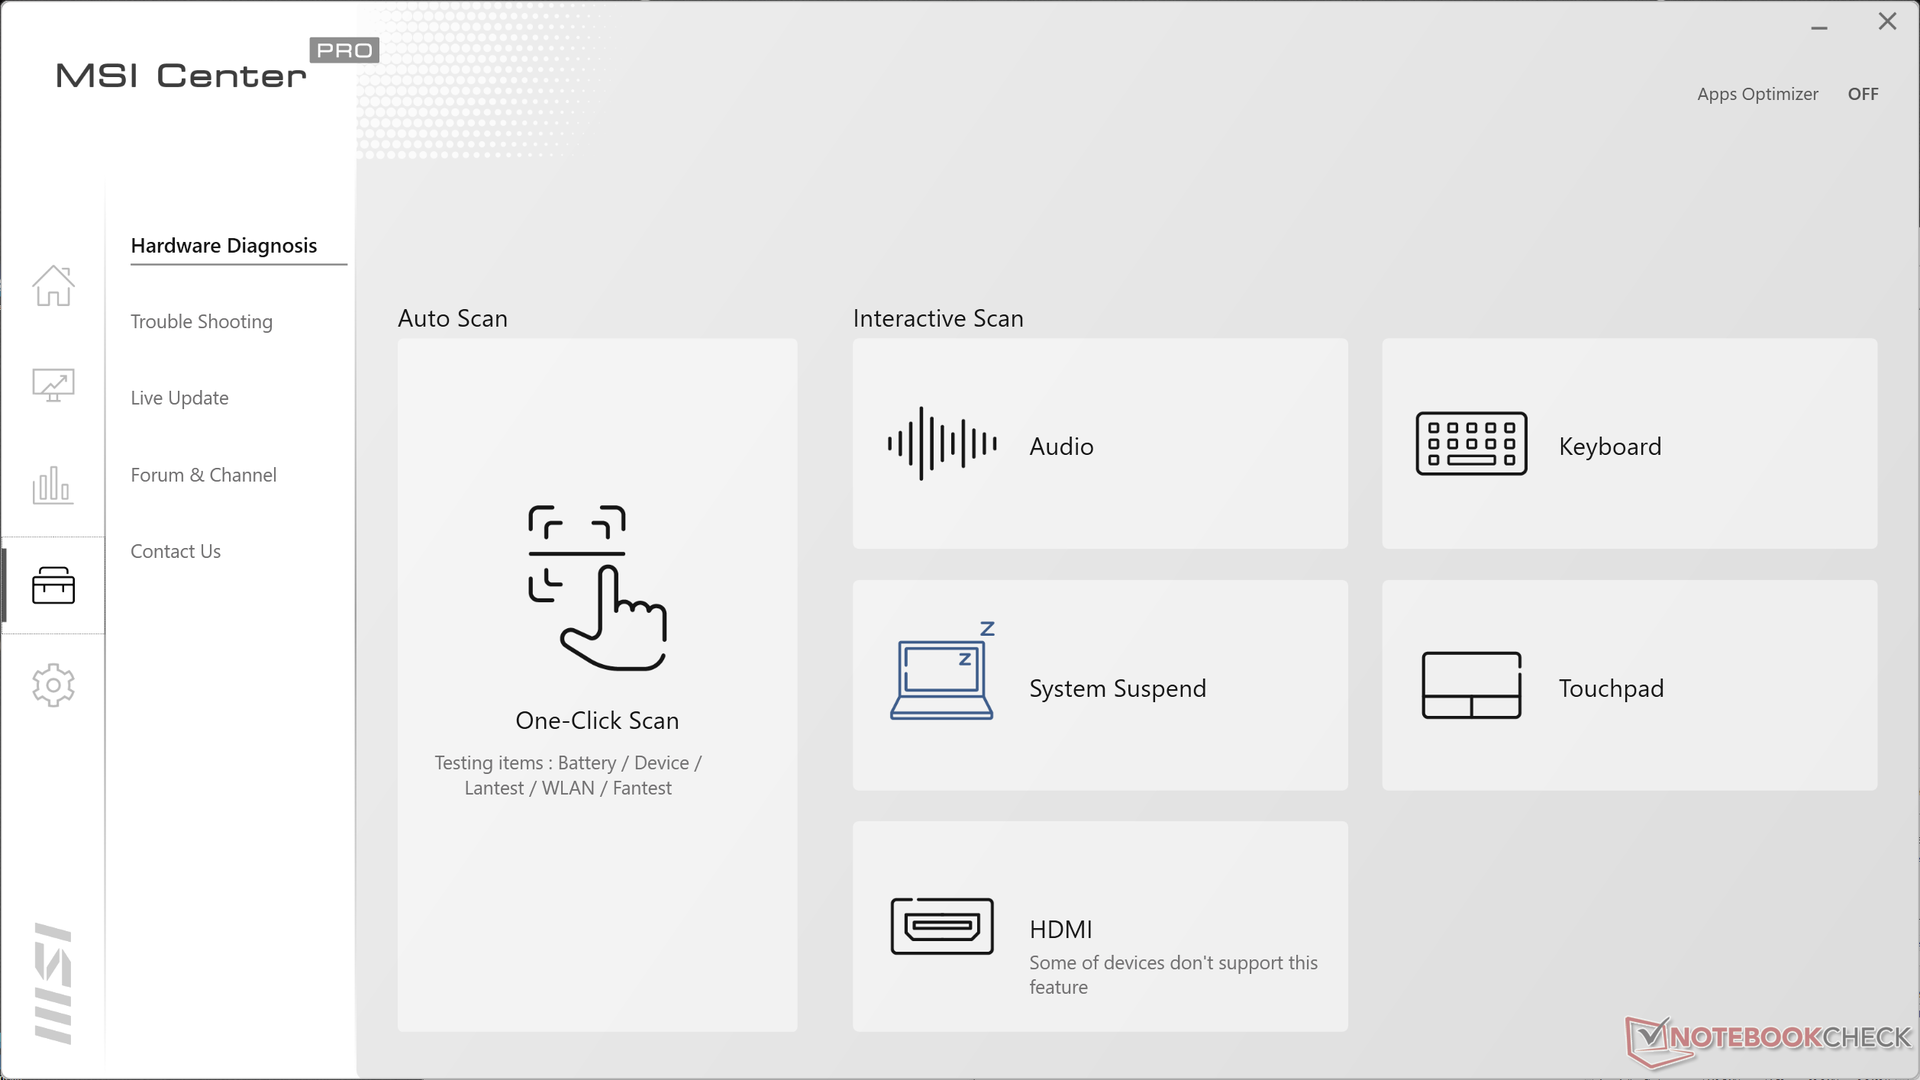
在运行以下任何性能基准之前,我们通过预装的微星中心软件将我们的设备设置为高性能模式。建议用户熟悉这个软件,因为它基本上是调整大多数系统设置、更新和性能配置文件的命令中心。
处理器
CPU的性能非常好,其结果比我们数据库中配备相同的笔记本电脑的平均水平高5%到10%。 酷睿i7-1260PCPU。我们的设备甚至能够持续超越酷睿i7-1270P,如在联想ThinkPad X1 Yoga G7在单线程和多线程工作负载中的表现。从上一代产品升级的用户 酷睿i7-1165G7的用户可以期待在多线程应用中获得高达80%的大幅提升。
竞争者 Ryzen 7 6800U在多线程工作负载中能够超过我们的Core i7-1260P达15%至20%,而在单线程工作负载中则是相反。
Cinebench R15 Multi Loop
Cinebench R23: Multi Core | Single Core
Cinebench R15: CPU Multi 64Bit | CPU Single 64Bit
Blender: v2.79 BMW27 CPU
7-Zip 18.03: 7z b 4 | 7z b 4 -mmt1
Geekbench 5.5: Multi-Core | Single-Core
HWBOT x265 Benchmark v2.2: 4k Preset
LibreOffice : 20 Documents To PDF
R Benchmark 2.5: Overall mean
Cinebench R23: Multi Core | Single Core
Cinebench R15: CPU Multi 64Bit | CPU Single 64Bit
Blender: v2.79 BMW27 CPU
7-Zip 18.03: 7z b 4 | 7z b 4 -mmt1
Geekbench 5.5: Multi-Core | Single-Core
HWBOT x265 Benchmark v2.2: 4k Preset
LibreOffice : 20 Documents To PDF
R Benchmark 2.5: Overall mean
* ... smaller is better
AIDA64: FP32 Ray-Trace | FPU Julia | CPU SHA3 | CPU Queen | FPU SinJulia | FPU Mandel | CPU AES | CPU ZLib | FP64 Ray-Trace | CPU PhotoWorxx
| Performance rating | |
| Asus VivoBook S 14X S5402Z | |
| Lenovo Yoga Slim 7i Pro 14IAP G7 | |
| Dell Latitude 9420 2-in-1 | |
| Average Intel Core i7-1260P | |
| MSI Summit E14 A11SCS | |
| LG Gram 14T90P | |
| MSI Summit E14 Flip Evo A12MT | |
| AIDA64 / FP32 Ray-Trace | |
| Dell Latitude 9420 2-in-1 | |
| MSI Summit E14 A11SCS | |
| LG Gram 14T90P | |
| Asus VivoBook S 14X S5402Z | |
| Average Intel Core i7-1260P (2176 - 10898, n=26) | |
| Lenovo Yoga Slim 7i Pro 14IAP G7 | |
| MSI Summit E14 Flip Evo A12MT | |
| AIDA64 / FPU Julia | |
| Asus VivoBook S 14X S5402Z | |
| Average Intel Core i7-1260P (11015 - 56906, n=26) | |
| Dell Latitude 9420 2-in-1 | |
| MSI Summit E14 A11SCS | |
| Lenovo Yoga Slim 7i Pro 14IAP G7 | |
| LG Gram 14T90P | |
| MSI Summit E14 Flip Evo A12MT | |
| AIDA64 / CPU SHA3 | |
| Asus VivoBook S 14X S5402Z | |
| Lenovo Yoga Slim 7i Pro 14IAP G7 | |
| Dell Latitude 9420 2-in-1 | |
| MSI Summit E14 A11SCS | |
| LG Gram 14T90P | |
| Average Intel Core i7-1260P (669 - 2709, n=26) | |
| MSI Summit E14 Flip Evo A12MT | |
| AIDA64 / CPU Queen | |
| Asus VivoBook S 14X S5402Z | |
| MSI Summit E14 Flip Evo A12MT | |
| Lenovo Yoga Slim 7i Pro 14IAP G7 | |
| Average Intel Core i7-1260P (42571 - 82493, n=26) | |
| Dell Latitude 9420 2-in-1 | |
| MSI Summit E14 A11SCS | |
| LG Gram 14T90P | |
| AIDA64 / FPU SinJulia | |
| Asus VivoBook S 14X S5402Z | |
| Lenovo Yoga Slim 7i Pro 14IAP G7 | |
| MSI Summit E14 Flip Evo A12MT | |
| Average Intel Core i7-1260P (2901 - 6975, n=26) | |
| Dell Latitude 9420 2-in-1 | |
| MSI Summit E14 A11SCS | |
| LG Gram 14T90P | |
| AIDA64 / FPU Mandel | |
| Asus VivoBook S 14X S5402Z | |
| MSI Summit E14 A11SCS | |
| Dell Latitude 9420 2-in-1 | |
| LG Gram 14T90P | |
| Average Intel Core i7-1260P (5950 - 26376, n=26) | |
| Lenovo Yoga Slim 7i Pro 14IAP G7 | |
| MSI Summit E14 Flip Evo A12MT | |
| AIDA64 / CPU AES | |
| Dell Latitude 9420 2-in-1 | |
| LG Gram 14T90P | |
| Asus VivoBook S 14X S5402Z | |
| Average Intel Core i7-1260P (16041 - 92356, n=26) | |
| Lenovo Yoga Slim 7i Pro 14IAP G7 | |
| MSI Summit E14 A11SCS | |
| MSI Summit E14 Flip Evo A12MT | |
| AIDA64 / CPU ZLib | |
| Asus VivoBook S 14X S5402Z | |
| Lenovo Yoga Slim 7i Pro 14IAP G7 | |
| MSI Summit E14 Flip Evo A12MT | |
| Average Intel Core i7-1260P (259 - 771, n=26) | |
| Dell Latitude 9420 2-in-1 | |
| MSI Summit E14 A11SCS | |
| LG Gram 14T90P | |
| AIDA64 / FP64 Ray-Trace | |
| Asus VivoBook S 14X S5402Z | |
| Dell Latitude 9420 2-in-1 | |
| MSI Summit E14 A11SCS | |
| LG Gram 14T90P | |
| Average Intel Core i7-1260P (1237 - 5858, n=26) | |
| Lenovo Yoga Slim 7i Pro 14IAP G7 | |
| MSI Summit E14 Flip Evo A12MT | |
| AIDA64 / CPU PhotoWorxx | |
| MSI Summit E14 A11SCS | |
| Dell Latitude 9420 2-in-1 | |
| LG Gram 14T90P | |
| MSI Summit E14 Flip Evo A12MT | |
| Lenovo Yoga Slim 7i Pro 14IAP G7 | |
| Average Intel Core i7-1260P (13261 - 43652, n=26) | |
| Asus VivoBook S 14X S5402Z | |
系统性能
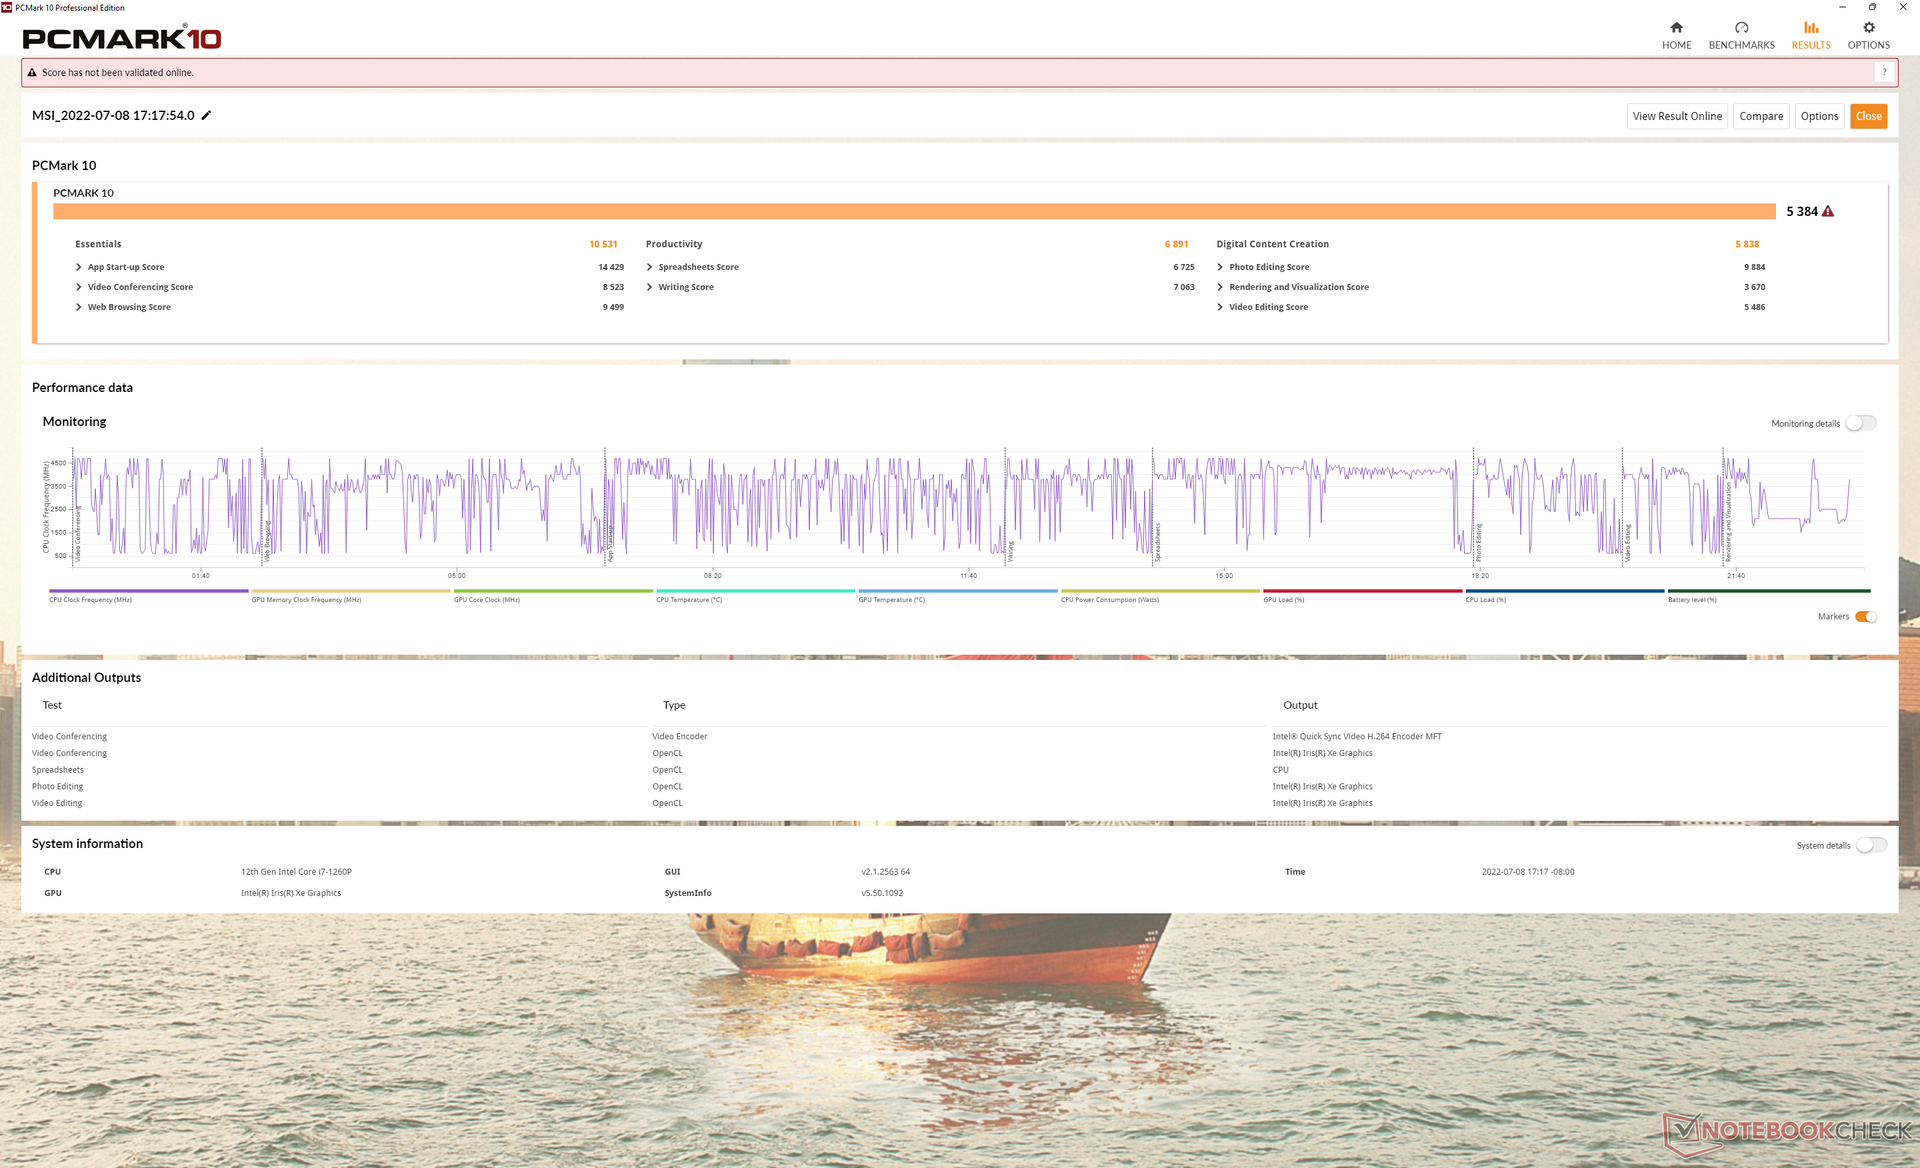
PCMark 10的得分与运行在相同的Core i7-1260P CPU上的其他笔记本电脑相当。同时,CrossMark得分一直高于许多其他14英寸的替代品,甚至包括Core H系列驱动的 华硕VivoBook S 14.
CrossMark: Overall | Productivity | Creativity | Responsiveness
| PCMark 10 / Score | |
| Asus VivoBook S 14X S5402Z | |
| Average Intel Core i7-1260P, Intel Iris Xe Graphics G7 96EUs (4796 - 6068, n=17) | |
| MSI Summit E14 Flip Evo A12MT | |
| MSI Summit E14 A11SCS | |
| Dell Latitude 9420 2-in-1 | |
| Lenovo Yoga Slim 7i Pro 14IAP G7 | |
| LG Gram 14T90P | |
| PCMark 10 / Essentials | |
| Asus VivoBook S 14X S5402Z | |
| MSI Summit E14 Flip Evo A12MT | |
| Dell Latitude 9420 2-in-1 | |
| Average Intel Core i7-1260P, Intel Iris Xe Graphics G7 96EUs (9260 - 11251, n=17) | |
| Lenovo Yoga Slim 7i Pro 14IAP G7 | |
| LG Gram 14T90P | |
| MSI Summit E14 A11SCS | |
| PCMark 10 / Productivity | |
| MSI Summit E14 A11SCS | |
| Asus VivoBook S 14X S5402Z | |
| Average Intel Core i7-1260P, Intel Iris Xe Graphics G7 96EUs (6167 - 8629, n=17) | |
| Dell Latitude 9420 2-in-1 | |
| MSI Summit E14 Flip Evo A12MT | |
| LG Gram 14T90P | |
| Lenovo Yoga Slim 7i Pro 14IAP G7 | |
| PCMark 10 / Digital Content Creation | |
| Asus VivoBook S 14X S5402Z | |
| Average Intel Core i7-1260P, Intel Iris Xe Graphics G7 96EUs (5231 - 6908, n=17) | |
| Lenovo Yoga Slim 7i Pro 14IAP G7 | |
| MSI Summit E14 Flip Evo A12MT | |
| MSI Summit E14 A11SCS | |
| Dell Latitude 9420 2-in-1 | |
| LG Gram 14T90P | |
| CrossMark / Overall | |
| MSI Summit E14 Flip Evo A12MT | |
| Average Intel Core i7-1260P, Intel Iris Xe Graphics G7 96EUs (1484 - 1811, n=16) | |
| Lenovo Yoga Slim 7i Pro 14IAP G7 | |
| Asus VivoBook S 14X S5402Z | |
| LG Gram 14T90P | |
| CrossMark / Productivity | |
| MSI Summit E14 Flip Evo A12MT | |
| Average Intel Core i7-1260P, Intel Iris Xe Graphics G7 96EUs (1486 - 1755, n=16) | |
| Asus VivoBook S 14X S5402Z | |
| Lenovo Yoga Slim 7i Pro 14IAP G7 | |
| LG Gram 14T90P | |
| CrossMark / Creativity | |
| MSI Summit E14 Flip Evo A12MT | |
| Average Intel Core i7-1260P, Intel Iris Xe Graphics G7 96EUs (1451 - 1872, n=16) | |
| Lenovo Yoga Slim 7i Pro 14IAP G7 | |
| Asus VivoBook S 14X S5402Z | |
| LG Gram 14T90P | |
| CrossMark / Responsiveness | |
| MSI Summit E14 Flip Evo A12MT | |
| Average Intel Core i7-1260P, Intel Iris Xe Graphics G7 96EUs (1253 - 1807, n=16) | |
| Asus VivoBook S 14X S5402Z | |
| Lenovo Yoga Slim 7i Pro 14IAP G7 | |
| LG Gram 14T90P | |
| PCMark 10 Score | 5384 points | |
Help | ||
| AIDA64 / Memory Copy | |
| MSI Summit E14 Flip Evo A12MT | |
| Dell Latitude 9420 2-in-1 | |
| LG Gram 14T90P | |
| MSI Summit E14 A11SCS | |
| Lenovo Yoga Slim 7i Pro 14IAP G7 | |
| Average Intel Core i7-1260P (25125 - 71544, n=25) | |
| Asus VivoBook S 14X S5402Z | |
| AIDA64 / Memory Read | |
| MSI Summit E14 Flip Evo A12MT | |
| Dell Latitude 9420 2-in-1 | |
| Lenovo Yoga Slim 7i Pro 14IAP G7 | |
| LG Gram 14T90P | |
| MSI Summit E14 A11SCS | |
| Average Intel Core i7-1260P (24983 - 72065, n=25) | |
| Asus VivoBook S 14X S5402Z | |
| AIDA64 / Memory Write | |
| LG Gram 14T90P | |
| Dell Latitude 9420 2-in-1 | |
| MSI Summit E14 A11SCS | |
| MSI Summit E14 Flip Evo A12MT | |
| Lenovo Yoga Slim 7i Pro 14IAP G7 | |
| Average Intel Core i7-1260P (23512 - 66799, n=25) | |
| Asus VivoBook S 14X S5402Z | |
| AIDA64 / Memory Latency | |
| MSI Summit E14 A11SCS | |
| Dell Latitude 9420 2-in-1 | |
| LG Gram 14T90P | |
| Average Intel Core i7-1260P (77.9 - 118.4, n=21) | |
| Asus VivoBook S 14X S5402Z | |
| MSI Summit E14 Flip Evo A12MT | |
* ... smaller is better
DPC延时
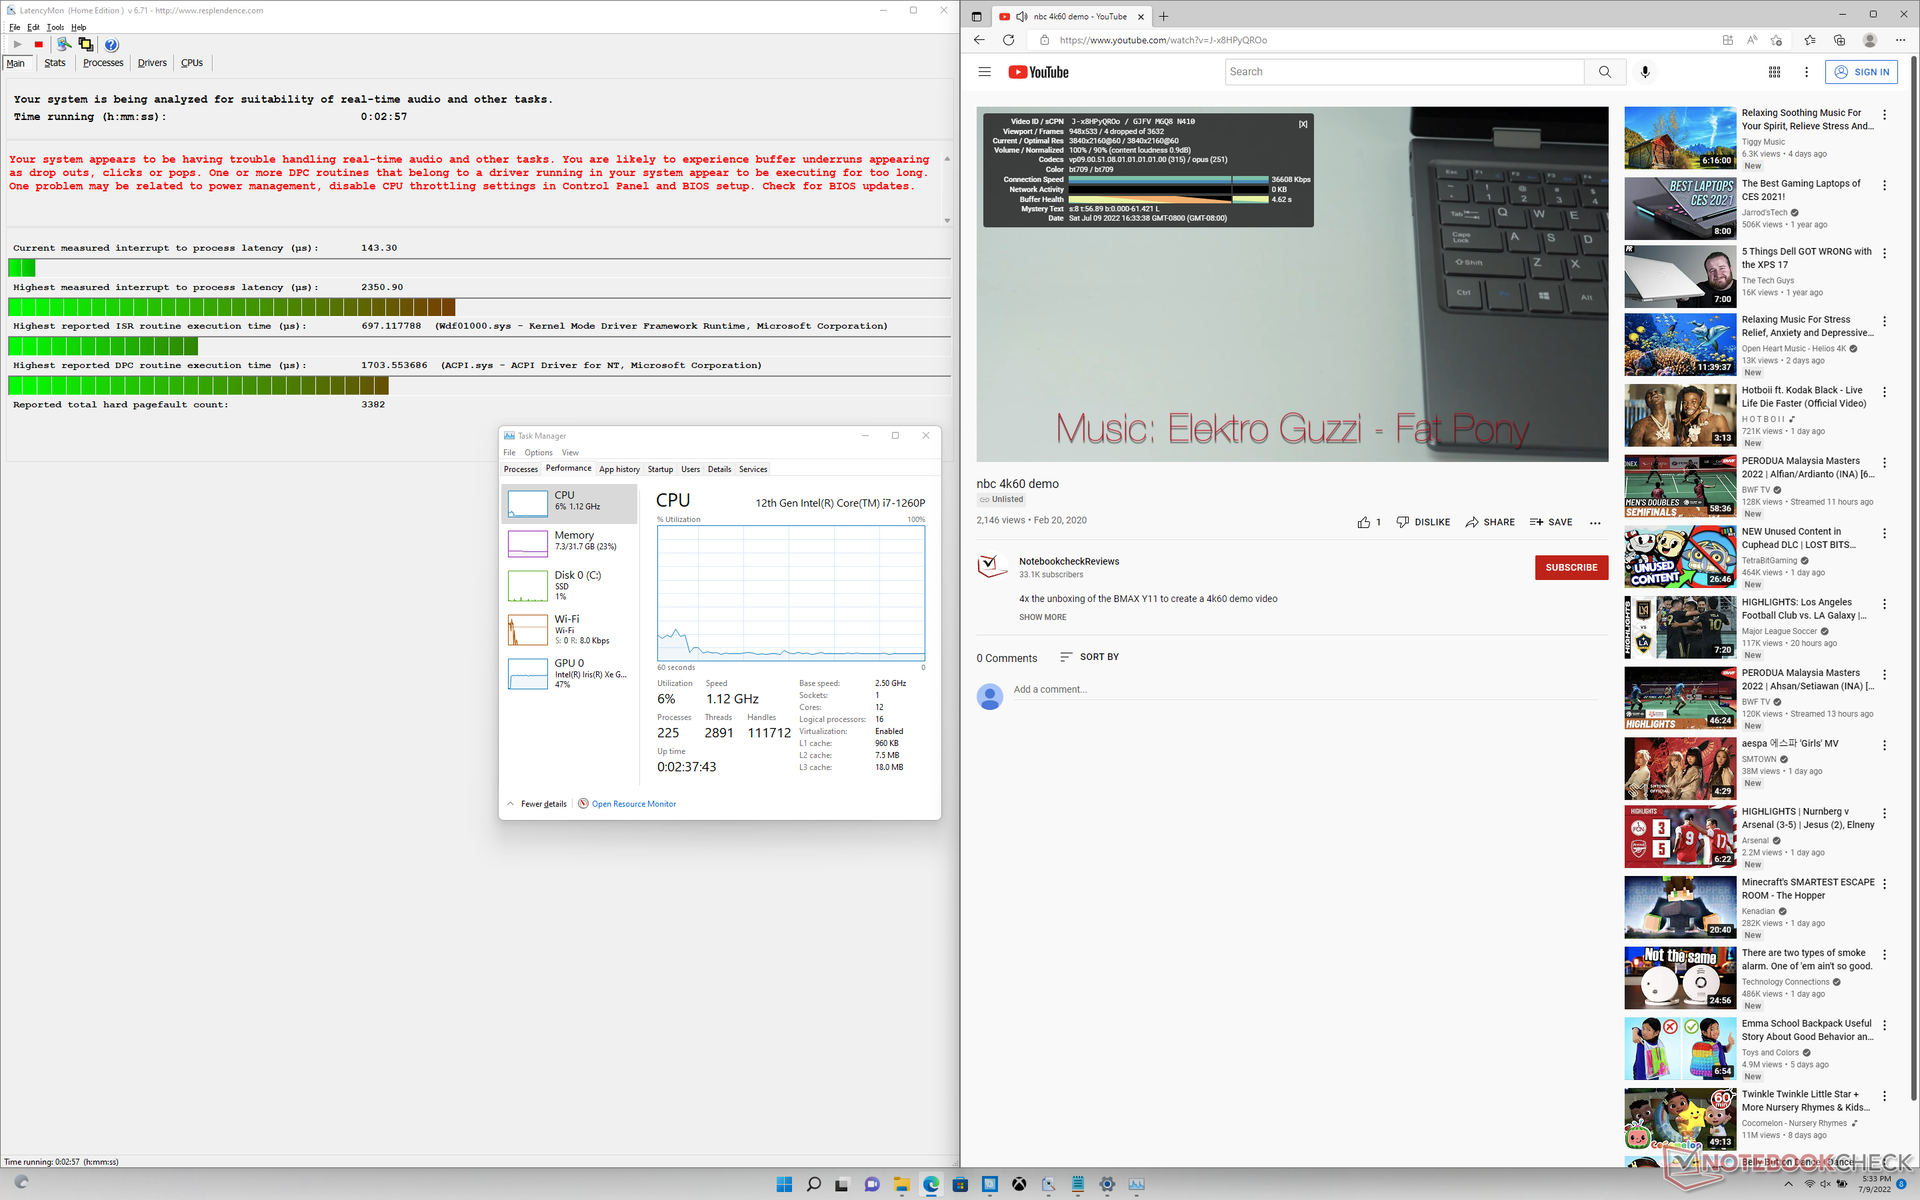
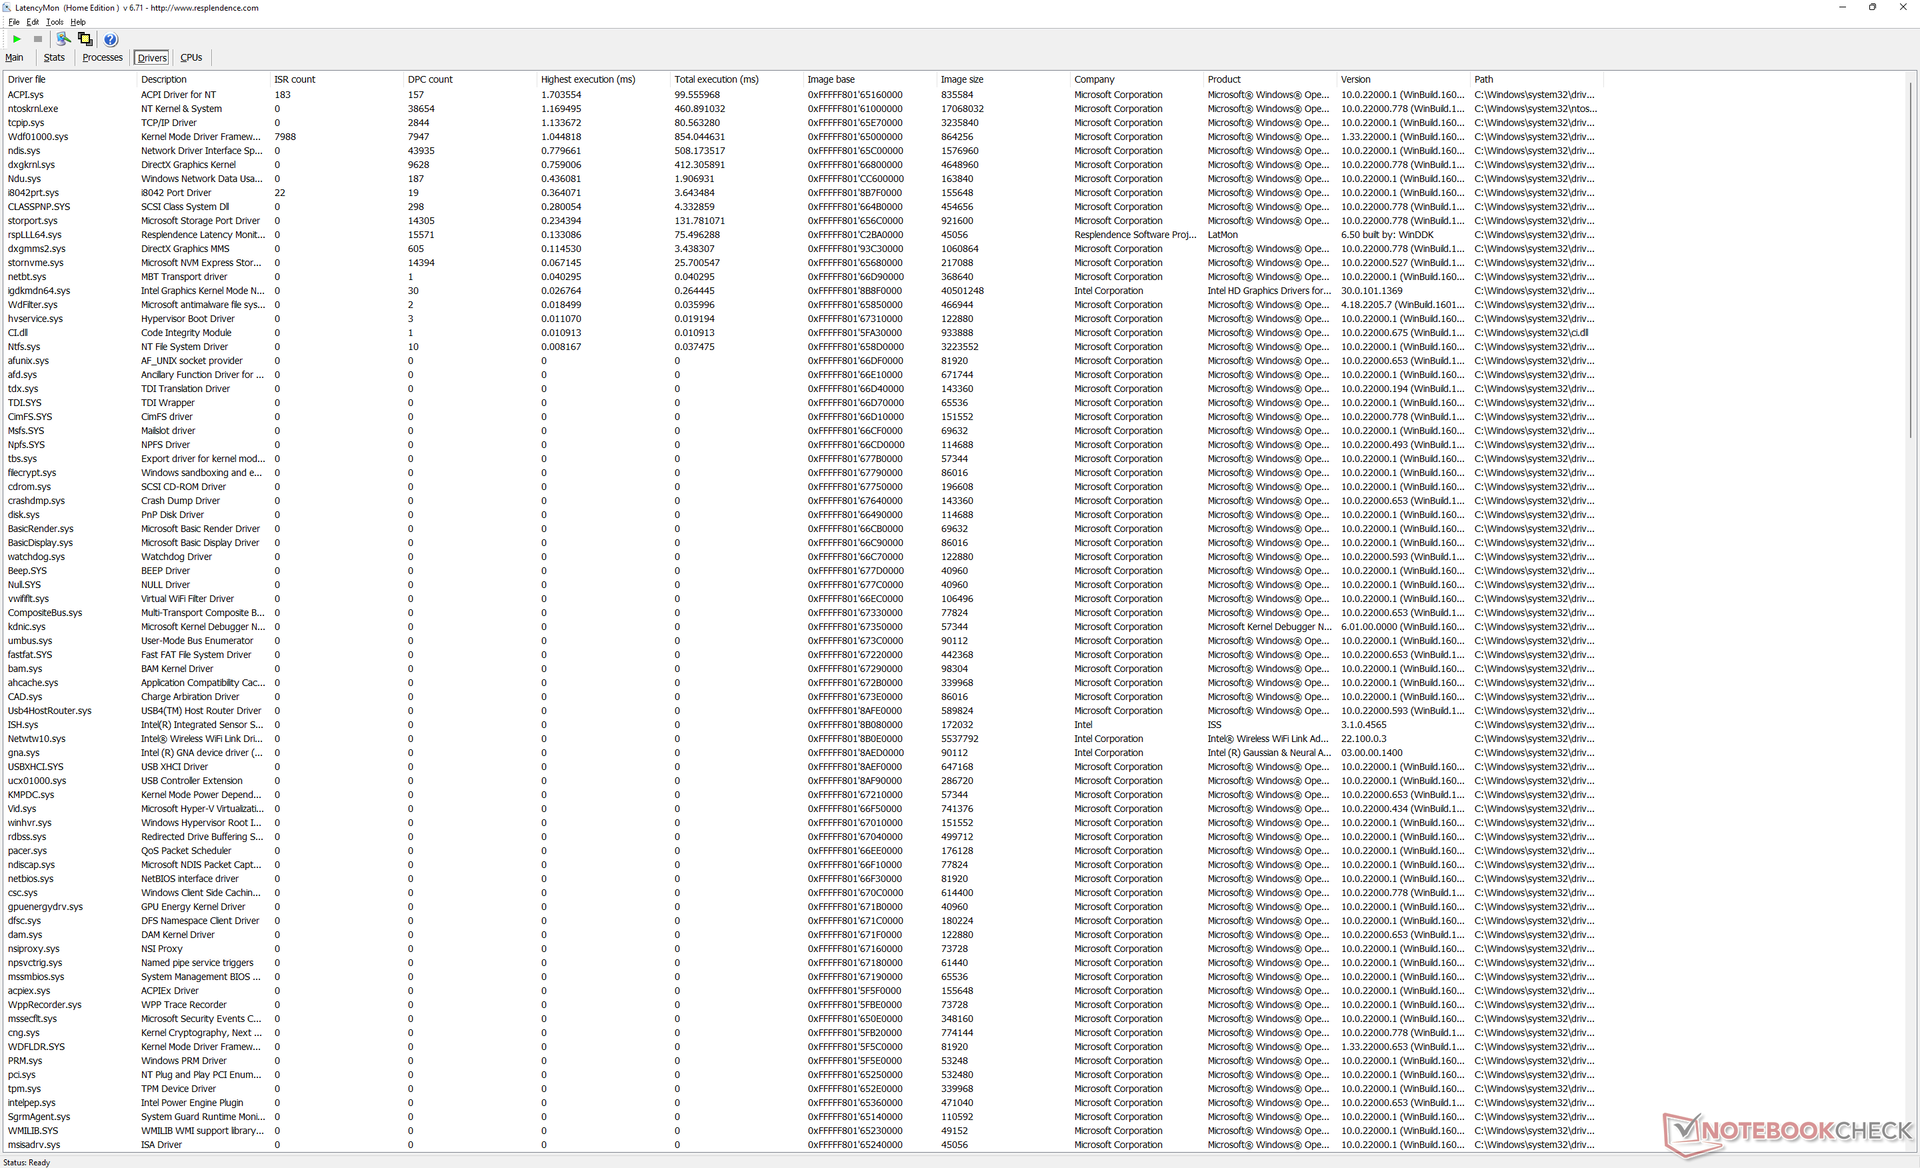
LatencyMon揭示了在打开我们的主页的多个浏览器标签时的DPC问题。在60FPS下的4K视频播放也不完美,在我们长达1分钟的视频测试中出现了4个丢帧。
| DPC Latencies / LatencyMon - interrupt to process latency (max), Web, Youtube, Prime95 | |
| MSI Summit E14 Flip Evo A12MT | |
| Asus VivoBook S 14X S5402Z | |
| LG Gram 14T90P | |
| MSI Summit E14 A11SCS | |
| Lenovo Yoga Slim 7i Pro 14IAP G7 | |
| Dell Latitude 9420 2-in-1 | |
* ... smaller is better
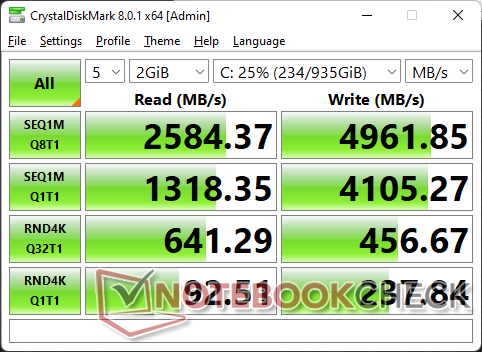
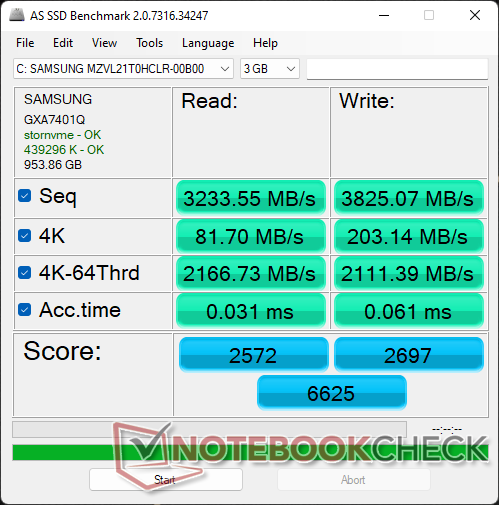
存储设备 - PCIe4 x4性能节流
我们的测试设备配备了一个1TB三星PM9A1PCIe4 x4 NVMe固态硬盘,连续读取和写入速度分别高达7000 MB/s和5200 MB/s。不幸的是,由于Summit E14 Flip中的固态硬盘缺乏任何冷却装置,因此在大多数实际情况下,不要指望接近这些传输速率。当循环运行DiskSpd时,传输率几乎会立即降至1700 MB/s,这已经比大多数PCIe3 NVMe SSD慢了。在联想Yoga Slim 7i Pro上运行同样的测试联想Yoga Slim 7i Pro配备了类似的三星PM9A1固态硬盘,也会显示出性能节流的行为,但平均传输速率仍然比微星的快。

| Drive Performance rating - Percent | |
| MSI Summit E14 Flip Evo A12MT | |
| MSI Summit E14 A11SCS | |
| Lenovo Yoga Slim 7i Pro 14IAP G7 | |
| LG Gram 14T90P | |
| Asus VivoBook S 14X S5402Z | |
| Dell Latitude 9420 2-in-1 | |
* ... smaller is better
Disk Throttling: DiskSpd Read Loop, Queue Depth 8
GPU性能--Iris Xe仍然非常好
图形性能比平均水平快15%至20%。 Iris Xe 96 EUs在我们的数据库中,它是具有集成图形的最快的14英寸可折叠电脑之一。这种轻微的提升可以部分归功于LPDDR5内存,而其他大多数超极本仍在使用DDR4或LPDDR4。芯片AMD Radeon 680M在大多数情况下仍然更快,但是Summit系列没有这样的选项。尽管如此,该系统的速度还是足以在720p或900p的低分辨率下玩高要求的游戏,或者在1080p下玩DOTA 2等要求不高的游戏。
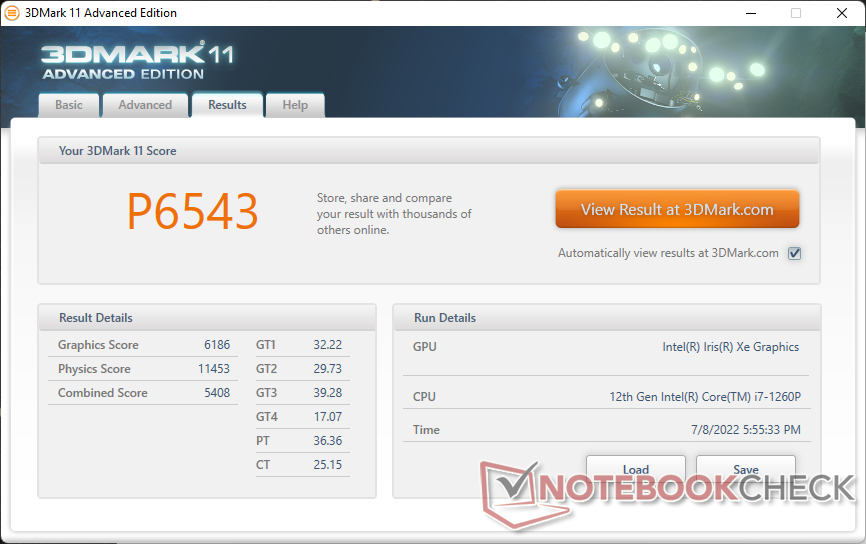
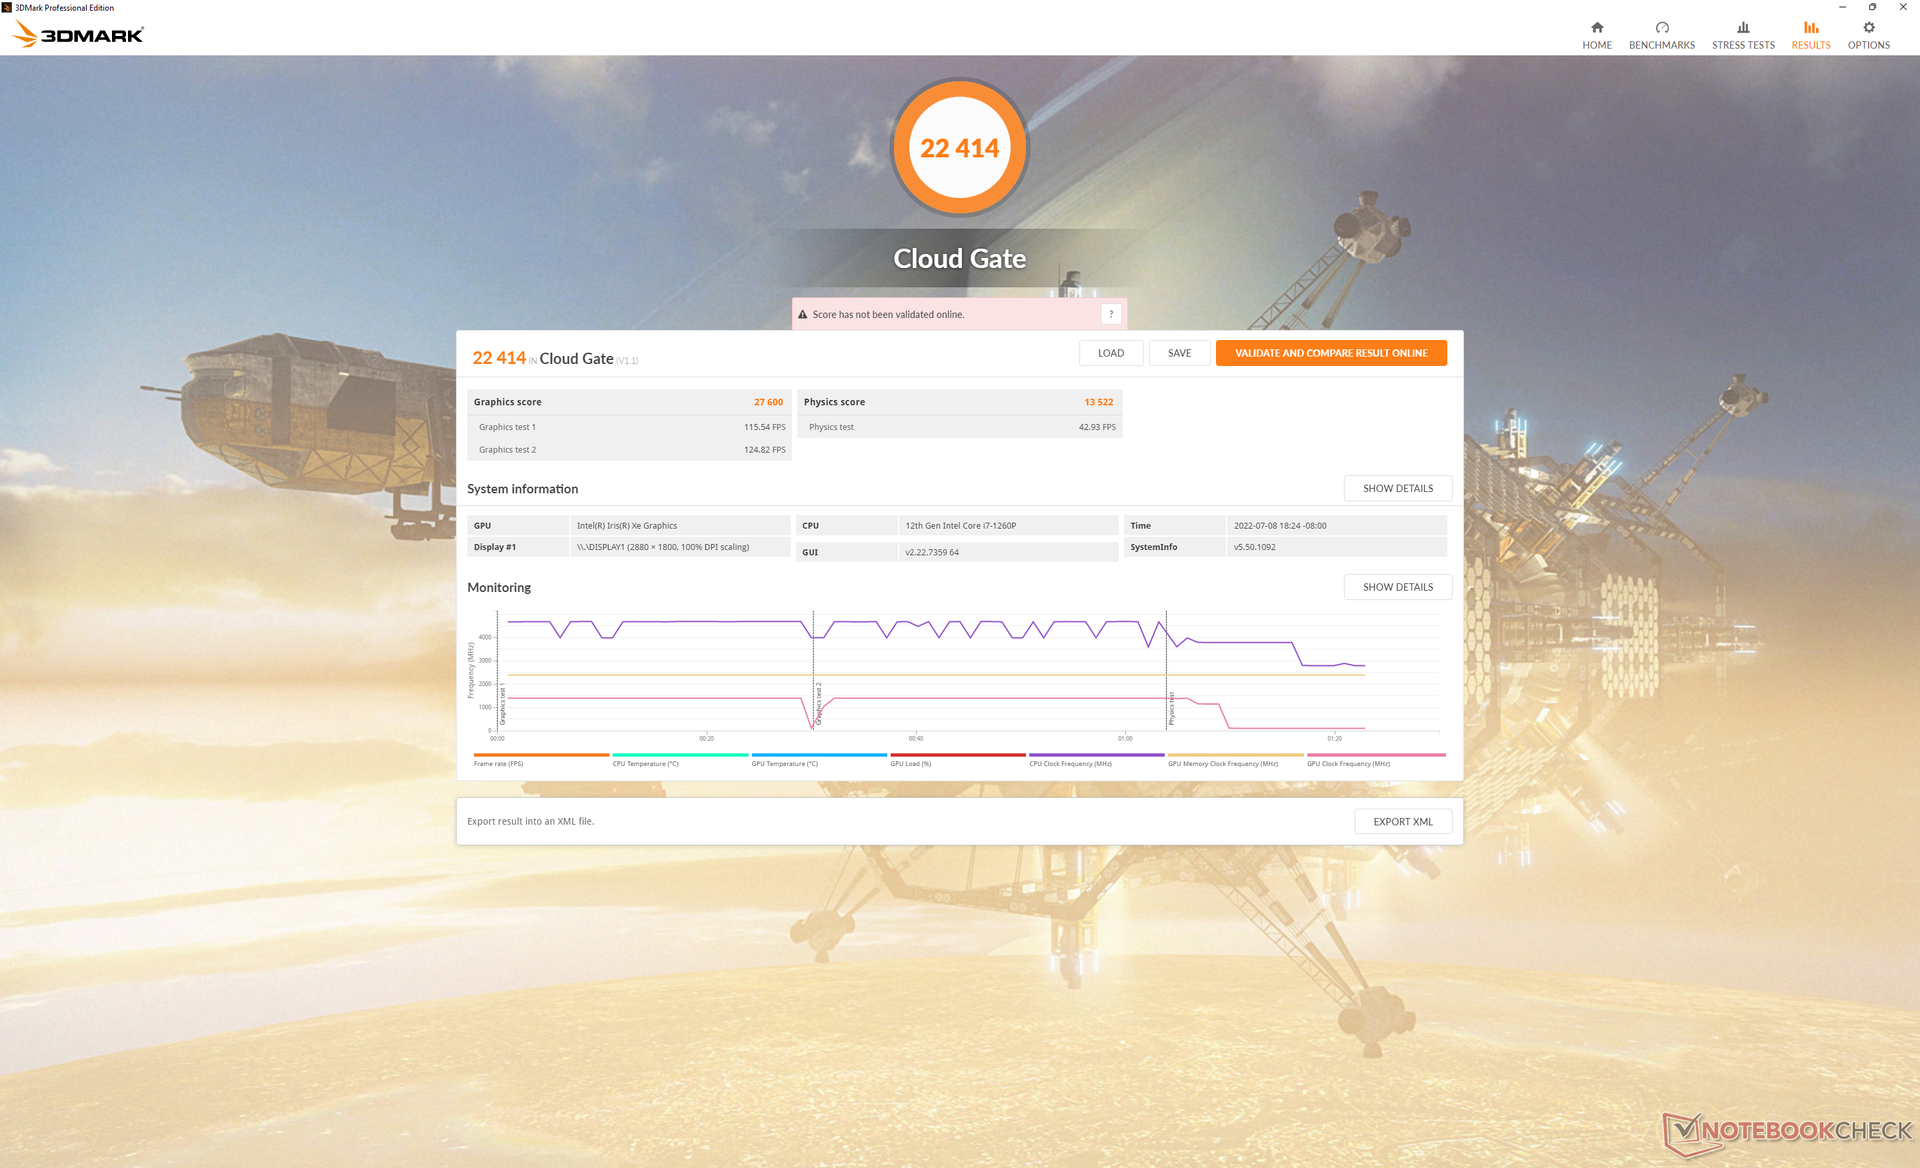
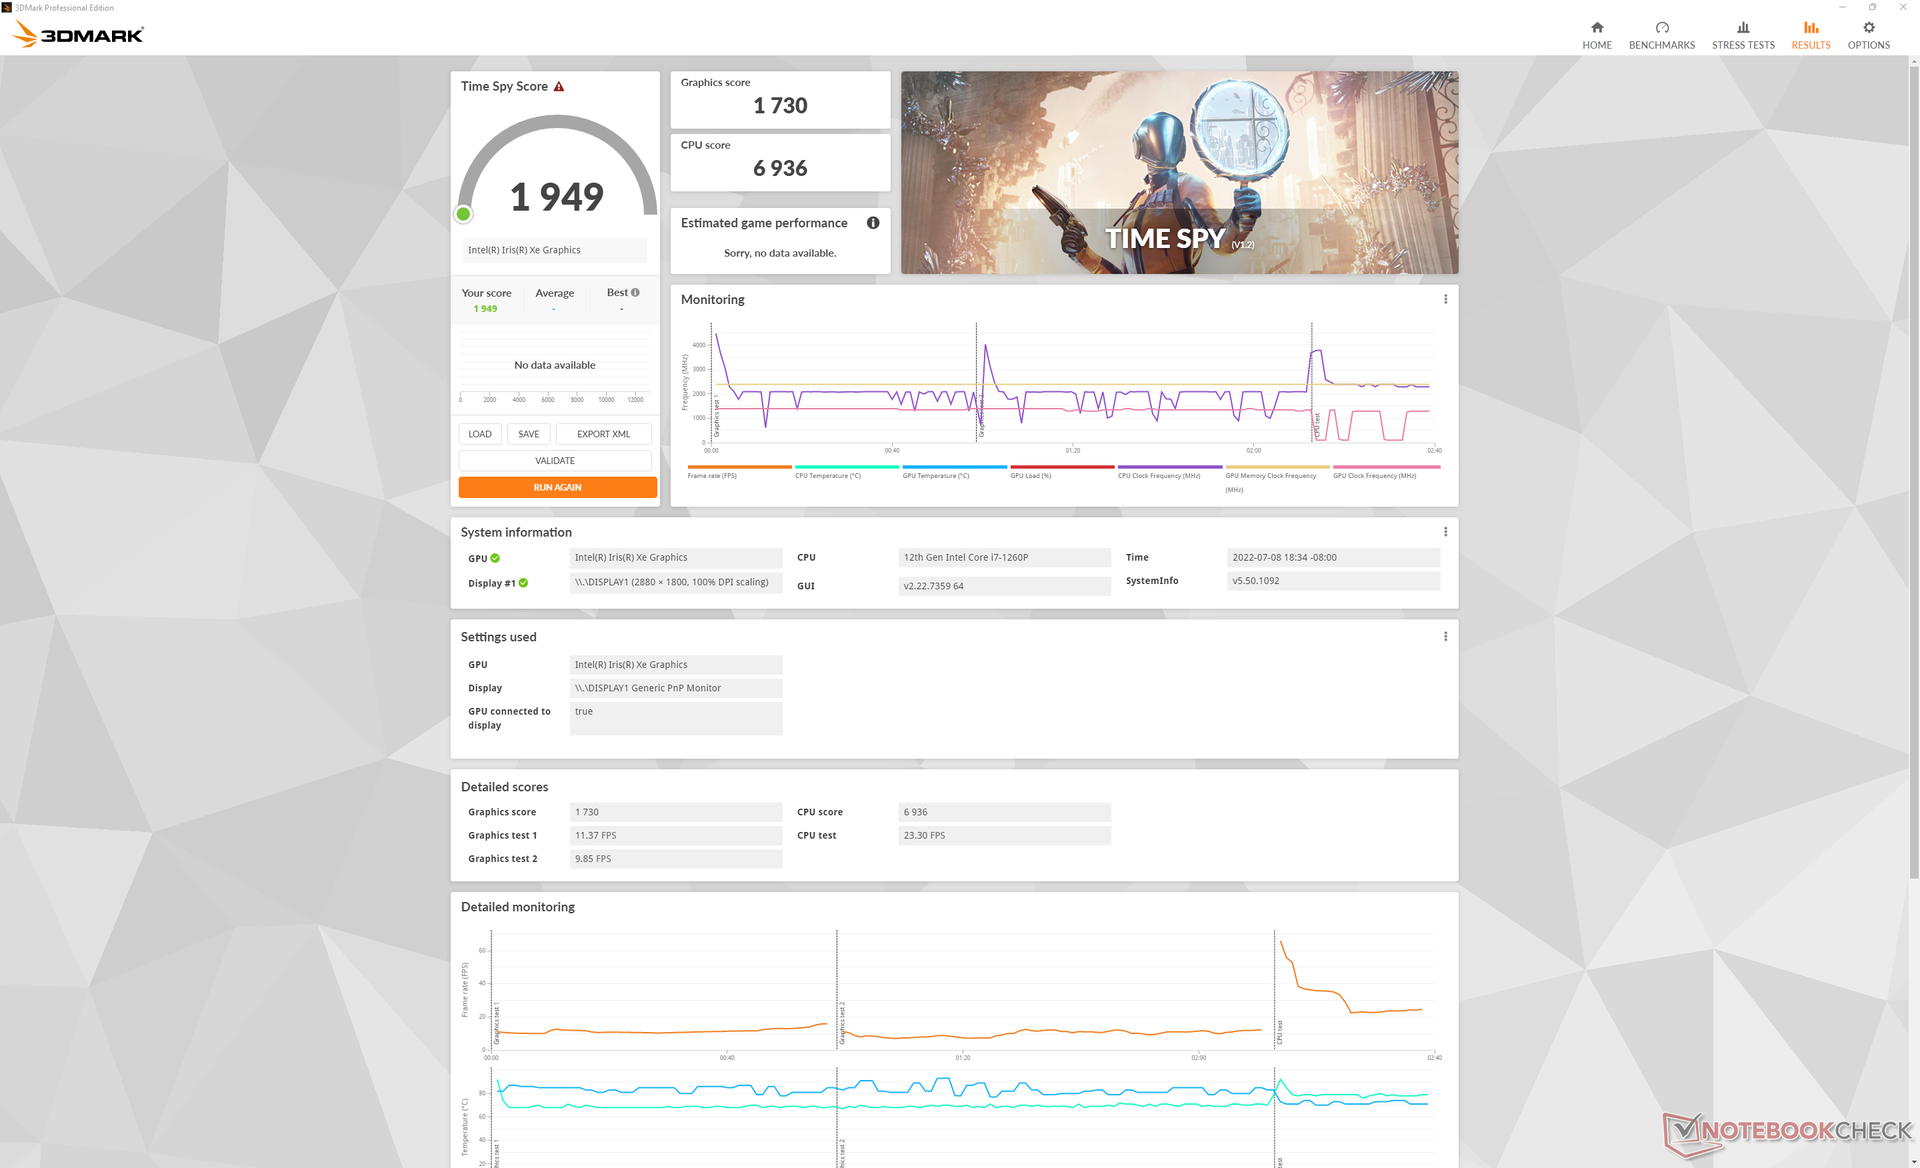
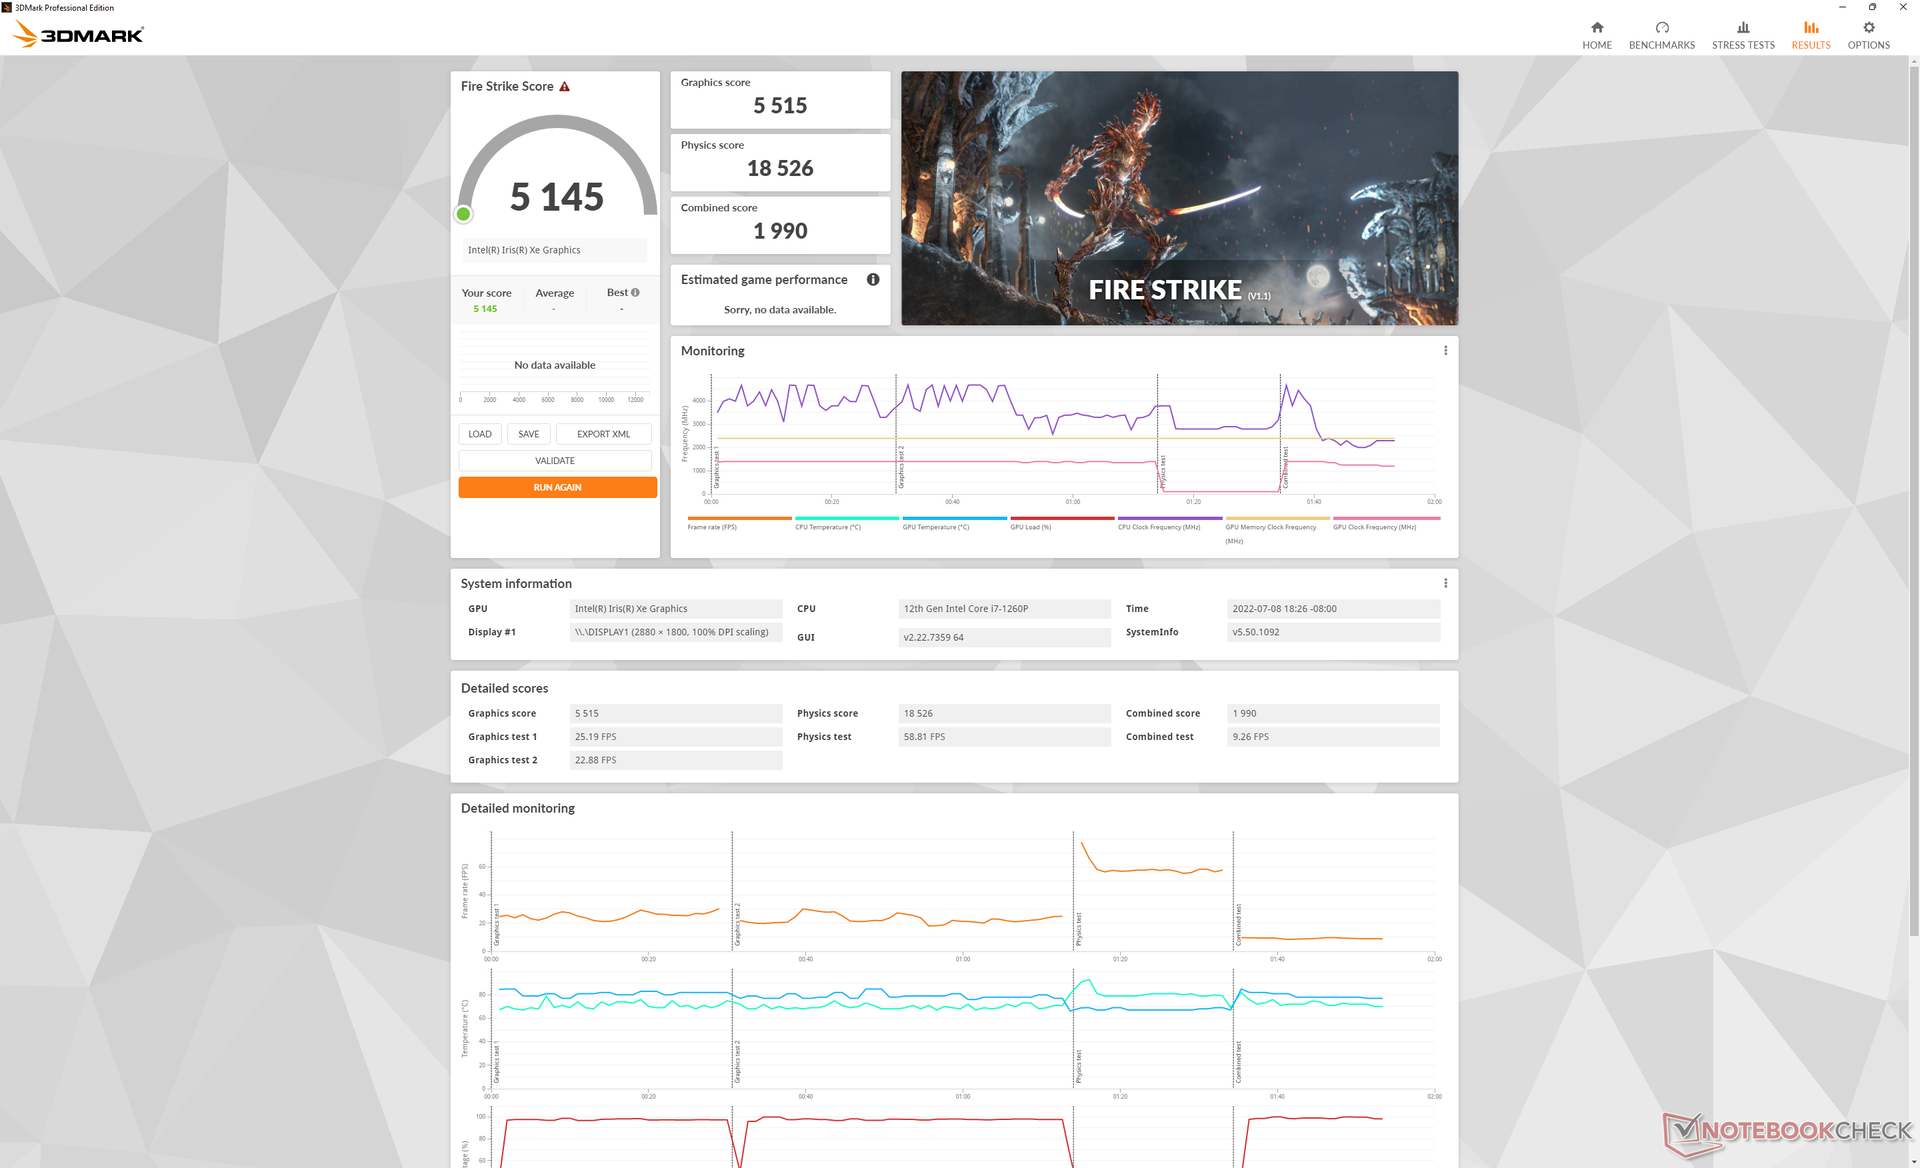
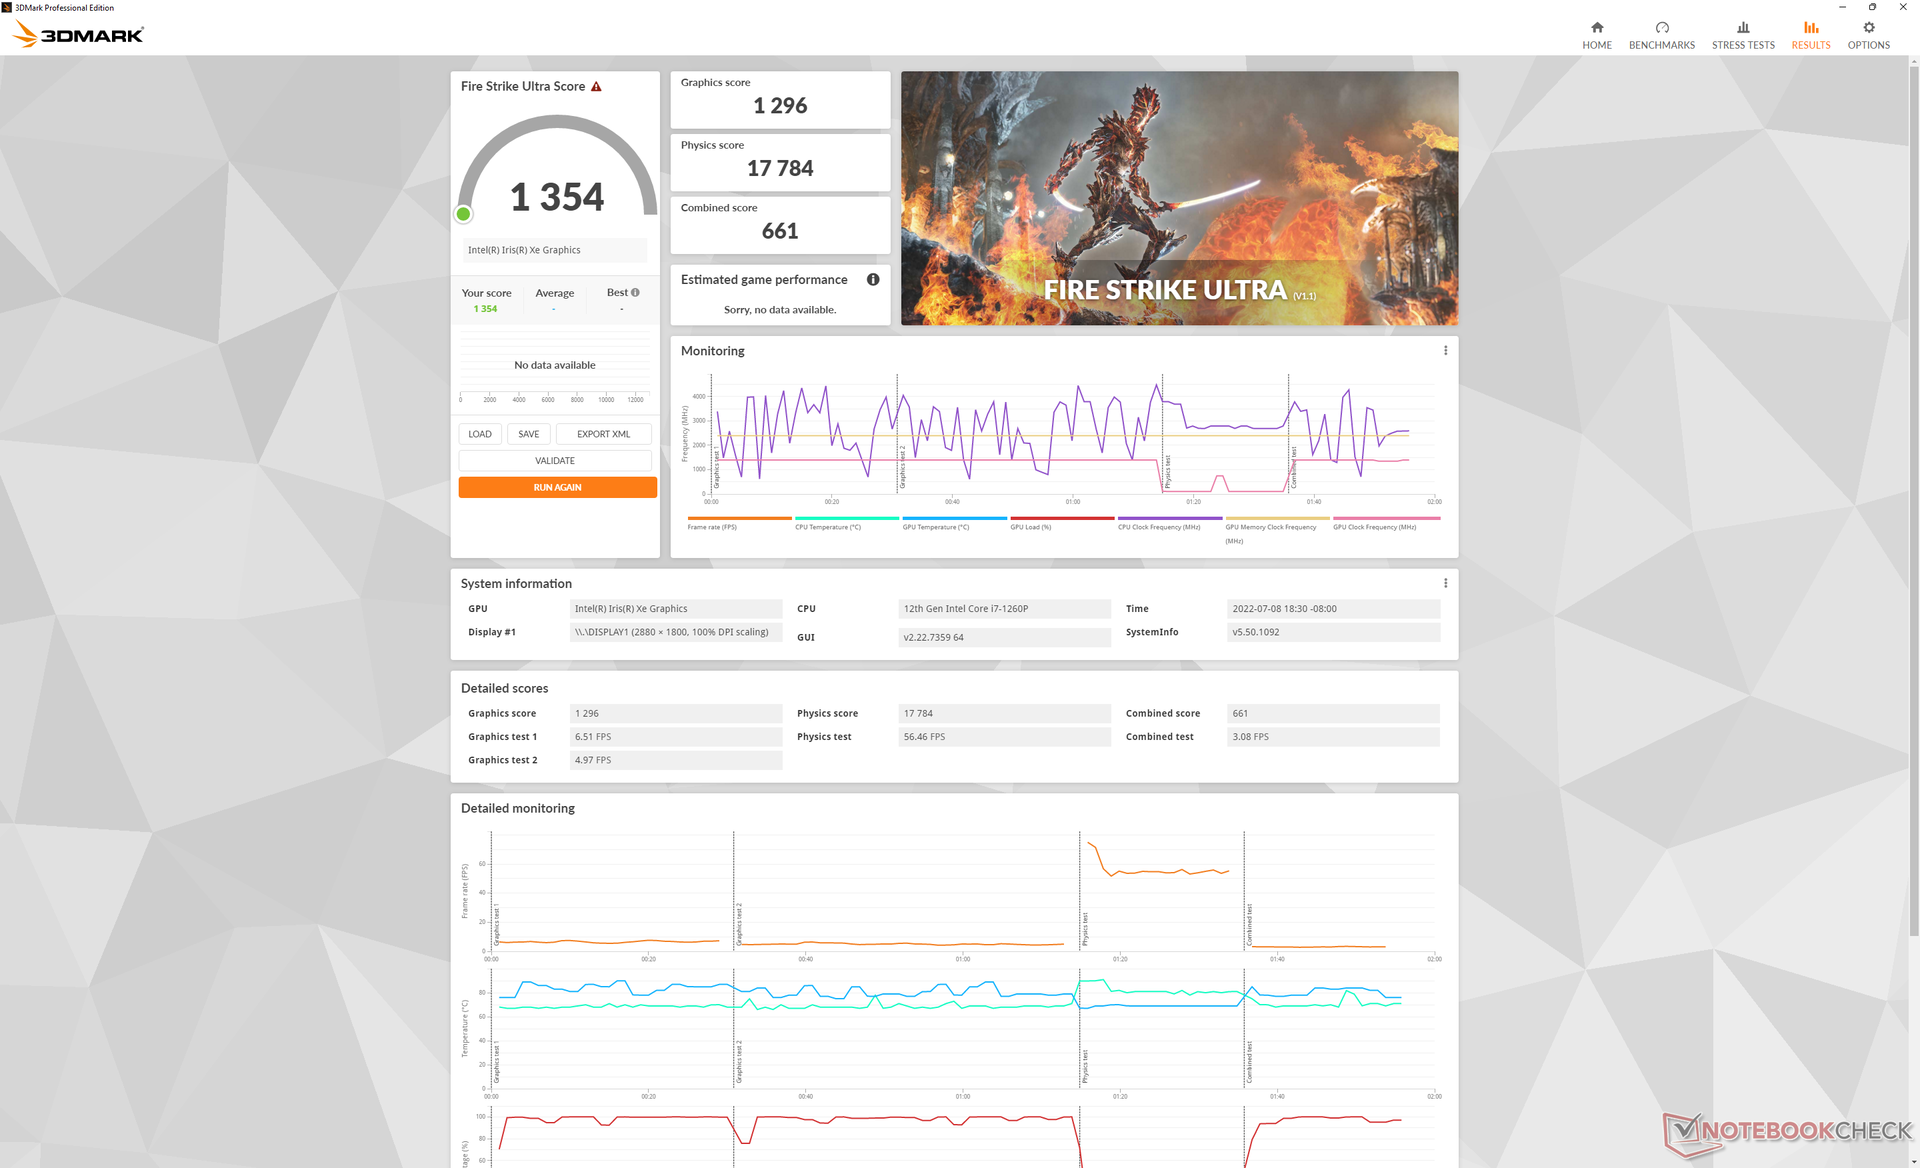
| 3DMark 11 Performance | 6543 points | |
| 3DMark Cloud Gate Standard Score | 22414 points | |
| 3DMark Fire Strike Score | 5145 points | |
| 3DMark Time Spy Score | 1949 points | |
Help | ||
Witcher 3 FPS Chart
| low | med. | high | ultra | |
|---|---|---|---|---|
| GTA V (2015) | 121.6 | 101.4 | 20.5 | 9.75 |
| The Witcher 3 (2015) | 96.9 | 62.9 | 34.7 | 15.8 |
| Dota 2 Reborn (2015) | 122.1 | 93.5 | 66.2 | 59.8 |
| Final Fantasy XV Benchmark (2018) | 44.4 | 24.8 | 24.8 | |
| X-Plane 11.11 (2018) | 47.8 | 34.9 | 32.1 | |
| Strange Brigade (2018) | 95.2 | 44.5 | 35.8 | 29 |
| Cyberpunk 2077 1.6 (2022) | 22.6 | 19.1 | 14.5 | 11.6 |
排放
系统噪音--在大多数中低速情况下都很安静
该机箱是为支持要求更高的Core-H和独立的GeForce MX选项而建造的。因此,我们唯一的Core-P CPU配置是相对安静的,这并不奇怪。例如,当在平衡模式下运行3DMark 06的第一个基准场景时,在23.3 dB(A)的无声背景下,几乎听不到风扇噪音,只有24 dB(A)。用户可以期望在典型的浏览场景下,风扇噪音保持在24.7 dB(A)以下。
当运行 Witcher 3代表高负载时,风扇噪音通常在35至43 dB(A)之间。启用Cooler Boost模式(即最大风扇模式)将导致风扇噪音达到近56 dB(A),比大多数副笔记本的噪音还要大。值得庆幸的是,对于我们的特定配置来说,这样的模式在大多数情况下是不必要的。
Noise level
| Idle |
| 23.3 / 23.3 / 23.3 dB(A) |
| Load |
| 24 / 55.8 dB(A) |
 | ||
30 dB silent 40 dB(A) audible 50 dB(A) loud |
||
min: | ||
| MSI Summit E14 Flip Evo A12MT Iris Xe G7 96EUs, i7-1260P, Samsung PM9A1 MZVL21T0HCLR | MSI Summit E14 A11SCS GeForce GTX 1650 Ti Max-Q, i7-1185G7, Phison 1TB SM2801T24GKBB4S-E162 | Asus VivoBook S 14X S5402Z Iris Xe G7 96EUs, i7-12700H, Micron 2450 512GB MTFDKBA512TFK | LG Gram 14T90P Iris Xe G7 80EUs, i5-1135G7, Samsung SSD PM981a MZVLB512HBJQ | Lenovo Yoga Slim 7i Pro 14IAP G7 Iris Xe G7 80EUs, i5-1240P, Samsung PM9A1 MZVL2512HCJQ | Dell Latitude 9420 2-in-1 Iris Xe G7 96EUs, i7-1185G7, WDC PC SN530 SDBPNPZ-512G | |
|---|---|---|---|---|---|---|
| Noise | -21% | -20% | -2% | -8% | -5% | |
| off / environment * (dB) | 23.3 | 23.9 -3% | 22.7 3% | 25.4 -9% | 23.7 -2% | 25.4 -9% |
| Idle Minimum * (dB) | 23.3 | 24.2 -4% | 23.2 -0% | 25.5 -9% | 23.7 -2% | 25.4 -9% |
| Idle Average * (dB) | 23.3 | 24.2 -4% | 23.2 -0% | 25.5 -9% | 25.1 -8% | 25.4 -9% |
| Idle Maximum * (dB) | 23.3 | 24.2 -4% | 27.2 -17% | 25.5 -9% | 25.1 -8% | 25.4 -9% |
| Load Average * (dB) | 24 | 50.2 -109% | 43.2 -80% | 28.3 -18% | 38.4 -60% | 25.4 -6% |
| Witcher 3 ultra * (dB) | 35.6 | 47 -32% | 52.8 -48% | 35 2% | 38.4 -8% | 41.3 -16% |
| Load Maximum * (dB) | 55.8 | 51.7 7% | 52.8 5% | 35 37% | 39.4 29% | 41.3 26% |
* ... smaller is better
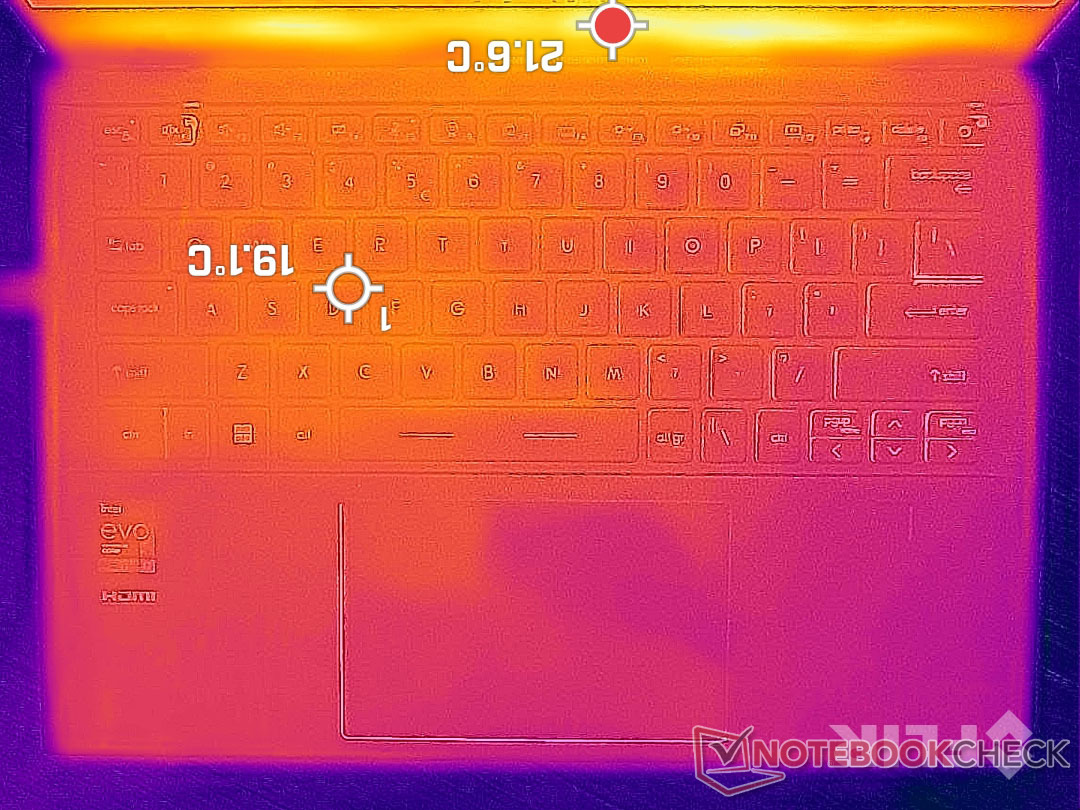
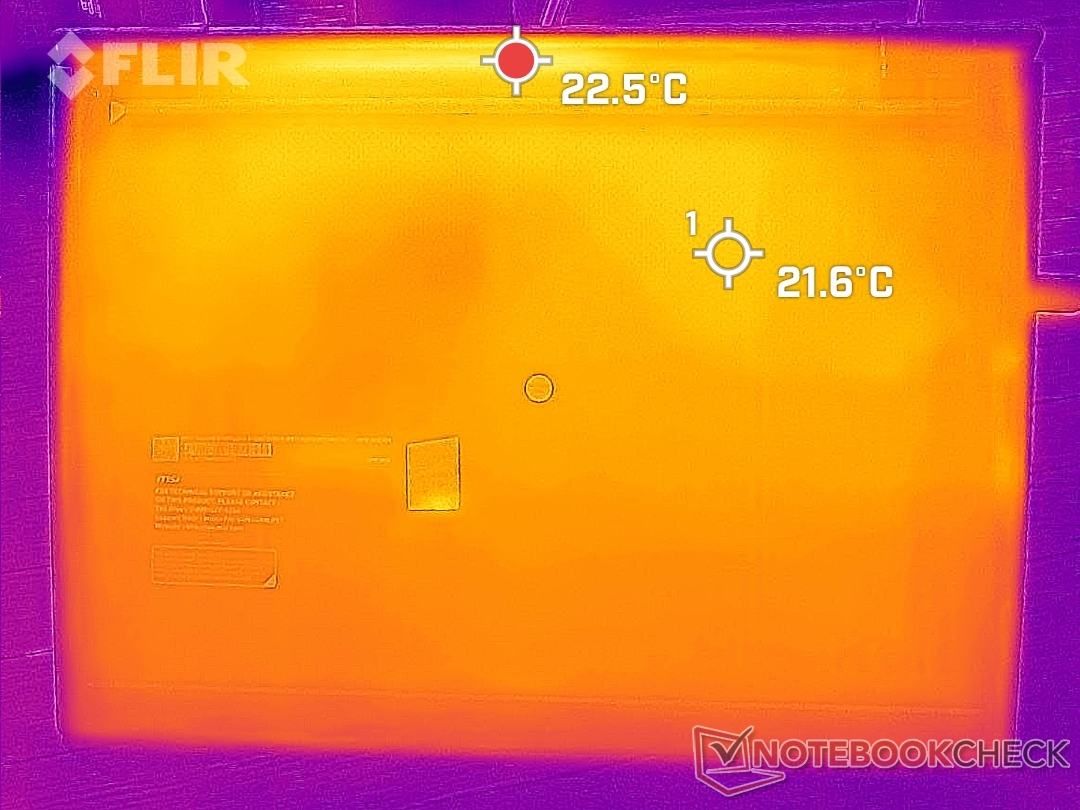
温度
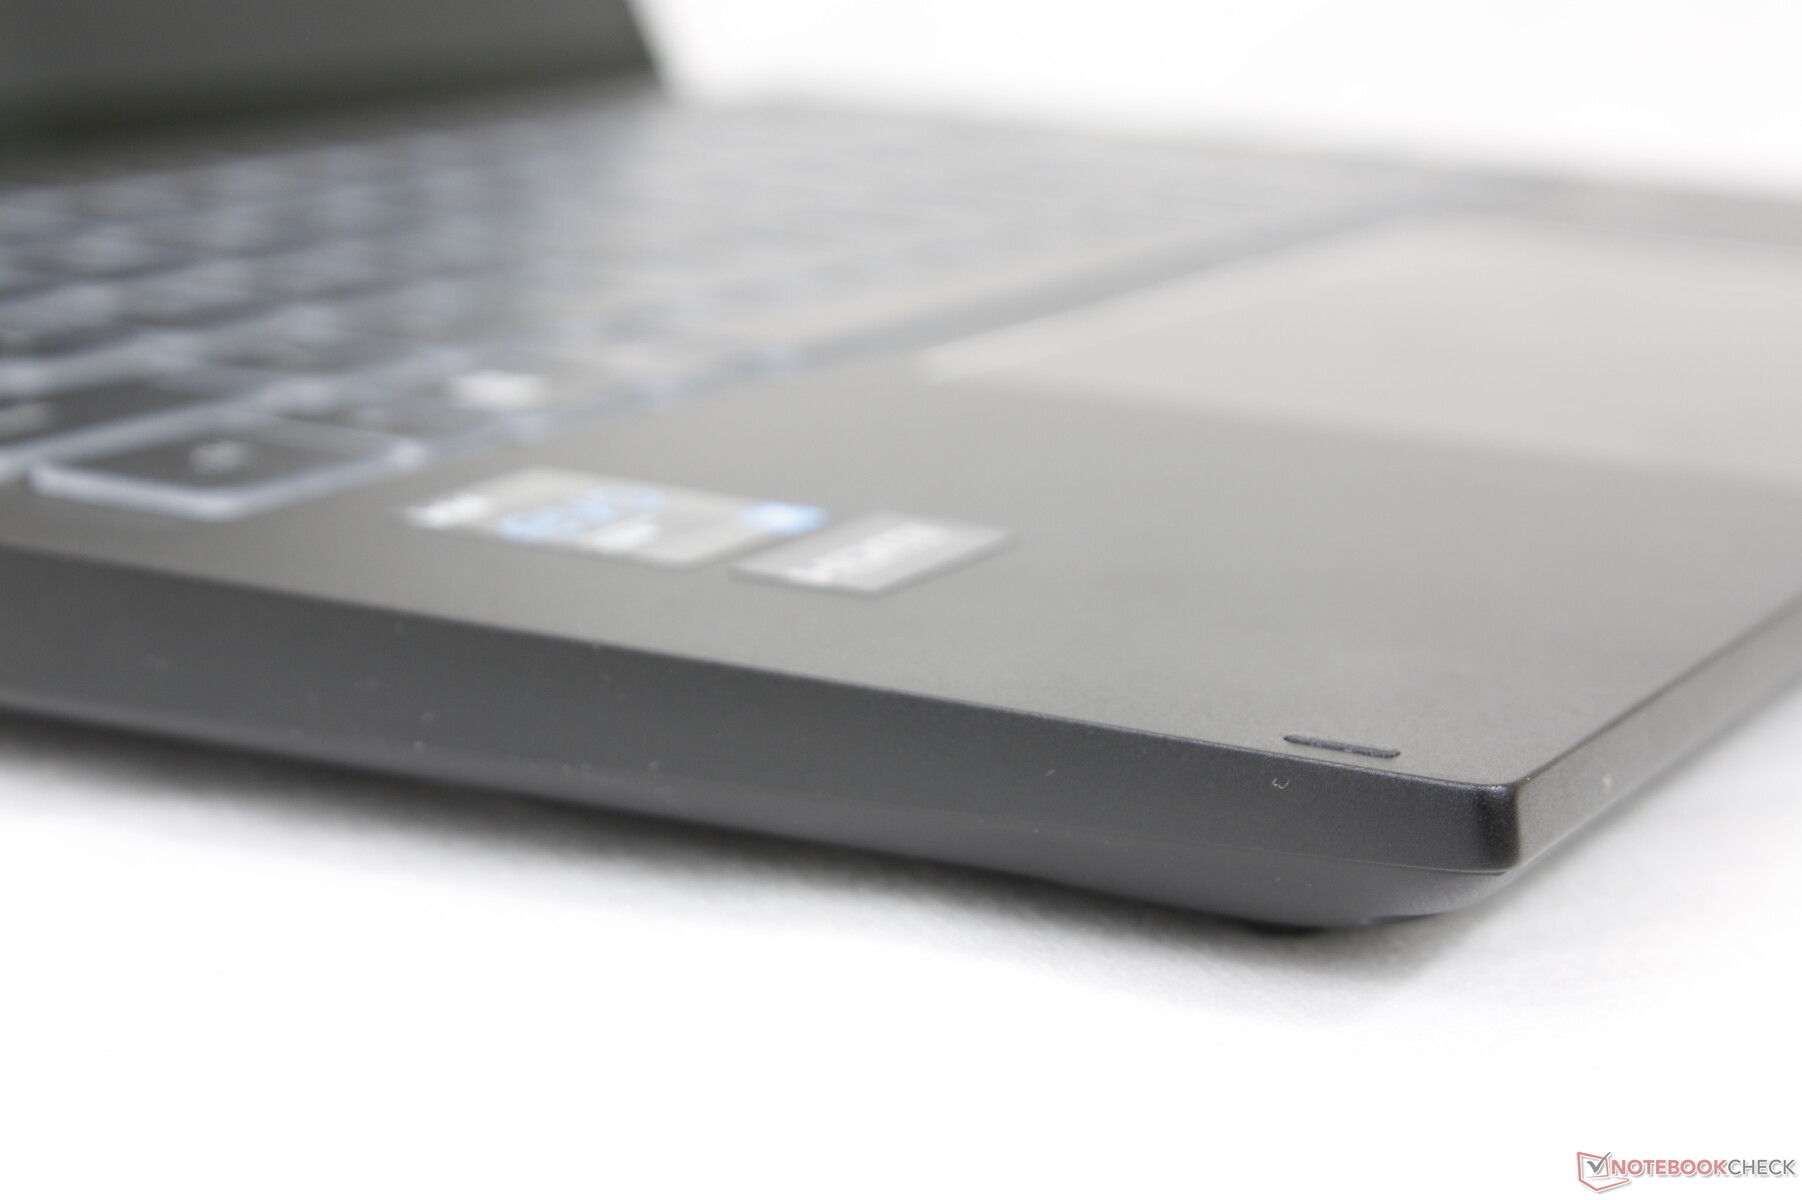
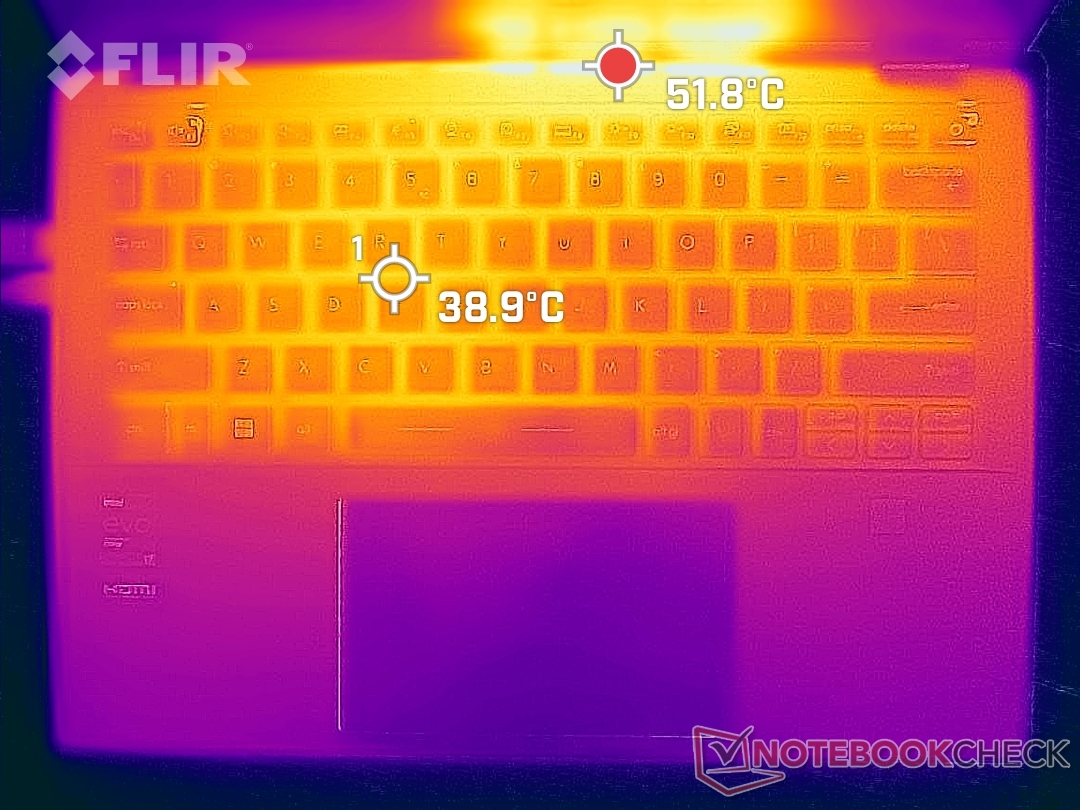
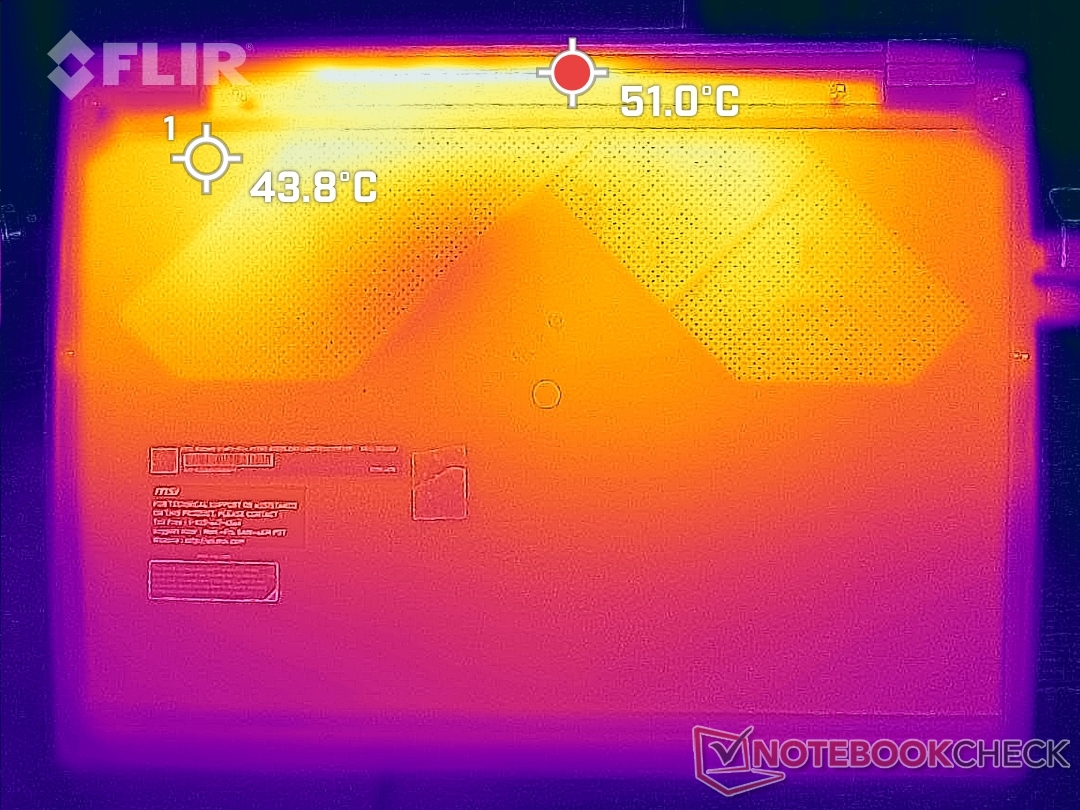
闲置或浏览网页时的表面温度保持舒适,有时甚至触摸起来很凉,因为机箱的大部分是金属。然而,当运行游戏等要求更高的负载时,顶部和底部的热点可能会在通风栅栏附近变得高达52℃。掌托也会变得更热,达到27摄氏度,在手掌上很明显。类似的结果也可以在金属包层上观察到。戴尔Latitude 9420 2合1因此,微星的表面温度非常高并不罕见。
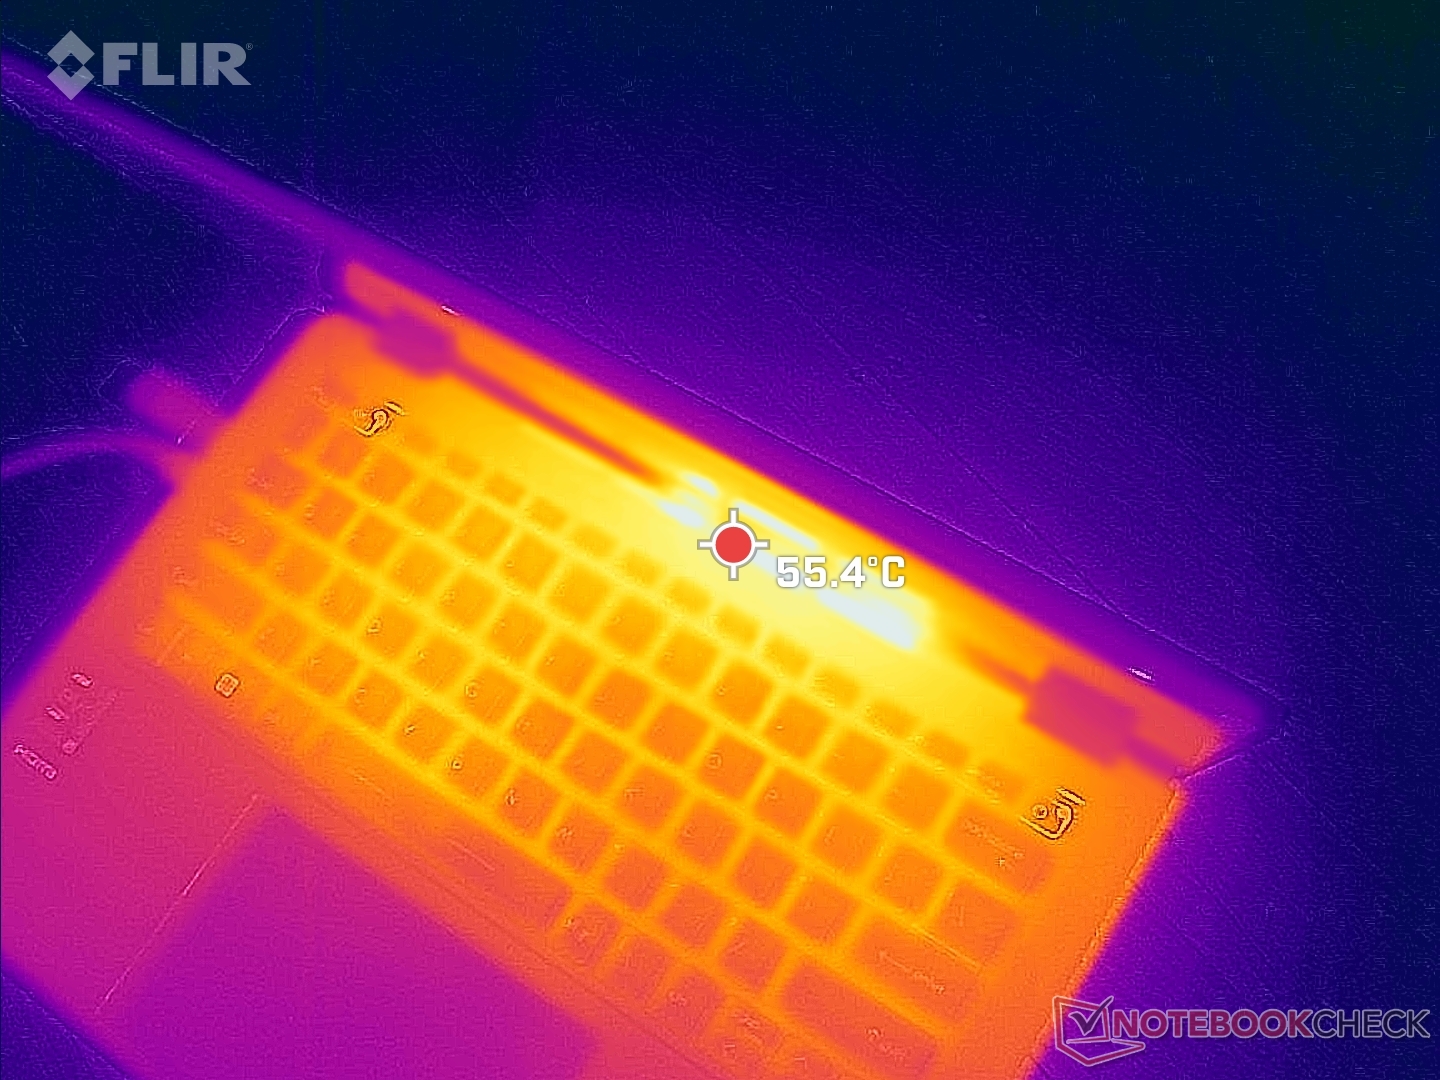
(±) The maximum temperature on the upper side is 44.2 °C / 112 F, compared to the average of 35.4 °C / 96 F, ranging from 19.6 to 60 °C for the class Convertible.
(-) The bottom heats up to a maximum of 45.8 °C / 114 F, compared to the average of 36.9 °C / 98 F
(+) In idle usage, the average temperature for the upper side is 19.2 °C / 67 F, compared to the device average of 30.3 °C / 87 F.
(+) The palmrests and touchpad are cooler than skin temperature with a maximum of 27.2 °C / 81 F and are therefore cool to the touch.
(±) The average temperature of the palmrest area of similar devices was 28 °C / 82.4 F (+0.8 °C / 1.4 F).
| MSI Summit E14 Flip Evo A12MT Intel Core i7-1260P, Intel Iris Xe Graphics G7 96EUs | MSI Summit E14 A11SCS Intel Core i7-1185G7, NVIDIA GeForce GTX 1650 Ti Max-Q | Asus VivoBook S 14X S5402Z Intel Core i7-12700H, Intel Iris Xe Graphics G7 96EUs | LG Gram 14T90P Intel Core i5-1135G7, Intel Iris Xe Graphics G7 80EUs | Lenovo Yoga Slim 7i Pro 14IAP G7 Intel Core i5-1240P, Intel Iris Xe Graphics G7 80EUs | Dell Latitude 9420 2-in-1 Intel Core i7-1185G7, Intel Iris Xe Graphics G7 96EUs | |
|---|---|---|---|---|---|---|
| Heat | -43% | -17% | -4% | -20% | -21% | |
| Maximum Upper Side * (°C) | 44.2 | 49.4 -12% | 37.2 16% | 41.6 6% | 42.3 4% | 43.4 2% |
| Maximum Bottom * (°C) | 45.8 | 60.6 -32% | 39.2 14% | 46.2 -1% | 52.8 -15% | 48 -5% |
| Idle Upper Side * (°C) | 19.6 | 30.6 -56% | 30.4 -55% | 22.6 -15% | 27.1 -38% | 29.8 -52% |
| Idle Bottom * (°C) | 22 | 37.4 -70% | 31.6 -44% | 23.2 -5% | 29.1 -32% | 28 -27% |
* ... smaller is better
压力测试--核心温度过高
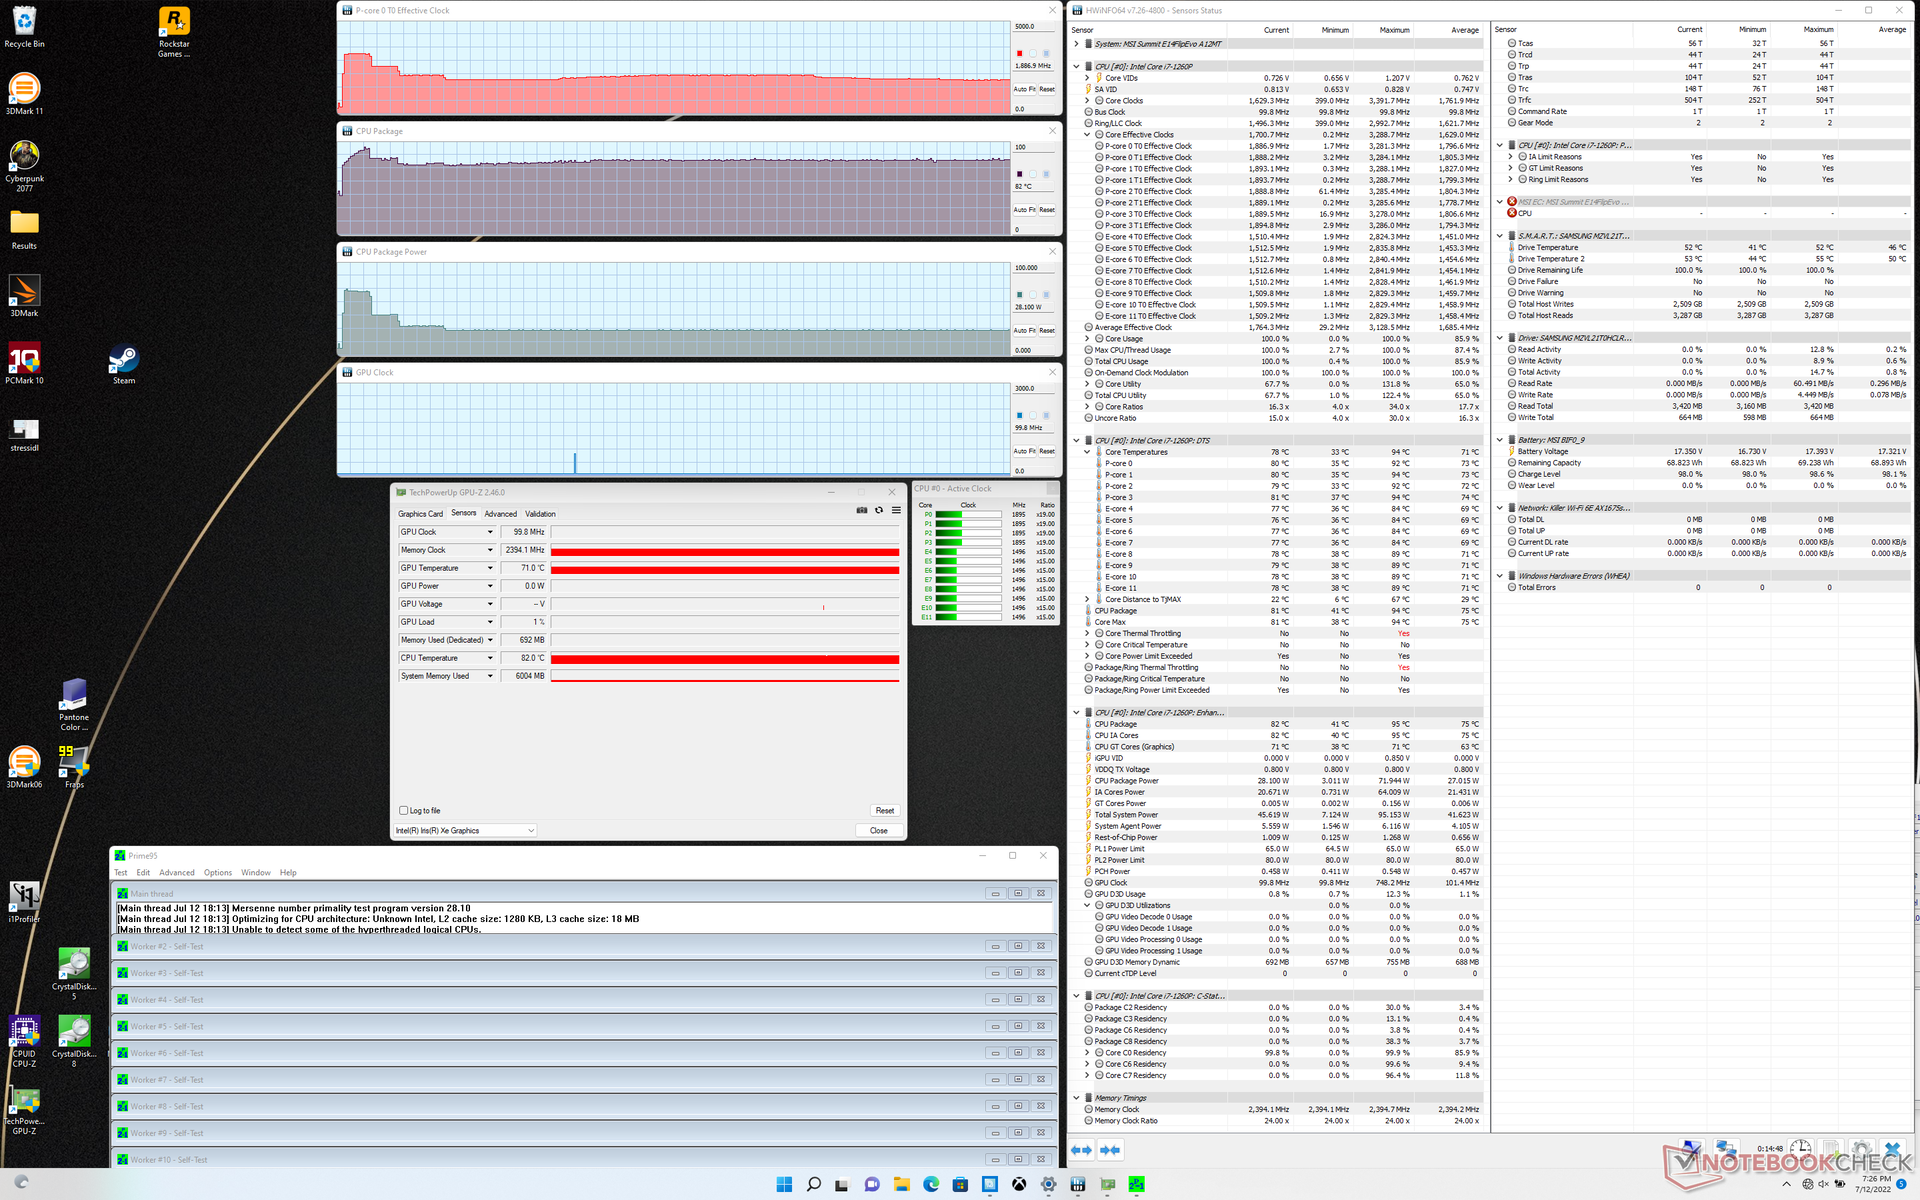
当运行Prime95时,CPU时钟速率会在一分钟内提升到3.3GHz,然后达到95C的核心温度。此后,时钟速率会下降到2.6GHz,最后下降并稳定在1.9GHz,温度为82C。 瑜伽9 14在Yoga 9 14上运行同样的测试,同样的CPU会导致类似的2.0GHz的稳定时钟速率和28W的CPU功耗,但核心温度会更低,为66C。
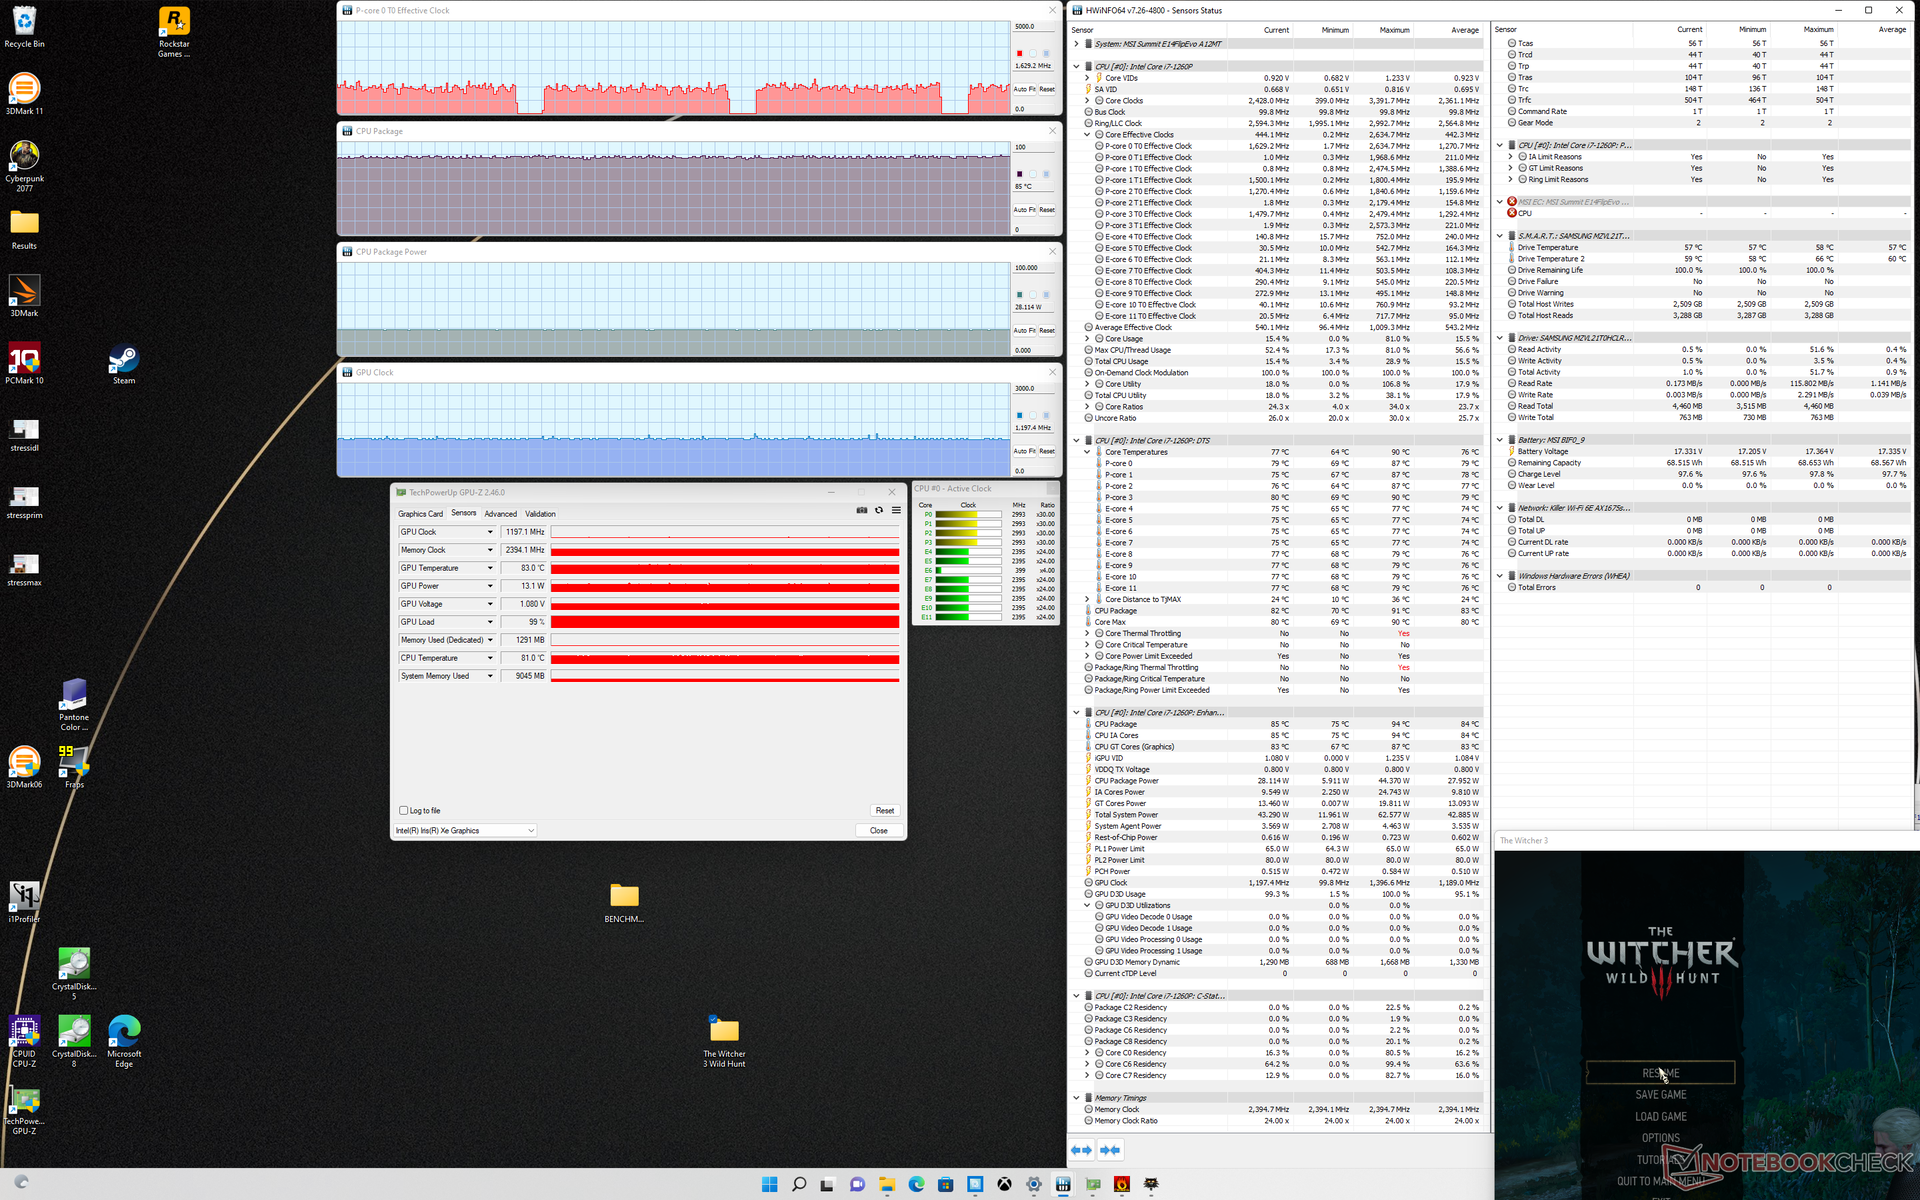
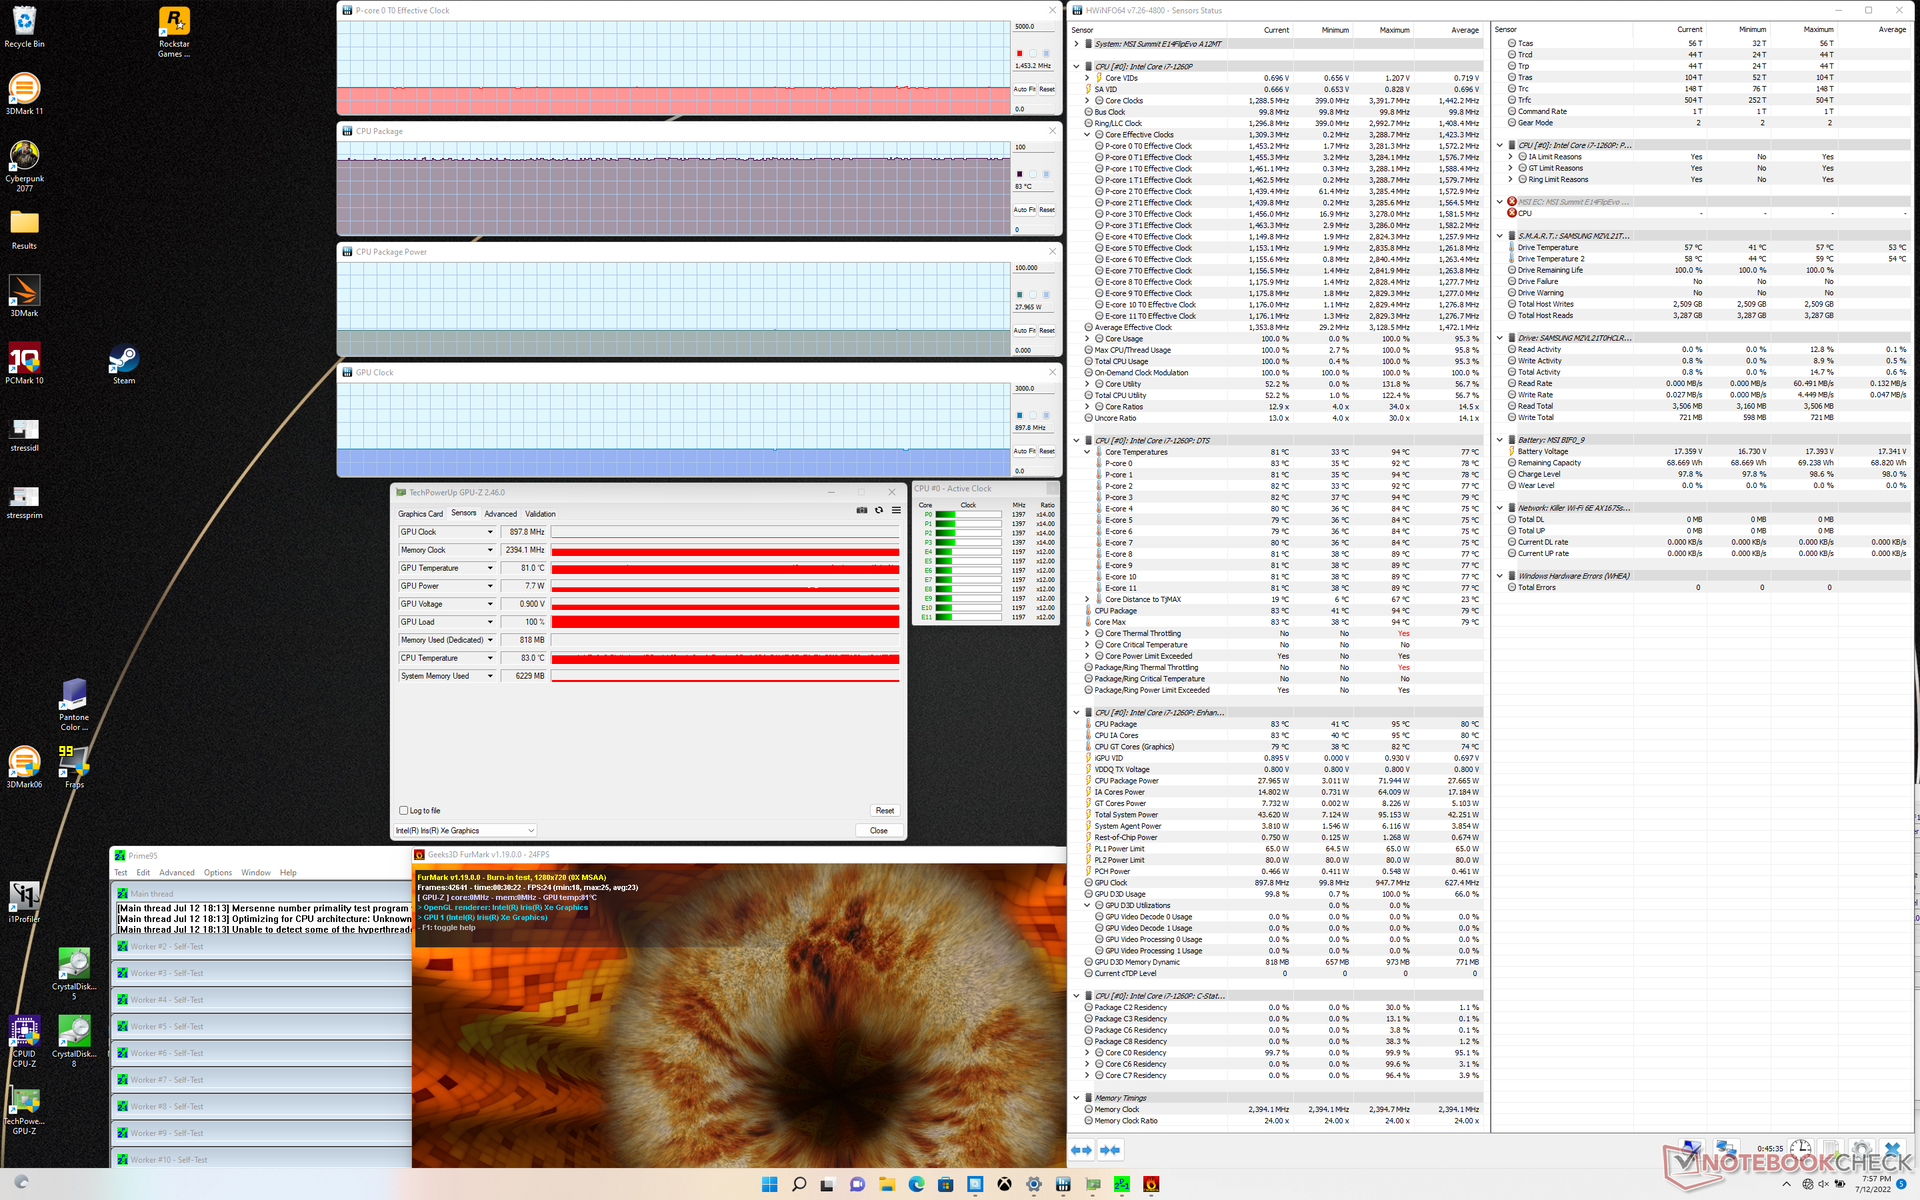
运行 Witcher 3 将导致平均核心温度为85摄氏度,这对于14英寸的可折叠电脑来说是偏高的。用同样的测试在戴尔Latitude 9420 2合1或前面提到的联想,例如,将再次导致较低的核心温度,分别为~73 C和65 C。如果担心温度过高,启用Cooler Boost模式将有助于将温度降低到70℃以下。
用电池供电运行并不限制性能。在电池上进行的3DMark 11测试将返回与主电源类似的分数。
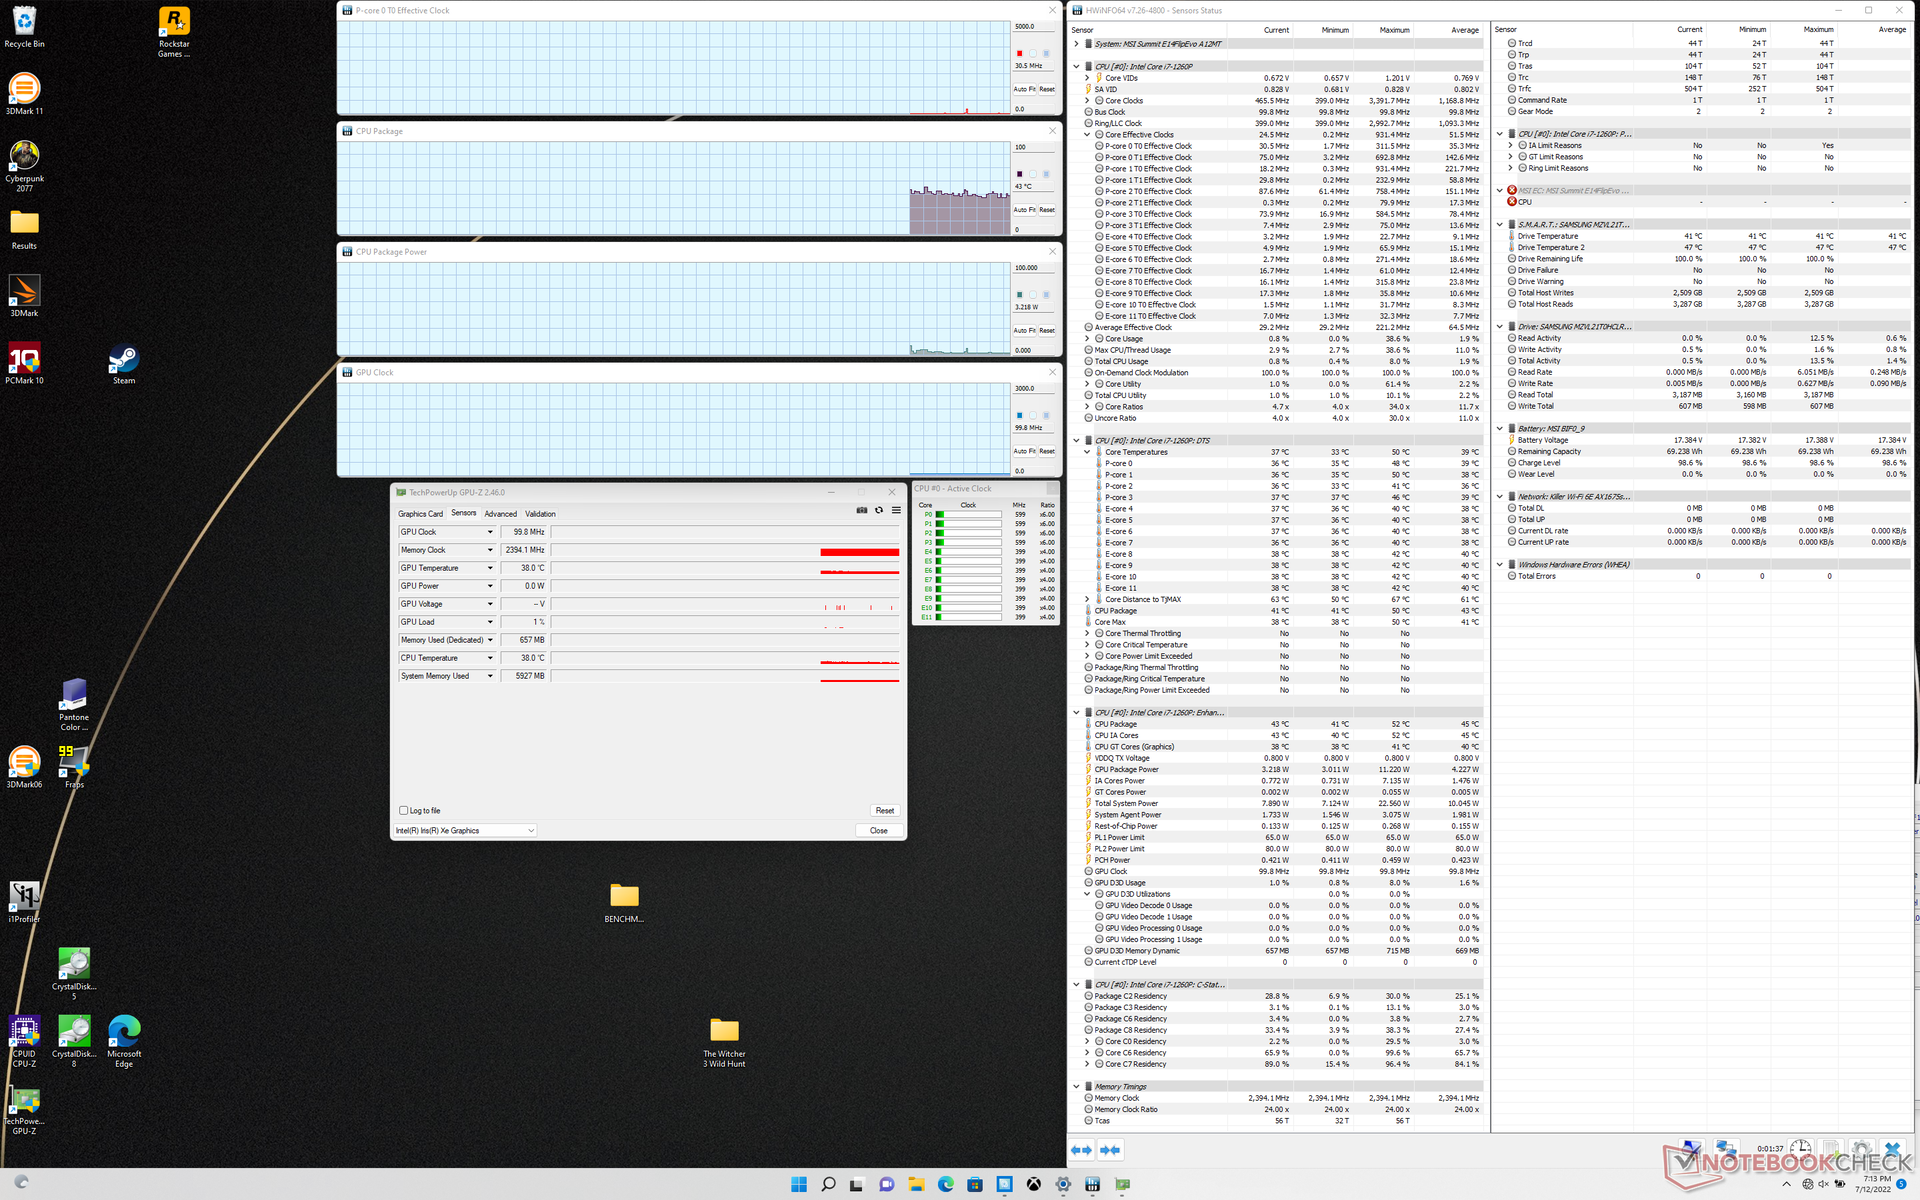
| CPU时钟(GHz) | GPU时钟 (MHz) | 平均CPU温度(°C) | |
| 系统空闲 | -- | -- | 43 |
| Prime95压力 | 1.9 - 2.0 | -- | 82 |
| Prime95 + FurMark 压力 | 1.5 | 898 | 83 |
| Witcher 3 应力 | ~1.6 | 1197 | 85 |
发言人
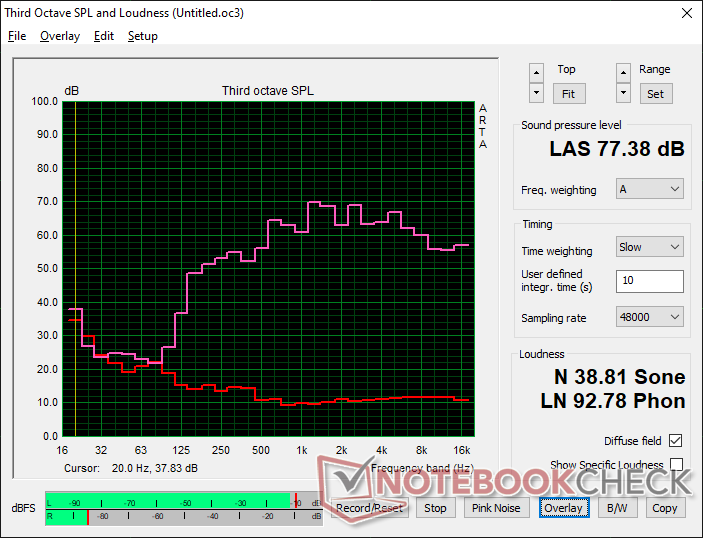
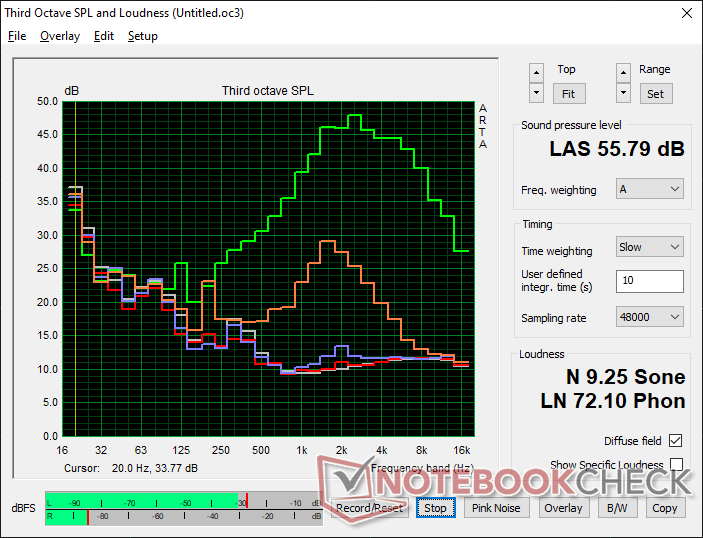
MSI Summit E14 Flip Evo A12MT audio analysis
(±) | speaker loudness is average but good (77.4 dB)
Bass 100 - 315 Hz
(±) | reduced bass - on average 14.7% lower than median
(±) | linearity of bass is average (11.4% delta to prev. frequency)
Mids 400 - 2000 Hz
(±) | higher mids - on average 5.2% higher than median
(±) | linearity of mids is average (8.7% delta to prev. frequency)
Highs 2 - 16 kHz
(+) | balanced highs - only 4.3% away from median
(±) | linearity of highs is average (7.7% delta to prev. frequency)
Overall 100 - 16.000 Hz
(±) | linearity of overall sound is average (17% difference to median)
Compared to same class
» 32% of all tested devices in this class were better, 8% similar, 61% worse
» The best had a delta of 6%, average was 20%, worst was 57%
Compared to all devices tested
» 30% of all tested devices were better, 8% similar, 62% worse
» The best had a delta of 4%, average was 23%, worst was 134%
Apple MacBook Pro 16 2021 M1 Pro audio analysis
(+) | speakers can play relatively loud (84.7 dB)
Bass 100 - 315 Hz
(+) | good bass - only 3.8% away from median
(+) | bass is linear (5.2% delta to prev. frequency)
Mids 400 - 2000 Hz
(+) | balanced mids - only 1.3% away from median
(+) | mids are linear (2.1% delta to prev. frequency)
Highs 2 - 16 kHz
(+) | balanced highs - only 1.9% away from median
(+) | highs are linear (2.7% delta to prev. frequency)
Overall 100 - 16.000 Hz
(+) | overall sound is linear (4.6% difference to median)
Compared to same class
» 0% of all tested devices in this class were better, 0% similar, 100% worse
» The best had a delta of 5%, average was 17%, worst was 45%
Compared to all devices tested
» 0% of all tested devices were better, 0% similar, 100% worse
» The best had a delta of 4%, average was 23%, worst was 134%
能源管理
功耗 - Core-P的要求很高
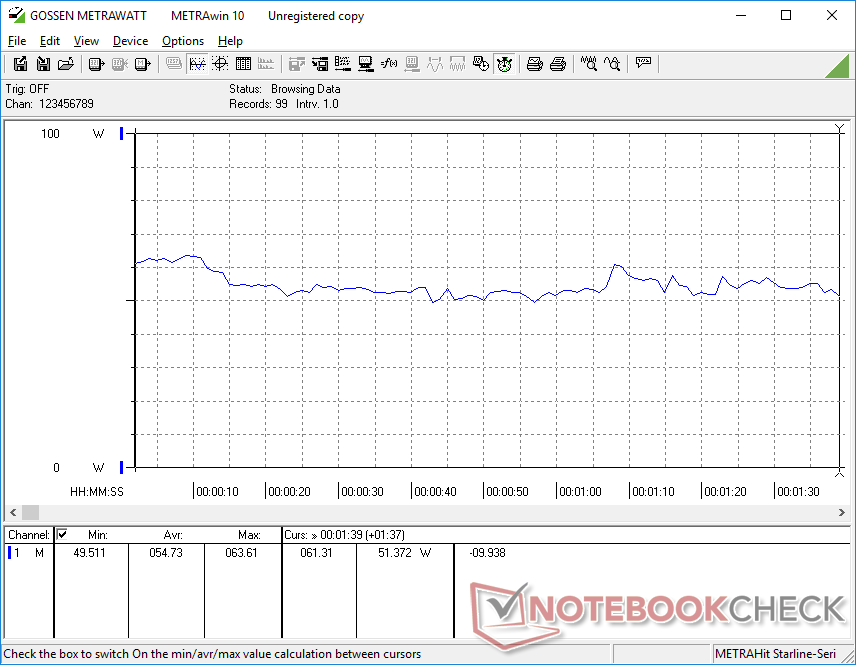
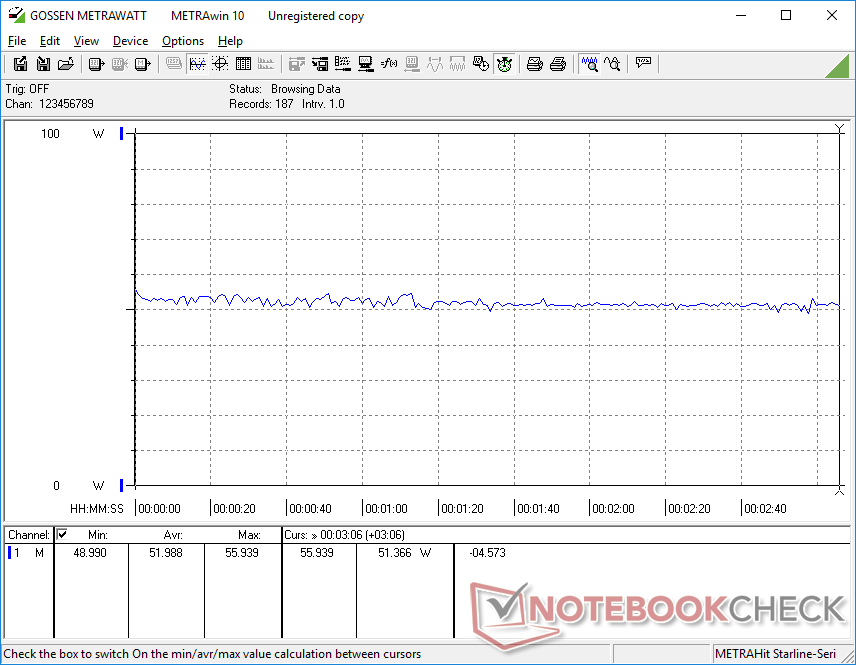
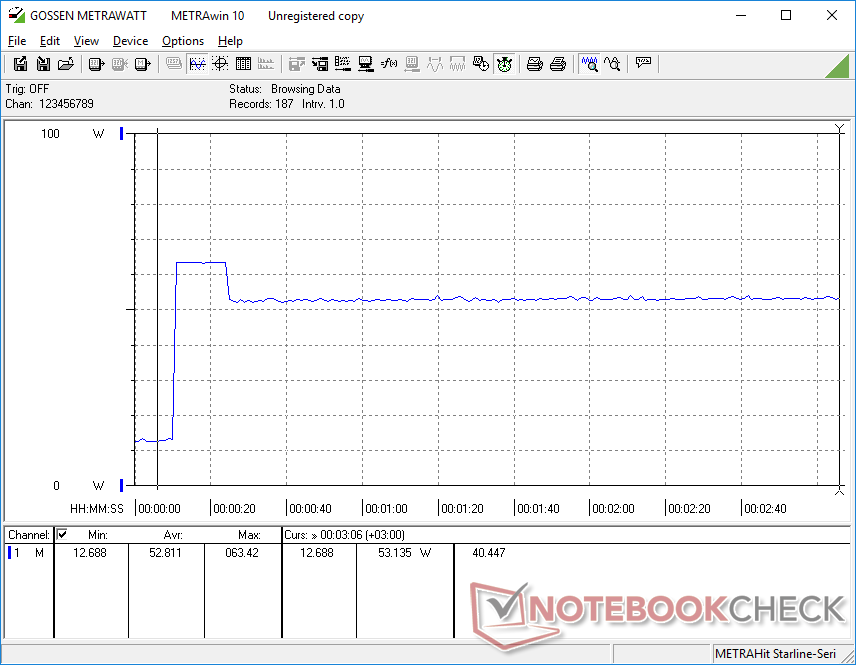
相对于使用第11代英特尔酷睿U系列CPU的系统,如LG Gram 14T90P或戴尔Latitude 9420 2合1,功耗全面提高。运行 Witcher 3或Prime95,例如,与上述戴尔相比,将分别多消耗37%和47%的电力。换句话说,上面提到的CPU和GPU比上一代英特尔CPU的优势是以明显的高功率需求为代价的。
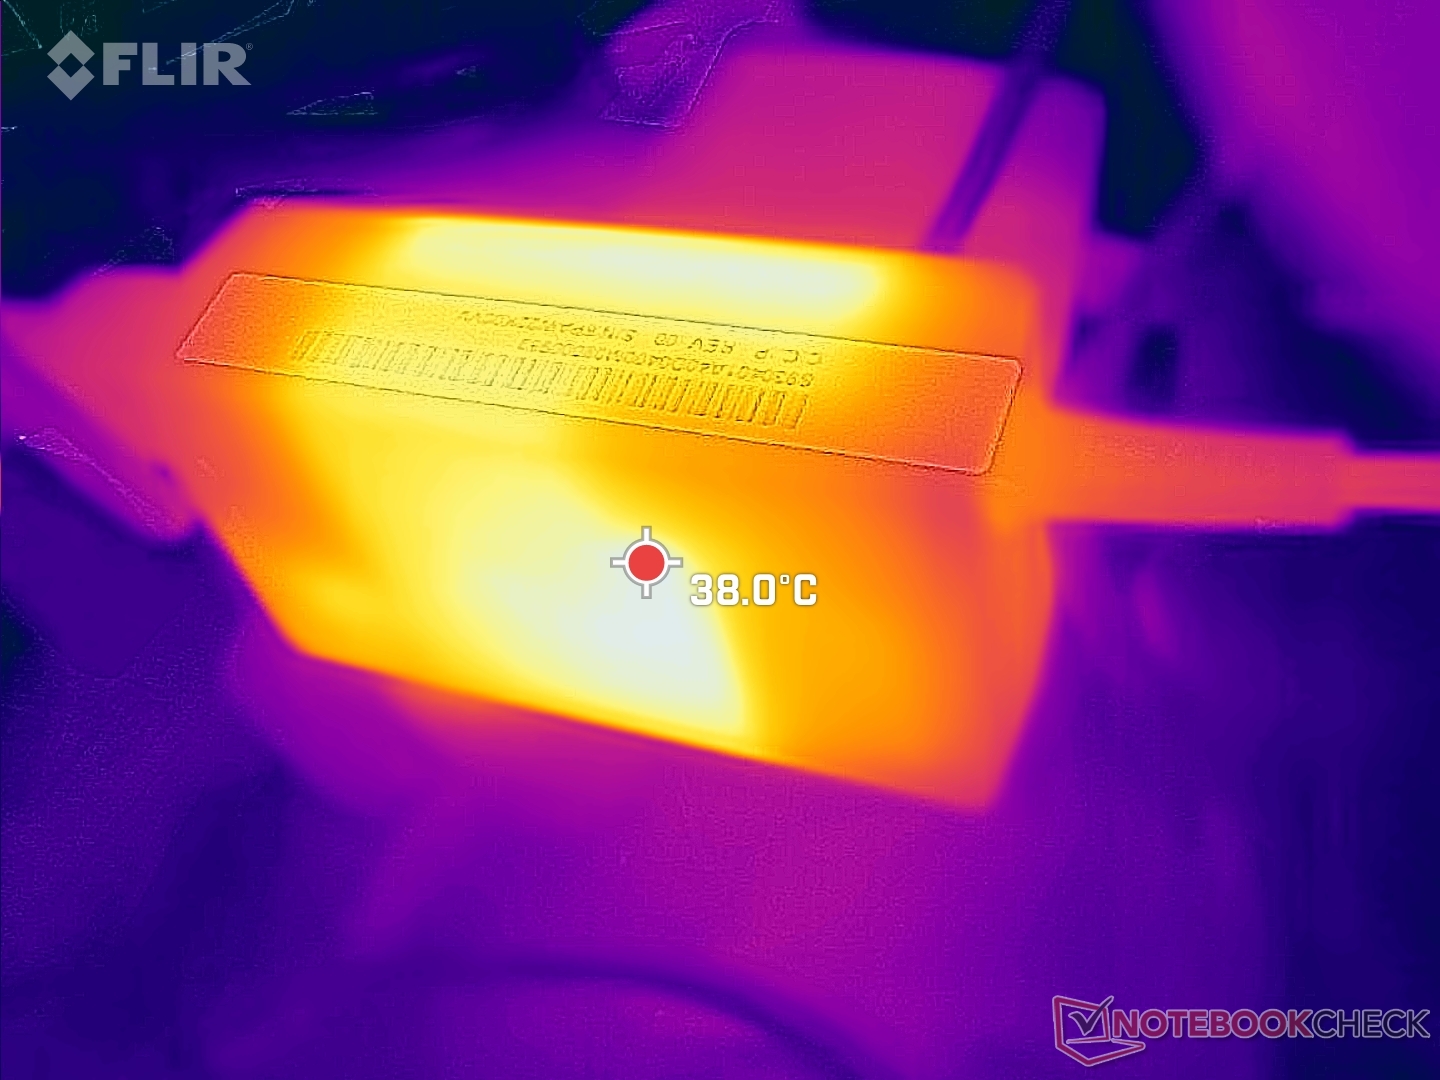
我们能够从小型(约8.8 x 4.9 x 3厘米)的65瓦交流适配器上记录到63.4瓦的最大耗电。当CPU完全受压时,总功耗趋于稳定在53W,只剩下12W的余量。

| Off / Standby | |
| Idle | |
| Load |
|
Key:
min: | |
| MSI Summit E14 Flip Evo A12MT i7-1260P, Iris Xe G7 96EUs, Samsung PM9A1 MZVL21T0HCLR, IPS, 2880x1800, 14" | MSI Summit E14 A11SCS i7-1185G7, GeForce GTX 1650 Ti Max-Q, Phison 1TB SM2801T24GKBB4S-E162, IPS, 3840x2160, 14" | Asus VivoBook S 14X S5402Z i7-12700H, Iris Xe G7 96EUs, Micron 2450 512GB MTFDKBA512TFK, OLED, 2880x1800, 14.5" | LG Gram 14T90P i5-1135G7, Iris Xe G7 80EUs, Samsung SSD PM981a MZVLB512HBJQ, IPS, 1900x1200, 14" | Lenovo Yoga Slim 7i Pro 14IAP G7 i5-1240P, Iris Xe G7 80EUs, Samsung PM9A1 MZVL2512HCJQ, IPS, 2880x1800, 14" | Dell Latitude 9420 2-in-1 i7-1185G7, Iris Xe G7 96EUs, WDC PC SN530 SDBPNPZ-512G, IPS, 2560x1600, 14" | |
|---|---|---|---|---|---|---|
| Power Consumption | -64% | -5% | 31% | 9% | 11% | |
| Idle Minimum * (Watt) | 5.4 | 9.9 -83% | 5.1 6% | 2.8 48% | 5.6 -4% | 4.6 15% |
| Idle Average * (Watt) | 9.5 | 17.4 -83% | 7.7 19% | 5.5 42% | 9.3 2% | 7.8 18% |
| Idle Maximum * (Watt) | 12.4 | 22.5 -81% | 11 11% | 6.4 48% | 9.6 23% | 8.2 34% |
| Load Average * (Watt) | 54.7 | 85.6 -56% | 73.9 -35% | 45.4 17% | 49 10% | 47.9 12% |
| Witcher 3 ultra * (Watt) | 52 | 70.9 -36% | 42.7 18% | 34 35% | 38.2 27% | 38.8 25% |
| Load Maximum * (Watt) | 63.4 | 91.1 -44% | 93 -47% | 65.9 -4% | 65.2 -3% | 87.1 -37% |
* ... smaller is better
Power Consumption Witcher 3 / Stresstest
Power Consumption external Monitor
电池寿命
电池容量与竞争产品华硕VivoBook S 14X或LG Gram 14T90P的70Wh类似。在需要充电之前,用户可以期待超过8小时的真实世界无线网络冲浪。
用附带的适配器从空电到满电只需要不到90分钟,这与大多数超极本相当。第三方的USB-C交流适配器也可以用来给系统充电。
| MSI Summit E14 Flip Evo A12MT i7-1260P, Iris Xe G7 96EUs, 72 Wh | MSI Summit E14 A11SCS i7-1185G7, GeForce GTX 1650 Ti Max-Q, 52 Wh | Asus VivoBook S 14X S5402Z i7-12700H, Iris Xe G7 96EUs, 70 Wh | LG Gram 14T90P i5-1135G7, Iris Xe G7 80EUs, 72 Wh | Lenovo Yoga Slim 7i Pro 14IAP G7 i5-1240P, Iris Xe G7 80EUs, 61 Wh | Dell Latitude 9420 2-in-1 i7-1185G7, Iris Xe G7 96EUs, 60 Wh | |
|---|---|---|---|---|---|---|
| Battery runtime | -54% | -27% | 35% | -21% | 33% | |
| Reader / Idle (h) | 22.1 | 6.6 -70% | 13.1 -41% | 28.7 30% | ||
| WiFi v1.3 (h) | 8.2 | 4.5 -45% | 7.1 -13% | 12.1 48% | 8.6 5% | 11.7 43% |
| Load (h) | 1.9 | 1 -47% | 2.3 21% | 1 -47% | 2.4 26% | |
| H.264 (h) | 10.7 |
Pros
Cons
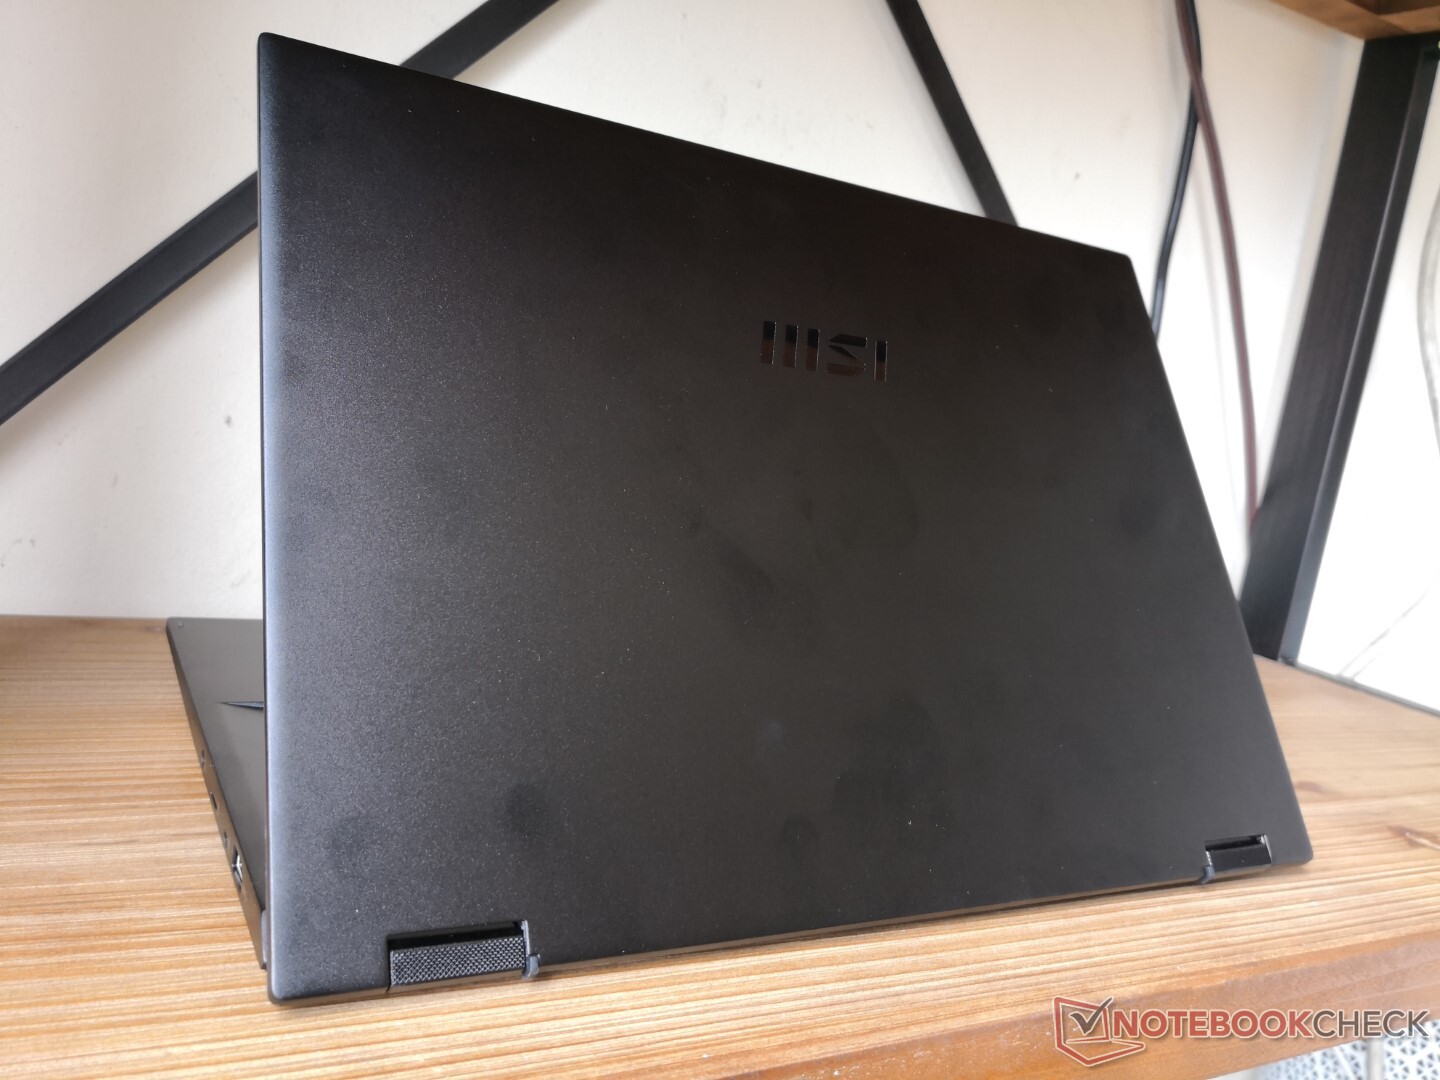
结论 - 迄今为止最好的微星峰会
而不是采取13英寸 峰会E13翻转而不是把13英寸的Summit E13 Flip简单地放大到14英寸,Summit E14 Flip是我们一直在寻找的完整的机箱重新设计。它失去了其较小的兄弟姐妹的一些金色装饰,但在刚性和构建质量方面的收益可以说是值得的,特别是从可靠性优先的专业角度来看。它并不像惠普Spectre系列那样强大。 惠普Spectre只是还没有,但它肯定在接近。
Summit E14 Flip是为那些希望获得可转换副笔记本外形因素的多功能性而又不需要牺牲性能的专业人员和学生准备的。
性能是一流的,没有重大的CPU或GPU的节流,不像在某些 惠普EliteBook蜻蜓型号。同时,显示屏在大多数方面与戴尔、惠普或华硕的其他专业消费型次笔记本的显示屏不相上下。我们希望在未来看到OLED或90+Hz的选择,这似乎是目前的趋势。
缺乏任何广域网选项意味着一些用户仍有理由选择联想ThinkPad、戴尔Latitude ,或惠普Spectre系列的机型。此外,虽然性能很好,机箱也很坚固,但它们也分别导致温度很高,设计较大。选择Summit E14 Flip意味着为那颗快速的CPU牺牲一点便携性。
价格和可用性
亚马逊 有多种配置的库存,从1300美元的Core i5-1240P到1700美元的Core i7-1260P。
MSI Summit E14 Flip Evo A12MT
- 07/15/2022 v7 (old)
Allen Ngo
Price comparison

