Notebook reviews with NVIDIA GeForce MX150 graphics card
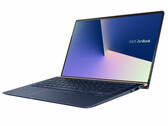
华硕ZenBook 14 UX433FN (Core i7-8565U, MX150, SSD, FHD) 笔记本电脑评测
华硕将强大的硬件整合在了一个时尚小巧的外壳中,令人印象深刻。不幸的是,这一壮举是不能在不妥协的情况下完成的,我们将在本次测评中强调这个问题。 UX433FN与其衍生型号共享其许多功能,我们已经测评过它的IPS屏幕,NVMe SSD,双通道RAM和背光键盘。但可惜的是,华硕也为这款机型配备了亮面屏。
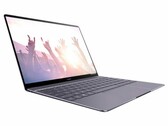
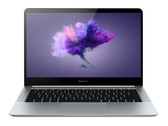
Intel Core i7-8565U, NVIDIA GeForce MX150, 14", 1.2 kg华为Matebook 13 (i7-8565U, GeForce MX150) 笔记本电脑评测
不要让它的小巧尺寸欺骗你——这款3:2 13.0英寸笔记本电脑配备的GPU比典型的超极本强得多。华为的最新产品应该是台中端产品,但其独特的做工和规格绝对不是。
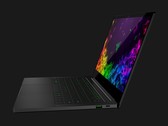
Intel Core i7-8565U, NVIDIA GeForce MX150, 13", 1.3 kg雷蛇灵刃潜行版雷蛇灵刃潜行版(i7-8565U, GeForce MX150)笔记本电脑评测
新的灵刃潜行版证明并非所有GeForce MX150 GPU都生而平等。它是迄今为止性能最强的13.3英寸超极本,在我们测试中,其图形性能与GTX 960M相差无几,但机身却采用了时尚的类MacBook Pro 13尺寸。
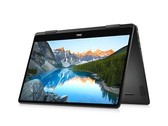
Intel Core i7-8565U, NVIDIA GeForce MX150, 13.3", 1.3 kg戴尔灵越15翻转本 Black Edition(i7-8565U,MX150)二合一笔记本评测
灵越15 7000二合一黑色版采用时尚的金属结构和极具吸引力的屏幕,缩小了与XPS系列的差距。凭借其酷睿 i7 CPU,GeForce MX150独立显卡,固态硬盘和UHD屏幕,这款1,333美元(9000元人民币)的设备可以重新定义这个品牌吗?
Intel Core i7-8565U, NVIDIA GeForce MX150, 15.6", 2.1 kg荣耀Magicbook (英特尔 i5-8250U版 对比 AMD Ryzen 5 2500U版)笔记本电脑评测
荣耀作为一个手机厂商在欧洲已经立足有段时间了,而华为也在最近发布了自己的笔记本电脑,只不过目前仅在亚洲市场上市。我们手里拿到了两台不同配置的荣耀Magicbook,他们分别采用了英特尔和AMD的处理器。
Intel Core i5-8250U, NVIDIA GeForce MX150, 14", 1.4 kgHP Envy 13-ad006ng: Intel Core i7-7500U, 13.30", 1.3 kg
Review » 惠普 Envy 13-ad006ng (i7-7500U, MX150) 笔记本电脑简短评测
Lenovo ThinkPad T480-20L6S01V00: Intel Core i7-8550U, 14.00", 1.8 kg
External Review » Lenovo ThinkPad T480-20L6S01V00
Lenovo Thinkpad T480-20L5000BMH: Intel Core i7-8550U, 15.00", 1.7 kg
External Review » Lenovo Thinkpad T480-20L5000BMH
Medion Akoya P6685-MD61087: Intel Core i7-8550U, 15.60", 2.1 kg
External Review » Medion Akoya P6685-MD61087
HP Pavilion 15-cs1960nd: Intel Core i5-8265U, 15.60", 1.9 kg
External Review » HP Pavilion 15-cs1960nd
Lenovo Ideapad S530-13IWL-81J700ARSP: Intel Core i5-8265U, 13.30", 1.3 kg
External Review » Lenovo Ideapad S530-13IWL-81J700ARSP
HP Pavilion 15-cs2060tx: Intel Core i5-8265U, 15.60", 1.9 kg
External Review » HP Pavilion 15-cs2060tx
Medion Akoya P6687-MD61007: Intel Core i7-8550U, 15.60", 2.5 kg
External Review » Medion Akoya P6687-MD61007
Huawei MateBook D 15-53010BAJ : Intel Core i5-8250U, 15.60", 1.8 kg
External Review » Huawei MateBook D 53010BAJ
Asus ZenBook RX533FN-A8059T: Intel Core i7-8565U, 15.60", 1.6 kg
External Review » Asus ZenBook RX533FN-A8059T
Asus VivoBook S15 S532FA-BN012T: Intel Core i5-8265U, 15.60", 1.8 kg
External Review » Asus VivoBook S15 S532FA-BN012T
Dell Latitude 15 5501-DJM4N: Intel Core i5-9400H, 15.60", 1.8 kg
External Review » Dell Latitude 15 5501-DJM4N
Lenovo IdeaPad 530S-15IKB-81EV003XRU: Intel Core i5-8250U, 15.60", 1.7 kg
External Review » Lenovo IdeaPad 530S-15IKB-81EV003XRU
Medion Akoya P6685-30025457: Intel Core i5-8250U, 15.60", 2.1 kg
External Review » Medion Akoya P6685-30025457
Asus ZenBook 14 UX433FN-A6096T: Intel Core i7-8565U, 14.00", 1.3 kg
External Review » Asus ZenBook 14 UX433FN-A6096T
HP Pavilion 14-ce0014ns: Intel Core i7-8550U, 14.00", 1.6 kg
External Review » HP Pavilion 14-ce0014ns
MSI PS42 8RB-206NL: Intel Core i7-8550U, 14.00", 1.2 kg
External Review » MSI PS42 8RB-206NL
Lenovo IdeaPad 530S-15IKB 81EV00DQMH: Intel Core i5-8250U, 15.60", 1.7 kg
External Review » Lenovo IdeaPad 530S-15IKB 81EV00DQMH
Honor MagicBook VLT-W50: Intel Core i5-8250U, 14.00", 1.5 kg
External Review » Honor MagicBook VLT-W50
Asus ZenBook S13 UX392FN-AB006T: Intel Core i7-8565U, 13.90", 1.1 kg
External Review » Asus ZenBook S13 UX392FN-AB006T
MSI PS42 8RB-606XES: Intel Core i7-8550U, 14.00", 1.2 kg
External Review » MSI PS42 8RB-606XES
HP Envy 13-ah0006ns: Intel Core i7-8550U, 13.30", 1.3 kg
External Review » HP Envy 13-ah0006ns
Dell Inspiron 15 5584, i5-8265U: Intel Core i5-8265U, 15.60", 2 kg
External Review » Dell Inspiron 15 5584, i5-8265U
Huawei MateBook D 14-53010CQK: Intel Core i7-8550U, 14.00", 1.5 kg
External Review » Huawei MateBook D 14-53010CQK
Asus VivoBook S14 S430FN-EB032T: Intel Core i5-8265U, 14.00", 1.4 kg
External Review » Asus VivoBook S14 S430FN-EB032T
Asus Vivobook A510UN-EJ521T: Intel Core i7-8550U, 15.60", 1.7 kg
External Review » Asus Vivobook A510UN-EJ521T
Asus ZenBook S13 UX392FN-AB006R: Intel Core i7-8565U, 13.90", 1.1 kg
External Review » Asus ZenBook S13 UX392FN-AB006R
Acer Swift 3 SF314-56G-78GZ: Intel Core i7-8565U, 14.00", 1.6 kg
External Review » Acer Swift 3 SF314-56G-78GZ
HP Spectre x360 15-df0000: Intel Core i7-8565U, 15.60", 2.2 kg
External Review » HP Spectre x360 15-df0000
Acer Swift 3 SF315-52G-54DA: Intel Core i5-8250U, 15.60", 1.7 kg
External Review » Acer Swift 3 SF315-52G-54DA
Acer Switch 7 BE SW713-51GNP-81DA: Intel Core i7-8550U, 13.50", 1.2 kg
External Review » Acer Switch 7 BE SW713-51GNP-81DA
Medion Akoya P6645-MD63260: Intel Core i5-8265U, 15.60", 1.8 kg
External Review » Medion Akoya P6645-MD63260
Acer Aspire 5 A517-51-508X: Intel Core i5-8250U, 17.30", 3 kg
External Review » Acer Aspire 5 A517-51-508X
HP Envy 17-bw0001ng: Intel Core i5-8250U, 17.30", 2.9 kg
External Review » HP Envy 17-bw0001ng
Acer Swift 3 SF314-56G: Intel Core i5-8265U, 14.00", 1.5 kg
External Review » Acer Swift 3 SF314-56G
Asus ZenBook 14 UX431FN: Intel Core i5-8265U, 14.00", 1.4 kg
External Review » Asus ZenBook 14 UX431FN
HP Spectre x360 15 (OLED 2019): Intel Core i7-8750H, 15.60", 2.2 kg
External Review » HP Spectre x360 15 (OLED 2019)
Acer Aspire A515-51G-34TP: Intel Core i5-8265U, 15.60", 1.8 kg
External Review » Acer Aspire A515-51G-34TP
Asus Zenbook 13 UX333FN-A4015T: Intel Core i5-8265U, 13.30", 1.2 kg
External Review » Asus Zenbook 13 UX333FN-A4015T
Asus ZenBook S13 UX392FN: Intel Core i7-8565U, 13.90", 1.1 kg
External Review » Asus ZenBook S13 UX392FN
Acer Aspire 5 A515-52G-58S9: Intel Core i5-8265U, 15.60", 1.8 kg
External Review » Acer Aspire 5 A515-52G-58S9
HP Envy 13-ah1000ns: Intel Core i5-8265U, 13.30", 1.3 kg
External Review » HP Envy 13-ah1000ns
Acer Switch 7 SW713-51GNP-89JD: Intel Core i7-8550U, 13.50", 1.6 kg
External Review » Acer Switch 7 SW713-51GNP-89JD
Huawei MateBook 13 i7: Intel Core i7-8565U, 13.00", 1.3 kg
External Review » Huawei MateBook 13 i7
HP Pavilion 14-CE0000NS: Intel Core i7-8550U, 14.00", 1.7 kg
External Review » HP Pavilion 14-CE0000NS
Asus ZenBook 14 UX433FN-A5104T: Intel Core i7-8565U, 14.00", 1.1 kg
External Review » Asus ZenBook 14 UX433FN-A5104T
Asus VivoBook S15 S530FN-BQ390T: Intel Core i5-8265U, 15.60", 1.8 kg
External Review » Asus VivoBook S15 S530FN-BQ390T
Dell Inspiron 15 7586-2379: Intel Core i7-8565U, 15.60", 2 kg
External Review » Dell Inspiron 15 7586-2379
Honor MagicBook VLT-W60A: Intel Core i7-8550U, 14.00", 1.5 kg
External Review » Honor MagicBook VLT-W60A
MSI PS42 8RB-060: Intel Core i5-8250U, 14.00", 1.2 kg
External Review » MSI PS42 8RB-060
Acer Aspire 5 A515-52G-71LD: Intel Core i7-8565U, 15.60", 2.2 kg
External Review » Acer Aspire 5 A515-52G-71LD
Asus ZenBook 13 UX333FN-A3064T: Intel Core i7-8565U, 13.30", 1.1 kg
External Review » Asus ZenBook 13 UX333FN-A3064T
Dell Inspiron 17 7786-PKCJ3, 2-in-1: Intel Core i7-8565U, 17.30", 2.9 kg
External Review » Dell Inspiron 17 7786-PKCJ3, 2-in-1
Dell Inspiron 15 7580-4CDV1: Intel Core i7-8565U, 15.60", 2.2 kg
External Review » Dell Inspiron 15 7580-4CDV1
Dell Inspiron 15 7572: Intel Core i7-8550U, 15.60", 2 kg
External Review » Dell Inspiron 15 7572
Razer Blade Stealth i7-8565U: Intel Core i7-8565U, 13.30", 1.3 kg
External Review » Razer Blade Stealth i7-8565U
Acer Aspire 5 A515-52G-53PU: Intel Core i5-8265U, 15.60", 1.8 kg
External Review » Acer Aspire 5 A515-52G-53PU
Asus VivoBook S15 S510UN-BQ121T: Intel Core i7-8550U, 15.60", 1.5 kg
External Review » Asus VivoBook S15 S510UN-BQ121T
HP Pavilion 15-cs0960nd: Intel Core i5-8250U, 15.60", 2 kg
External Review » HP Pavilion 15-cs0960nd
Asus ZenBook 14 UX433FN-A6090T: Intel Core i5-8250U, 14.00", 1.1 kg
External Review » Asus ZenBook 14 UX433FN-A6090T
Huawei MateBook 13, i7: Intel Core i7-8565U, 13.30", 1.3 kg
External Review » Huawei MateBook 13, i7
Dell Inspiron 15 7000 2-in-1 Black Edition: Intel Core i7-8565U, 15.60", 2.1 kg
External Review » Dell Inspiron 15 7000 2-in-1 Black Edition
HP ENVY 13-ah0001ns: Intel Core i5-8250U, 13.30", 1.3 kg
External Review » HP ENVY 13-ah0001ns
Huawei MateBook D 15 2018 53010BRU: Intel Core i5-8250U, 15.60", 1.9 kg
External Review » Huawei MateBook D 2018 53010BRU
Lenovo ThinkPad T580-20LAS01H00: Intel Core i7-8550U, 15.60", 2.1 kg
External Review » Lenovo ThinkPad T580-20LAS01H00
Medion Akoya P6685-MD60989: Intel Core i5-8250U, 15.60", 2.1 kg
External Review » Medion Akoya P6685-MD60989
Lenovo Ideapad 720s-14IKBR-81BD003RSP: Intel Core i7-8550U, 14.00", 1.6 kg
External Review » Lenovo Ideapad 720s-14IKBR-81BD003RSP
HP Envy x360 15-cn0101ng: Intel Core i5-8250U, 15.60", 2.2 kg
External Review » HP Envy x360 15-cn0101ng
Medion Akoya P6687-MD61005: Intel Core i5-8250U, 15.60", 2.3 kg
External Review » Medion Akoya P6687-MD61005
HP Pavilion 14-ce0012ns: Intel Core i7-8550U, 14.00", 1.6 kg
External Review » HP Pavilion 14-ce0012ns
HP Envy 13-ah0003ng: Intel Core i7-8550U, 13.30", 1.2 kg
External Review » HP Envy 13-ah0003ng
HP Envy 13-ad015na: Intel Core i7-7500U, 13.30", 1.3 kg
External Review » HP Envy 13-ad015na
HP Envy x360 15-cn0004ng: Intel Core i5-8250U, 15.60", 2.1 kg
External Review » HP Envy x360 15-cn0004ng
Dell Inspiron 15 5580: Intel Core i5-8265U, 15.60", 1.8 kg
External Review » Dell Inspiron 15 5580
Asus VivoBook S15 S530UN-BQ353T: Intel Core i7-8550U, 15.60", 1.8 kg
External Review » Asus VivoBook S15 S530UN-BQ353T
Lenovo IdeaPad 330-15IKBR 81DE00WJMH: Intel Core i5-8250U, 15.60", 2.2 kg
External Review » Lenovo IdeaPad 330-15IKBR 81DE00WJMH
Honor Magicbook: Intel Core i5-8250U, 14.00", 1.4 kg
External Review » Honor Magicbook
Asus ZenBook 14 UX433FN: Intel Core i7-8565U, 14.00", 1.1 kg
External Review » Asus ZenBook 14 UX433FN
Asus Zenbook 13 UX331UN-90NB0GY1-M00230: Intel Core i7-8550U, 13.30", 1.1 kg
External Review » Asus Zenbook 13 UX331UN-90NB0GY1-M00230
Acer Swift 3 SF314-55G: Intel Core i3-8145U, 14.00"
External Review » Acer Swift 3 SF314-55G
MSI Prestige PS42 8RB-059: Intel Core i7-8550U, 14.00", 1.2 kg
External Review » MSI Prestige PS42 8RB-059
MSI PL62 7RC-268XES: Intel Core i5-7300HQ, 15.60", 2.2 kg
External Review » MSI PL62 7RC-268XES
Asus VivoBook S13 S330UN: Intel Core i5-8250U, 13.30", 1.2 kg
External Review » Asus VivoBook S13 S330UN
Acer Swift 3-SF314-54G: Intel Core i5-8250U, 14.00", 1.5 kg
External Review » Acer Swift 3-SF314-54G
HP Pavilion 15-cs0007NS: Intel Core i7-8550U, 15.60", 1.9 kg
External Review » HP Pavilion 15-CS0007NS
MSI PS42 8RB-021ES: Intel Core i7-8550U, 14.00", 1.2 kg
External Review » MSI PS42 8RB-021ES
Lenovo Ideapad 520-15IKBR-81BF0074SP: Intel Core i5-8250U, 15.60", 2.2 kg
External Review » Lenovo Ideapad 520-15IKBR-81BF0074SP
Medion Akoya P6687-MD6100: Intel Core i7-8550U, 15.60", 2.1 kg
External Review » Medion Akoya P6687-MD6100
Asus VivoBook S K510UN-BQ297T : Intel Core i5-8250U, 15.60", 1.7 kg
External Review » Asus VivoBook S K510UN-BQ297T
Acer Swift 3 SF315-52G-8376: Intel Core i7-8550U, 15.60", 1.8 kg
External Review » Acer Swift 3 SF315-52G-8376
Acer Aspire Nitro 5 AN515-31-561Q: Intel Core i5-8250U, 15.60", 2.7 kg
External Review » Acer Aspire Nitro 5 AN515-31-561Q
MSI Prestige PS42 8RB-073: Intel Core i7-8550U, 14.10", 1.2 kg
External Review » MSI Prestige PS42 8RB-073
Lenovo Ideapad 320-15IKBRN-81BG00MNSP: Intel Core i5-8250U, 15.60", 2.2 kg
External Review » Lenovo Ideapad 320-15IKBRN-81BG00MNSP
Acer Swift 3 SF314-52-74JS: Intel Core i7-8550U, 15.60", 2.1 kg
External Review » Acer Swift 3 SF314-52-74JS
Asus VivoBook S15 S510UN-BQ256T: Intel Core i5-8250U, 15.60", 1.7 kg
External Review » Asus VivoBook S15 S510UN-BQ256T
Asus ZenBook Pro 14 UX480FD: Intel Core i7-8550U, 14.00", 1.6 kg
External Review » Asus ZenBook Pro 14 UX480FD
Acer Aspire A615-51G-59EA: Intel Core i5-8250U, 15.60", 2.1 kg
External Review » Acer Aspire A615-51G-59EA
Lenovo Ideapad 530S-15IKB: Intel Core i7-8550U, 15.60", 2 kg
External Review » Lenovo Ideapad 530S-15IKB
Acer Aspire 5 A515-51G-83LX: Intel Core i7-8550U, 15.60", 2.2 kg
External Review » Acer Aspire 5 A515-51G-83LX
Acer Aspire 5 A517-51G-8433: Intel Core i7-8550U, 17.30", 2.9 kg
External Review » Acer Aspire 5 A517-51G-8433
Lenovo ThinkPad T480s-20L8S02E00: Intel Core i7-8550U, 14.00", 1.3 kg
External Review » Lenovo ThinkPad T480s-20L8S02E00
Lenovo IdeaPad 520-15IKB-81BF00CXHV: Intel Core i5-8250U, 15.60", 2.2 kg
External Review » Lenovo IdeaPad 520-15IKB-81BF00CXHV
Huawei Matebook D 15 2018: Intel Core i7-8550U, 15.60", 1.9 kg
External Review » Huawei Matebook D 2018
Lenovo Ideapad 320-15IKBR-80XL03MDSP: Intel Core i7-8550U, 15.60", 2.2 kg
External Review » Lenovo Ideapad 320-15IKBR-80XL03MDSP
HP Envy 13-ad109ns: Intel Core i7-8550U, 13.30", 1.4 kg
External Review » HP Envy 13-ad109ns
Asus Zenbook Flip 14 UX461UN-90NB0GD1-M00980: Intel Core i5-8250U, 14.00", 1.5 kg
External Review » Asus Zenbook Flip 14 UX461UN-90NB0GD1-M00980
Asus ZenBook 13 UX331UN-90NB0GY2-M02590: Intel Core i5-8250U, 13.30", 1.1 kg
External Review » Asus ZenBook 13 UX331UN-90NB0GY2-M02590
Acer Swift 3 SF314-52G-50B3: Intel Core i5-8250U, 14.00", 1.7 kg
External Review » Acer Swift 3 SF314-52G-50B3
MSI PL62 7RC-267XES: Intel Core i5-7300HQ, 15.60", 2.2 kg
External Review » MSI PL62 7RC-267XES
Lenovo Ideapad 320-15IKBRN-81BG00EWSP: Intel Core i5-8250U, 15.60", 2.2 kg
External Review » Lenovo Ideapad 320-15IKBRN-81BG00EWSP
Medion Akoya P6687-MD60882: Intel Core i5-8250U, 15.60", 2.3 kg
External Review » Medion Akoya P6687-MD60882
HP Pavilion 15-ck025nd: Intel Core i5-8250U, 15.60", 1.8 kg
External Review » HP Pavilion 15-ck025nd
Lenovo IdeaPad 720S-14IKB 81BD003YMH: Intel Core i5-8250U, 14.00", 1.6 kg
External Review » Lenovo IdeaPad 720S-14IKB 81BD003YMH
Asus ZenBook 13 UX331UN: Intel Core i7-8550U, 13.30", 1.1 kg
External Review » Asus ZenBook 13 UX331UA
Asus ZenBook UX430UN-GV038T: Intel Core i7-8550U, 14.00", 1.3 kg
External Review » Asus ZenBook UX430UN-GV038T
Asus ZenBook Flip 14 UX461UN-E1033T: Intel Core i7-8550U, 14.00", 1.5 kg
External Review » Asus ZenBook Flip 14 UX461UN-E1033T
Samsung Notebook 9 NP900X5T-X01US : Intel Core i7-8550U, 15.00", 1.3 kg
External Review » Samsung Notebook 9 NP900X5T-X01US
Asus ZenBook UX430UN-GV033T: Intel Core i5-8250U, 14.00", 1.3 kg
External Review » Asus ZenBook UX430UN-GV033T
Asus VivoBook S14 S410UN-EB229T: Intel Core i7-8550U, 14.00", 1.3 kg
External Review » Asus VivoBook S14 S410UN-EB229T
Asus VivoBook S14 S410UN-EB177T: Intel Core i5-8250U, 14.00", 1.4 kg
External Review » Asus VivoBook S14 S410UN-EB177T
Huawei MateBook X Pro, i7: Intel Core i7-8550U, 13.90", 1.3 kg
External Review » Huawei MateBook X Pro, i7
Huawei Matebook X Pro i5: Intel Core i5-8250U, 13.90", 1.3 kg
External Review » Huawei Matebook X Pro, i5
Acer Aspire Nitro 5 AN515-31-59RD: Intel Core i5-8250U, 15.60", 2.7 kg
External Review » Acer Aspire Nitro 5 AN515-31-59RD
Xiaomi Mi Notebook Air 13.3 2018: Intel Core i5-8250U, 13.30", 1.3 kg
External Review » Xiaomi Mi Notebook Air 13.3 2018
MSI GV62 7RC-065PL: Intel Core i5-7300HQ, 15.60", 2.2 kg
External Review » MSI GV62 7RC-065PL
Acer Aspire E5-476G-5319: Intel Core i5-8250U, 14.00", 2.1 kg
External Review » Acer Aspire E5-476G-5319
Acer Aspire 5 A515-51G-59WL: Intel Core i5-8250U, 15.60", 2.2 kg
External Review » Acer Aspire 5 A515-51G-59WL
Acer Aspire E15 E5-576G-5762: Intel Core i5-8250U, 15.60", 2.4 kg
External Review » Acer Aspire E15 E5-576G-5762
Asus Zenbook UX430UN: Intel Core i7-8550U, 14.00", 1.3 kg
External Review » Asus Zenbook UX430UN
Asus VivoBook X405UQ: Intel Core i7-7500U, 14.00", 1.3 kg
External Review » Asus VivoBook X405UQ
Asus VivoBook S14 S410UN-EB123T: Intel Core i5-8250U, 14.00", 1.3 kg
External Review » Asus VivoBook S14 S410UN-EB123T
Asus ZenBook 13 UX331UN: Intel Core i7-8550U, 13.30", 1.1 kg
External Review » Asus ZenBook 13 UX331UN
Asus VivoBook Pro 17 N705UN-GC023T: Intel Core i5-7200U, 17.30", 2.2 kg
External Review » Asus VivoBook Pro 17 N705UN-GC023T
MSI GV62 7RC-225UK: Intel Core i5-7300HQ, 15.60", 2.2 kg
External Review » MSI GV62 7RC-225UK
Dell Inspiron 17-7773-9955: Intel Core i5-8250U, 17.30", 2.9 kg
External Review » Dell Inspiron 17-7773-9955
Dell Inspiron 17-7773-0043: Intel Core i7-8550U, 17.30", 2.9 kg
External Review » Dell Inspiron 17-7773-0043
HP Envy 17-ae120nd: Intel Core i7-8550U, 17.30", 3 kg
External Review » HP Envy 17-ae120nd
HP Pavilion 15-ck094nd: Intel Core i7-8550U, 15.60", 2 kg
External Review » HP Pavilion 15-ck094nd
Acer Aspire 5 A517-51G-80L: Intel Core i7-8550U, 17.30", 2.9 kg
External Review » Acer Aspire 5 A517-51G-80L
HP Spectre x360 15t-bl100: Intel Core i7-8550U, 15.60", 2 kg
External Review » HP Spectre x360 15t-bl100
Lenovo IdeaPad 320-15IKB-81BG000BSB: Intel Core i7-8550U, 15.60", 2.2 kg
External Review » Lenovo IdeaPad 320-15IKB-81BG000BSB
Acer Aspire E5-576G-5755: Intel Core i5-8250U, 15.60", 2.2 kg
External Review » Acer Aspire E5-576G-5755
Acer Aspire 5 A517-51G-582X: Intel Core i5-8250U, 17.30", 3 kg
External Review » Acer Aspire 5 A517-51G-582X
Acer Swift 3 SF315-51G-55Z9: Intel Core i5-7200U, 15.60", 2.1 kg
External Review » Acer Swift 3 SF315-51G-55Z9
HP Envy 13-ad104ns: Intel Core i5-8250U, 13.30", 1.3 kg
External Review » HP Envy 13-ad104ns
Asus VivoBook S15 S510UN, i7 8550U: Intel Core i7-8550U, 15.60", 1.7 kg
External Review » Asus VivoBook S15 S510UN, i7 8550U
Acer Aspire 5 A515-51G-50AC: Intel Core i5-8250U, 15.60", 2.2 kg
External Review » Acer Aspire 5 A515-51G-50AC
HP Envy 13-ad142ng: Intel Core i7-8550U, 13.30", 1.3 kg
External Review » HP Envy 13-ad142ng
Acer Swift 3 SF314-52G-89SL: Intel Core i7-8550U, 14.00", 1.6 kg
External Review » Acer Swift 3 SF314-52G-89SL
Acer Aspire 5 A515-51G-500W: Intel Core i5-8250U, 15.60", 2.2 kg
External Review » Acer Aspire 5 A515-51G-500W
Xiaomi Mi Notebook Pro i7: Intel Core i7-8550U, 15.60", 2 kg
External Review » Xiaomi Mi Notebook Pro i7
Xiaomi Mi Notebook Air 13.3 2017: Intel Core i5-7200U, 13.30", 1.3 kg
External Review » Xiaomi Mi Notebook Air 13.3 (2017)
Xiaomi Mi Notebook Pro i5: Intel Core i5-8250U, 15.60", 2 kg
External Review » Xiaomi Mi Notebook Pro
Acer Swift 3 SF315-51G-57E5: Intel Core i5-8250U, 15.60", 1.9 kg
External Review » Acer Swift 3 SF315-51G-57E5
Acer Swift 3 SF314-52-722E: Intel Core i7-7500U, 14.00", 1.8 kg
External Review » Acer Swift 3 SF314-52-722E
Acer Swift 3 SF314-52-717H: Intel Core i7-7500U, 14.00", 1.8 kg
External Review » Acer Swift 3 SF314-52-717H
Acer Switch 7 BE SW713-51GNP: Intel Core i7-8550U, 13.50", 1.6 kg
External Review » Acer Switch 7 BE SW713-51GNP
Asus ZenBook 13 UX331UN: Intel Core i7-8550U, 13.50", 1.1 kg
External Review » Asus ZenBook 13 UX331UN
Acer Switch 7 Black Edition: Intel Core i7-8550U, 13.50", 1.6 kg
External Review » Acer Switch 7 Black Edition
Acer Swift 3 SF314-52G-5848: Intel Core i5-8250U, 14.00", 1.8 kg
External Review » Acer Swift 3 SF314-52G-5848
Asus ZenBook Flip 14 UX461UN: Intel Core i7-8550U, 14.00", 1.5 kg
External Review » Asus ZenBook Flip 14 UX461UN
MSI PL62 7RC-051XES: Intel Core i7-7700HQ, 15.60", 2.2 kg
External Review » MSI PL62 7RC-051XES
HP Envy 13-ad006ng: Intel Core i7-7500U, 13.30", 1.3 kg
External Review » HP Envy 13-ad006ng
MSI PL62 7RC-001: Intel Core i7-7700HQ, 15.60", 2.2 kg
External Review » MSI PL62 7RC-001