Notebookcheck Logo

NVIDIA RTX A2000 Laptop GPU

NVIDIA RTX A2000 Laptop GPU

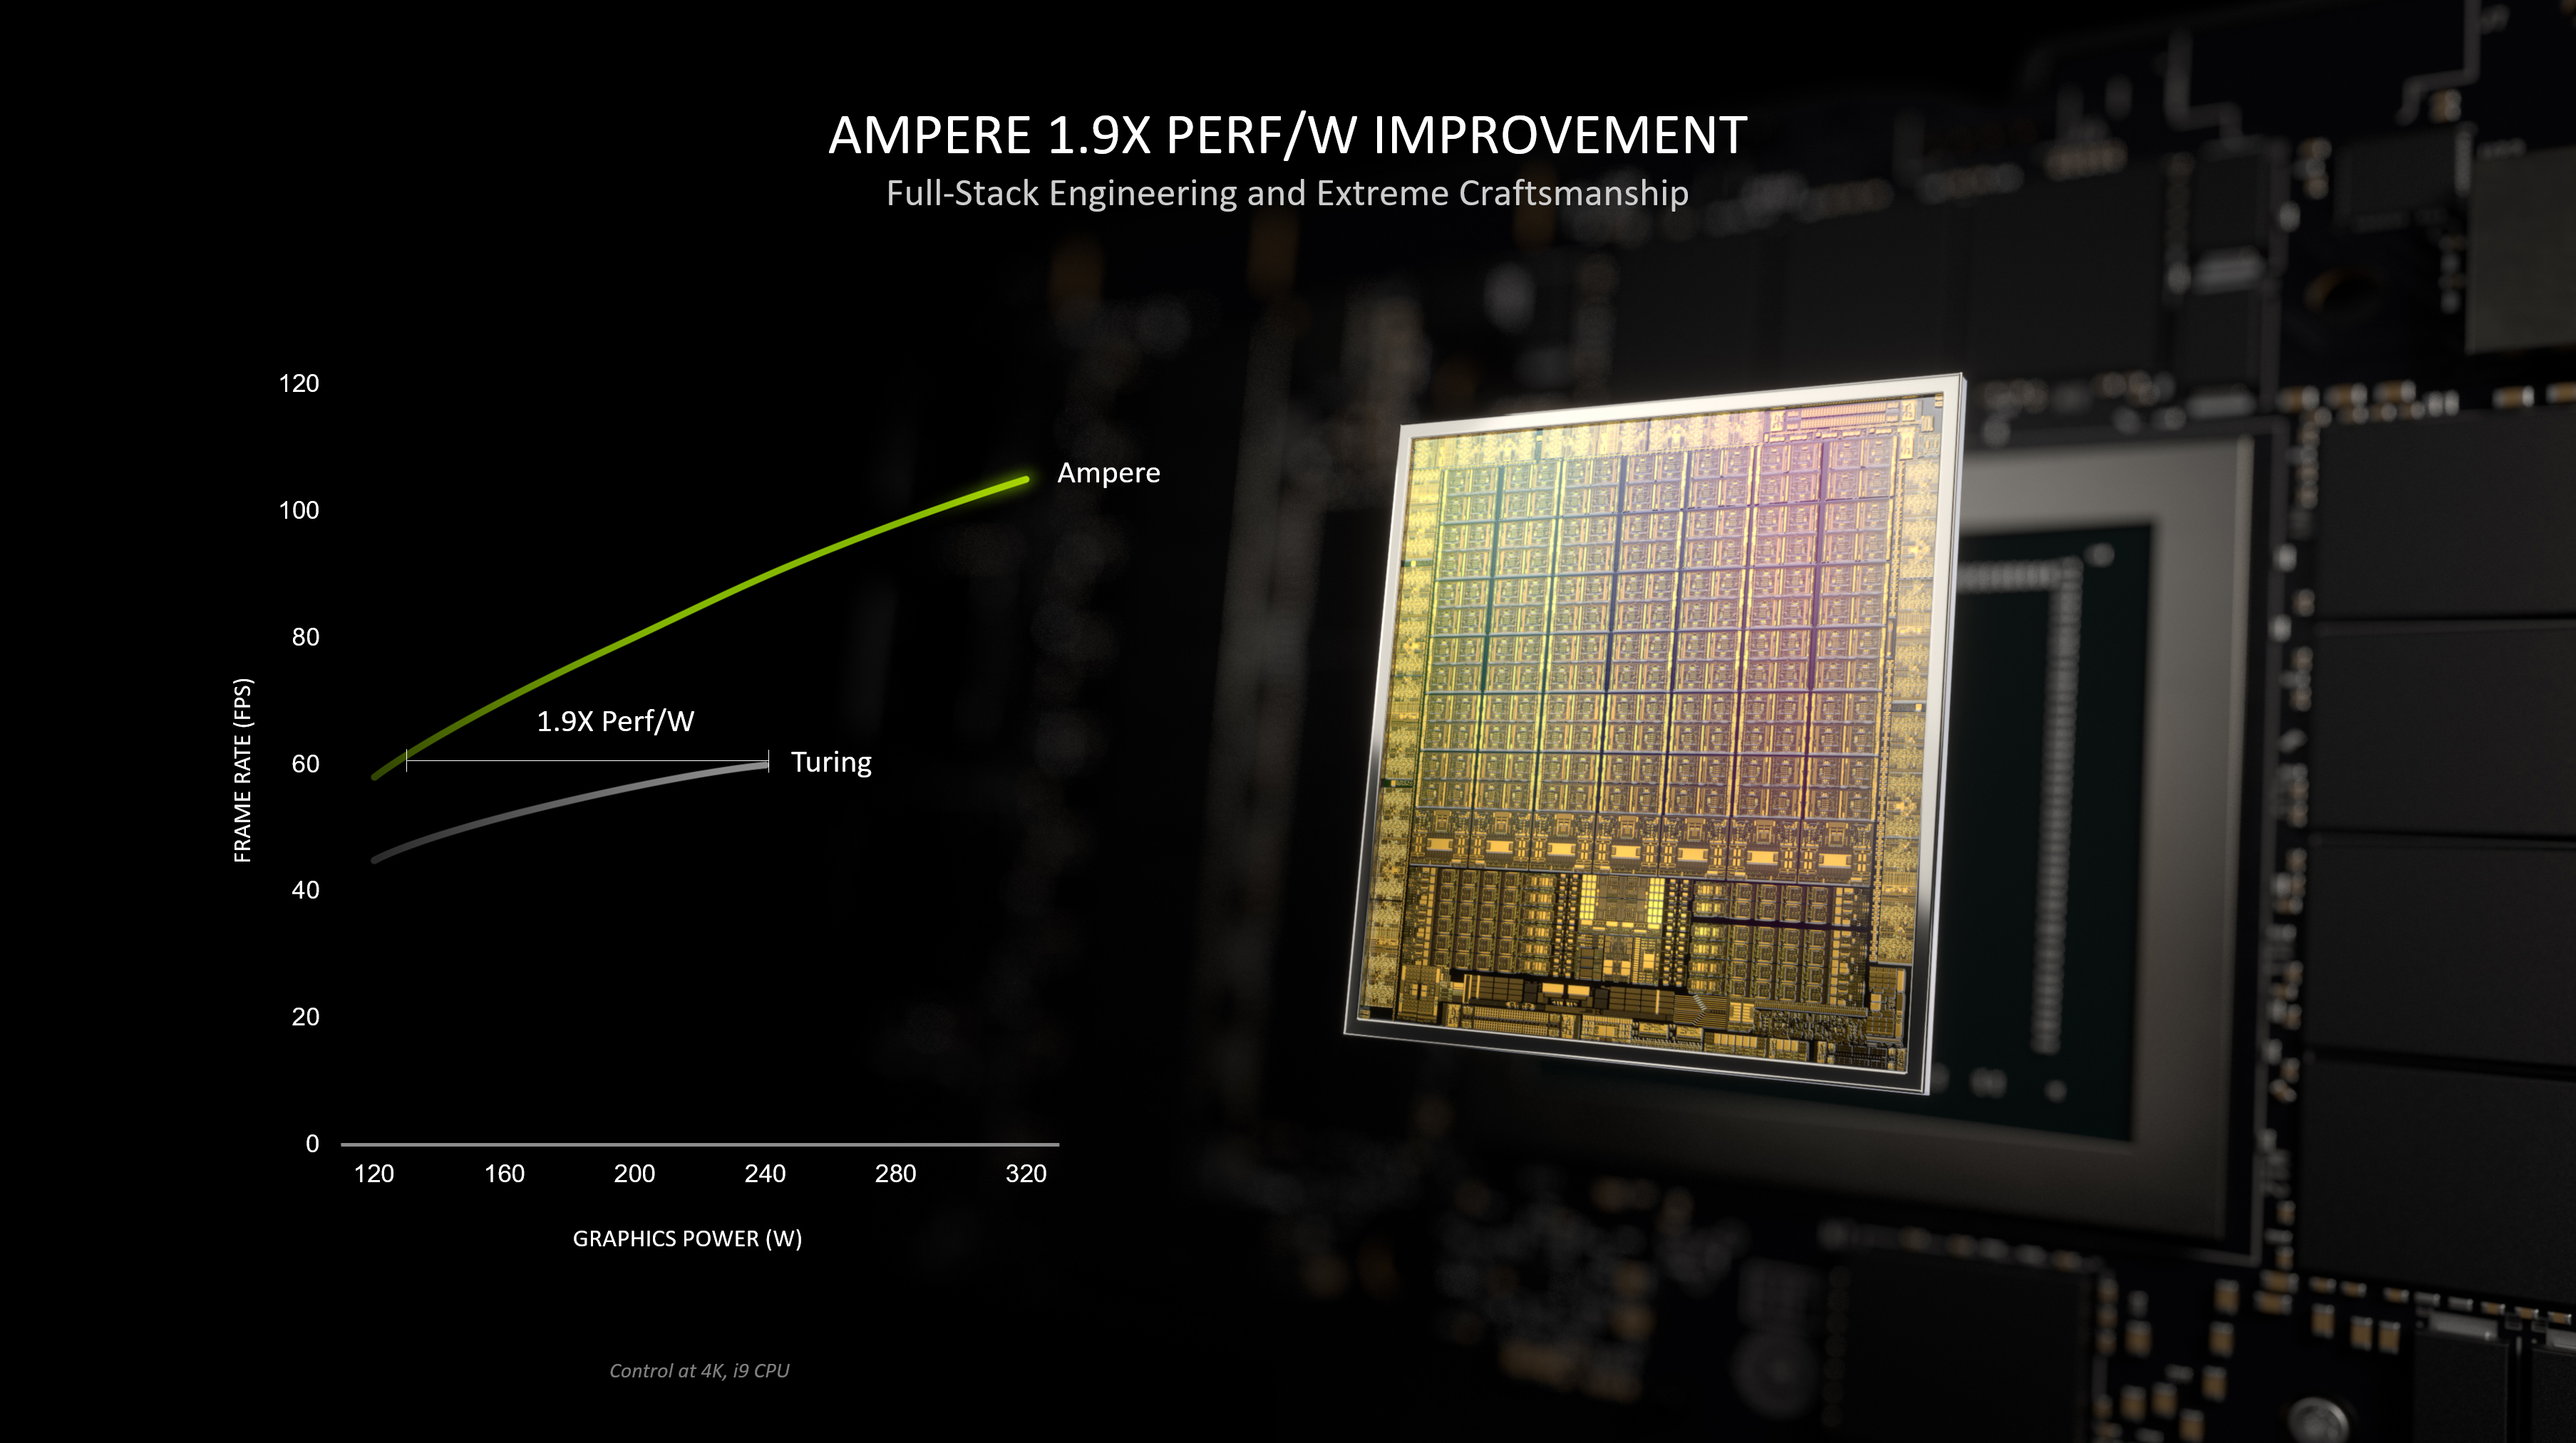
NVIDIA RTX A2000笔记本电脑GPU或A2000 Mobile是移动工作站的专业显卡。 基于GA107安培芯片,提供与消费者GeForce RTX 3050 Ti Laptop GPU相同的性能。它还提供2,560个CUDA、20个Raytracing和80个Tensor核心,以及128位内存总线。 35~95瓦特(TGP)的时钟速度(和性能)不同。 GPU 支持 eDP 1.4b 连接内部监视器和 DisplayPort 1.4 和 HDMI 2.1 外部连接。

Max-Q 变体(以前用于低功耗变体)已不存在,但所有 OEM 都可以选择实施 Max-Q 技术(动态 Boost、WhisperMode)。

原始性能必须与同一 TGP 级笔记本电脑的 GeForce RTX 3050 Ti 相同。 两个GPU都依赖良好的冷却和高TGP来提高性能。 RTX A2000的功耗水平与以前的Quadro T2000和T2000 Max-Q相比明显更快。

GA107芯片提供2.560FP32ALU,其中一半可以执行INT32指令(1,280INT32ALU)。 如果使用 Turing,则所有着色器都可以执行 FP32 或 INT32 指令。 Nvidia还改善了芯片上的光线跟踪和张量核。 安培芯片还包括改进的第 5代视频编码器 (H.264和 H.265的 NVENC)和第 7代解码器 (包括 AV1的各种格式 )。

GA107芯片由Samsung以8nm(8N)制造,与TSMC的7nm节点(AMD、专业GA100安培芯片等)相比,性能差很多。 根据TGP的不同,A2000还可用于轻薄笔记本电脑(例如35瓦TGP)。

RTX A Series

RTX A5500 Laptop GPU 7424 256 Bit @ 16000 MHz
RTX A4500 Laptop GPU 5888 @ 0.93 - 1.5 GHz256 Bit @ 16000 MHz
RTX A5000 Laptop GPU 6144 @ 1.22 - 1.77 GHz256 Bit @ 14000 MHz
RTX A4000 Laptop GPU 5120 @ 0.78 - 1.68 GHz256 Bit @ 12000 MHz
RTX A3000 Laptop GPU 4096 @ 1.08 - 1.56 GHz192 Bit @ 14000 MHz
RTX A2000 Laptop GPU 2560 @ 0.89 - 1.69 GHz128 Bit @ 14000 MHz
RTX A1000 Laptop GPU 2048 128 Bit @ 14000 MHz
RTX A500 Laptop GPU 2048 64 Bit @ 14000 MHz
CodenameGA107
ArchitectureAmpere
Pipelines2560 - unified
TMUs80
ROPs32
Raytracing Cores20
Tensor / AI Cores80
Core Speed893 - 1687 (Boost) MHz
Theoretical Performance9.3 TFLOPS FP32
Memory Speed14000 effective = 1750 MHz
Memory Bus Width128 Bit
Memory TypeGDDR6
Max. Amount of Memory8 GB
Shared Memoryno
Memory Bandwidth192 GB/s
APIDirectX 12_2, Shader 6.7, OpenGL 4.6
Power Consumption95 Watt (35 - 95 Watt TGP)
technology8 nm
PCIe4.0
DisplaysHDMI 2.1, DisplayPort 1.4
FeaturesDisplayPort 1.4, HDMI 2.1, PCIe 4.0 x16, 9.3 SP-FP TFLOPS Peak, 75 Tensor Performance Peak, up to 192 GB/s Memory Bandwidth, Resizable BAR, Support for Modern Standby
Notebook Sizelarge
Date of Announcement12.04.2021
Link to Manufacturer Pagewww.nvidia.com

Benchmarks

Performance Rating - 3DMark 11 + Fire Strike + Time Spy
6 pt (18%)
AMD Radeon HD 8180
0.06605 -99%
...
AMD Radeon RX 580 (Laptop)
5.13 -14%
5.27 -12%
5.38 -10%
5.45 -9%
5.57 -7%
NVIDIA Quadro P4000
5.58 -7%
5.59 -7%
NVIDIA Quadro P3200
5.72 -5%
NVIDIA GeForce GTX 980 (Laptop)
5.94 -1%
NVIDIA RTX A2000 Laptop GPU
5.99
6.08 2%
6.09 2%
NVIDIA Quadro RTX 3000 Max-Q
6.2 4%
6.68 12%
6.69 12%
6.72 12%
6.75 13%
6.76 13%
6.79 13%
...
21.1 252%
max:
33.3 456%
0%
100%
3DMark - 3DMark Time Spy Score
min: 4566     avg: 5572     median: 5523 (16%)     max: 6692 Points
3DMark - 3DMark Time Spy Graphics
min: 4228     avg: 5151     median: 5016 (13%)     max: 6108 Points
3DMark - 3DMark Cloud Gate Score
min: 28776     avg: 39926     median: 40815 (44%)     max: 52450 Points
3DMark - 3DMark Cloud Gate Graphics
min: 36447     avg: 65554     median: 60336 (16%)     max: 93708 Points
3DMark - 3DMark Fire Strike Standard Score
min: 10333     avg: 12188     median: 12211 (22%)     max: 15042 Points
3DMark - 3DMark Fire Strike Standard Graphics
min: 10415     avg: 13167     median: 13157 (15%)     max: 15988 Points
3DMark - 3DMark Ice Storm Graphics
min: 86344     avg: 91503     median: 91503 (11%)     max: 96662 Points
3DMark - 3DMark Wild Life Extreme Unlimited
min: 9041     avg: 9468     median: 9468 (11%)     max: 9895 Points
3DMark 11 - 3DM11 Performance Score
min: 14564     avg: 17114     median: 17348 (24%)     max: 19498 Points
3DMark 11 - 3DM11 Performance GPU
min: 14831     avg: 17690     median: 18058 (16%)     max: 19823 Points
171.8 -99%
...
NVIDIA Quadro P4000
15433 -13%
15711 -11%
15823 -11%
NVIDIA Quadro P4000 Max-Q
15837 -10%
NVIDIA Quadro P3200
16233 -8%
16564 -6%
NVIDIA GeForce GTX 980 (Laptop)
17028 -4%
17113 -3%
17562 -1%
NVIDIA RTX A2000 Laptop GPU
17690
17711 0%
17889 1%
NVIDIA Quadro RTX 3000 Max-Q
18037 2%
19016 7%
19109 8%
19467 10%
19881 12%
20096 14%
20096 14%
...
59943 239%
max:
106023 499%
0%
100%
3DMark Vantage
3DM Vant. Perf. total +
3DMark Vantage - 3DM Vant. Perf. total
63738 Points (18%)
3DM Vant. Perf. GPU no PhysX +
3DMark Vantage - 3DM Vant. Perf. GPU no PhysX
63137 Points (36%)
ATI Radeon HD 3200
62 -100%
...
52917 -16%
53510 -15%
54830 -13%
58792 -7%
60089 -5%
60439 -4%
NVIDIA Quadro RTX 4000 (Laptop)
62557 -1%
NVIDIA Quadro RTX 5000 Max-Q
62862 0%
NVIDIA GeForce GTX 1080 Mobile
63088 0%
NVIDIA RTX A2000 Laptop GPU
63137
66003 5%
66376 5%
66735 6%
68082 8%
NVIDIA Quadro P5200
68614 9%
68627 9%
NVIDIA GeForce RTX 2070 Super Max-Q
69136 10%
69467 10%
74008 17%
...
132443 110%
max:
170928 171%
0%
100%
3DMark 06 3DMark 06 - Standard 1280x1024 +
3DMark 06
36019 Points (47%)
Blender - Blender 3.3 Classroom CUDA *
min: 78     avg: 87     median: 90 (13%)     max: 98 Seconds
Blender - Blender 3.3 Classroom OPTIX *
min: 42     avg: 49.4     median: 53 (20%)     max: 54 Seconds
Blender - Blender 3.3 Classroom HIP *
474 Seconds (39%)
SPECviewperf 12
specvp12 sw-03 +
SPECviewperf 12 - specvp12 sw-03
min: 141.6     avg: 142.1     median: 142.1 (35%)     max: 142.51 fps
specvp12 snx-02 +
SPECviewperf 12 - specvp12 snx-02
min: 97.9     avg: 109.5     median: 109.5 (16%)     max: 121.11 fps
specvp12 showcase-01 +
SPECviewperf 12 - specvp12 showcase-01
min: 63.3     avg: 70     median: 70 (15%)     max: 76.6 fps
specvp12 mediacal-01 +
SPECviewperf 12 - specvp12 mediacal-01
min: 40.04     avg: 45     median: 45 (11%)     max: 49.9 fps
specvp12 maya-04 +
SPECviewperf 12 - specvp12 maya-04
min: 89.7     avg: 96     median: 96 (26%)     max: 102.25 fps
specvp12 energy-01 +
SPECviewperf 12 - specvp12 energy-01
min: 9.33     avg: 10.7     median: 10.7 (10%)     max: 12.13 fps
specvp12 creo-01 +
SPECviewperf 12 - specvp12 creo-01
min: 106.8     avg: 116.2     median: 116.2 (46%)     max: 125.61 fps
specvp12 catia-04 +
SPECviewperf 12 - specvp12 catia-04
min: 122.2     avg: 134.9     median: 134.9 (22%)     max: 147.68 fps
SPECviewperf 13 specvp13 sw-04 +
SPECviewperf 13 - specvp13 sw-04
min: 121.26     avg: 144.6     median: 140.8 (38%)     max: 177 fps
specvp13 snx-03 +
SPECviewperf 13 - specvp13 snx-03
min: 135.15     avg: 191     median: 190.7 (21%)     max: 223 fps
specvp13 showcase-02 +
SPECviewperf 13 - specvp13 showcase-02
min: 58.79     avg: 68     median: 67.4 (15%)     max: 79.2 fps
specvp13 medical-02 +
SPECviewperf 13 - specvp13 medical-02
min: 54.66     avg: 70.4     median: 71.2 (15%)     max: 78.3 fps
specvp13 maya-05 +
SPECviewperf 13 - specvp13 maya-05
min: 117.19     avg: 174.5     median: 172 (20%)     max: 221 fps
specvp13 energy-02 +
SPECviewperf 13 - specvp13 energy-02
min: 23.85     avg: 32.1     median: 33.6 (11%)     max: 36.8 fps
specvp13 creo-02 +
SPECviewperf 13 - specvp13 creo-02
min: 117.06     avg: 165.1     median: 165.4 (24%)     max: 207 fps
specvp13 catia-05 +
SPECviewperf 13 - specvp13 catia-05
min: 159.05     avg: 204.9     median: 201.8 (22%)     max: 251 fps
specvp13 3dsmax-06 +
SPECviewperf 13 - specvp13 3dsmax-06
min: 120.47     avg: 139.4     median: 135.3 (24%)     max: 165 fps
SPECviewperf 2020 specvp2020 solidworks-05 1080p +
SPECviewperf 2020 - specvp2020 solidworks-05 1080p
min: 106.28     avg: 124.3     median: 119.3 (23%)     max: 142.27 fps
specvp2020 snx-04 1080p +
SPECviewperf 2020 - specvp2020 snx-04 1080p
min: 136.88     avg: 190.4     median: 186 (30%)     max: 222 fps
specvp2020 medical-03 1080p +
SPECviewperf 2020 - specvp2020 medical-03 1080p
min: 26.96     avg: 33.4     median: 34 (35%)     max: 38.36 fps
specvp2020 maya-06 1080p +
SPECviewperf 2020 - specvp2020 maya-06 1080p
min: 172.4     avg: 207.5     median: 196.6 (29%)     max: 266 fps
specvp2020 energy-03 1080p +
SPECviewperf 2020 - specvp2020 energy-03 1080p
min: 26.06     avg: 32.4     median: 33.7 (27%)     max: 36.9 fps
specvp2020 creo-03 1080p +
SPECviewperf 2020 - specvp2020 creo-03 1080p
min: 65.51     avg: 97.6     median: 98 (48%)     max: 117 fps
specvp2020 catia-06 1080p +
SPECviewperf 2020 - specvp2020 catia-06 1080p
min: 46.02     avg: 58     median: 57.8 (37%)     max: 67.9 fps
specvp2020 3dsmax-07 1080p +
SPECviewperf 2020 - specvp2020 3dsmax-07 1080p
min: 54.4     avg: 63.3     median: 61.2 (28%)     max: 72.9 fps
specvp2020 solidworks-05 4k +
SPECviewperf 2020 - specvp2020 solidworks-05 4k
min: 29.9     avg: 42.9     median: 41.2 (12%)     max: 59.37 fps
specvp2020 snx-04 4k +
SPECviewperf 2020 - specvp2020 snx-04 4k
min: 99.9     avg: 112.5     median: 115.6 (12%)     max: 118.88 fps
specvp2020 medical-03 4k +
SPECviewperf 2020 - specvp2020 medical-03 4k
min: 8.89     avg: 10.6     median: 10.4 (10%)     max: 12.59 fps
specvp2020 maya-06 4k +
SPECviewperf 2020 - specvp2020 maya-06 4k
min: 79.3     avg: 83.5     median: 82.9 (14%)     max: 88.9 fps
specvp2020 energy-03 4k +
SPECviewperf 2020 - specvp2020 energy-03 4k
min: 9.4     avg: 25.6     median: 12.1 (3%)     max: 68.83 fps
specvp2020 creo-03 4k +
SPECviewperf 2020 - specvp2020 creo-03 4k
min: 49.2     avg: 55.5     median: 55.6 (26%)     max: 61.57 fps
specvp2020 catia-06 4k +
SPECviewperf 2020 - specvp2020 catia-06 4k
min: 22.34     avg: 29.7     median: 29.5 (19%)     max: 37.48 fps
specvp2020 3dsmax-07 4k +
SPECviewperf 2020 - specvp2020 3dsmax-07 4k
min: 26     avg: 36     median: 36.5 (15%)     max: 45.1 fps
Cinebench R10 Cinebench R10 Shading (32bit) +
Cinebench R10 - Cinebench R10 Shading (32bit)
6839 points (5%)
Cinebench R11.5 Cinebench R11.5 OpenGL 64 Bit +
Cinebench R11.5 - Cinebench R11.5 OpenGL 64 Bit
177.1 fps (61%)
Cinebench R15
Cinebench R15 OpenGL 64 Bit +
Cinebench R15 - Cinebench R15 OpenGL 64 Bit
min: 176.7     avg: 296.3     median: 311 (18%)     max: 344 fps
Cinebench R15 OpenGL Ref. Match 64 Bit +
Cinebench R15 - Cinebench R15 OpenGL Ref. Match 64 Bit
99.6 % (100%)
LuxMark v2.0 64Bit - LuxMark v2.0 Room GPU
2021 Samples/s (9%)
LuxMark v2.0 64Bit - LuxMark v2.0 Sala GPU
4554 Samples/s (8%)
ComputeMark v2.1 - ComputeMark v2.1 Result
13585 points (15%)
Power Consumption - Furmark Stress Test Power Consumption - external Monitor *
min: 64.6     avg: 98.7     median: 79.4 (11%)     max: 142.2 Watt
0102030405060708090100110120130140150Tooltip
Power Consumption - The Witcher 3 Power Consumption - external Monitor *
min: 73.7     avg: 108.6     median: 98.5 (14%)     max: 174.1 Watt
0102030405060708090100110120130140Tooltip
Power Consumption - Witcher 3 Power Consumption *
min: 86.8     avg: 114.4     median: 106.7 (23%)     max: 177.5 Watt
0153045607590105120135150165180195210Tooltip
Power Consumption - Witcher 3 ultra Power Efficiency
min: 0.3425     avg: 0.4     median: 0.4 (43%)     max: 0.575 fps per Watt
Power Consumption - Witcher 3 ultra Power Efficiency - external Monitor
min: 0.3745     avg: 0.5     median: 0.5 (38%)     max: 0.611 fps per Watt
Emissions Witcher 3 Fan Noise +
Emissions - Witcher 3 Fan Noise
min: 34.1     avg: 42.1     median: 42.2 (68%)     max: 52.7 dB(A)
- Range of benchmark values for this graphics card
- Average benchmark values for this graphics card
* Smaller numbers mean a higher performance

Game Benchmarks

The following benchmarks stem from our benchmarks of review laptops. The performance depends on the used graphics memory, clock rate, processor, system settings, drivers, and operating systems. So the results don't have to be representative for all laptops with this GPU. For detailed information on the benchmark results, click on the fps number.

low 1920x1080
122.8  fps    + Compare
med. 1920x1080
107  fps    + Compare
high 1920x1080
85.8  fps    + Compare
ultra 1920x1080
66.7  fps    + Compare
» With all tested laptops playable in detail settings ultra.
Additional Benchmarks
RT Ultra Preset / On FXAA 1920x1080
17.1
low 1920x1080
92  fps    + Compare
med. 1920x1080
69  fps    + Compare
high 1920x1080
42  fps    + Compare
QHD 2560x1440
32  fps    + Compare
» With all tested laptops playable in detail settings high.
low 1920x1080
97.9  fps    + Compare
med. 1920x1080
76  fps    + Compare
high 1920x1080
64  fps    + Compare
ultra 1920x1080
62  fps    + Compare
QHD 2560x1440
34  fps    + Compare
» With all tested laptops playable in detail settings ultra.
Additional Benchmarks
Low Preset 1280x720
115
low 1920x1080
87  fps    + Compare
med. 1920x1080
83  fps    + Compare
high 1920x1080
82  fps    + Compare
ultra 1920x1080
74  fps    + Compare
QHD 2560x1440
55  fps    + Compare
» With all tested laptops playable in detail settings ultra.
Additional Benchmarks
Very High Preset + Ray-Tracing TAA 1920x0180
59
low 1920x1080
81  fps    + Compare
med. 1920x1080
73  fps    + Compare
high 1920x1080
53  fps    + Compare
ultra 1920x1080
50  fps    + Compare
QHD 2560x1440
38  fps    + Compare
» With all tested laptops playable in detail settings ultra.
Additional Benchmarks
Basic Quality Preset T2X SMAA 1280x720
126
low 1920x1080
69.2  fps    + Compare
med. 1920x1080
56  fps    + Compare
high 1920x1080
53  fps    + Compare
ultra 1920x1080
50  fps    + Compare
QHD 2560x1440
37  fps    + Compare
» With all tested laptops playable in detail settings ultra.
low 1920x1080
66  fps    + Compare
med. 1920x1080
42  fps    + Compare
high 1920x1080
35.6  fps    + Compare
ultra 1920x1080
31  fps    + Compare
» With all tested laptops playable in detail settings high.
FIFA 23

FIFA 23

2022
low 1920x1080
114  fps    + Compare
med. 1920x1080
107.8  fps    + Compare
high 1920x1080
92.7  fps    + Compare
ultra 1920x1080
90  fps    + Compare
QHD 2560x1440
66  fps    + Compare
» With all tested laptops playable in detail settings ultra.
F1 22

F1 22

2022
low 1920x1080
126.5 130.3 147.1 155.4 195 ~ 151 fps    + Compare
med. 1920x1080
121.2 125.8 137.9 147.8 178.2 ~ 142 fps    + Compare
high 1920x1080
89.5 100.6 111.6 123.2 125.4 ~ 110 fps    + Compare
ultra 1920x1080
27.6 30.8 33.6 36.2 39.4 ~ 34 fps    + Compare
QHD 2560x1440
16.7 19.1 20.7 22.6 ~ 20 fps    + Compare
4K 3840x2160
7.1 9.1 9.8 ~ 9 fps    + Compare
» With all tested laptops playable in detail settings high.
Additional Benchmarks
Ultra Low Preset 16xAF TAA 1280x720
278
208
323
low 1920x1080
166  fps    + Compare
med. 1920x1080
154  fps    + Compare
high 1920x1080
148  fps    + Compare
ultra 1920x1080
80  fps    + Compare
QHD 2560x1440
81  fps    + Compare
» With all tested laptops playable in detail settings ultra.
Additional Benchmarks
Low Preset 1280x720
153
low 1920x1080
137.2  fps    + Compare
med. 1920x1080
111  fps    + Compare
high 1920x1080
74  fps    + Compare
ultra 1920x1080
57  fps    + Compare
QHD 2560x1440
38.8  fps    + Compare
» With all tested laptops playable in detail settings ultra.
low 1920x1080
69 78.5 ~ 74 fps    + Compare
med. 1920x1080
59 65.1 ~ 62 fps    + Compare
high 1920x1080
44 55 ~ 50 fps    + Compare
ultra 1920x1080
37 44.3 ~ 41 fps    + Compare
QHD 2560x1440
23 27.4 ~ 25 fps    + Compare
» With all tested laptops playable in detail settings ultra.
low 1920x1080
173  fps    + Compare
med. 1920x1080
141  fps    + Compare
high 1920x1080
123  fps    + Compare
ultra 1920x1080
89  fps    + Compare
» With all tested laptops playable in detail settings ultra.
Additional Benchmarks
Low Preset 1280x720
164
low 1920x1080
58.8  fps    + Compare
med. 1920x1080
59.3  fps    + Compare
high 1920x1080
57.4  fps    + Compare
ultra 1920x1080
55.8  fps    + Compare
QHD 2560x1440
47.5  fps    + Compare
» With all tested laptops playable in detail settings ultra.
low 1920x1080
81  fps    + Compare
med. 1920x1080
67.7  fps    + Compare
high 1920x1080
55.5  fps    + Compare
QHD 2560x1440
41  fps    + Compare
» With all tested laptops playable in detail settings high.
Additional Benchmarks
Low Quality 1280x720
131
High Quality Raytracing 1920x1080
44.8
med. 1920x1080
152  fps    + Compare
high 1920x1080
126  fps    + Compare
ultra 1920x1080
104  fps    + Compare
QHD 2560x1440
43 43 ~ 43 fps    + Compare
» With all tested laptops playable in detail settings ultra.
low 1920x1080
89  fps    + Compare
med. 1920x1080
94  fps    + Compare
high 1920x1080
62  fps    + Compare
ultra 1920x1080
42  fps    + Compare
QHD 2560x1440
35  fps    + Compare
» With all tested laptops playable in detail settings ultra.
Additional Benchmarks
Low Preset 1280x720
137
New World

New World

2021
low 1280x720
83.2  fps    + Compare + 📈 Graph
med. 1920x1080
68.6  fps    + Compare + 📈 Graph
high 1920x1080
63.5  fps    + Compare + 📈 Graph
ultra 1920x1080
52.4  fps    + Compare + 📈 Graph
» With all tested laptops playable in detail settings ultra.
Deathloop

Deathloop

2021
low 1280x720
104  fps    + Compare
med. 1920x1080
64.3  fps    + Compare
high 1920x1080
50.8  fps    + Compare
ultra 1920x1080
42.3  fps    + Compare
» With all tested laptops playable in detail settings ultra.
F1 2021

F1 2021

2021
low 1280x720
114 205 287 290 ~ 224 fps    + Compare
med. 1920x1080
120 137 153.1 166 ~ 144 fps    + Compare
high 1920x1080
104 109 124.4 138.5 ~ 119 fps    + Compare
ultra 1920x1080
37 50.6 62.7 68.4 ~ 55 fps    + Compare
QHD 2560x1440
24 44.4 48.3 ~ 39 fps    + Compare
4K 3840x2160
23.9 25.7 ~ 25 fps    + Compare
» With all tested laptops playable in detail settings ultra.
Additional Benchmarks
Ultra Low Preset 1920x1080
137
Days Gone

Days Gone

2021
low 1280x720
123  fps    + Compare + 📈 Graph
med. 1920x1080
85.5  fps    + Compare + 📈 Graph
high 1920x1080
76.6  fps    + Compare + 📈 Graph
ultra 1920x1080
57.7  fps    + Compare + 📈 Graph
» With all tested laptops playable in detail settings ultra.
Outriders

Outriders

2021
low 1280x720
127  fps    + Compare + 📈 Graph
med. 1920x1080
86.9  fps    + Compare + 📈 Graph
high 1920x1080
56 69.9 ~ 63 fps    + Compare + 📈 Graph
» With all tested laptops playable in detail settings high.
Hitman 3

Hitman 3

2021
low 1280x720
166.6  fps    + Compare
med. 1920x1080
83.4  fps    + Compare
high 1920x1080
78.6  fps    + Compare
ultra 1920x1080
73.9  fps    + Compare
QHD 2560x1440
48.4  fps    + Compare
» With all tested laptops playable in detail settings ultra.
Additional Benchmarks
Minimum Settings 1920x1080
93.3
low 1280x720
107  fps    + Compare
med. 1920x1080
80  fps    + Compare
high 1920x1080
72  fps    + Compare
ultra 1920x1080
64  fps    + Compare
QHD 2560x1440
53  fps    + Compare
» With all tested laptops playable in detail settings ultra.
low 1280x720
80  fps    + Compare
med. 1920x1080
55  fps    + Compare
high 1920x1080
39  fps    + Compare
ultra 1920x1080
32  fps    + Compare
QHD 2560x1440
27  fps    + Compare
» With all tested laptops playable in detail settings high.
Dirt 5

Dirt 5

2020
low 1280x720
86.3  fps    + Compare
med. 1920x1080
68  fps    + Compare
high 1920x1080
54.6  fps    + Compare
ultra 1920x1080
41.9  fps    + Compare
QHD 2560x1440
34  fps    + Compare
» With all tested laptops playable in detail settings ultra.
low 1280x720
86  fps    + Compare
med. 1920x1080
62  fps    + Compare
high 1920x1080
51  fps    + Compare
ultra 1920x1080
29  fps    + Compare
QHD 2560x1440
20  fps    + Compare
» With all tested laptops playable in detail settings high.
low 1280x720
118  fps    + Compare
med. 1920x1080
68.6  fps    + Compare
high 1920x1080
63.7  fps    + Compare
» With all tested laptops playable in detail settings high.
low 1280x720
81 109 ~ 95 fps    + Compare
med. 1920x1080
60 77.9 ~ 69 fps    + Compare
high 1920x1080
55 70.1 ~ 63 fps    + Compare
ultra 1920x1080
49 54.8 ~ 52 fps    + Compare
QHD 2560x1440
41  fps    + Compare
» With all tested laptops playable in detail settings ultra.
low 1280x720
104.3 143 ~ 124 fps    + Compare + 📈 Graph
med. 1920x1080
113.7 125 ~ 119 fps    + Compare + 📈 Graph
high 1920x1080
77.5 85.1 ~ 81 fps    + Compare + 📈 Graph
ultra 1920x1080
53.4 63.9 ~ 59 fps    + Compare + 📈 Graph
QHD 2560x1440
37.3  fps    + Compare
» With all tested laptops playable in detail settings ultra.
low 1280x720
207  fps    + Compare
med. 1920x1080
110  fps    + Compare
» With all tested laptops playable in detail settings med..
low 1280x720
169  fps    + Compare
med. 1920x1080
81.2  fps    + Compare
high 1920x1080
68.6  fps    + Compare
» With all tested laptops playable in detail settings high.
low 1280x720
115.5  fps    + Compare
med. 1920x1080
60.7  fps    + Compare
high 1920x1080
46.2  fps    + Compare
ultra 1920x1080
36  fps    + Compare
» With all tested laptops playable in detail settings ultra.
Additional Benchmarks
Very Low Overall Quality (DX11) 1920x1080
83.8
low 1280x720
106  fps    + Compare
med. 1920x1080
72  fps    + Compare
high 1920x1080
71  fps    + Compare
ultra 1920x1080
59  fps    + Compare
QHD 2560x1440
49  fps    + Compare
» With all tested laptops playable in detail settings ultra.
low 1280x720
110.4  fps    + Compare
med. 1920x1080
55.1  fps    + Compare
high 1920x1080
42.3  fps    + Compare
ultra 1920x1080
34.9  fps    + Compare
QHD 2560x1440
27  fps    + Compare
» With all tested laptops playable in detail settings high.
Additional Benchmarks
Ultra Quality DXR 16xAF 1920x1080
29
low 1280x720
107 111 ~ 109 fps    + Compare
med. 1920x1080
62 70.4 ~ 66 fps    + Compare
high 1920x1080
58 67.3 ~ 63 fps    + Compare
ultra 1920x1080
55 61.6 ~ 58 fps    + Compare
QHD 2560x1440
40  fps    + Compare
4K 3840x2160
17  fps    + Compare
» With all tested laptops playable in detail settings ultra.
Additional Benchmarks
Lowest Preset 1920x1080
75
Strange Brigade

Strange Brigade

2018
low 1280x720
238 251 266 280 289 290 325 347 353 ~ 293 fps    + Compare
med. 1920x1080
113.8 118.6 126 134 135 151.2 154.3 159.4 ~ 137 fps    + Compare
high 1920x1080
89.9 91.1 100 106 110 120.4 120.9 125.9 ~ 108 fps    + Compare
ultra 1920x1080
77.8 77.9 86 92 95.7 103.5 103.9 108.8 ~ 93 fps    + Compare
QHD 2560x1440
54.3 57.1 60.4 66 75.9 76.8 ~ 65 fps    + Compare
4K 3840x2160
33 35 36 ~ 35 fps    + Compare
» With all tested laptops playable in detail settings ultra.
Far Cry 5

Far Cry 5

2018
low 1280x720
120 165 ~ 143 fps    + Compare
med. 1920x1080
82 96 111 ~ 96 fps    + Compare + 📈 Graph
high 1920x1080
77 88 103 ~ 89 fps    + Compare + 📈 Graph
ultra 1920x1080
69 83 96 ~ 83 fps    + Compare + 📈 Graph
QHD 2560x1440
49 57 ~ 53 fps    + Compare
4K 3840x2160
26  fps    + Compare
» With all tested laptops playable in detail settings ultra.
Additional Benchmarks
Low Preset TAA 1920x1080
87
121
low 1280x720
88.2 112 115 122.6 135.2 138.8 140.3 155.3 163.3 ~ 130 fps    + Compare
med. 1920x1080
77 89.2 97.9 103.6 104.1 119 119.2 131.1 142.3 ~ 109 fps    + Compare
high 1920x1080
63.2 75.1 78.5 85.5 87.6 95.6 97 105.1 112.5 ~ 89 fps    + Compare
4K 3840x2160
45.3 51.3 55.1 73.1 76.5 93.8 ~ 66 fps    + Compare
» With all tested laptops playable in detail settings high.
low 1280x720
86.9 96.7 112.5 121.9 129.5 131 141.7 158.2 164.3 ~ 127 fps    + Compare
med. 1920x1080
51.9 62.5 63.2 68.2 76.3 78 80.4 84.7 90.5 ~ 73 fps    + Compare
high 1920x1080
38.3 46 46.6 48.6 51.6 56.4 60.3 60.6 64 ~ 52 fps    + Compare
QHD 2560x1440
31.1 33.4 34.4 34.9 41 44.2 44.4 47.1 ~ 39 fps    + Compare
4K 3840x2160
17.7 19.3 20.6 23.1 26 ~ 21 fps    + Compare
» With all tested laptops playable in detail settings high.
low 1280x720
122.3 156 173 177.5 179.3 180.8 181.2 181.5 192.4 ~ 172 fps    + Compare
med. 1366x768
111.1 133 133.5 155 159.3 160.8 165.6 166.9 174.7 ~ 151 fps    + Compare
high 1920x1080
105.3 126.1 129 130 145.1 149.3 154.3 157.4 168.4 ~ 141 fps    + Compare
ultra 1920x1080
100.4 118.6 119 121 128.8 139.5 142.5 149.4 158 ~ 131 fps    + Compare
4K 3840x2160
62.9 64.2 68.9 72.3 78.5 83.2 ~ 72 fps    + Compare
» With all tested laptops playable in detail settings ultra.
low 1024x768
218 256 259.8 264 273 282 291 297.1 320 ~ 273 fps    + Compare
med. 1366x768
145.6 150.5 151.9 160 171 181.7 188 204 220 ~ 175 fps    + Compare
high 1920x1080
45 79.7 82.2 92.4 95.8 96.2 103 108.6 108.6 ~ 90 fps    + Compare + 📈 Graph
ultra 1920x1080
43.6 43.9 44.5 48.8 50 54 57.4 59 65.2 ~ 52 fps    + Compare + 📈 Graph
4K 3840x2160
29.2 33 33.1 ~ 32 fps    + Compare
» With all tested laptops playable in detail settings ultra.
GTA V

GTA V

2015
low 1024x768
167.3 173 179 181.7 182.9 183.4 185.7 186.8 ~ 180 fps    + Compare
med. 1366x768
157.6 164 170 177.1 177.6 181.1 185.3 ~ 173 fps    + Compare
high 1920x1080
112 117.2 119 134.7 146.3 155.1 163.5 164.5 ~ 139 fps    + Compare
ultra 1920x1080
57.8 61.1 65.4 69.1 72.1 79.1 81.2 84 ~ 71 fps    + Compare
QHD 2560x1440
42.9 44.1 47.3 51.8 57.1 58.4 ~ 50 fps    + Compare
4K 3840x2160
41.2 44.1 45 ~ 43 fps    + Compare
» With all tested laptops playable in detail settings ultra.
Additional Benchmarks
Highest Settings possible 16xAF 4xMSAA + FXAA 3840x2160
21.2
Normal/Off 4xAF 1920x1080
156
163
174.5
155.7
184.1
Lowest Settings possible 1920x1080
163
167
179.9
163.1
186.5
lowmed.highultraQHD4K
The Witcher 3 v4.00122.810785.866.7
The Callisto Protocol92694232
Need for Speed Unbound97.976646234
Spider-Man Miles Morales8783827455
Call of Duty Modern Warfare 2 20228173535038
Uncharted Legacy of Thieves Collection69.256535037
A Plague Tale Requiem664235.631
FIFA 23114107.892.79066
F1 2215114211034209
Vampire Bloodhunt1661541488081
Tiny Tina's Wonderlands137.23111745738.83
Cyberpunk 2077 1.67462504125
GRID Legends17314112389
Elden Ring58.859.357.455.847.5
Dying Light 28167.755.4741
Rainbow Six Extraction15212610443
God of War8994624235
New World83.268.663.552.4
Deathloop10464.350.842.3
F1 2021224144119553925
Days Gone12385.576.657.7
Outriders12786.963
Hitman 3166.683.478.673.948.4
Immortals Fenyx Rising10780726453
Assassin´s Creed Valhalla8055393227
Dirt 586.36854.641.934
Watch Dogs Legion8662512920
Mafia Definitive Edition11868.663.7
Horizon Zero Dawn9569635241
Gears Tactics124119815937.3
Doom Eternal207110
Hunt Showdown16981.268.6
Borderlands 3115.560.746.236
Far Cry New Dawn10672715949
Metro Exodus110.455.142.334.927
Shadow of the Tomb Raider1096663584017
Strange Brigade293137108936535
Far Cry 51439689835326
X-Plane 11.111301098966
Final Fantasy XV Benchmark12773523921
Dota 2 Reborn17215114113172
The Witcher 3273175905232
GTA V180173139715043
< 30 fps
< 60 fps
< 120 fps
≥ 120 fps

1
22
19

5
29
9

14
23
5
1
21
12
1
5
21
3
5
3
2

For more games that might be playable and a list of all games and graphics cards visit our Gaming List

v1.26
log 22. 12:33:44

#0 no ids found in url (should be separated by "_") +0s ... 0s

#1 not redirecting to Ajax server +0s ... 0s

#2 did not recreate cache, as it is less than 5 days old! Created at Mon, 22 Apr 2024 05:40:21 +0200 +0.001s ... 0.001s

#3 no comparison url found in template nbc.compare_page_1 needed +0.055s ... 0.056s

#4 no comparison url found in template nbc.compare_page_1 needed +0s ... 0.056s

#5 no comparison url found in template nbc.compare_page_1 needed +0s ... 0.057s

#6 no comparison url found in template nbc.compare_page_1 needed +0s ... 0.057s

#7 no comparison url found in template nbc.compare_page_1 needed +0s ... 0.058s

#8 no comparison url found in template nbc.compare_page_1 needed +0s ... 0.058s

#9 no comparison url found in template nbc.compare_page_1 needed +0s ... 0.058s

#10 composed specs +0s ... 0.058s

#11 did output specs +0s ... 0.058s

#12 start showIntegratedCPUs +0s ... 0.058s

#13 getting avg benchmarks for device 10681 +0.031s ... 0.09s

#14 got single benchmarks 10681 +0.05s ... 0.14s

#15 got avg benchmarks for devices +0s ... 0.14s

#16 min, max, avg, median took s +1.118s ... 1.257s

#17 before gaming benchmark output +0s ... 1.258s

#18 Got 469 rows for game benchmarks. +0.125s ... 1.383s

#19 composed SQL query for gamebenchmarks +0s ... 1.383s

#20 got data and put it in $dataArray +0.03s ... 1.413s

#21 benchmarks composed for output. +1.934s ... 3.347s

#22 no comparison url found in template nbc.compare_page_1 needed +0.005s ... 3.352s

#23 return log +0s ... 3.352s

Notebook reviews with NVIDIA RTX A2000 Laptop GPU graphics card

联想ThinkPad P16笔记本电脑回顾:RTX A2000现在有了充分的动力

联想ThinkPad P16笔记本电脑回顾:RTX A2000现在有了充分的动力

一台移动工作站必须在各方面提供高性能。我们在ThinkPad P16的第一次测试中相应地感到失望,其RTX A2000运行时有手刹。重新测试表明,这可能是我们第一个测试设备的特殊功能。...
Intel Core i7-12850HX | NVIDIA RTX A2000 Laptop GPU | 16.00" | 3 kg
联想ThinkPad P15v G3 AMD笔记本电脑评测:ThinkPad工作站现在首次配备Ryzen 6000H

联想ThinkPad P15v G3 AMD笔记本电脑评测:ThinkPad工作站现在首次配备Ryzen 6000H

联想ThinkPad P15v第三代将是最后一款采用经典1.8毫米键盘的ThinkPad。它也是ThinkPad系列中第一款采用AMD Ryzen 6000H系列的工作站机型--在这款相对便宜的ThinkPad工作站中,新旧交融令人激动。...
AMD Ryzen 7 PRO 6850H | NVIDIA RTX A2000 Laptop GPU | 15.60" | 2.2 kg
联想ThinkPad P16 G1笔记本电脑评测。一个强大的、新设计的HX55工作站

联想ThinkPad P16 G1笔记本电脑评测。一个强大的、新设计的HX55工作站

在其ThinkPad P工作站产品线中,联想给2022年的型号做了一次体面的改造。现在只有联想ThinkPad P16 G1这一款经典工作站,而不是两个型号。它接替了ThinkPad P15 G2和P17 G2。...
Intel Core i7-12850HX | NVIDIA RTX A2000 Laptop GPU | 16.00" | 3 kg
华硕ExpertBook B6翻转版的回顾

华硕ExpertBook B6 Flip评测。带手写笔的强大的工作站可转换性

即使对于一个拥有16英寸屏幕的工作站来说,华硕ExpertBook B6 Flip也是相当大和重的。但是,敞篷车内的高效冷却系统可以轻松地驱散英特尔酷睿i9-12950HX和Nvidia RTX A2000产生的140瓦废热。...
Intel Core i9-12950HX | NVIDIA RTX A2000 Laptop GPU | 16.00" | 2.8 kg
惠普ZBook Power 15 G9笔记本电脑评测--带哑光4K显示屏的移动工作站

惠普ZBook Power 15 G9笔记本电脑评测--带哑光4K显示屏的移动工作站

通过ZBook Power 15,惠普在入门级领域提供了一个移动工作站。除了目前的Alder Lake CPU外,还使用了Nvidia的专业GPU,但只有芯片达到RTX A2000。...
Intel Core i7-12700H | NVIDIA RTX A2000 Laptop GPU | 15.60" | 2 kg

HP ZBook Studio 16 G9 62U04EA: Intel Core i7-12800H, 16.00", 1.8 kg
  Review » 惠普ZBook Studio 16 G9笔记本电脑评测。配备120赫兹DreamColor显示屏的工作站

Dell Precision 7670: Intel Core i7-12850HX, 16.00", 2.7 kg
  Review » 戴尔Precision 7670工作站回顾。酷睿i7-12850HX和CAMM内存首次亮相

Dell Precision 5000 5560: Intel Core i7-11850H, 15.60", 2 kg
  Review » 戴尔Precision 5560工作站回顾。Quadro RTX A2000的提升

Lenovo ThinkPad P17 G2-20YU0025G: Intel Core i7-11800H, 17.30", 3.6 kg
  Review » 联想ThinkPad P17 G2笔记本电脑评论。具有内部升级功能的大型工作站

HP ZBook Studio 16 G10: Intel Core i7-13700H, 16.00", 1.7 kg
  External Review » HP ZBook Studio 16 G10

Dell Precision 16 7680: Intel Core i7-13850HX, 16.00", 2.6 kg
  External Review » Dell Precision 16 7680

Asus ExpertBook B6 Flip B6602FC2: Intel Core i9-12950HX, 16.00", 2.8 kg
  External Review » Asus ExpertBook B6 Flip B6602FC2

Asus ExpertBook B6 Flip B6602FC2, i7-12850HX: Intel Core i7-12850HX, 16.00", 2.7 kg
  External Review » Asus ExpertBook B6 Flip B6602FC2, i7-12850HX

Lenovo ThinkPad P15v G3 21EM001AGE: AMD Ryzen 7 PRO 6850H, 15.60", 2.2 kg
  External Review » Lenovo ThinkPad P15v G3 21EM001AGE

Lenovo ThinkPad P16 G1 21D6001DMB: Intel Core i7-12850HX, 16.00", 3 kg
  External Review » Lenovo ThinkPad P16 G1 21D6001DMB

HP ZBook Power 15 G9 6B8C4EA: Intel Core i7-12700H, 15.60", 2 kg
  External Review » HP ZBook Power 15 G9 6B8C4EA

Dell Precision 7670: Intel Core i7-12850HX, 16.00", 2.7 kg
  External Review » Dell Precision 7670

HP ZBook Studio 16 G9 62U04EA: Intel Core i7-12800H, 16.00", 1.8 kg
  External Review » HP ZBook Studio 16 G9 62U04EA

HP ZBook Fury 16 G9-62V34EA: Intel Core i7-12800HX, 16.00", 2.4 kg
  External Review » HP ZBook Fury 16 G9-62V34EA

Dell Precision 17 5770-D3C00: Intel Core i7-12700H, 17.30", 2.6 kg
  External Review » Dell Precision 17 5770-D3C00

Dell Precision 7560-DG0HV: Intel Core i9-11950H, 15.60", 2.5 kg
  External Review » Dell Precision 7560-DG0HV

Dell Precision 15 7560-DG0HV: Intel Core i9-11950H, 15.60", 2.5 kg
  External Review » Dell Precision 15 7560-DG0HV

HP ZBook Fury 15 G8-314J6EA : Intel Core i7-11800H, 15.60", 2.4 kg
  External Review » HP ZBook Fury 15 G8-314J6EA

Lenovo ThinkPad P15 G2-20YQ001RGE: Intel Core i7-11850H, 15.60", 2.9 kg
  External Review » Lenovo ThinkPad P15 G2-20YQ001RGE

Dell Precision 5000 5560: Intel Core i7-11850H, 15.60", 2 kg
  External Review » Dell Precision 5000 5560

Microsoft Surface Laptop Studio, i7-11370H RTX A2000: Intel Core i7-11370H, 14.40", 1.8 kg
  External Review » Microsoft Surface Laptop Studio, i7-11370H RTX A2000

HP ZBook Power G8, 11850H A2000: Intel Core i7-11850H, 15.60", 1.9 kg
  External Review » HP ZBook Power G8, 11850H A2000

Please share our article, every link counts!

» Comparison of GPUs
Detailed list of all laptop GPUs sorted by class and performance.

» Benchmark List
Sort and restrict laptop GPUs based on performance in synthetic benchmarks.

» Notebook Gaming List
Playable games for each graphics card and their average FPS results.

Class 1

GeForce RTX 2080 Super Mobile

Class 2

M1 Max 32-Core GPU *
GeForce RTX 2070 Super Mobile
M1 Max 24-Core GPU *
Quadro RTX 5000 Max-Q
Radeon RX 5700M *
GeForce GTX 1080 Mobile
Quadro RTX 4000 (Laptop)
M1 Pro 16-Core GPU *
Radeon PRO W6600M *
GeForce RTX 2070 Super Max-Q
Quadro RTX 4000 Max-Q *
M1 Pro 14-Core GPU *
Quadro P5200
Quadro RTX 3000 Max-Q *
Quadro P4200
Quadro P5000 Max-Q *
GeForce GTX 980 (Laptop)
Quadro P4000
Quadro P4000 Max-Q
Quadro P3200
Radeon RX 580X (Laptop) *
Radeon RX 580 (Laptop)
Radeon Pro 5300M
Radeon RX 5300M
Quadro P3000 Max-Q *
Quadro T2000 Max-Q *
Radeon Pro WX 7100 *
Radeon RX 570X (Laptop) *
Radeon RX 570 (Laptop) *
Radeon RX 470 (Laptop) *
Quadro T1000 Max-Q *

Class 3

Vega M GH
Quadro M5000M
GeForce GTX 1050 Ti Mobile
Radeon 680M
Quadro P2000
Quadro P2000 Max-Q
Quadro M4000M
T500 Laptop GPU *
Radeon R9 M395X
GeForce GTX 1050 Ti Max-Q *
Radeon Pro Vega 16
WX Vega M GL
Radeon R9 M485X
Quadro M3000M
FirePro W7170M
Radeon R9 M395
GeForce GTX 1050 Max-Q *
Radeon 660M
Radeon Pro WX 4150 *
Radeon RX 560X (Laptop)
Radeon RX 560 (Laptop)
Radeon RX 460 (Laptop)
Quadro P1000
Radeon R9 M390
Xe MAX
Radeon Pro 560X
Radeon Pro 560
Radeon Pro 460
Radeon Pro WX 4130 *
GeForce GTX 960M
Quadro P620 *
Radeon RX 550X (Laptop)
Radeon Pro WX 3200 *
Radeon Pro 555X
Radeon Pro 555
Radeon Pro 455
Quadro P600
Quadro M2000M
Radeon RX 540X *
Radeon Pro WX 2100 *
Radeon Pro WX 3100 *
GeForce GTX 950M
Radeon Pro 450
Radeon 630
Radeon 540X *
Radeon R9 M385X
Quadro P520
Quadro M1000M
GeForce 945M
Quadro P500 *
Iris Plus Graphics G7 (Ice Lake 64 EU) *
Vega 10 *
Iris Pro Graphics 580
FirePro W5170M *
Radeon R9 M370X
Vega 9
FirePro W5130M
UHD Graphics Xe G4 48EUs *
UHD Graphics 32EUs
UHD Graphics Xe 32EUs (Tiger Lake-H) *
UHD Graphics 750
Vega 7
Radeon R7 M465
Iris Pro Graphics 6200
Vega 8
GeForce 940M
Iris Plus Graphics G4 (Ice Lake 48 EU)
Quadro M600M
FirePro W4190M
Radeon R9 M375
Radeon R7 M445
Iris Plus Graphics 650
Iris Graphics 550
Radeon 625
Vega 6 *
Iris Plus Graphics 640
Iris Graphics 540
UHD Graphics 24EUs (Alder Lake-N) *
Radeon R7 M360
GeForce 920M
Radeon 620
Radeon R7 M340
Radeon 610
Radeon 610M *
Vega 6 *
UHD Graphics G1 (Ice Lake 32 EU)
UHD Graphics Xe 16EUs (Tiger Lake-H) *
HD Graphics 530
Radeon R5 (Bristol Ridge)
Adreno 690 *
Adreno 685 *
Adreno 680 *
Radeon R5 M330
GeForce 910M
HD Graphics 520

Class 4

UHD Graphics 730
Radeon R5 M320 *
Radeon R5 M315 *
Radeon R5 M420 *
Vega 2 *
UHD Graphics 617
UHD Graphics 615
HD Graphics 515
UHD Graphics 610
HD Graphics 510
UHD Graphics 605
Radeon R4 (Stoney Ridge)
Radeon R2 (Stoney Ridge)
HD Graphics (Broadwell)
UHD Graphics 600
HD Graphics (Braswell)

Class 5

* Approximate position of the graphics adapter