Acer Enduro Urban N3 EUN314笔记本电脑评测。部分坚固耐用,部分超极本
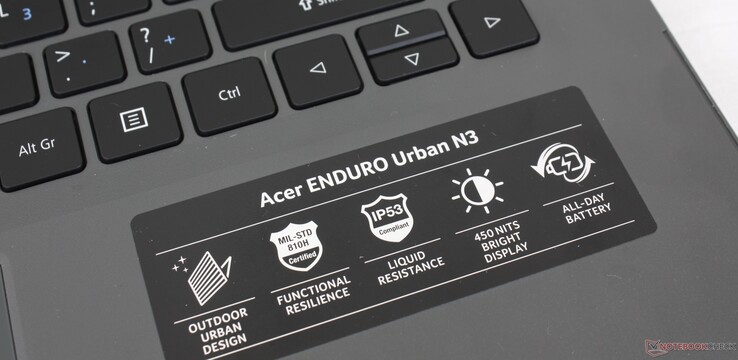
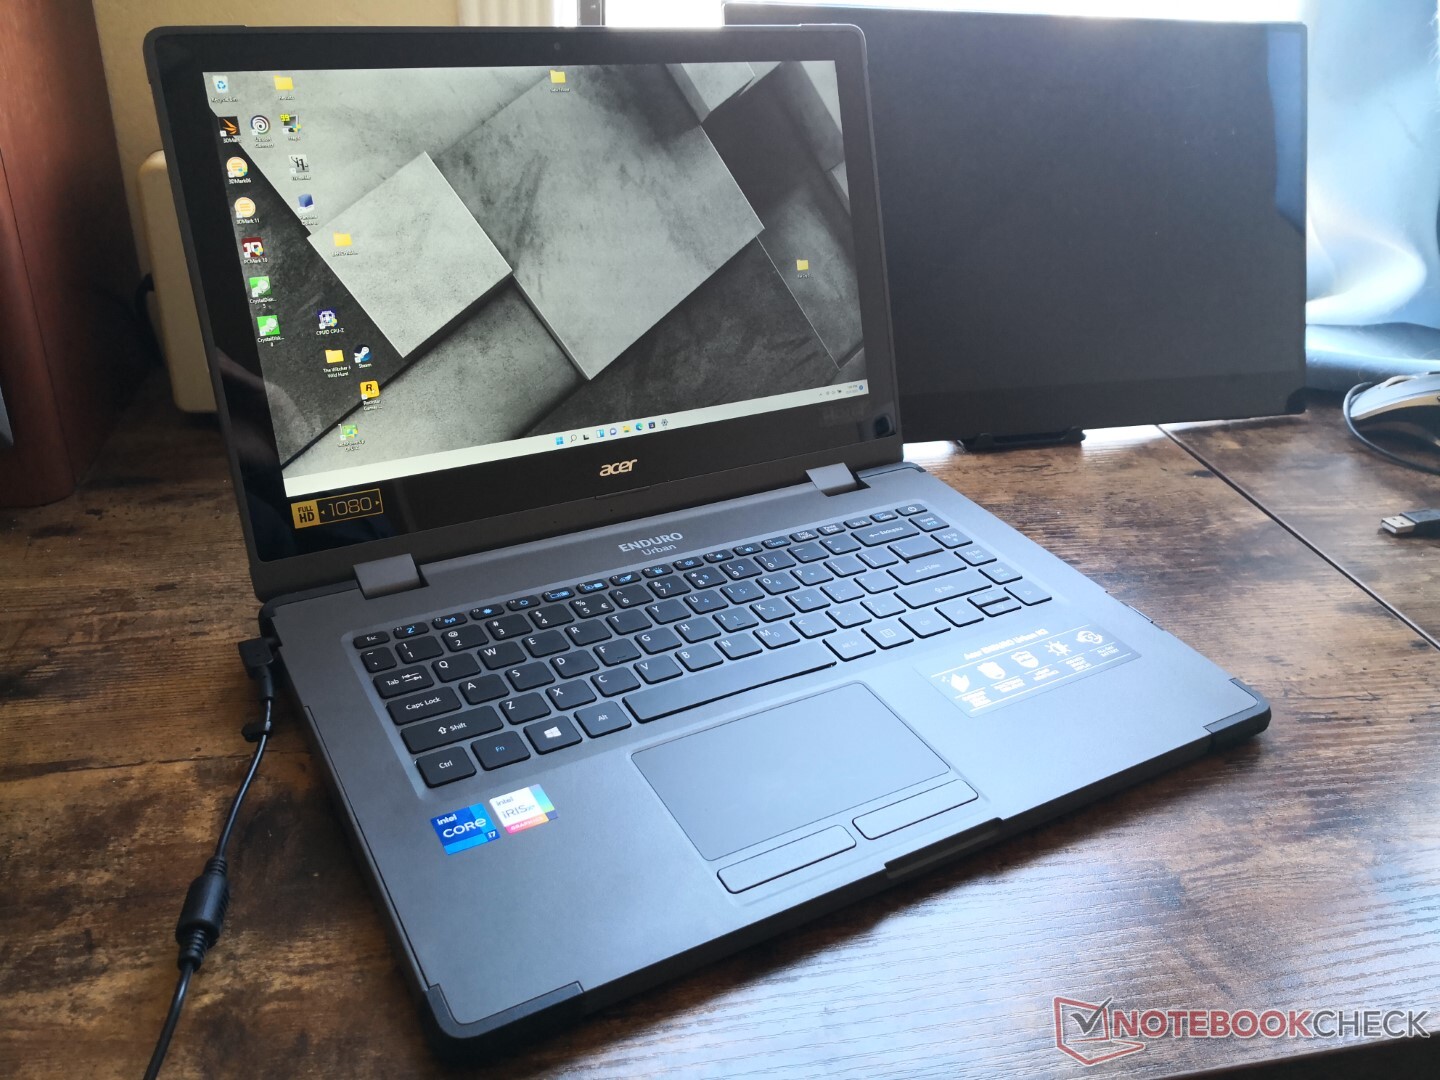
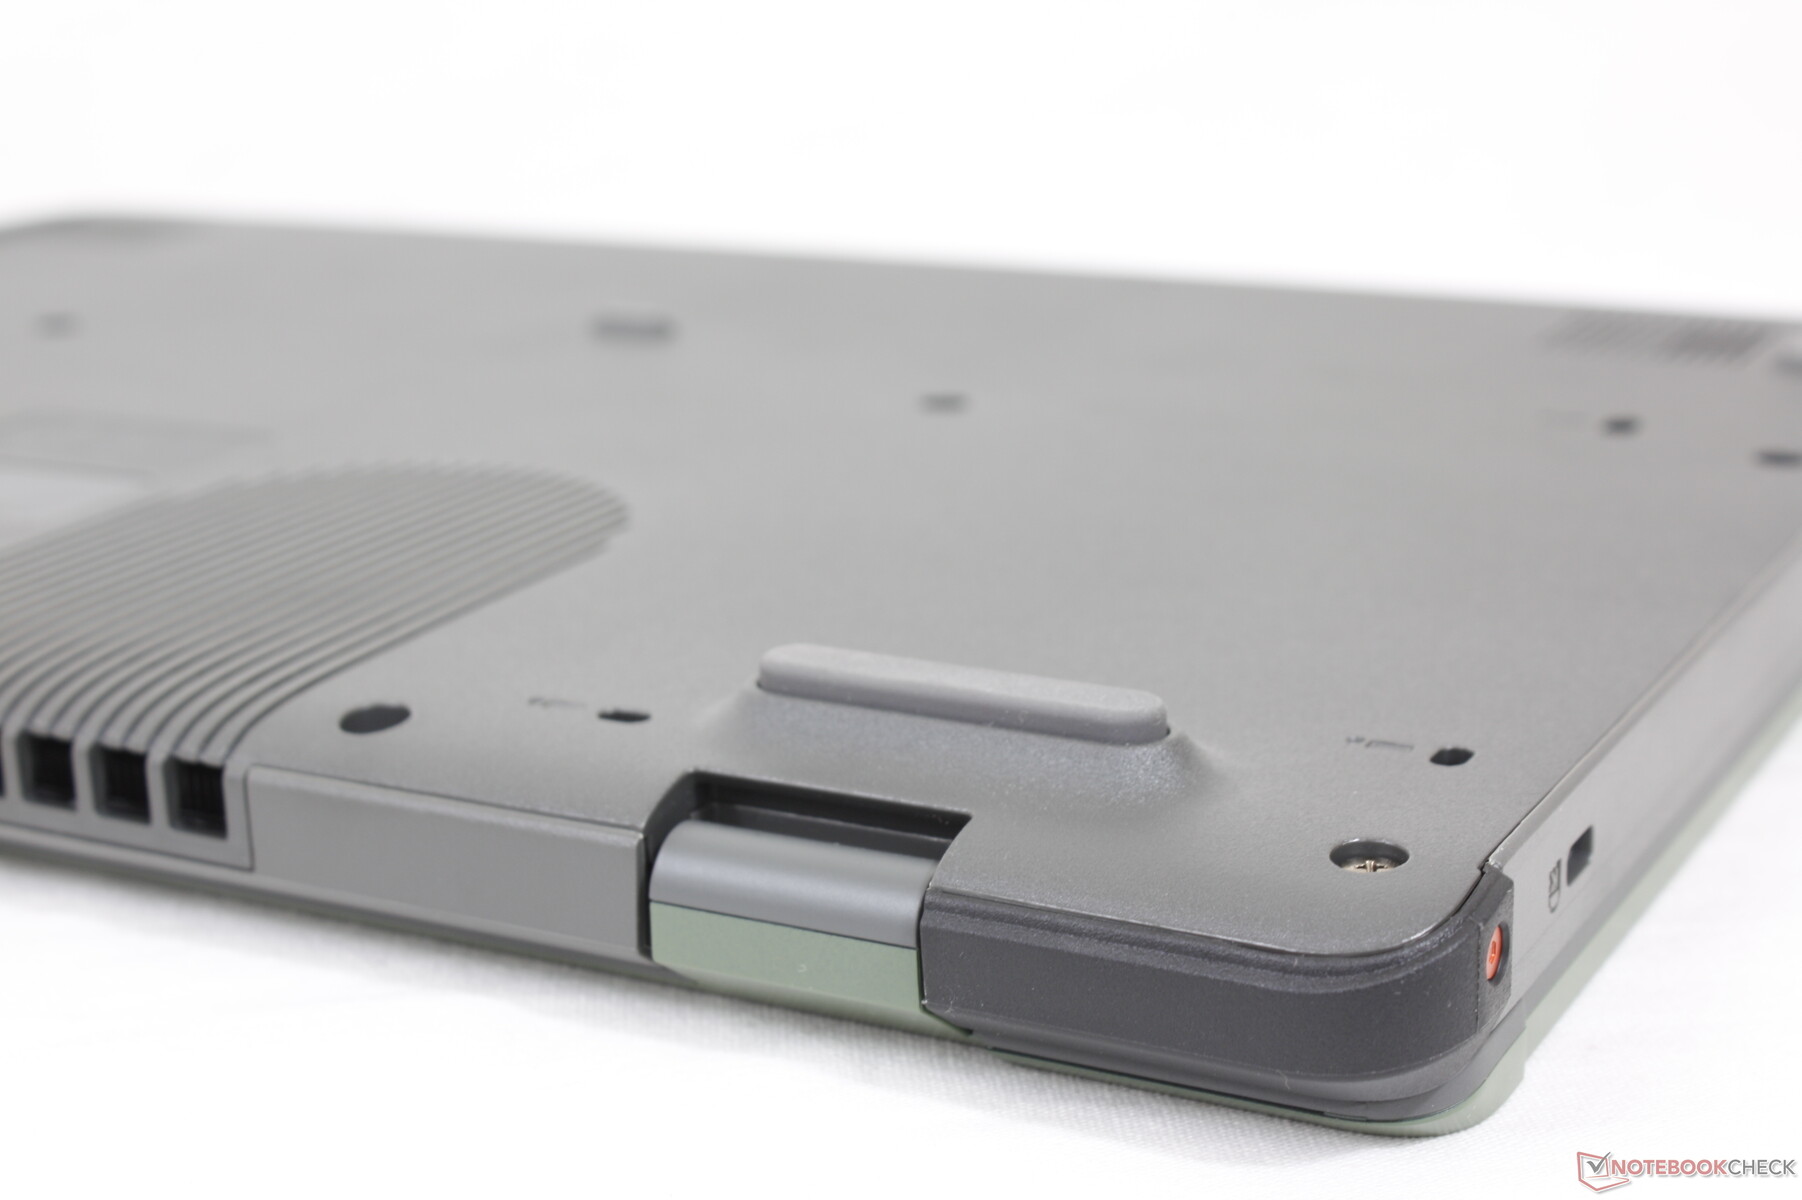
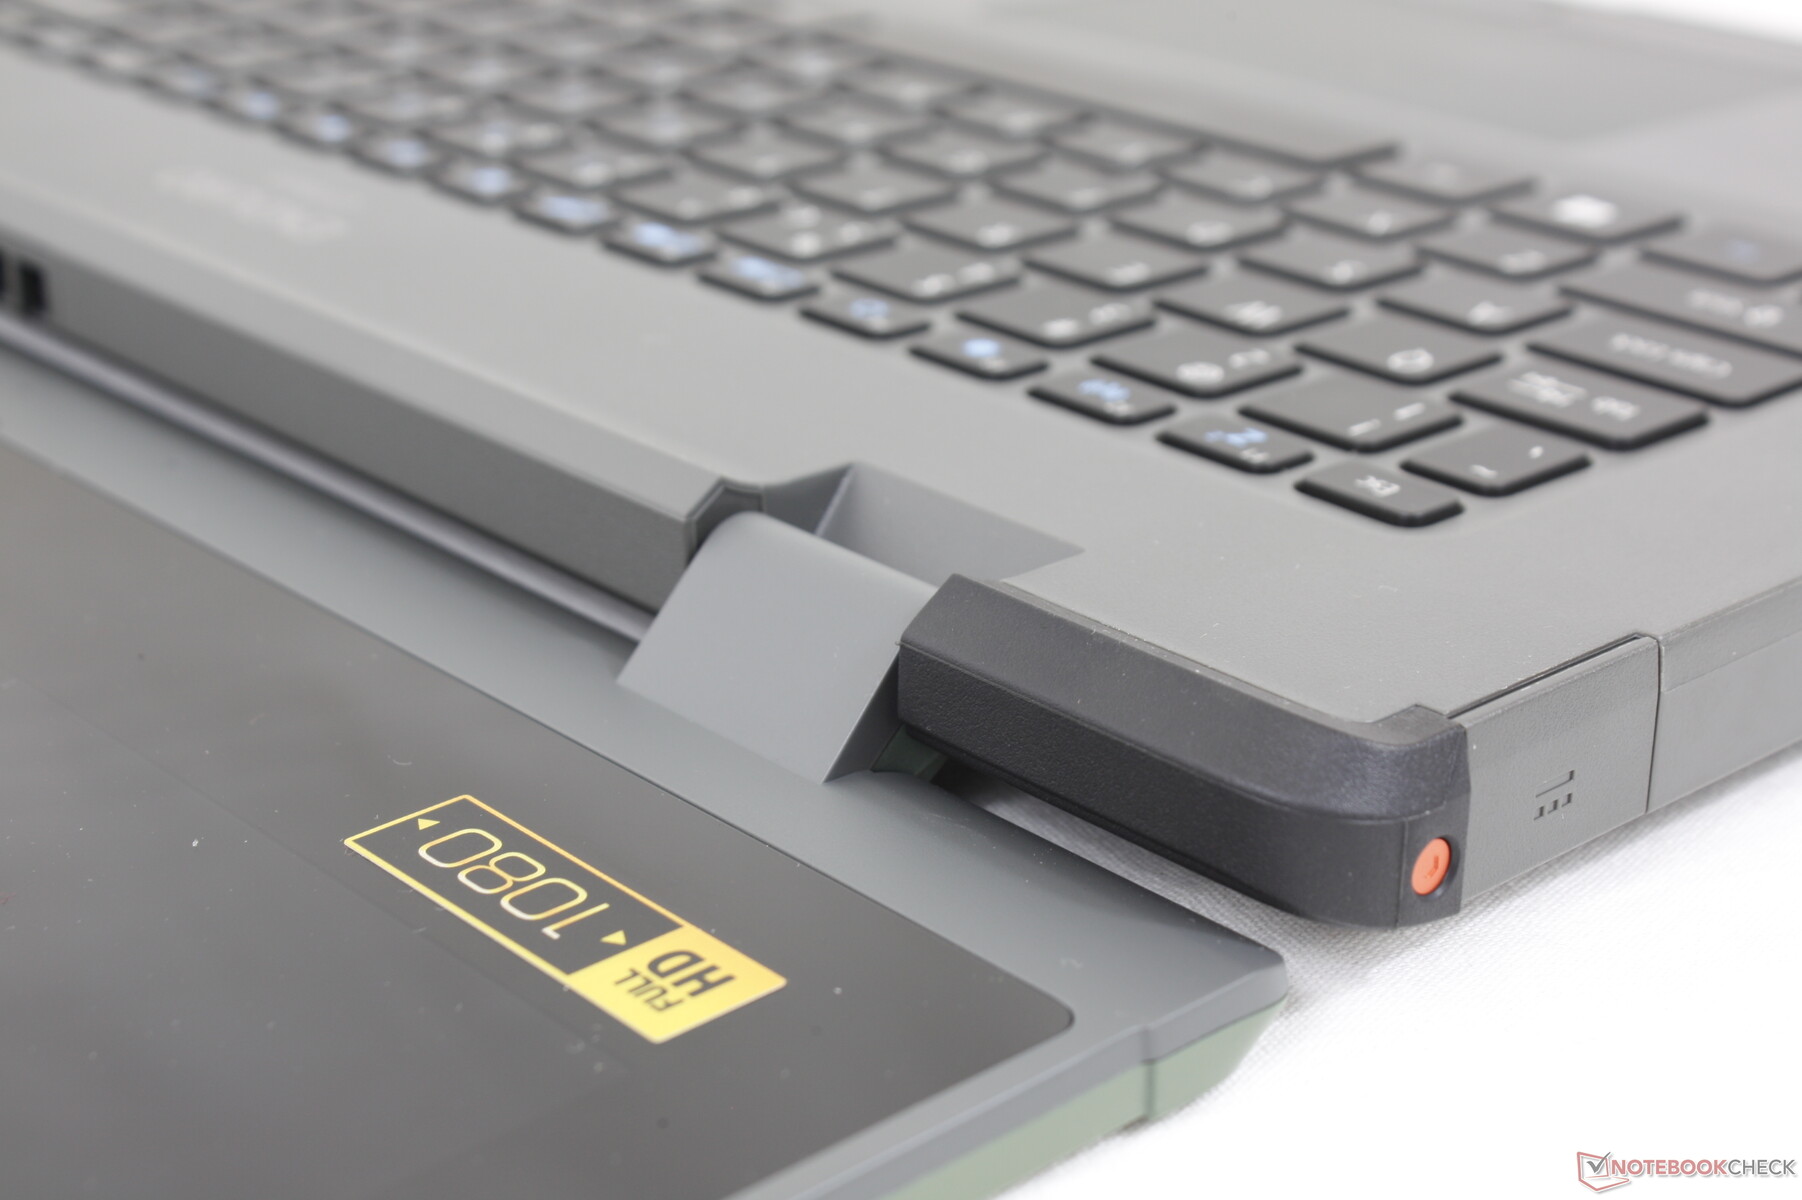
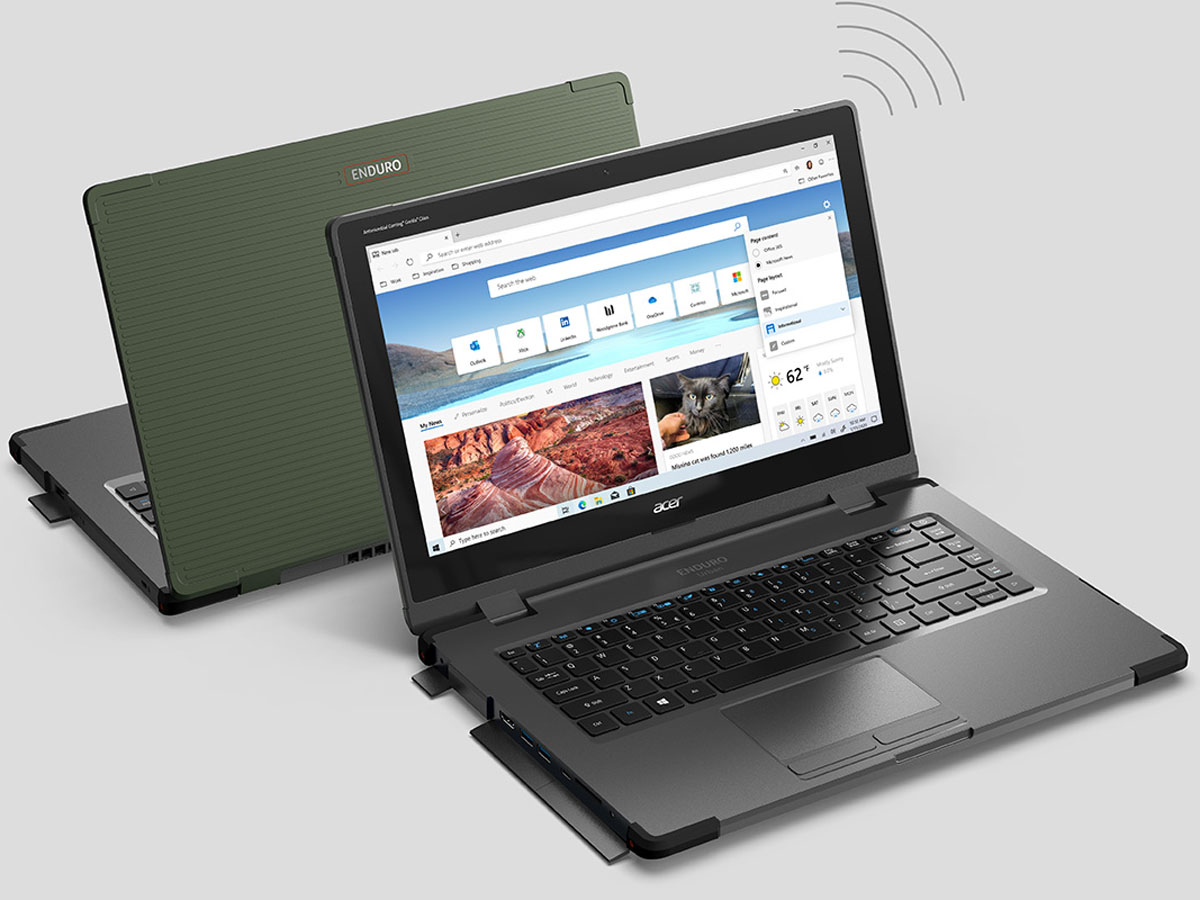
如果强固型或半强固型笔记本电脑和超极本有了孩子,那么它可能看起来很像宏碁的Enduro Urban N3。这款14英寸的笔记本电脑集成了耐用型笔记本电脑的一些常见功能,包括减震保险杠和防水I/O端口,同时保留了传统超极本的便携性。
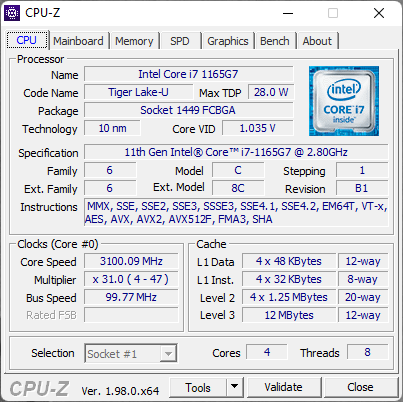
我们审查的配置包括第11代酷睿i7-1165G7处理器,16GB内存和1TB NVMe固态硬盘,价格约为999美元,比许多坚固或半坚固的系统便宜得多。其他SKU可使用旧的第10代酷睿i5-10210U CPU或独立的GeForce MX230图形,但所有选项都包括相同的1080p显示屏。
更多宏碁评论。
Potential Competitors in Comparison
Rating | Date | Model | Weight | Height | Size | Resolution | Price |
|---|---|---|---|---|---|---|---|
| 82.4 % v7 (old) | 12 / 2021 | Acer Enduro Urban N3 EUN314 i7-1165G7, Iris Xe G7 96EUs | 1.8 kg | 21.95 mm | 14.00" | 1920x1080 | |
| 89.2 % v6 (old) | Dell Latitude 5420 Rugged-P85G i7-8650U, Radeon RX 540 | 2.8 kg | 32.9 mm | 14.00" | 1920x1080 | ||
| 83.9 % v7 (old) | 10 / 2021 | Panasonic Toughbook FZ-55 MK2 i7-1185G7, Iris Xe G7 96EUs | 2.3 kg | 33 mm | 14.00" | 1920x1080 | |
v (old) | 09 / 2021 | Durabook S14I i7-1165G7, Iris Xe G7 96EUs | 3 kg | 38.1 mm | 14.00" | 1920x1080 | |
| 81.9 % v6 (old) | Getac S410 i5-8550U, UHD Graphics 620 | 3.2 kg | 34.9 mm | 14.00" | 1366x768 |
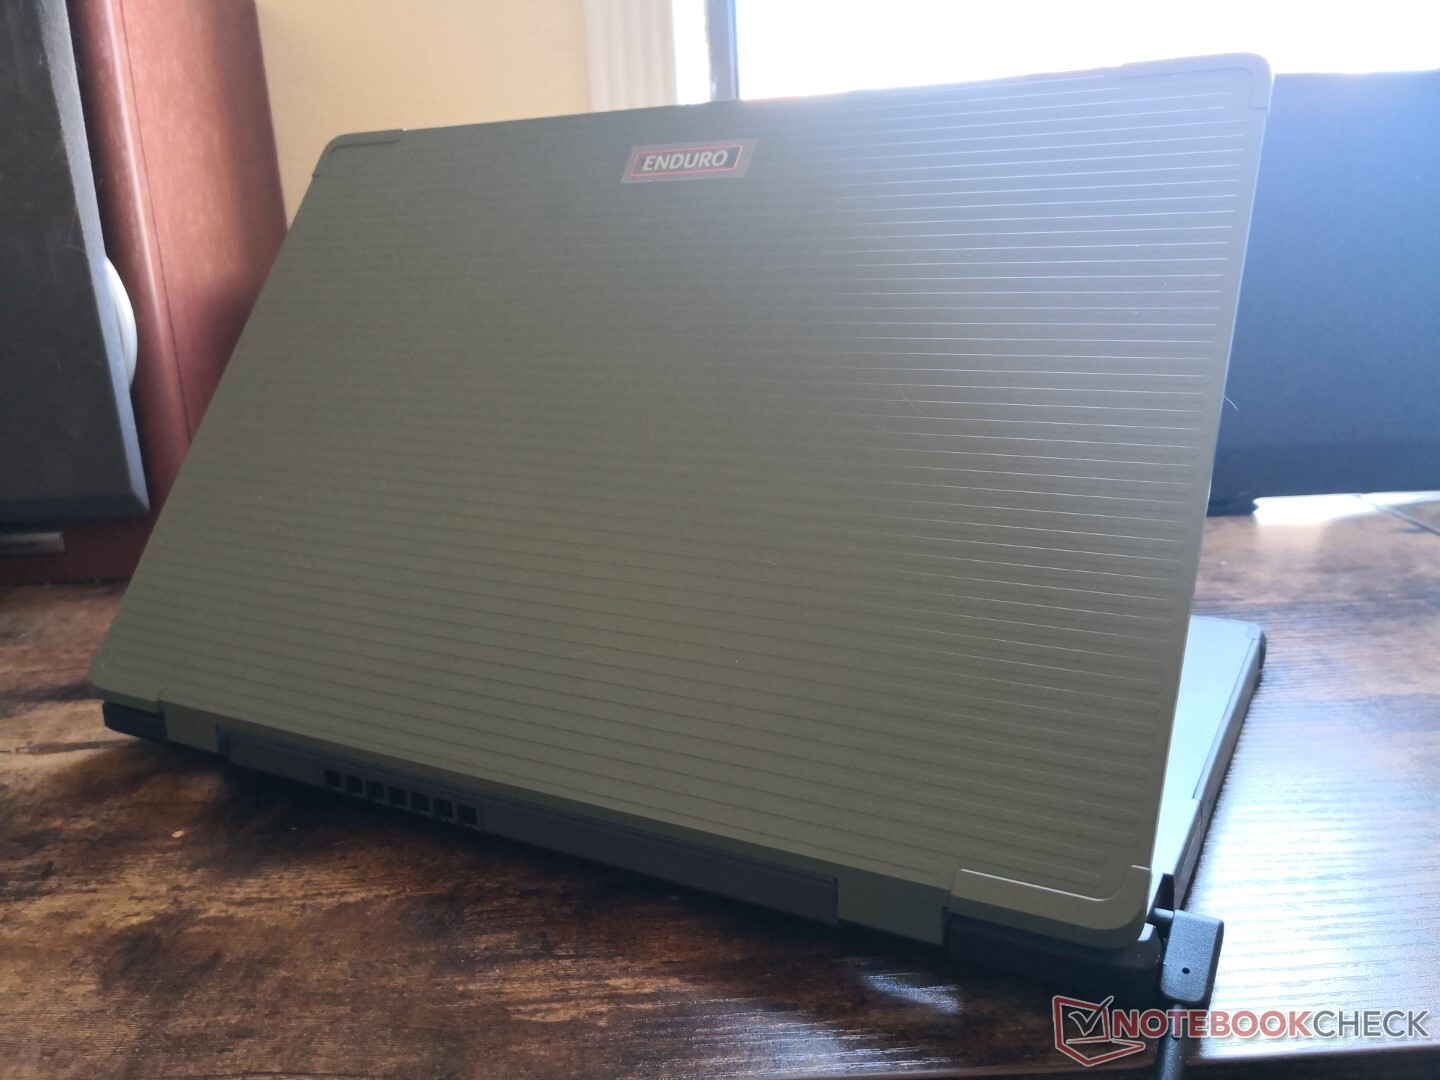
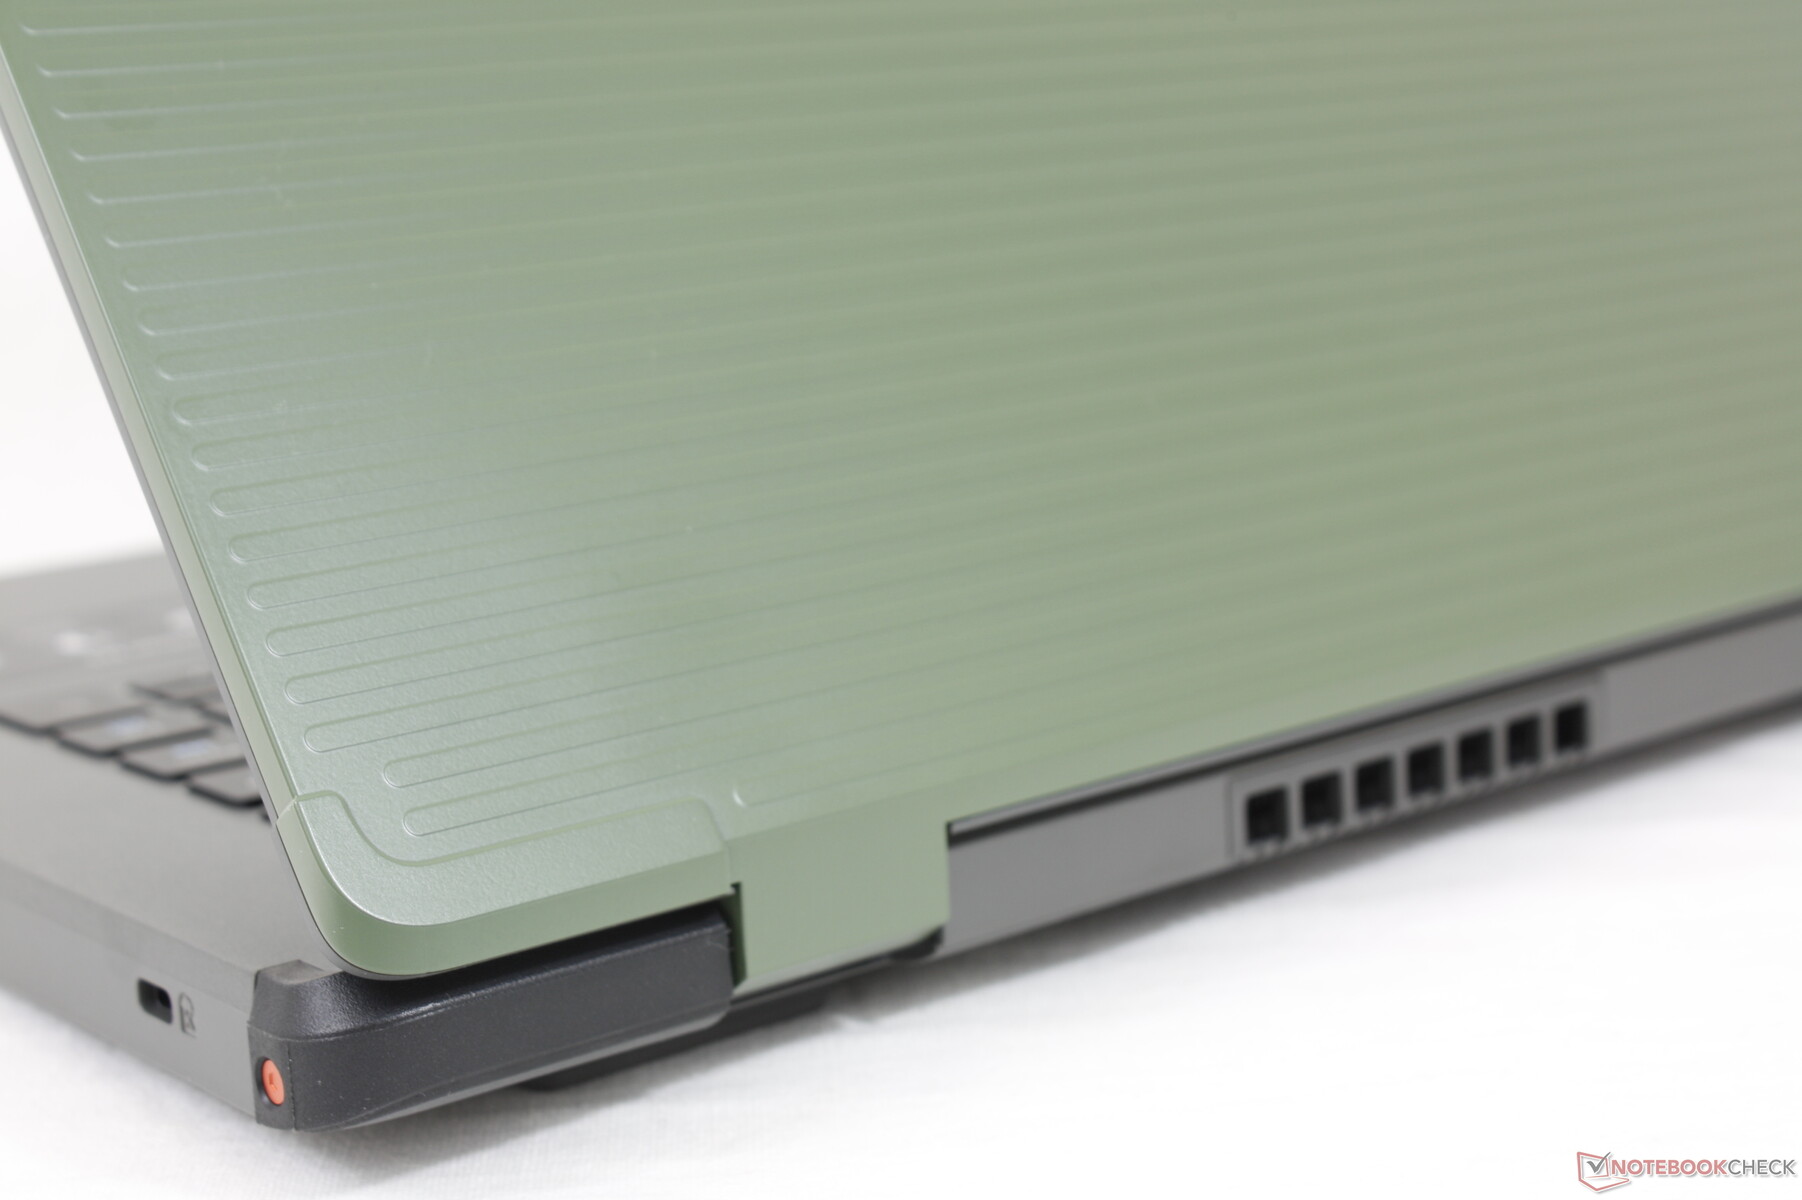
案例
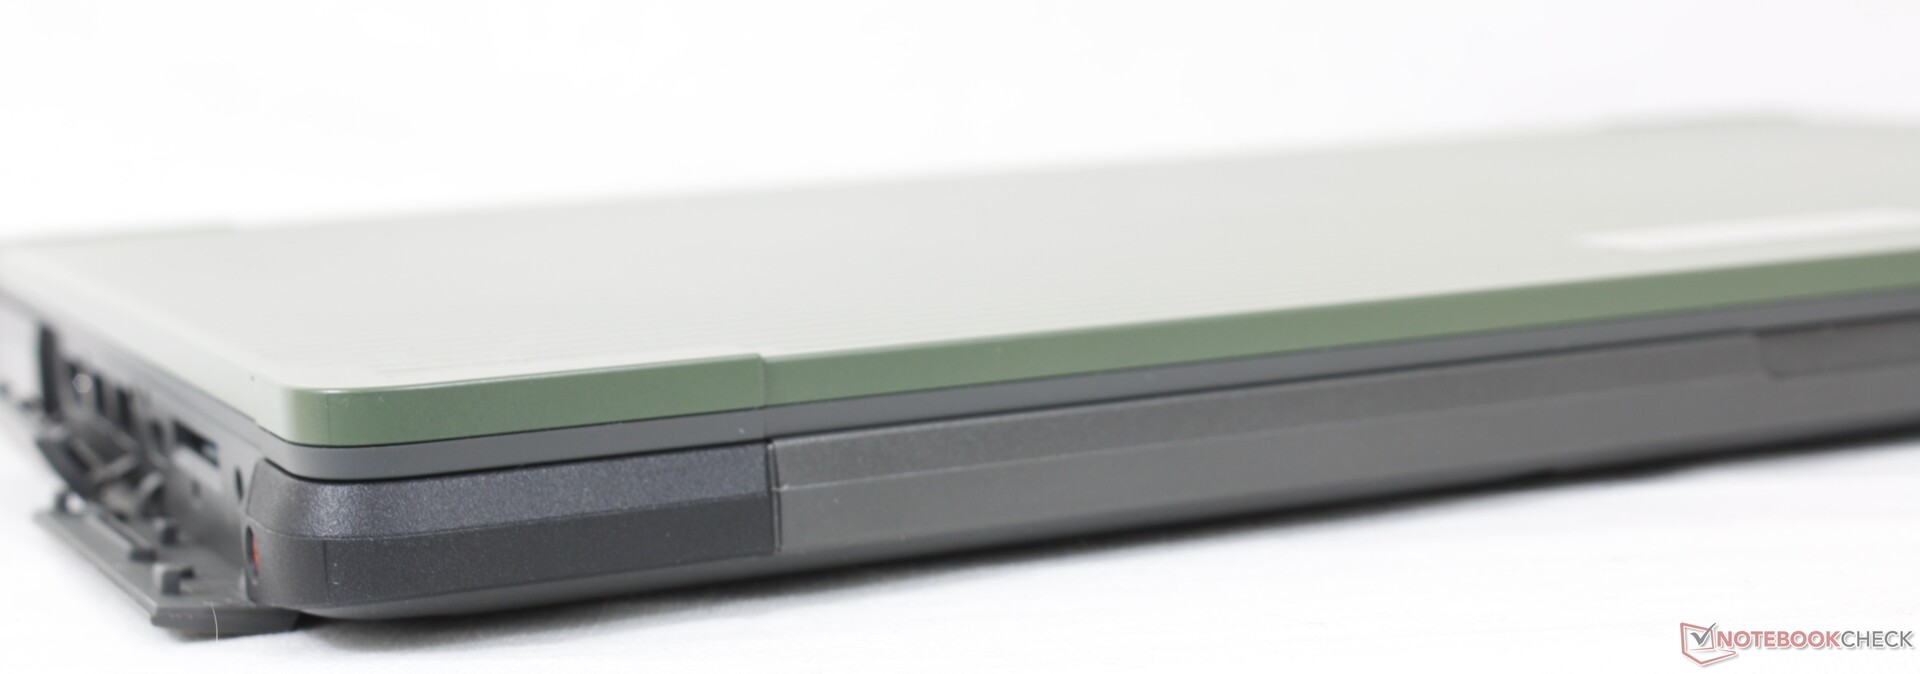
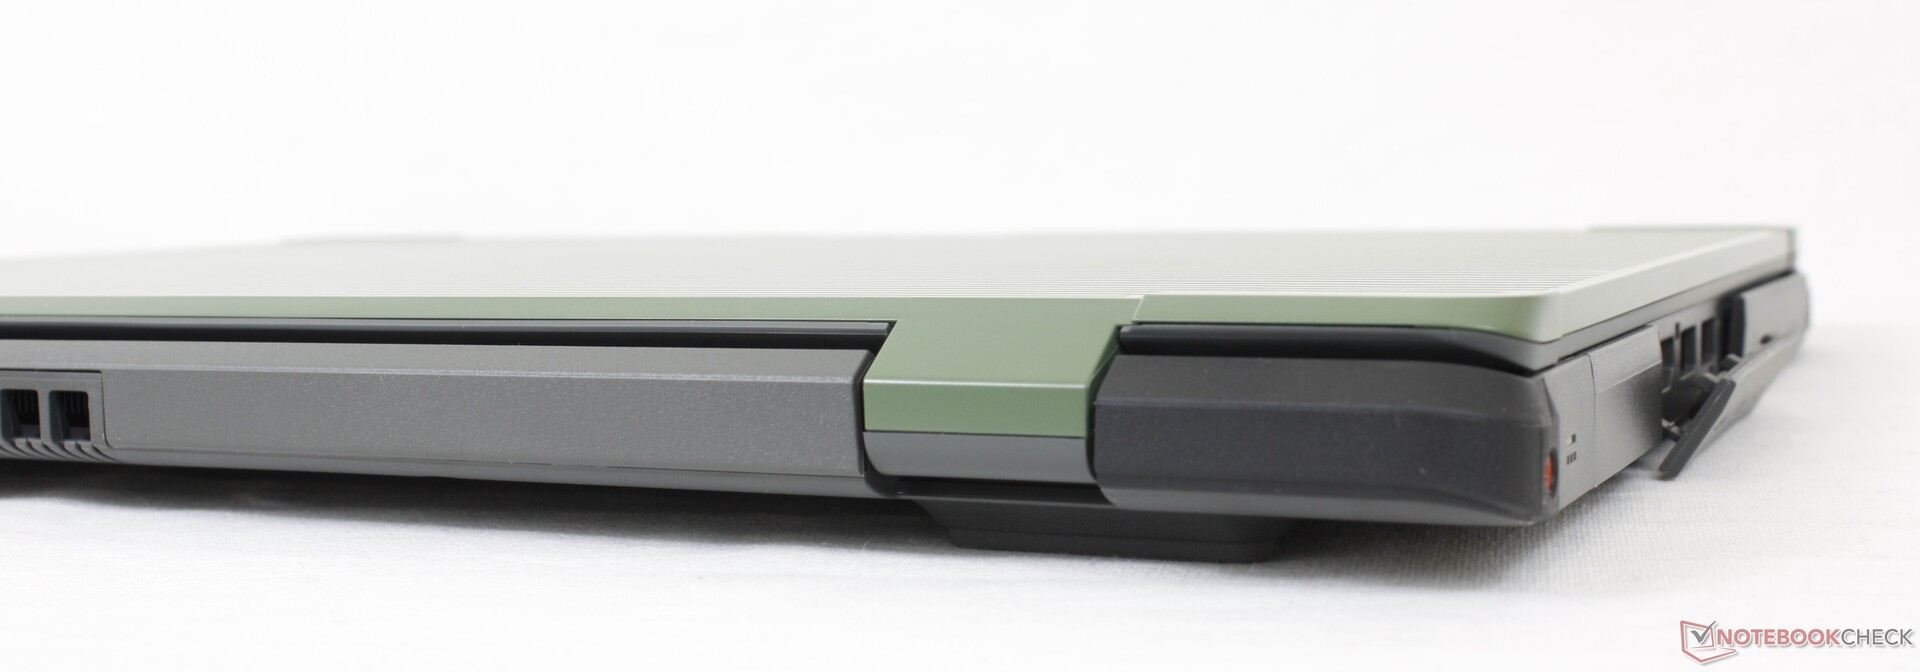
Urban N3最显著的特点是它的便携性和相对于其他14英寸坚固设备的小尺寸。宏碁系统仅有1.8公斤,比Getac S410轻了几百克。 Getac S410或松下Toughbook FZ-55 MK2在尺寸上更接近于典型的15.6英寸消费类笔记本电脑。其厚厚的边框可能很难看,但像Enduro这样的坚固耐用的家庭一直都是功能大于形式。
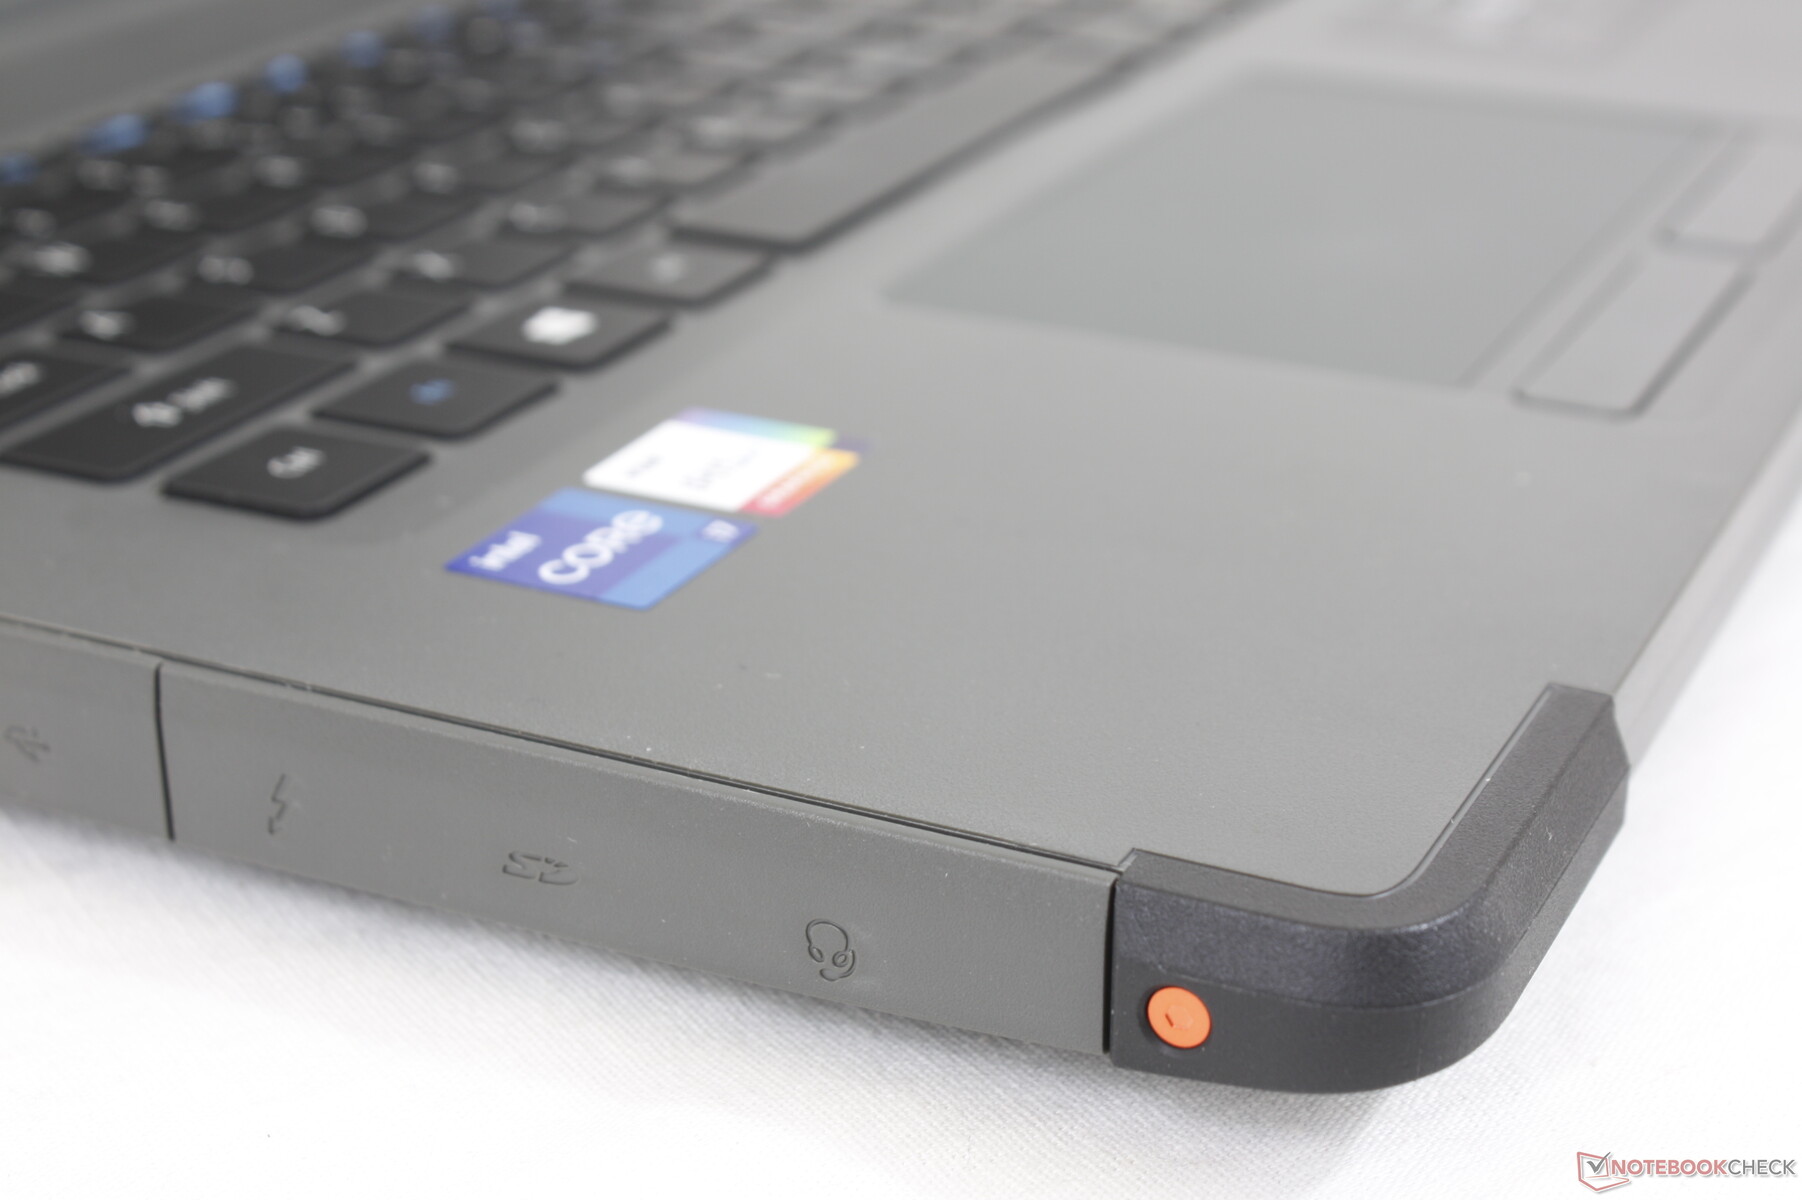
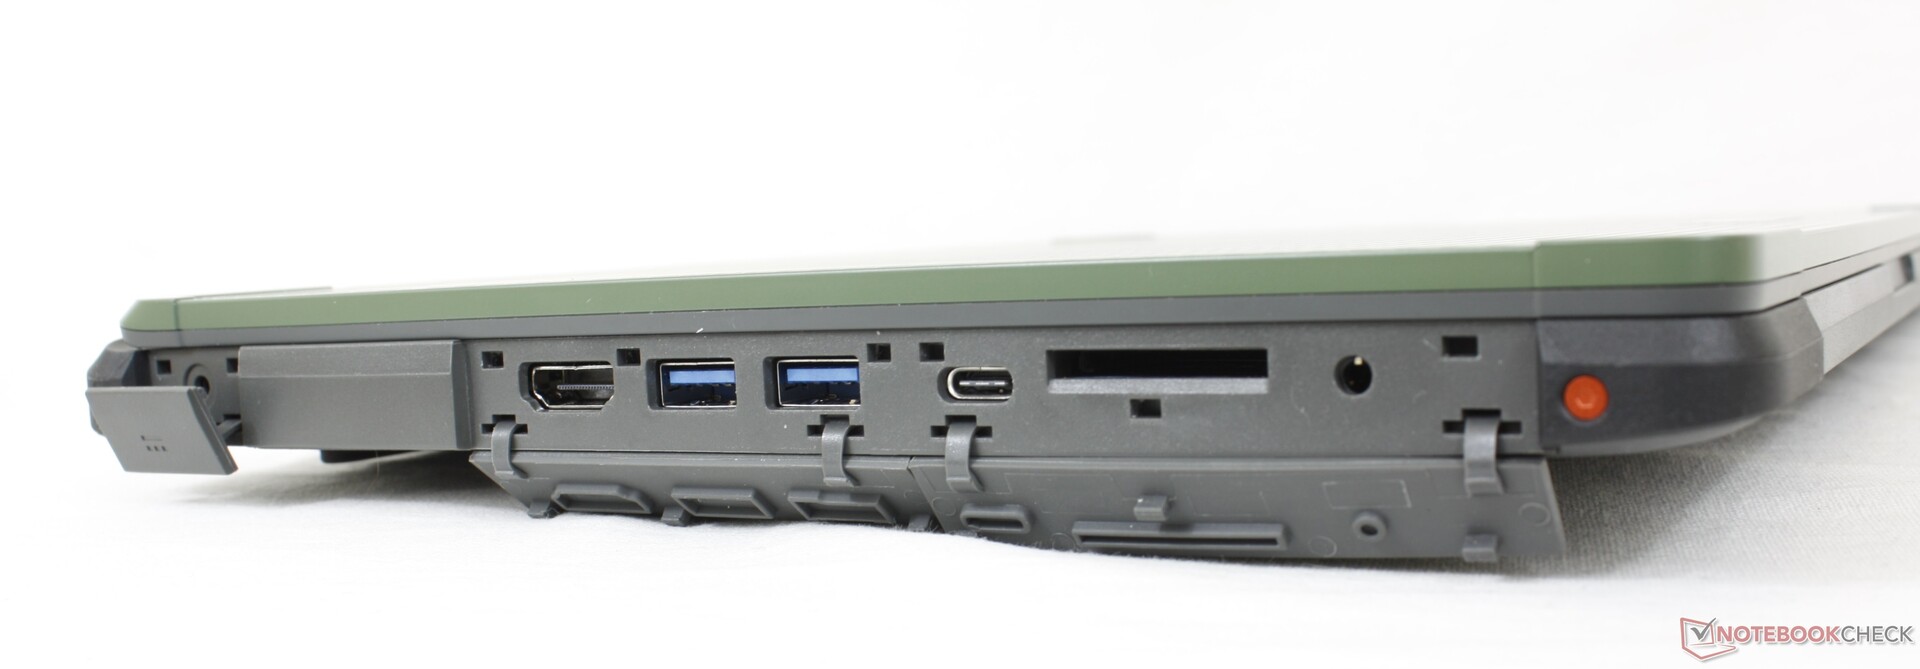
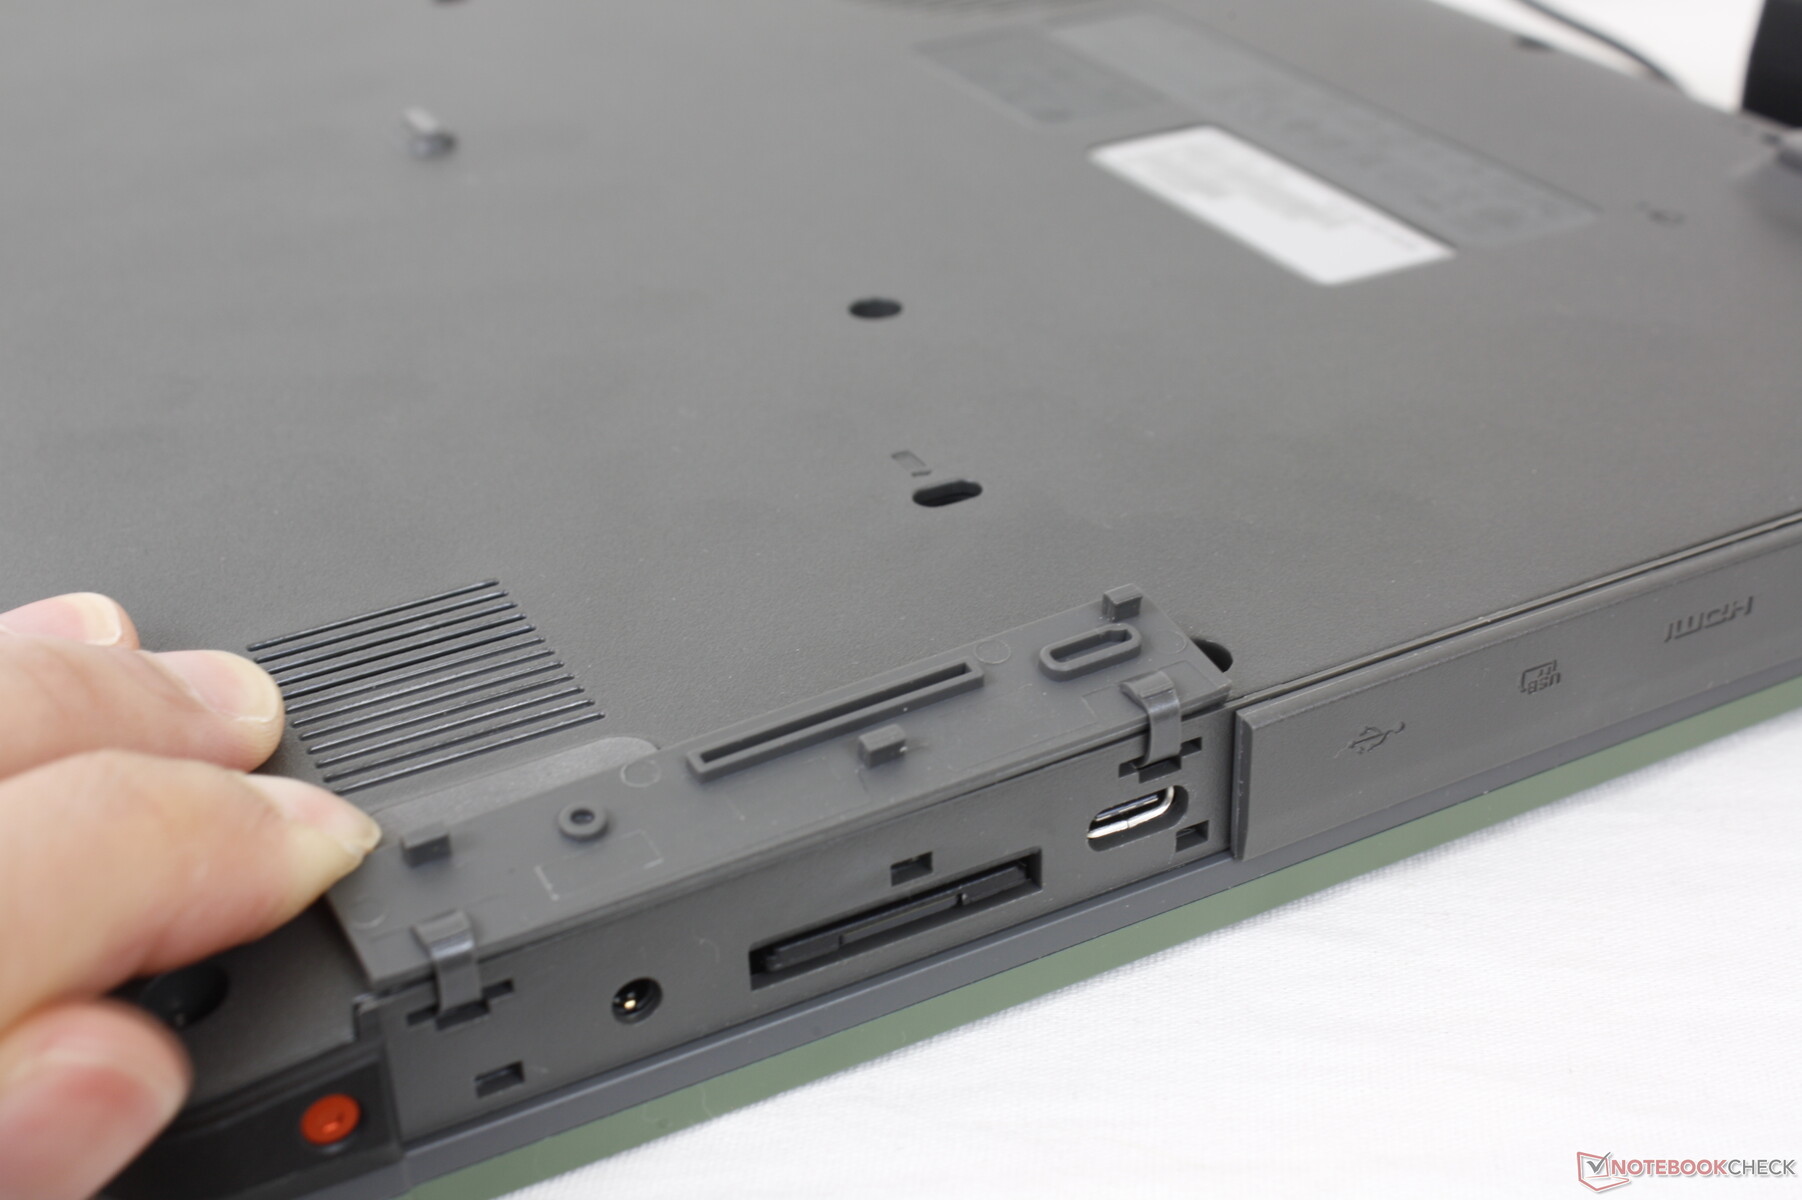
连接性
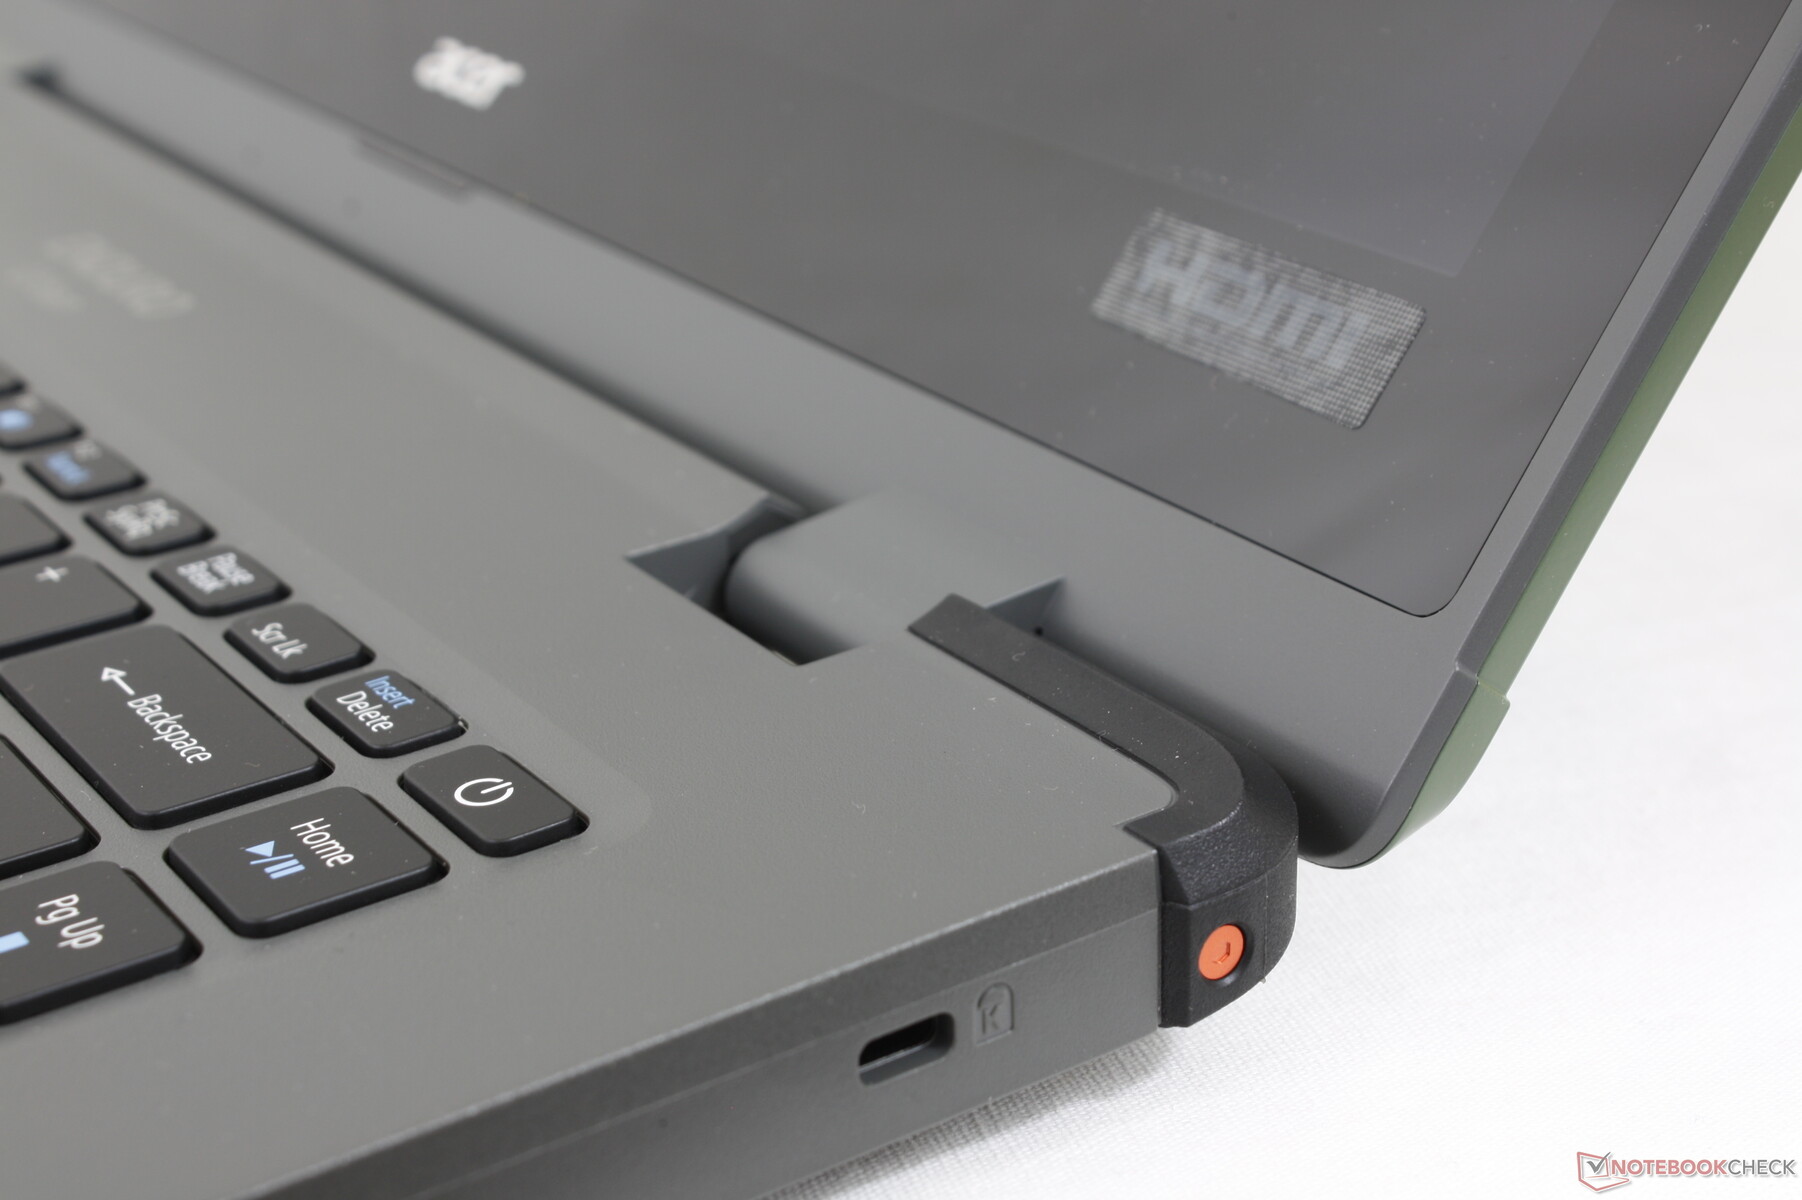
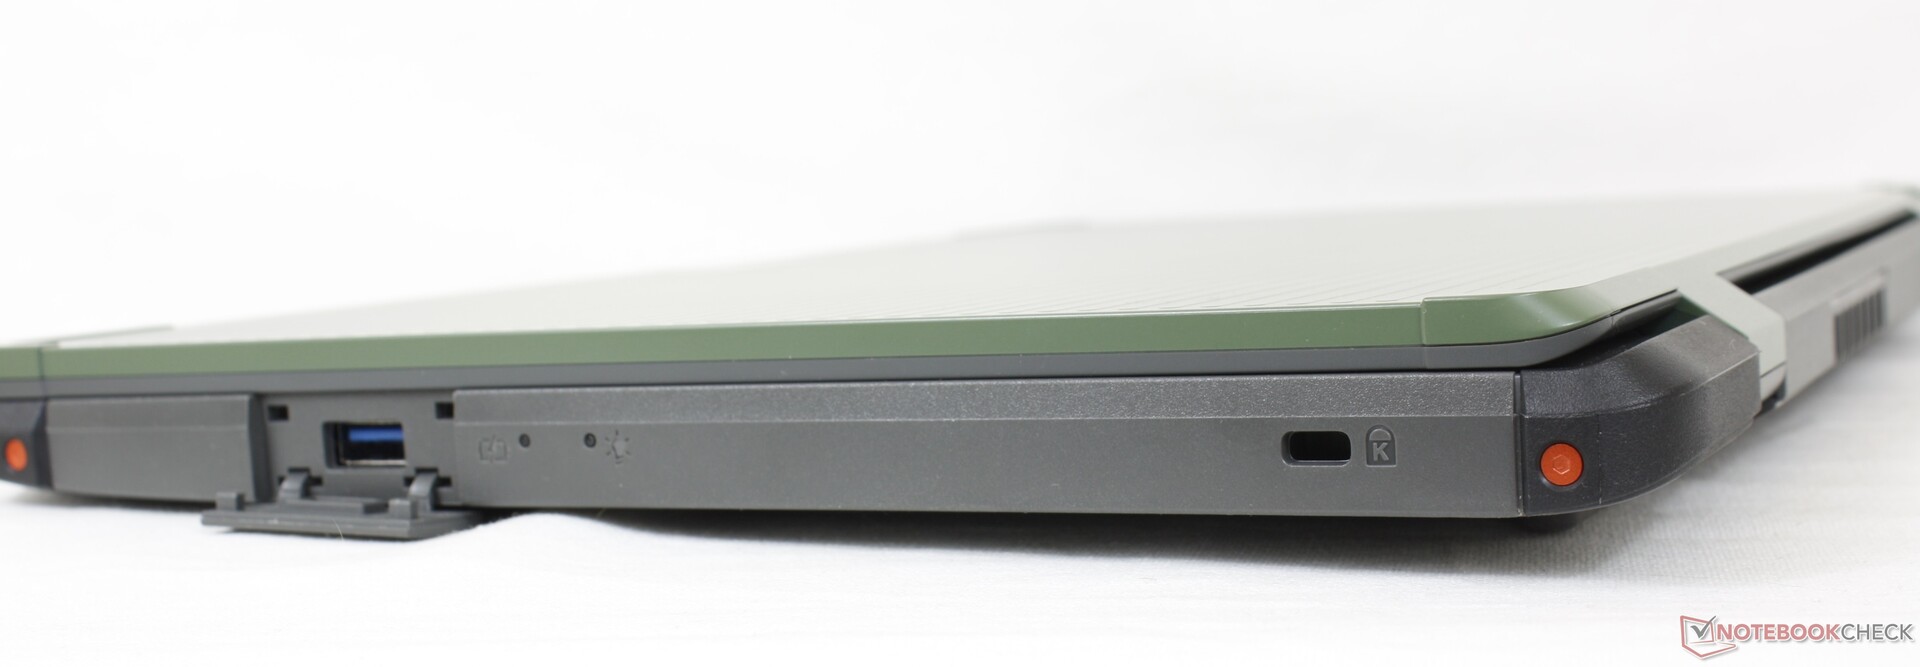
端口选项与许多超极本相似,包括所有重要的Thunderbolt 4端口。坚固耐用的笔记本电脑上的常规端口,如串行RS232、VGA和RJ-45被省略了。
SD卡阅读器
集成的SD卡读卡器很慢。将1GB的图片从我们的UHS-II测试卡移动到桌面需要大约45秒,而Getac S410只需要12秒。
| SD Card Reader | |
| average JPG Copy Test (av. of 3 runs) | |
| Dell Latitude 5420 Rugged-P85G (Toshiba Exceria Pro SDXC 64 GB UHS-II) | |
| Getac S410 (Toshiba Exceria Pro SDXC 64 GB UHS-II) | |
| Panasonic Toughbook FZ-55 MK2 (AV Pro V60) | |
| Acer Enduro Urban N3 EUN314 (AV Pro V60) | |
| Durabook S14I (Angelbird 128GB AV Pro UHS-II) | |
| maximum AS SSD Seq Read Test (1GB) | |
| Dell Latitude 5420 Rugged-P85G (Toshiba Exceria Pro SDXC 64 GB UHS-II) | |
| Panasonic Toughbook FZ-55 MK2 (AV Pro V60) | |
| Getac S410 (Toshiba Exceria Pro SDXC 64 GB UHS-II) | |
| Durabook S14I (Angelbird 128GB AV Pro UHS-II) | |
| Acer Enduro Urban N3 EUN314 (AV Pro V60) | |
沟通
| Networking | |
| iperf3 transmit AX12 | |
| Acer Enduro Urban N3 EUN314 | |
| Panasonic Toughbook FZ-55 MK2 | |
| Durabook S14I | |
| Dell Latitude 5420 Rugged-P85G | |
| Getac S410 | |
| iperf3 receive AX12 | |
| Durabook S14I | |
| Acer Enduro Urban N3 EUN314 | |
| Panasonic Toughbook FZ-55 MK2 | |
| Dell Latitude 5420 Rugged-P85G | |
| Getac S410 | |
网络摄像头
720p网络摄像头的质量很差,没有隐私快门或红外摄像头。


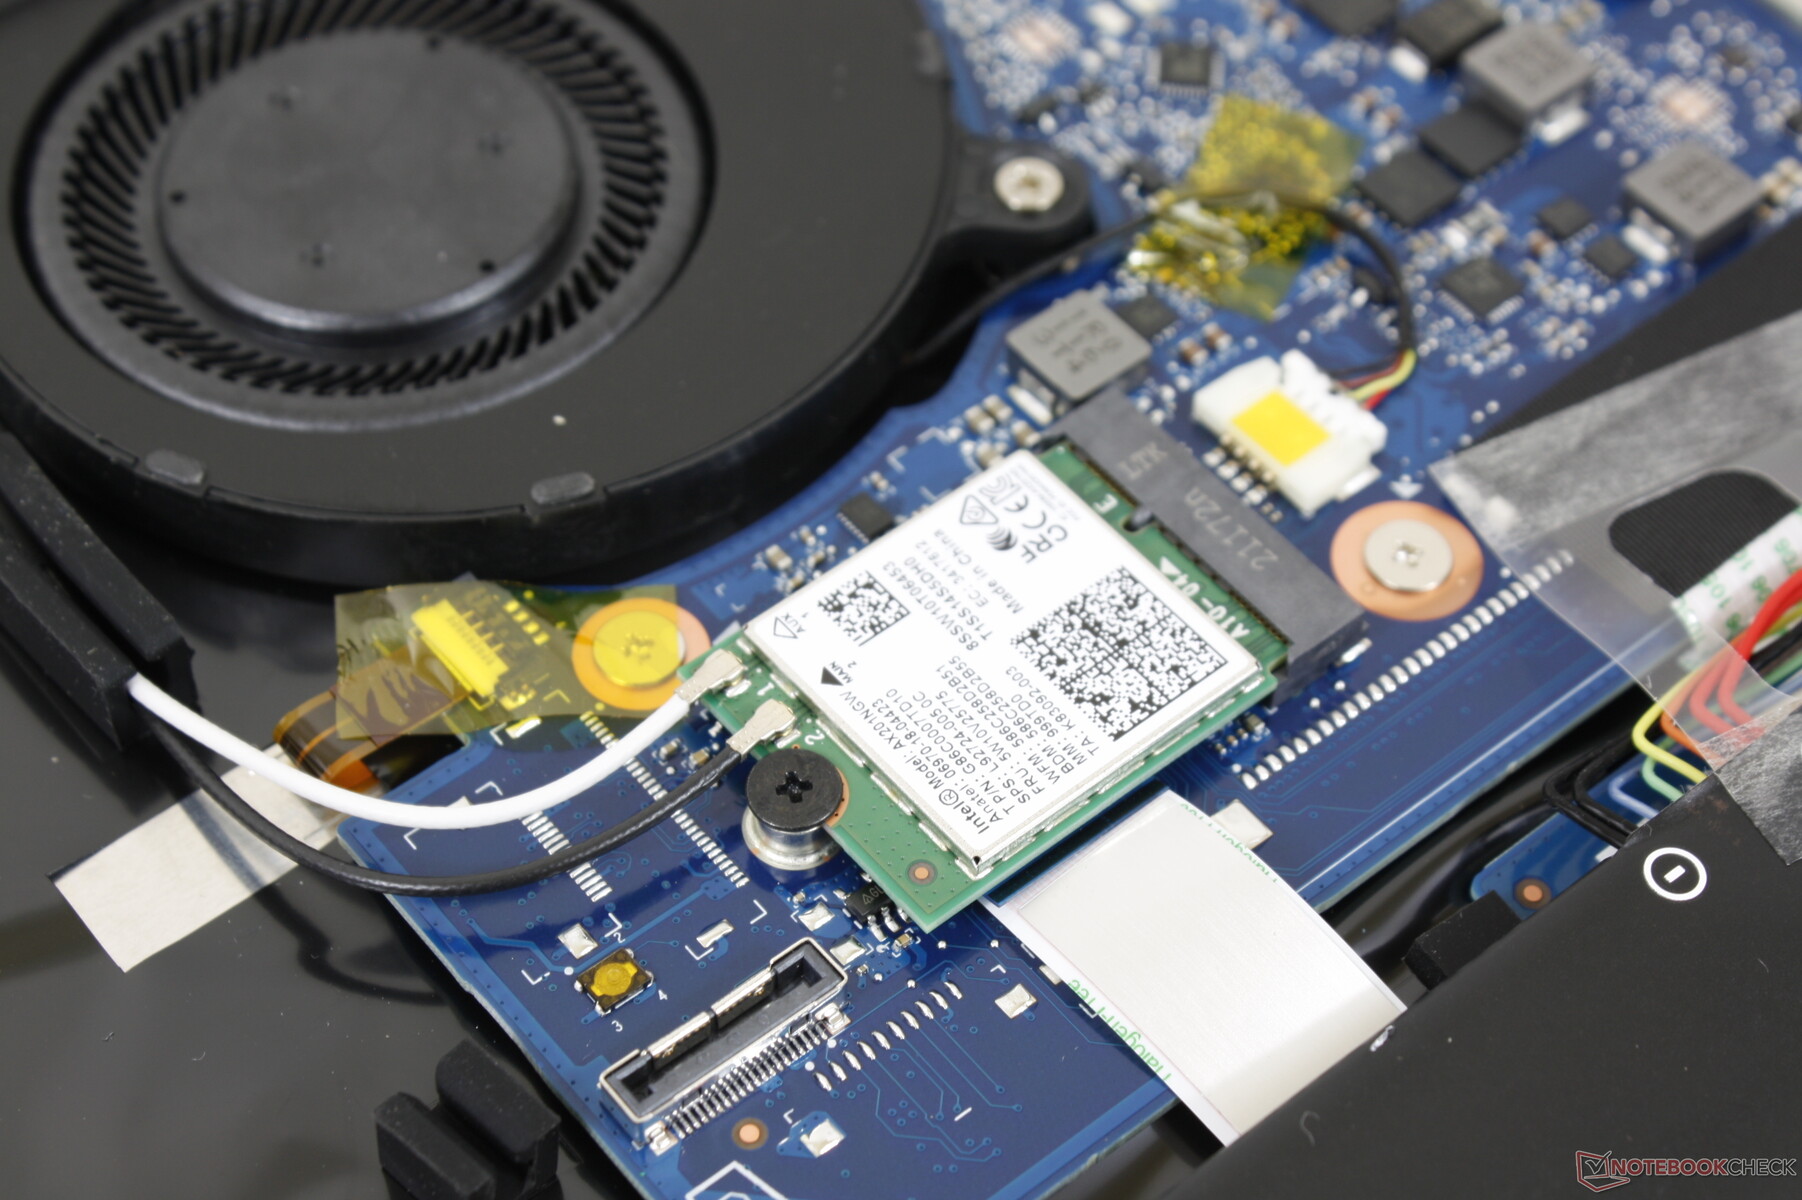
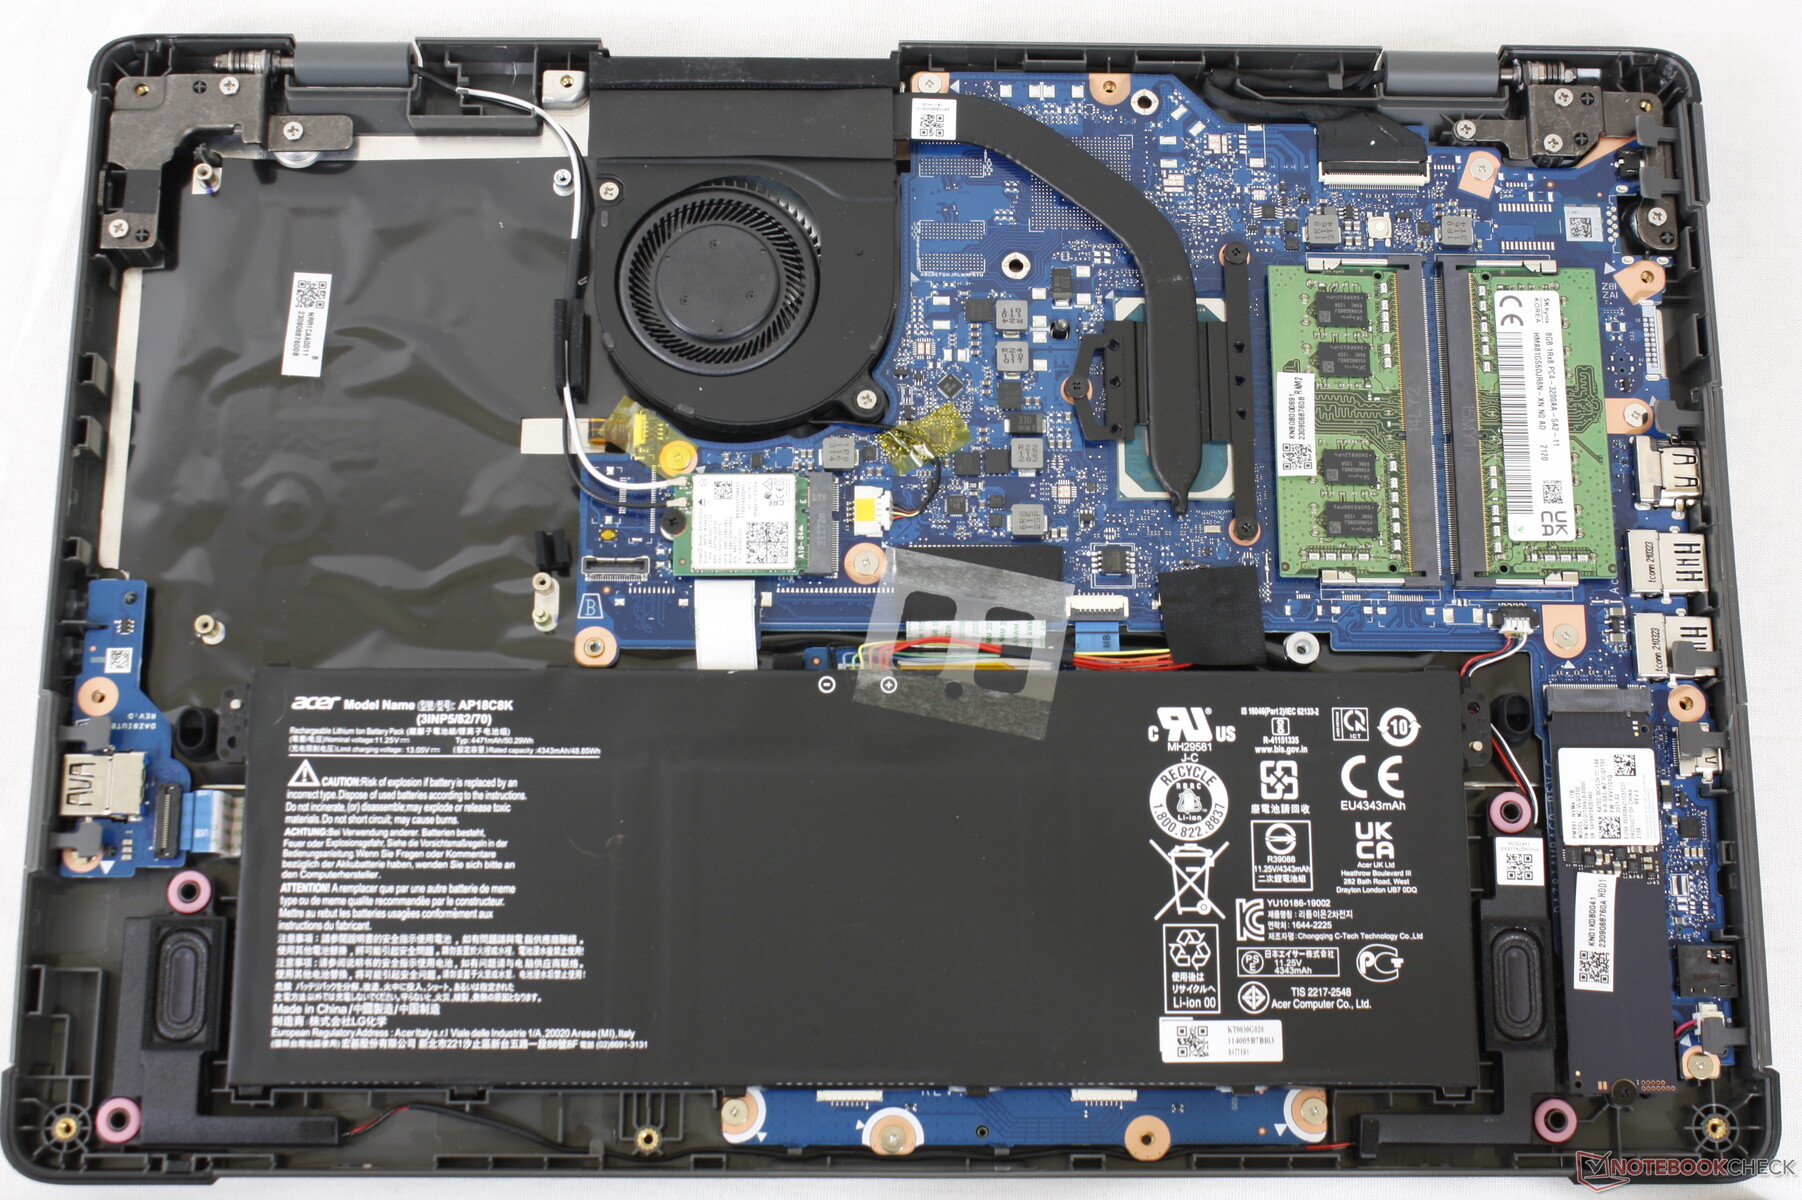
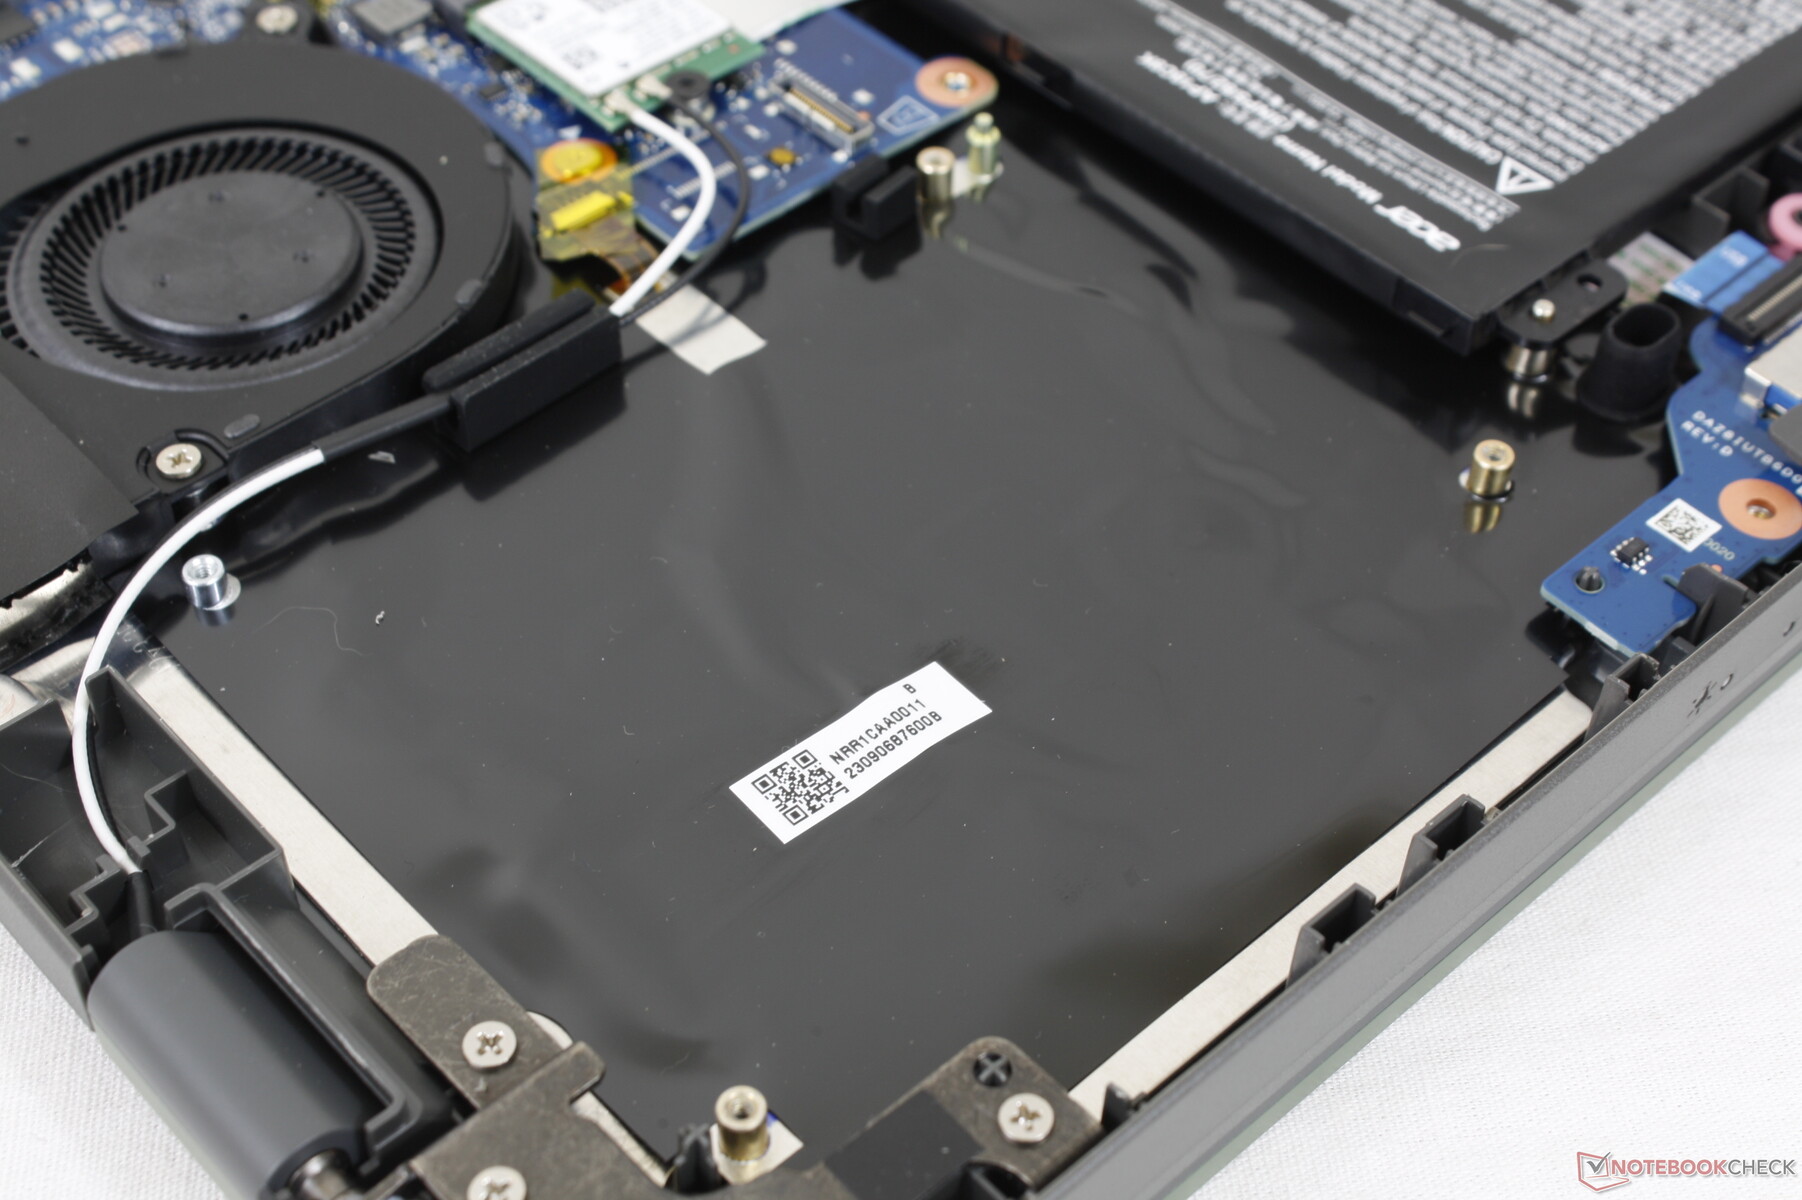
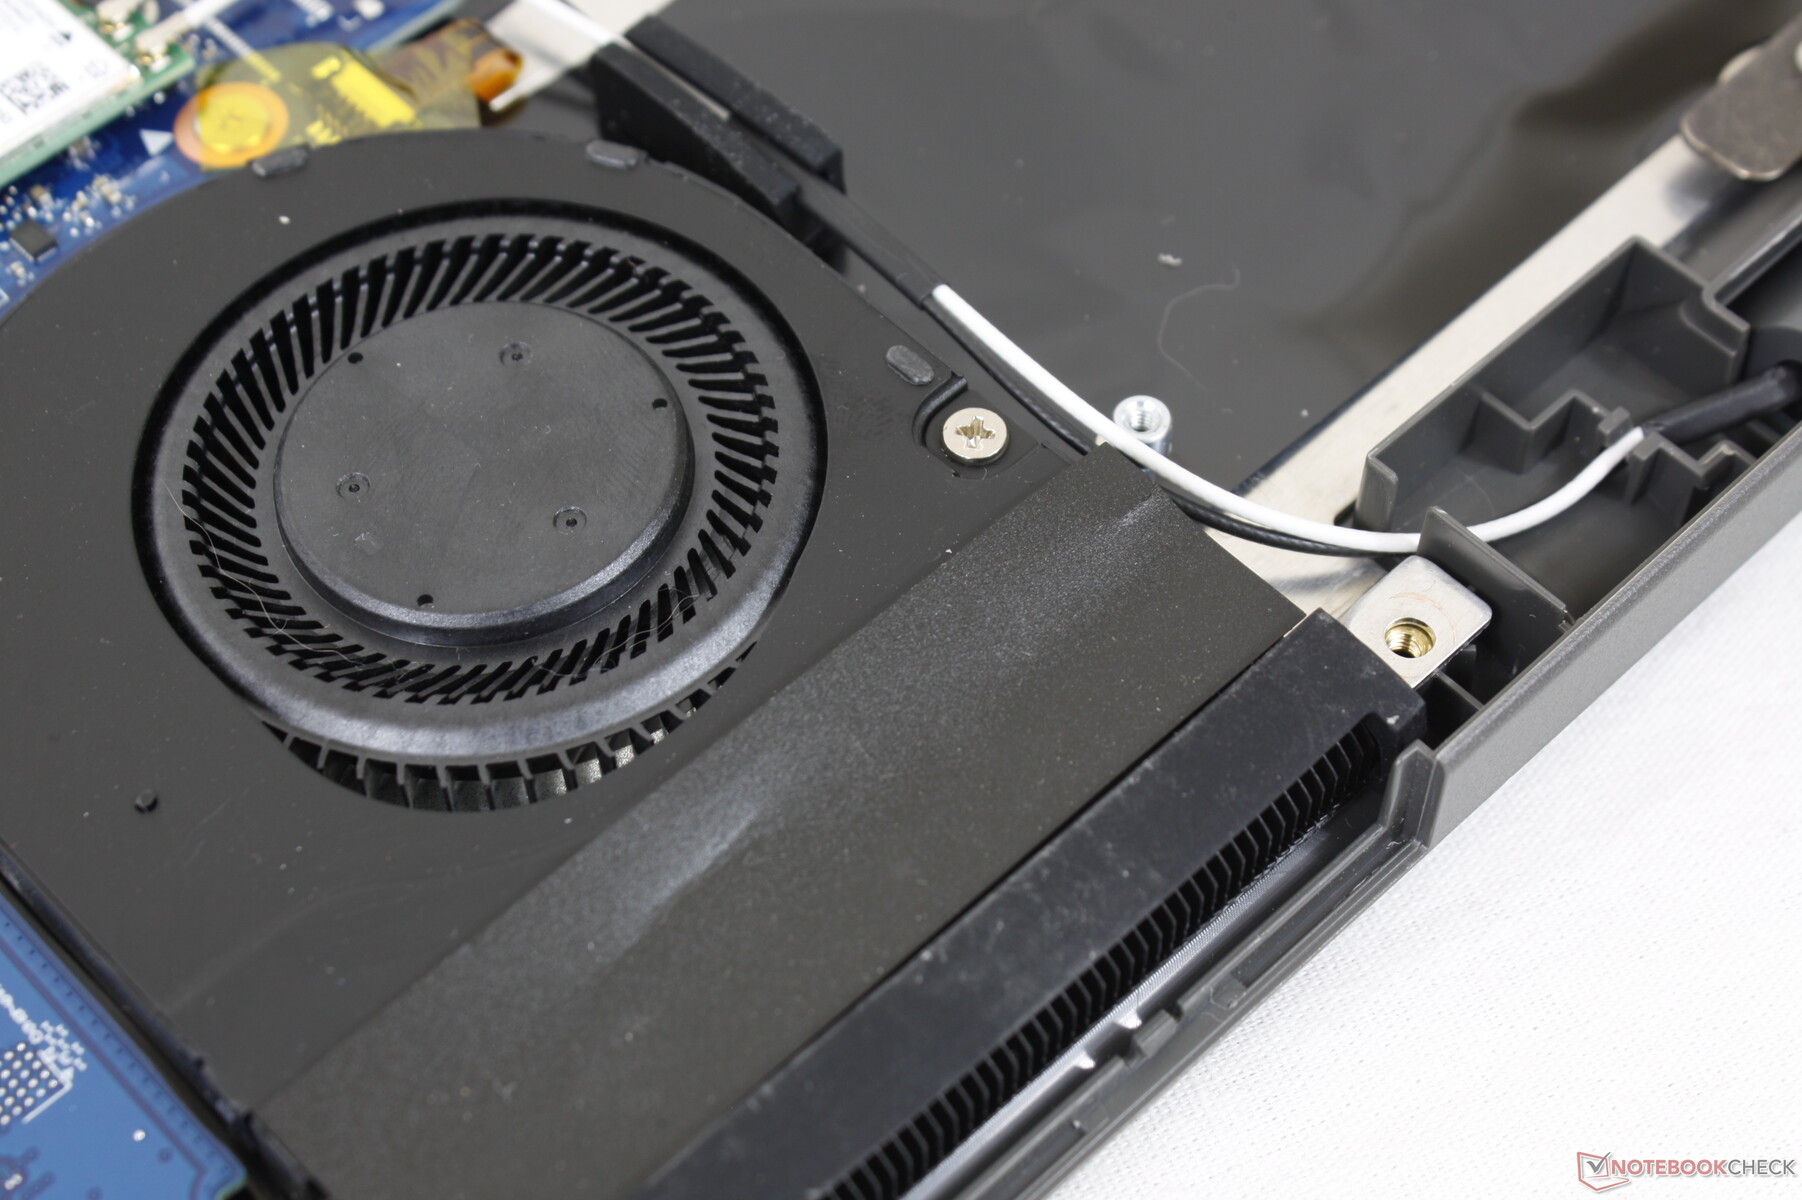
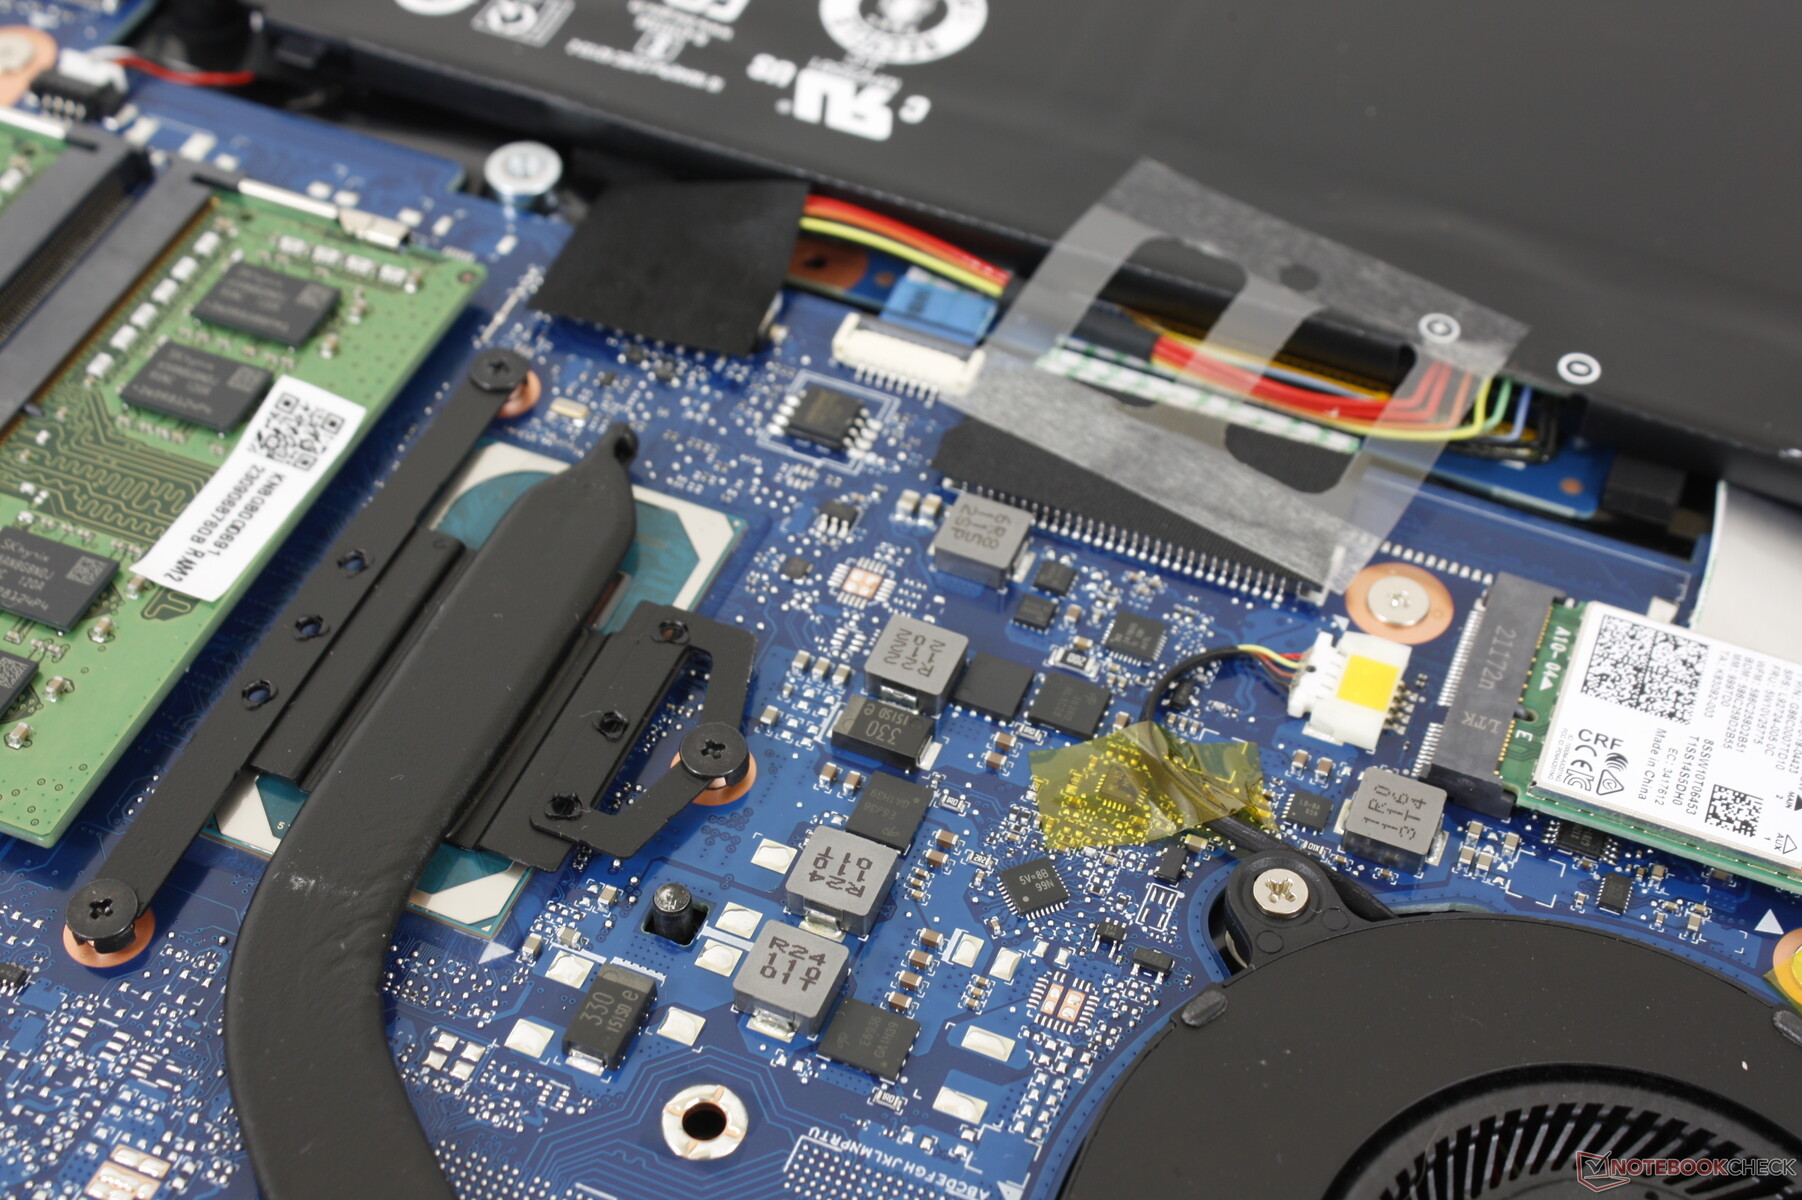
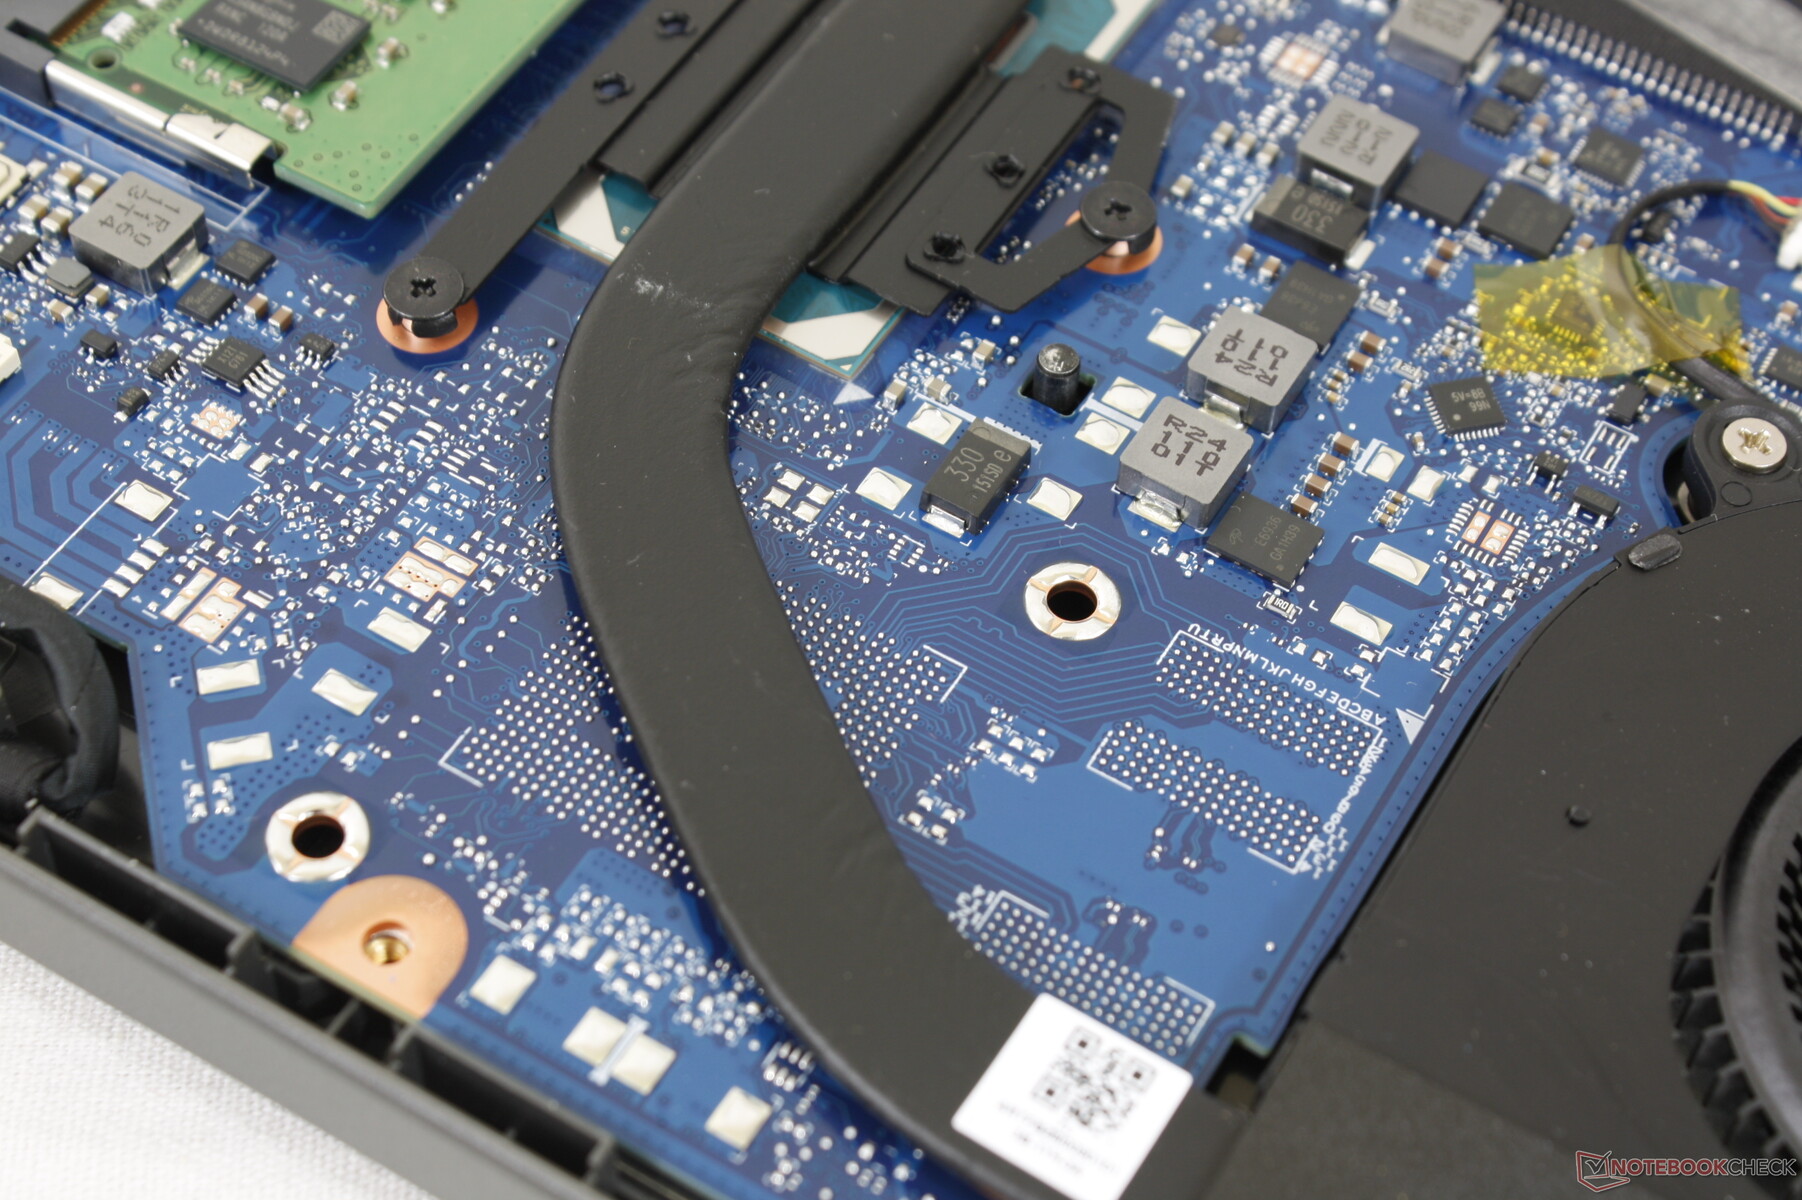
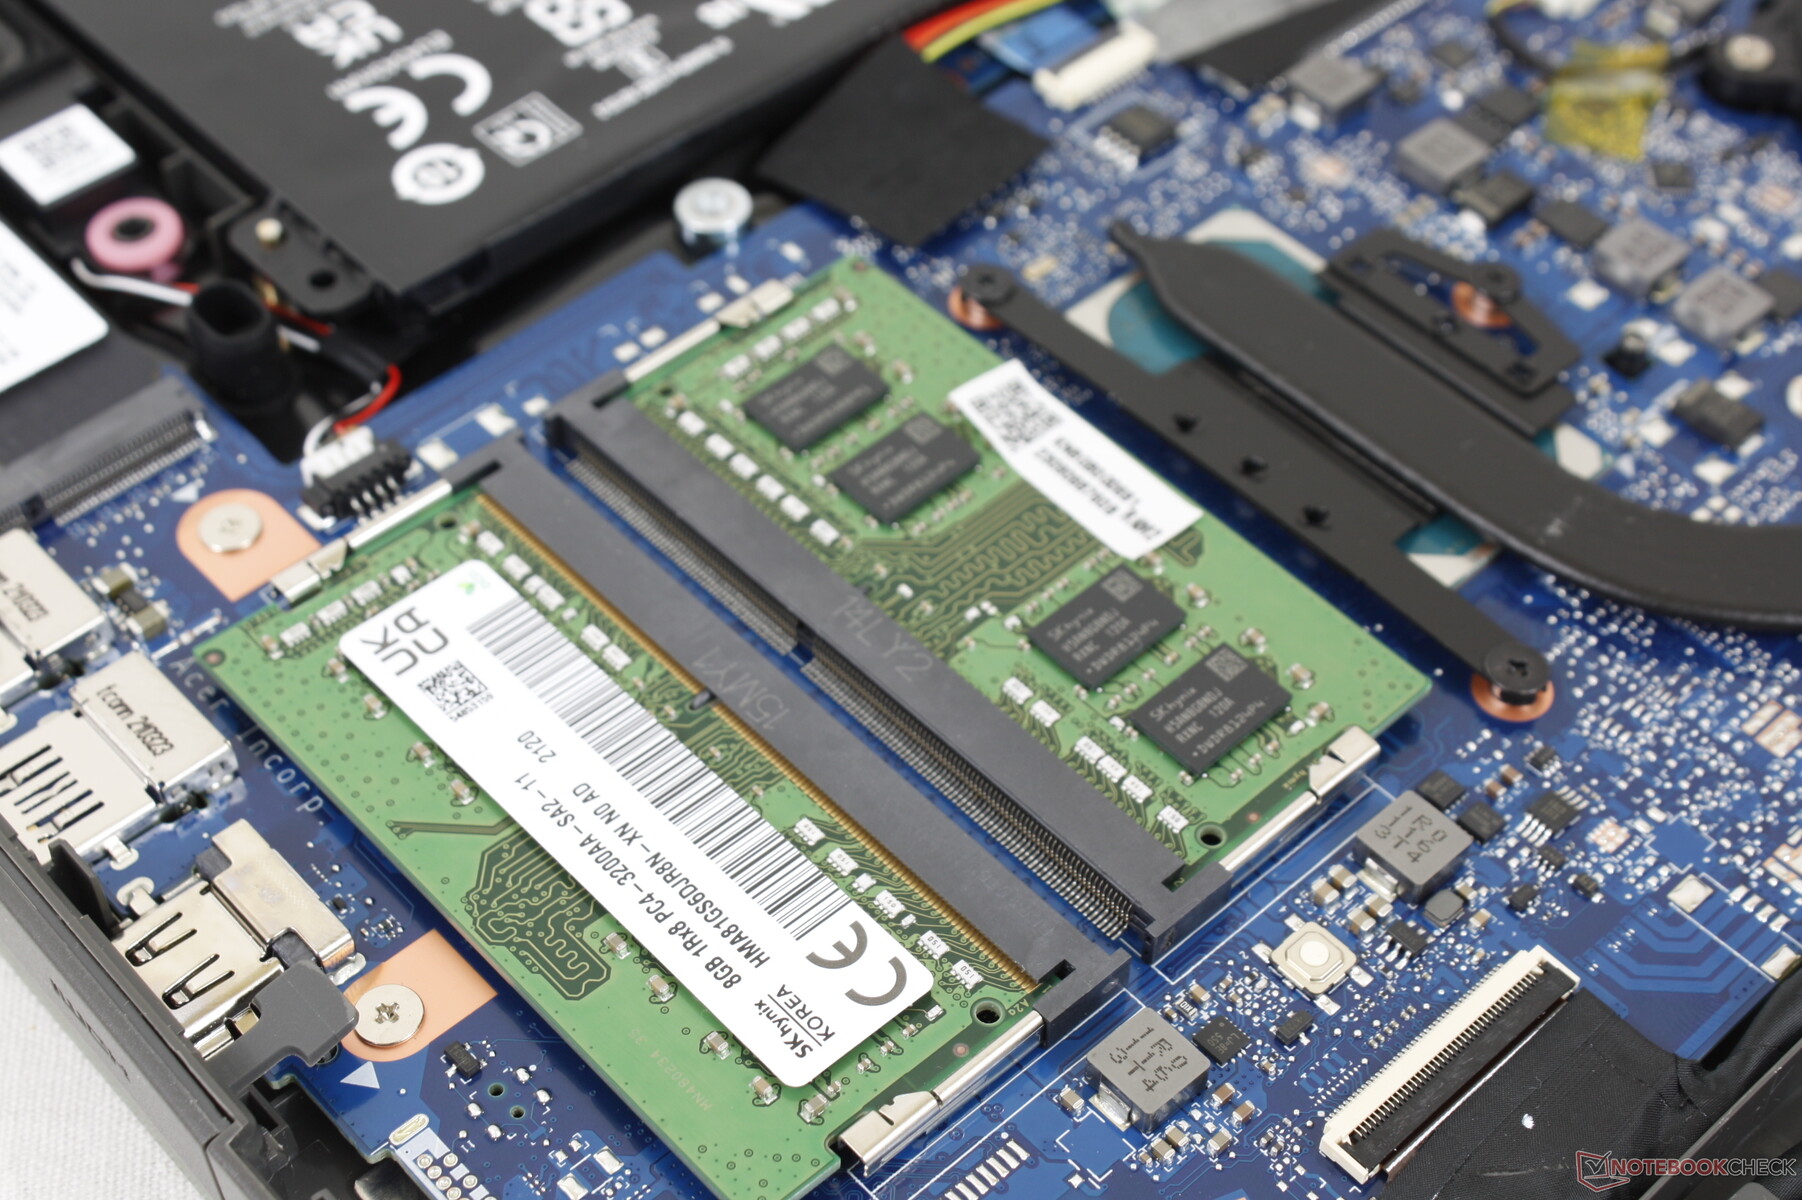
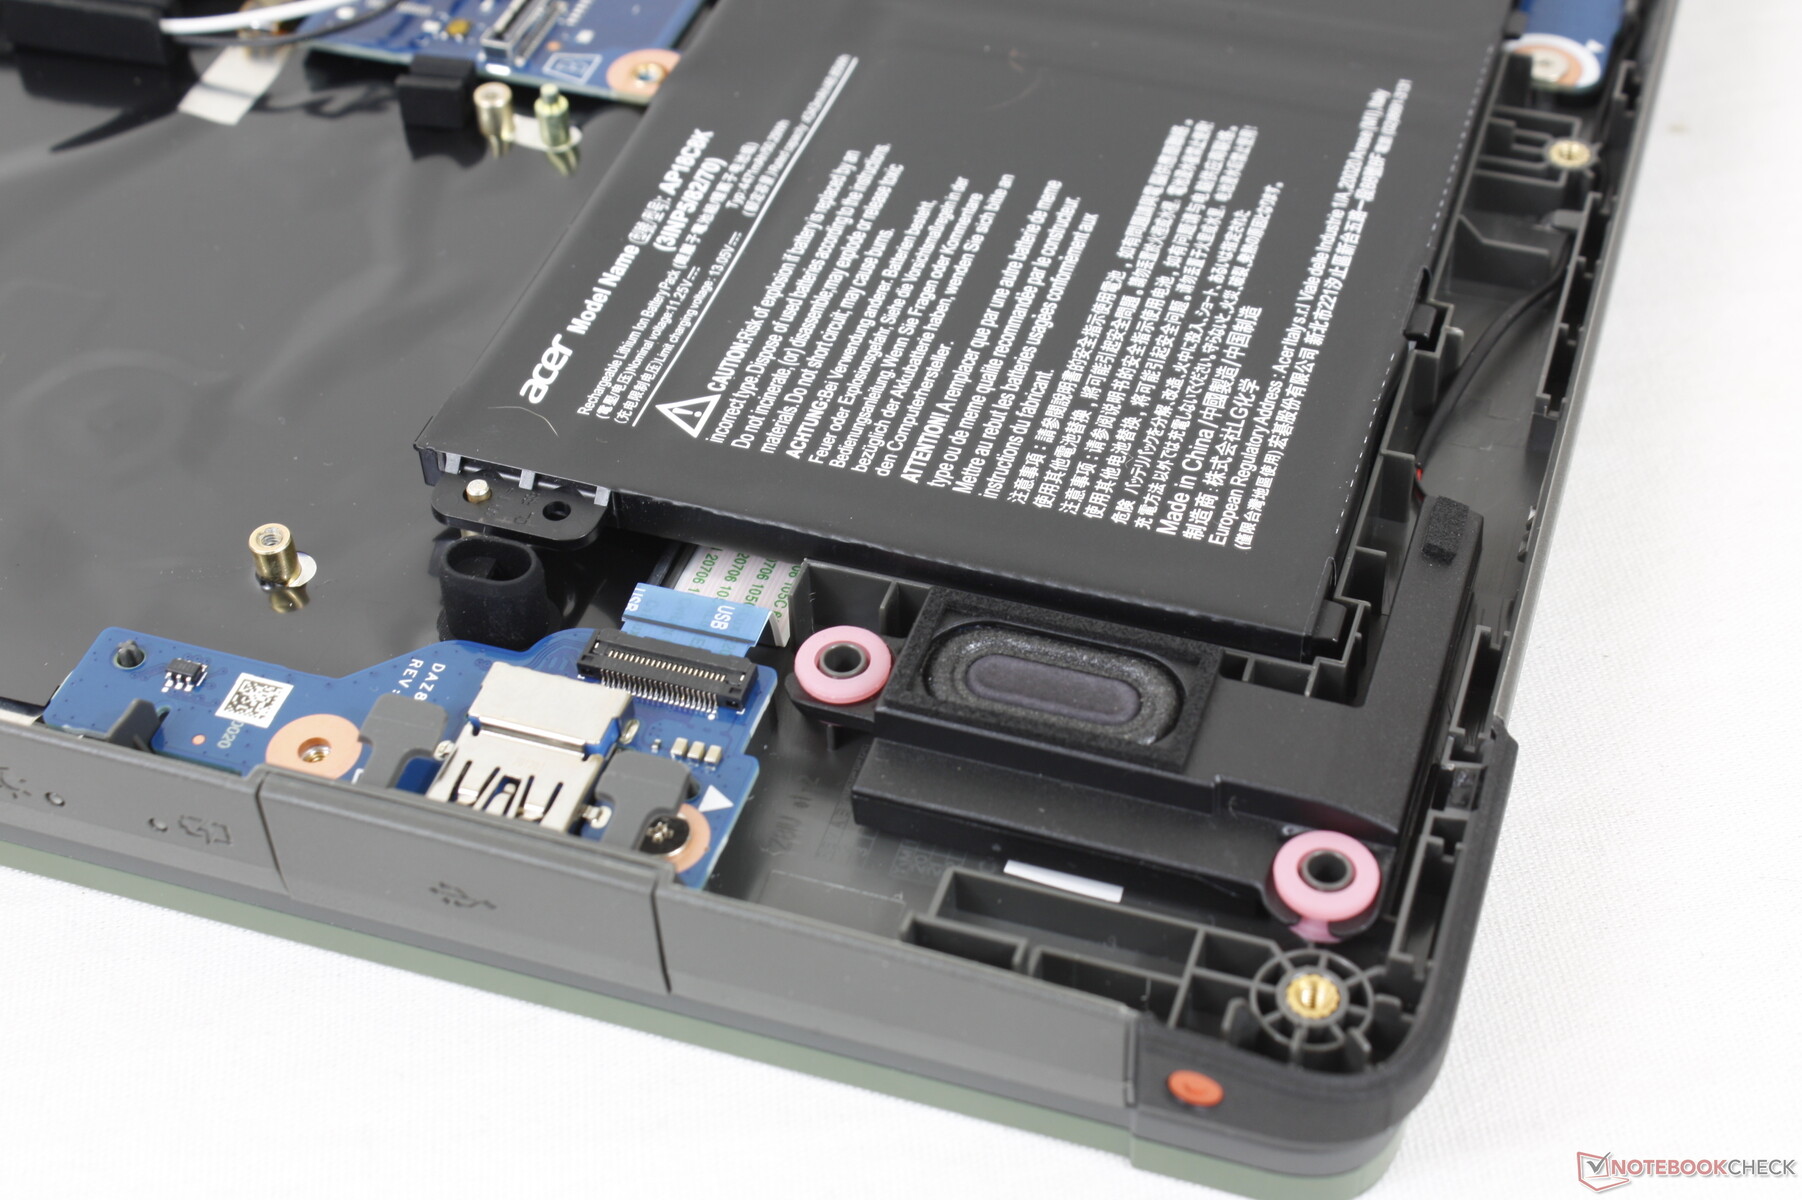
维护
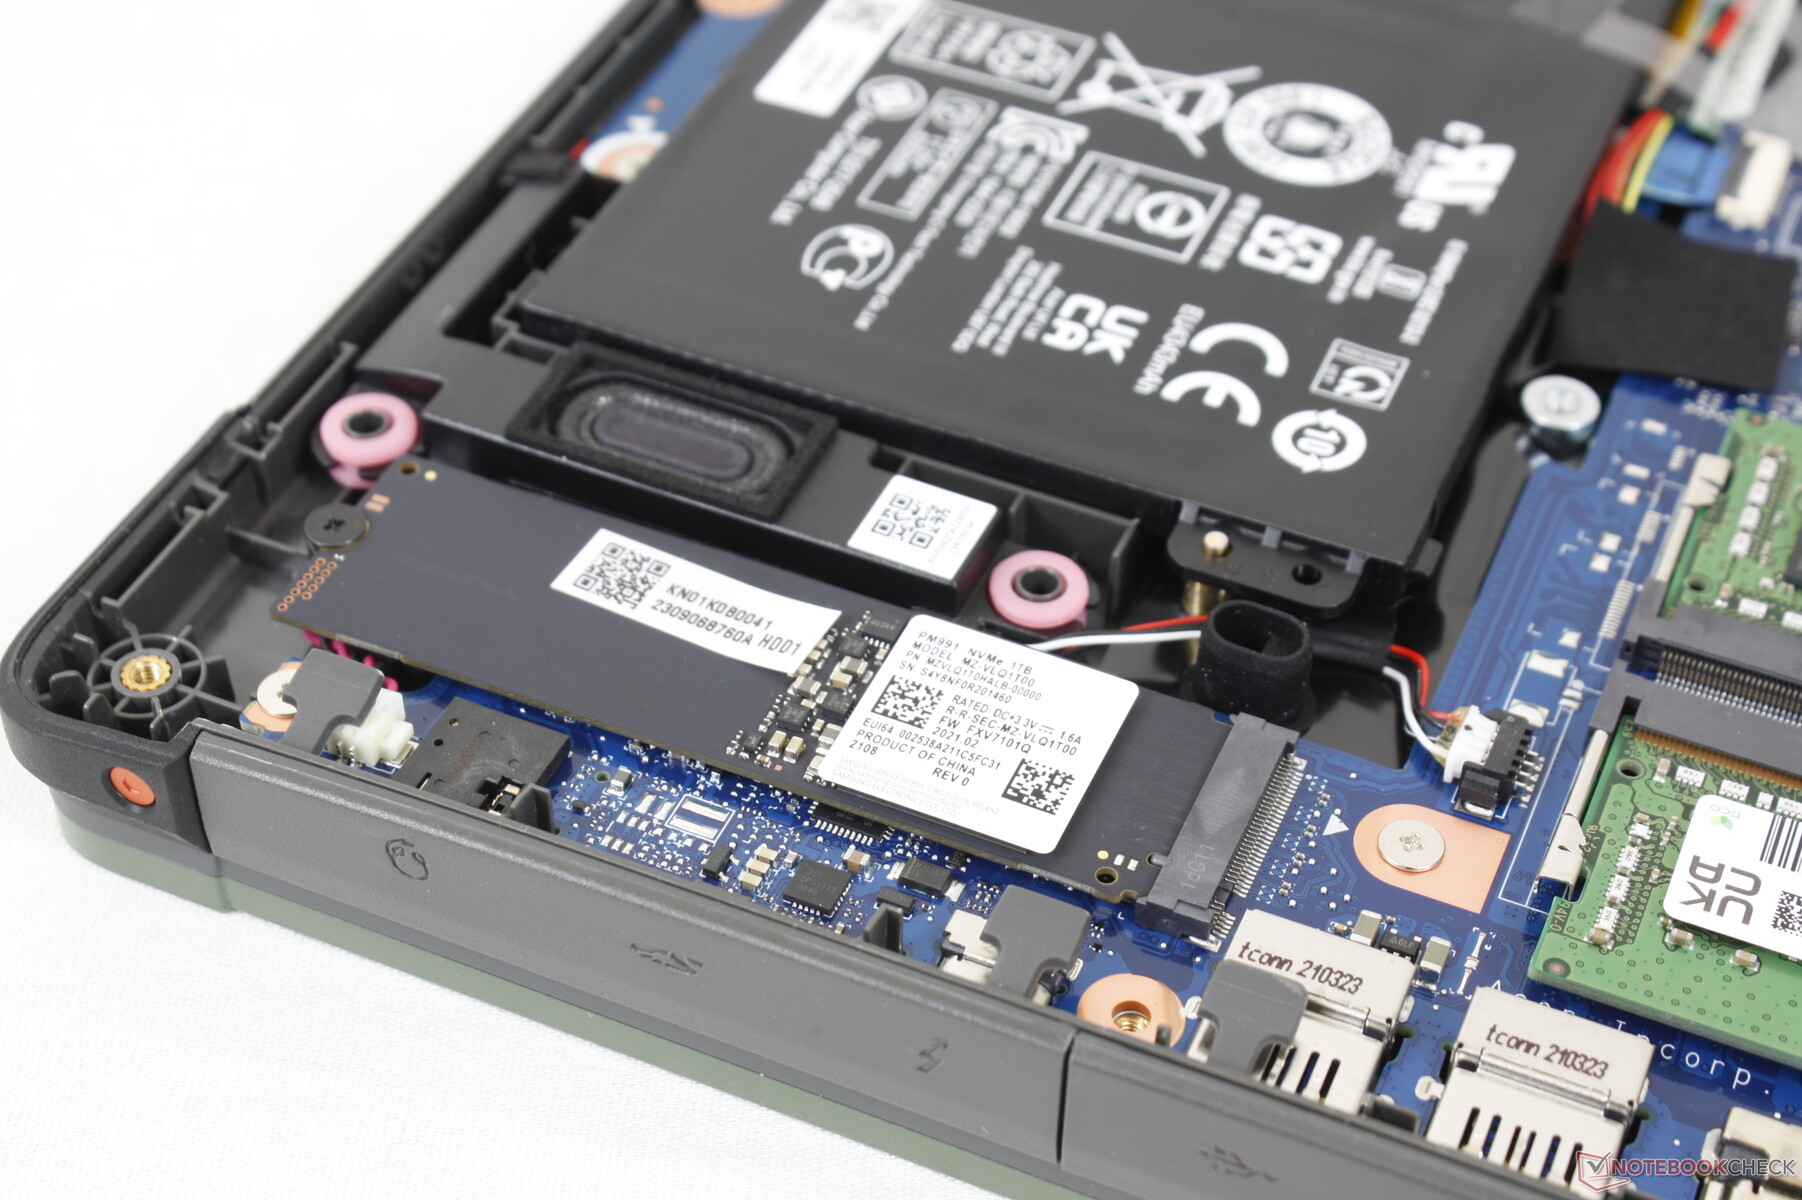
卸下13颗飞利浦螺丝后,底部的塑料面板很容易弹出。用户可以直接接触到电池、两个SODIMM插槽、WLAN模块和M.2 PCIe3 x4 2280插槽。
配件和保修
除了交流电适配器和文件之外,零售盒中没有任何额外的东西。一年的有限保修期,而许多专业笔记本电脑通常会有两年或三年的标准保修期。
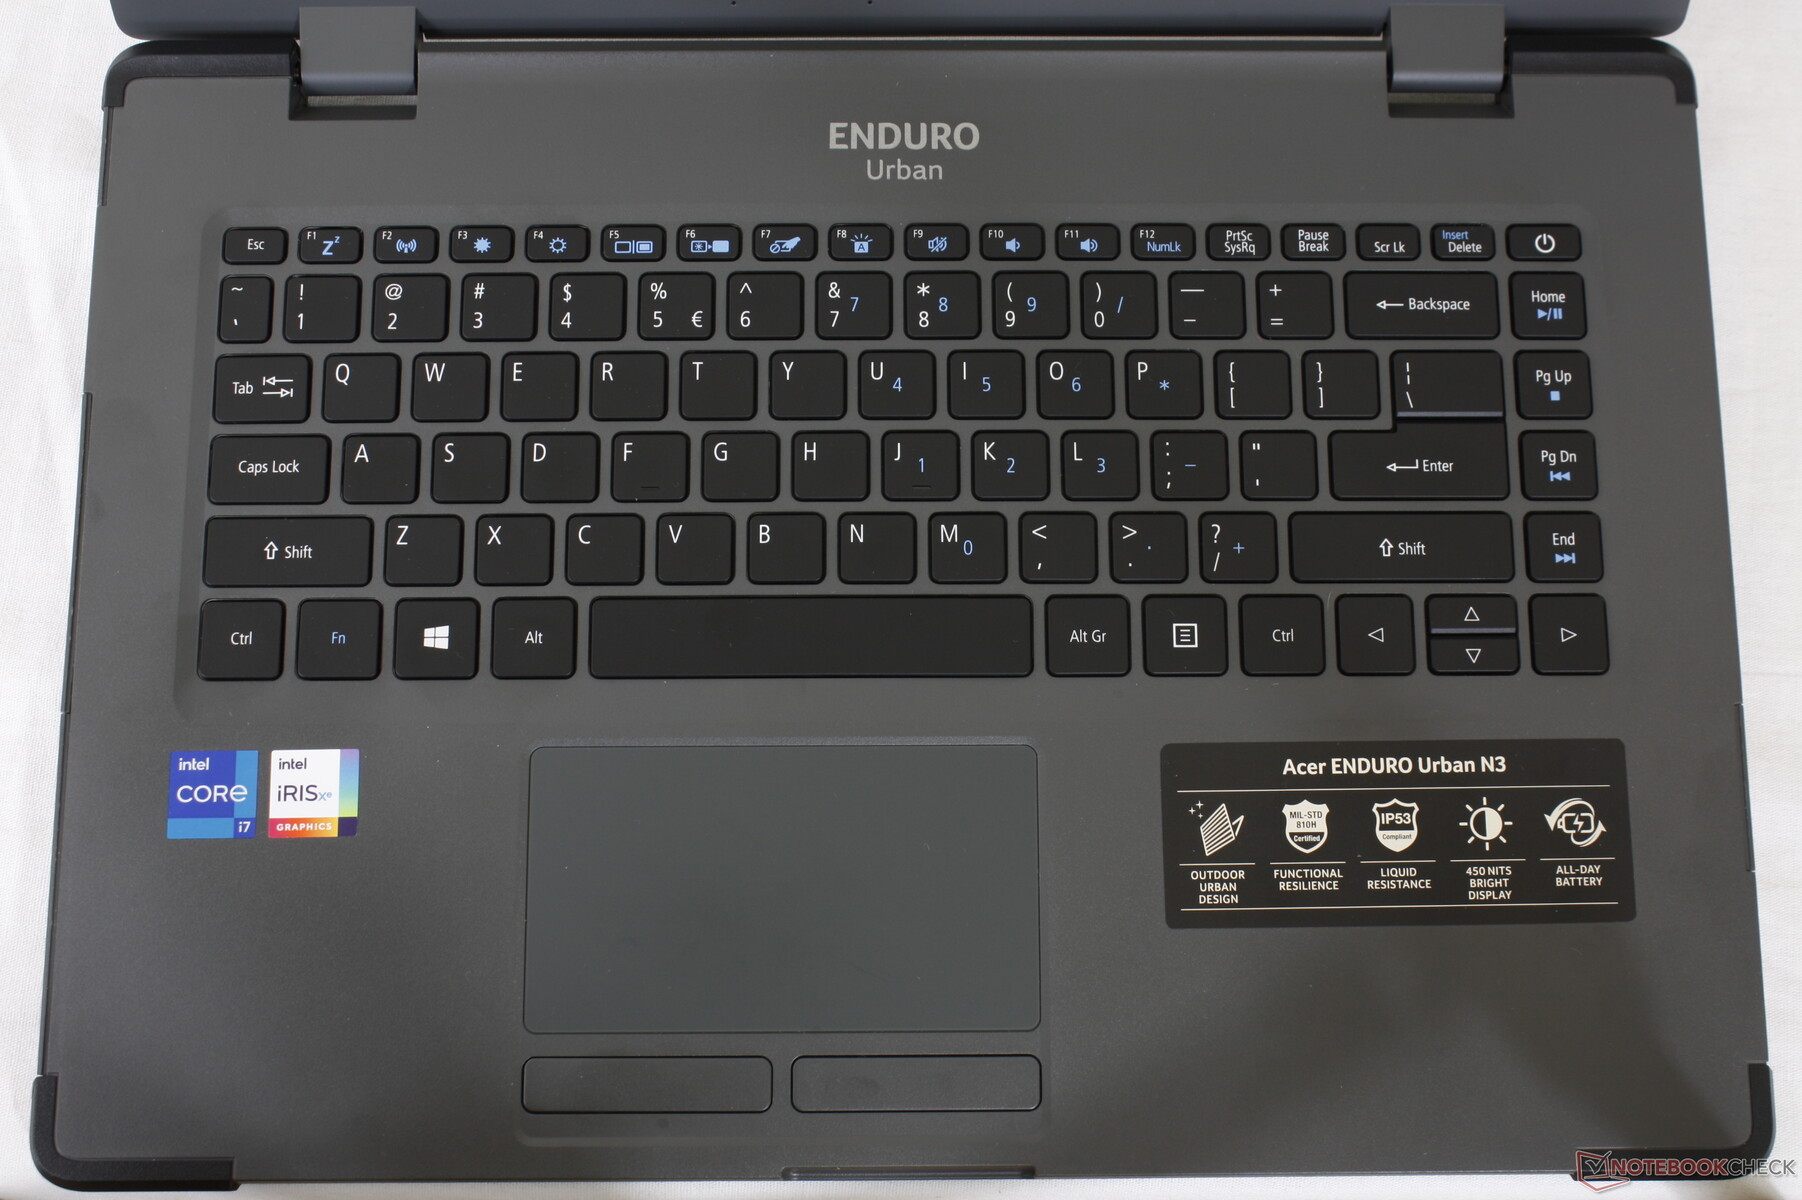
输入设备
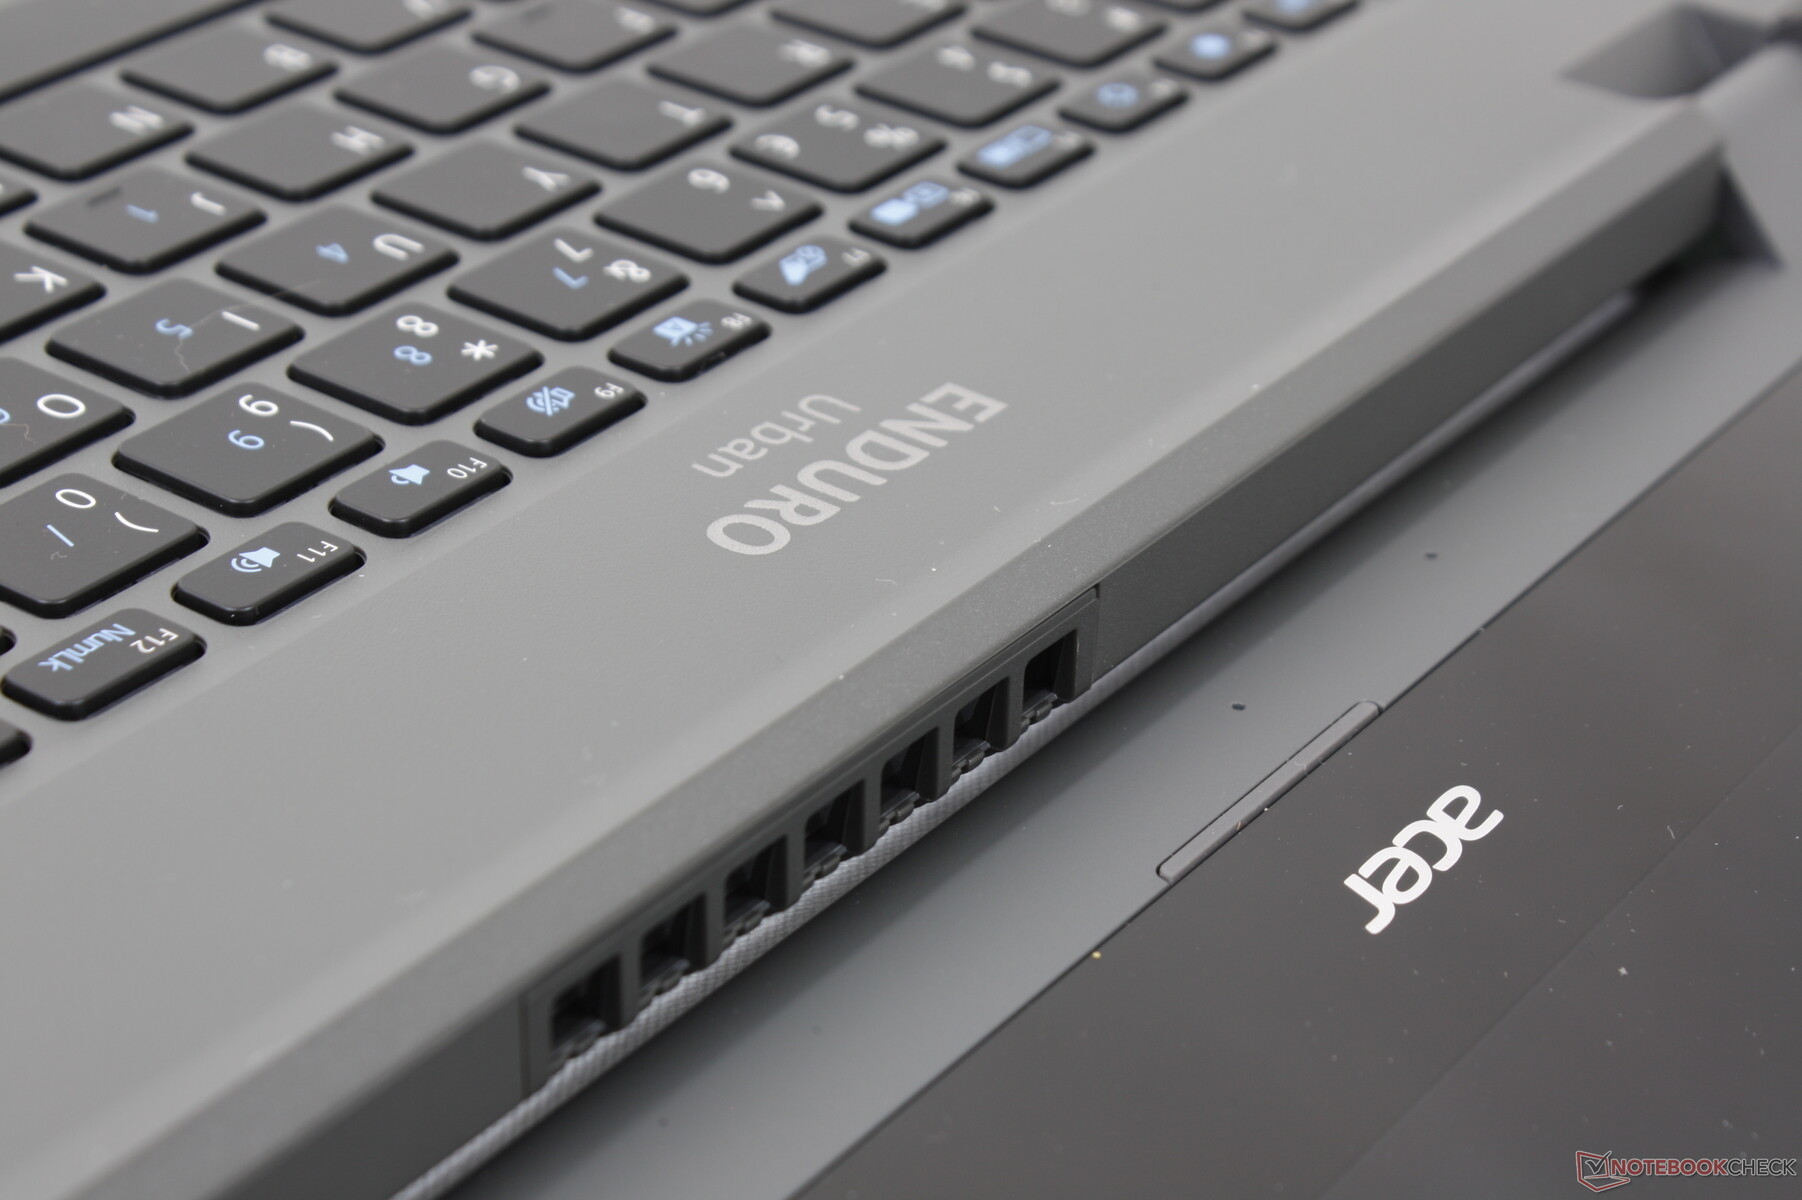
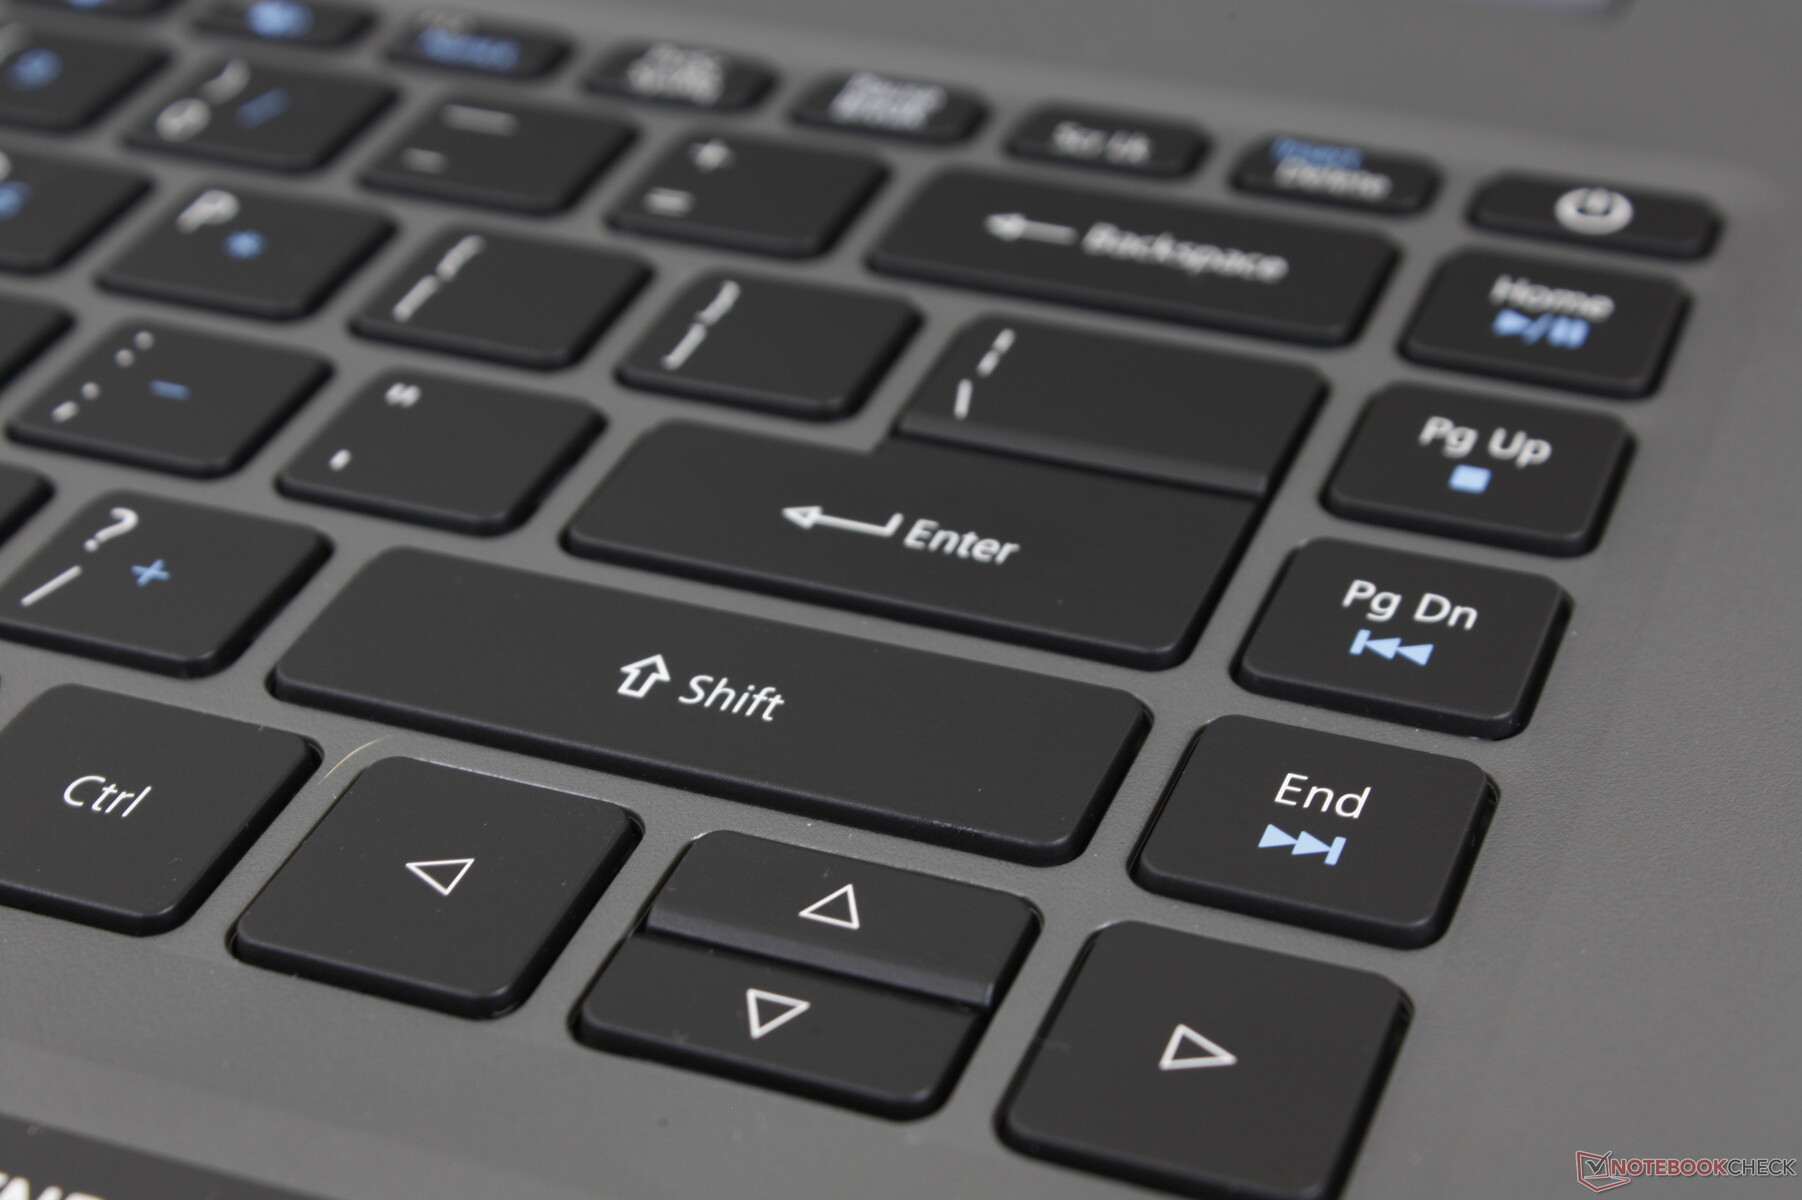
键盘
打字体验更类似于标准的超极本,如华硕VivoBook或戴尔Inspiron,而不是更专业的笔记本电脑,如 笔记本电脑,如Durabook S14I或联想ThinkPad等更专业的笔记本电脑,它们的按键往往更结实、更深。如果你习惯于在消费级笔记本电脑上打字,那么Urban N3的键盘无论好坏都不会有什么不同的感觉。按键的咔哒声比较安静,所有按键的反馈都比较柔和而均匀。
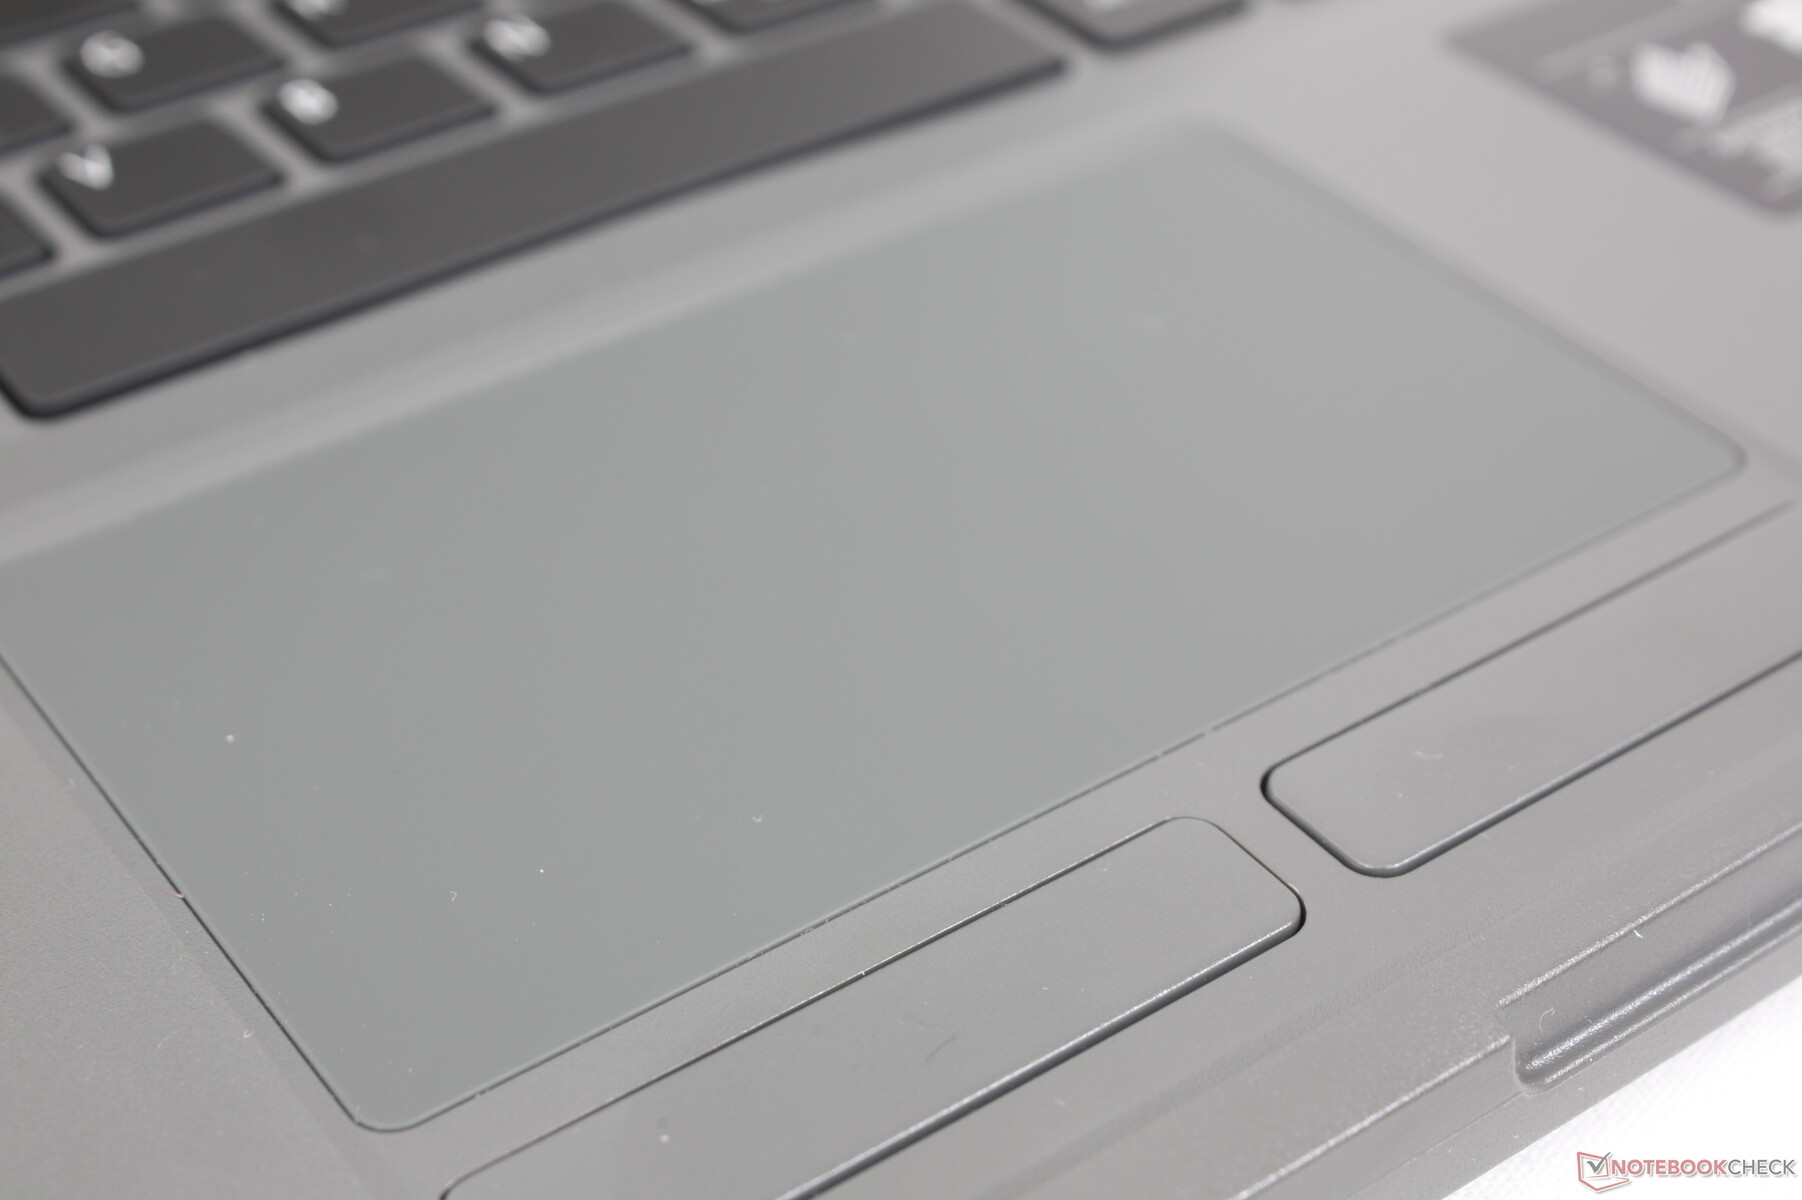
触摸板
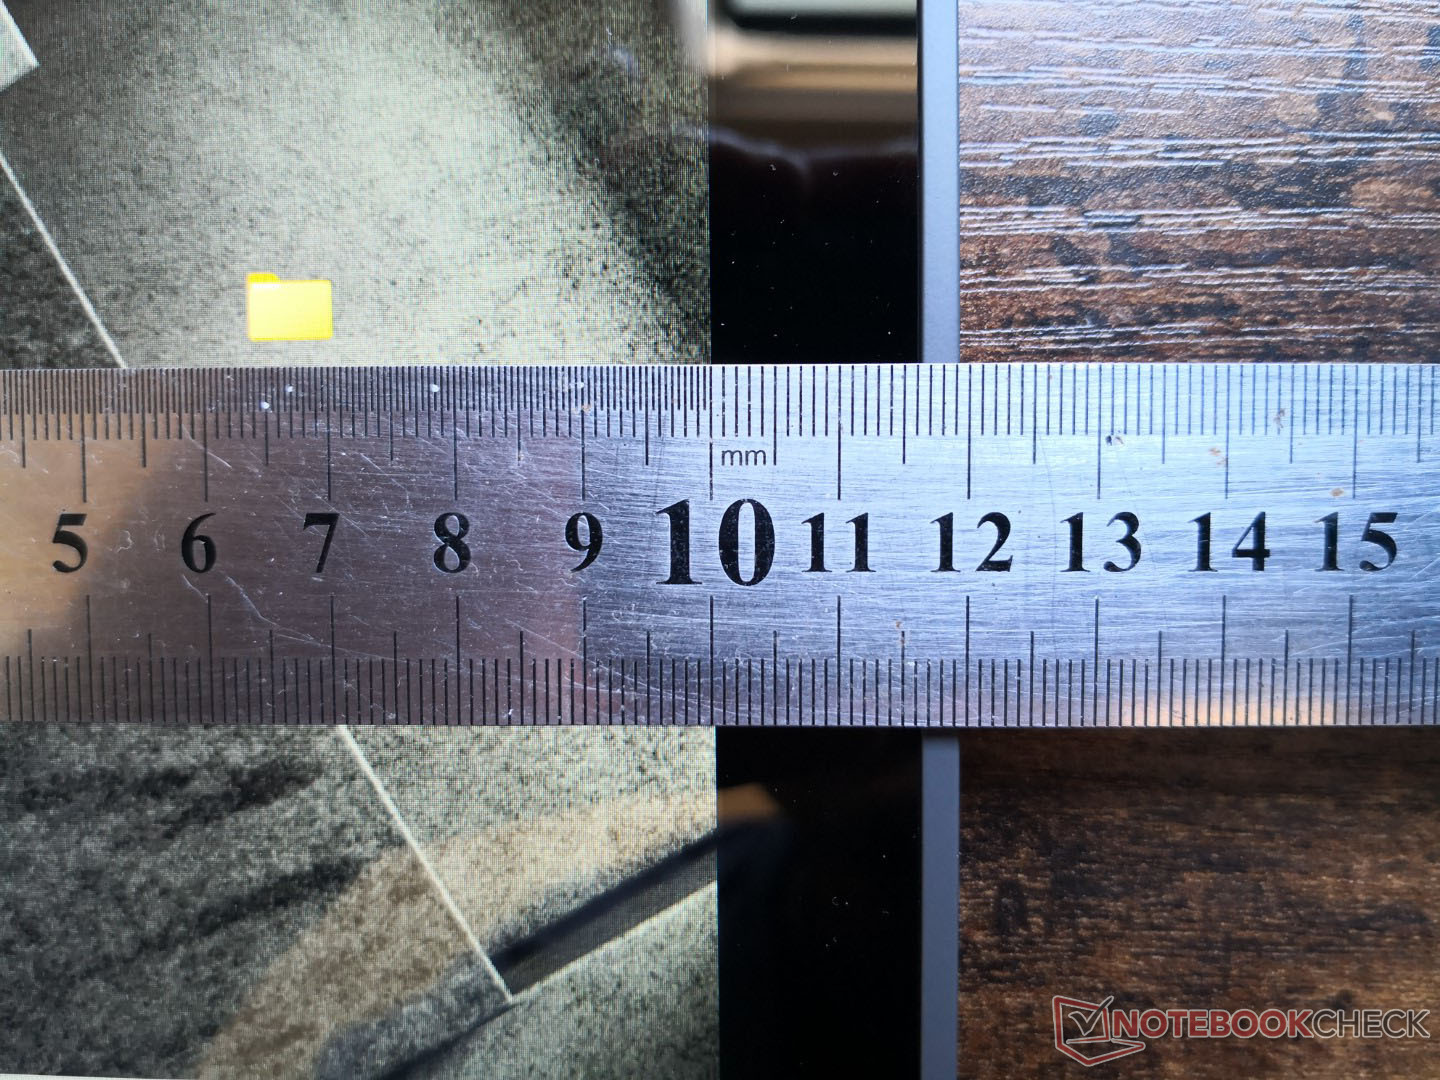
触摸板的大小适中,为10.5 x 5.9厘米。在中快速度下的滑行是平稳的,而慢速则倾向于坚持更多的拖动和下降。

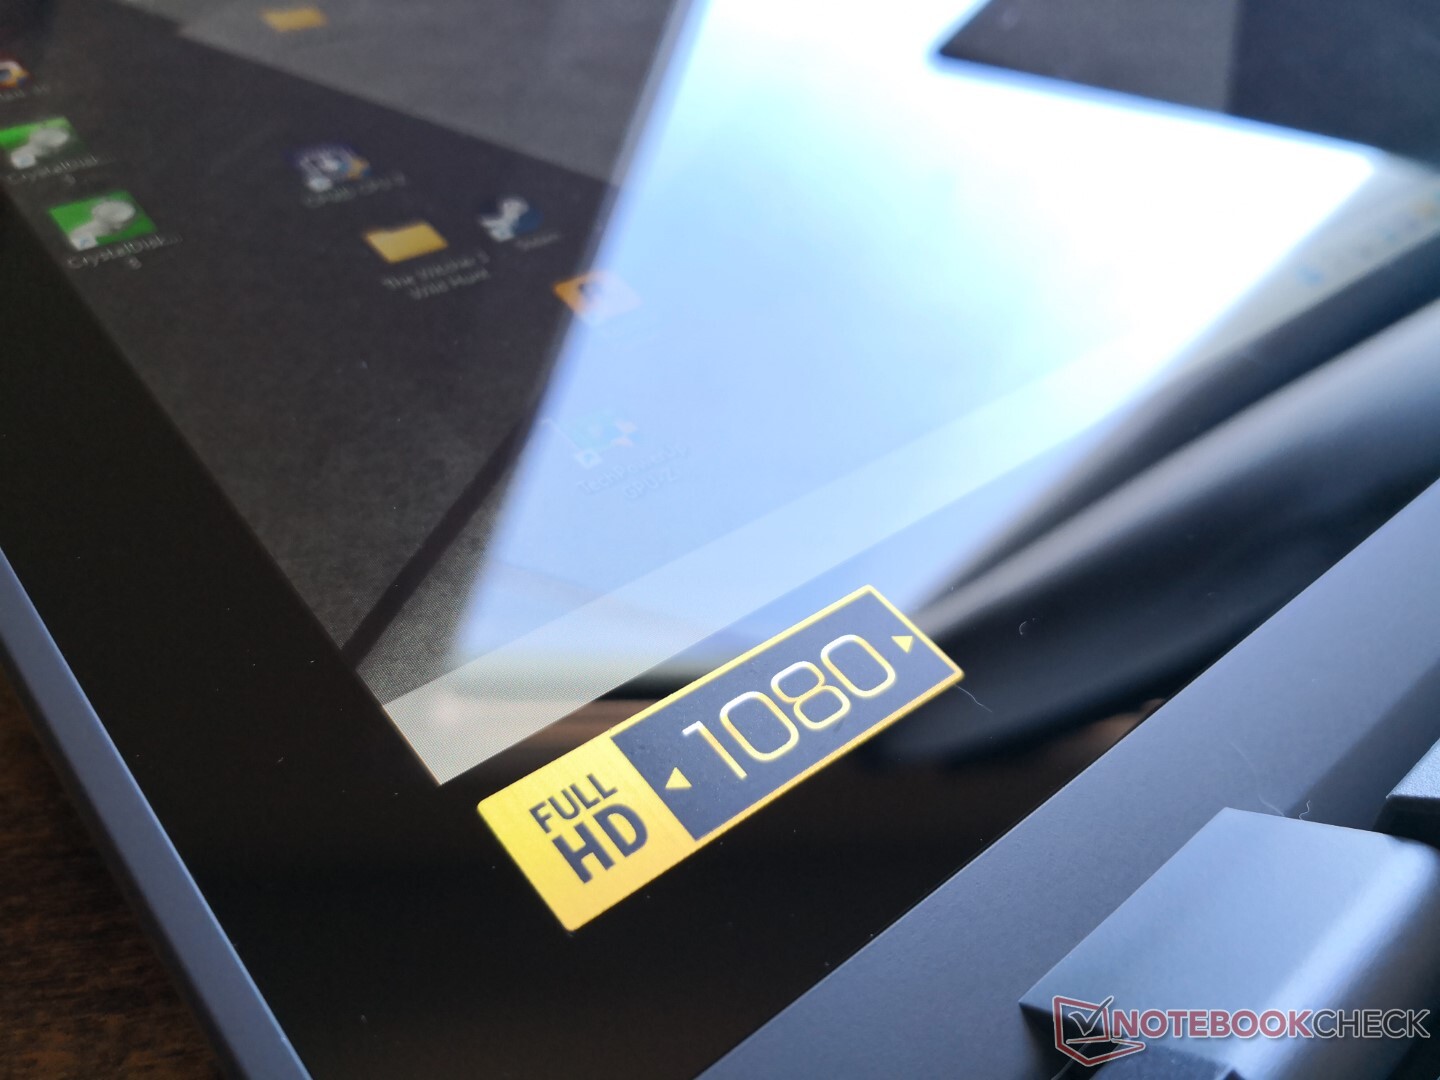
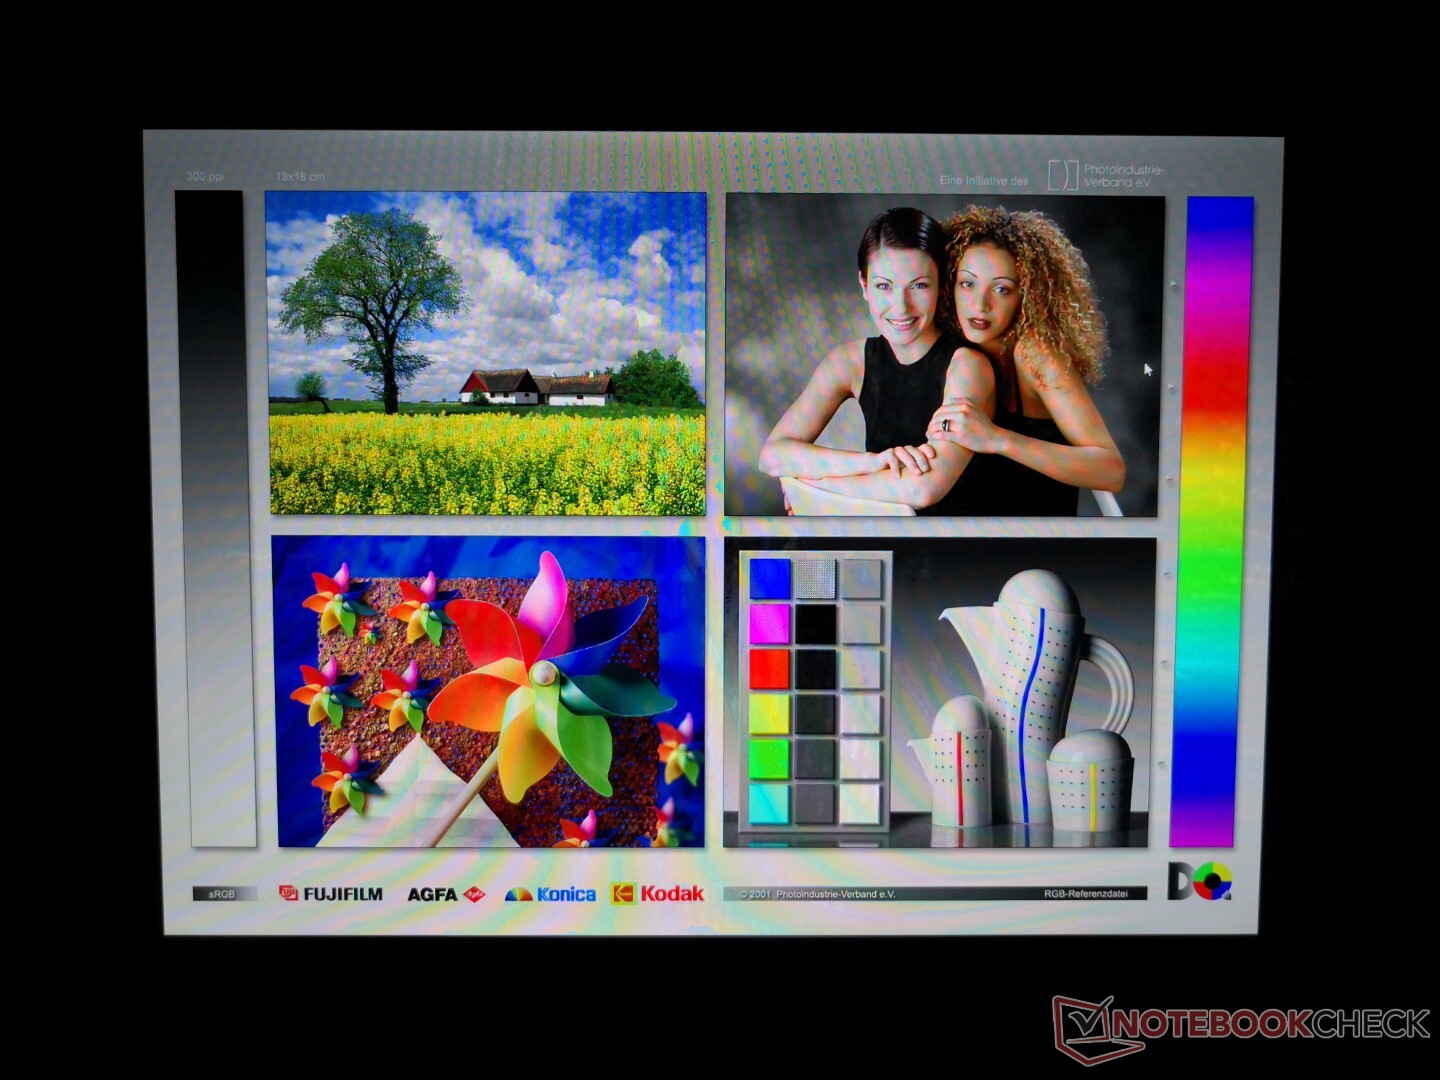
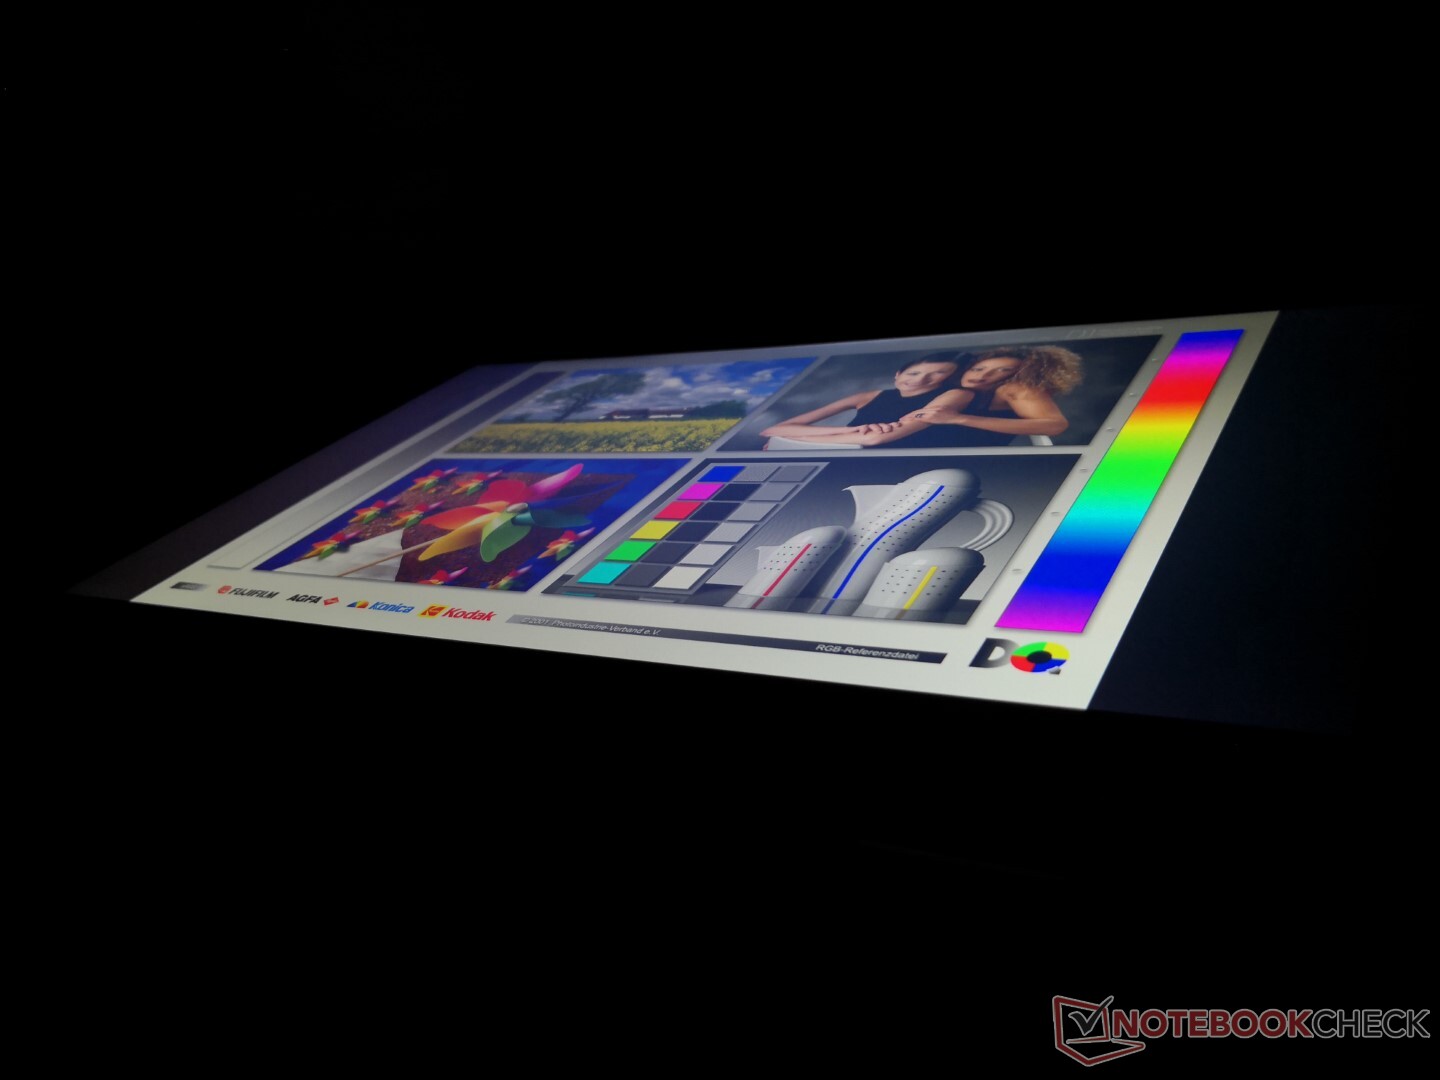
显示
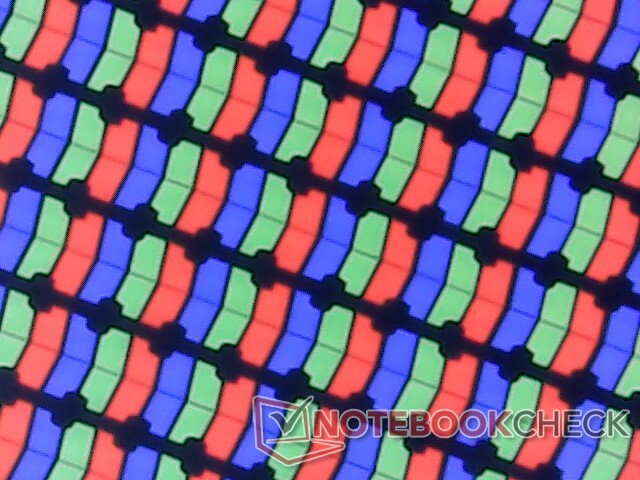
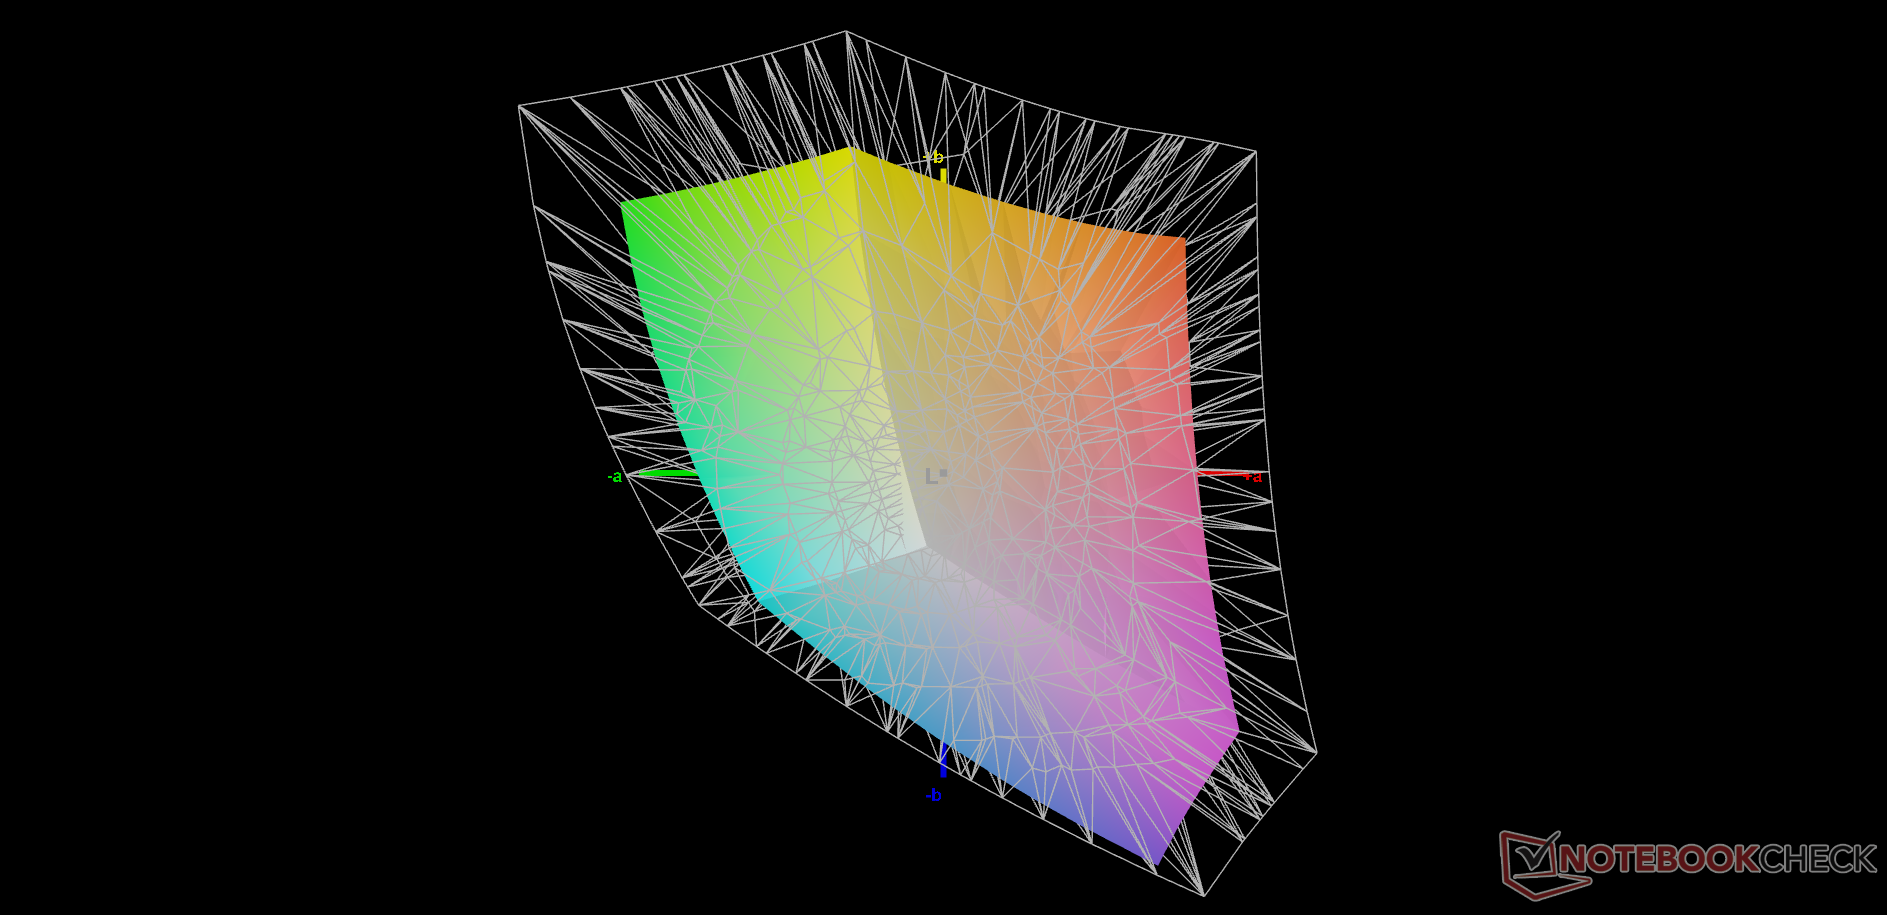
在我们的数据库中,XR140EA6T的面板在其他笔记本电脑上找不到。幸运的是,它的核心属性非常好,特别是对于一台坚固耐用的笔记本电脑来说。它的背光亮度接近500尼特,具有高对比度(>1000:1)和可敬的色彩覆盖。
缺点是黑白响应时间慢,有明显的重影,并且在所有亮度水平上存在PWM,最高可达99%。如果你的眼睛对屏幕上的闪烁很敏感,你可能要避免这款笔记本。其他像Durabook S14I这样的耐用型笔记本电脑可以提供超过1000尼特的更明亮的显示屏。
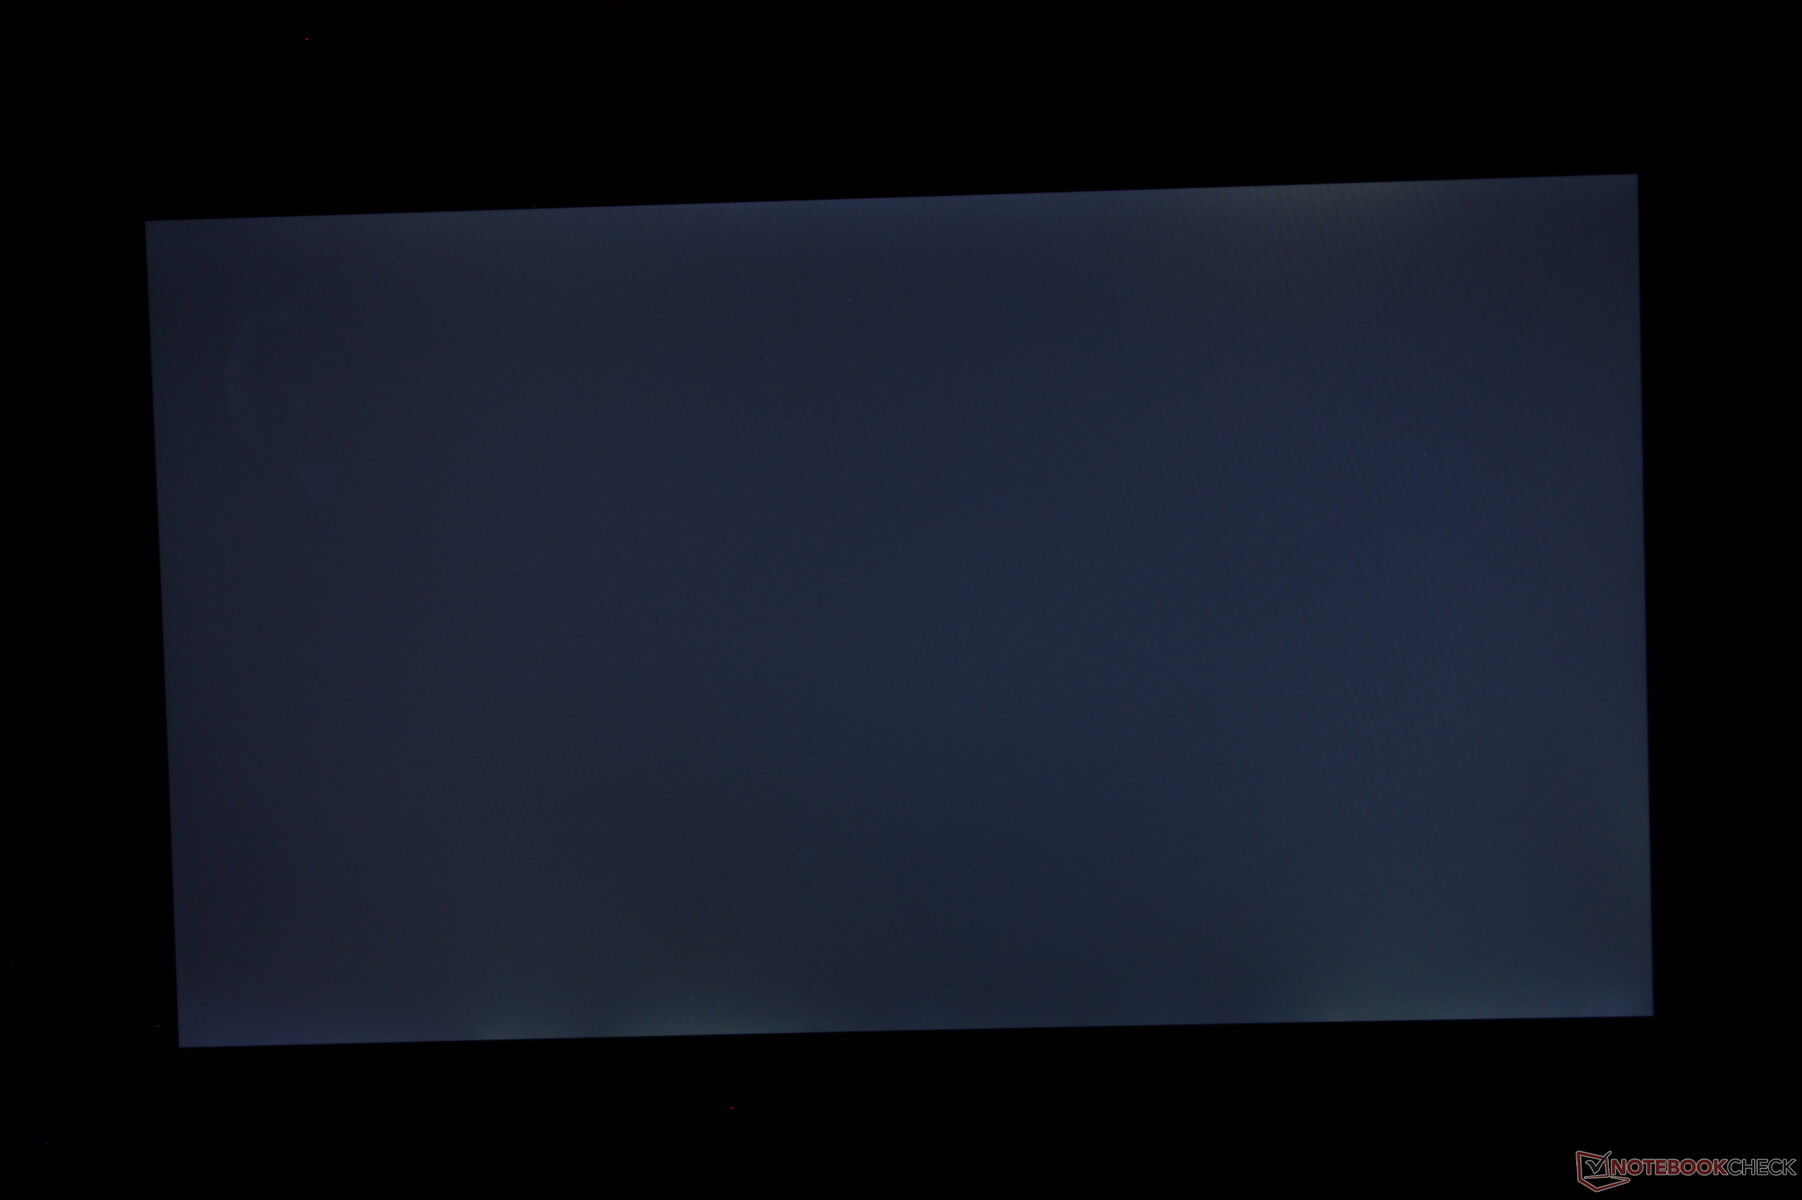
| |||||||||||||||||||||||||
Brightness Distribution: 89 %
Center on Battery: 487.8 cd/m²
Contrast: 1016:1 (Black: 0.48 cd/m²)
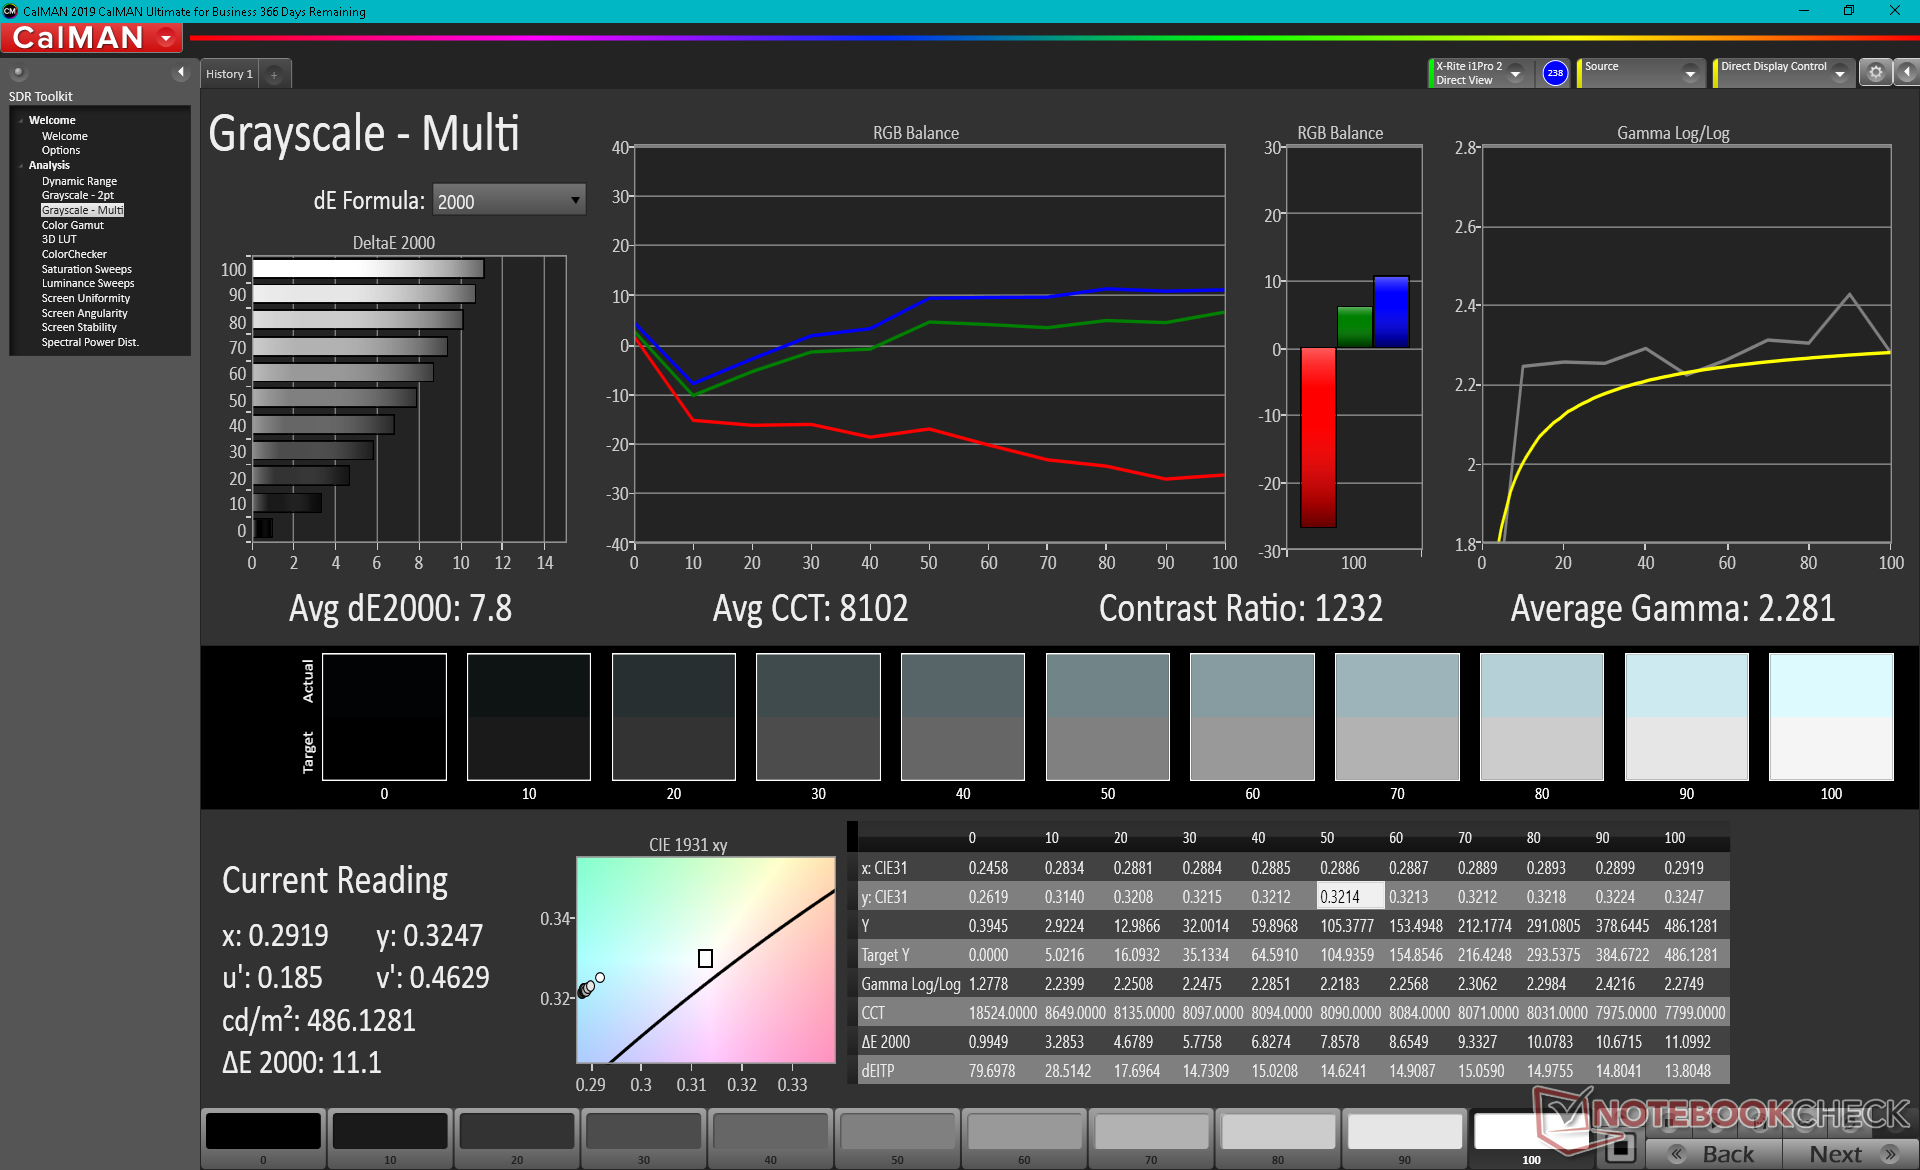
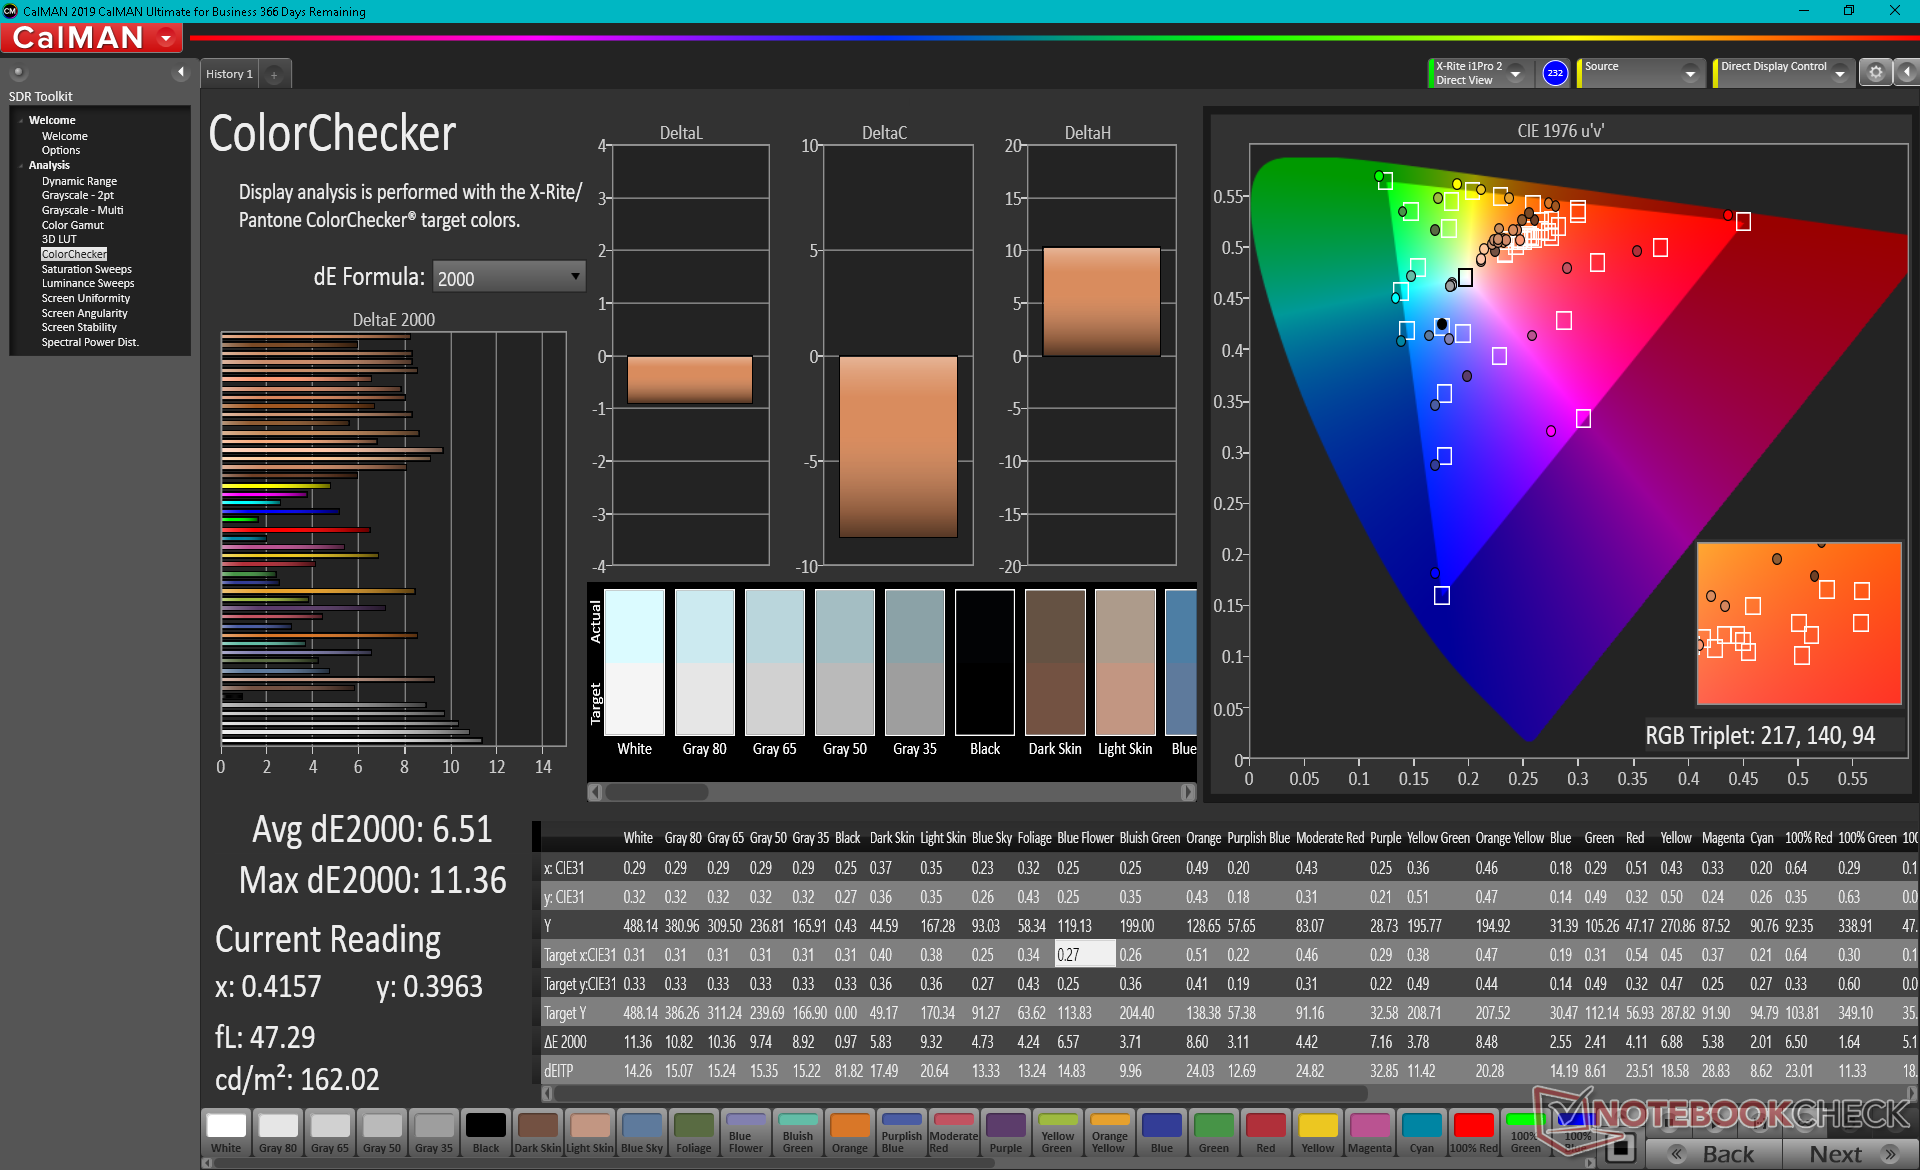
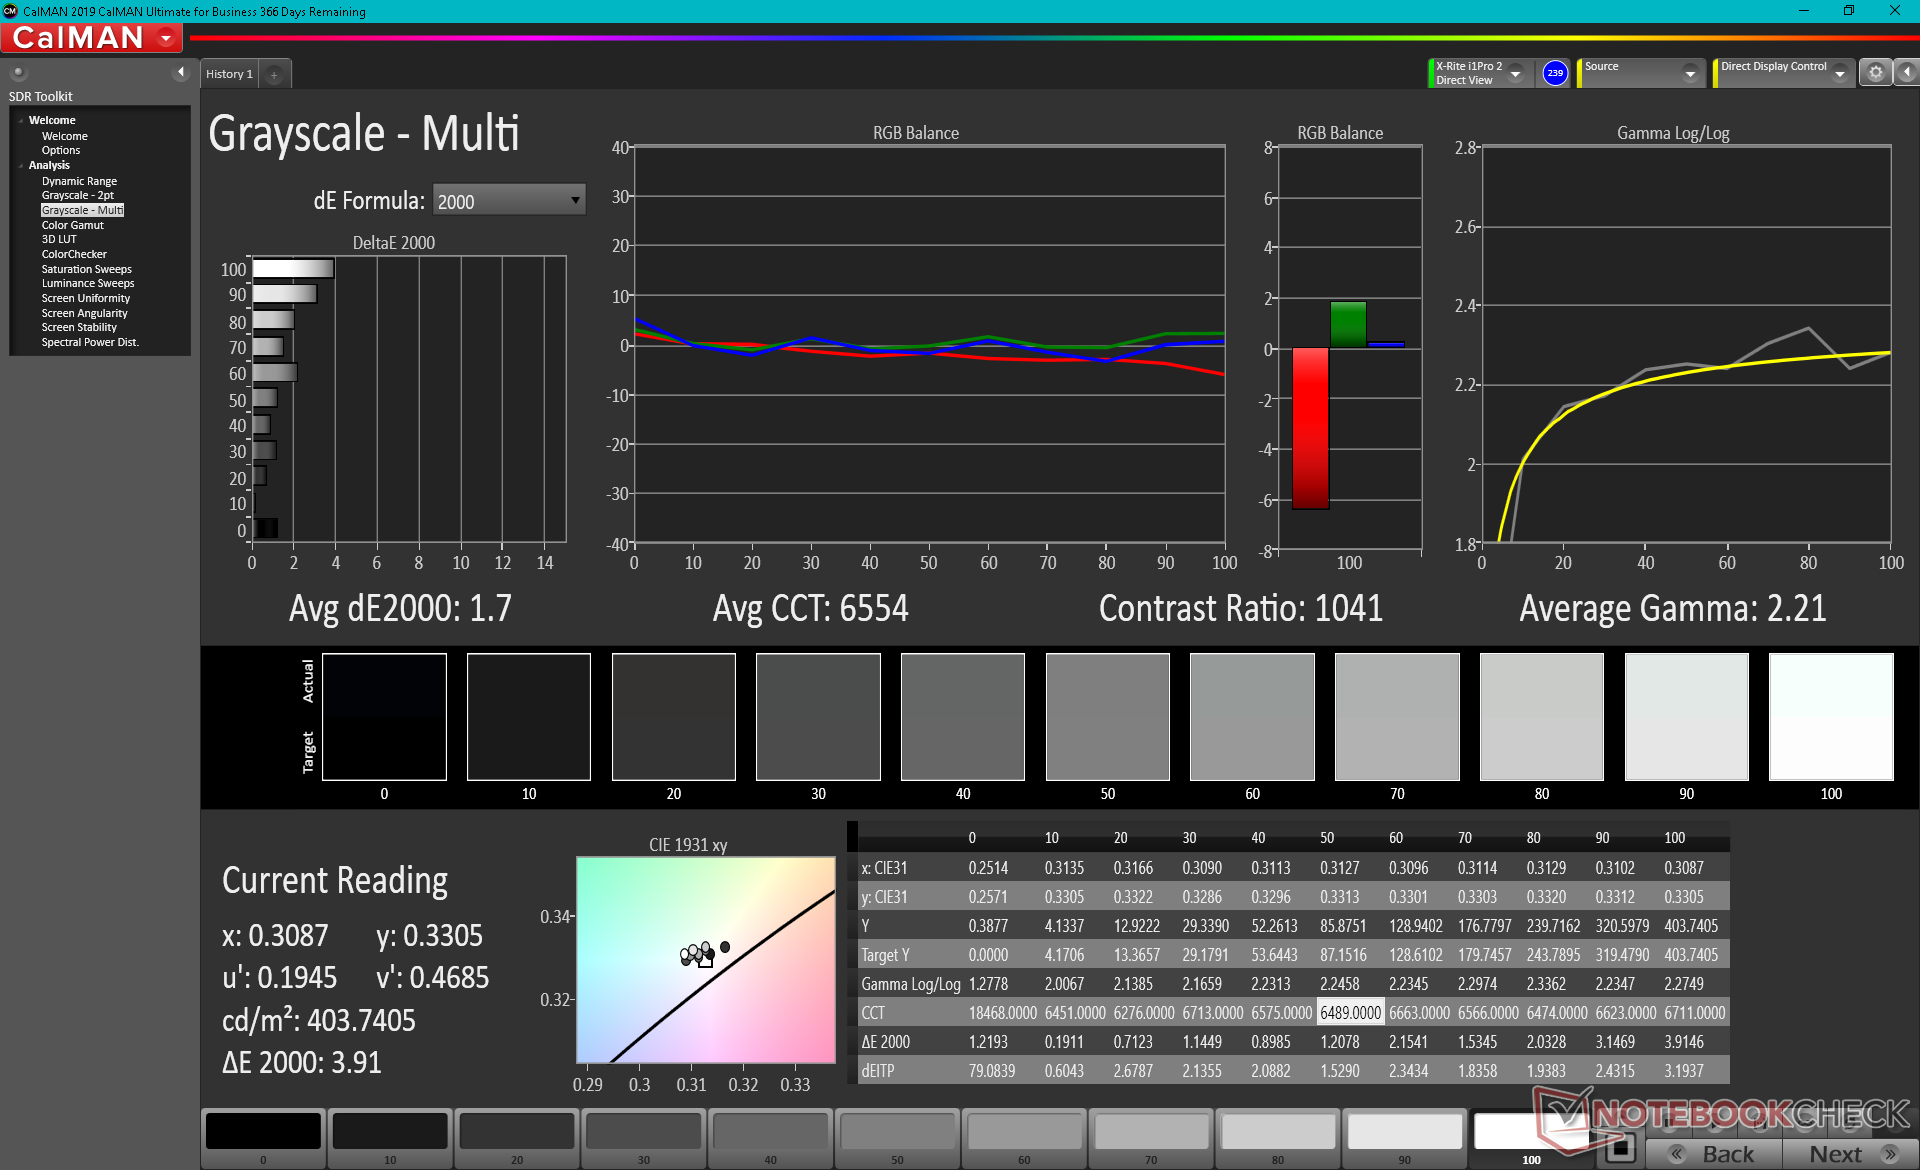
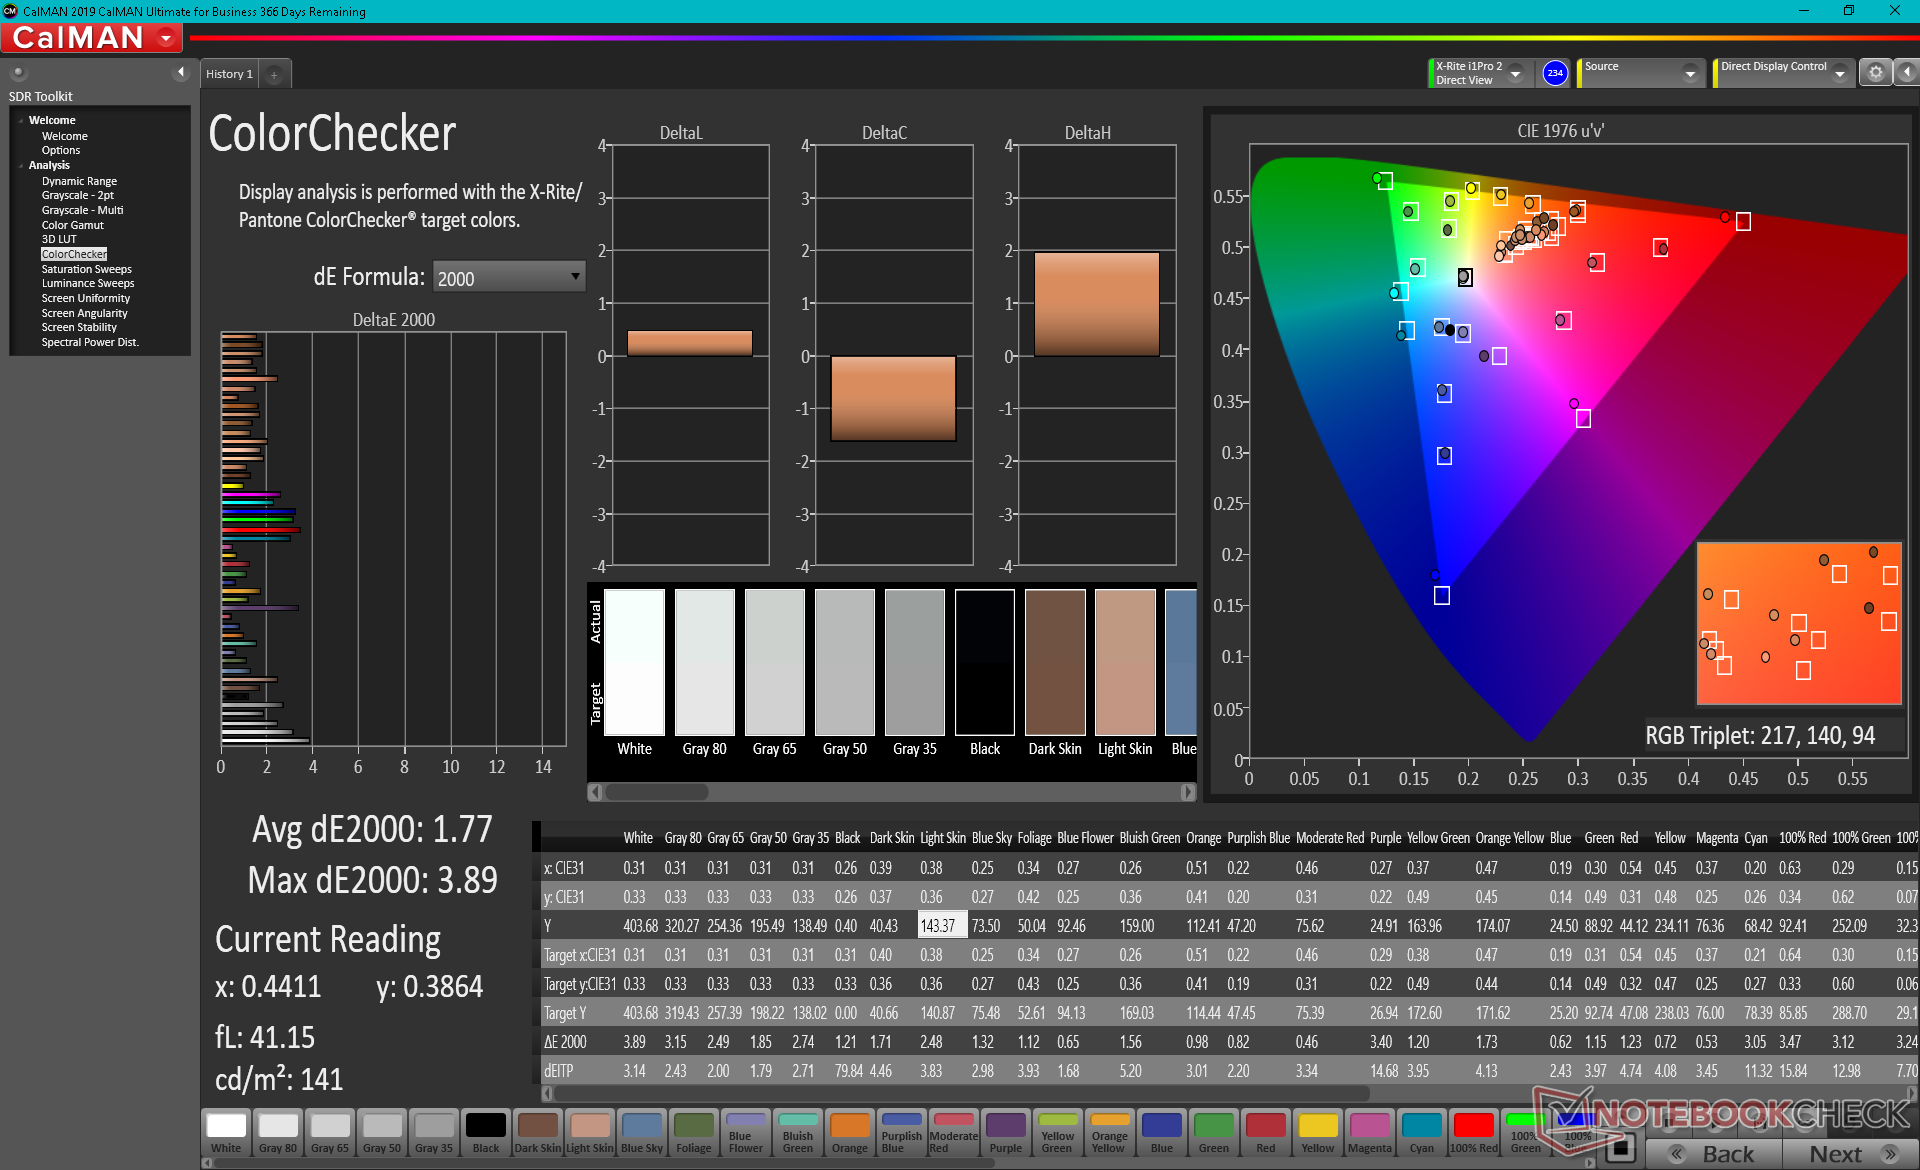
ΔE ColorChecker Calman: 6.51 | ∀{0.5-29.43 Ø4.71}
calibrated: 1.77
ΔE Greyscale Calman: 7.8 | ∀{0.09-98 Ø4.96}
65.5% AdobeRGB 1998 (Argyll 3D)
91.9% sRGB (Argyll 3D)
63.5% Display P3 (Argyll 3D)
Gamma: 2.28
CCT: 8102 K
| Acer Enduro Urban N3 EUN314 XR140EA6T, IPS, 1920x1080, 14" | Dell Latitude 5420 Rugged-P85G AU Optronics AUO523D, IPS, 1920x1080, 14" | Panasonic Toughbook FZ-55 MK2 InfoVision M140NWF5 R3, IPS, 1920x1080, 14" | Durabook S14I KD140N0730A01, TN, 1920x1080, 14" | Getac S410 CMN N140BGE-E33, TN PED, 1366x768, 14" | |
|---|---|---|---|---|---|
| Display | -1% | -44% | -30% | -35% | |
| Display P3 Coverage (%) | 63.5 | 62.5 -2% | 34.8 -45% | 43.55 -31% | 40.46 -36% |
| sRGB Coverage (%) | 91.9 | 92.4 1% | 52.2 -43% | 65.4 -29% | 60.9 -34% |
| AdobeRGB 1998 Coverage (%) | 65.5 | 64.2 -2% | 36 -45% | 45 -31% | 41.8 -36% |
| Response Times | -8% | 32% | 56% | 43% | |
| Response Time Grey 50% / Grey 80% * (ms) | 56 ? | 68 ? -21% | 28.4 ? 49% | 30.4 ? 46% | 41.2 ? 26% |
| Response Time Black / White * (ms) | 35.2 ? | 33.6 ? 5% | 30 ? 15% | 11.8 ? 66% | 14 ? 60% |
| PWM Frequency (Hz) | 1000 ? | 735 ? | 685 ? | 304.9 ? | 877 ? |
| Screen | 26% | 21% | -49% | -71% | |
| Brightness middle (cd/m²) | 487.8 | 1111.7 128% | 1061.1 118% | 1180.7 142% | 265.1 -46% |
| Brightness (cd/m²) | 464 | 1026 121% | 997 115% | 1102 138% | 246 -47% |
| Brightness Distribution (%) | 89 | 80 -10% | 76 -15% | 89 0% | 81 -9% |
| Black Level * (cd/m²) | 0.48 | 0.81 -69% | 0.7 -46% | 1.91 -298% | 0.58 -21% |
| Contrast (:1) | 1016 | 1372 35% | 1516 49% | 618 -39% | 457 -55% |
| Colorchecker dE 2000 * | 6.51 | 3.83 41% | 4.64 29% | 13.45 -107% | 14.24 -119% |
| Colorchecker dE 2000 max. * | 11.36 | 7.85 31% | 20.92 -84% | 22.52 -98% | 26.66 -135% |
| Colorchecker dE 2000 calibrated * | 1.77 | 2.98 -68% | 2.52 -42% | 3.19 -80% | 3.94 -123% |
| Greyscale dE 2000 * | 7.8 | 5.6 28% | 2.8 64% | 15.4 -97% | 14.2 -82% |
| Gamma | 2.28 96% | 2.306 95% | 2.08 106% | 1.97 112% | 2.03 108% |
| CCT | 8102 80% | 7676 85% | 6364 102% | 21134 31% | 17152 38% |
| Color Space (Percent of AdobeRGB 1998) (%) | 59 | 41.6 | 38.7 | ||
| Color Space (Percent of sRGB) (%) | 93 | 65.5 | 61 | ||
| Total Average (Program / Settings) | 6% /
16% | 3% /
9% | -8% /
-30% | -21% /
-47% |
* ... smaller is better
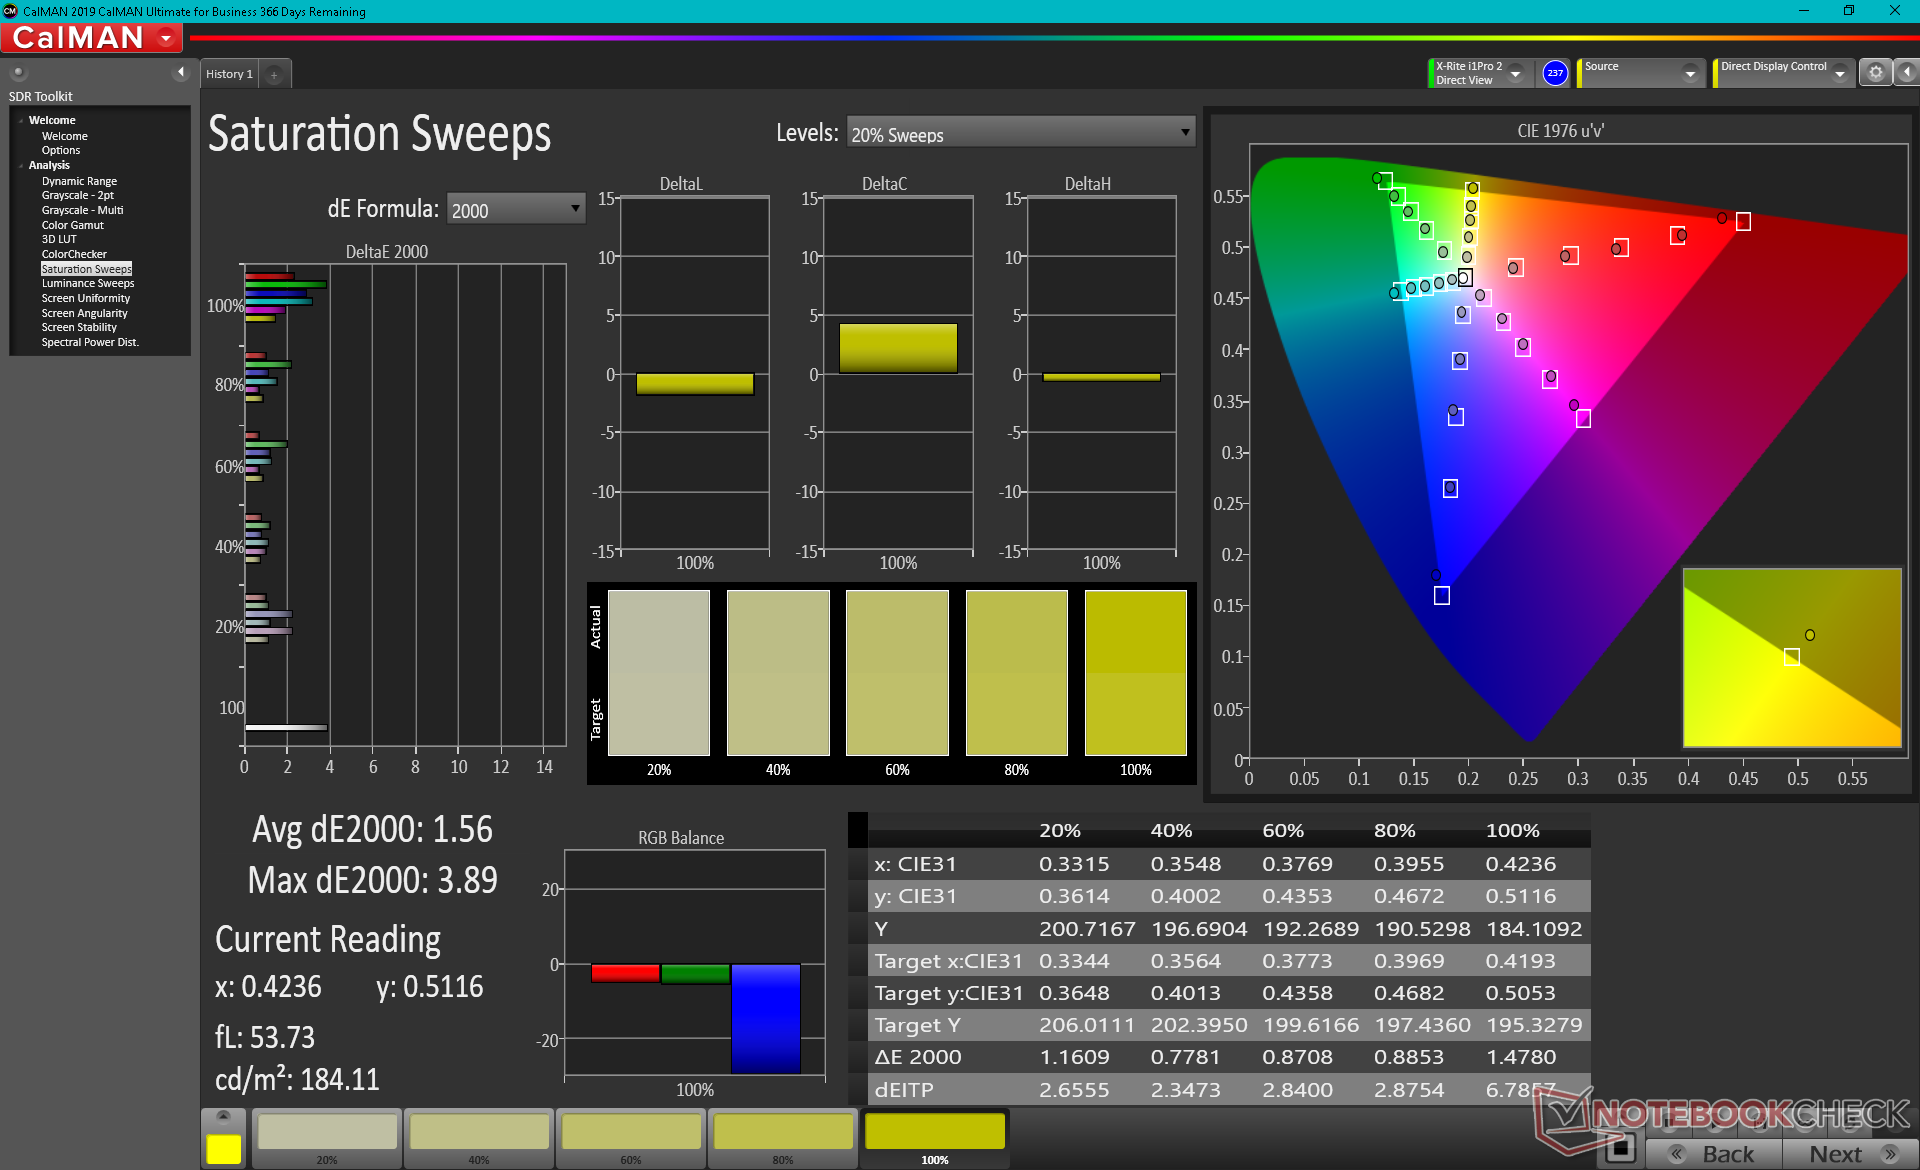
该面板提供>90%的sRGB覆盖率,这比许多其他坚固或半坚固的笔记本电脑要高得多,因为这些笔记本电脑的颜色通常不是优先考虑的。
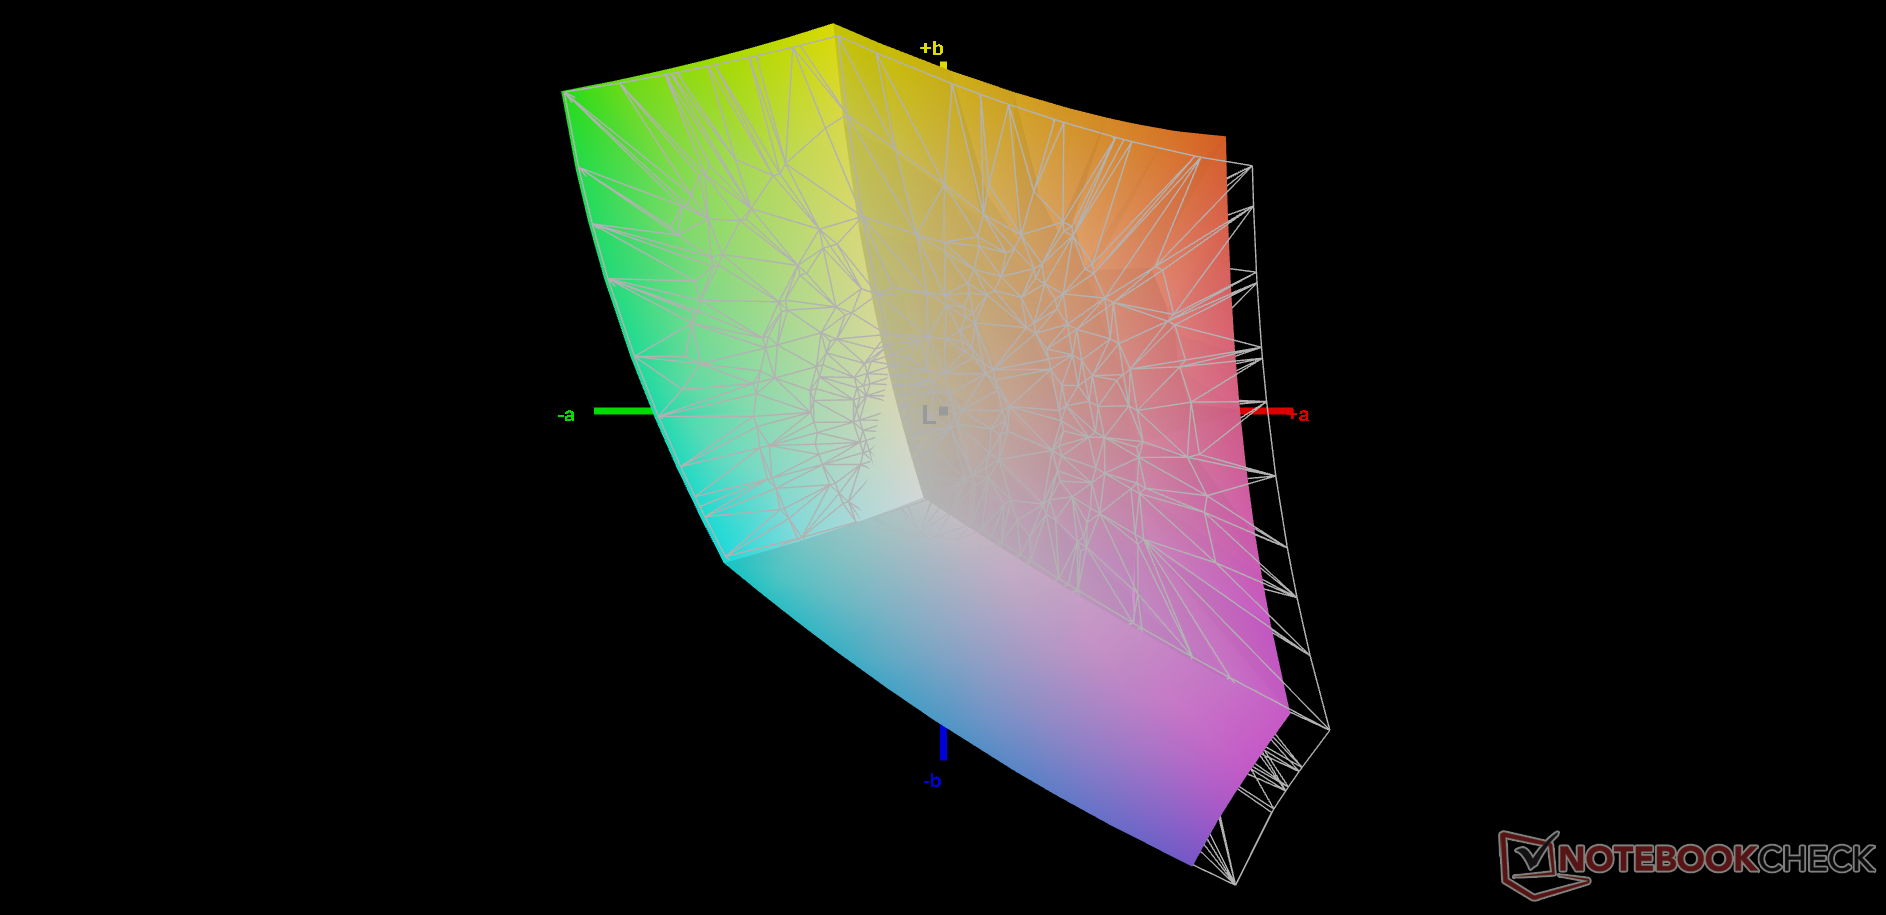
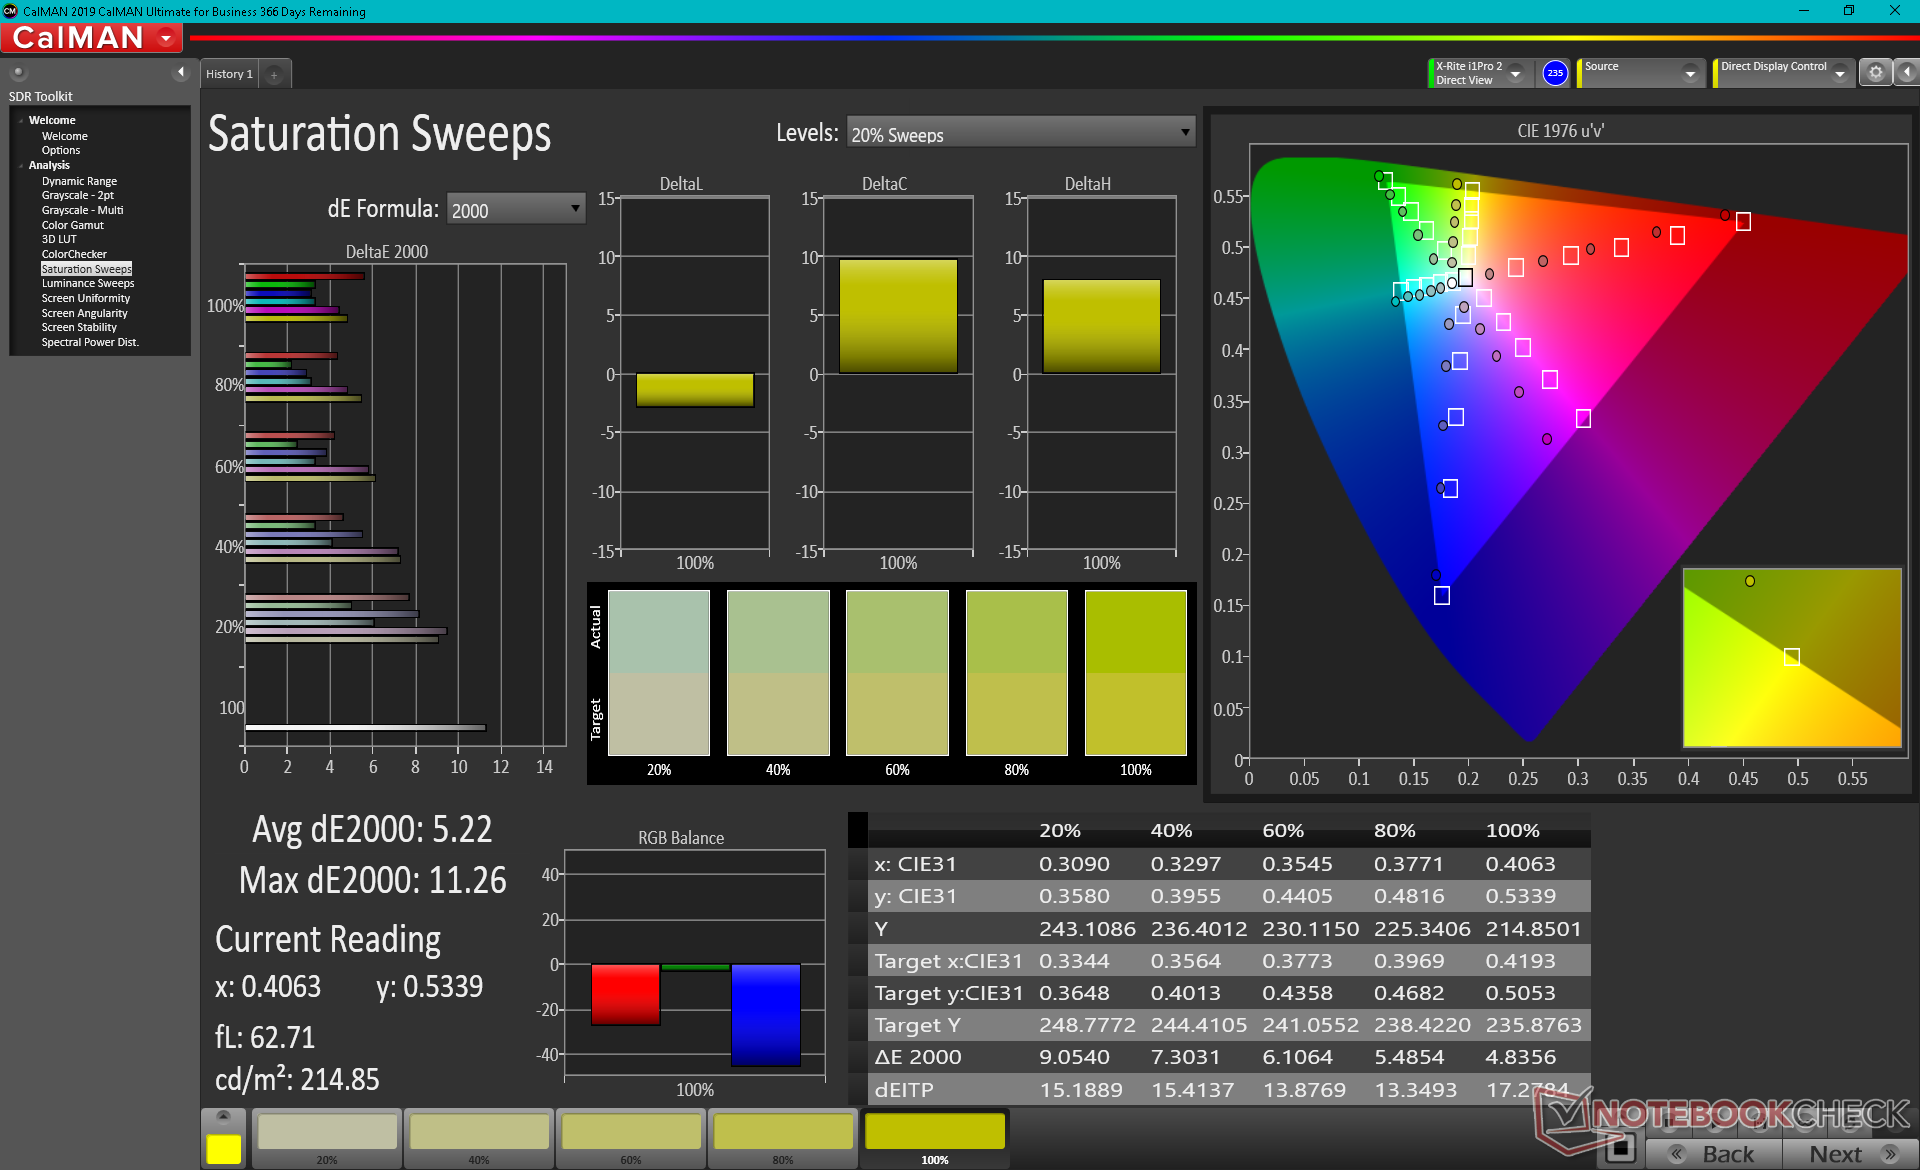
X-Rite色度计的测量结果显示,开箱后的色温太低。一旦经过适当的校准,灰度和色彩将得到极大的改善,正如我们下面的CalMAN结果所示。我们建议进行终端用户校准,以更好地利用面板相对宽泛的色彩空间。
Display Response Times
| ↔ Response Time Black to White | ||
|---|---|---|
| 35.2 ms ... rise ↗ and fall ↘ combined | ↗ 16.4 ms rise | 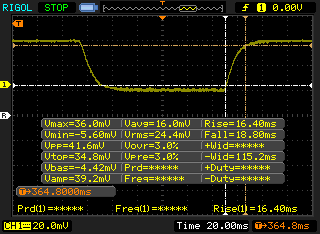 |
| ↘ 18.8 ms fall | ||
| The screen shows slow response rates in our tests and will be unsatisfactory for gamers. In comparison, all tested devices range from 0.1 (minimum) to 240 (maximum) ms. » 93 % of all devices are better. This means that the measured response time is worse than the average of all tested devices (19.8 ms). | ||
| ↔ Response Time 50% Grey to 80% Grey | ||
| 56 ms ... rise ↗ and fall ↘ combined | ↗ 25.2 ms rise | 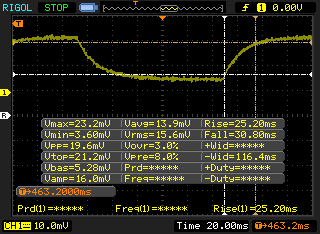 |
| ↘ 30.8 ms fall | ||
| The screen shows slow response rates in our tests and will be unsatisfactory for gamers. In comparison, all tested devices range from 0.165 (minimum) to 636 (maximum) ms. » 93 % of all devices are better. This means that the measured response time is worse than the average of all tested devices (31 ms). | ||
Screen Flickering / PWM (Pulse-Width Modulation)
| Screen flickering / PWM detected | 1000 Hz | ≤ 99 % brightness setting | 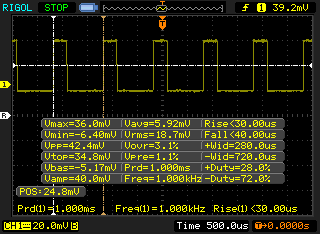 |
The display backlight flickers at 1000 Hz (worst case, e.g., utilizing PWM) Flickering detected at a brightness setting of 99 % and below. There should be no flickering or PWM above this brightness setting. The frequency of 1000 Hz is quite high, so most users sensitive to PWM should not notice any flickering. In comparison: 52 % of all tested devices do not use PWM to dim the display. If PWM was detected, an average of 7754 (minimum: 5 - maximum: 343500) Hz was measured. | |||
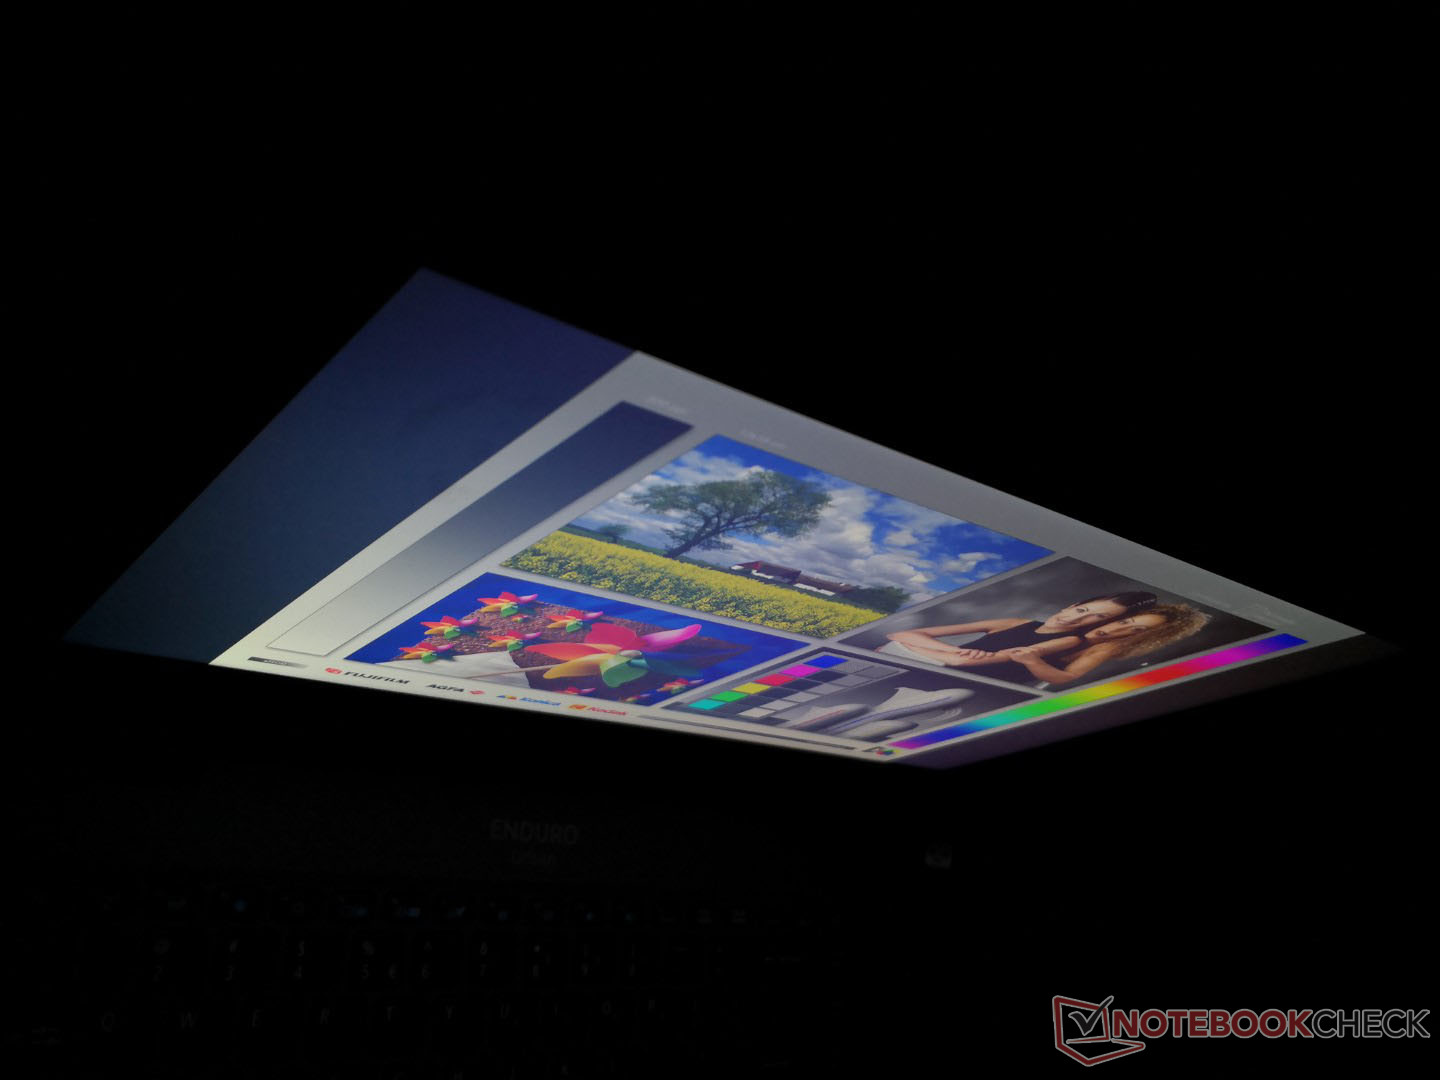
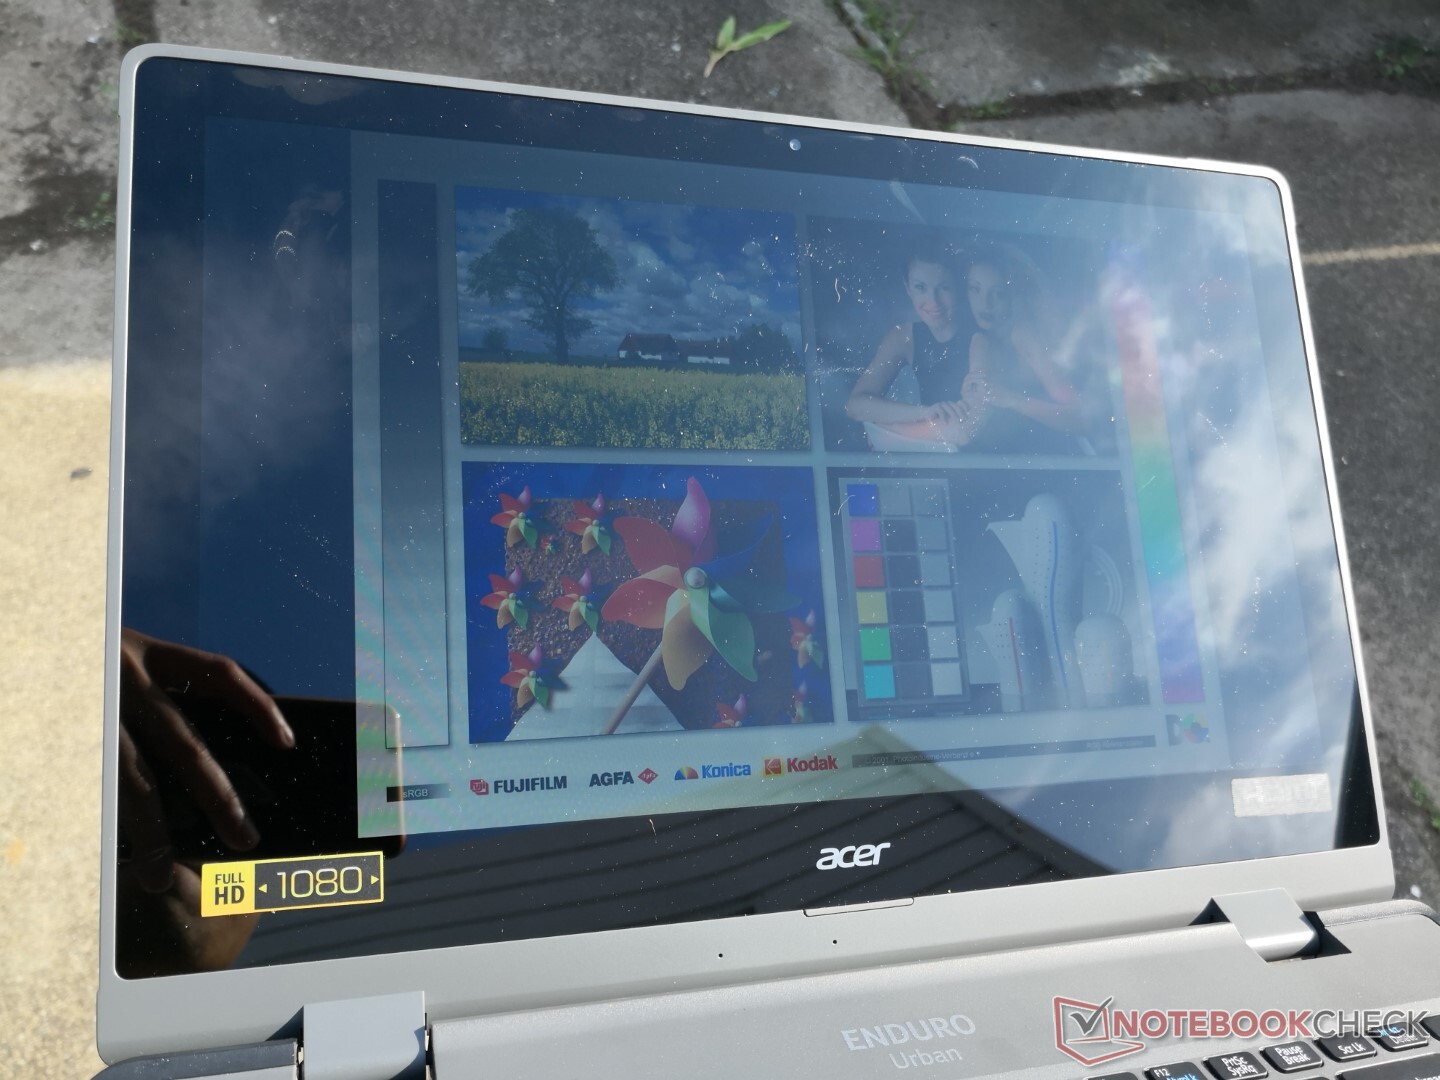
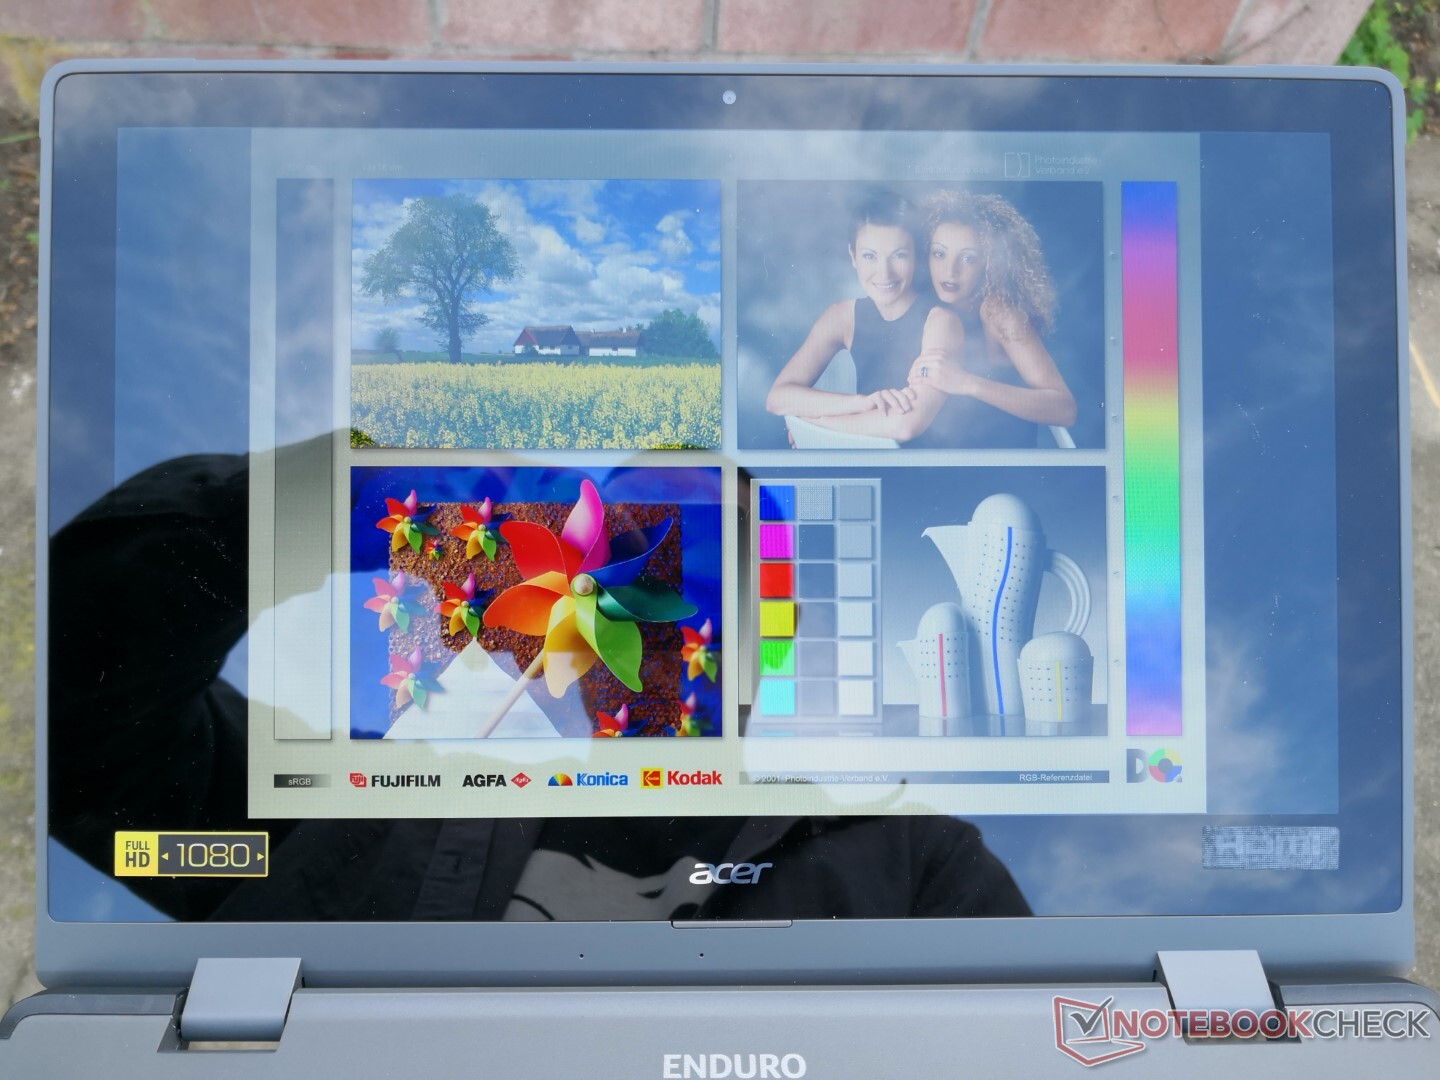
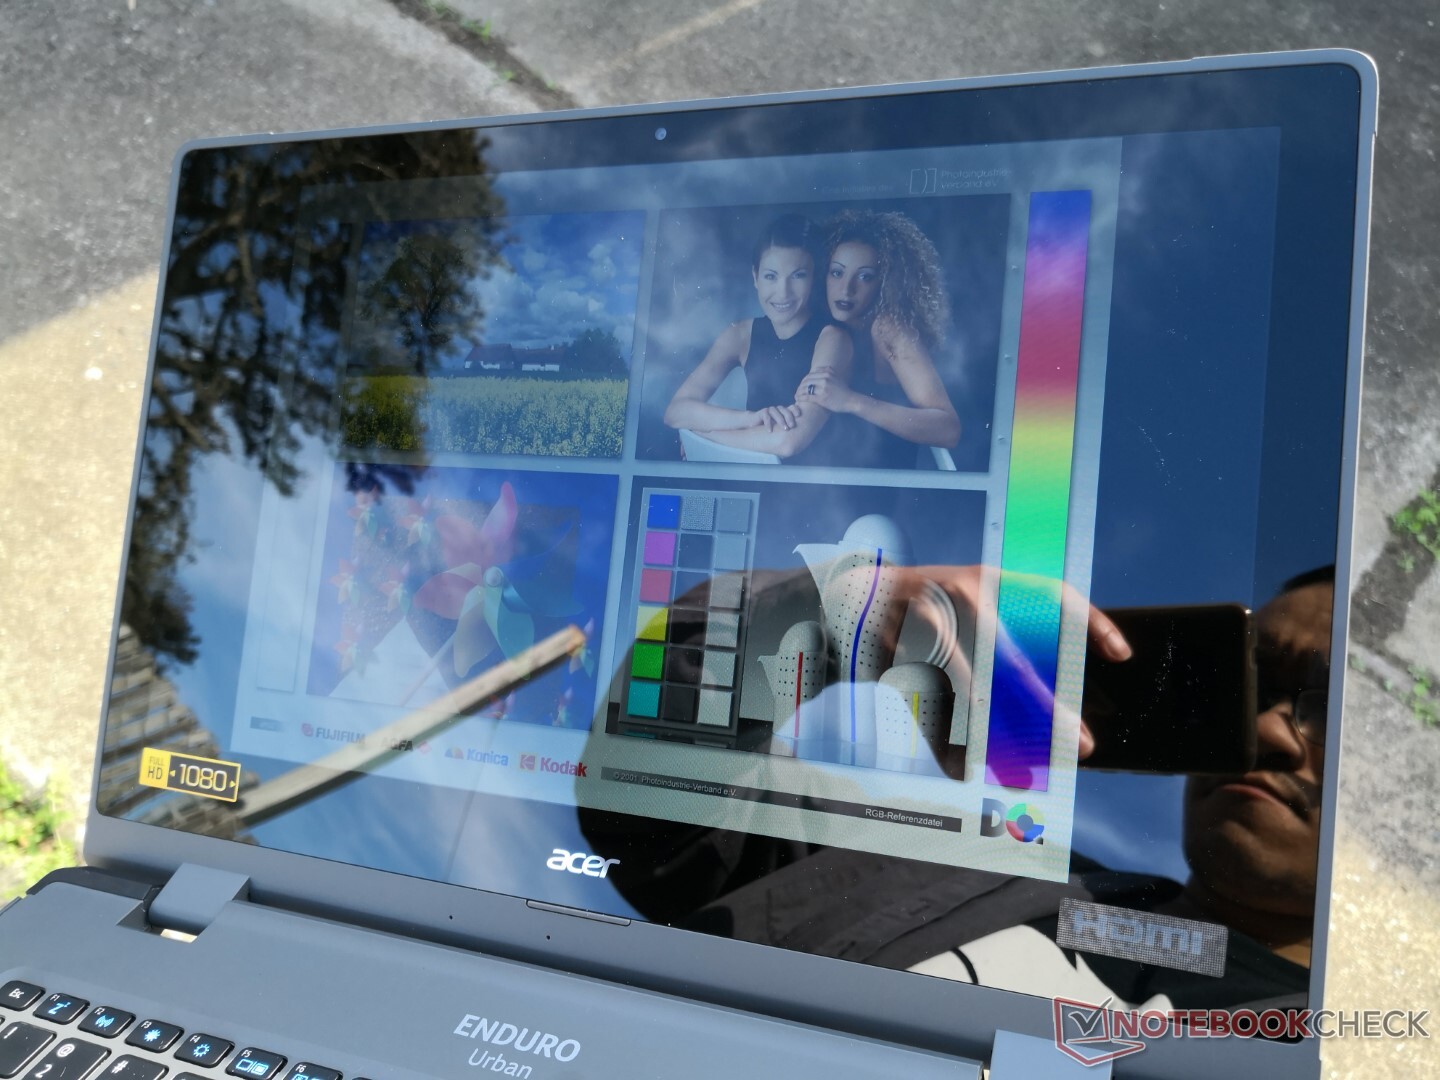
室外能见度通常比大多数消费级笔记本电脑(如戴尔XPS)要好,因为宏碁的显示屏明显更亮。然而,由于光泽覆盖层,眩光仍然存在,而且难以忽视。如果能有一个哑光选项,而不是在所有配置上都强制使用光面,那就更理想了。
业绩
测试条件
在运行以下任何性能基准测试之前,我们的设备通过Windows设置为最佳性能模式,以获得可能的最高分数。
处理器
CPU性能非常好,大约比Durabook S14I快40%。 笔记本电脑S14I尽管它们都采用了相同的 酷睿i7-1165G7CPU。降级到 酷睿i5-1135G7根据我们对其他酷睿i5-1135G7笔记本电脑的经验,降级到酷睿i5-1135G7配置预计只会带来非常轻微的性能损失。
Cinebench R15 Multi Loop
Cinebench R23: Multi Core | Single Core
Cinebench R20: CPU (Multi Core) | CPU (Single Core)
Cinebench R15: CPU Multi 64Bit | CPU Single 64Bit
Blender: v2.79 BMW27 CPU
7-Zip 18.03: 7z b 4 | 7z b 4 -mmt1
Geekbench 5.5: Multi-Core | Single-Core
HWBOT x265 Benchmark v2.2: 4k Preset
LibreOffice : 20 Documents To PDF
R Benchmark 2.5: Overall mean
| CPU Performance rating | |
| Lenovo IdeaPad Flex 5 14ALC05 82HU002YUS | |
| Lenovo Yoga Slim 7 14ARE05 82A20008GE | |
| Lenovo ThinkPad E14 G3-20Y7003SGE | |
| Dell XPS 13 7390 Core i7-10710U -6! | |
| Acer Enduro Urban N3 EUN314 | |
| Average Intel Core i7-1165G7 | |
| Panasonic Toughbook FZ-55 MK2 -2! | |
| Dynabook Tecra A40-J-12E | |
| Durabook S14I | |
| Lenovo ThinkPad L14-20U50003GE -2! | |
| Lenovo ThinkPad P14s Gen1 20S40009GE | |
| Getac S410 -12! | |
| Infinix INBook X1 Pro -2! | |
| HP ZBook 14u G6 6TP71EA -6! | |
| Dell Latitude 5420 Rugged-P85G -12! | |
| HP 14s-dq1431ng -2! | |
| Cinebench R23 / Multi Core | |
| Lenovo IdeaPad Flex 5 14ALC05 82HU002YUS | |
| Lenovo Yoga Slim 7 14ARE05 82A20008GE | |
| Lenovo ThinkPad E14 G3-20Y7003SGE | |
| Dynabook Tecra A40-J-12E | |
| Panasonic Toughbook FZ-55 MK2 | |
| Acer Enduro Urban N3 EUN314 | |
| Average Intel Core i7-1165G7 (2525 - 6862, n=64) | |
| Infinix INBook X1 Pro | |
| Lenovo ThinkPad P14s Gen1 20S40009GE | |
| Durabook S14I | |
| Cinebench R23 / Single Core | |
| Average Intel Core i7-1165G7 (1110 - 1539, n=59) | |
| Panasonic Toughbook FZ-55 MK2 | |
| Acer Enduro Urban N3 EUN314 | |
| Durabook S14I | |
| Dynabook Tecra A40-J-12E | |
| Lenovo IdeaPad Flex 5 14ALC05 82HU002YUS | |
| Lenovo Yoga Slim 7 14ARE05 82A20008GE | |
| Infinix INBook X1 Pro | |
| Lenovo ThinkPad P14s Gen1 20S40009GE | |
| Lenovo ThinkPad E14 G3-20Y7003SGE | |
| Cinebench R20 / CPU (Multi Core) | |
| Lenovo IdeaPad Flex 5 14ALC05 82HU002YUS | |
| Lenovo Yoga Slim 7 14ARE05 82A20008GE | |
| Lenovo ThinkPad E14 G3-20Y7003SGE | |
| Dell XPS 13 7390 Core i7-10710U | |
| Lenovo ThinkPad L14-20U50003GE | |
| Dynabook Tecra A40-J-12E | |
| Panasonic Toughbook FZ-55 MK2 | |
| Acer Enduro Urban N3 EUN314 | |
| Average Intel Core i7-1165G7 (1060 - 2657, n=81) | |
| Infinix INBook X1 Pro | |
| Lenovo ThinkPad P14s Gen1 20S40009GE | |
| Durabook S14I | |
| HP 14s-dq1431ng | |
| HP 14s-dq1431ng | |
| HP ZBook 14u G6 6TP71EA | |
| Cinebench R20 / CPU (Single Core) | |
| Average Intel Core i7-1165G7 (442 - 589, n=81) | |
| Acer Enduro Urban N3 EUN314 | |
| Panasonic Toughbook FZ-55 MK2 | |
| Durabook S14I | |
| Dynabook Tecra A40-J-12E | |
| Lenovo IdeaPad Flex 5 14ALC05 82HU002YUS | |
| Lenovo Yoga Slim 7 14ARE05 82A20008GE | |
| Lenovo ThinkPad P14s Gen1 20S40009GE | |
| Infinix INBook X1 Pro | |
| Dell XPS 13 7390 Core i7-10710U | |
| Lenovo ThinkPad E14 G3-20Y7003SGE | |
| Lenovo ThinkPad L14-20U50003GE | |
| HP 14s-dq1431ng | |
| HP 14s-dq1431ng | |
| HP ZBook 14u G6 6TP71EA | |
| Cinebench R15 / CPU Multi 64Bit | |
| Lenovo IdeaPad Flex 5 14ALC05 82HU002YUS | |
| Lenovo ThinkPad E14 G3-20Y7003SGE | |
| Lenovo Yoga Slim 7 14ARE05 82A20008GE | |
| Dell XPS 13 7390 Core i7-10710U | |
| Dynabook Tecra A40-J-12E | |
| Lenovo ThinkPad L14-20U50003GE | |
| Average Intel Core i7-1165G7 (553 - 1027, n=86) | |
| Acer Enduro Urban N3 EUN314 | |
| Panasonic Toughbook FZ-55 MK2 | |
| Lenovo ThinkPad P14s Gen1 20S40009GE | |
| Infinix INBook X1 Pro | |
| HP 14s-dq1431ng | |
| Durabook S14I | |
| Getac S410 | |
| HP ZBook 14u G6 6TP71EA | |
| Dell Latitude 5420 Rugged-P85G | |
| Cinebench R15 / CPU Single 64Bit | |
| Panasonic Toughbook FZ-55 MK2 | |
| Acer Enduro Urban N3 EUN314 | |
| Average Intel Core i7-1165G7 (115 - 230, n=78) | |
| Durabook S14I | |
| Dynabook Tecra A40-J-12E | |
| Lenovo IdeaPad Flex 5 14ALC05 82HU002YUS | |
| Lenovo ThinkPad P14s Gen1 20S40009GE | |
| Infinix INBook X1 Pro | |
| Dell XPS 13 7390 Core i7-10710U | |
| Lenovo Yoga Slim 7 14ARE05 82A20008GE | |
| Lenovo ThinkPad E14 G3-20Y7003SGE | |
| Lenovo ThinkPad L14-20U50003GE | |
| HP 14s-dq1431ng | |
| HP ZBook 14u G6 6TP71EA | |
| Getac S410 | |
| Dell Latitude 5420 Rugged-P85G | |
| Blender / v2.79 BMW27 CPU | |
| HP 14s-dq1431ng | |
| HP 14s-dq1431ng | |
| HP ZBook 14u G6 6TP71EA | |
| Durabook S14I | |
| Infinix INBook X1 Pro | |
| Lenovo ThinkPad P14s Gen1 20S40009GE | |
| Average Intel Core i7-1165G7 (468 - 1138, n=80) | |
| Dell XPS 13 7390 Core i7-10710U | |
| Panasonic Toughbook FZ-55 MK2 | |
| Acer Enduro Urban N3 EUN314 | |
| Lenovo ThinkPad L14-20U50003GE | |
| Dynabook Tecra A40-J-12E | |
| Lenovo Yoga Slim 7 14ARE05 82A20008GE | |
| Lenovo ThinkPad E14 G3-20Y7003SGE | |
| Lenovo IdeaPad Flex 5 14ALC05 82HU002YUS | |
| 7-Zip 18.03 / 7z b 4 | |
| Lenovo IdeaPad Flex 5 14ALC05 82HU002YUS | |
| Lenovo ThinkPad E14 G3-20Y7003SGE | |
| Lenovo Yoga Slim 7 14ARE05 82A20008GE | |
| Dell XPS 13 7390 Core i7-10710U | |
| Lenovo ThinkPad L14-20U50003GE | |
| Acer Enduro Urban N3 EUN314 | |
| Panasonic Toughbook FZ-55 MK2 | |
| Dynabook Tecra A40-J-12E | |
| Average Intel Core i7-1165G7 (15347 - 27405, n=80) | |
| Infinix INBook X1 Pro | |
| Lenovo ThinkPad P14s Gen1 20S40009GE | |
| Durabook S14I | |
| HP ZBook 14u G6 6TP71EA | |
| HP 14s-dq1431ng | |
| HP 14s-dq1431ng | |
| 7-Zip 18.03 / 7z b 4 -mmt1 | |
| Acer Enduro Urban N3 EUN314 | |
| Panasonic Toughbook FZ-55 MK2 | |
| Durabook S14I | |
| Average Intel Core i7-1165G7 (4478 - 5507, n=80) | |
| Lenovo ThinkPad P14s Gen1 20S40009GE | |
| Dynabook Tecra A40-J-12E | |
| Lenovo IdeaPad Flex 5 14ALC05 82HU002YUS | |
| HP ZBook 14u G6 6TP71EA | |
| Dell XPS 13 7390 Core i7-10710U | |
| Infinix INBook X1 Pro | |
| Lenovo Yoga Slim 7 14ARE05 82A20008GE | |
| Lenovo ThinkPad L14-20U50003GE | |
| Lenovo ThinkPad E14 G3-20Y7003SGE | |
| HP 14s-dq1431ng | |
| HP 14s-dq1431ng | |
| Geekbench 5.5 / Multi-Core | |
| Lenovo IdeaPad Flex 5 14ALC05 82HU002YUS | |
| Lenovo Yoga Slim 7 14ARE05 82A20008GE | |
| Lenovo ThinkPad E14 G3-20Y7003SGE | |
| Acer Enduro Urban N3 EUN314 | |
| Average Intel Core i7-1165G7 (3078 - 5926, n=77) | |
| Lenovo ThinkPad L14-20U50003GE | |
| Dynabook Tecra A40-J-12E | |
| Durabook S14I | |
| HP 14s-dq1431ng | |
| HP 14s-dq1431ng | |
| Lenovo ThinkPad P14s Gen1 20S40009GE | |
| Geekbench 5.5 / Single-Core | |
| Acer Enduro Urban N3 EUN314 | |
| Average Intel Core i7-1165G7 (1302 - 1595, n=77) | |
| Durabook S14I | |
| Dynabook Tecra A40-J-12E | |
| Lenovo ThinkPad P14s Gen1 20S40009GE | |
| HP 14s-dq1431ng | |
| HP 14s-dq1431ng | |
| Lenovo IdeaPad Flex 5 14ALC05 82HU002YUS | |
| Lenovo Yoga Slim 7 14ARE05 82A20008GE | |
| Lenovo ThinkPad E14 G3-20Y7003SGE | |
| Lenovo ThinkPad L14-20U50003GE | |
| HWBOT x265 Benchmark v2.2 / 4k Preset | |
| Lenovo IdeaPad Flex 5 14ALC05 82HU002YUS | |
| Lenovo Yoga Slim 7 14ARE05 82A20008GE | |
| Lenovo ThinkPad E14 G3-20Y7003SGE | |
| Lenovo ThinkPad L14-20U50003GE | |
| Panasonic Toughbook FZ-55 MK2 | |
| Dynabook Tecra A40-J-12E | |
| Acer Enduro Urban N3 EUN314 | |
| Average Intel Core i7-1165G7 (1.39 - 8.47, n=80) | |
| Dell XPS 13 7390 Core i7-10710U | |
| Infinix INBook X1 Pro | |
| Lenovo ThinkPad P14s Gen1 20S40009GE | |
| Durabook S14I | |
| HP ZBook 14u G6 6TP71EA | |
| HP 14s-dq1431ng | |
| HP 14s-dq1431ng | |
| LibreOffice / 20 Documents To PDF | |
| HP 14s-dq1431ng | |
| HP 14s-dq1431ng | |
| Lenovo Yoga Slim 7 14ARE05 82A20008GE | |
| Acer Enduro Urban N3 EUN314 | |
| Lenovo ThinkPad E14 G3-20Y7003SGE | |
| Lenovo ThinkPad L14-20U50003GE | |
| Lenovo IdeaPad Flex 5 14ALC05 82HU002YUS | |
| Infinix INBook X1 Pro | |
| Dynabook Tecra A40-J-12E | |
| Lenovo ThinkPad P14s Gen1 20S40009GE | |
| Panasonic Toughbook FZ-55 MK2 | |
| Average Intel Core i7-1165G7 (21.5 - 88.1, n=78) | |
| Durabook S14I | |
| R Benchmark 2.5 / Overall mean | |
| HP 14s-dq1431ng | |
| HP 14s-dq1431ng | |
| Infinix INBook X1 Pro | |
| Lenovo ThinkPad P14s Gen1 20S40009GE | |
| Lenovo ThinkPad L14-20U50003GE | |
| Dynabook Tecra A40-J-12E | |
| Lenovo ThinkPad E14 G3-20Y7003SGE | |
| Lenovo Yoga Slim 7 14ARE05 82A20008GE | |
| Durabook S14I | |
| Average Intel Core i7-1165G7 (0.552 - 1.002, n=80) | |
| Lenovo IdeaPad Flex 5 14ALC05 82HU002YUS | |
| Acer Enduro Urban N3 EUN314 | |
| Panasonic Toughbook FZ-55 MK2 | |
Cinebench R23: Multi Core | Single Core
Cinebench R20: CPU (Multi Core) | CPU (Single Core)
Cinebench R15: CPU Multi 64Bit | CPU Single 64Bit
Blender: v2.79 BMW27 CPU
7-Zip 18.03: 7z b 4 | 7z b 4 -mmt1
Geekbench 5.5: Multi-Core | Single-Core
HWBOT x265 Benchmark v2.2: 4k Preset
LibreOffice : 20 Documents To PDF
R Benchmark 2.5: Overall mean
* ... smaller is better
AIDA64: FP32 Ray-Trace | FPU Julia | CPU SHA3 | CPU Queen | FPU SinJulia | FPU Mandel | CPU AES | CPU ZLib | FP64 Ray-Trace | CPU PhotoWorxx
| Performance rating | |
| Acer Enduro Urban N3 EUN314 | |
| Average Intel Core i7-1165G7 | |
| Panasonic Toughbook FZ-55 MK2 | |
| Durabook S14I | |
| AIDA64 / FP32 Ray-Trace | |
| Acer Enduro Urban N3 EUN314 | |
| Average Intel Core i7-1165G7 (3933 - 8184, n=58) | |
| Panasonic Toughbook FZ-55 MK2 | |
| Durabook S14I | |
| AIDA64 / FPU Julia | |
| Acer Enduro Urban N3 EUN314 | |
| Panasonic Toughbook FZ-55 MK2 | |
| Average Intel Core i7-1165G7 (17720 - 34369, n=58) | |
| Durabook S14I | |
| AIDA64 / CPU SHA3 | |
| Acer Enduro Urban N3 EUN314 | |
| Average Intel Core i7-1165G7 (958 - 2338, n=58) | |
| Panasonic Toughbook FZ-55 MK2 | |
| Durabook S14I | |
| AIDA64 / CPU Queen | |
| Acer Enduro Urban N3 EUN314 | |
| Durabook S14I | |
| Panasonic Toughbook FZ-55 MK2 | |
| Average Intel Core i7-1165G7 (44161 - 50624, n=58) | |
| AIDA64 / FPU SinJulia | |
| Acer Enduro Urban N3 EUN314 | |
| Panasonic Toughbook FZ-55 MK2 | |
| Average Intel Core i7-1165G7 (3183 - 4796, n=58) | |
| Durabook S14I | |
| AIDA64 / FPU Mandel | |
| Acer Enduro Urban N3 EUN314 | |
| Panasonic Toughbook FZ-55 MK2 | |
| Average Intel Core i7-1165G7 (11876 - 20468, n=58) | |
| Durabook S14I | |
| AIDA64 / CPU AES | |
| Acer Enduro Urban N3 EUN314 | |
| Average Intel Core i7-1165G7 (29506 - 73387, n=58) | |
| Durabook S14I | |
| Panasonic Toughbook FZ-55 MK2 | |
| AIDA64 / CPU ZLib | |
| Acer Enduro Urban N3 EUN314 | |
| Average Intel Core i7-1165G7 (169 - 402, n=65) | |
| Panasonic Toughbook FZ-55 MK2 | |
| Durabook S14I | |
| AIDA64 / FP64 Ray-Trace | |
| Acer Enduro Urban N3 EUN314 | |
| Panasonic Toughbook FZ-55 MK2 | |
| Average Intel Core i7-1165G7 (2033 - 4461, n=58) | |
| Durabook S14I | |
| AIDA64 / CPU PhotoWorxx | |
| Average Intel Core i7-1165G7 (12392 - 45694, n=58) | |
| Acer Enduro Urban N3 EUN314 | |
| Panasonic Toughbook FZ-55 MK2 | |
| Durabook S14I | |
系统性能
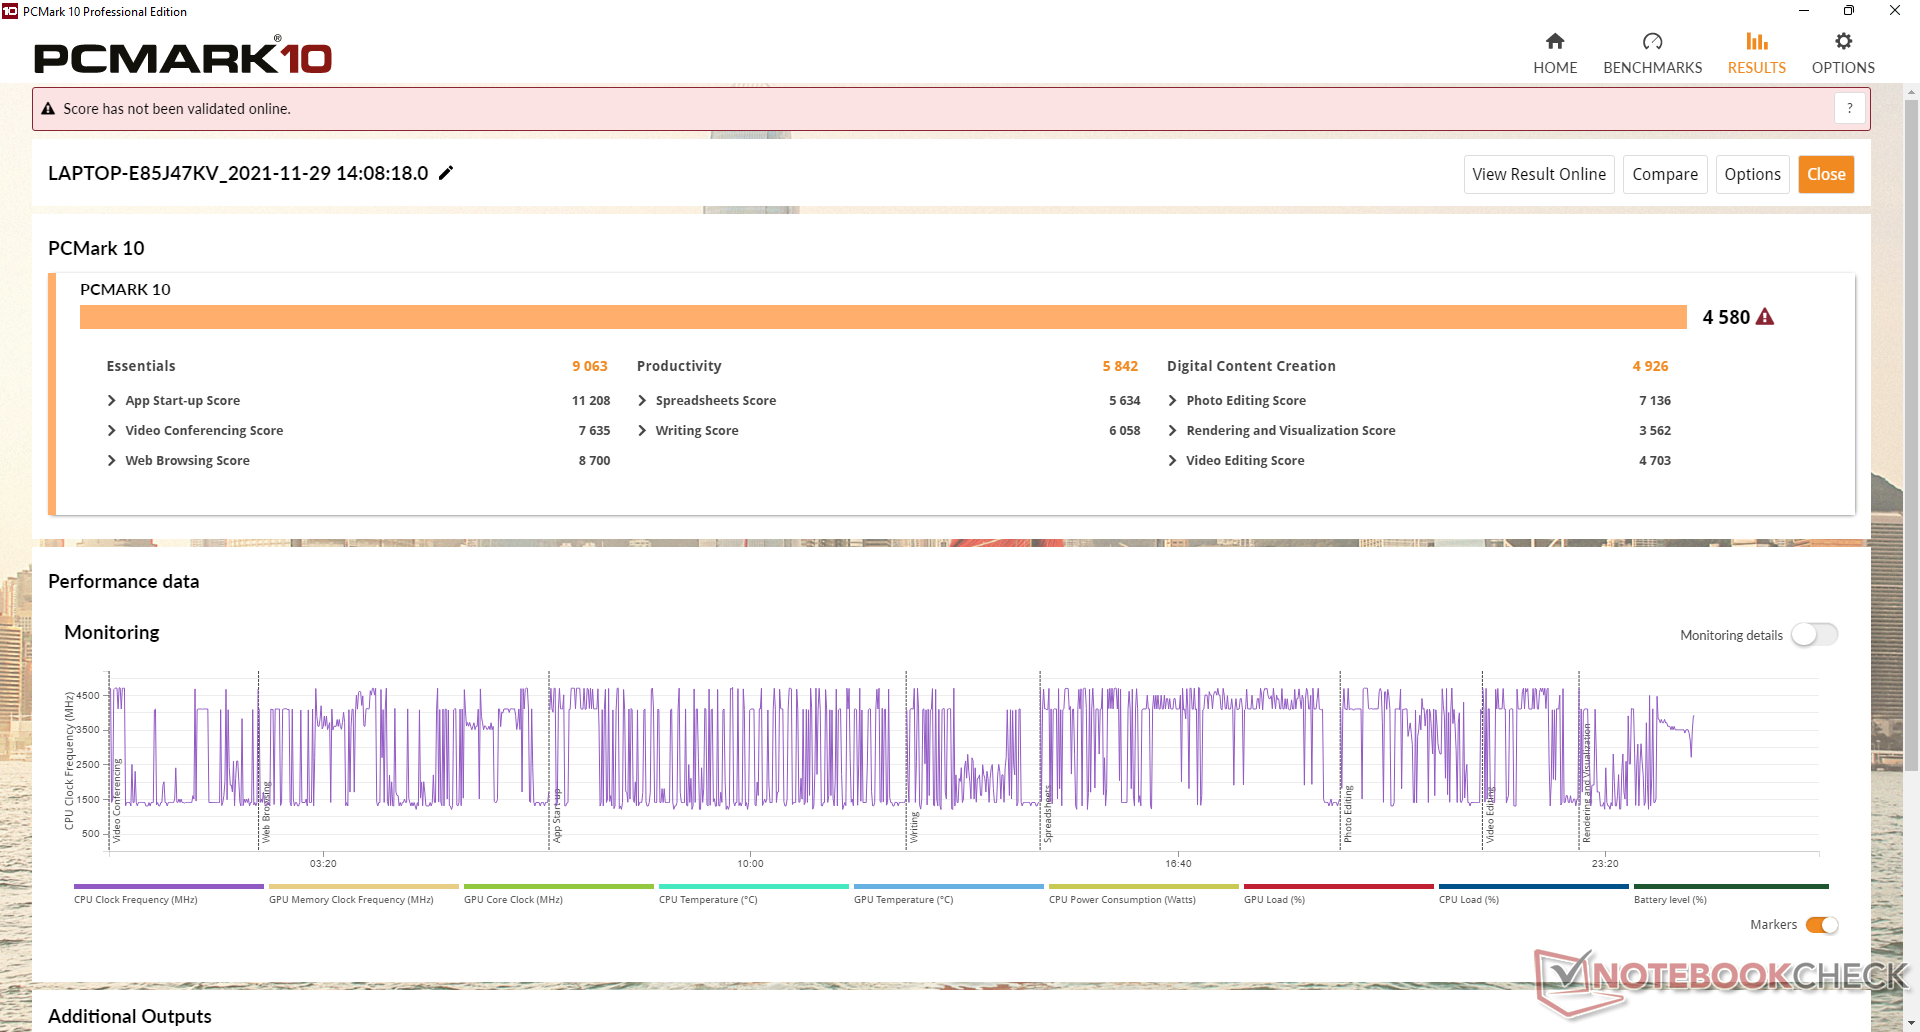
PCMark的结果奇怪地落后于DuraBook S14I,尽管我们的宏碁有相同的CPU,但有更高的PL1目标(28W对15W)。
| PCMark 10 / Score | |
| Panasonic Toughbook FZ-55 MK2 | |
| Average Intel Core i7-1165G7, Intel Iris Xe Graphics G7 96EUs (4531 - 5454, n=50) | |
| Durabook S14I | |
| Acer Enduro Urban N3 EUN314 | |
| Dell Latitude 5420 Rugged-P85G | |
| Getac S410 | |
| PCMark 10 / Essentials | |
| Panasonic Toughbook FZ-55 MK2 | |
| Durabook S14I | |
| Average Intel Core i7-1165G7, Intel Iris Xe Graphics G7 96EUs (8997 - 11505, n=50) | |
| Acer Enduro Urban N3 EUN314 | |
| Dell Latitude 5420 Rugged-P85G | |
| Getac S410 | |
| PCMark 10 / Productivity | |
| Dell Latitude 5420 Rugged-P85G | |
| Durabook S14I | |
| Getac S410 | |
| Average Intel Core i7-1165G7, Intel Iris Xe Graphics G7 96EUs (5570 - 7136, n=50) | |
| Panasonic Toughbook FZ-55 MK2 | |
| Acer Enduro Urban N3 EUN314 | |
| PCMark 10 / Digital Content Creation | |
| Panasonic Toughbook FZ-55 MK2 | |
| Average Intel Core i7-1165G7, Intel Iris Xe Graphics G7 96EUs (4083 - 5550, n=50) | |
| Acer Enduro Urban N3 EUN314 | |
| Durabook S14I | |
| Dell Latitude 5420 Rugged-P85G | |
| Getac S410 | |
| PCMark 10 Score | 4580 points | |
Help | ||
| AIDA64 / Memory Copy | |
| Average Intel Core i7-1165G7 (20032 - 65446, n=58) | |
| Acer Enduro Urban N3 EUN314 | |
| Panasonic Toughbook FZ-55 MK2 | |
| Durabook S14I | |
| AIDA64 / Memory Read | |
| Average Intel Core i7-1165G7 (23033 - 64524, n=58) | |
| Acer Enduro Urban N3 EUN314 | |
| Panasonic Toughbook FZ-55 MK2 | |
| Durabook S14I | |
| AIDA64 / Memory Write | |
| Average Intel Core i7-1165G7 (21736 - 66791, n=58) | |
| Acer Enduro Urban N3 EUN314 | |
| Panasonic Toughbook FZ-55 MK2 | |
| Durabook S14I | |
| AIDA64 / Memory Latency | |
| Acer Enduro Urban N3 EUN314 | |
| Panasonic Toughbook FZ-55 MK2 | |
| Average Intel Core i7-1165G7 (69 - 110, n=65) | |
| Durabook S14I | |
* ... smaller is better
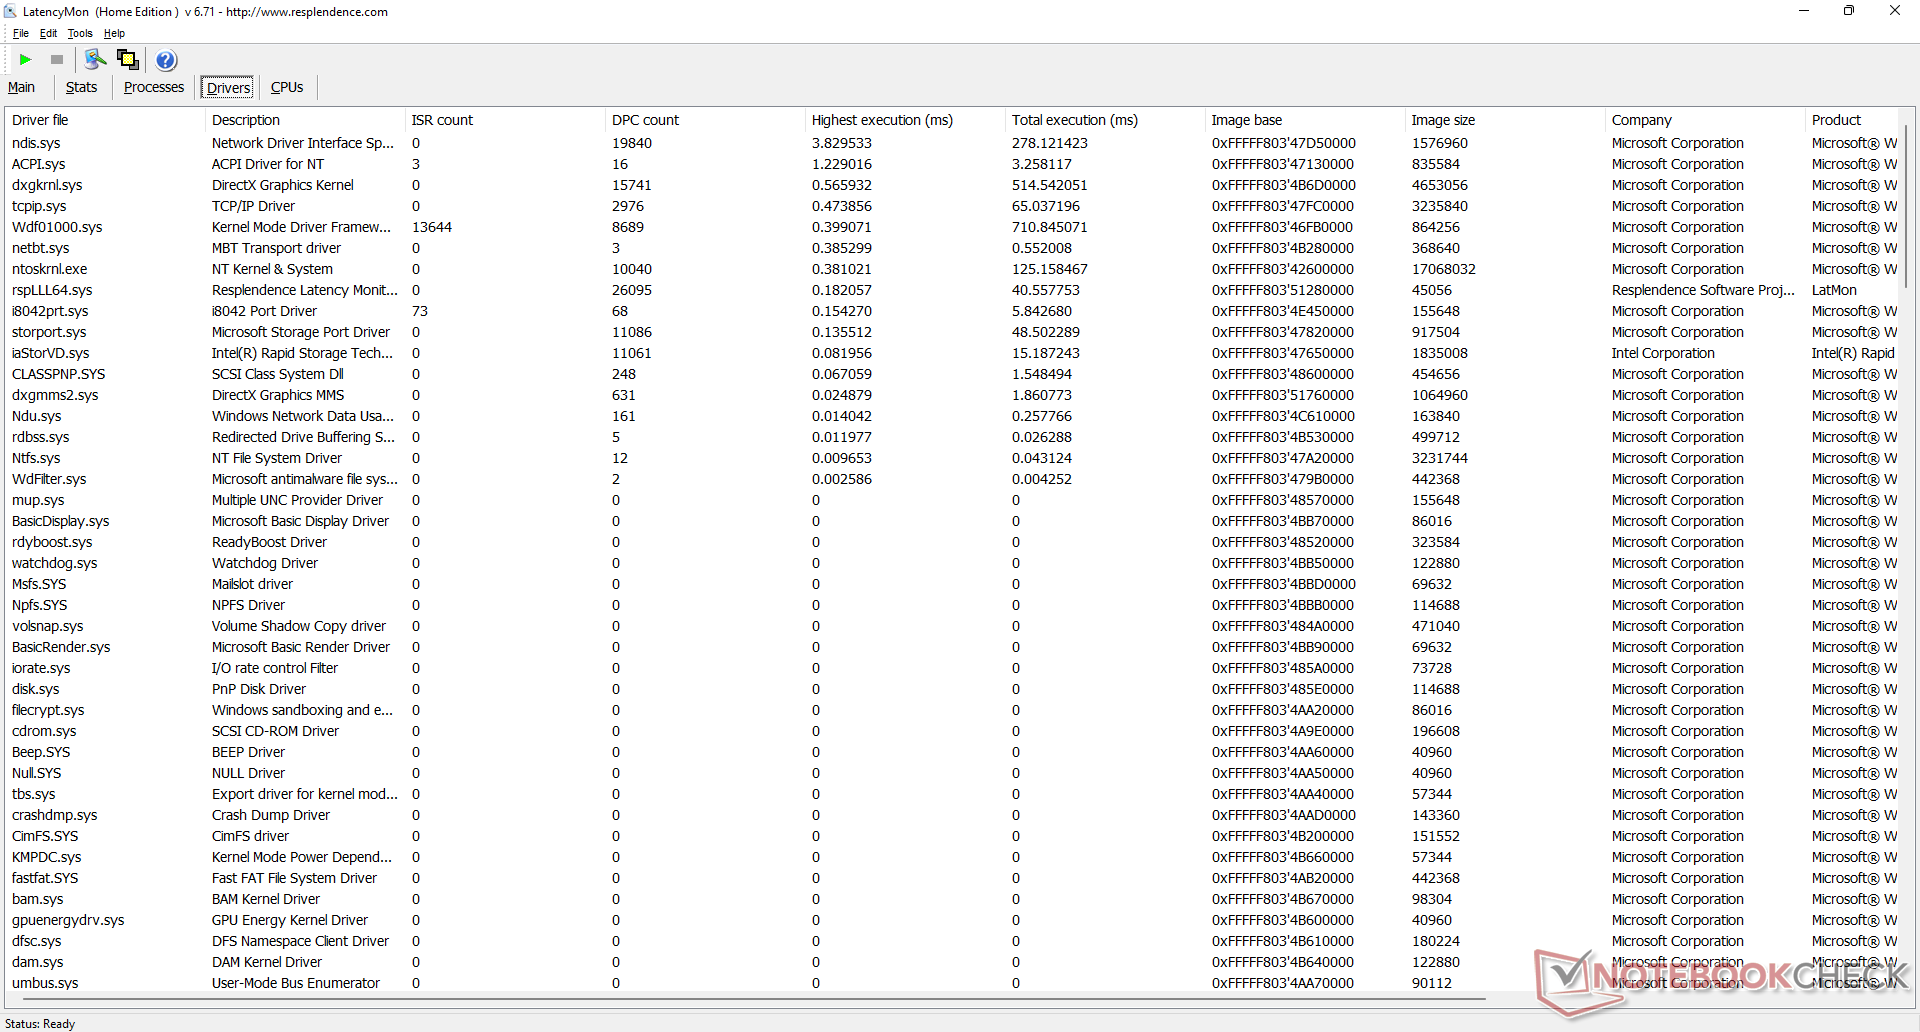
DPC延时
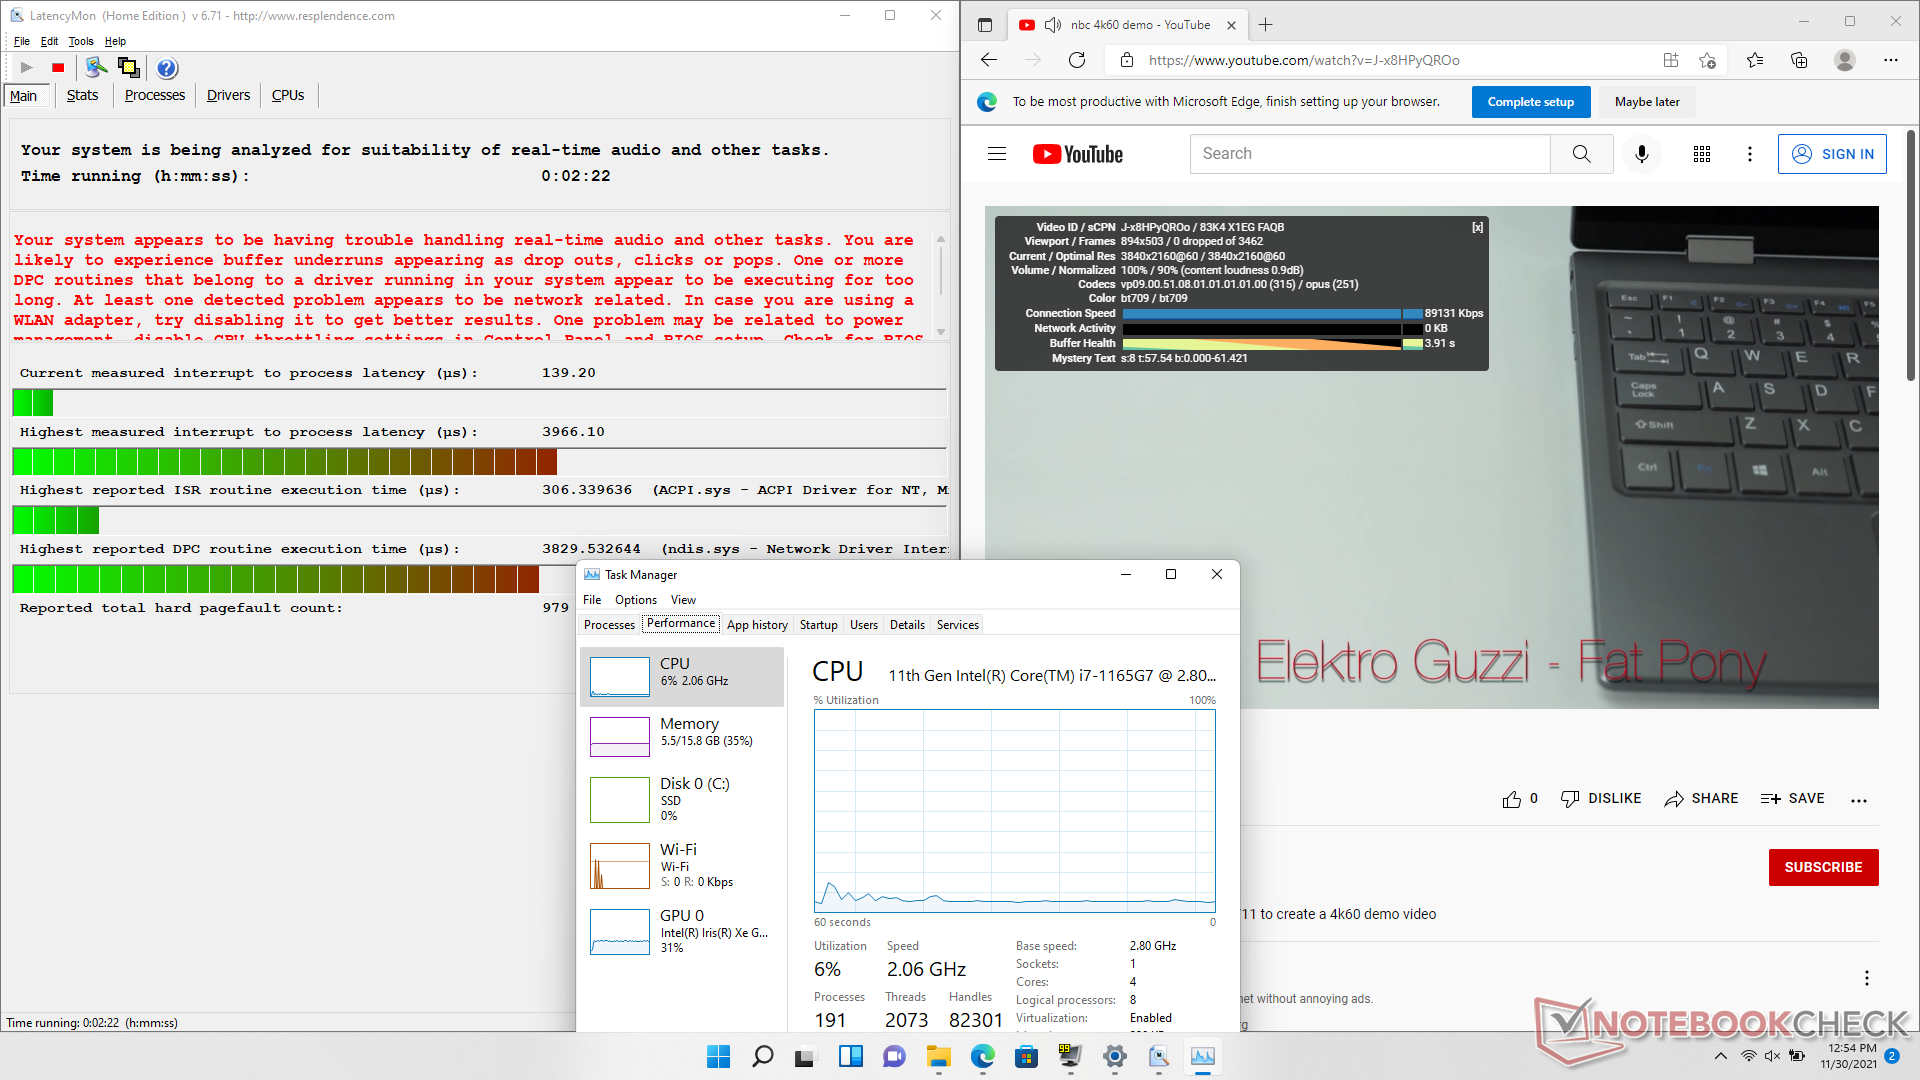
LatencyMon显示在我们的主页上打开多个浏览器标签时存在DPC问题。在60 FPS的情况下,4K视频播放很流畅,没有任何掉帧。
| DPC Latencies / LatencyMon - interrupt to process latency (max), Web, Youtube, Prime95 | |
| Acer Enduro Urban N3 EUN314 | |
| Panasonic Toughbook FZ-55 MK2 | |
| Durabook S14I | |
* ... smaller is better
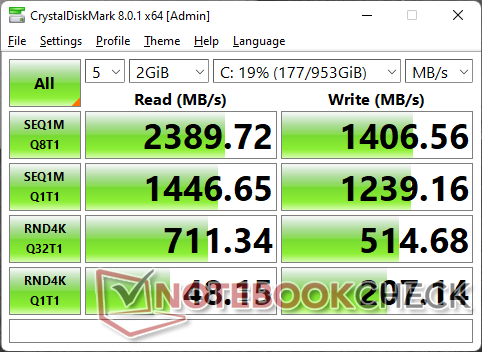
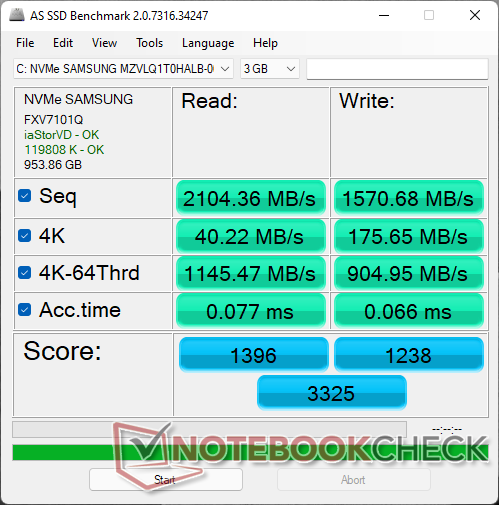
存储设备
我们的设备配备了一个1TB 三星PM991(不是PM991a),这是一个中档的PCIe3 NVMe SSD。顺序读取率最高为2300MB/s,但由于缺乏帮助冷却的散热器,意味着在压力下性能会下降,正如我们下面的DiskSpd读取循环测试结果所示。令人讨厌的是,用户只能在一些SKU上添加第二个存储驱动器,而不是所有的SKU。

| Drive Performance rating - Percent | |
| Acer Enduro Urban N3 EUN314 | |
| Durabook S14I | |
| Dell Latitude 5420 Rugged-P85G -8! | |
| Panasonic Toughbook FZ-55 MK2 | |
| Getac S410 -8! | |
* ... smaller is better
Disk Throttling: DiskSpd Read Loop, Queue Depth 8
GPU性能
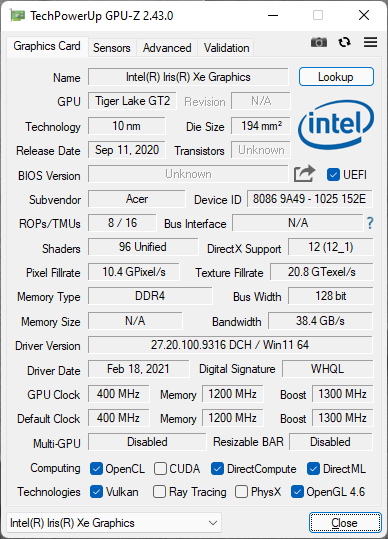
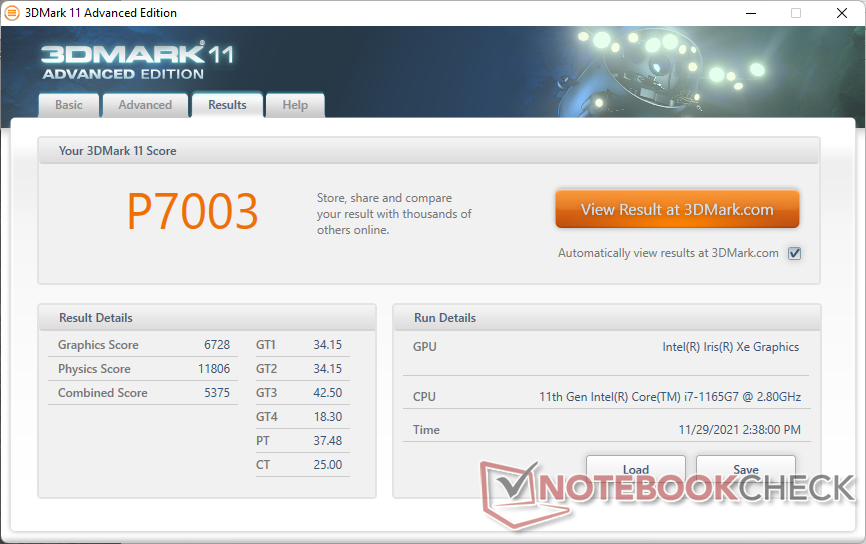
集成的 Iris Xe 96 EUs相对于我们数据库中的平均水平,GPU的表现是我们所期望的。降级到酷睿i5 SKU,配备较少的 Iris Xe 80 EUs将会导致性能下降约30%至40%。
| 3DMark Performance rating - Percent | |
| Acer Enduro Urban N3 EUN314 | |
| Average Intel Iris Xe Graphics G7 96EUs | |
| Panasonic Toughbook FZ-55 MK2 | |
| Lenovo IdeaPad Flex 5 14ALC05 82HU002YUS | |
| Lenovo Yoga Slim 7 14ARE05 82A20008GE | |
| Durabook S14I | |
| Lenovo ThinkPad E14 G3-20Y7003SGE | |
| Lenovo ThinkPad P14s Gen1 20S40009GE | |
| HP ZBook 14u G6 6TP71EA | |
| Dynabook Tecra A40-J-12E | |
| Dell Latitude 5420 Rugged-P85G | |
| Infinix INBook X1 Pro | |
| Lenovo ThinkPad L14-20U50003GE -2! | |
| Dell Inspiron 14 3493-4KWCF | |
| HP 14s-dq1431ng -2! | |
| Dell XPS 13 7390 Core i7-10710U | |
| Getac S410 -3! | |
| 3DMark 11 - 1280x720 Performance GPU | |
| Acer Enduro Urban N3 EUN314 | |
| Panasonic Toughbook FZ-55 MK2 | |
| Average Intel Iris Xe Graphics G7 96EUs (2867 - 7676, n=209) | |
| Lenovo IdeaPad Flex 5 14ALC05 82HU002YUS | |
| Lenovo Yoga Slim 7 14ARE05 82A20008GE | |
| Durabook S14I | |
| Lenovo ThinkPad E14 G3-20Y7003SGE | |
| Dell Latitude 5420 Rugged-P85G | |
| Dynabook Tecra A40-J-12E | |
| HP ZBook 14u G6 6TP71EA | |
| Lenovo ThinkPad P14s Gen1 20S40009GE | |
| Infinix INBook X1 Pro | |
| Lenovo ThinkPad L14-20U50003GE | |
| Dell Inspiron 14 3493-4KWCF | |
| HP 14s-dq1431ng | |
| Dell XPS 13 7390 Core i7-10710U | |
| Getac S410 | |
| 3DMark 11 Performance | 7003 points | |
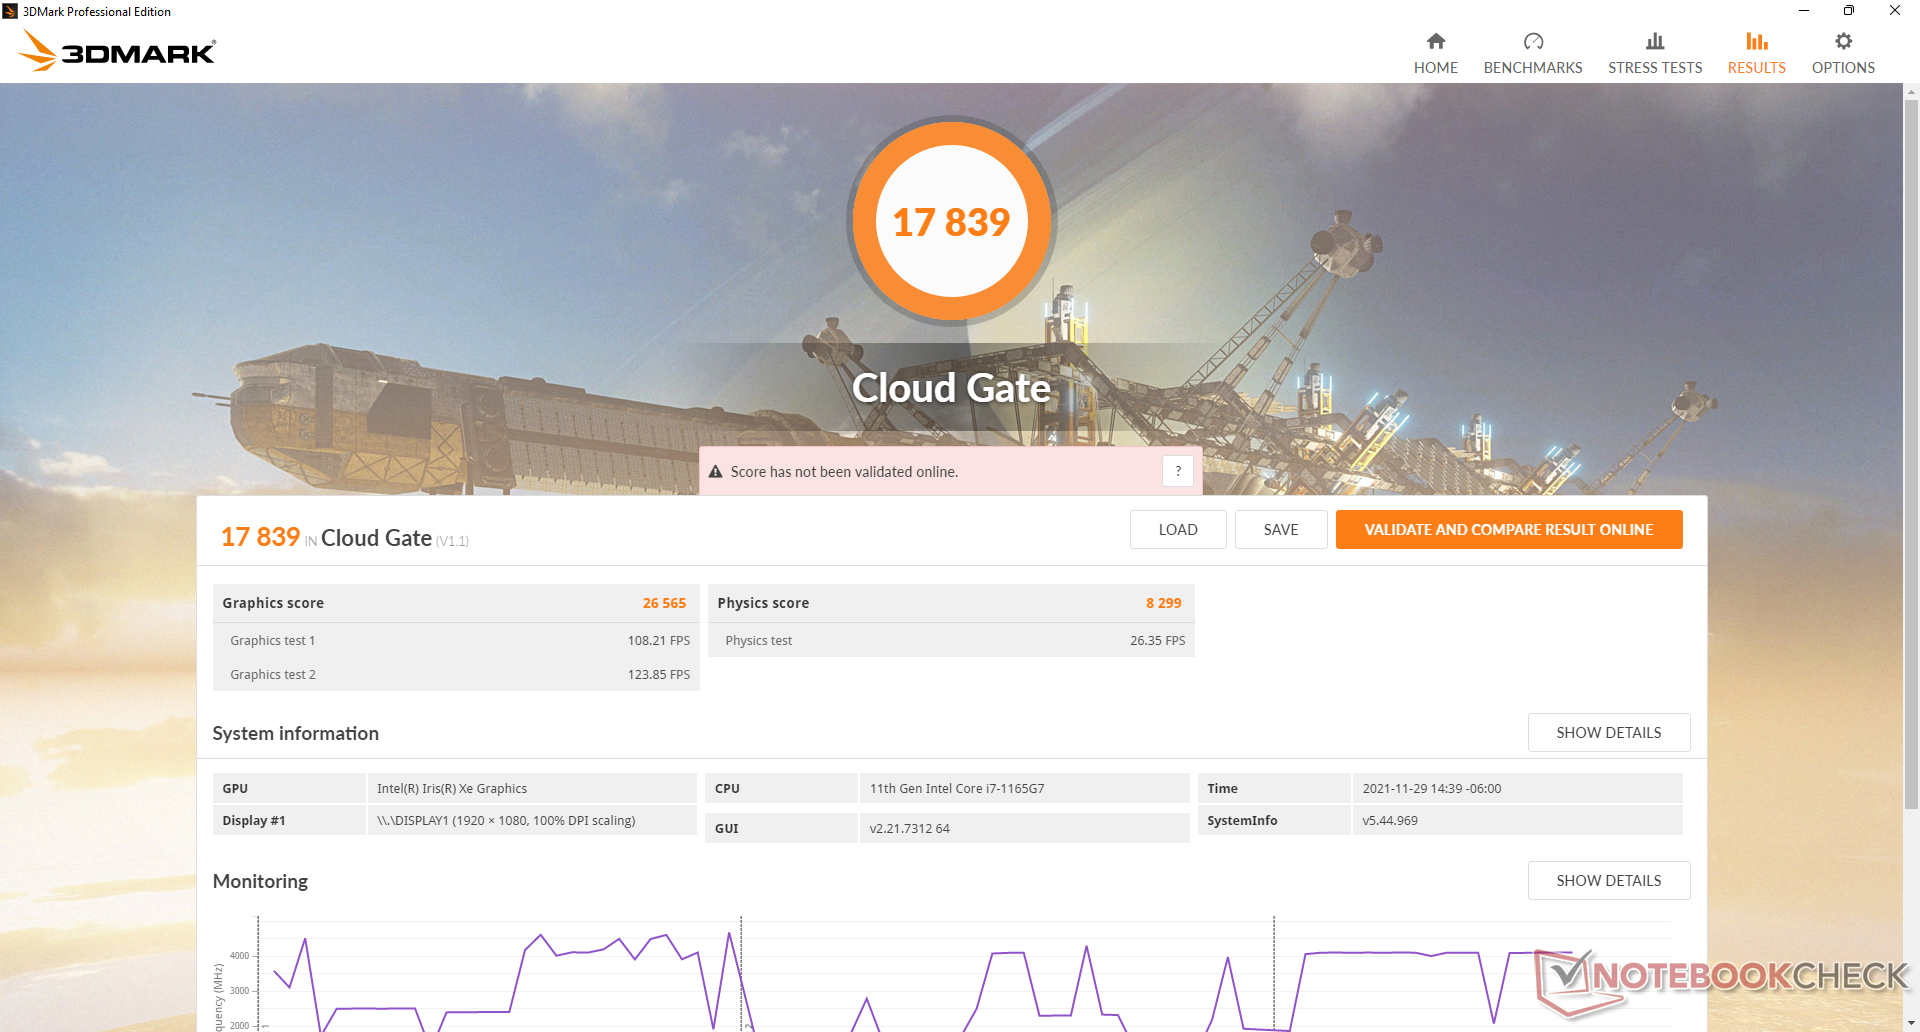
| 3DMark Cloud Gate Standard Score | 17839 points | |
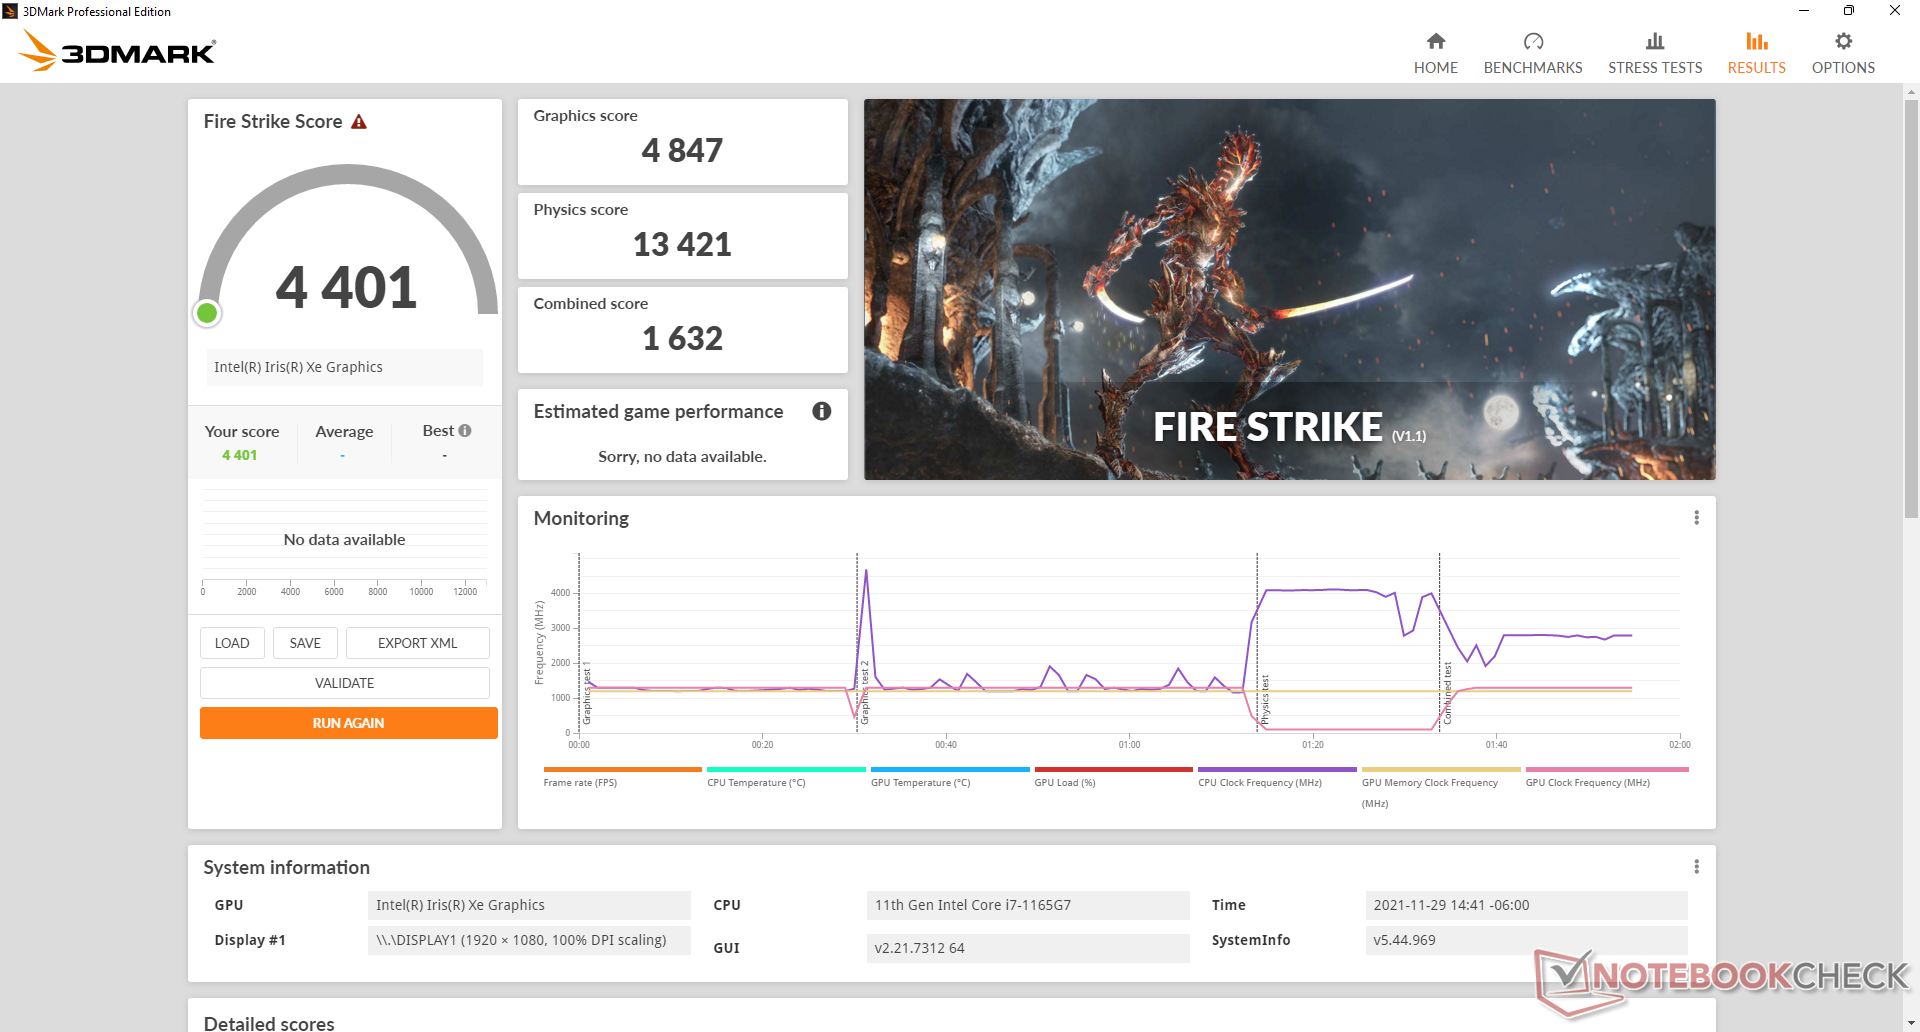
| 3DMark Fire Strike Score | 4401 points | |
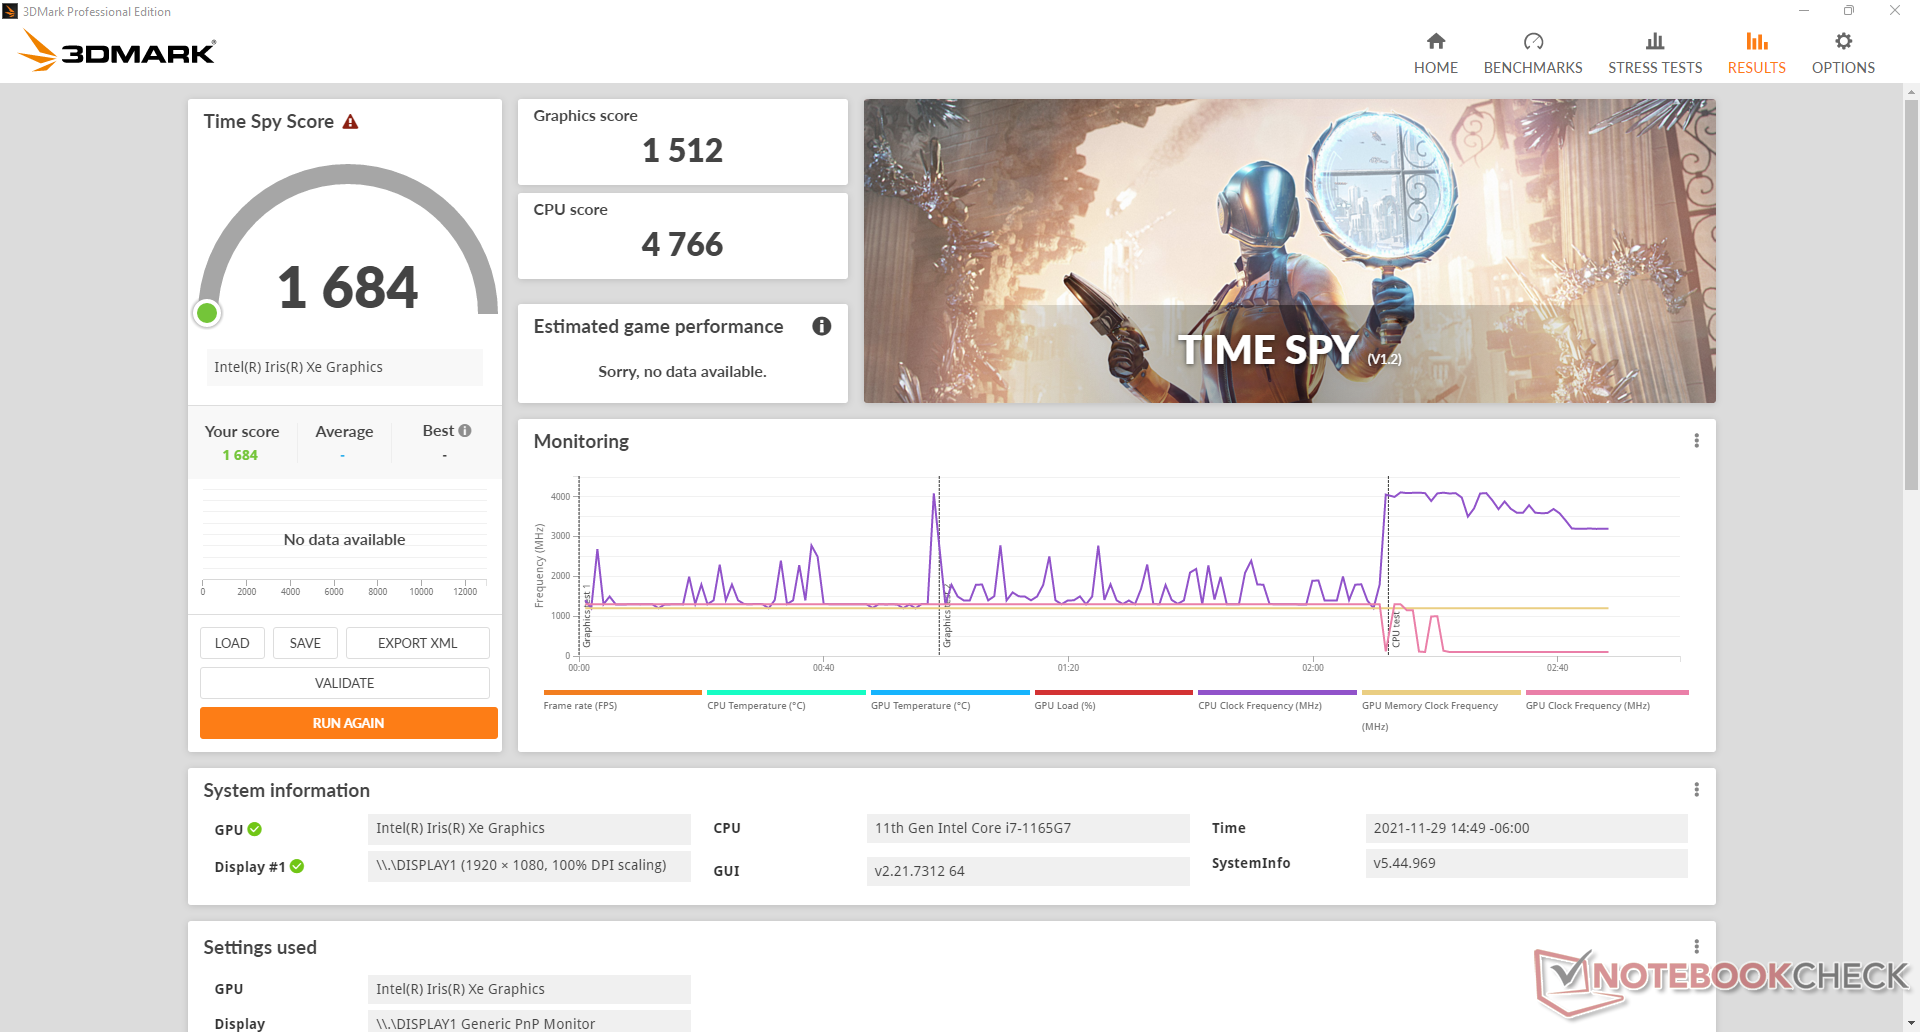
| 3DMark Time Spy Score | 1684 points | |
Help | ||
| Far Cry 5 | |
| 1280x720 Low Preset AA:T | |
| Acer Enduro Urban N3 EUN314 | |
| Average Intel Iris Xe Graphics G7 96EUs (23 - 75, n=93) | |
| Dell Latitude 5420 Rugged-P85G | |
| Lenovo ThinkPad E14 G3-20Y7003SGE | |
| Dynabook Tecra A40-J-12E | |
| 1920x1080 Low Preset AA:T | |
| Average Intel Iris Xe Graphics G7 96EUs (15 - 48, n=41) | |
| Acer Enduro Urban N3 EUN314 | |
| Dynabook Tecra A40-J-12E | |
| 1920x1080 Medium Preset AA:T | |
| Average Intel Iris Xe Graphics G7 96EUs (14 - 39, n=91) | |
| Dell Latitude 5420 Rugged-P85G | |
| Acer Enduro Urban N3 EUN314 | |
| Lenovo ThinkPad E14 G3-20Y7003SGE | |
| Dynabook Tecra A40-J-12E | |
| 1920x1080 High Preset AA:T | |
| Average Intel Iris Xe Graphics G7 96EUs (10 - 35, n=89) | |
| Dell Latitude 5420 Rugged-P85G | |
| Acer Enduro Urban N3 EUN314 | |
| Lenovo ThinkPad E14 G3-20Y7003SGE | |
| Dynabook Tecra A40-J-12E | |
| 1920x1080 Ultra Preset AA:T | |
| Average Intel Iris Xe Graphics G7 96EUs (11 - 33, n=75) | |
| Acer Enduro Urban N3 EUN314 | |
| Dell Latitude 5420 Rugged-P85G | |
| Lenovo ThinkPad E14 G3-20Y7003SGE | |
| Dynabook Tecra A40-J-12E | |
Witcher 3 FPS Chart
| low | med. | high | ultra | |
|---|---|---|---|---|
| GTA V (2015) | 91.1 | 78.1 | 19.2 | 8.32 |
| The Witcher 3 (2015) | 89.5 | 57.3 | 29.2 | 13.4 |
| Dota 2 Reborn (2015) | 78.5 | 81.6 | 48.7 | 43.4 |
| Final Fantasy XV Benchmark (2018) | 39.9 | 22.1 | 15.9 | |
| X-Plane 11.11 (2018) | 22.1 | 41.4 | 36.5 | |
| Far Cry 5 (2018) | 49 | 22 | 21 | 20 |
| Strange Brigade (2018) | 82.9 | 34.1 | 28.2 | 22.7 |
排放
系统噪音
在桌面上没有运行应用程序的情况下,风扇噪音是无声的。然而,更多的时候,用户会浏览或播放视频,这将引起27.9 dB(A)的风扇噪音,而安静的背景为23.8 dB(A)。当坐在与笔记本保持正常距离时,音调和噪音都很低,容易被忽略。
像游戏这样的高负荷会引起高达39 dB(A)的风扇噪音。
我们的测试设备会表现出轻微的线圈呜呜声,幸好只有在把耳朵放在键盘按键附近时才能注意到。
Noise level
| Idle |
| 24.1 / 24.1 / 24.1 dB(A) |
| Load |
| 27.9 / 38.6 dB(A) |
 | ||
30 dB silent 40 dB(A) audible 50 dB(A) loud |
||
min: | ||
| Acer Enduro Urban N3 EUN314 Iris Xe G7 96EUs, i7-1165G7, Samsung PM991 MZVLQ1T0HALB | Dell Latitude 5420 Rugged-P85G Radeon RX 540, i7-8650U, SK hynix PC401 NVMe 500 GB | Panasonic Toughbook FZ-55 MK2 Iris Xe G7 96EUs, i7-1185G7, Toshiba KIOXIA KBG4AZNV512G M.2 2280 OPAL | Durabook S14I Iris Xe G7 96EUs, i7-1165G7, UDinfo M2P M2P80DE512GBAEP | Getac S410 UHD Graphics 620, i5-8550U, CUKUSA 1 TB SATA SSD Q0526A | |
|---|---|---|---|---|---|
| Noise | -13% | -1% | -13% | -11% | |
| off / environment * (dB) | 23.8 | 28.3 -19% | 23.8 -0% | 25.2 -6% | 28.4 -19% |
| Idle Minimum * (dB) | 24.1 | 28.3 -17% | 24 -0% | 25.2 -5% | 28.4 -18% |
| Idle Average * (dB) | 24.1 | 28.3 -17% | 24 -0% | 25.2 -5% | 28.4 -18% |
| Idle Maximum * (dB) | 24.1 | 28.3 -17% | 24 -0% | 34.5 -43% | 28.4 -18% |
| Load Average * (dB) | 27.9 | 29.9 -7% | 26.7 4% | 34.5 -24% | 30.3 -9% |
| Witcher 3 ultra * (dB) | 35.7 | ||||
| Load Maximum * (dB) | 38.6 | 38 2% | 41.7 -8% | 36.2 6% | 33.3 14% |
* ... smaller is better
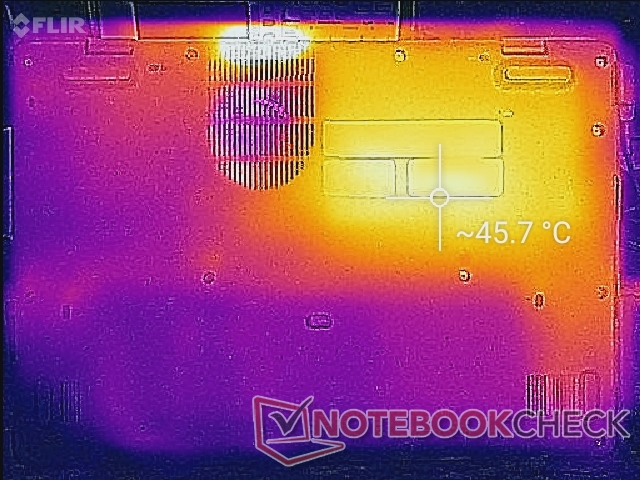
温度
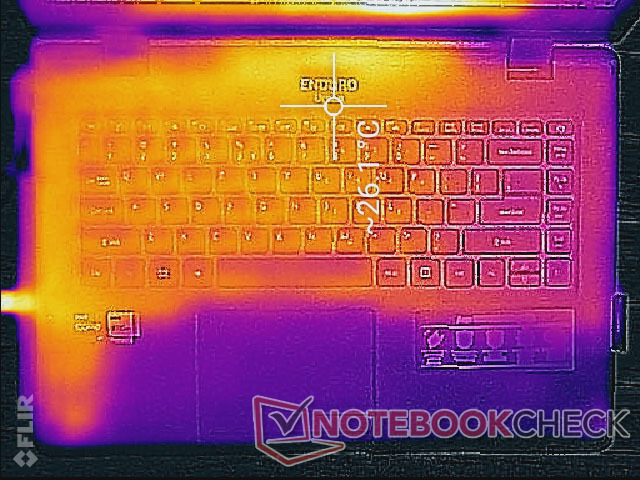
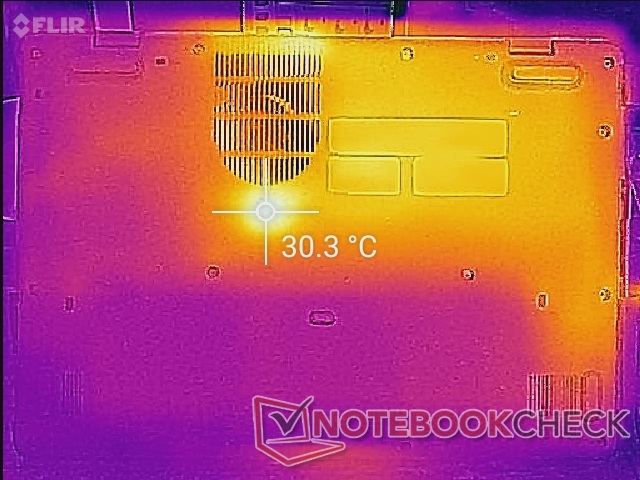
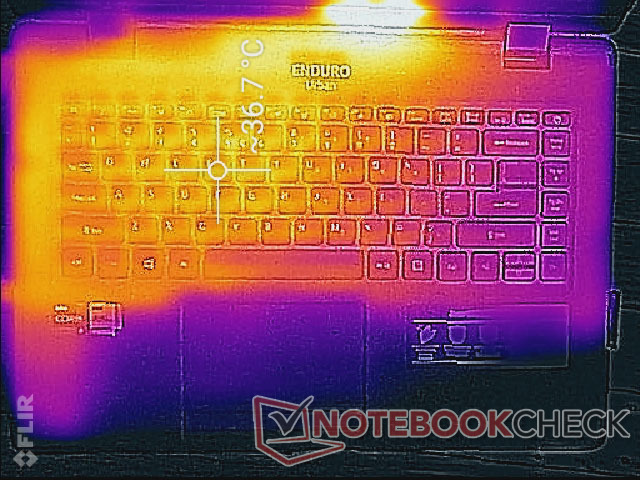
由于冷却解决方案的设计方式,笔记本电脑左半边的表面温度比右半边高。顶部和底部的热点可分别达到37摄氏度和46摄氏度,而更厚的Durabook S14I在类似条件下,两侧的最高温度为39摄氏度。
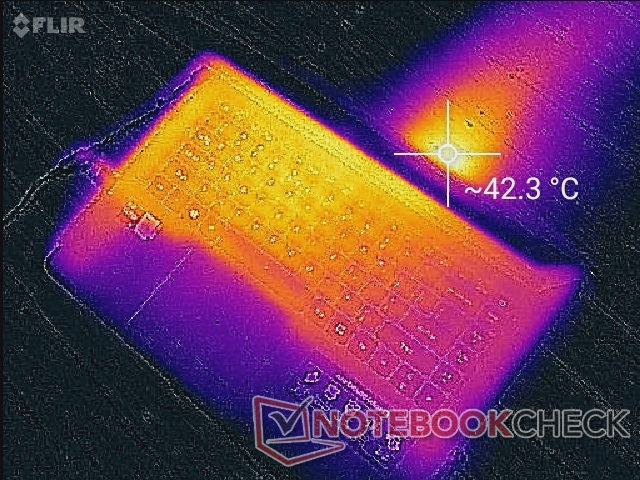
(+) The maximum temperature on the upper side is 37.8 °C / 100 F, compared to the average of 34.3 °C / 94 F, ranging from 21.2 to 62.5 °C for the class Office.
(-) The bottom heats up to a maximum of 45.8 °C / 114 F, compared to the average of 36.8 °C / 98 F
(+) In idle usage, the average temperature for the upper side is 24.7 °C / 76 F, compared to the device average of 29.5 °C / 85 F.
(+) The palmrests and touchpad are cooler than skin temperature with a maximum of 28.6 °C / 83.5 F and are therefore cool to the touch.
(±) The average temperature of the palmrest area of similar devices was 27.5 °C / 81.5 F (-1.1 °C / -2 F).
| Acer Enduro Urban N3 EUN314 Intel Core i7-1165G7, Intel Iris Xe Graphics G7 96EUs | Dell Latitude 5420 Rugged-P85G Intel Core i7-8650U, AMD Radeon RX 540 | Panasonic Toughbook FZ-55 MK2 Intel Core i7-1185G7, Intel Iris Xe Graphics G7 96EUs | Durabook S14I Intel Core i7-1165G7, Intel Iris Xe Graphics G7 96EUs | Getac S410 Intel Core i7-8550U, Intel UHD Graphics 620 | |
|---|---|---|---|---|---|
| Heat | -7% | -5% | -4% | -13% | |
| Maximum Upper Side * (°C) | 37.8 | 42.2 -12% | 36.2 4% | 36.4 4% | 42.6 -13% |
| Maximum Bottom * (°C) | 45.8 | 42 8% | 42.2 8% | 38.6 16% | 49 -7% |
| Idle Upper Side * (°C) | 26.4 | 31.6 -20% | 31 -17% | 32.6 -23% | 30.8 -17% |
| Idle Bottom * (°C) | 30.2 | 31.8 -5% | 34 -13% | 33.8 -12% | 34.4 -14% |
* ... smaller is better
压力测试
当运行Prime95对CPU施加压力时,时钟频率在最初的一两秒钟内会提升到3.7GHz,然后下降到2.9GHz,最后降到2.7GHz。核心温度和CPU封装功率将分别稳定在82℃和28W。Durabook S14I将在1.8至1.9 GHz范围内的较慢时钟速率下稳定下来,但也会在63 C的较低核心温度下稳定下来。
用电池运行会限制性能。在电池电源上进行的3DMark 11测试将分别返回物理和图形分数10264和5615分,而在主电源上则为11806和6728分。
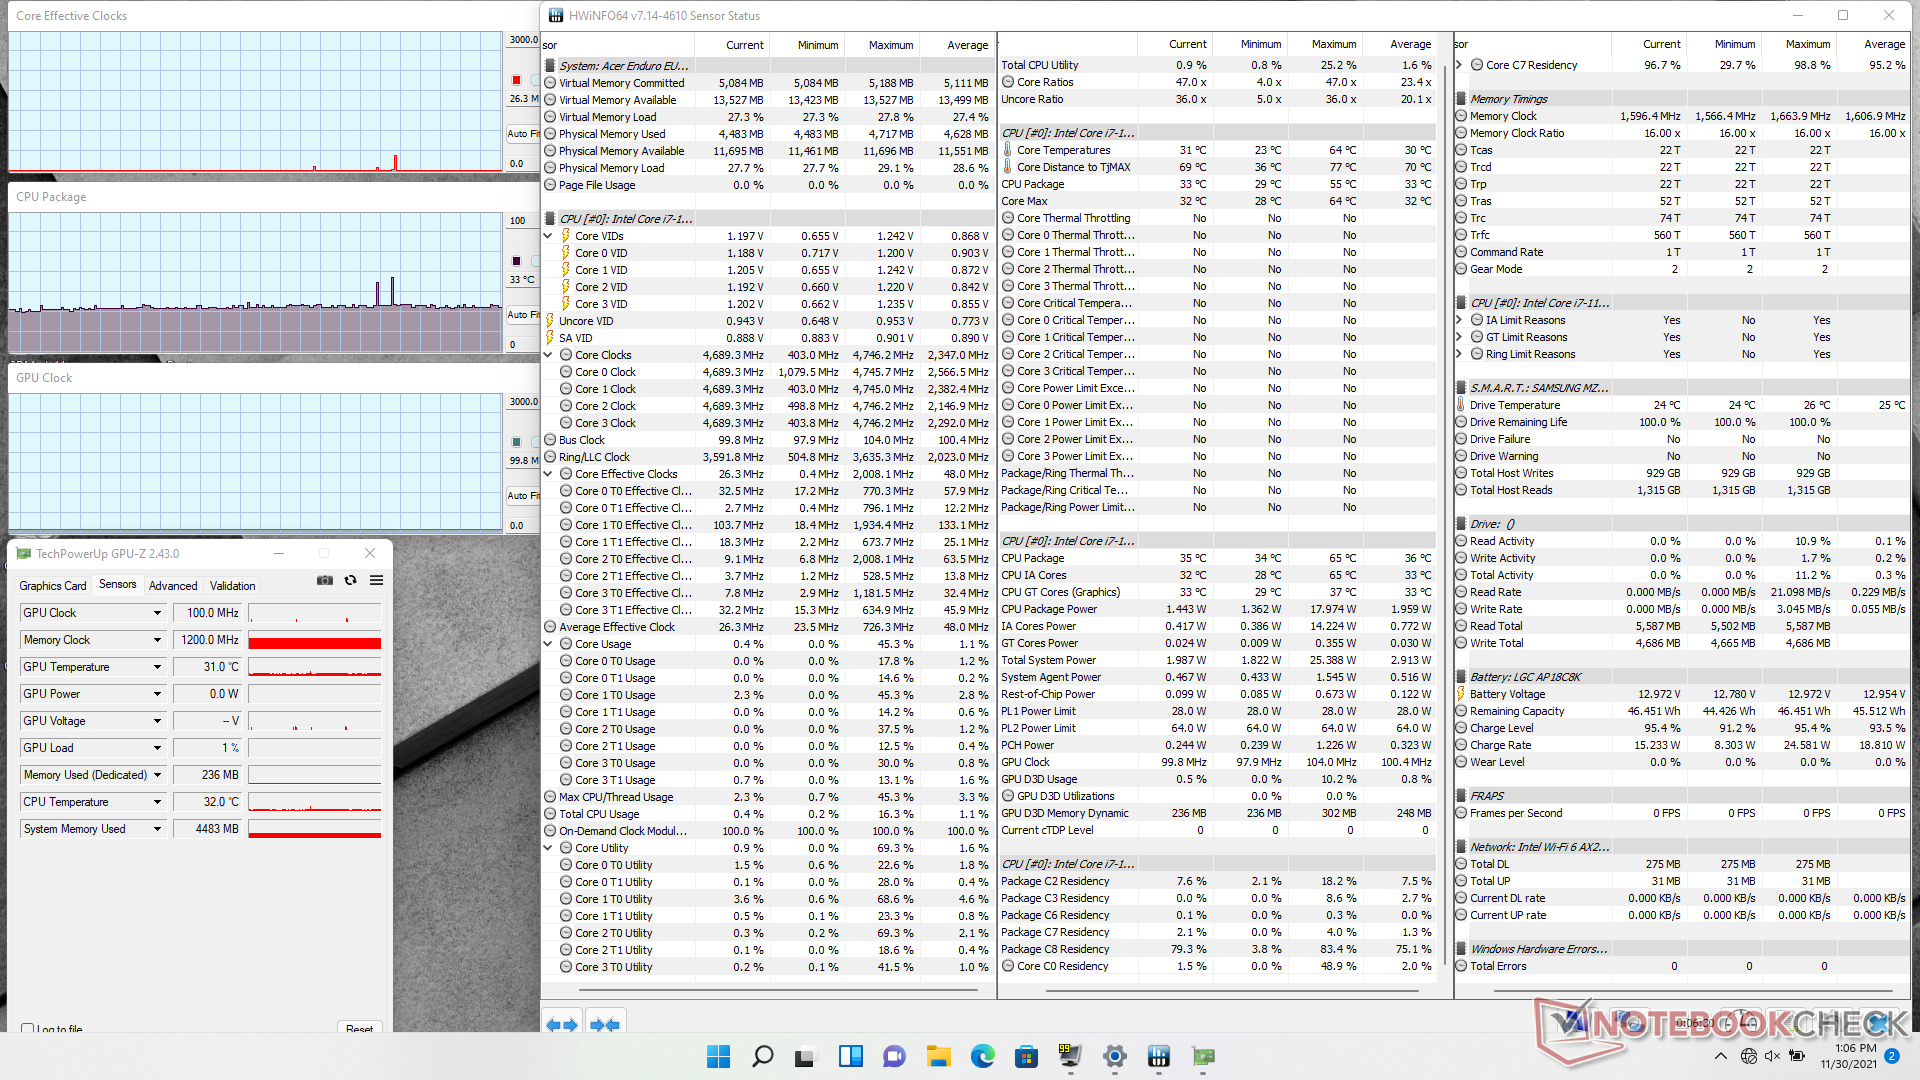
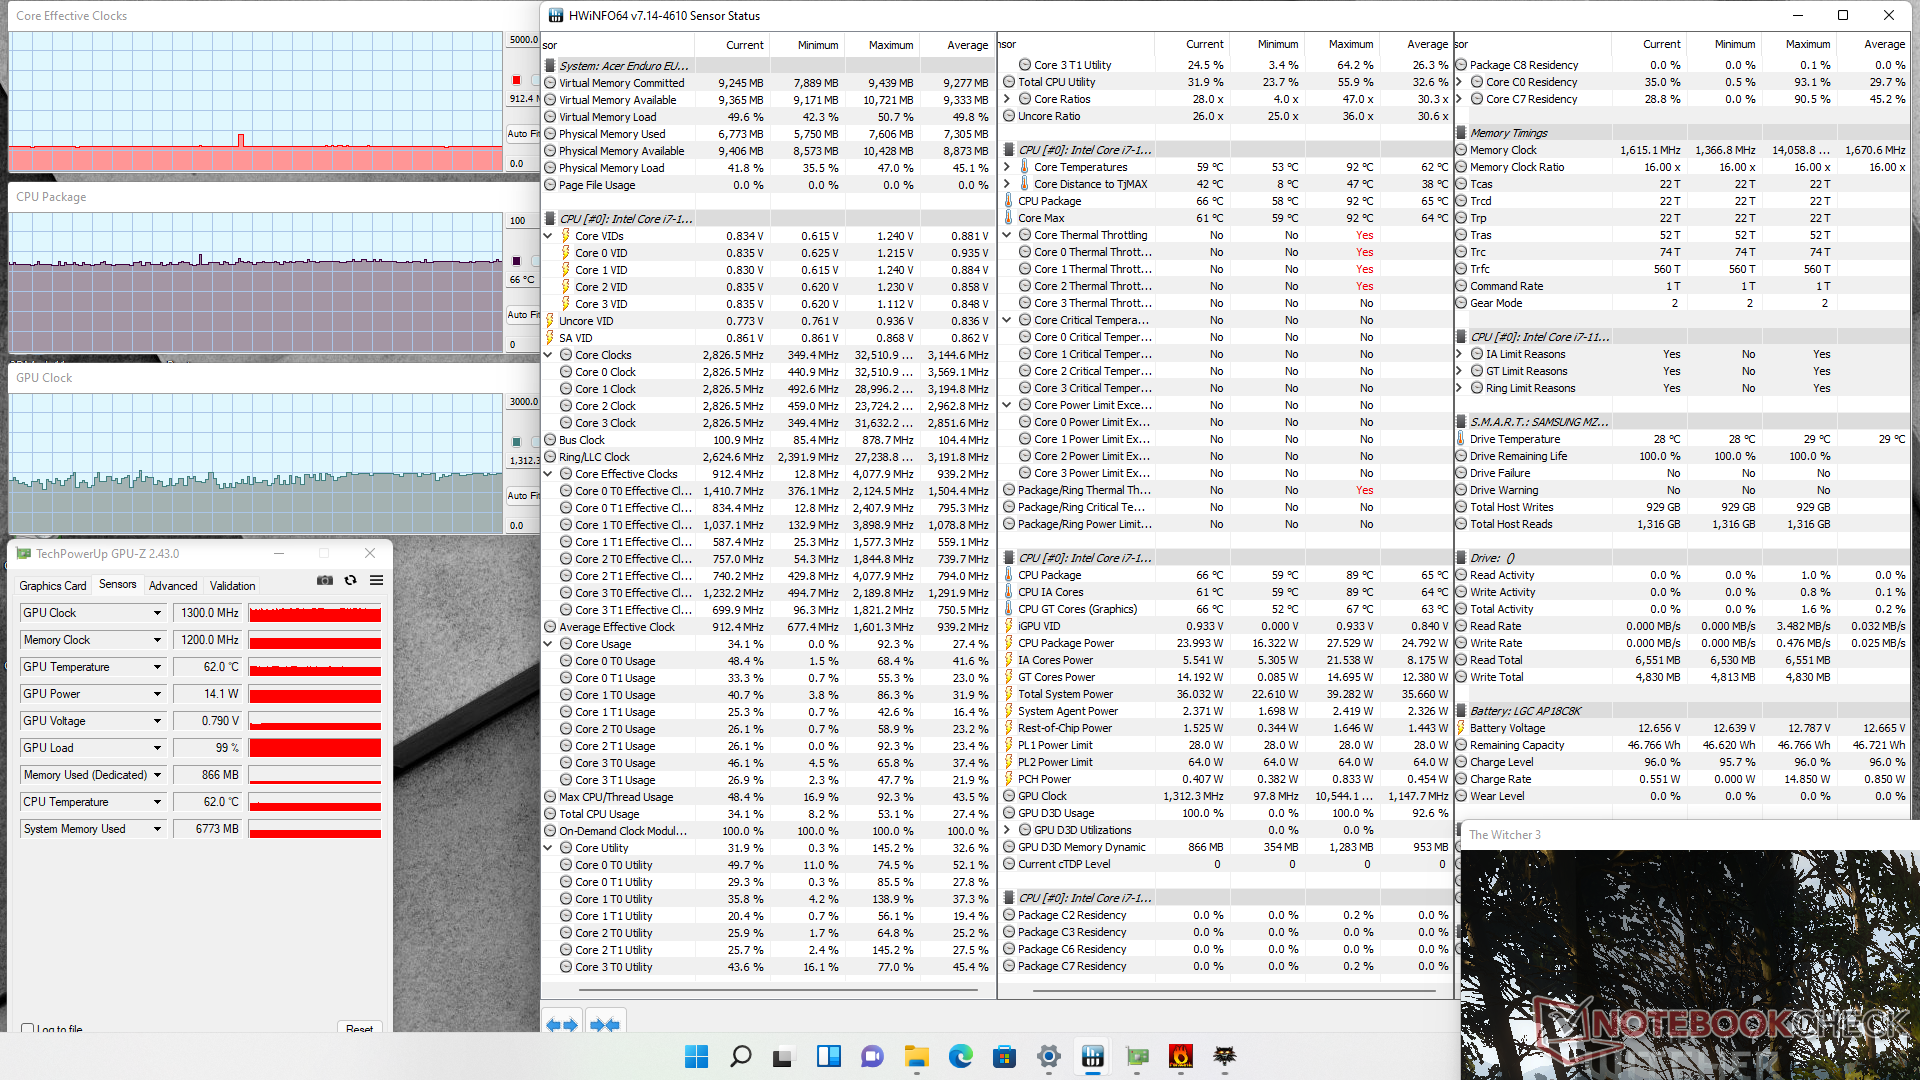
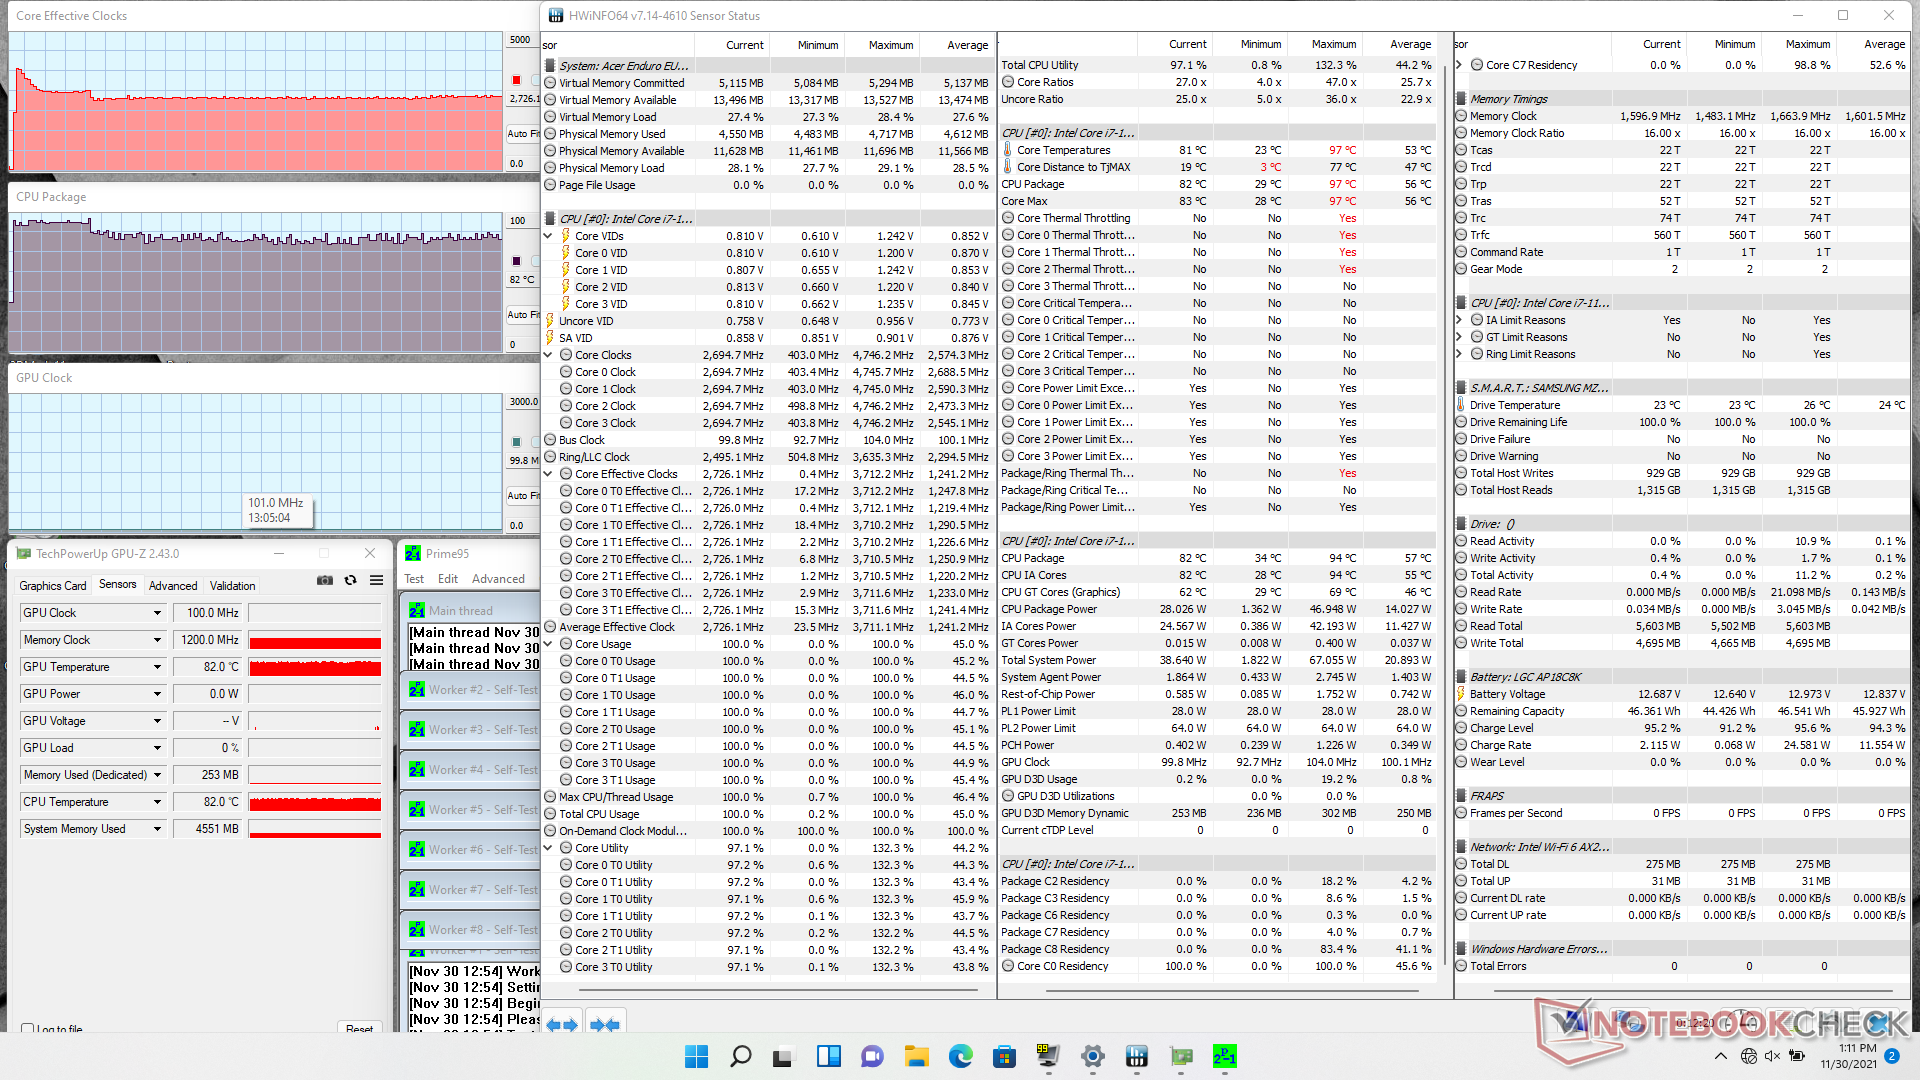
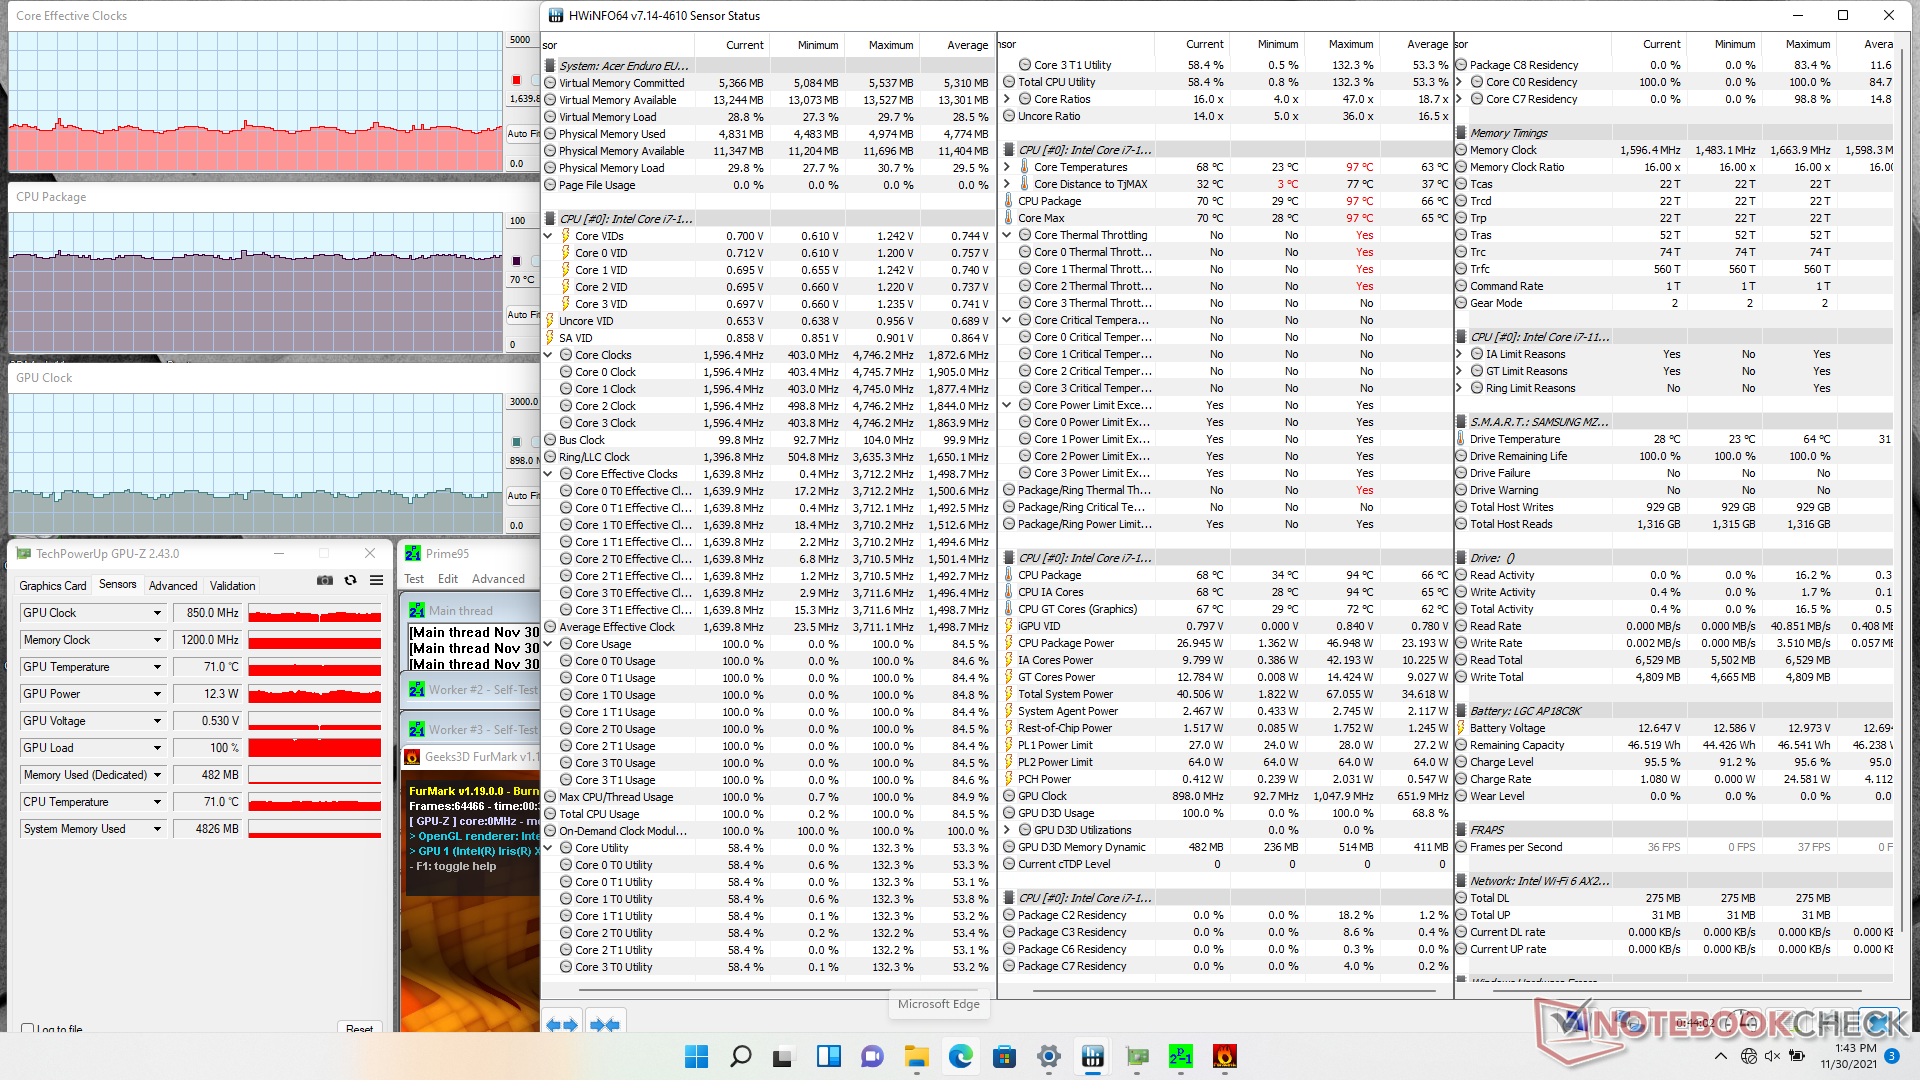
| CPU时钟(GHz) | GPU时钟(MHz) | CPU平均温度(℃) | |
| 系统空闲 | -- | -- | 33 |
| Prime95压力 | 2.7 | -- | 82 |
| Prime95 + FurMark压力 | 1.4 - 1.6 | 800 - 950 | 66 - 71 |
| Witcher 3 Stress | 0.9 | ~1300 | 66 |
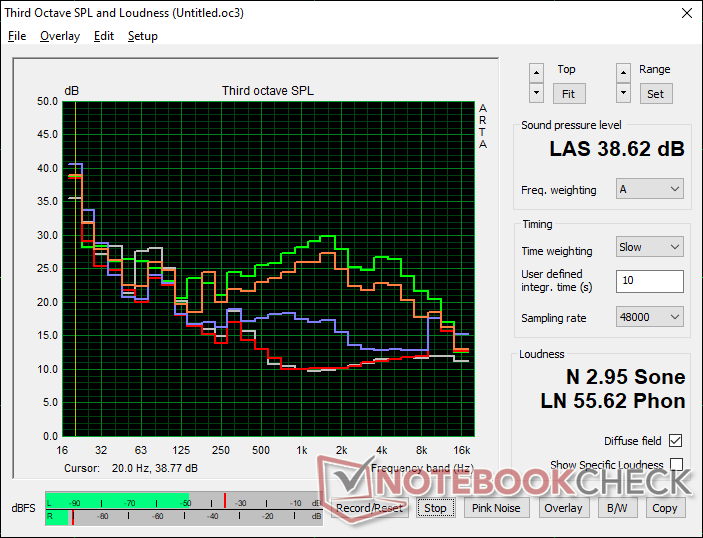
发言人
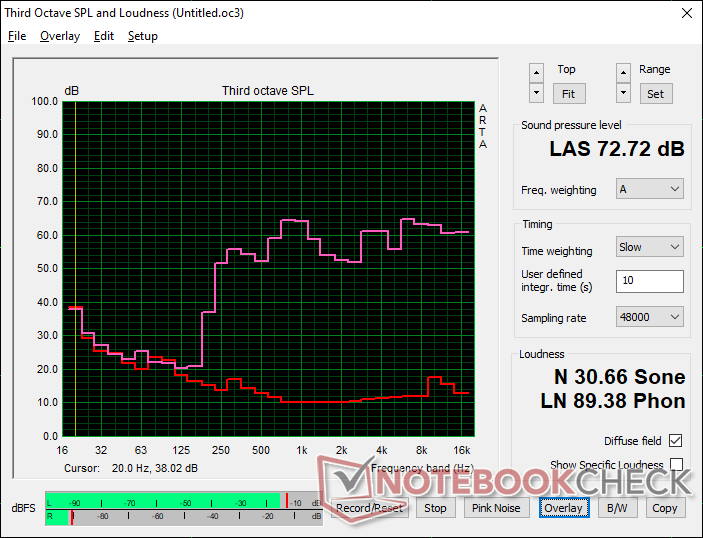
Acer Enduro Urban N3 EUN314 audio analysis
(±) | speaker loudness is average but good (72.7 dB)
Bass 100 - 315 Hz
(-) | nearly no bass - on average 21.2% lower than median
(±) | linearity of bass is average (14.2% delta to prev. frequency)
Mids 400 - 2000 Hz
(+) | balanced mids - only 4.2% away from median
(±) | linearity of mids is average (7.9% delta to prev. frequency)
Highs 2 - 16 kHz
(±) | higher highs - on average 5.5% higher than median
(±) | linearity of highs is average (8.6% delta to prev. frequency)
Overall 100 - 16.000 Hz
(±) | linearity of overall sound is average (23% difference to median)
Compared to same class
» 64% of all tested devices in this class were better, 7% similar, 29% worse
» The best had a delta of 7%, average was 21%, worst was 53%
Compared to all devices tested
» 69% of all tested devices were better, 5% similar, 26% worse
» The best had a delta of 4%, average was 23%, worst was 134%
Apple MacBook 12 (Early 2016) 1.1 GHz audio analysis
(+) | speakers can play relatively loud (83.6 dB)
Bass 100 - 315 Hz
(±) | reduced bass - on average 11.3% lower than median
(±) | linearity of bass is average (14.2% delta to prev. frequency)
Mids 400 - 2000 Hz
(+) | balanced mids - only 2.4% away from median
(+) | mids are linear (5.5% delta to prev. frequency)
Highs 2 - 16 kHz
(+) | balanced highs - only 2% away from median
(+) | highs are linear (4.5% delta to prev. frequency)
Overall 100 - 16.000 Hz
(+) | overall sound is linear (10.2% difference to median)
Compared to same class
» 7% of all tested devices in this class were better, 2% similar, 90% worse
» The best had a delta of 5%, average was 18%, worst was 53%
Compared to all devices tested
» 5% of all tested devices were better, 1% similar, 94% worse
» The best had a delta of 4%, average was 23%, worst was 134%
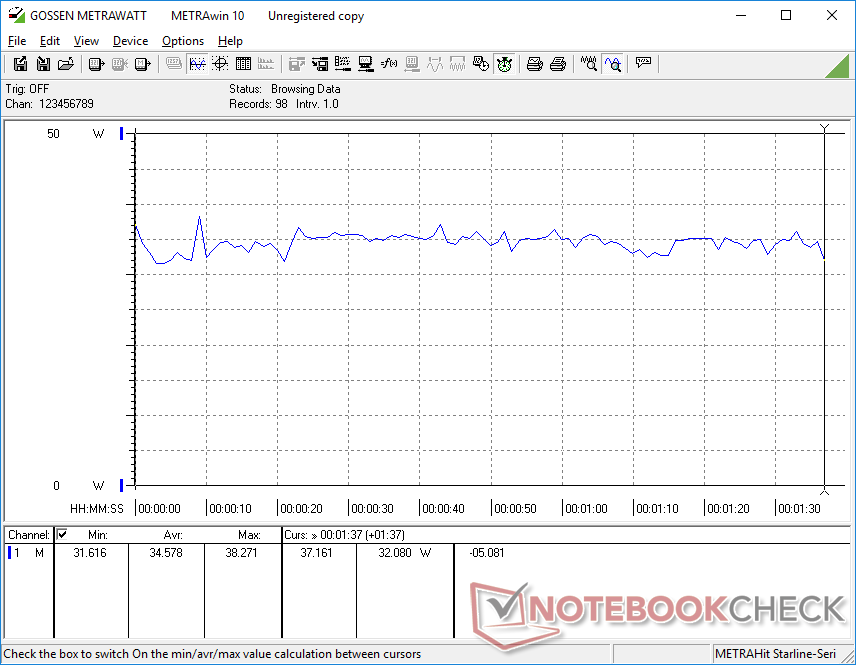
能源管理
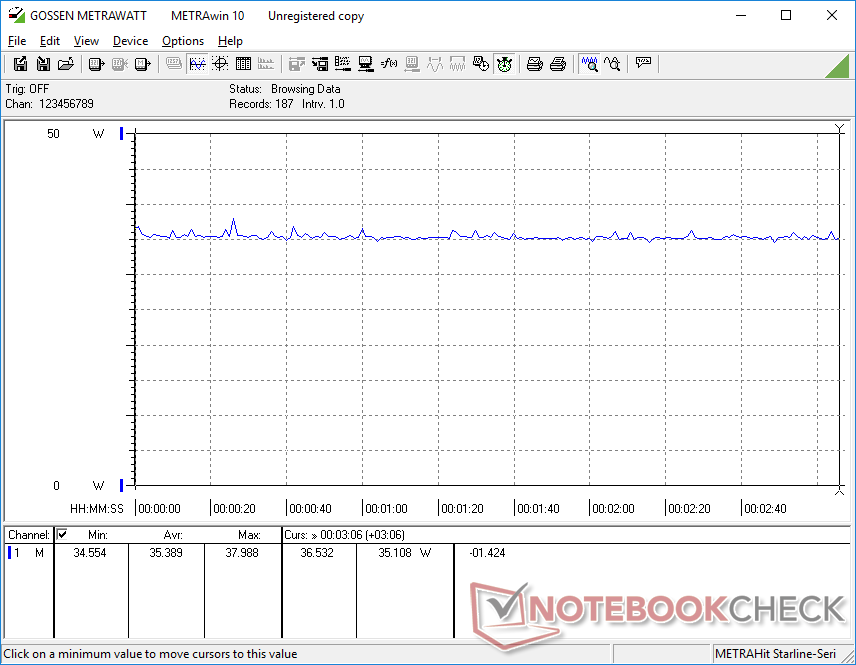
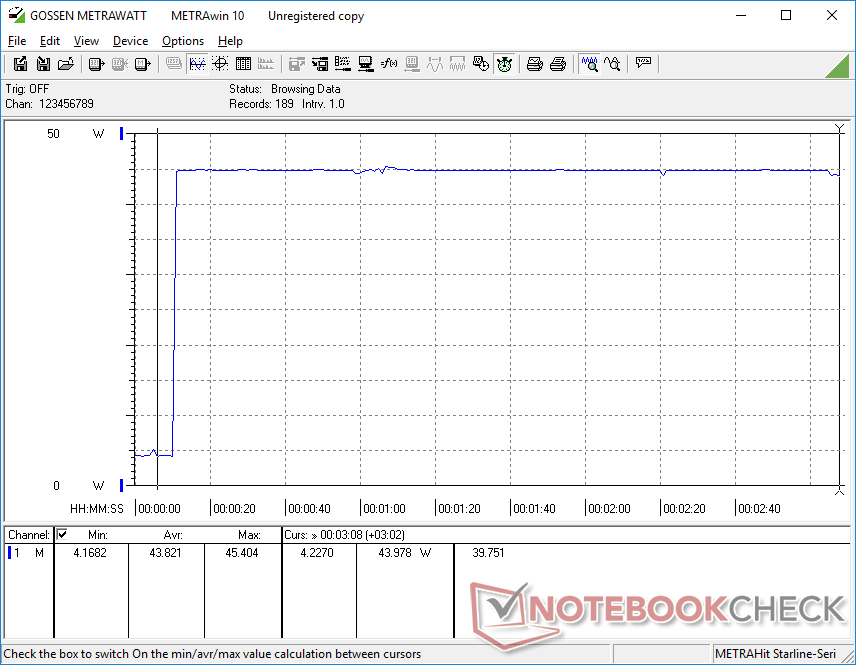
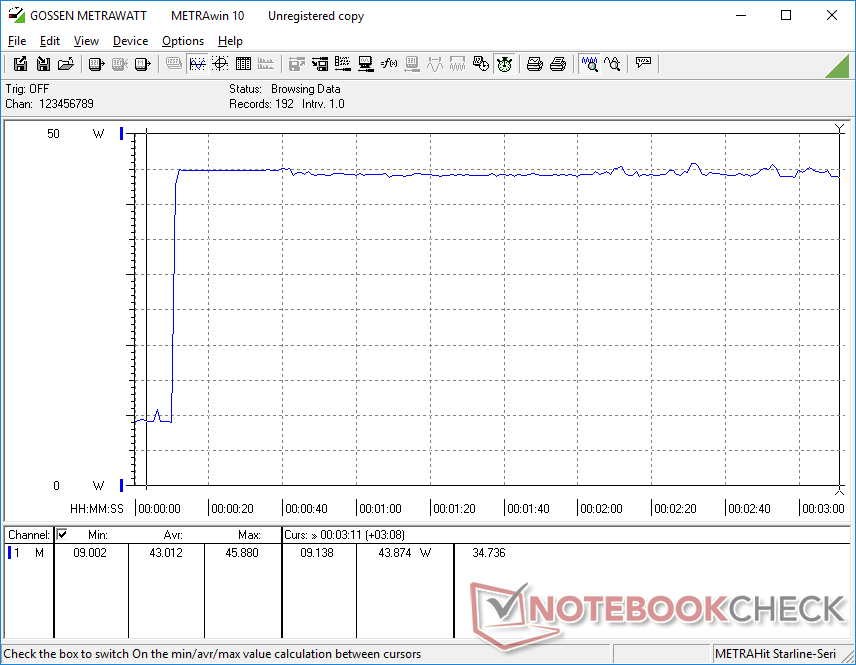
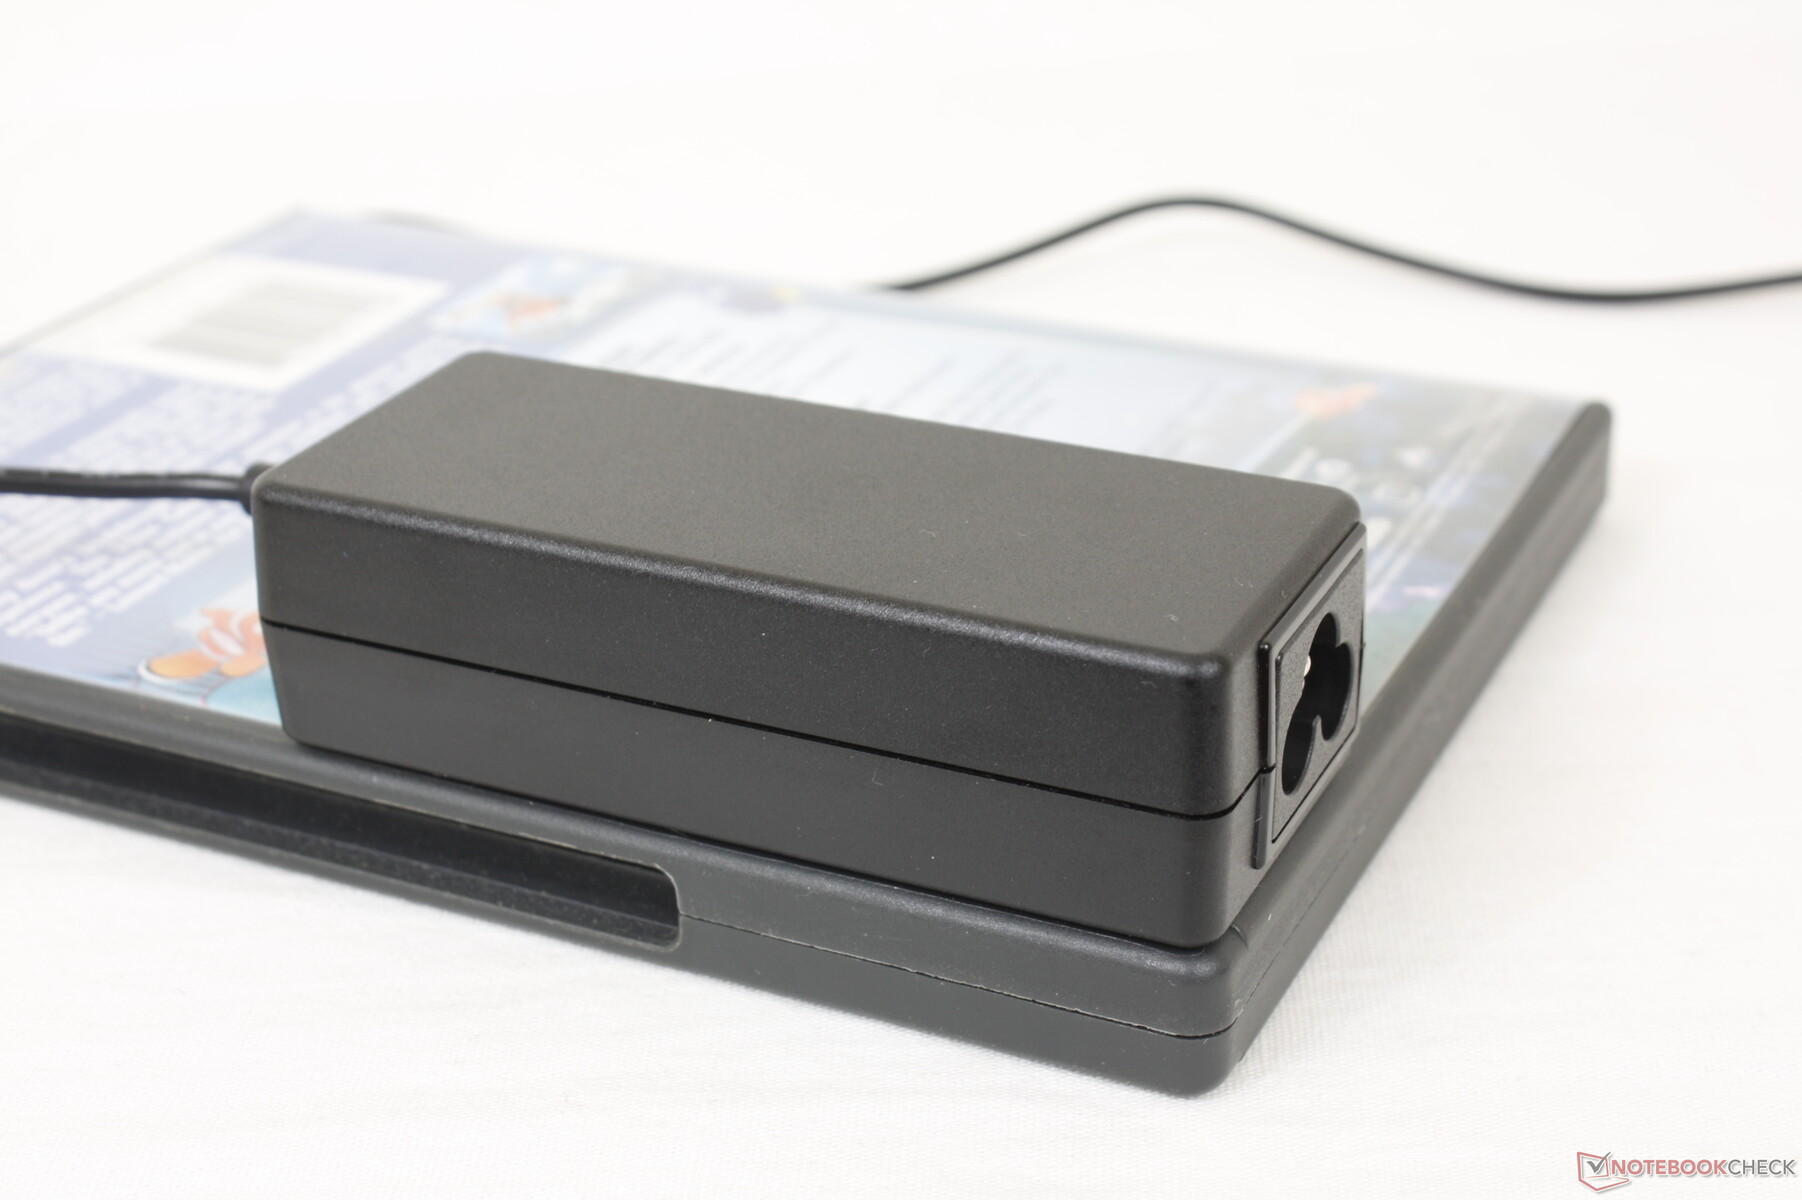
消耗功率
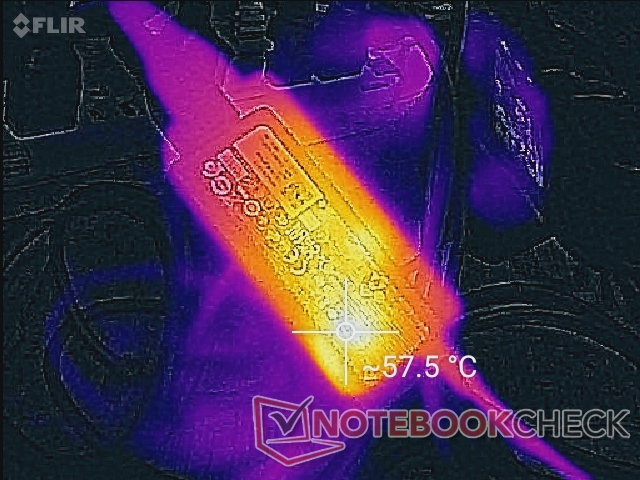
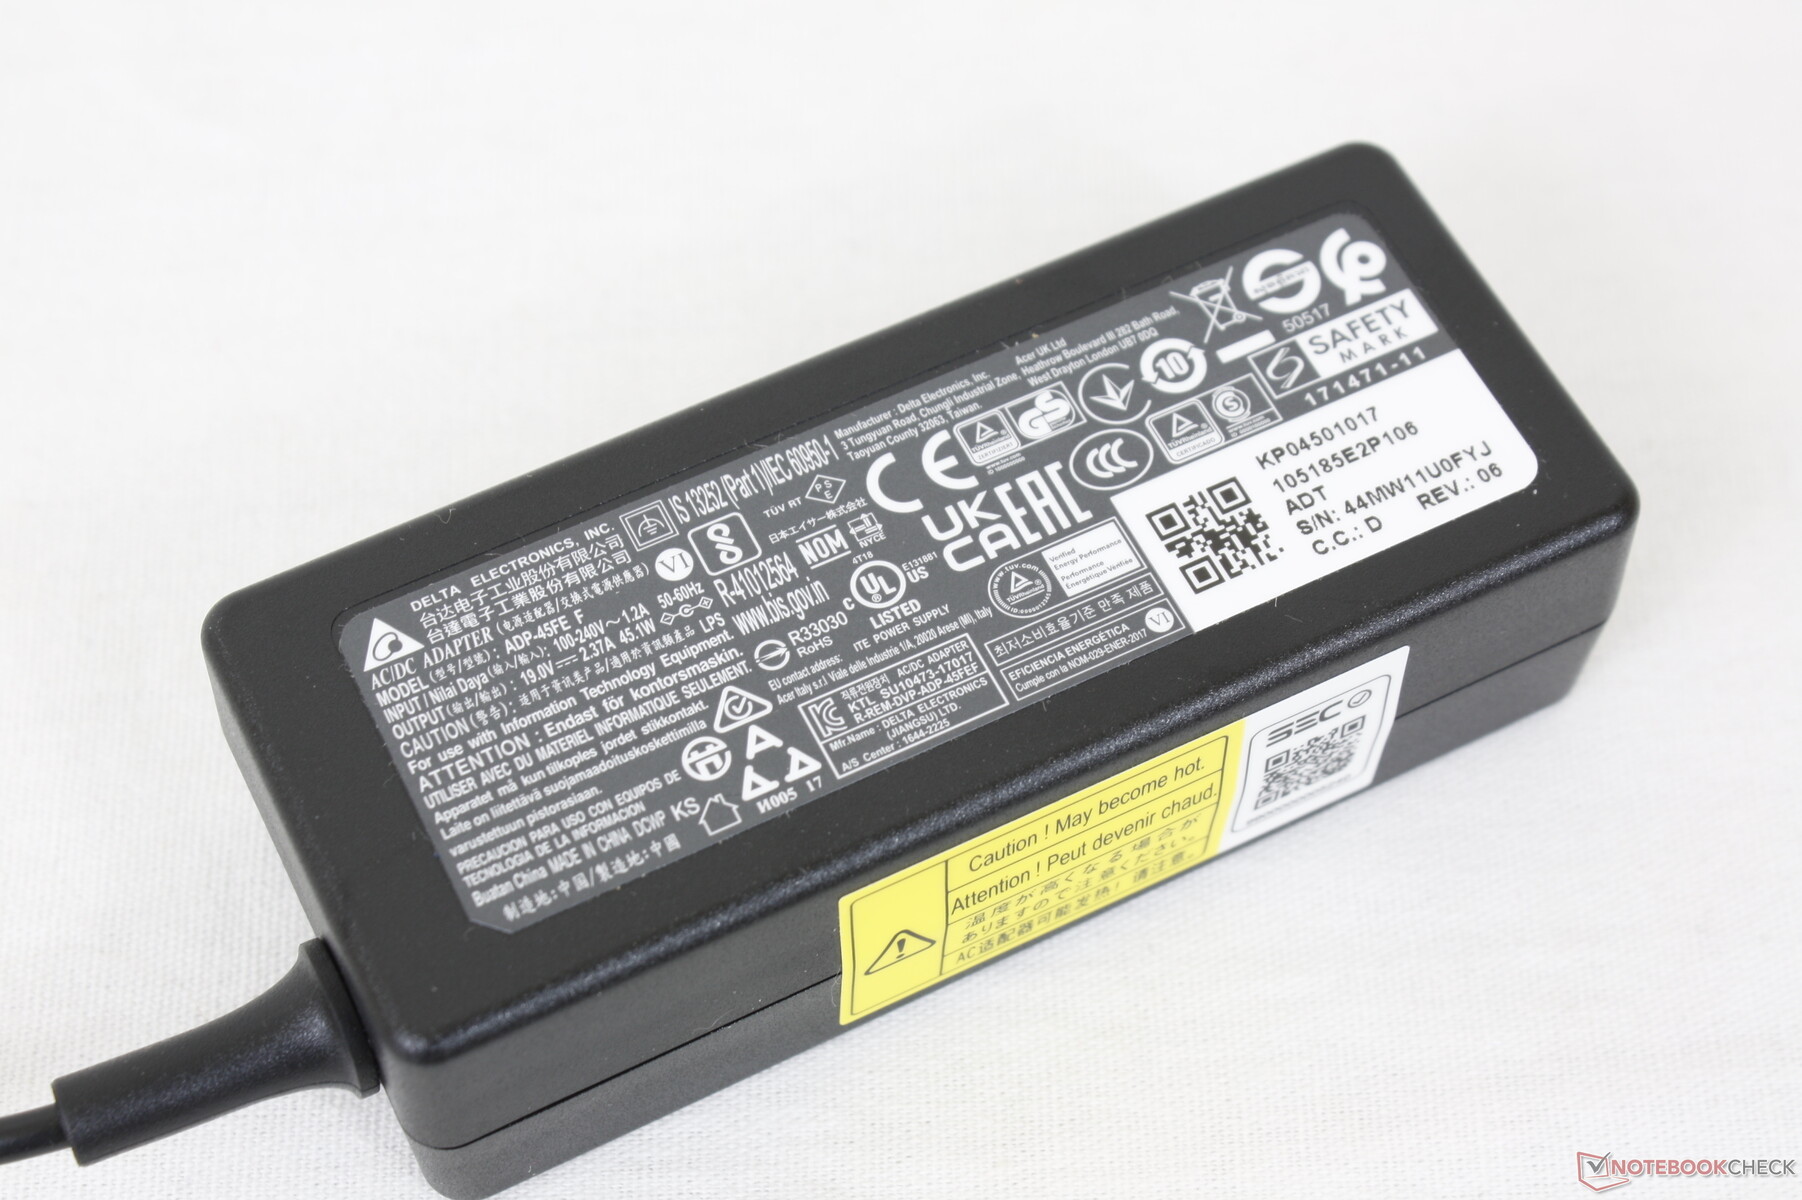
Acer比Durabook S14I在相同的Core i7处理器上运行时更省电,可能是因为Durabook的显示屏比Acer的显示屏亮2倍以上。在运行极端负载时,我们能够从小型(约9.3 x 3.8 x 2.7厘米)的45瓦交流适配器中记录到最大的耗电量为45.4瓦。因此,如果处理器受到压力,宏碁的充电速度会明显减慢。
| Off / Standby | |
| Idle | |
| Load |
|
Key:
min: | |
| Acer Enduro Urban N3 EUN314 i7-1165G7, Iris Xe G7 96EUs, Samsung PM991 MZVLQ1T0HALB, IPS, 1920x1080, 14" | Dell Latitude 5420 Rugged-P85G i7-8650U, Radeon RX 540, SK hynix PC401 NVMe 500 GB, IPS, 1920x1080, 14" | Panasonic Toughbook FZ-55 MK2 i7-1185G7, Iris Xe G7 96EUs, Toshiba KIOXIA KBG4AZNV512G M.2 2280 OPAL, IPS, 1920x1080, 14" | Durabook S14I i7-1165G7, Iris Xe G7 96EUs, UDinfo M2P M2P80DE512GBAEP, TN, 1920x1080, 14" | Getac S410 i5-8550U, UHD Graphics 620, CUKUSA 1 TB SATA SSD Q0526A, TN PED, 1366x768, 14" | |
|---|---|---|---|---|---|
| Power Consumption | -75% | -36% | -70% | -3% | |
| Idle Minimum * (Watt) | 3.8 | 4.8 -26% | 3.5 8% | 6.8 -79% | 5.6 -47% |
| Idle Average * (Watt) | 8 | 13.6 -70% | 10.4 -30% | 16.4 -105% | 7.9 1% |
| Idle Maximum * (Watt) | 8.7 | 13.8 -59% | 10.5 -21% | 16.9 -94% | 8.4 3% |
| Load Average * (Watt) | 34.6 | 67.8 -96% | 45.4 -31% | 39.2 -13% | 32.8 5% |
| Witcher 3 ultra * (Watt) | 35.4 | 69.1 -95% | 43 -21% | ||
| Load Maximum * (Watt) | 45.4 | 93.5 -106% | 99.3 -119% | 73.1 -61% | 34.3 24% |
* ... smaller is better
Power Consumption Witcher 3 / Stresstest
Power Consumption external Monitor
电池寿命
我们能够在充满电和150 nit显示亮度的情况下记录到将近6.5小时的实际WLAN运行时间。将系统从满电到空电大约需要100分钟。用户也可以用通用的USB-C交流适配器为系统充电。
| Acer Enduro Urban N3 EUN314 i7-1165G7, Iris Xe G7 96EUs, 50.3 Wh | Dell Latitude 5420 Rugged-P85G i7-8650U, Radeon RX 540, 102 Wh | Panasonic Toughbook FZ-55 MK2 i7-1185G7, Iris Xe G7 96EUs, 71 Wh | Durabook S14I i7-1165G7, Iris Xe G7 96EUs, 50 Wh | Getac S410 i5-8550U, UHD Graphics 620, 46.6 Wh | |
|---|---|---|---|---|---|
| Battery runtime | 153% | 113% | -14% | -19% | |
| WiFi v1.3 (h) | 6.4 | 16.2 153% | 13.6 113% | 5.5 -14% | 5.2 -19% |
| Reader / Idle (h) | 31.4 | ||||
| Load (h) | 3.2 |
Pros
Cons
判决书
Enduro Urban N3是一款14英寸的笔记本电脑,感觉像15.6英寸的笔记本电脑。与传统的以消费者为中心的14英寸笔记本电脑相比,其额外的腰围和厚度,如华硕VivoBook或 Acer Swift 5 SF514使得Urban N3对外界环境的适应性更强,而成本却远远低于 "适当的 "坚固型或半坚固型笔记本电脑,如 坚固耐用的S14I或 松下Toughbook如果你发现自己在野外或岩石堆上使用笔记本电脑的次数比在整齐的办公桌上使用的次数多,那么Urban N3可能适合你。
Enduro Urban N3是一款经济实惠的耐用型笔记本电脑,在处理器性能和显示质量方面毫不吝啬。某些方面如电池寿命、音量和用于亮度控制的脉宽调制可以做得更好。
性能和显示是宏碁的明显亮点。然而,用户将不得不自己校准面板,以充分利用其相对较深的色彩。
许多方面仍然可以改进。例如,扬声器音量偏低,而铰链在更大的角度上可以更硬,以防止盖子向后掉。看到PWM令人失望,电池寿命可以更好,只有6.5小时。机箱内有未使用的容积,可以用来改善系统的功能。如果能有一个哑光的选择,以减少眩光,也是值得赞赏的。
Acer Enduro Urban N3 EUN314
- 12/03/2021 v7 (old)
Allen Ngo
Price comparison

