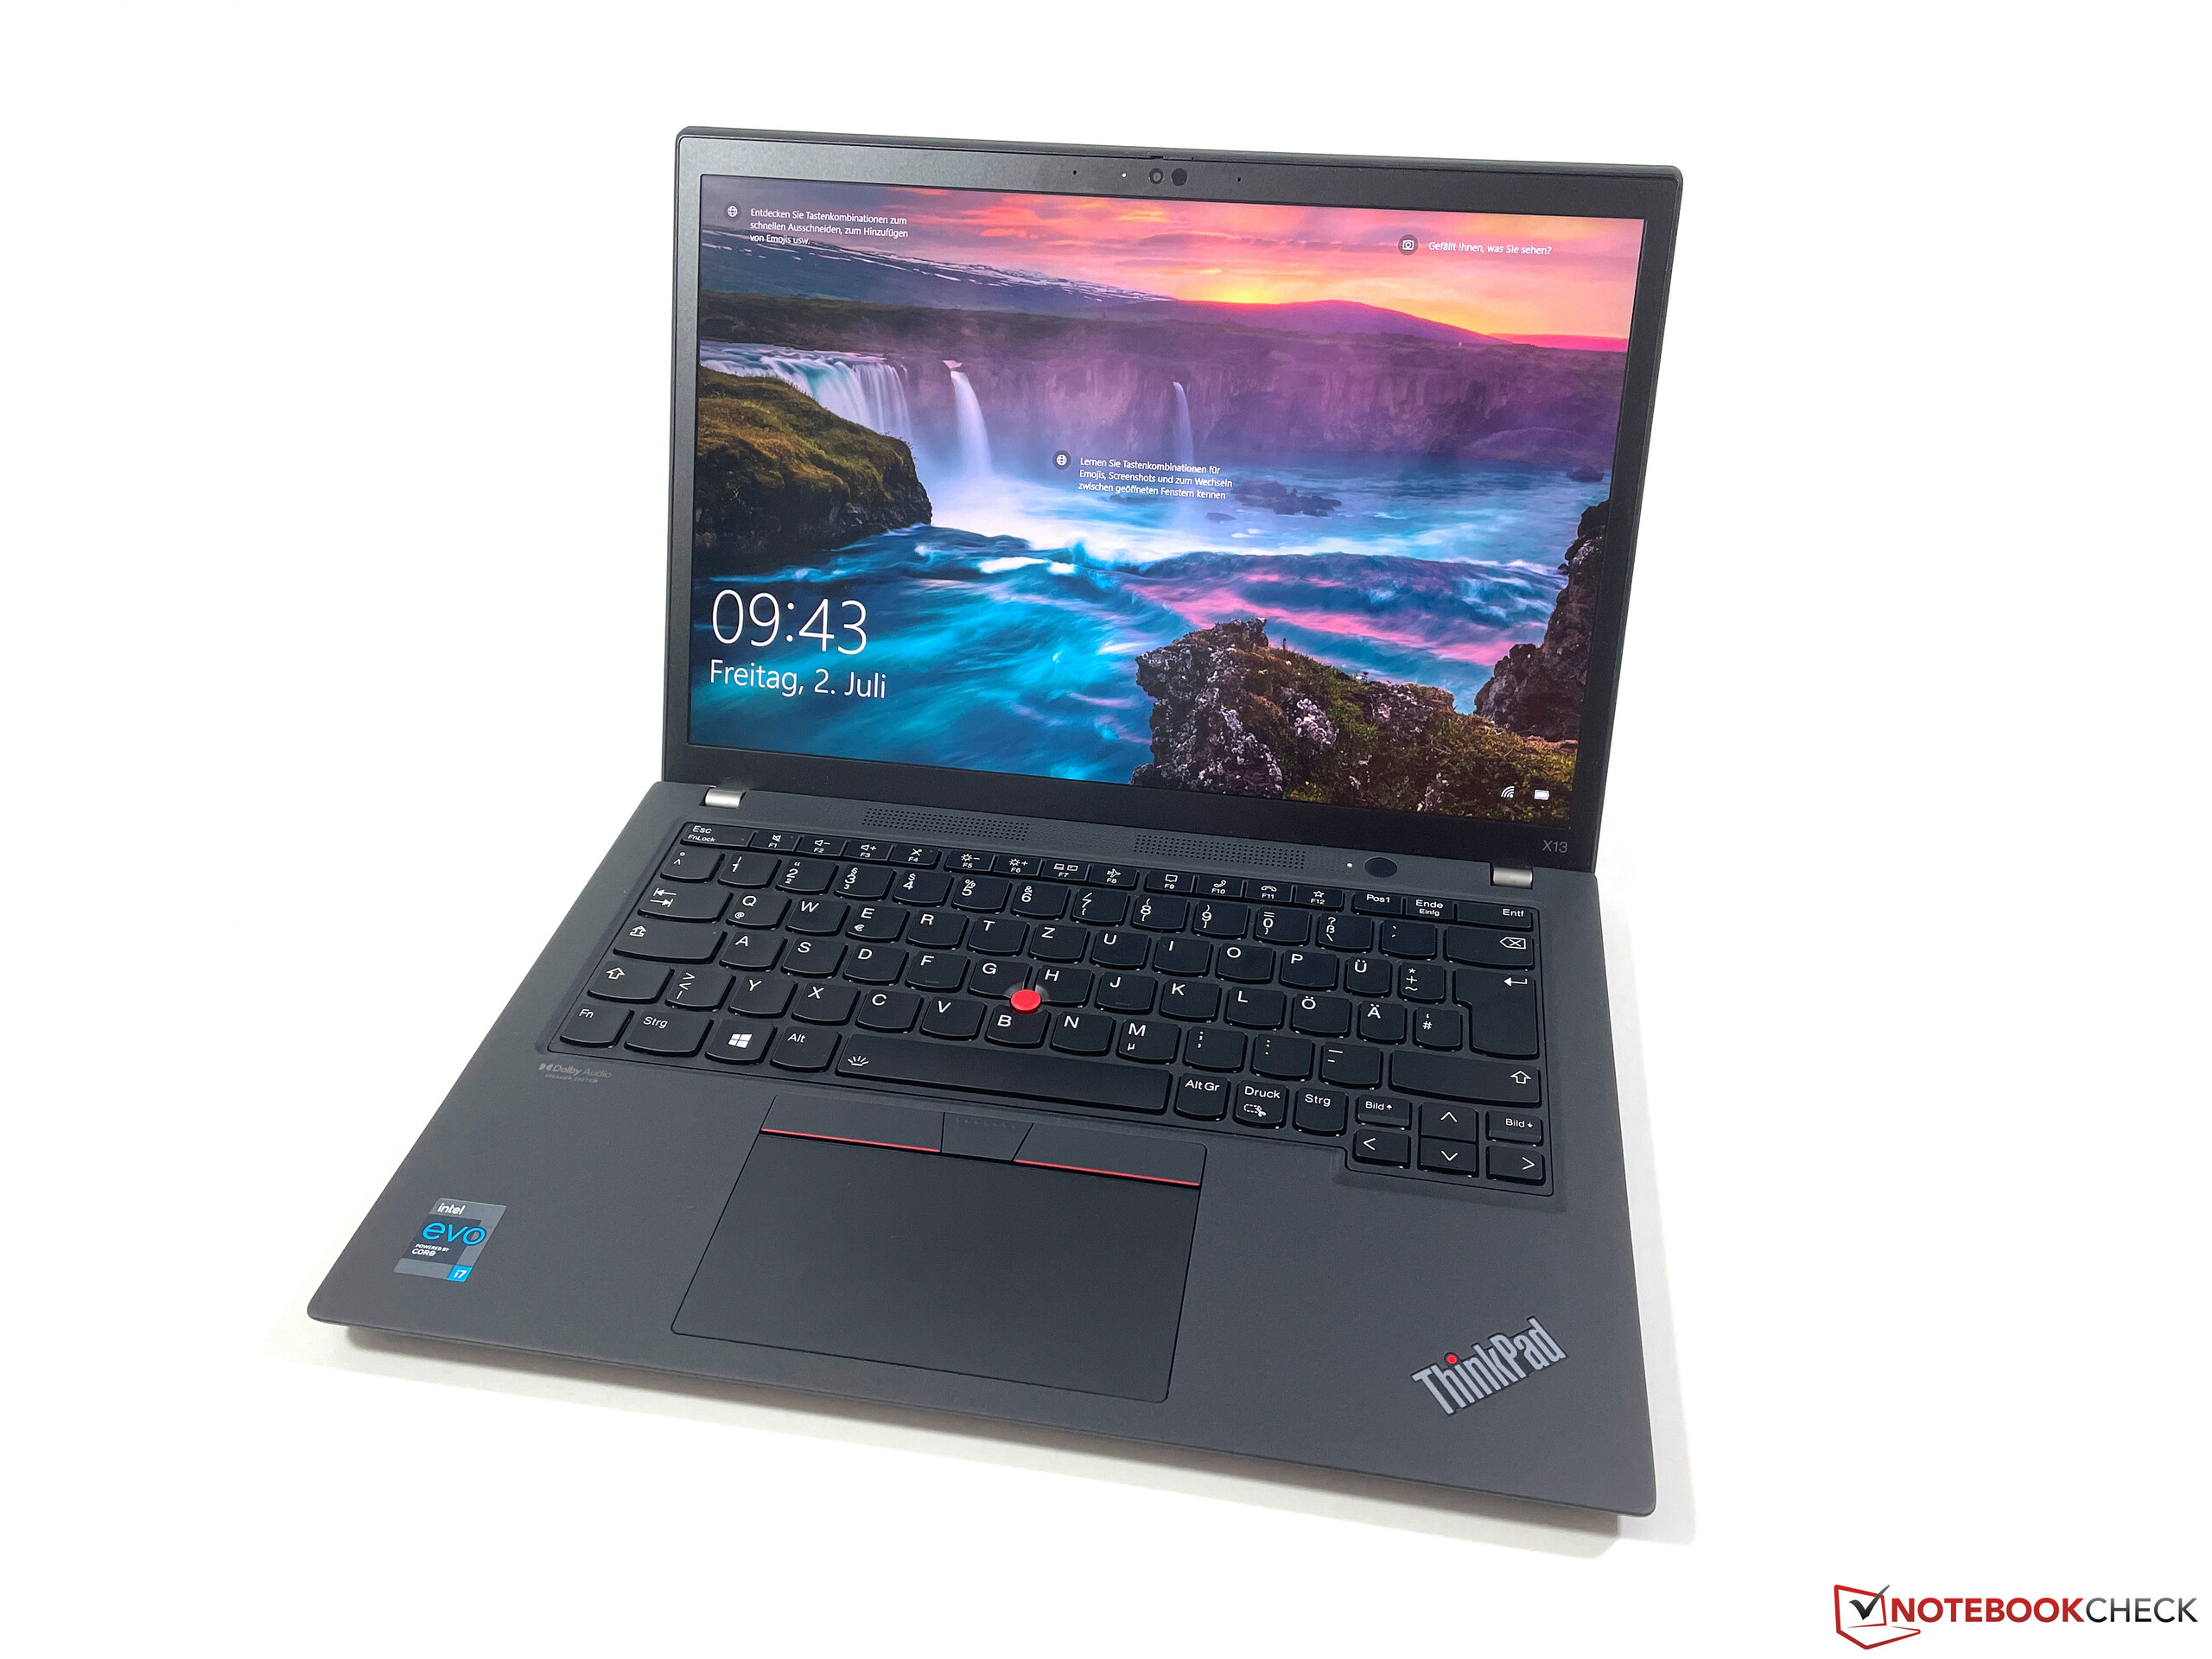
联想ThinkPad X13 G2评论。完美的移动伴侣?

去年的笔记本X13确实得到了一个新的名称,但它仍然是基于旧的笔记本X390.另一方面,第二代ThinkPad X13是一次重大更新,采用了新的机箱,更新了CPU,而且和ThinkPad X1型号一样,采用了新的16:10长宽比屏幕。
ThinkPad X13 G2再次提供了英特尔或AMD的CPU,但英特尔的型号是最先提供的。我们的测试装置的代号为20WK0024GE,普通客户的价格约为1900欧元,如果你有机会参加联想的教育计划,则约为1800欧元。配置包括一个现代的Tiger Lake i7处理器,16GB内存,512GB PCI-SSD存储,16:10面板,1920 x 1200像素,以及一个5G调制解调器。
我们还没有审查戴尔、富士通或惠普的所有直接商业对手,所以我们也将使用一些消费者型号作为本次审查的比较设备。
Possible Competitors
Rating | Date | Model | Weight | Height | Size | Resolution | Price |
|---|---|---|---|---|---|---|---|
| 89.3 % v7 (old) | 08 / 2021 | Lenovo ThinkPad X13 G2 20WK0024GE i7-1165G7, Iris Xe G7 96EUs | 1.3 kg | 18.2 mm | 13.30" | 1920x1200 | |
| 88.1 % v7 (old) | 12 / 2020 | Dell XPS 13 9310 Core i7 FHD i7-1165G7, Iris Xe G7 96EUs | 1.3 kg | 14.8 mm | 13.40" | 1920x1200 | |
| 91.1 % v7 (old) | 12 / 2020 | Apple MacBook Pro 13 Late 2020 M1 Entry (8 / 256 GB) M1, M1 8-Core GPU | 1.4 kg | 15.6 mm | 13.30" | 2560x1600 | |
| 88.7 % v7 (old) | 12 / 2020 | HP EliteBook 830 G7 i7-10810U, UHD Graphics 620 | 1.3 kg | 18.1 mm | 13.30" | 1920x1080 | |
| 87.8 % v7 (old) | 03 / 2021 | Huawei MateBook X Pro 2021 i7-1165G7, Iris Xe G7 96EUs | 1.3 kg | 14.6 mm | 13.90" | 3000x2000 |
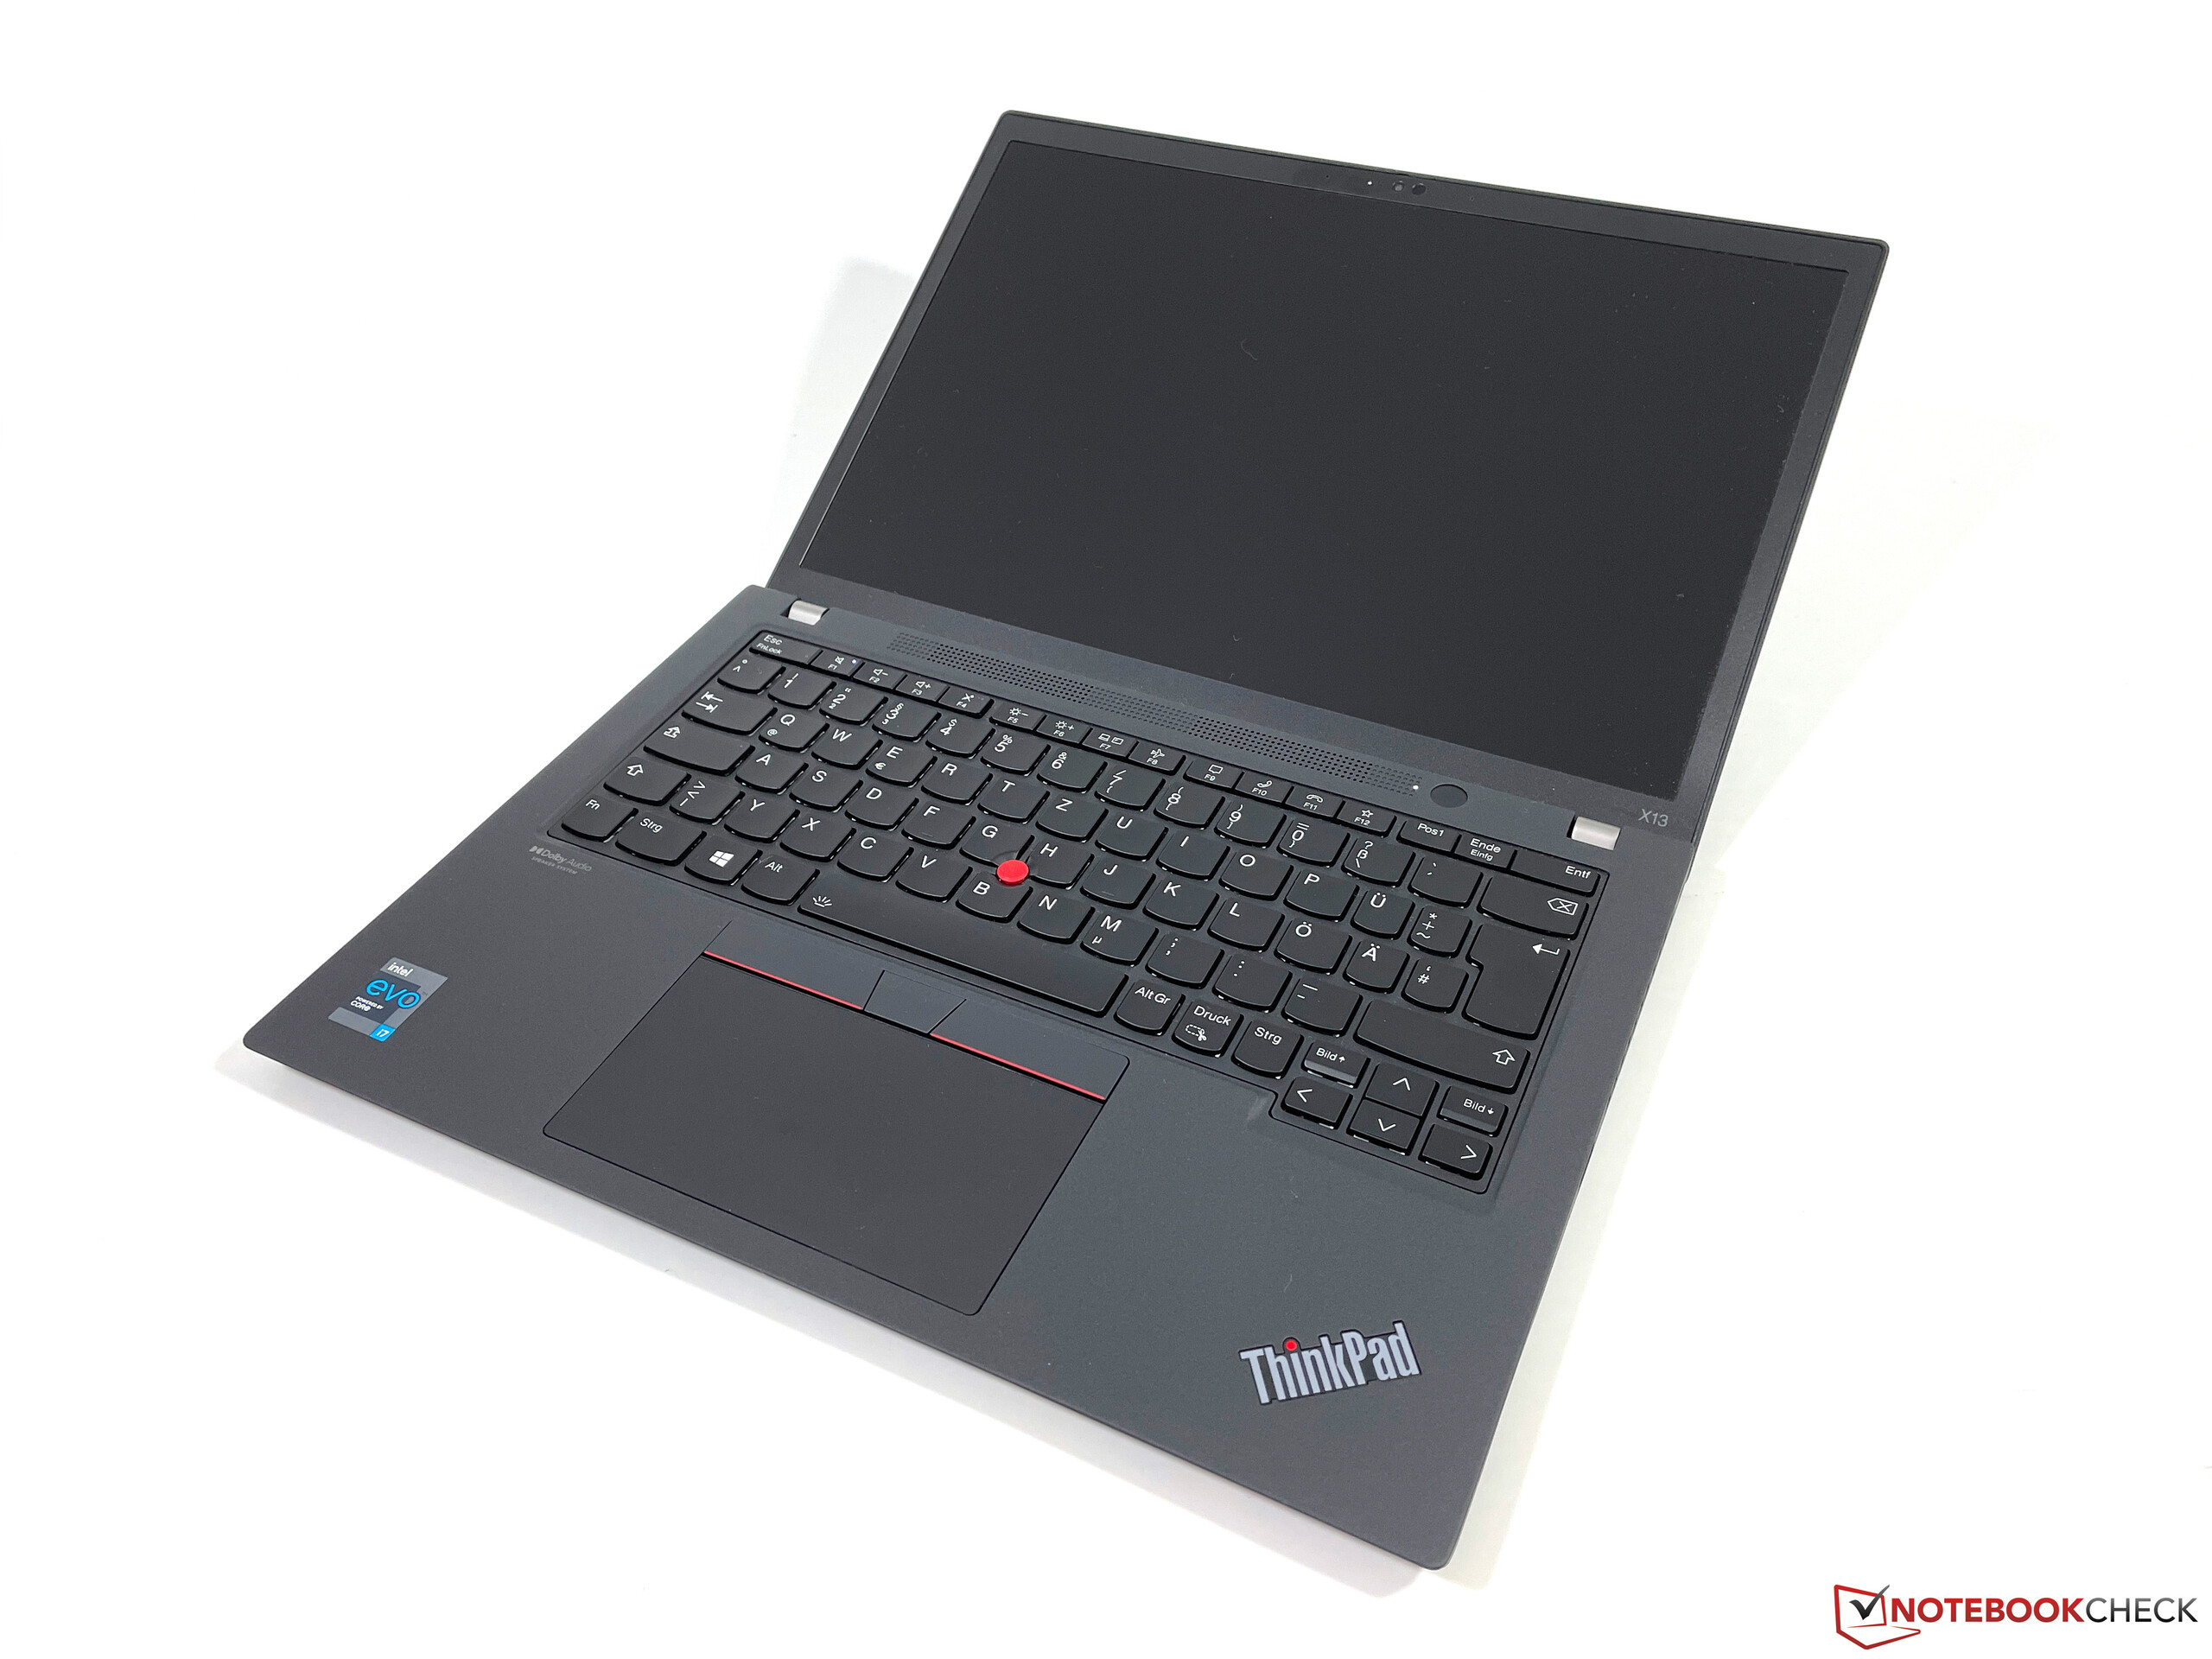
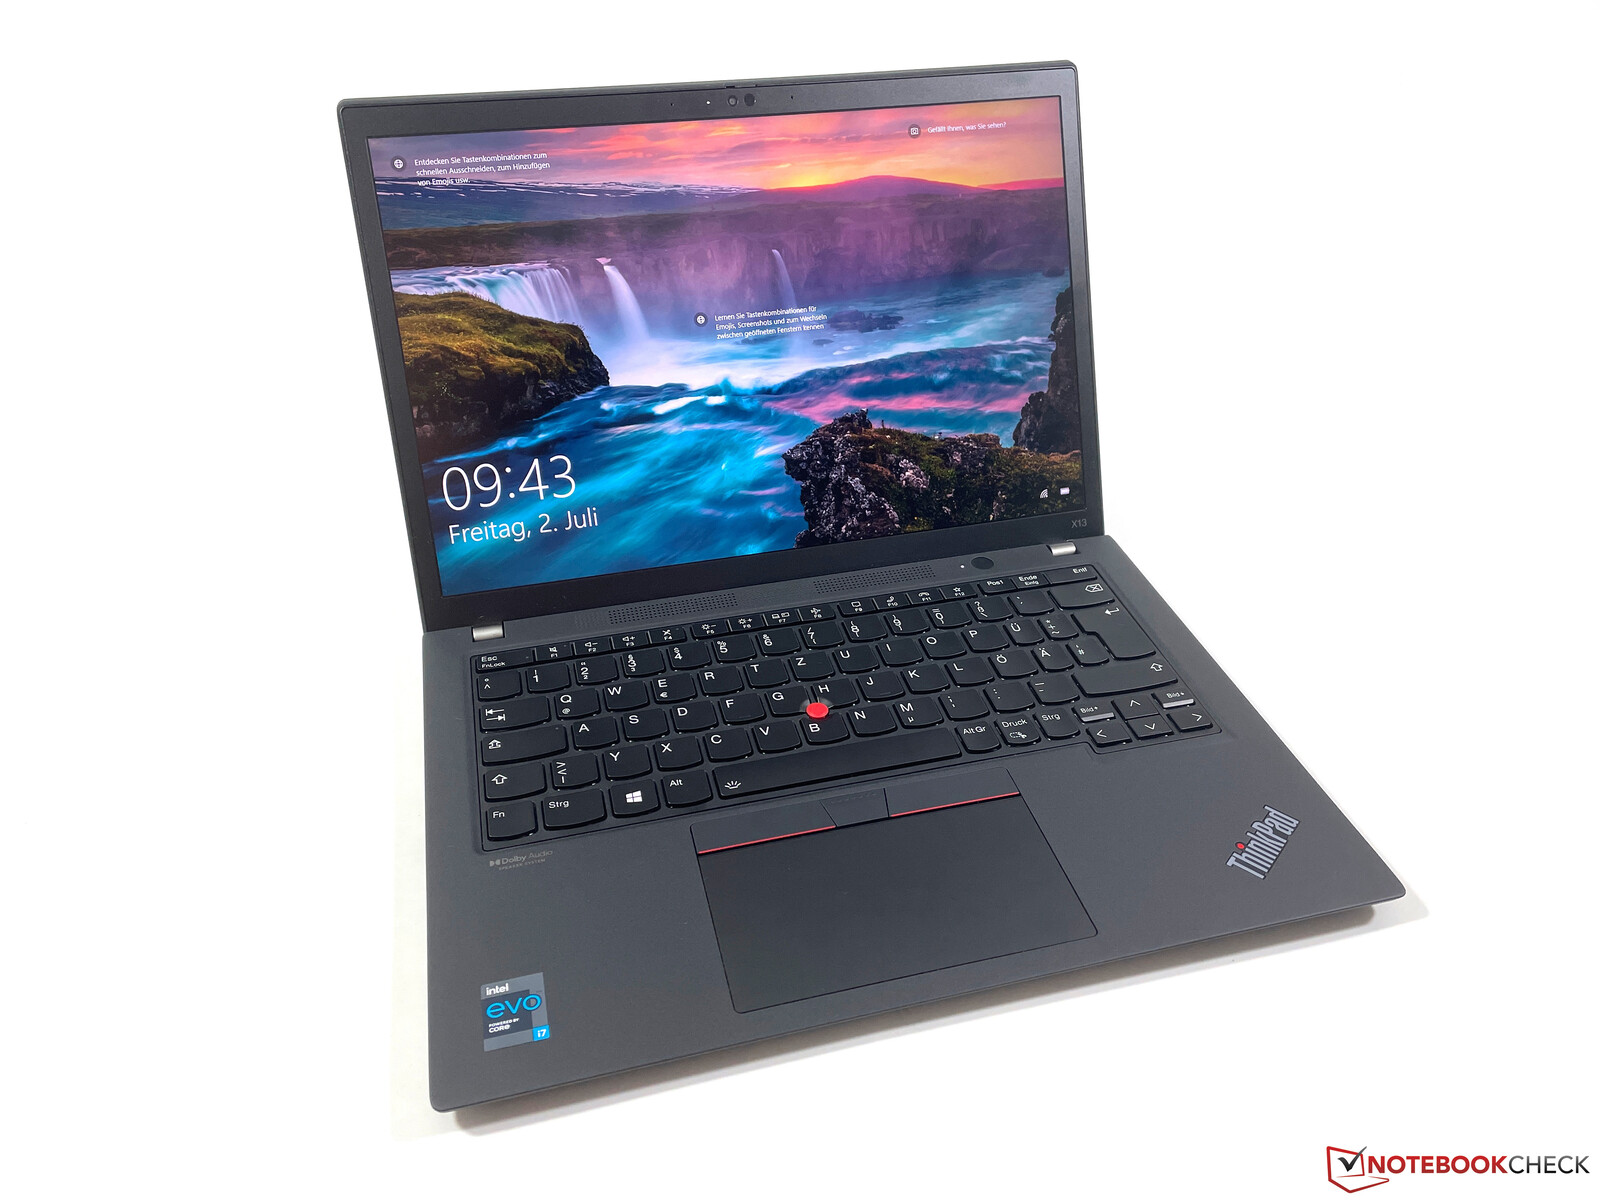
外壳 - 联想的新材料
联想为第二代产品使用了新的机箱。从外观上看,你不会注意到很大的区别,但当你打开盖子时,你会立即看到新的16:10面板和四面的细长边框,这显得更加现代。颜色是另一个区别,因为现在的黑色表面更亮一些,与键盘和触摸板有明显的对比。你也可以得到银色的X13 G2(风暴灰)。
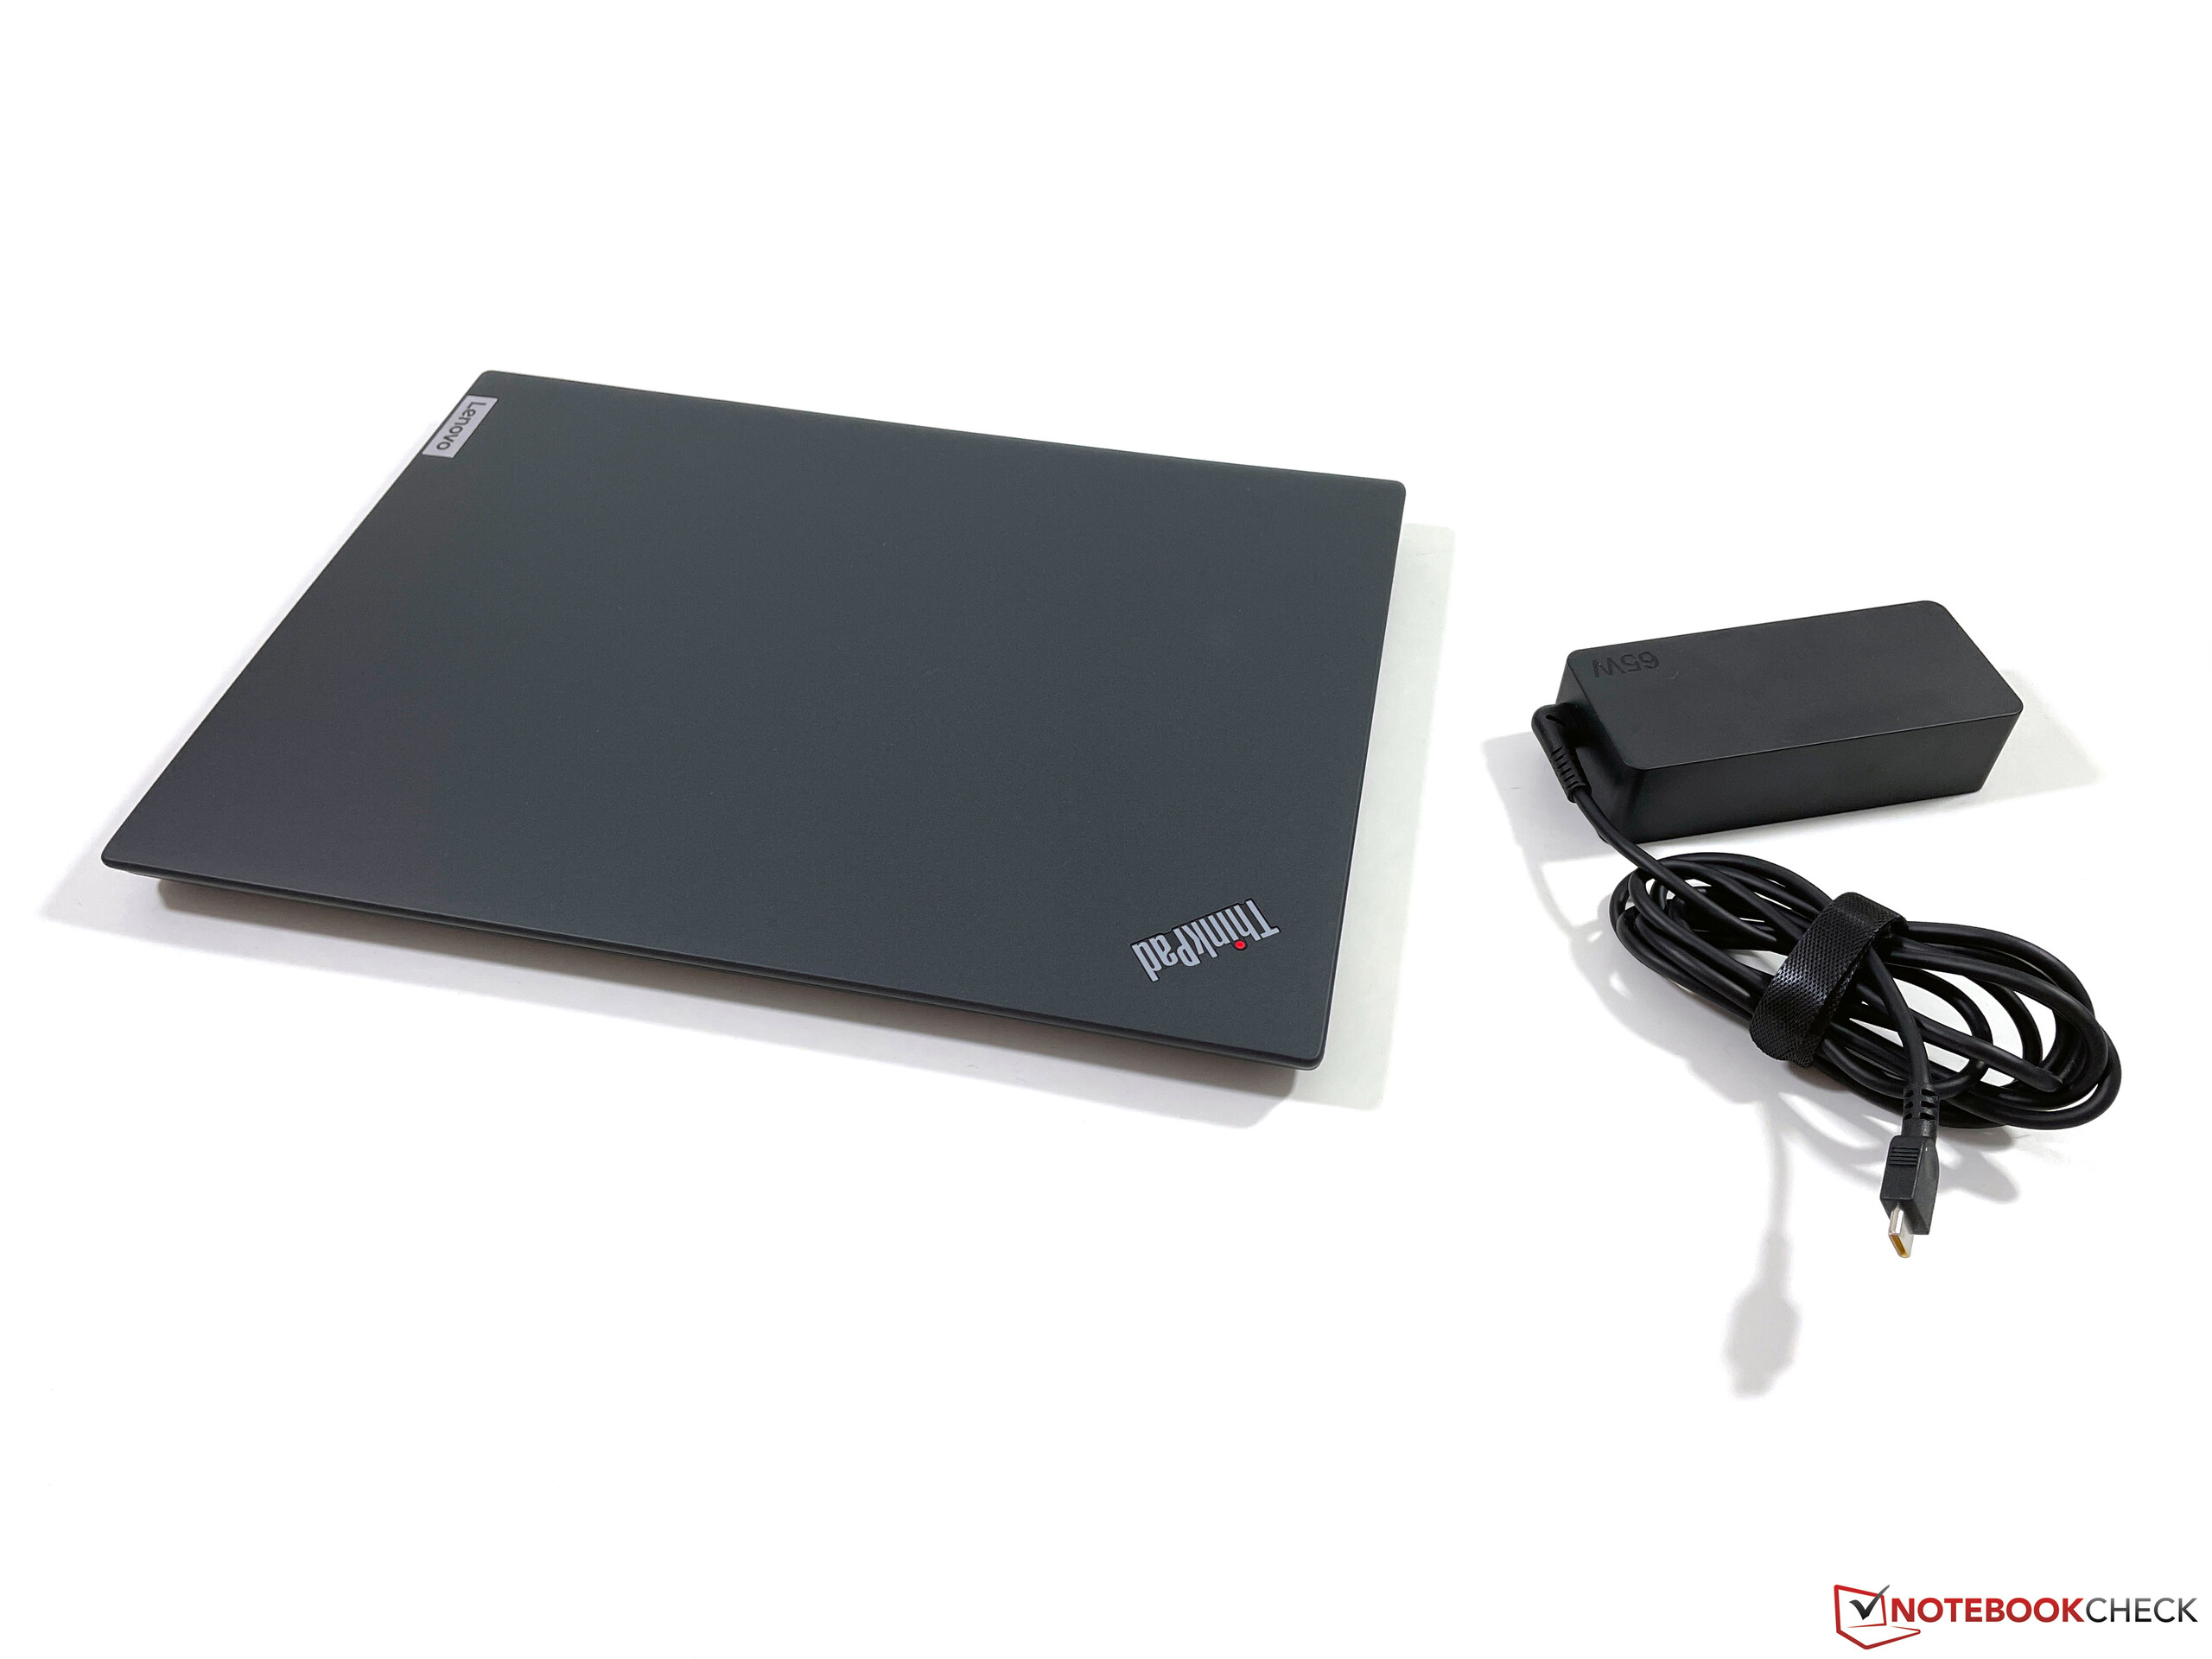
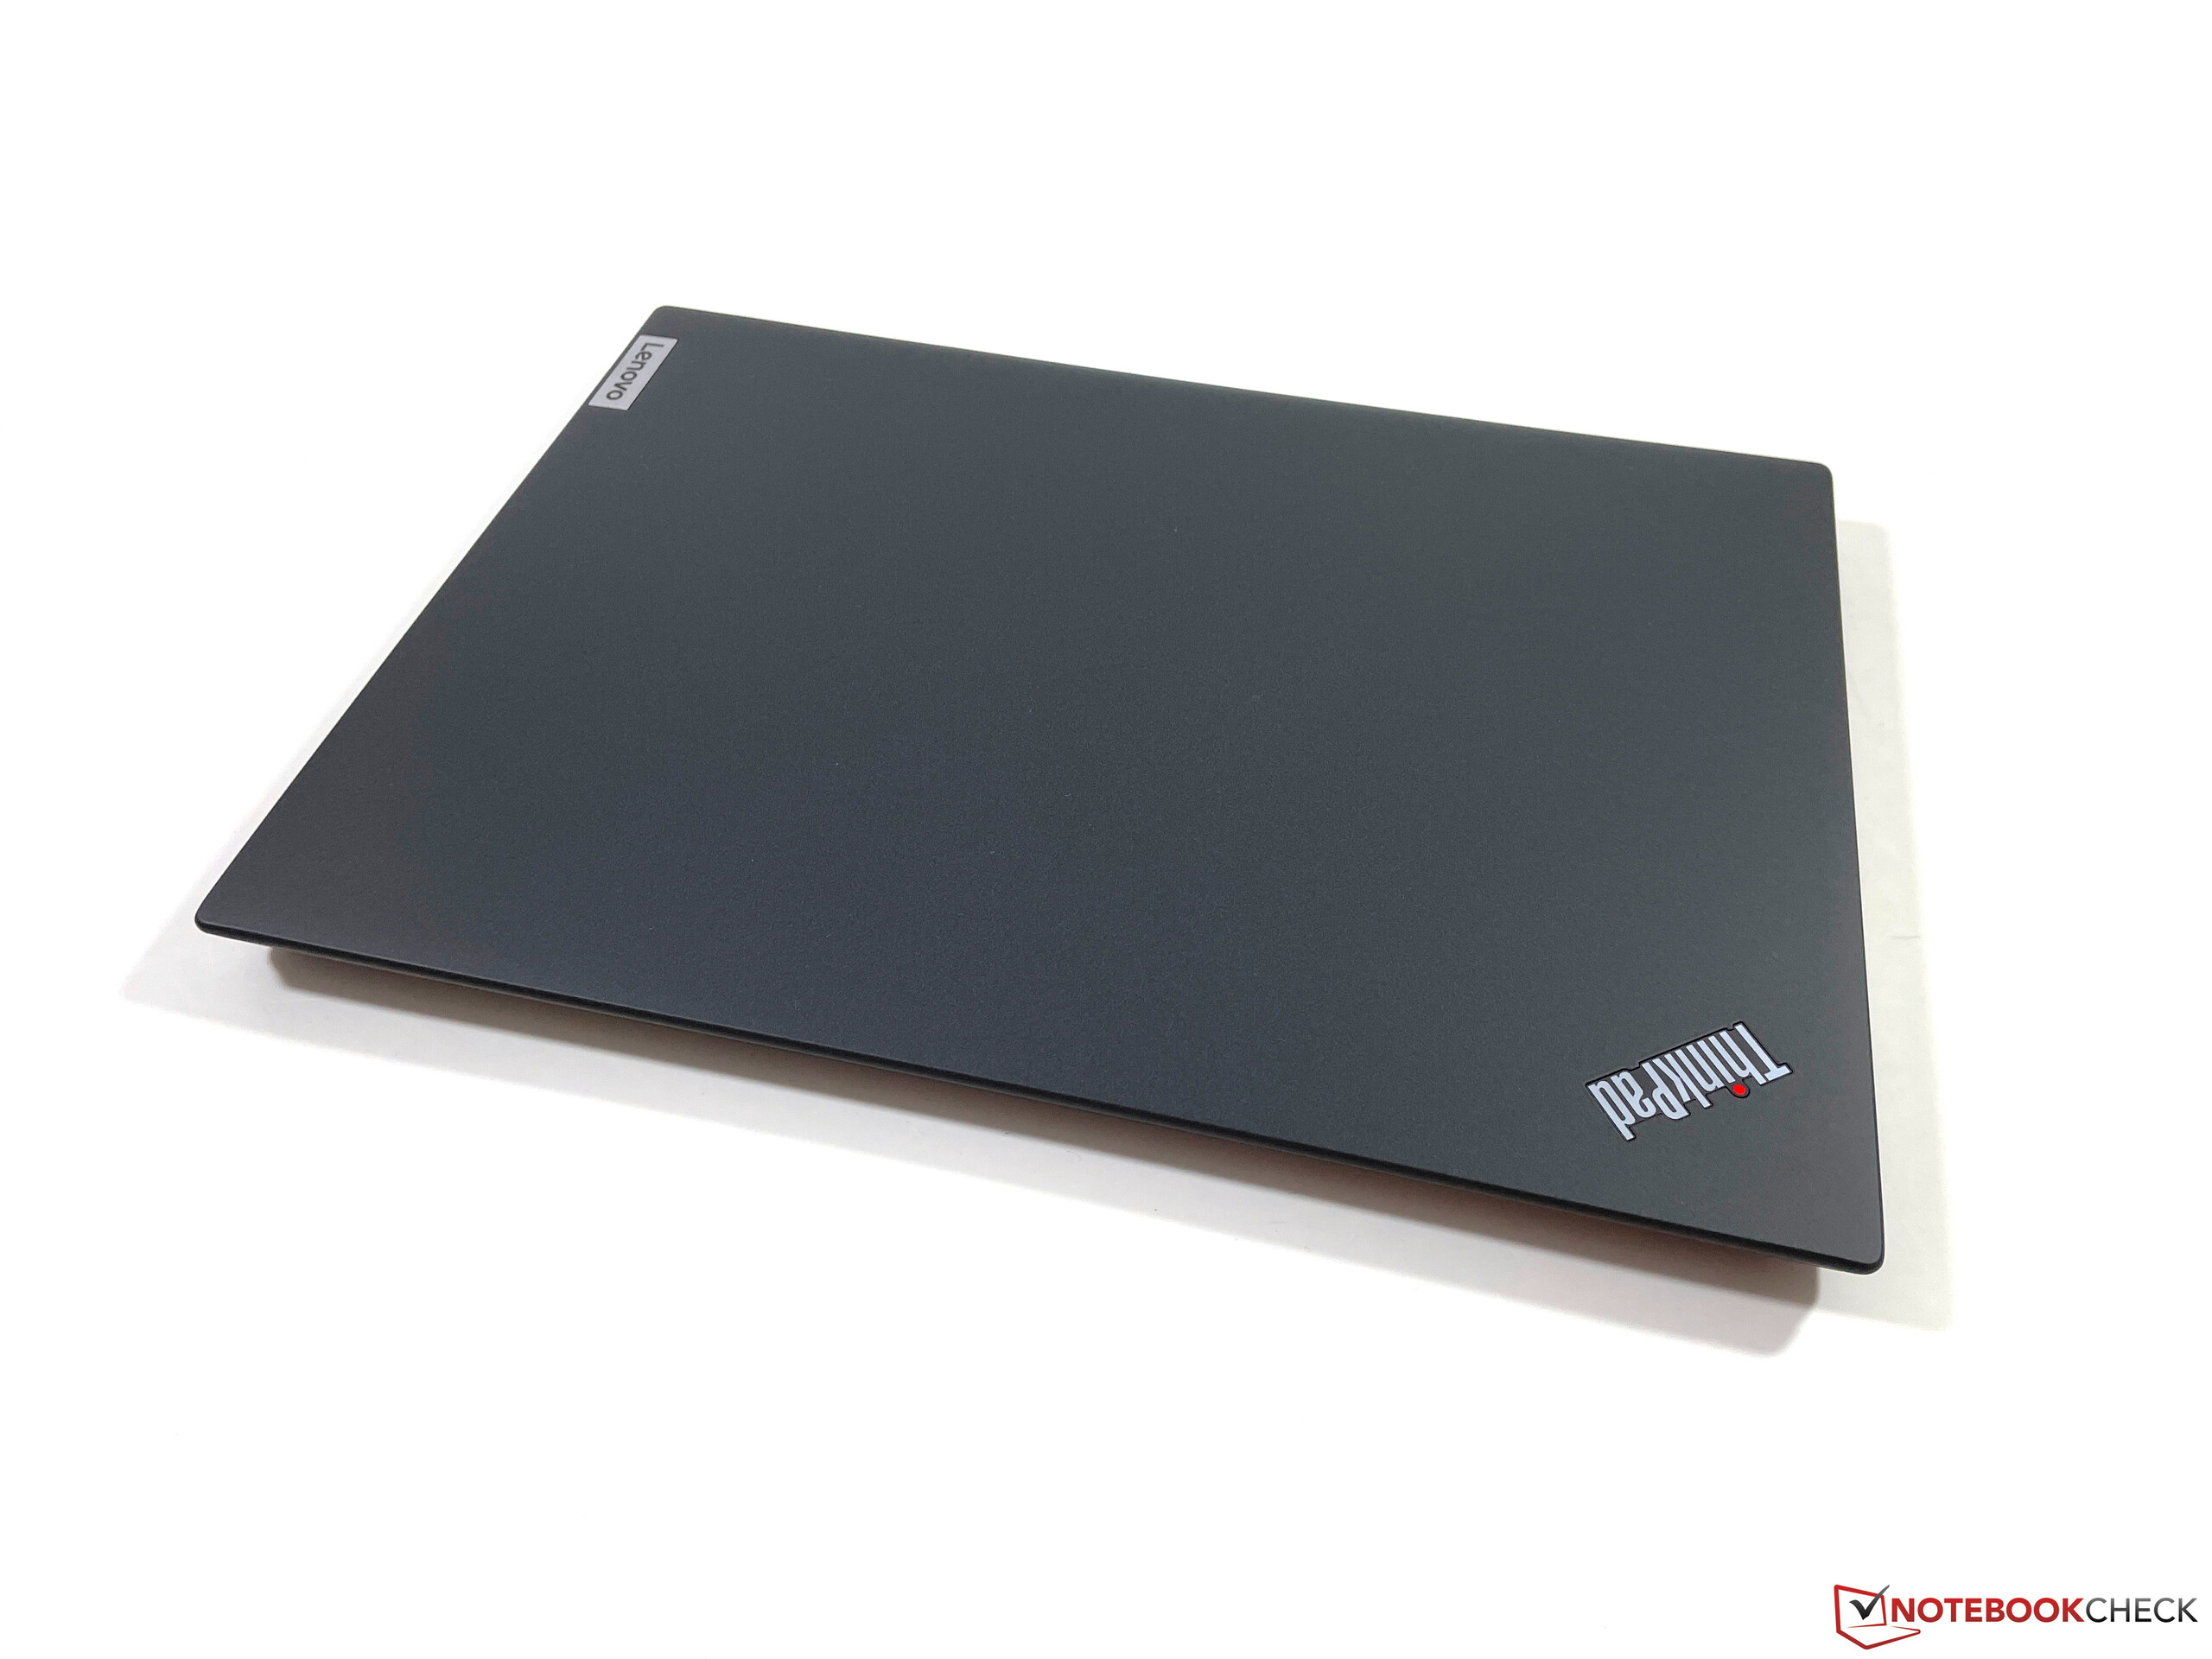
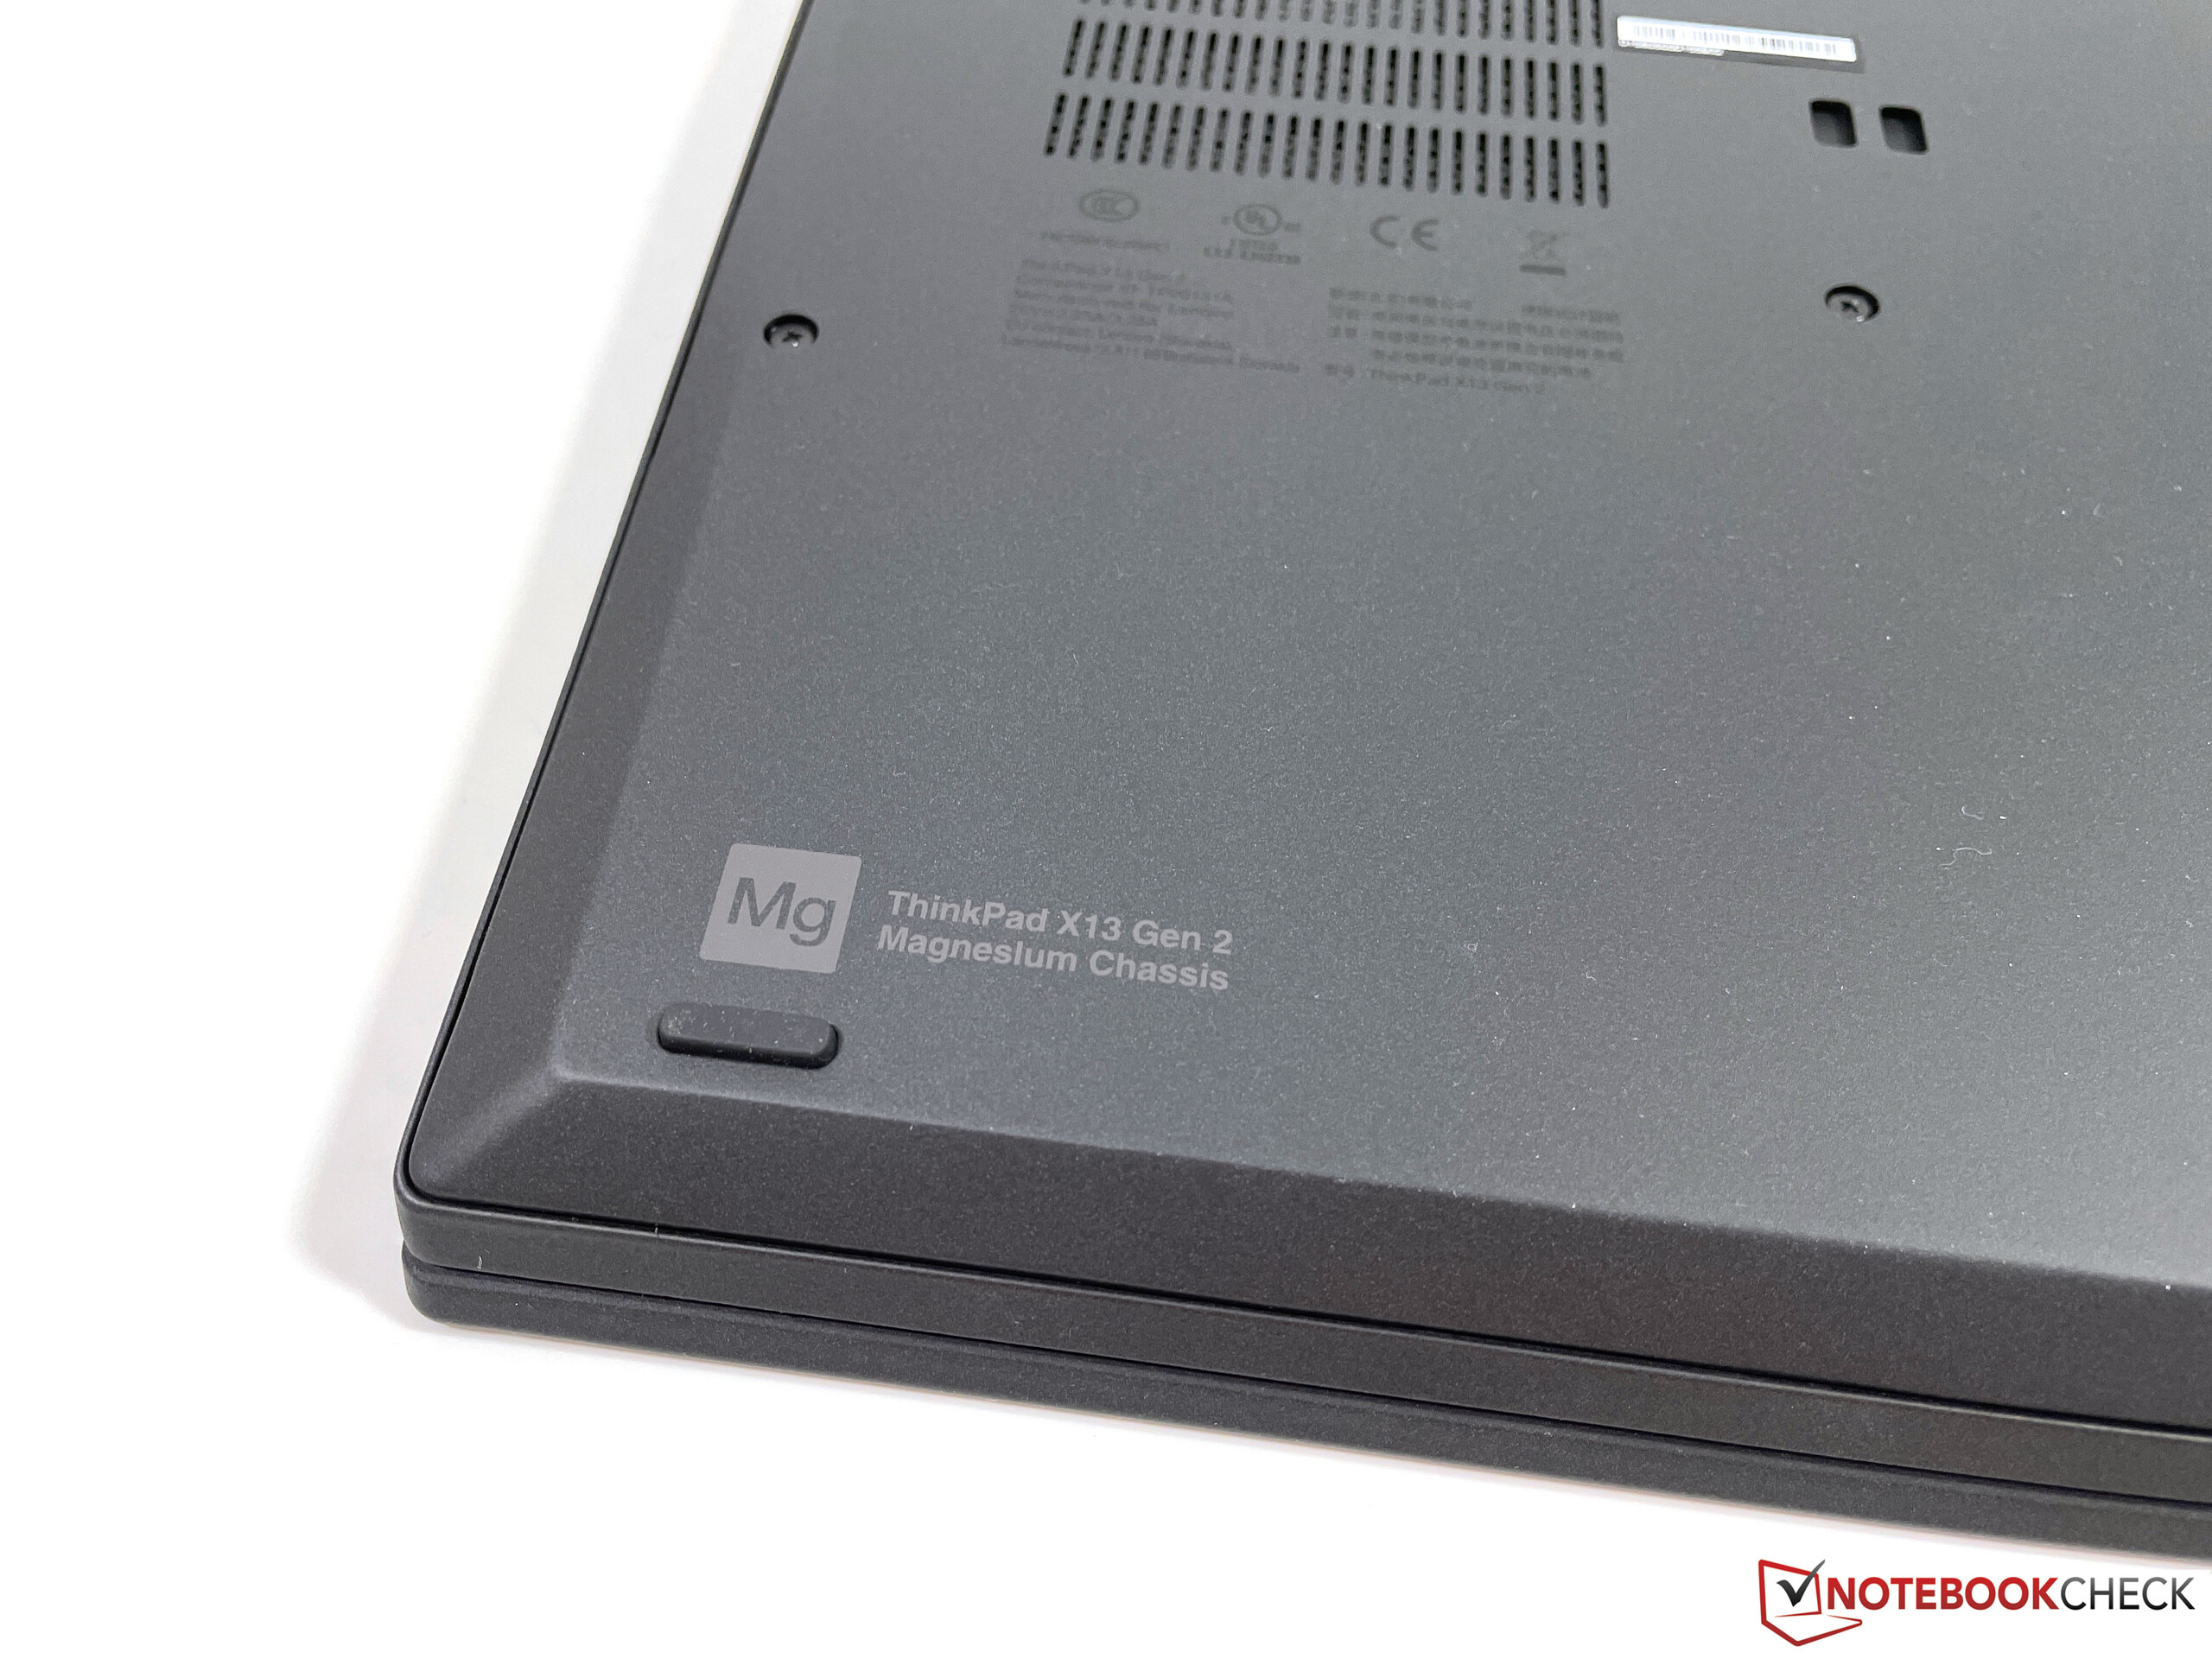
材料也发生了相当大的变化,也有明显的差异,以X13 Yoga G2.基础单元的顶部和底部过去都是由镁制成的,但新机型只有顶部是由镁制成的,表面也更粗糙一些。后者的好处是你不会那么快看到指纹。底部面板现在是由铝制成的。总而言之,底板的稳定性非常好,我们只能在试图扭转底板时激起一些吱吱嘎嘎的声音。
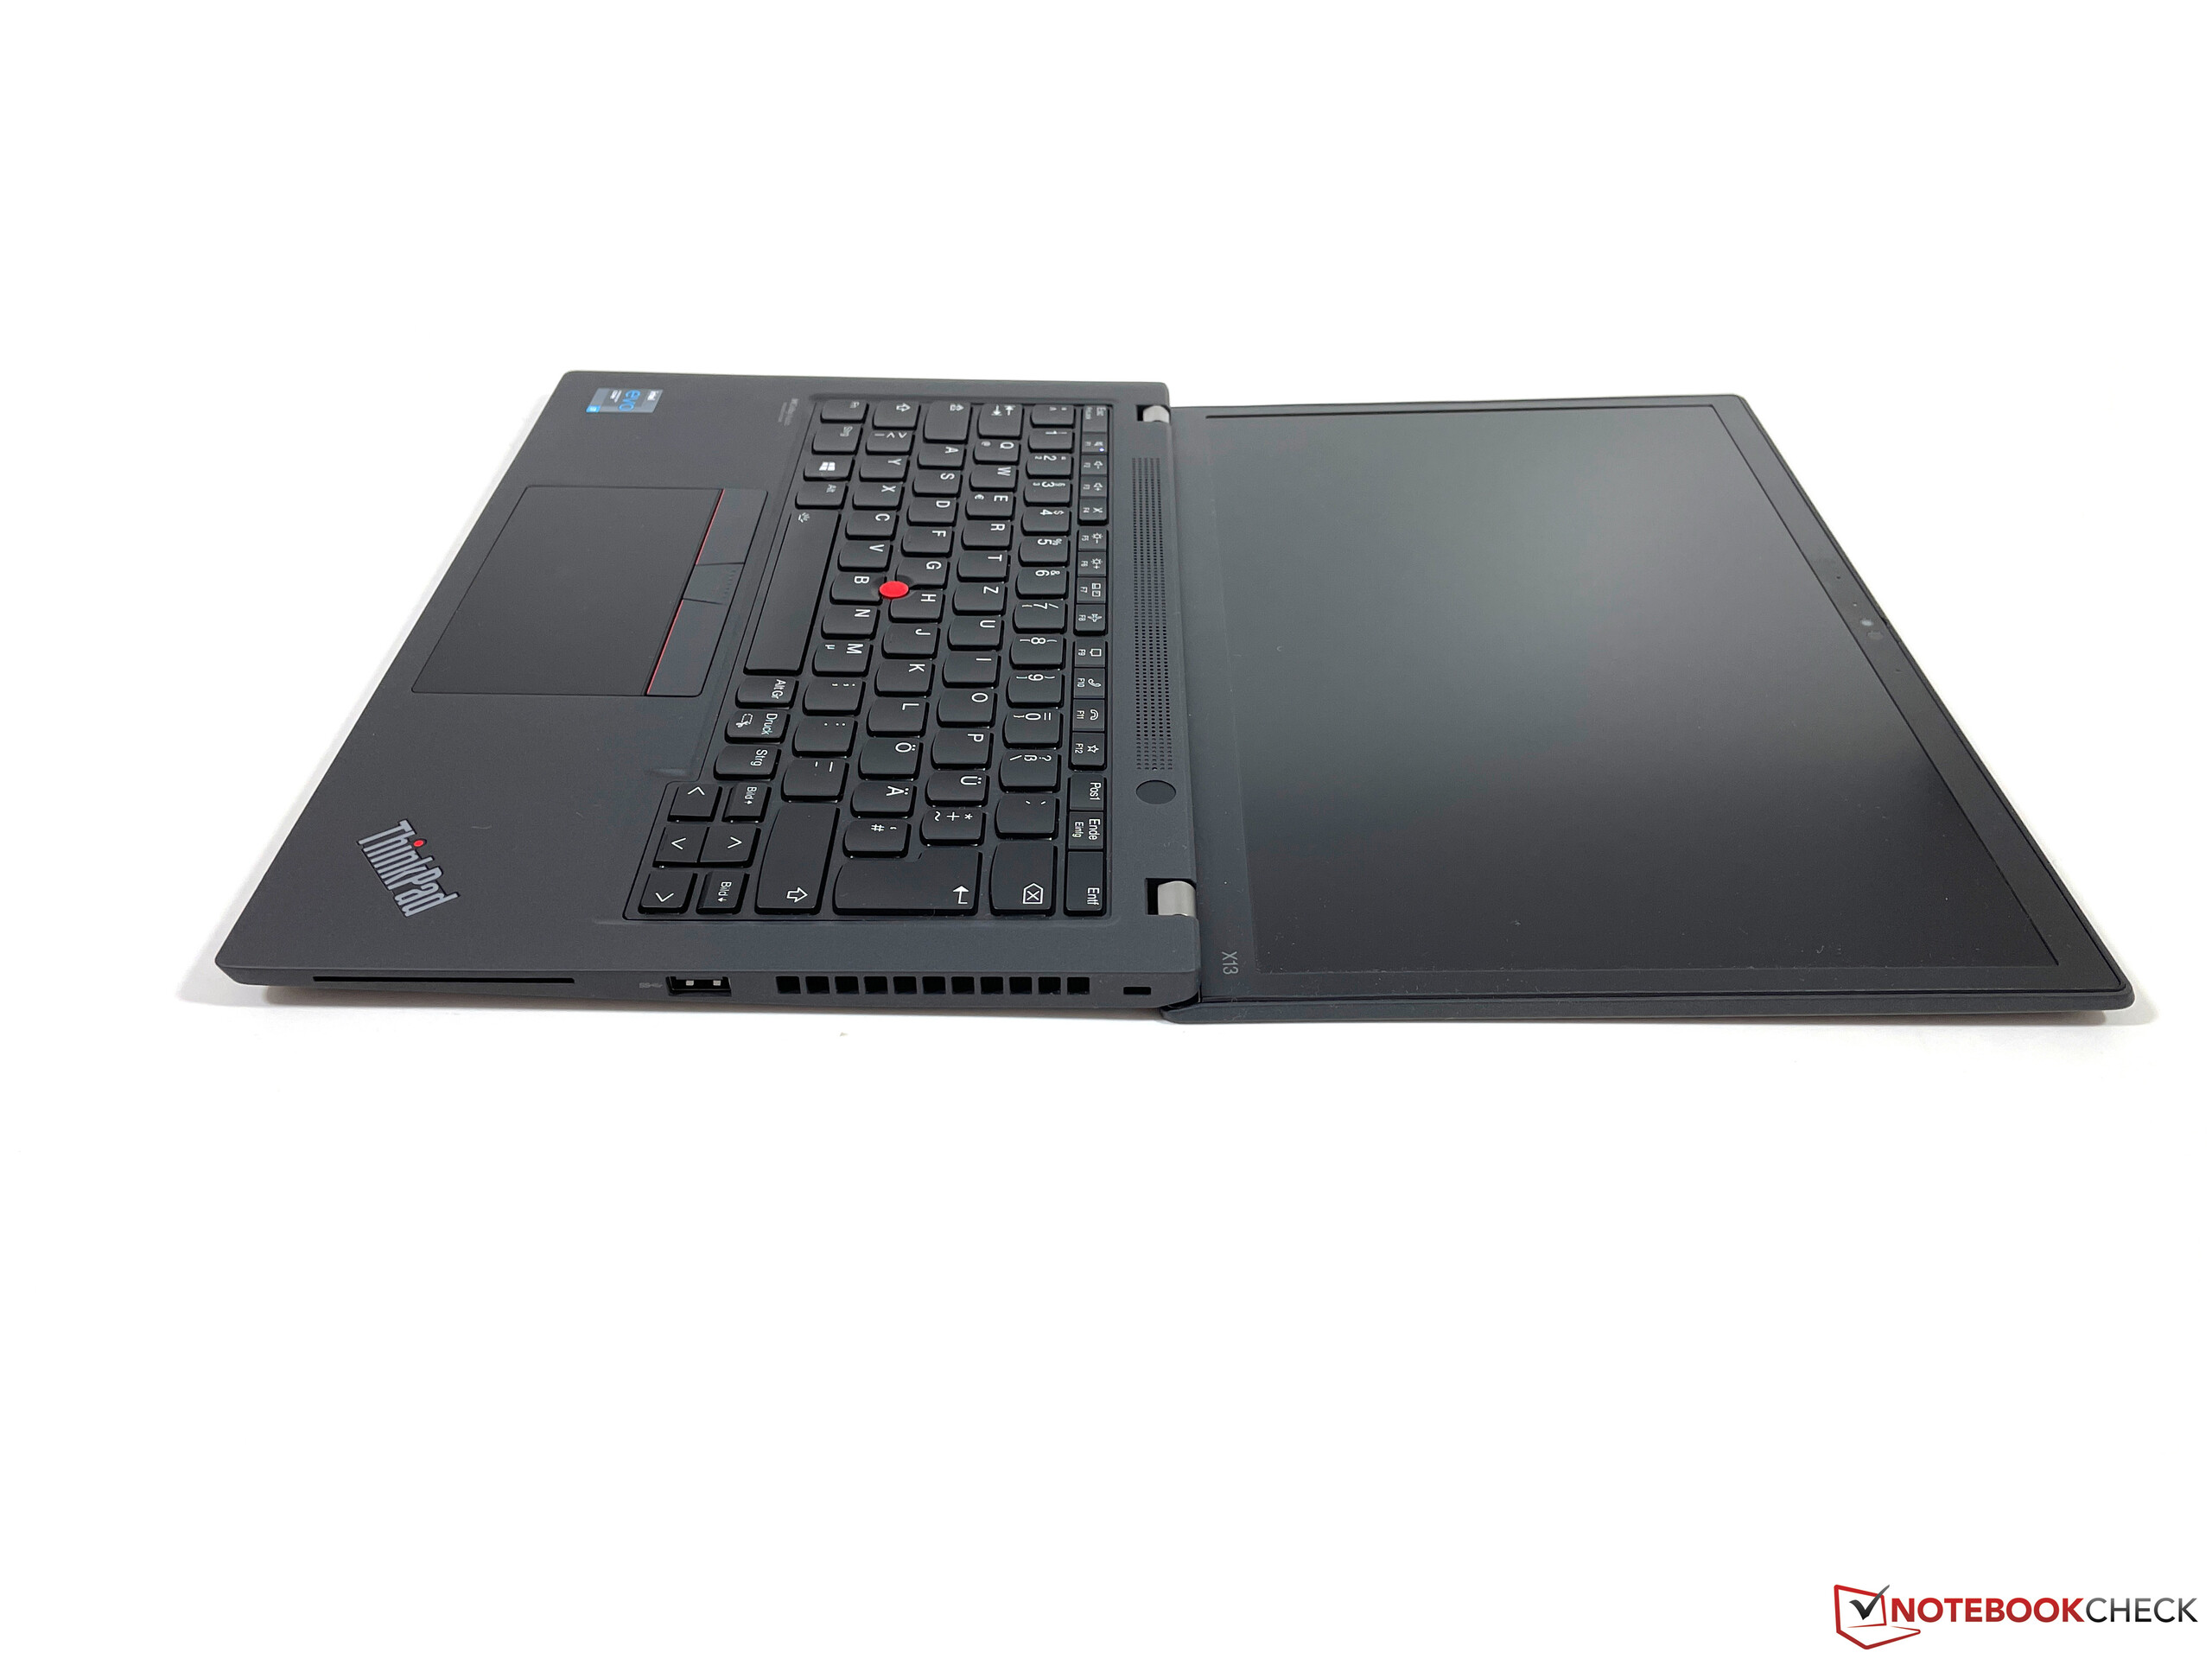
盖子不再由PPS塑料/玻璃纤维复合材料制成,而只是PPS塑料。盖子非常结实,我们不能引起图片的刺激。两个铰链再次允许180度的最大开启角度,但对于我们的口味来说,它们可以更牢固一点。有一些弹跳,盖子从大约20度的角度关闭。
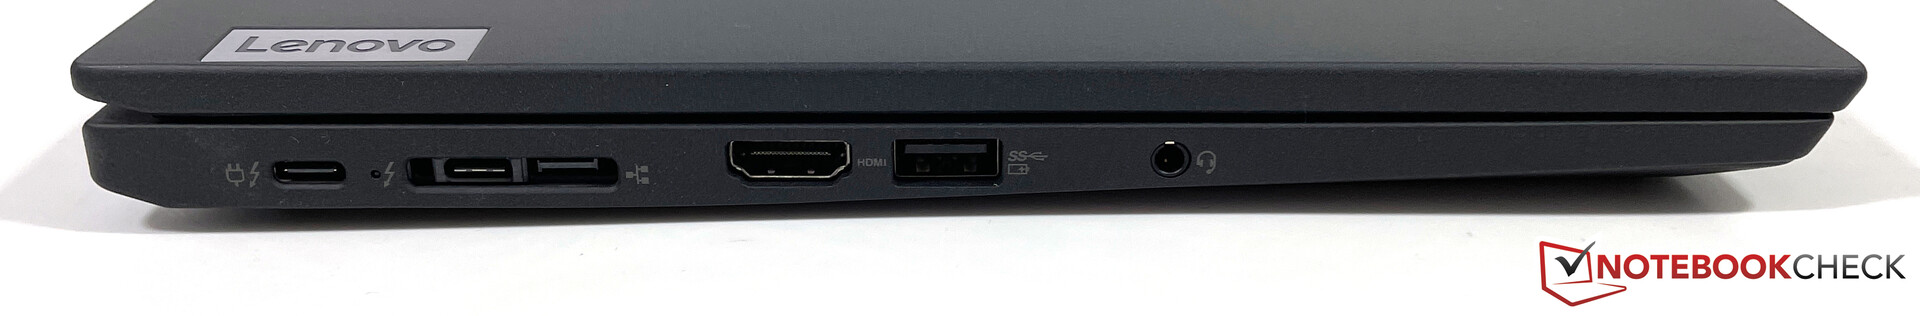
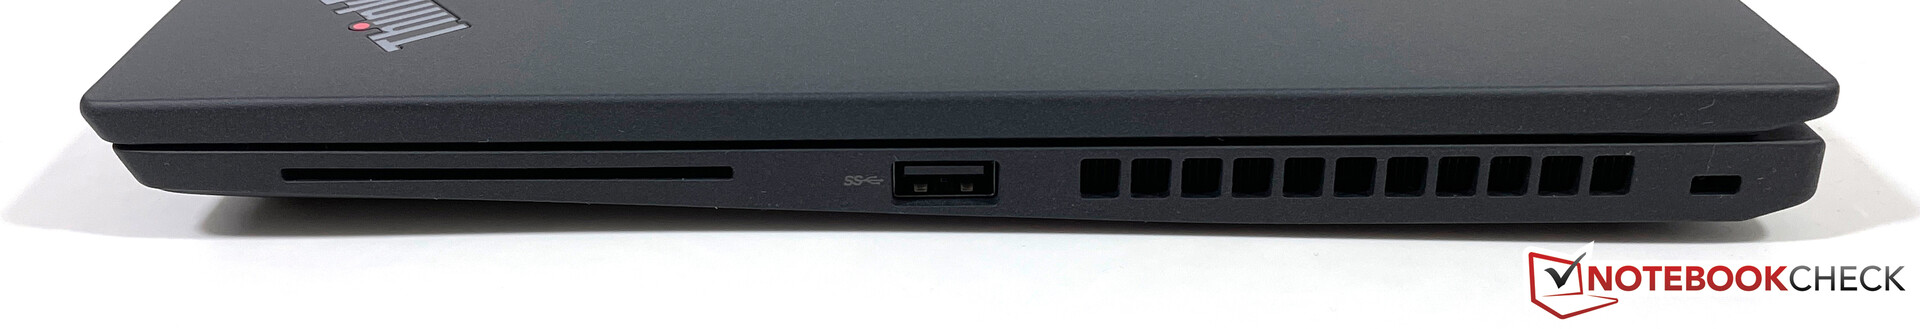
连接性 - X13现在有了Thunderbolt 4技术
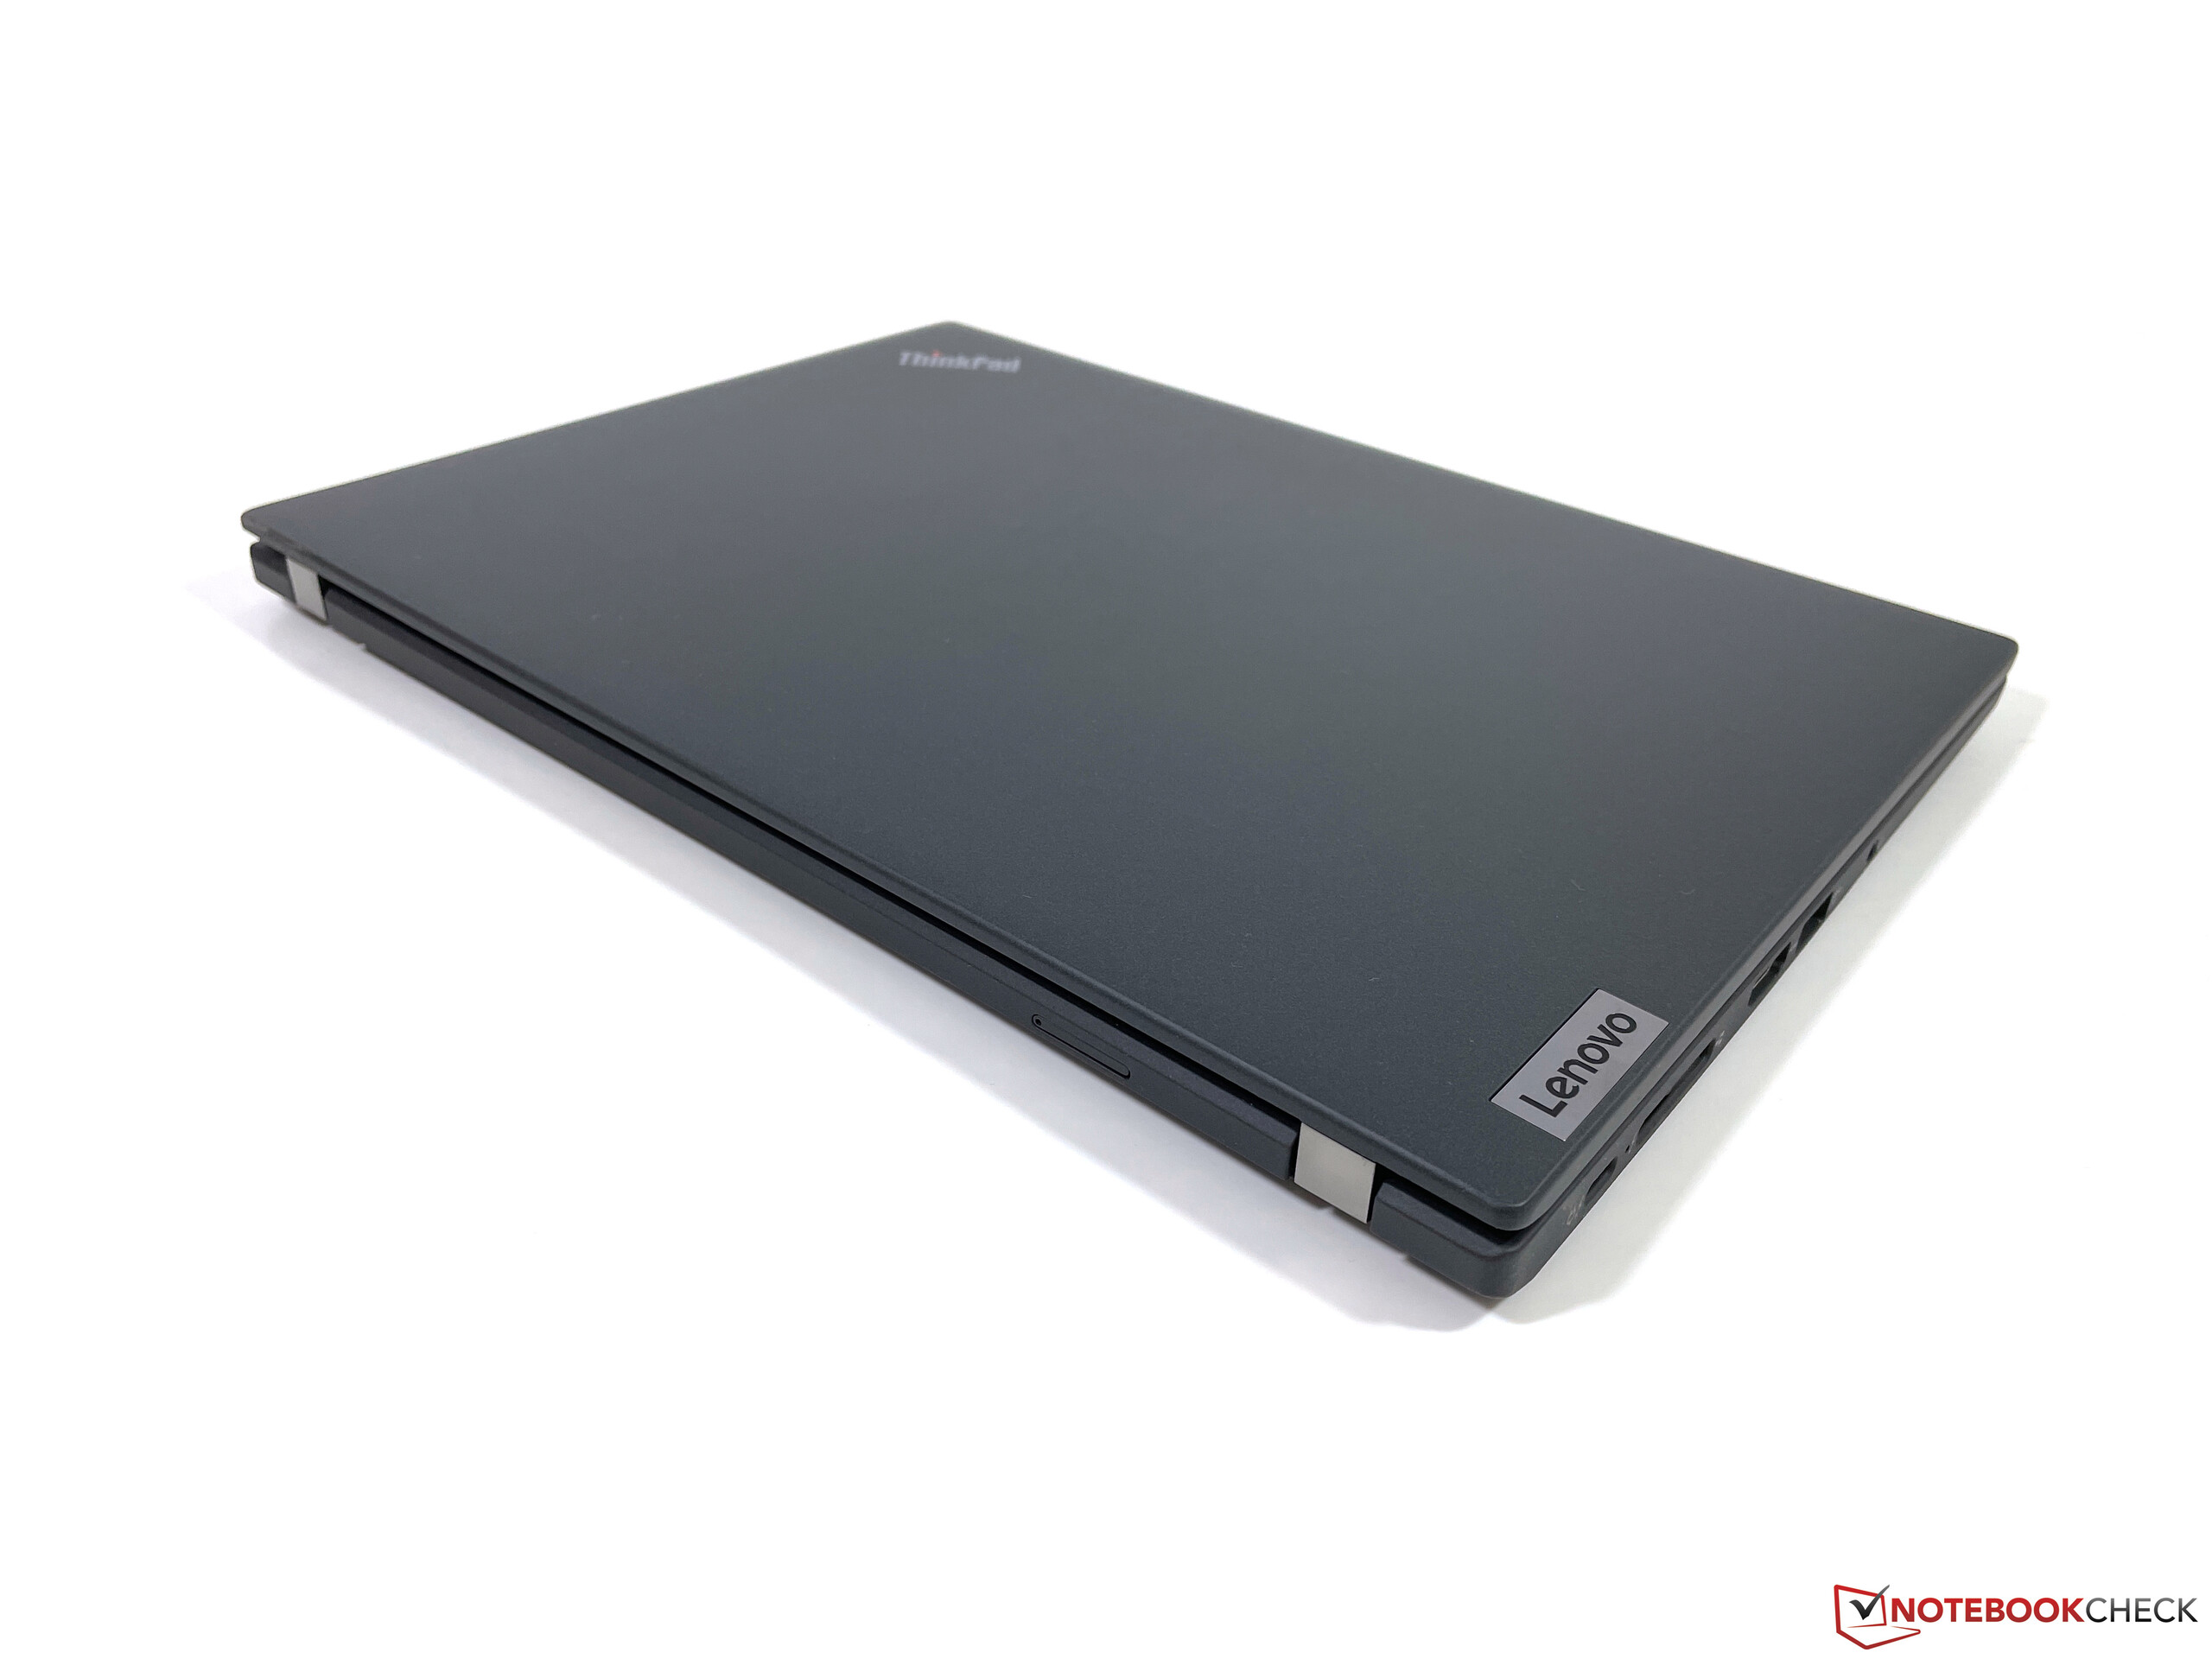
与竞争对手相比,X13 G2的端口情况要好得多。你不仅有两个支持Thunderbolt 4的USB-C端口,还有一个全尺寸的HDMI输出和两个普通的USB-A端口。然而,没有SD卡读卡器。
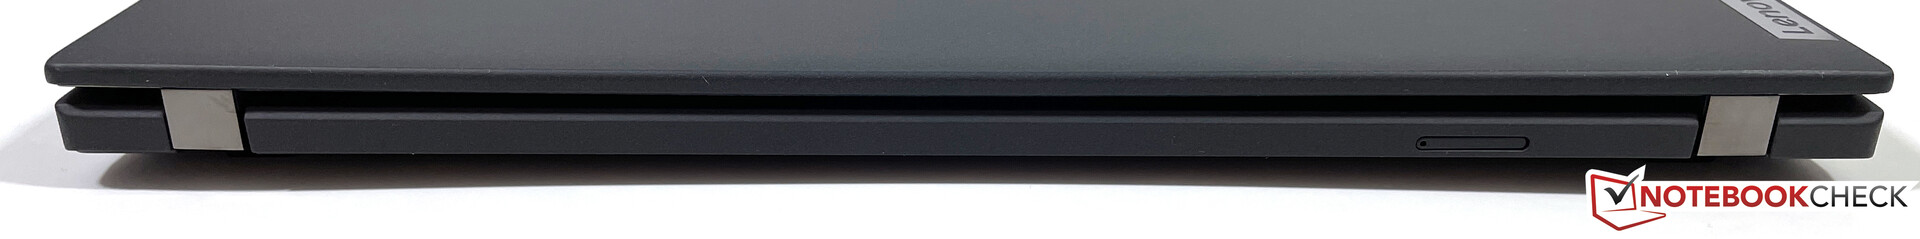
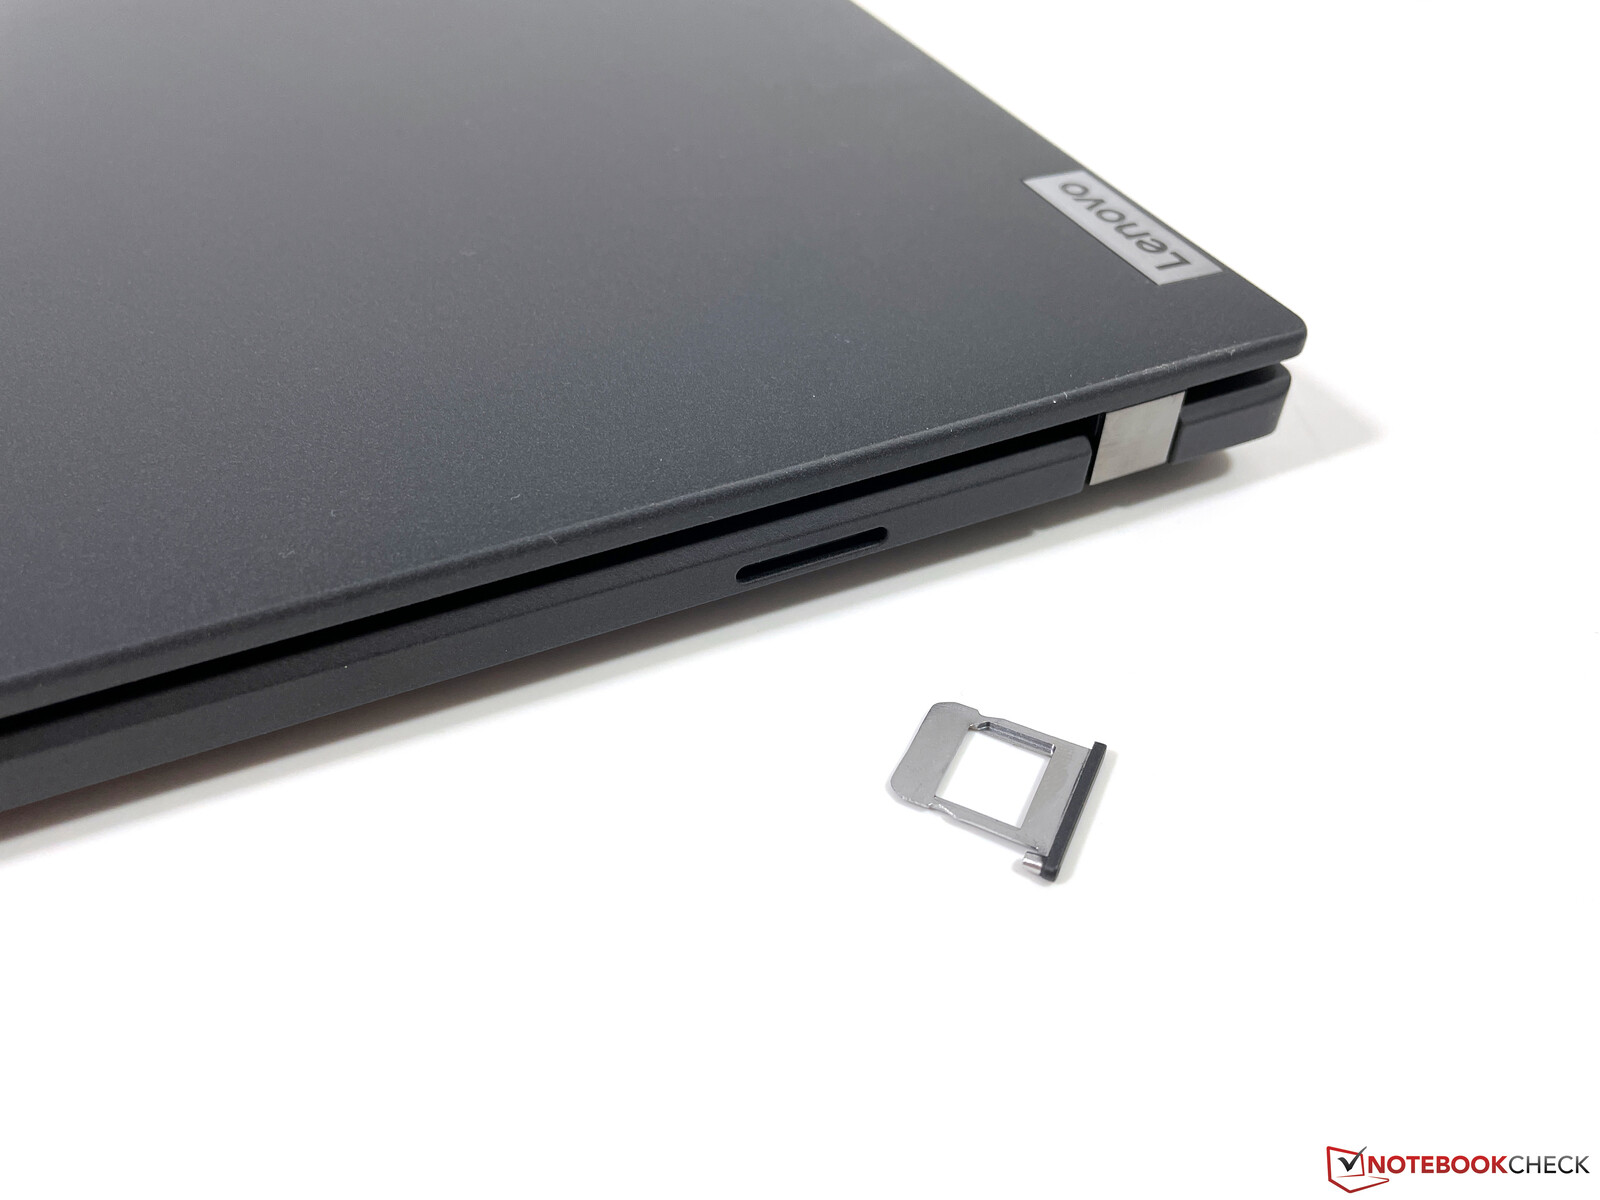
通信 - 5G作为一种选择
除了有线千兆以太网(通过适配器),联想还为X13 G2配备了来自英特尔的最新Wi-Fi 6E模块(AX210)。在我们与路由器Netgear Nighthawk RAX120进行的标准化Wi-Fi测试中,它管理着非常高的传输率,在我们的审查期间,无论是Netgear路由器,还是AVM Fritz!Box(Wi-Fi 5),我们都没有注意到任何连接问题。
你也可以得到带有4G或5G调制解调器的X13 G2。我们的评测单元配备了高通公司的5G模块(骁龙X55),但它只能与eSIM卡结合使用。后面的Nano-SIM卡插槽与我们来自T-Mobile的SIM卡不兼容。
网络摄像头 - ThinkPad现在有了1080p
联想现在使用的是200万像素的1080p摄像头,画质比以前要好一些。这款相机显然适用于视频会议等,但它仍然不能拍出好照片。


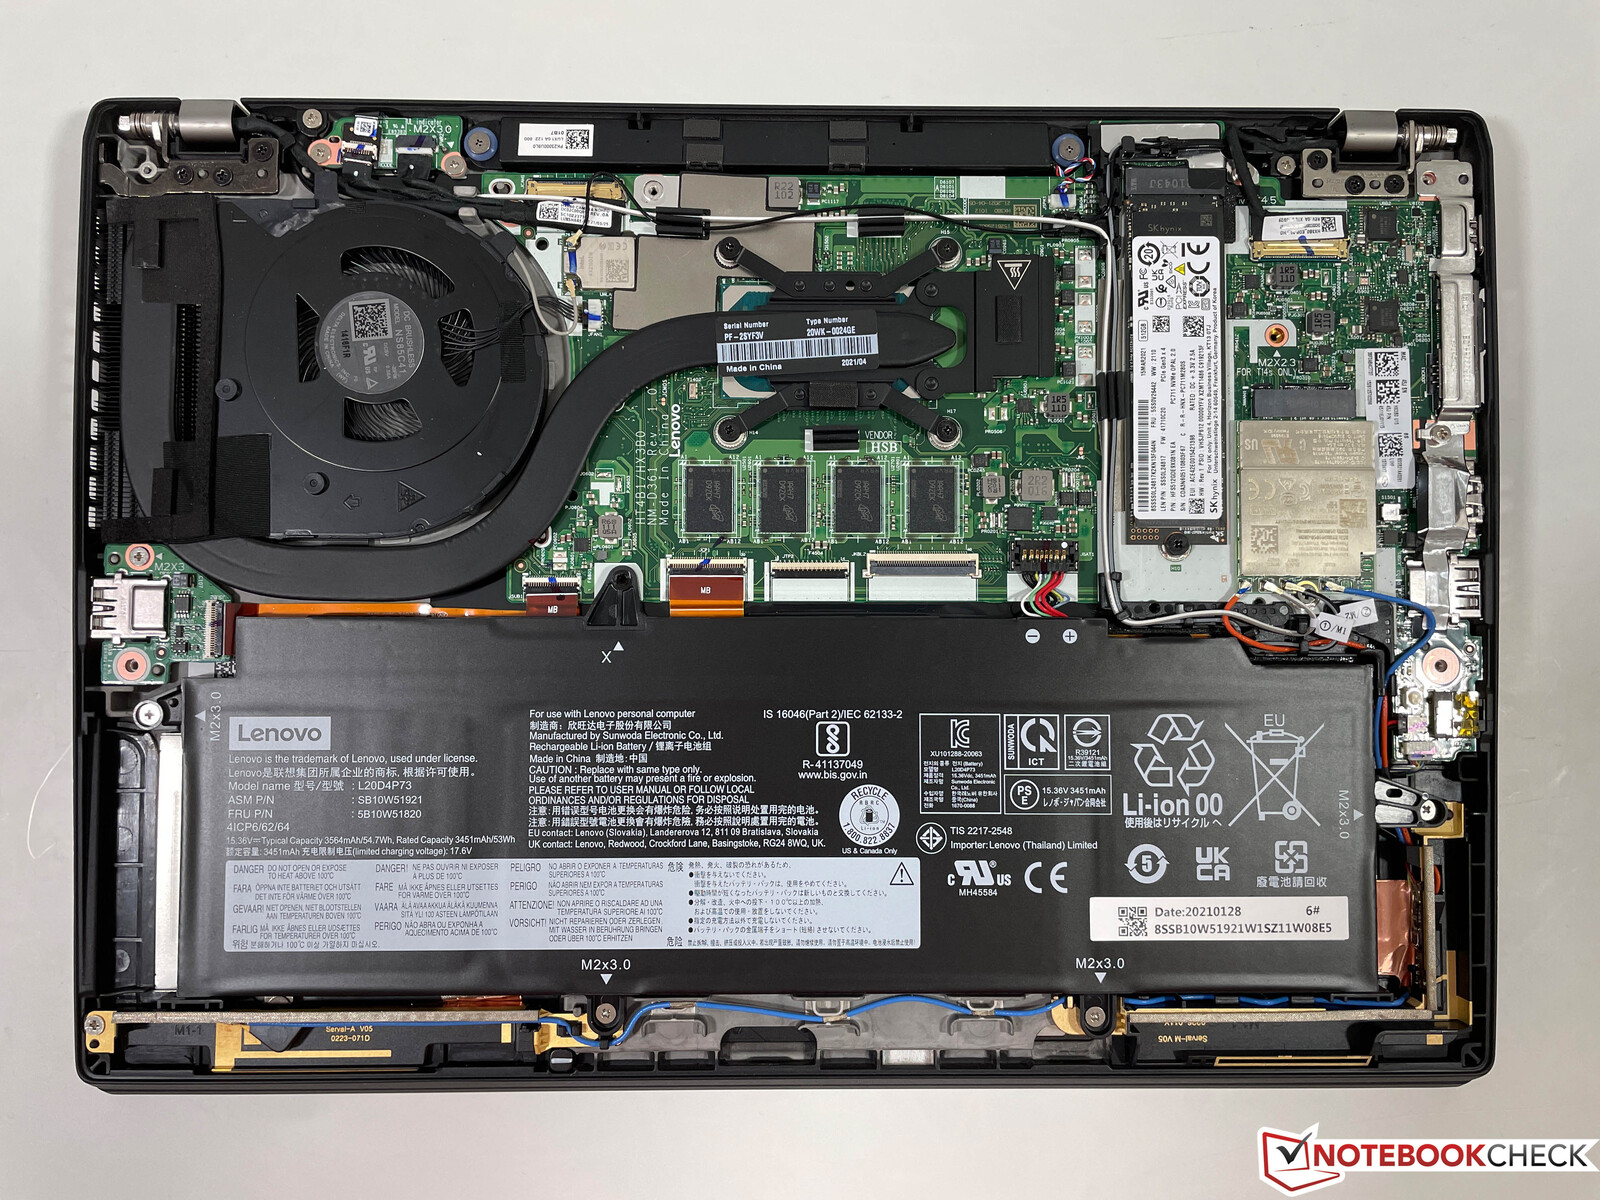
维护
底部面板用几个飞利浦螺钉固定,很容易拆卸。联想在X13 G2和T14s G2上使用相同的主板。T14s G2,用户无法在里面做很多事情。Wi-Fi模块以及内存都是焊接的,所以你只能访问WWAN模块以及M.2-2280固态硬盘,风扇也可以清洗。
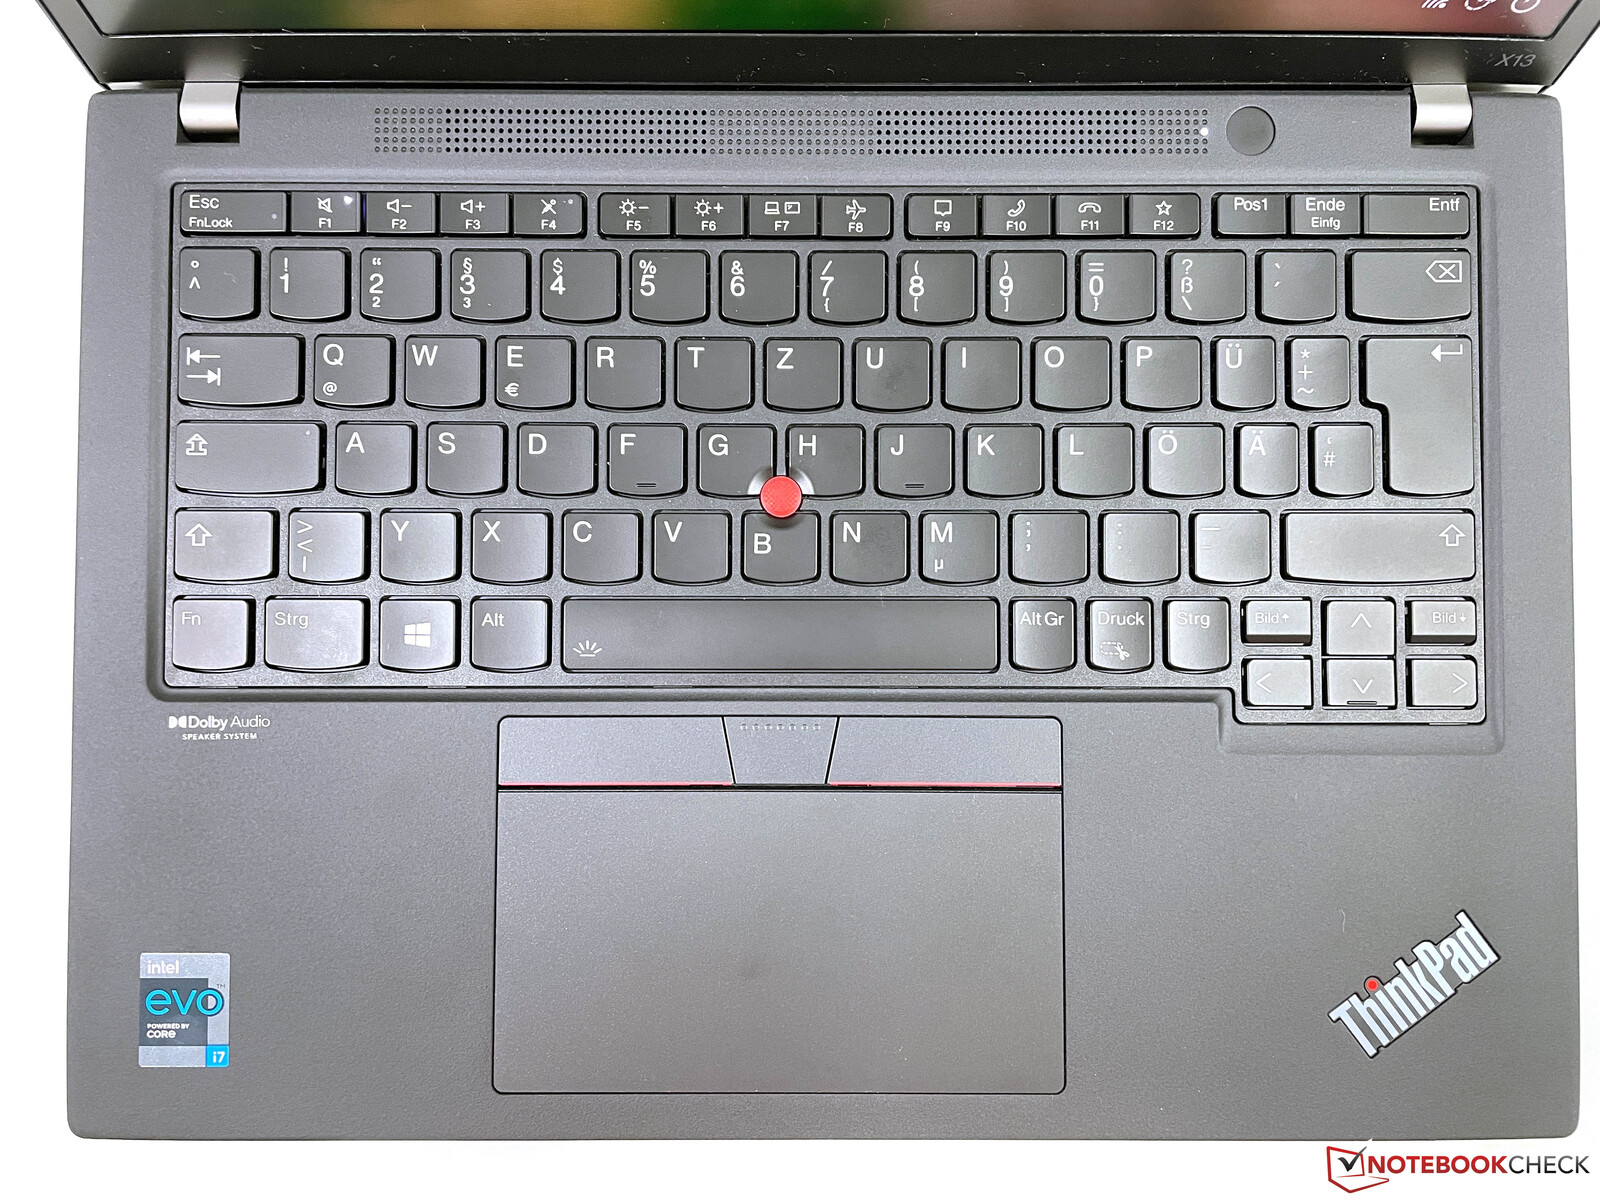
输入设备 - 较浅的按键和减少的行程
键盘
键盘的宽度再次有些缩小(约为常规尺寸的95%),但你很快就会习惯的。然而,类似于目前的ThinkPad X1 Carbon,现在的按键行程减少了1.5毫米,按键也更平坦。这显然影响了打字体验。与消费类笔记本电脑相比仍有优势,但惠普或戴尔的其他商务键盘基本处于同一水平,ThinkPad X13 G2已经没有大的优势。当然,我们在这里抱怨的水平很高,键盘也适合长篇文字,但以前的型号在这一领域有很大优势。
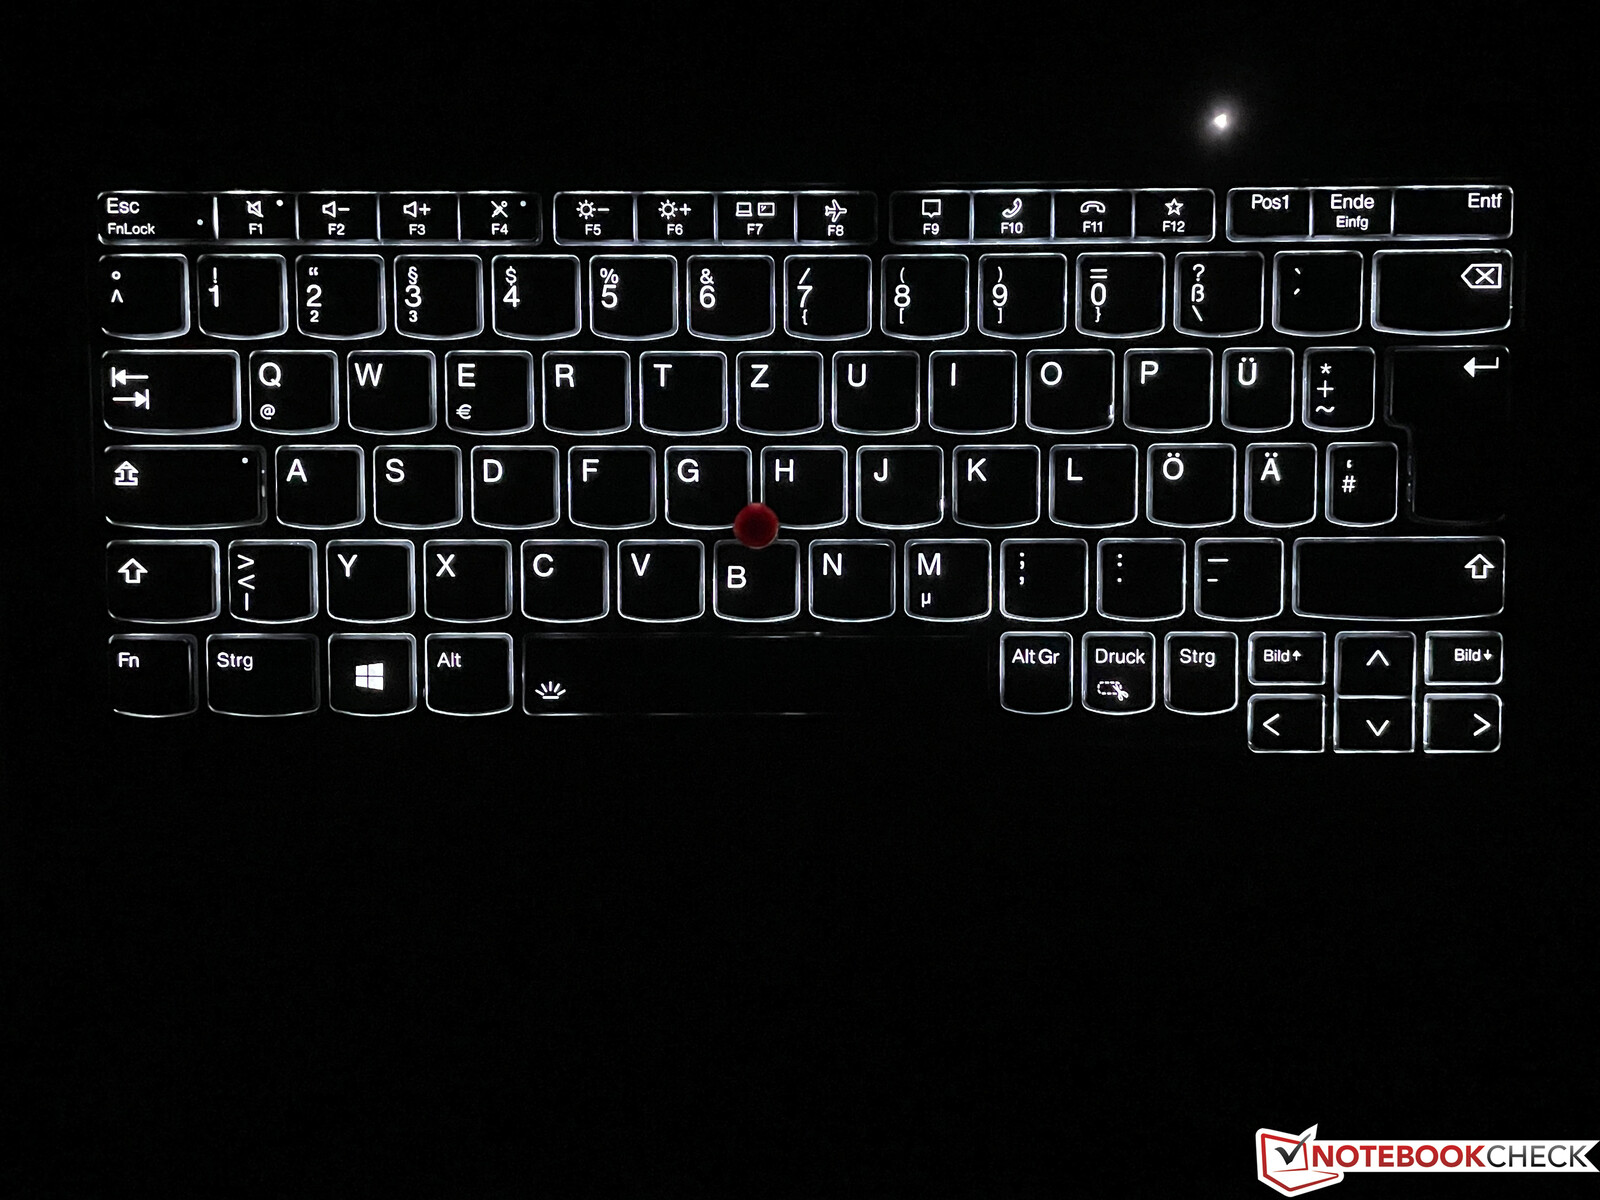
你仍然可以得到一个两段式的白色背景照明,效果很好,它使你在黑暗环境中工作更容易。
触摸板和TrackPoint
联想现在为新的X13 G2使用了更宽的触摸板(11.5 x 6.1厘米),它很容易使用。光滑的表面提供了良好的滑行能力,但是当你点击触摸板的下部时,你会听到相当响亮而廉价的点击声。
红色TrackPoint和键盘上方的额外按钮再次可用,一旦你习惯了,就很容易使用。专用按钮也很好用,但两个按钮的点击噪音有一点不同。
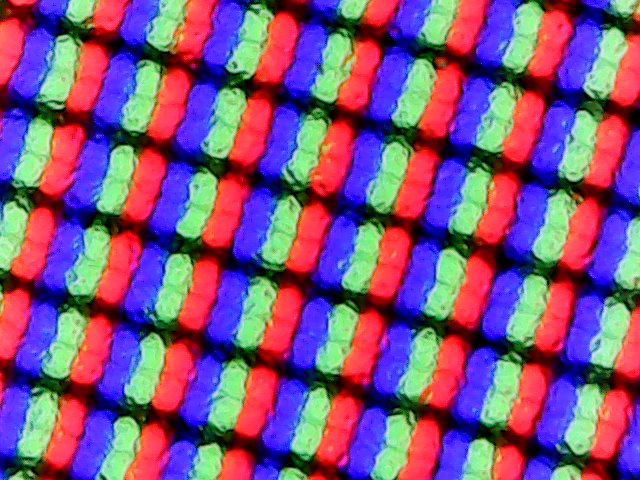
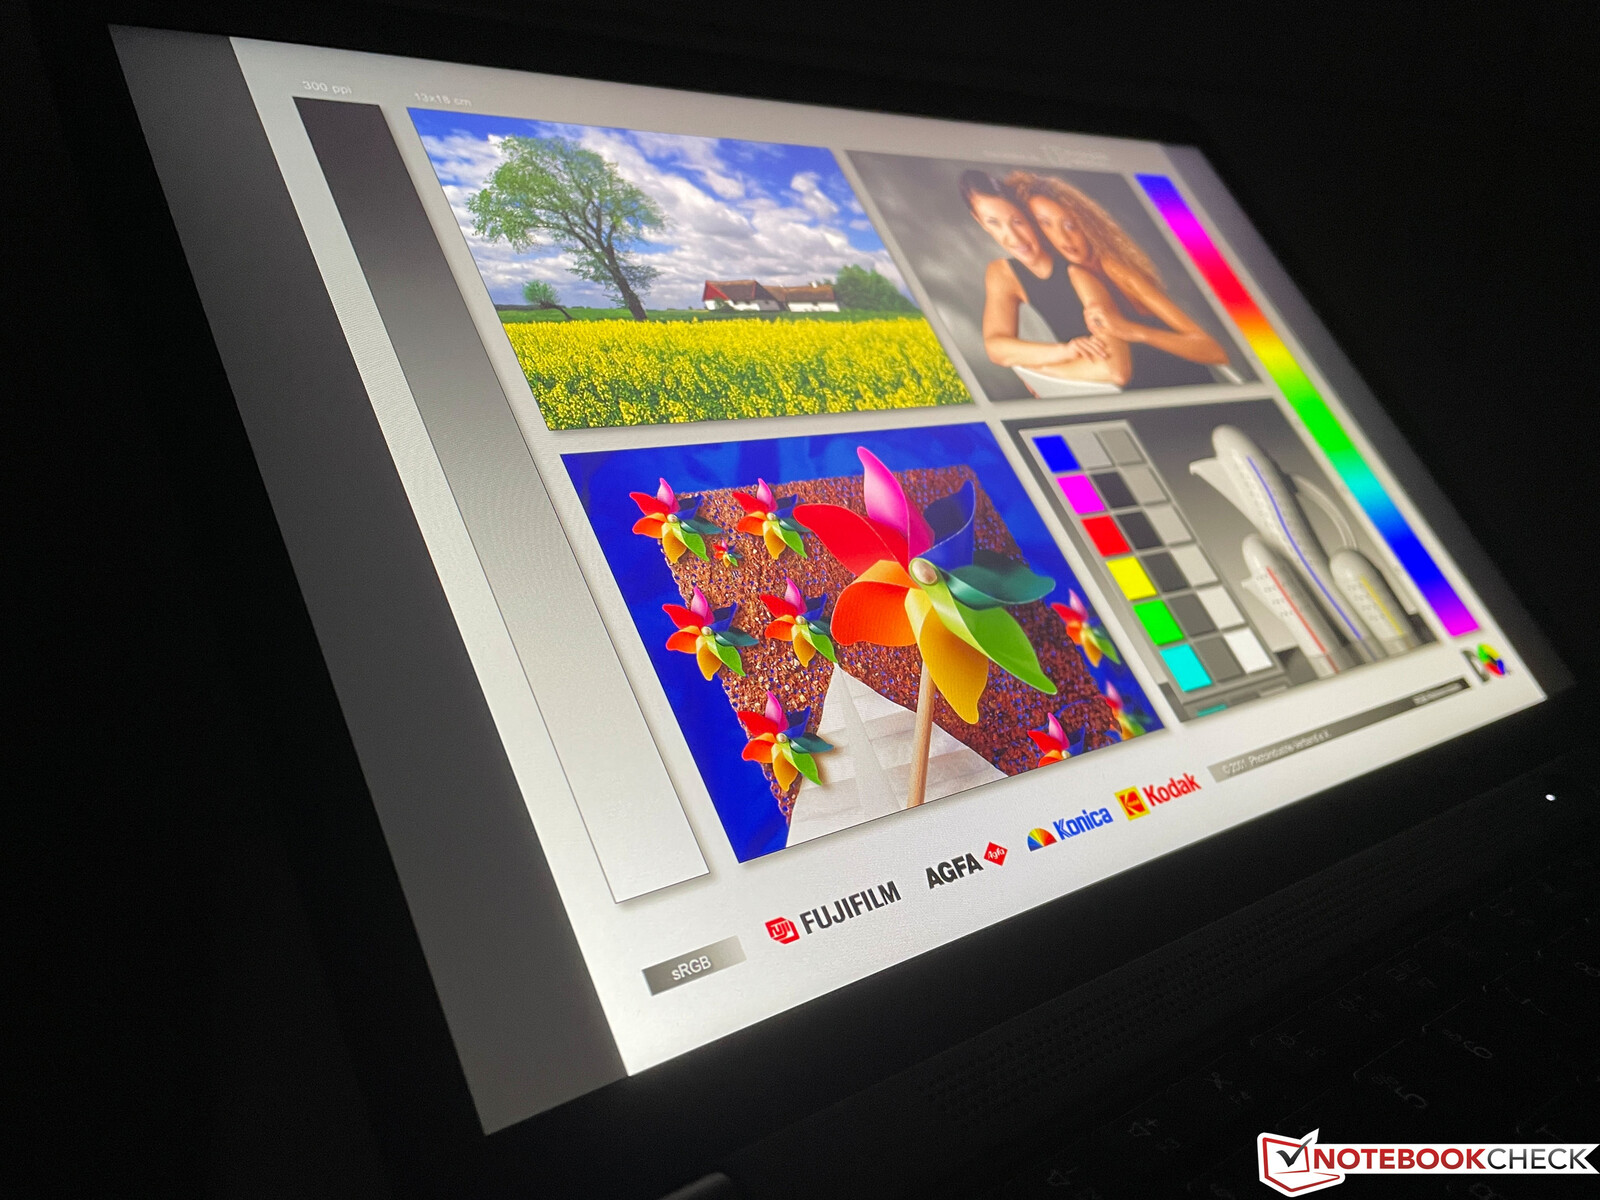
显示屏 - 13.3英寸,现在为16:10
联想为X13 G2配备了哑光的13.3英寸IPS屏幕,长宽比为16:10。你可以在四个不同的选项中选择。
- WUXGA (1920 x 1200, 300 cd/m²)
- WUXGA (1920 x 1200, Touch, 300 cd/m²)
- WUXGA (1920 x 1200, Privacy Guard, 500cd/m²)
- WQXGA (2560 x 1600, LowPower, 400cd/m²)
我们已经有机会审查了X13 Yoga G2的WQXGA面板。X13 Yoga G2我们的X13 G2评测单元配备的是默认的WUXGA显示屏,亮度为300尼特。我们对屏幕略感失望;我们希望看到至少400尼特和我们从联想14英寸产品系列中了解到的低功率屏幕。
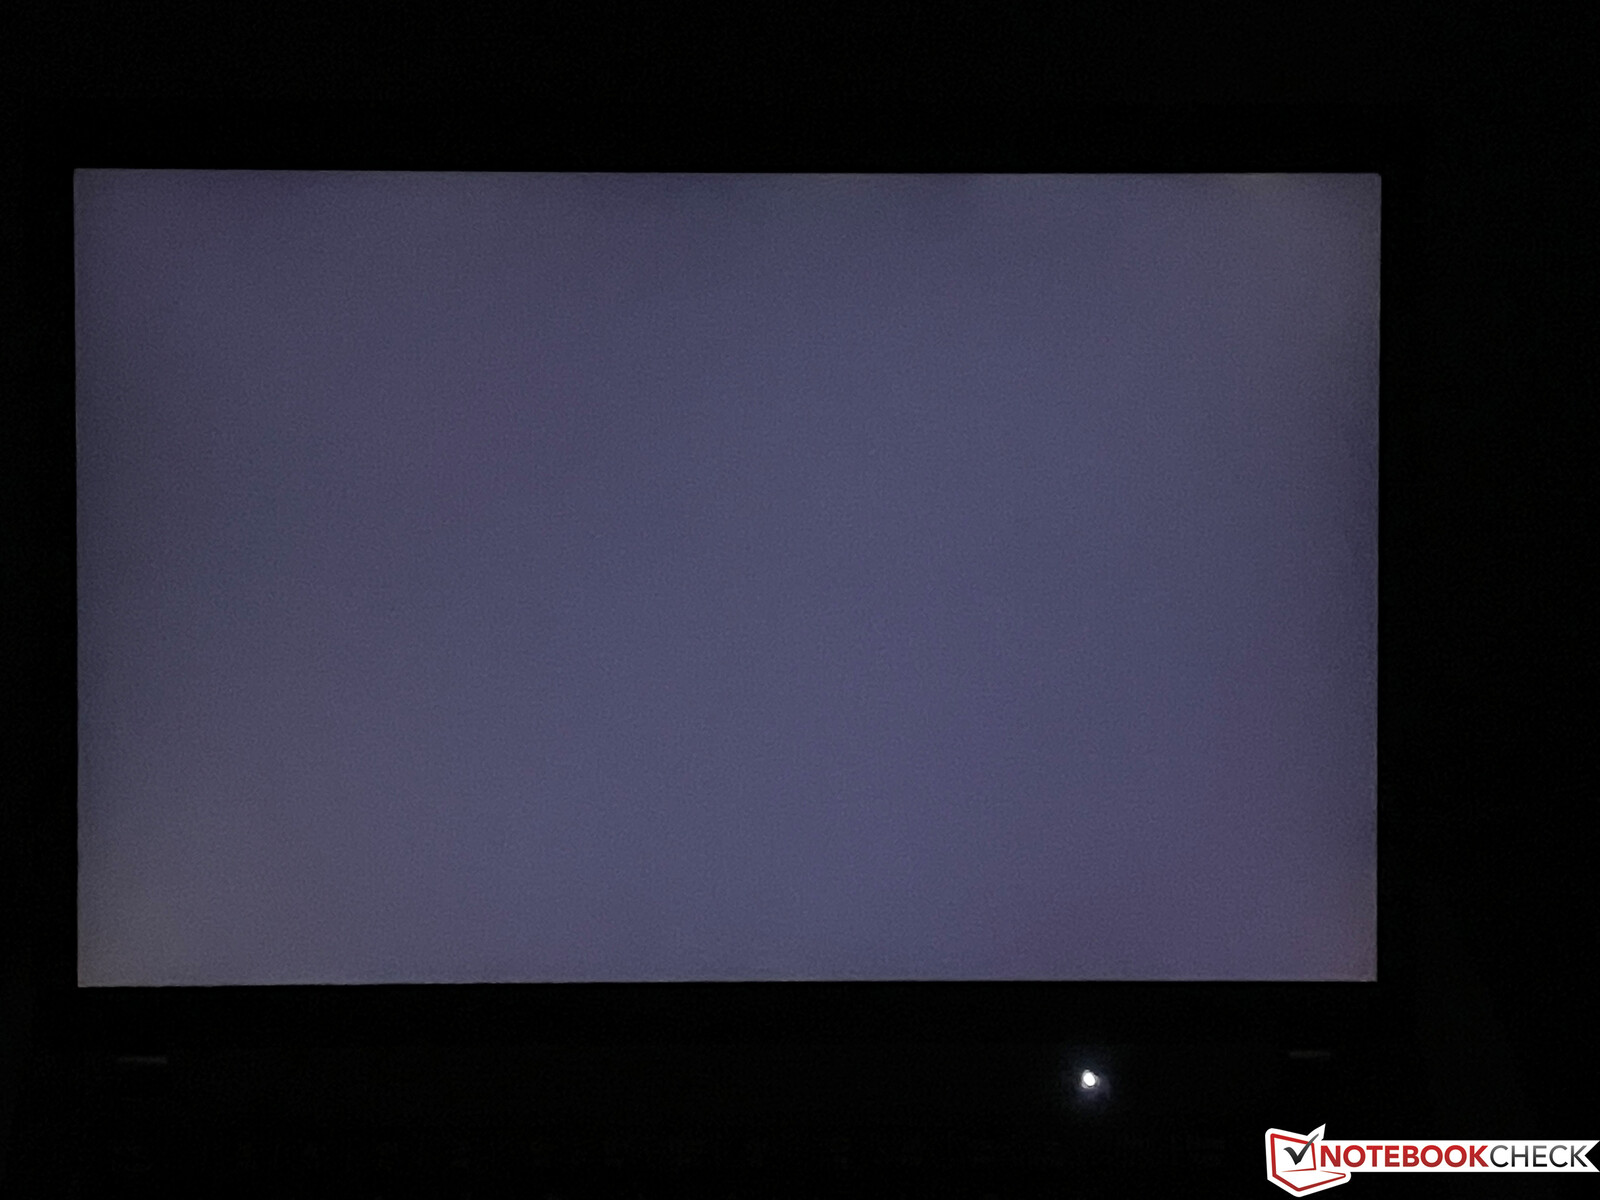
我们的测试装置管理的平均亮度为310尼特,对比度超过1300:1。画面的主观印象很好,即使是明亮的表面看起来也不会有太多的颗粒感。我们没有发现任何PWM闪烁,IPS屏幕的视角稳定性非常好。背光渗漏不是什么大问题;当你使用最大亮度与深色背景相结合时,只在上边缘有一些亮点。
| |||||||||||||||||||||||||
Brightness Distribution: 89 %
Center on Battery: 319 cd/m²
Contrast: 1333:1 (Black: 0.24 cd/m²)
ΔE ColorChecker Calman: 2.7 | ∀{0.5-29.43 Ø4.71}
calibrated: 0.9
ΔE Greyscale Calman: 4.1 | ∀{0.09-98 Ø4.96}
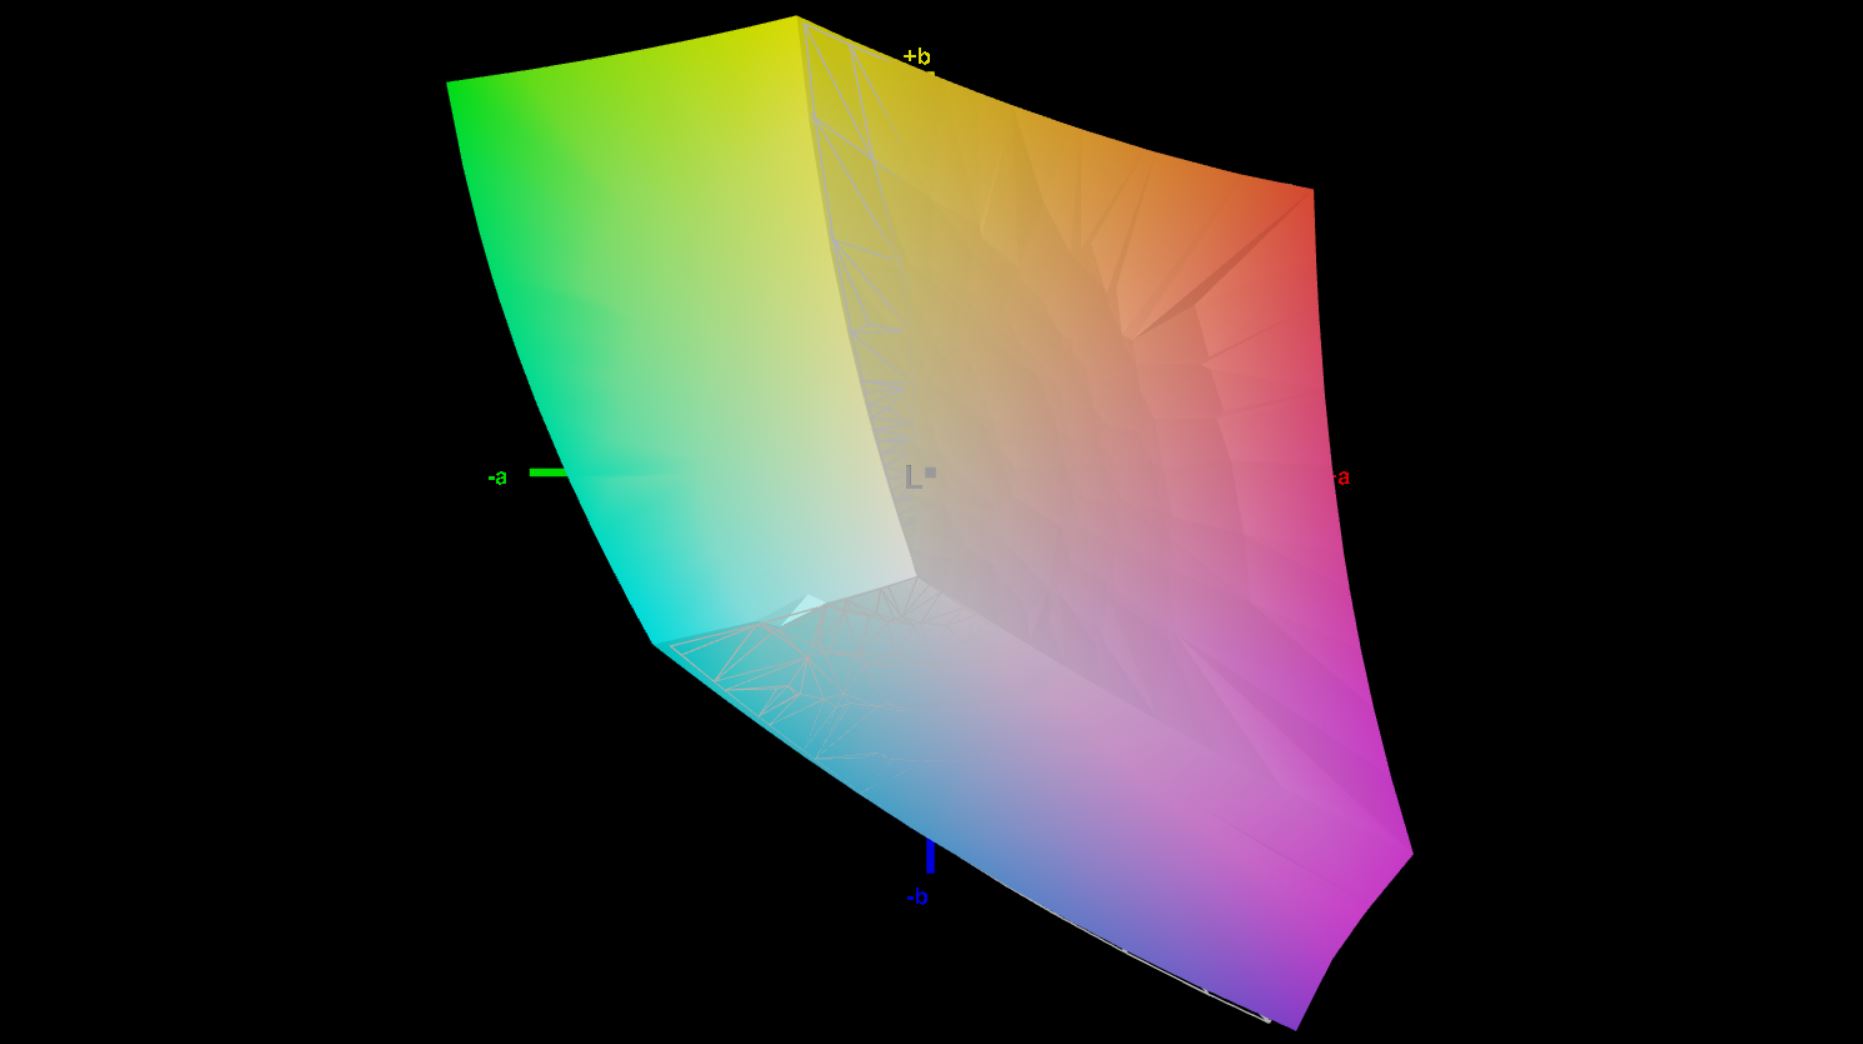
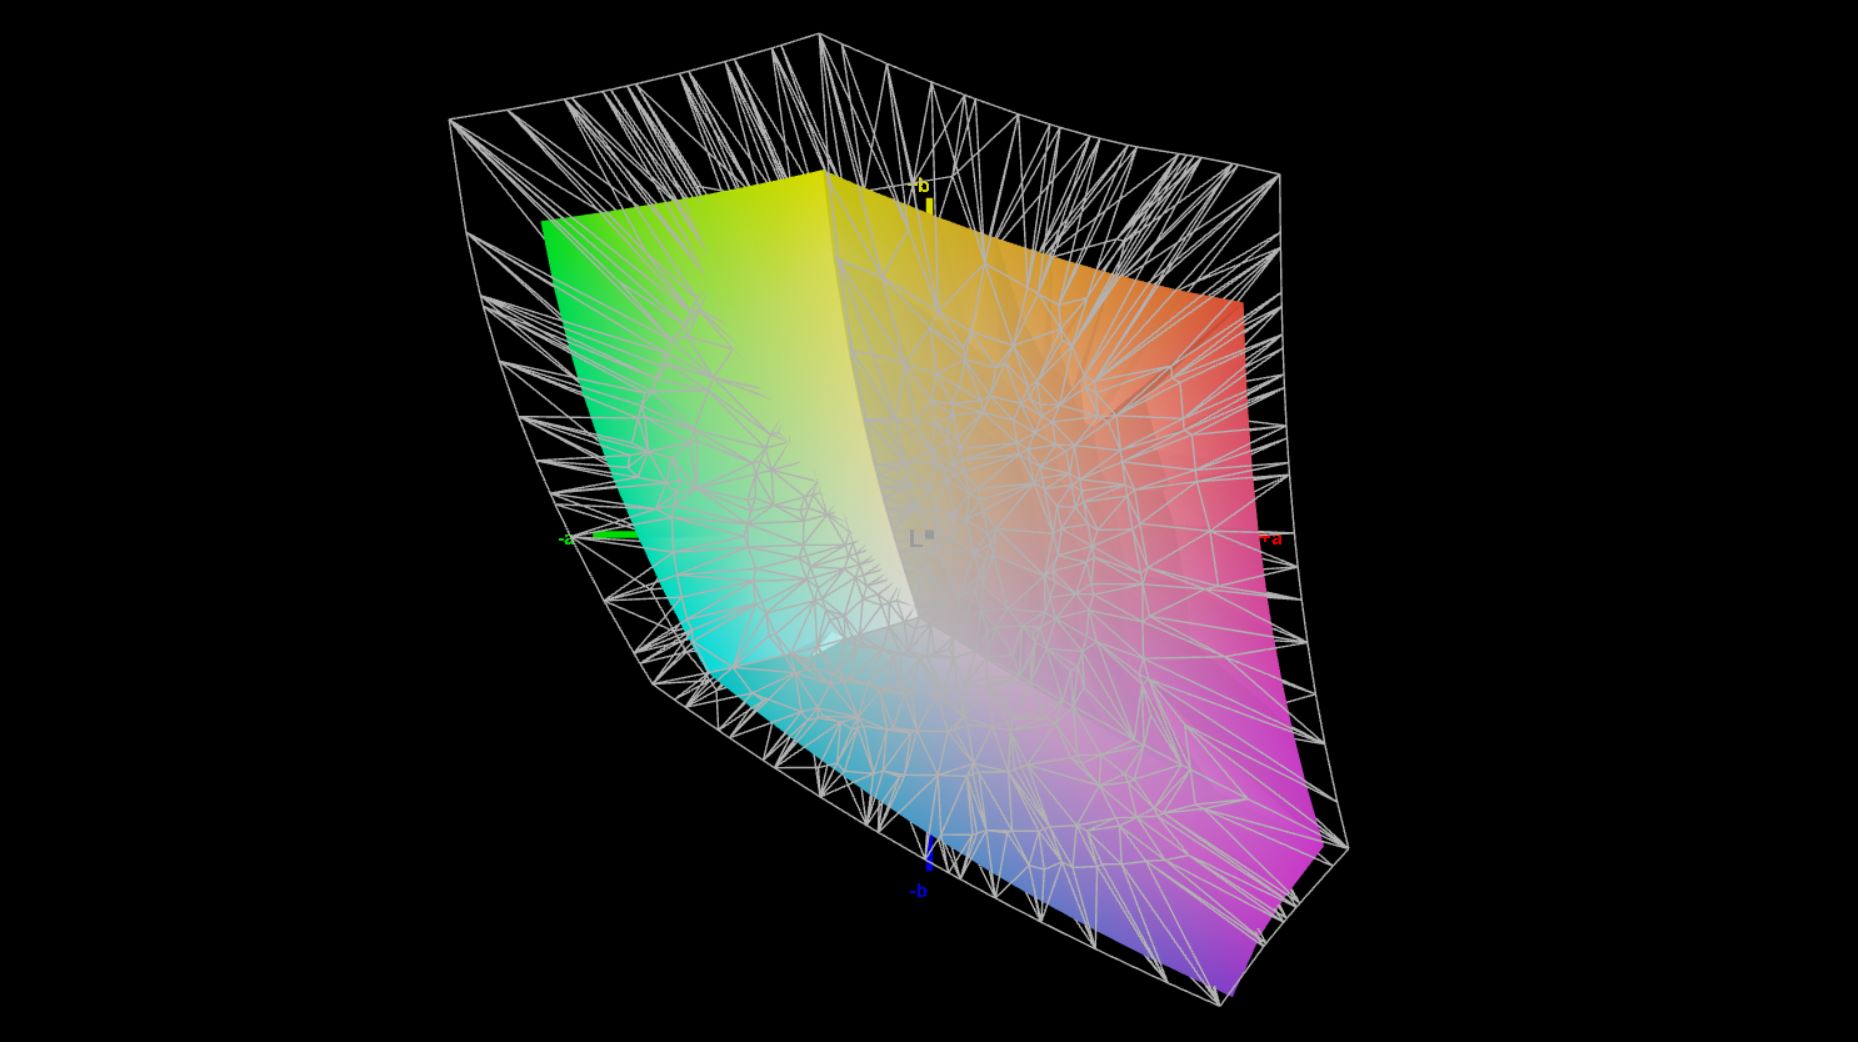
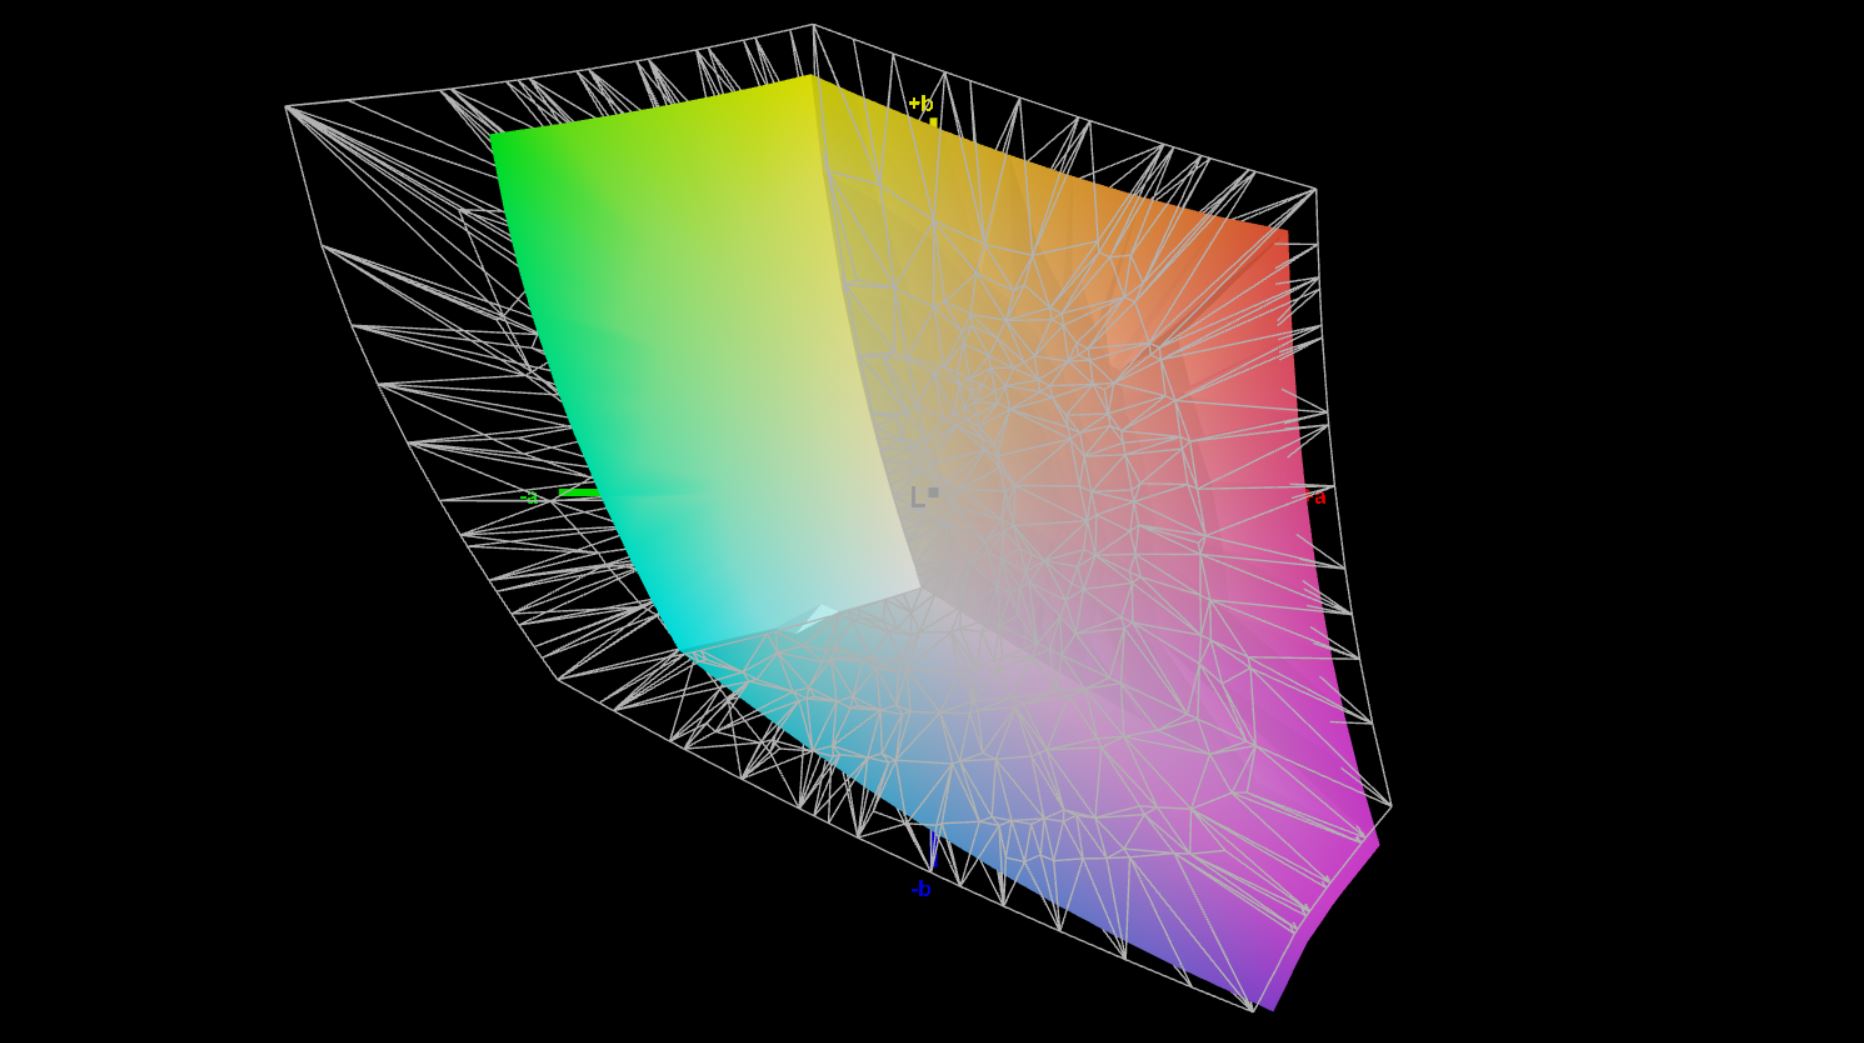
71.1% AdobeRGB 1998 (Argyll 3D)
99.7% sRGB (Argyll 3D)
71.1% Display P3 (Argyll 3D)
Gamma: 2.24
CCT: 6429 K
| Lenovo ThinkPad X13 G2 20WK0024GE NV133WUM-N61, IPS, 1920x1200, 13.3" | Dell XPS 13 9310 Core i7 FHD Sharp LQ134N1, IPS, 1920x1200, 13.4" | Apple MacBook Pro 13 Late 2020 M1 Entry (8 / 256 GB) IPS, 2560x1600, 13.3" | HP EliteBook 830 G7 Chi Mei CMN13A9, IPS, 1920x1080, 13.3" | Huawei MateBook X Pro 2021 TIANMA XM, IPS, 3000x2000, 13.9" | Lenovo ThinkPad X13-20UGS00800 B133HAK01.1, IPS LED, 1920x1080, 13.3" | Lenovo ThinkPad X13 Yoga G2 LP133WQ1-SPF2, IPS LED, 2560x1600, 13.3" | |
|---|---|---|---|---|---|---|---|
| Display | 1% | -5% | -7% | -7% | -2% | ||
| Display P3 Coverage (%) | 71.1 | 70.9 0% | 65.7 -8% | 64.9 -9% | 64.8 -9% | 68.3 -4% | |
| sRGB Coverage (%) | 99.7 | 99.1 -1% | 97.4 -2% | 94.4 -5% | 95.6 -4% | 99.1 -1% | |
| AdobeRGB 1998 Coverage (%) | 71.1 | 72.9 3% | 67.4 -5% | 66.3 -7% | 65.7 -8% | 70.3 -1% | |
| Response Times | -81% | -52% | -69% | -38% | -79% | -78% | |
| Response Time Grey 50% / Grey 80% * (ms) | 30.8 ? | 52 ? -69% | 48 ? -56% | 46.8 ? -52% | 37.6 ? -22% | 56.8 ? -84% | 52 ? -69% |
| Response Time Black / White * (ms) | 17.2 ? | 33.2 ? -93% | 25.2 ? -47% | 32 ? -86% | 26.4 ? -53% | 30 ? -74% | 32 ? -86% |
| PWM Frequency (Hz) | 2475 ? | 122000 ? | 26600 ? | ||||
| Screen | 2% | 37% | 2% | 24% | -23% | 30% | |
| Brightness middle (cd/m²) | 320 | 543.3 70% | 510 59% | 454.5 42% | 502 57% | 331 3% | 460 44% |
| Brightness (cd/m²) | 310 | 524 69% | 491 58% | 435 40% | 474 53% | 315 2% | 423 36% |
| Brightness Distribution (%) | 89 | 92 3% | 94 6% | 91 2% | 89 0% | 90 1% | 85 -4% |
| Black Level * (cd/m²) | 0.24 | 0.38 -58% | 0.29 -21% | 0.27 -13% | 0.33 -38% | 0.21 12% | 0.33 -38% |
| Contrast (:1) | 1333 | 1430 7% | 1759 32% | 1683 26% | 1521 14% | 1576 18% | 1394 5% |
| Colorchecker dE 2000 * | 2.7 | 3.02 -12% | 1.3 52% | 3.12 -16% | 1.35 50% | 6.1 -126% | 1 63% |
| Colorchecker dE 2000 max. * | 7.6 | 7.61 -0% | 3 61% | 4.85 36% | 3.67 52% | 10 -32% | 1.5 80% |
| Colorchecker dE 2000 calibrated * | 0.9 | 1.23 -37% | 1.97 -119% | 1.2 -33% | 1.2 -33% | 0.8 11% | |
| Greyscale dE 2000 * | 4.1 | 5 -22% | 2 51% | 3.1 24% | 1.7 59% | 6.3 -54% | 1.2 71% |
| Gamma | 2.24 98% | 2.02 109% | 2.23 99% | 2.01 109% | 2.24 98% | 2.77 79% | 2.26 97% |
| CCT | 6429 101% | 6550 99% | 6933 94% | 6902 94% | 6440 101% | 6938 94% | 6652 98% |
| Color Space (Percent of AdobeRGB 1998) (%) | 66.8 | 88.3 | 61.5 | 61.1 | 60.7 | 64.4 | |
| Color Space (Percent of sRGB) (%) | 99.6 | 100 | 97 | 94.3 | 95.4 | 99.12 | |
| Total Average (Program / Settings) | -26% /
-10% | -8% /
20% | -24% /
-9% | -7% /
8% | -36% /
-28% | -17% /
8% |
* ... smaller is better
开箱后的色彩准确性已经非常好,与sRGB色彩参考相比,所有的色彩都在目标偏差3以内。我们用专业的CalMAN软件进行的显示分析显示,在灰度上有轻微的偏色,偏向粉红色。然而,这只有在与经过校准的屏幕直接比较时才会明显。
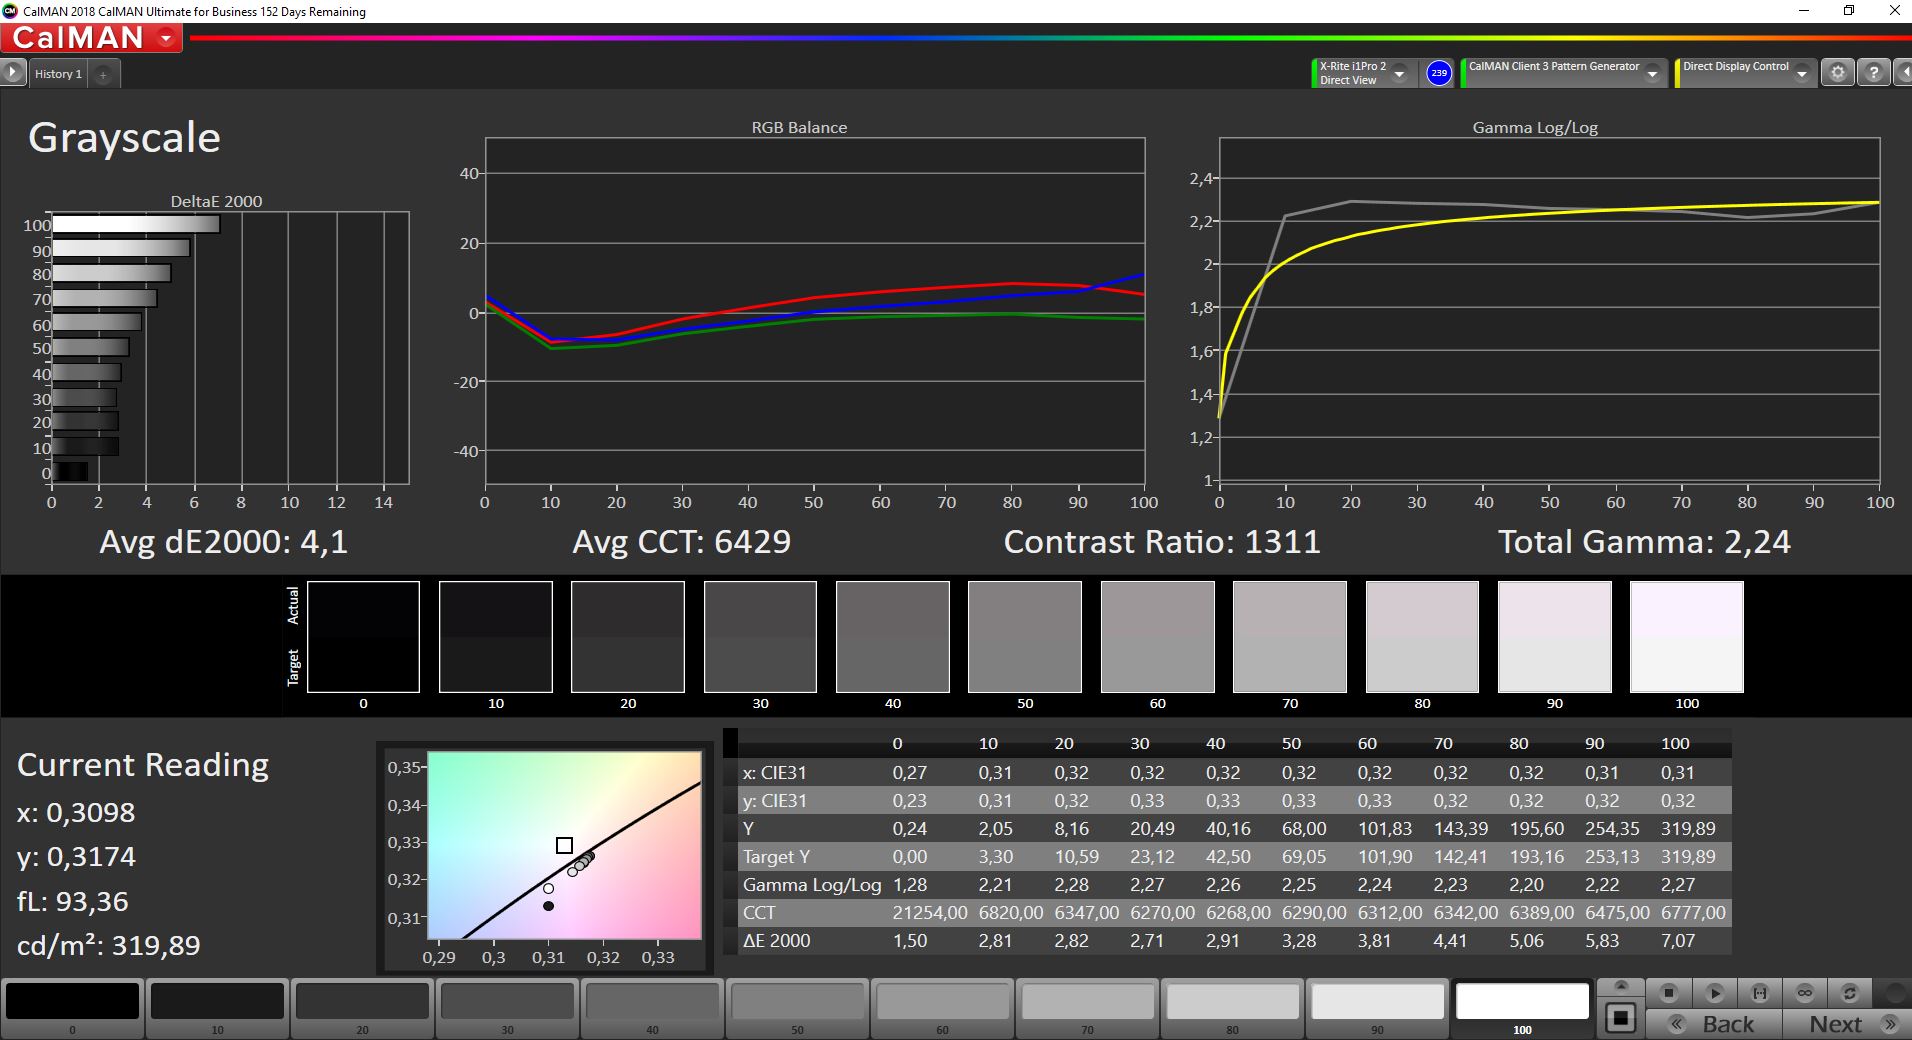
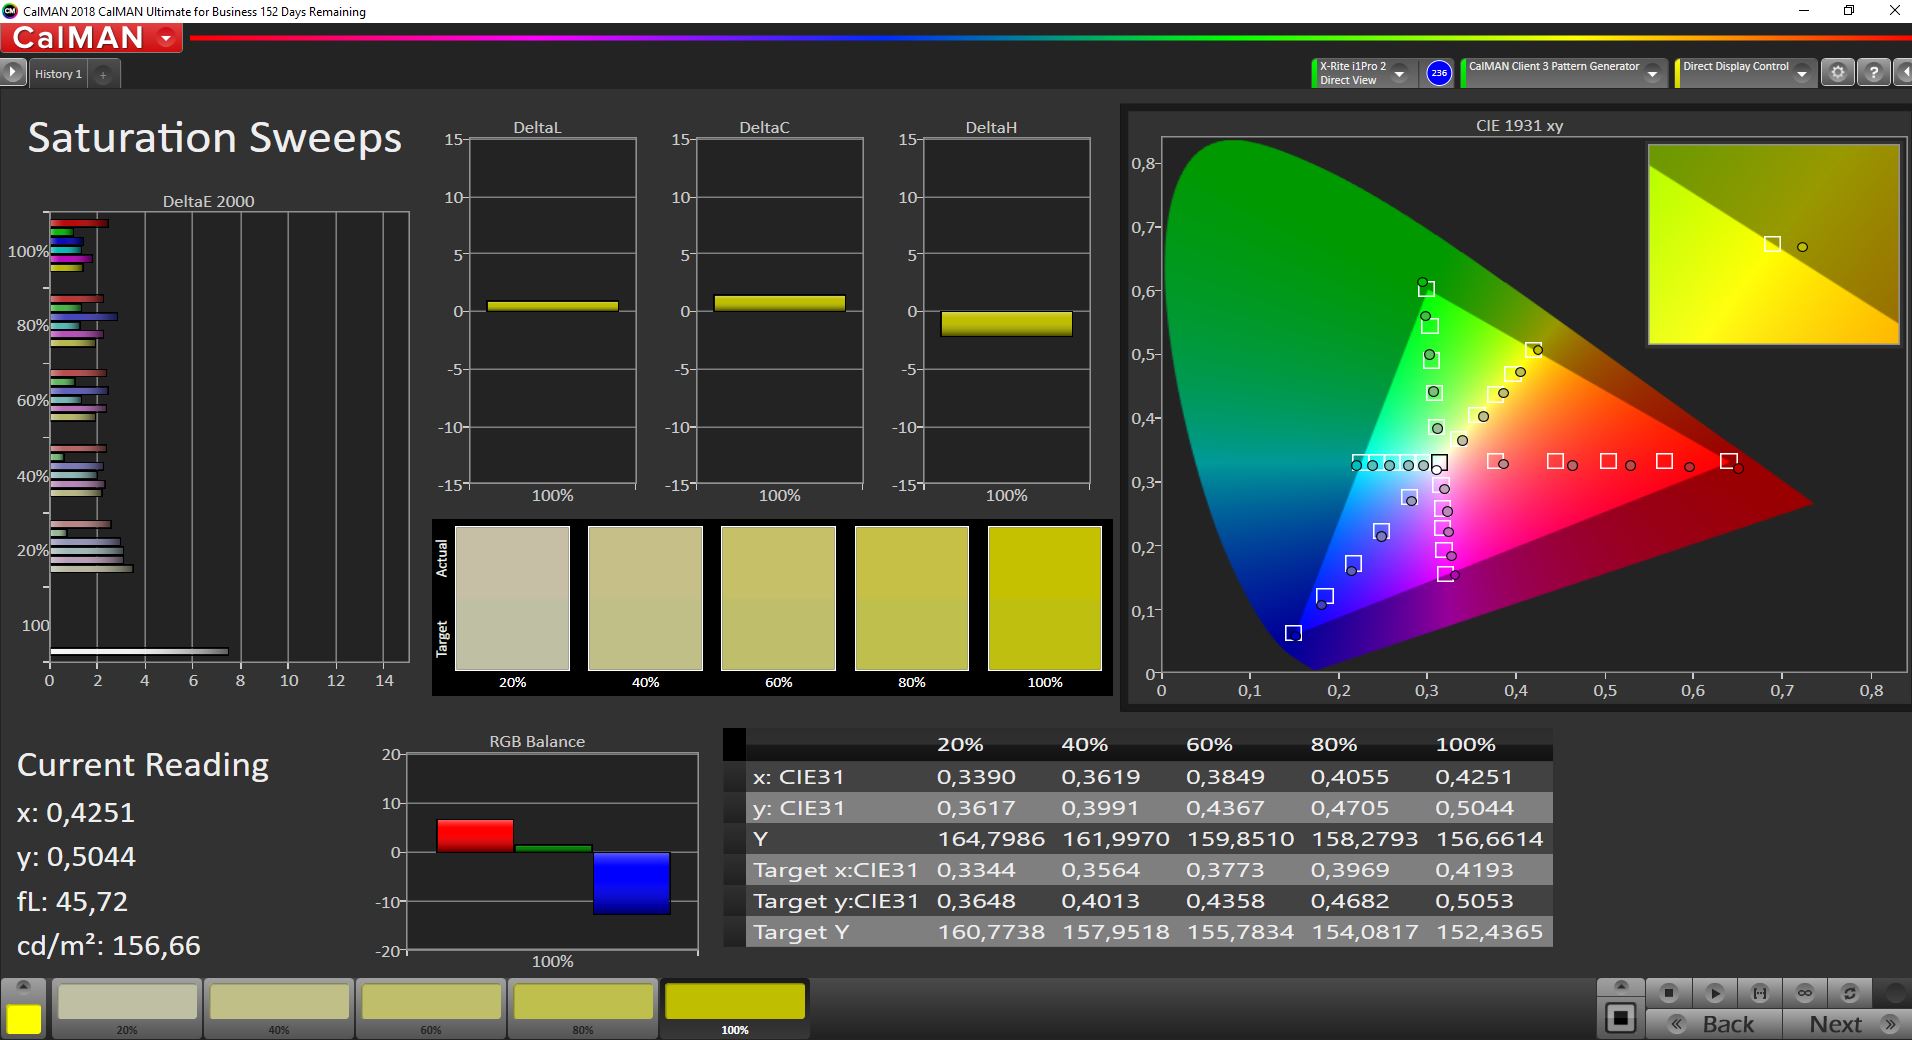
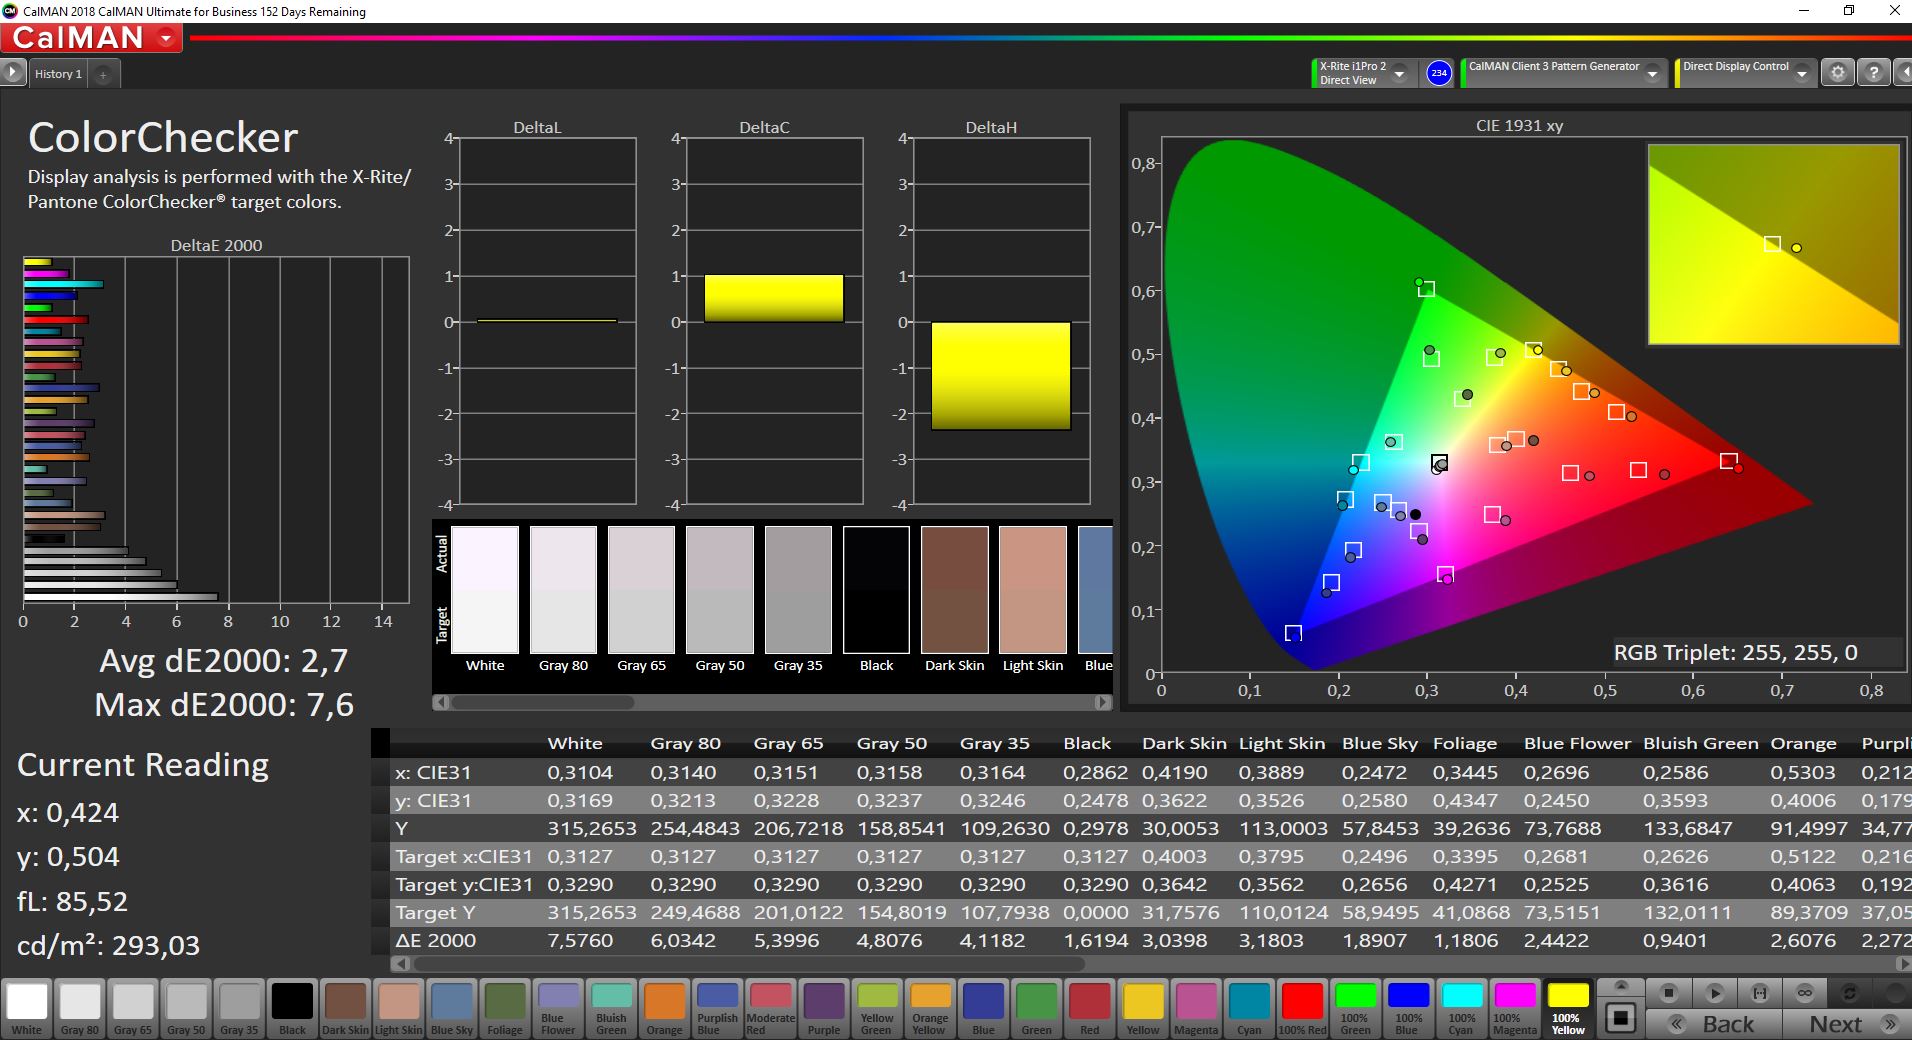
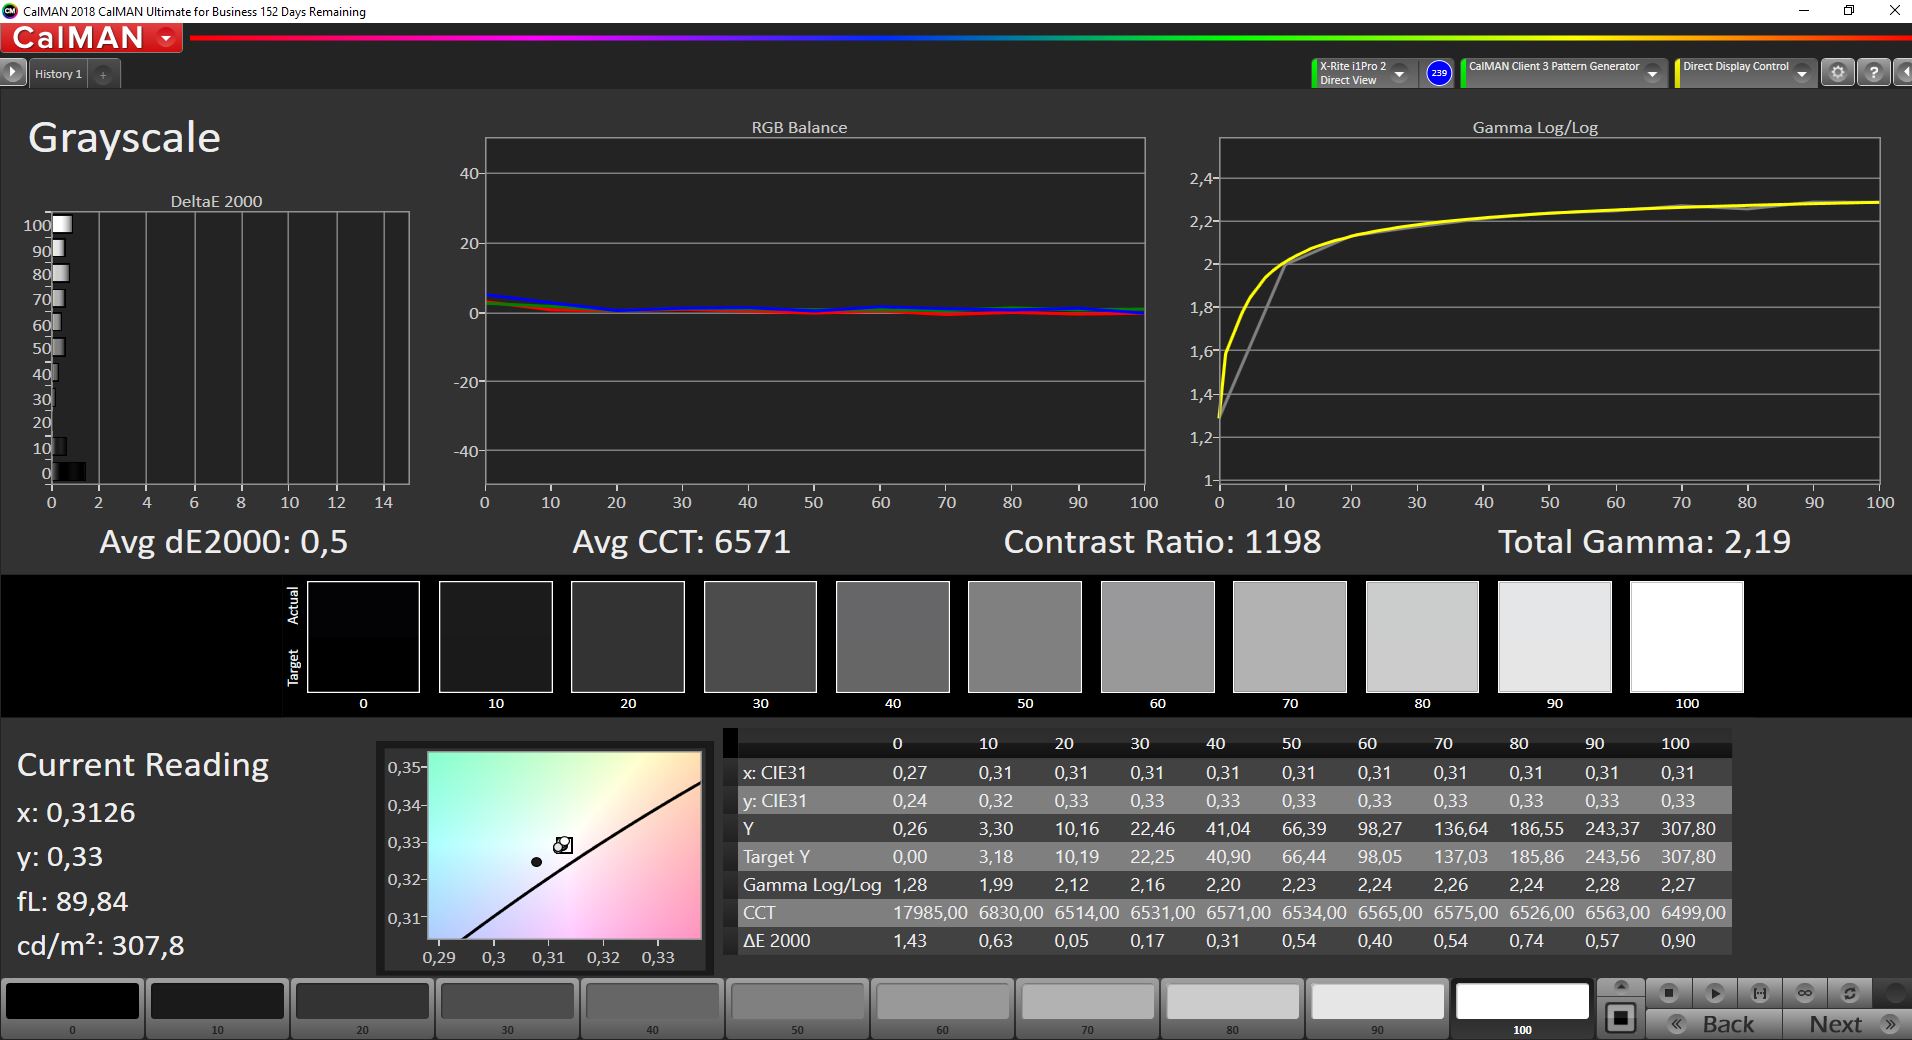
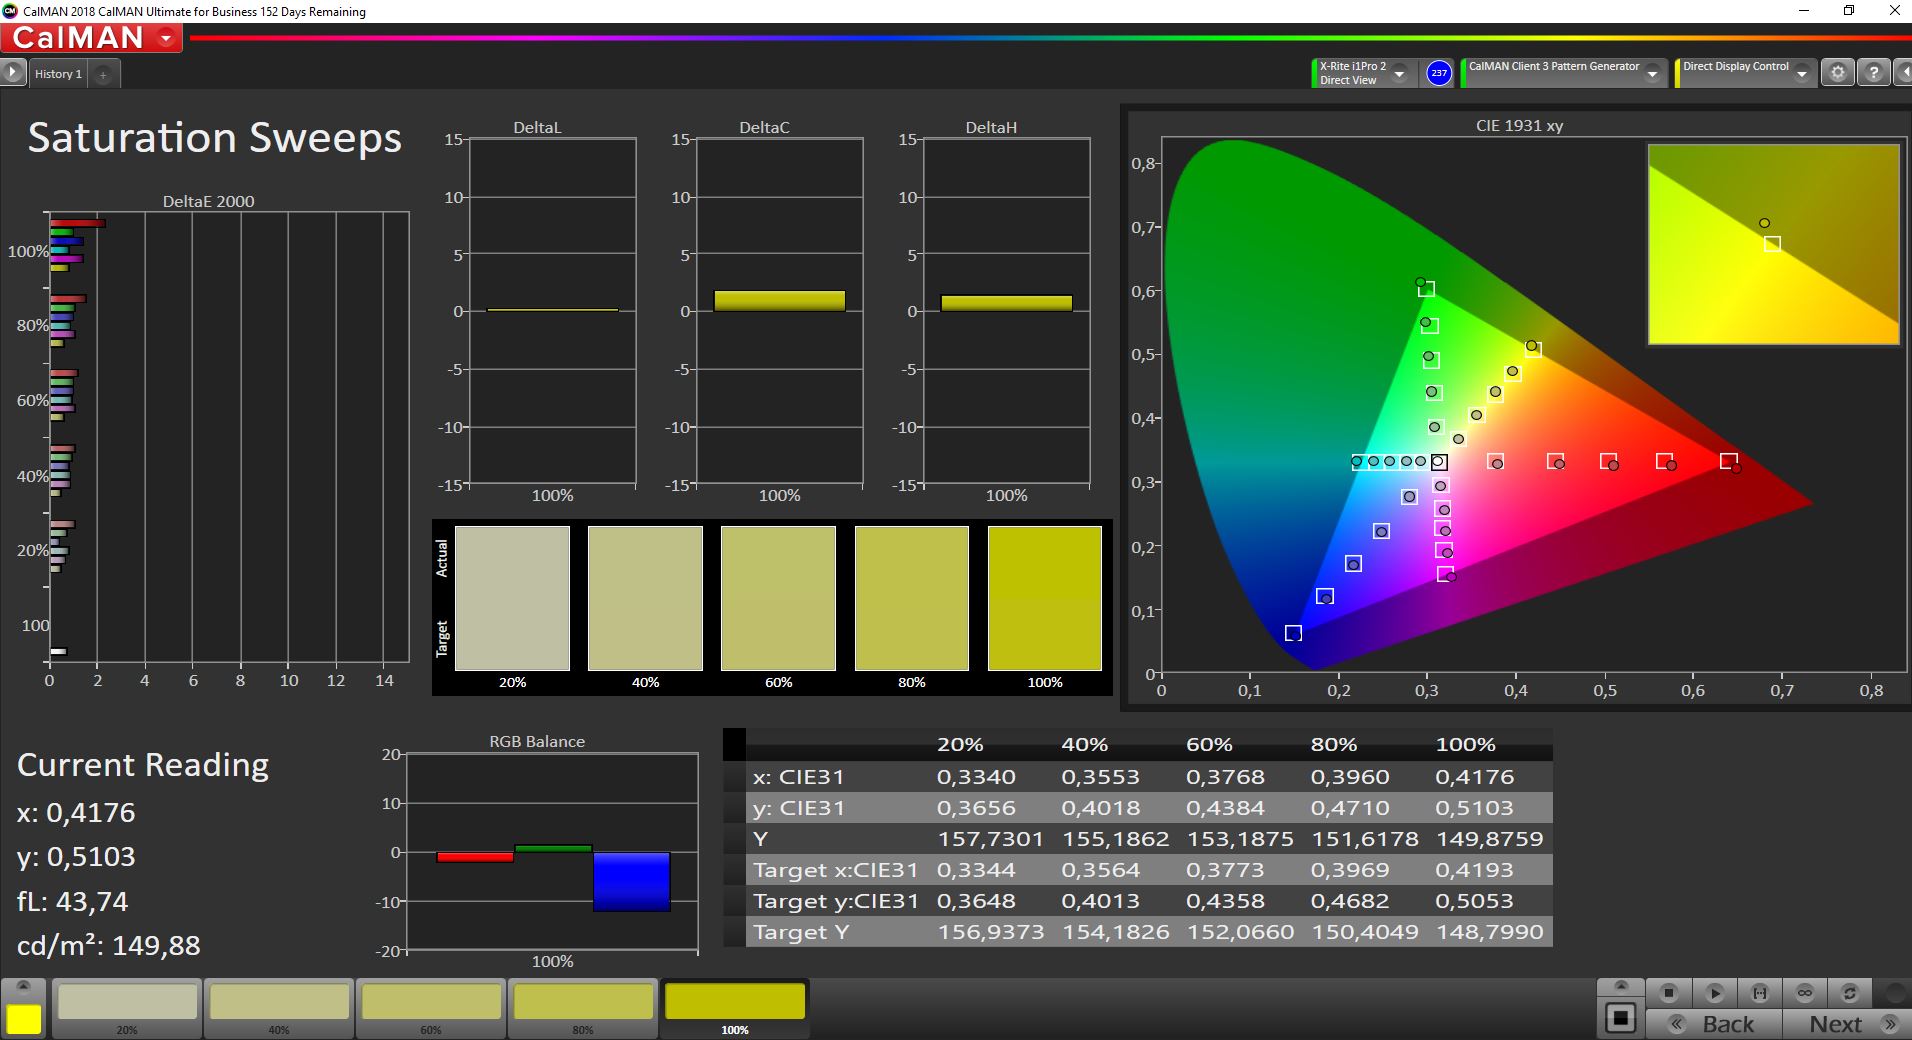
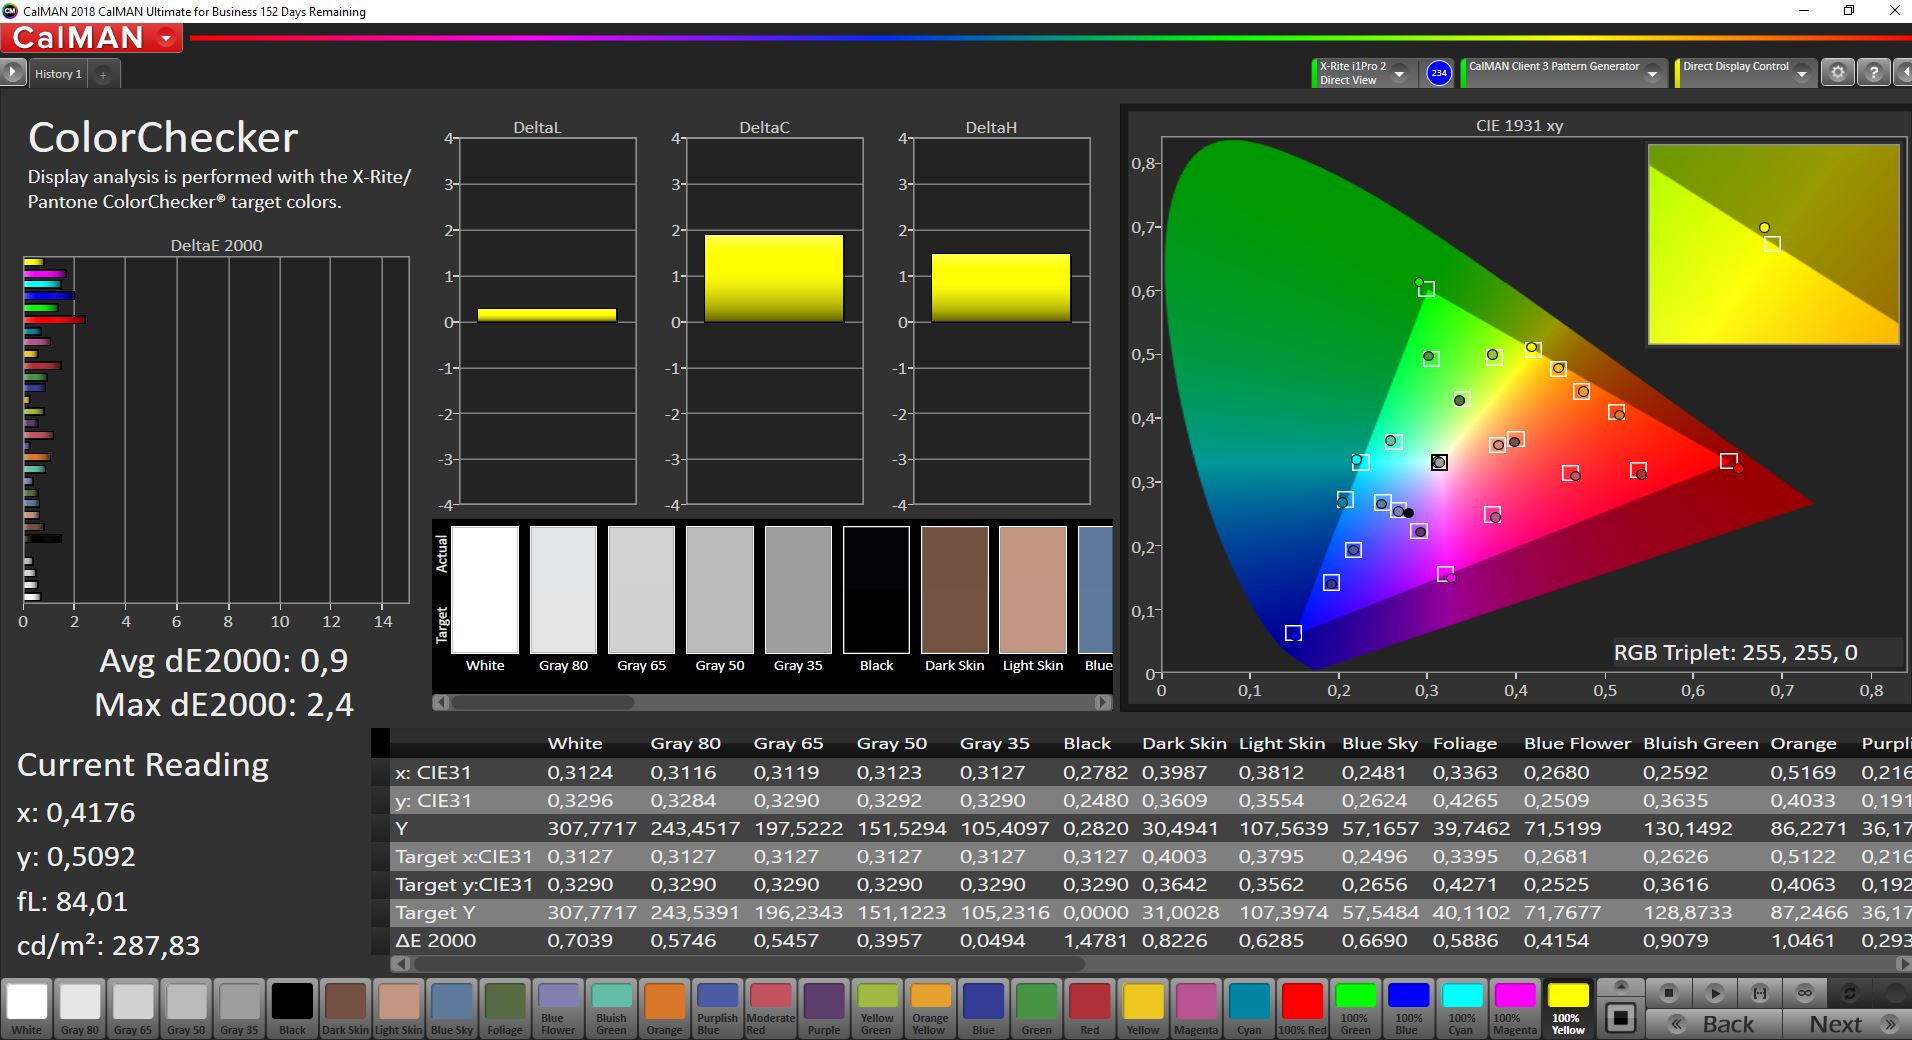
我们确实用X-Rite i1 Pro 2分光光度计校准了面板(配置文件可在上面免费下载),我们设法改善了灰度和色彩。小的sRGB色彩空间被完全覆盖,这意味着该面板适用于图片/视频编辑。
Display Response Times
| ↔ Response Time Black to White | ||
|---|---|---|
| 17.2 ms ... rise ↗ and fall ↘ combined | ↗ 8.4 ms rise | 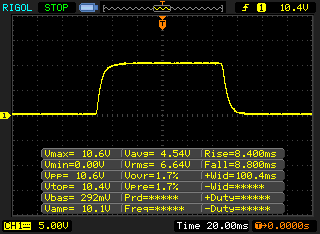 |
| ↘ 8.8 ms fall | ||
| The screen shows good response rates in our tests, but may be too slow for competitive gamers. In comparison, all tested devices range from 0.1 (minimum) to 240 (maximum) ms. » 39 % of all devices are better. This means that the measured response time is better than the average of all tested devices (19.8 ms). | ||
| ↔ Response Time 50% Grey to 80% Grey | ||
| 30.8 ms ... rise ↗ and fall ↘ combined | ↗ 14.8 ms rise | 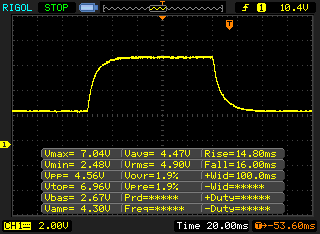 |
| ↘ 16 ms fall | ||
| The screen shows slow response rates in our tests and will be unsatisfactory for gamers. In comparison, all tested devices range from 0.165 (minimum) to 636 (maximum) ms. » 41 % of all devices are better. This means that the measured response time is similar to the average of all tested devices (30.9 ms). | ||
Screen Flickering / PWM (Pulse-Width Modulation)
| Screen flickering / PWM not detected |  | ||
In comparison: 52 % of all tested devices do not use PWM to dim the display. If PWM was detected, an average of 7741 (minimum: 5 - maximum: 343500) Hz was measured. | |||
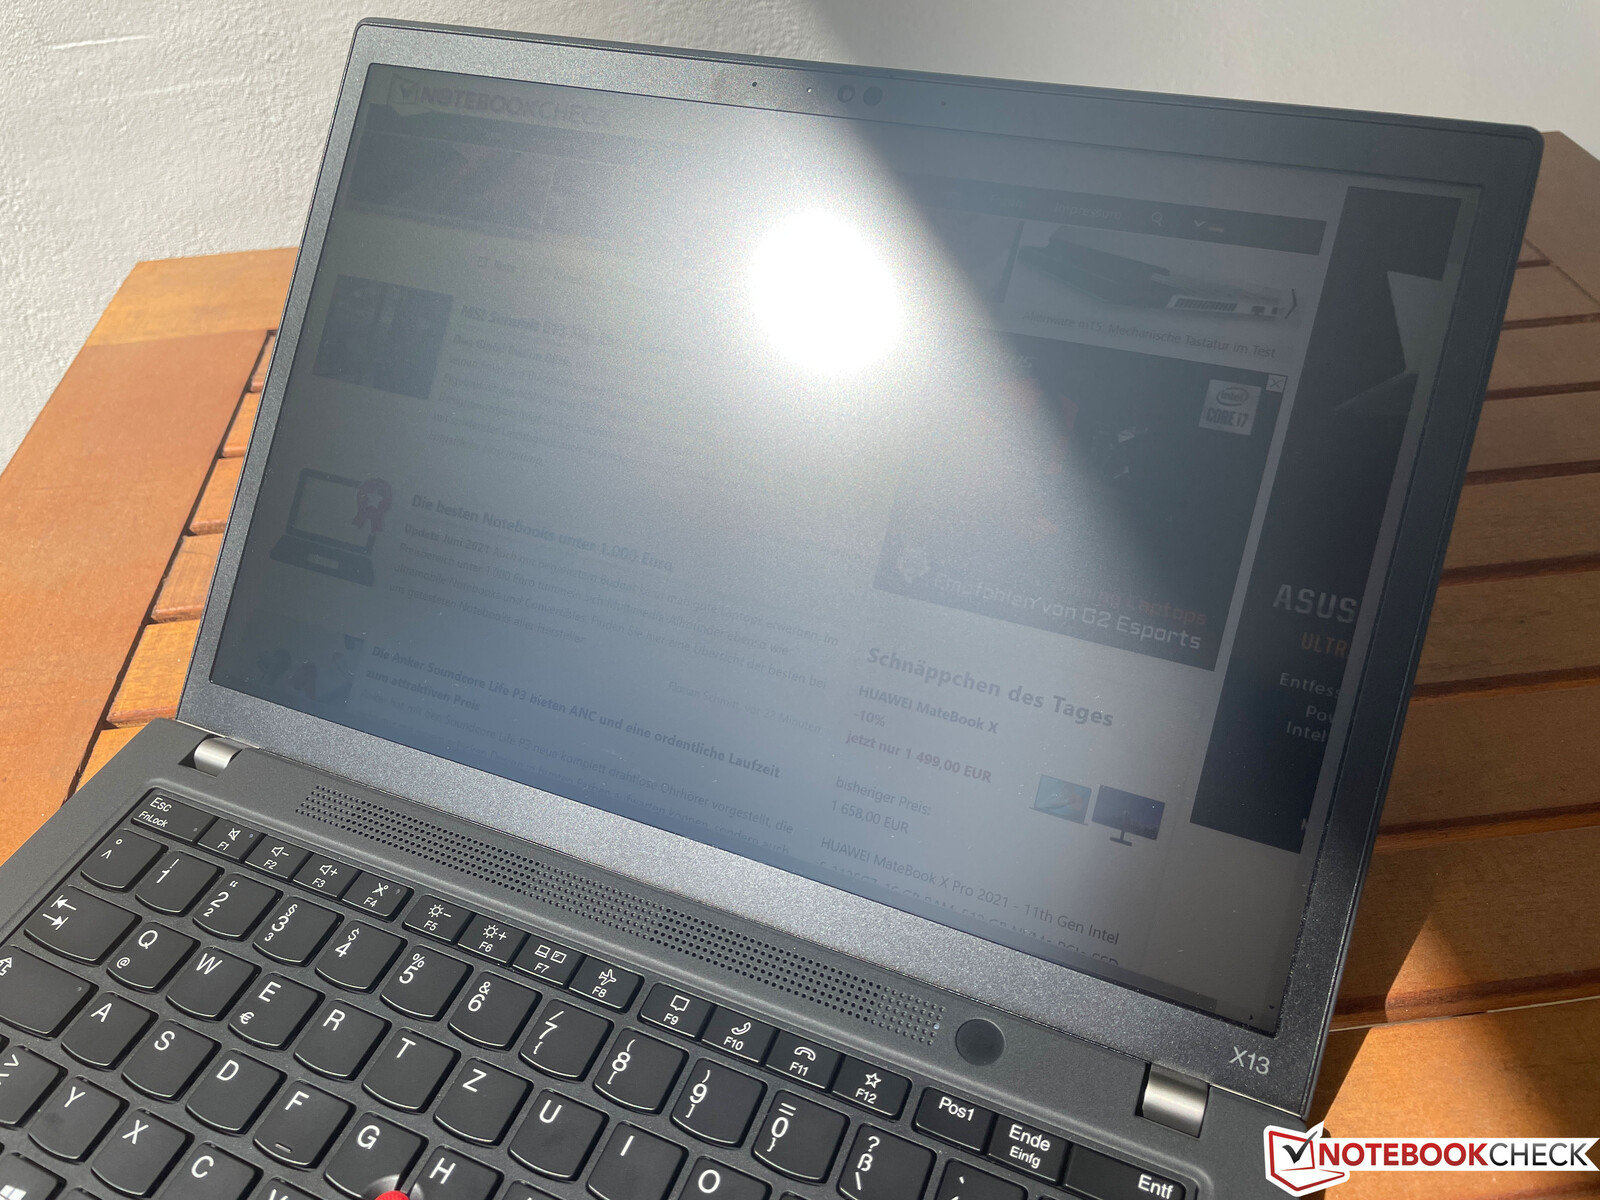
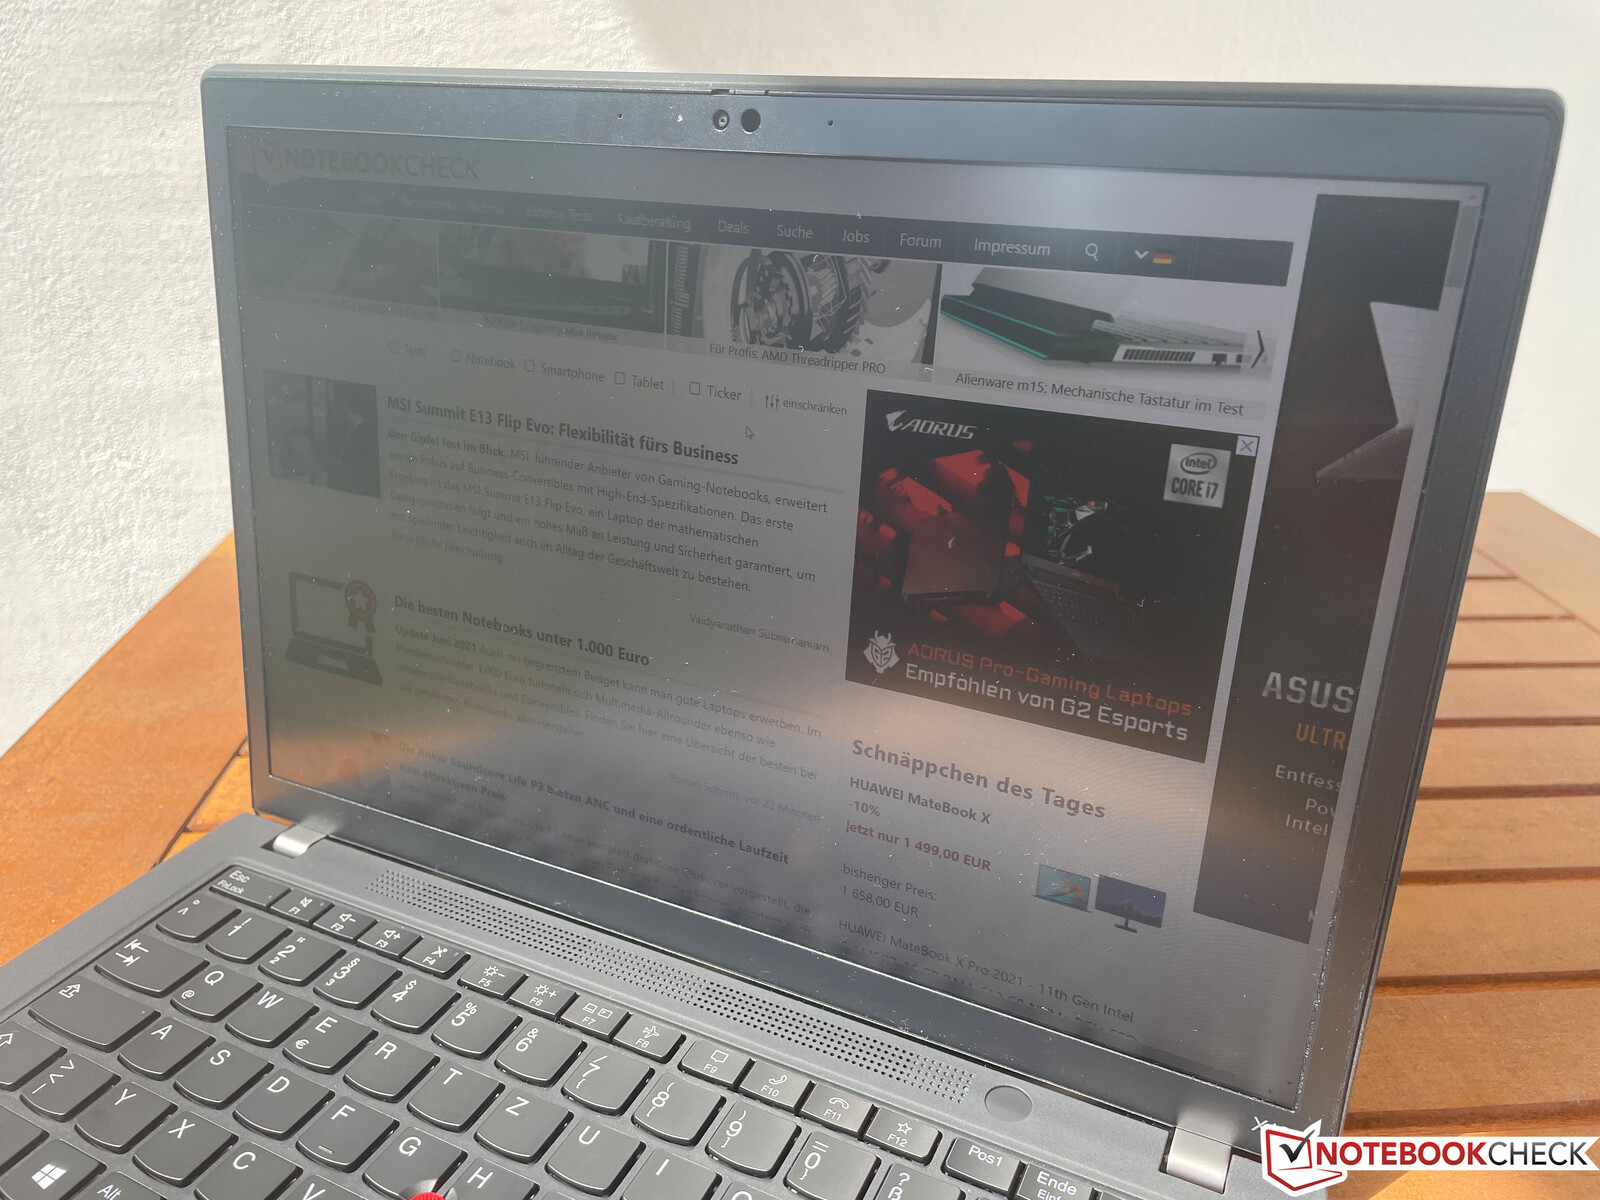
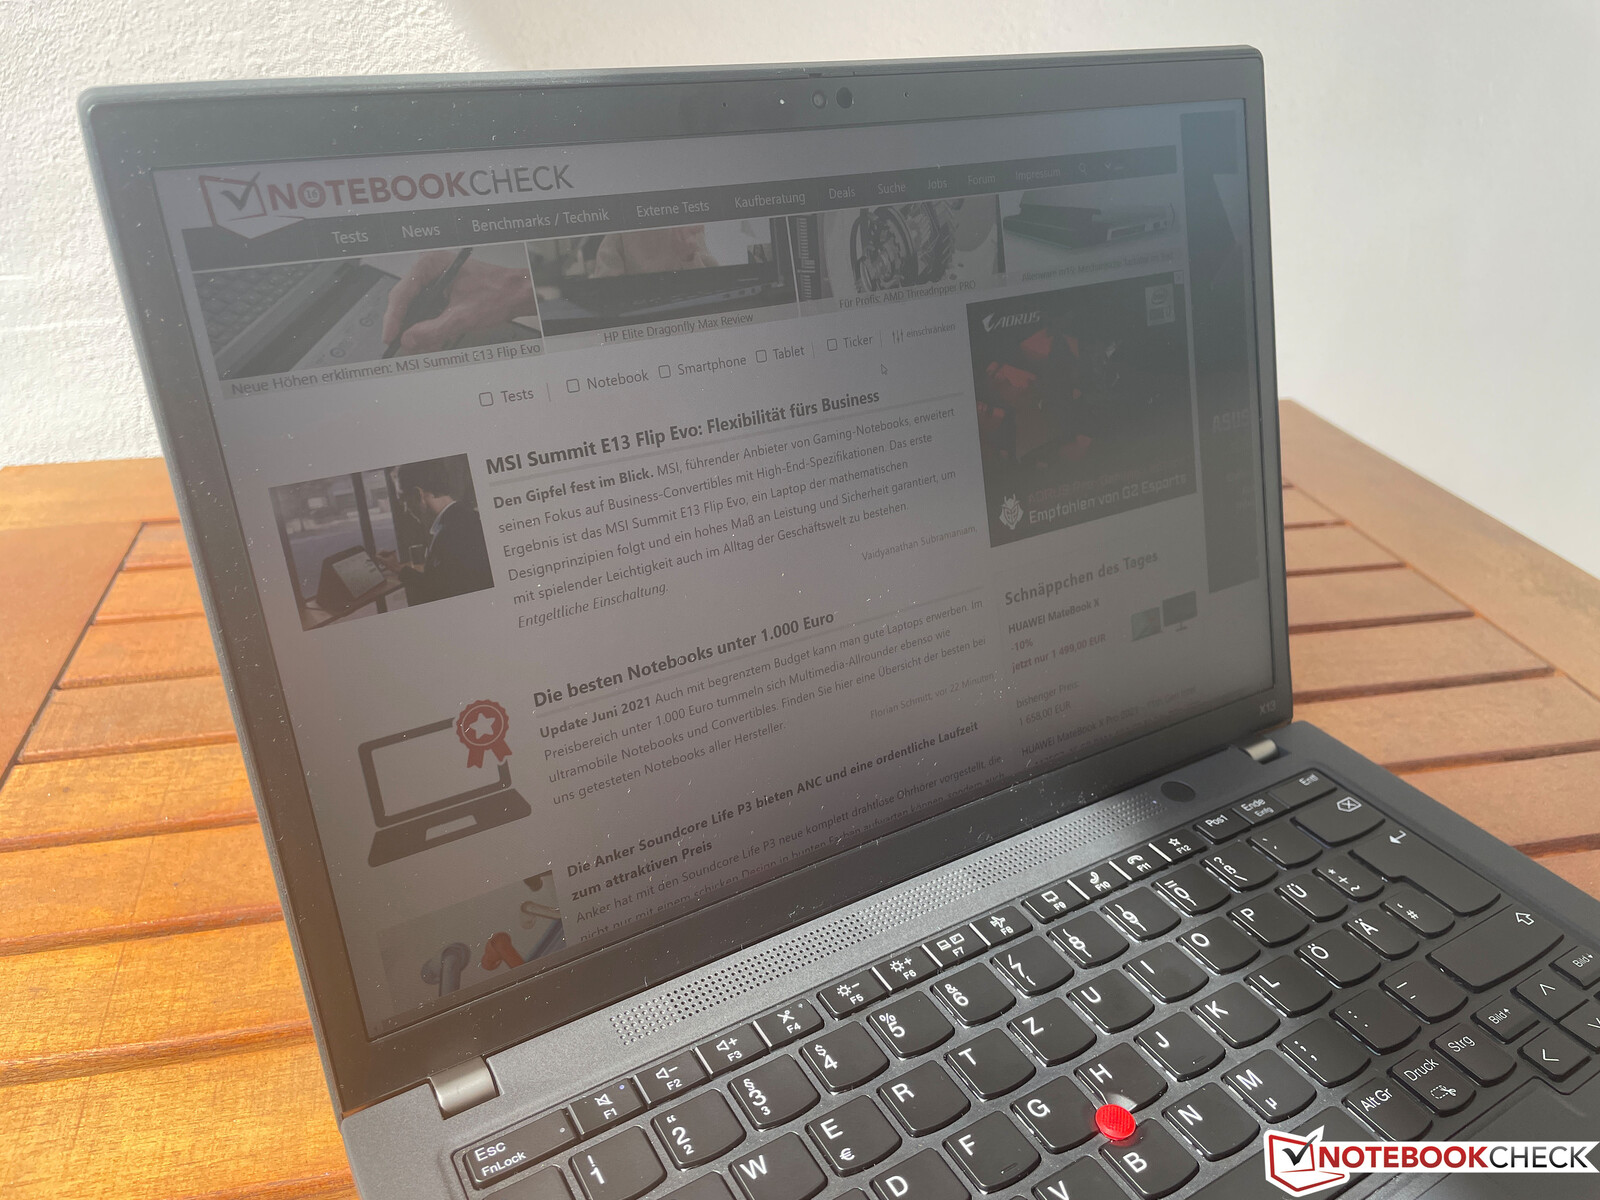
由于采用了哑光面板,在户外使用X13 G2是没有问题的。只要你避免阳光直射,你甚至可以在非常明亮的环境中看到内容。我们仍然希望有一个更明亮的面板,以获得更多的观看舒适度。
性能 -Tiger Lake 和焊接的RAM
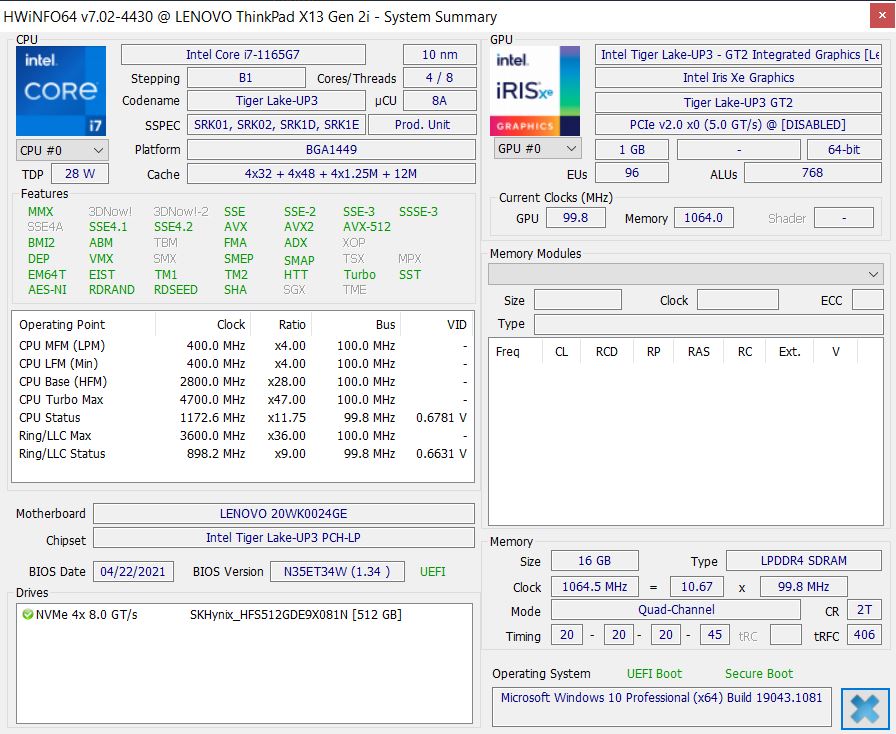
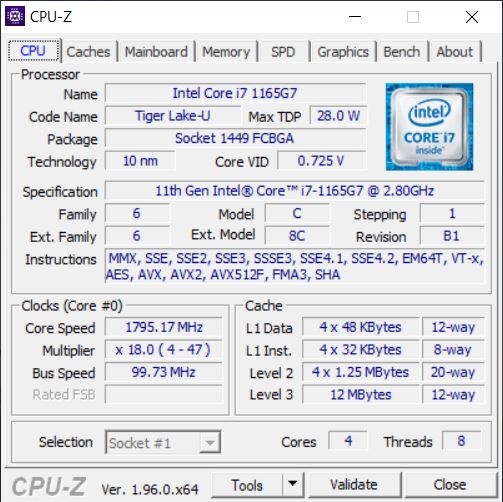
处理器 - 酷睿i7-1165G7
我们的评测单元使用熟悉的Tiger Lake 处理器酷睿i7-1165G7(UP3),一个核心的最高时钟为4.7GHz,当你强调所有四个核心(8个线程)时,最高时钟为4.1GHz。关于该处理器的更多信息可在 这里.
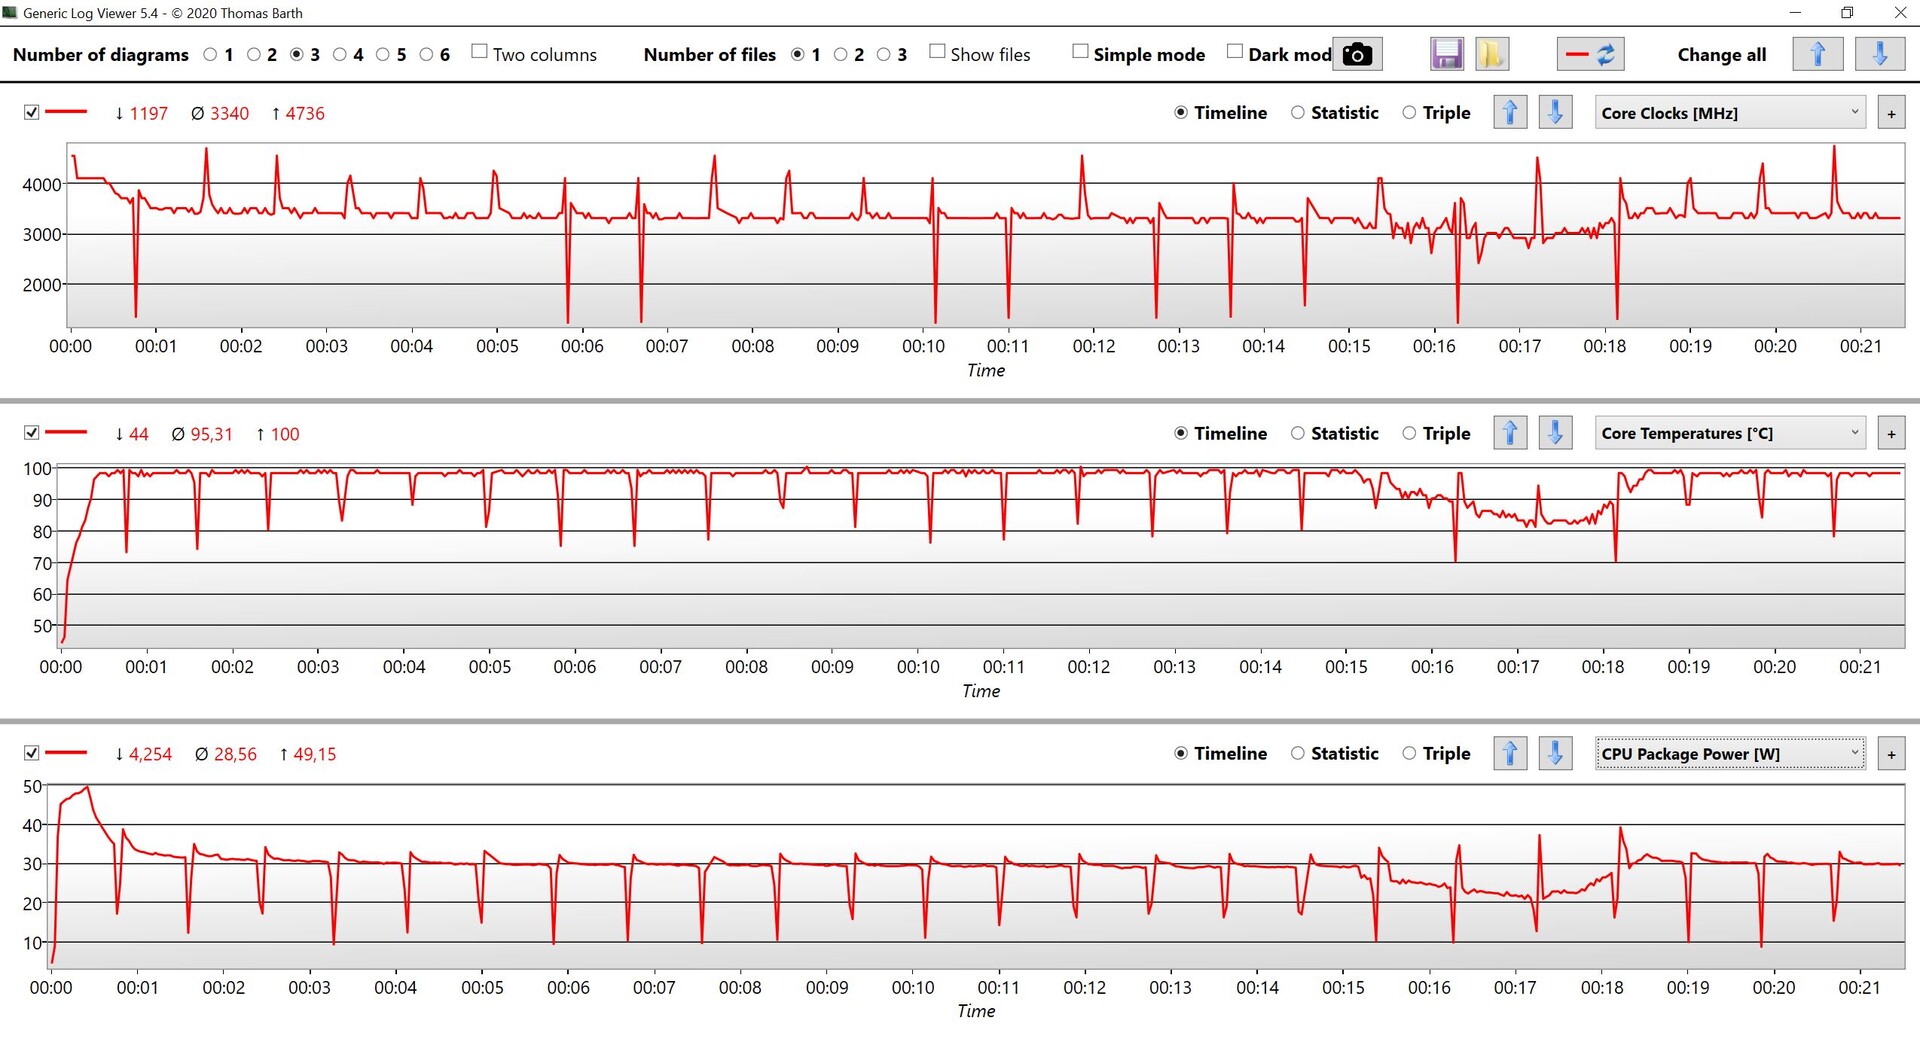
联想非常慷慨地设定了功率限制,在基准测试的开始阶段,我们确实可以看到4.1GHz的最高时钟(相当于~50W)。然而,过了一会儿,该值就平息在4x 3.3 GHz和30W。总而言之,结果很好,但是处理器经常触及100℃的大关。我们可以看到大约15分钟后性能略有下降,但性能很快又稳定下来。
Cinebench R15 Multi Loop
与其他Tiger Lake 笔记本电脑及其前身相比,新的X13 G2的性能如何? 前代产品?在单核基准测试中,酷睿i7主要得益于高时钟,新的X13 G2经常在排名中名列前茅。其性能也不错,领先于所有其他基于英特尔的对手(采用Comet Lake的前辈被击败了30%),但旧的X13 G1 AMD仍然明显更快。我们已经急于看到X13 G2与新的Ryzen 5000 CPU的性能。如果功率限制相当的话,我们期望CPU更好。Apple's M1 CPU在MacBook Pro 13当你给一个核心施加压力时,它的速度一样快,但在原生多核心基准测试中要快得多(>30%)。
在电池供电的情况下,功耗被限制在30W,所以与主电源相比,只是有一个小的性能缺陷,约15%。
Cinebench R20: CPU (Single Core) | CPU (Multi Core)
Cinebench R15: CPU Single 64Bit | CPU Multi 64Bit
Blender: v2.79 BMW27 CPU
7-Zip 18.03: 7z b 4 -mmt1 | 7z b 4
Geekbench 5.5: Single-Core | Multi-Core
HWBOT x265 Benchmark v2.2: 4k Preset
LibreOffice : 20 Documents To PDF
R Benchmark 2.5: Overall mean
| Cinebench R23 / Single Core | |
| Average of class Subnotebook (358 - 2213, n=60, last 2 years) | |
| Lenovo ThinkPad X13 G2 20WK0024GE | |
| Apple MacBook Pro 13 Late 2020 M1 Entry (8 / 256 GB) | |
| Average Intel Core i7-1165G7 (1110 - 1539, n=59) | |
| Huawei MateBook X Pro 2021 | |
| Cinebench R23 / Multi Core | |
| Average of class Subnotebook (1555 - 21812, n=59, last 2 years) | |
| Apple MacBook Pro 13 Late 2020 M1 Entry (8 / 256 GB) | |
| Lenovo ThinkPad X13 G2 20WK0024GE | |
| Average Intel Core i7-1165G7 (2525 - 6862, n=64) | |
| Huawei MateBook X Pro 2021 | |
| Cinebench R20 / CPU (Single Core) | |
| Average of class Subnotebook (128 - 832, n=56, last 2 years) | |
| Lenovo ThinkPad X13 G2 20WK0024GE | |
| Dell XPS 13 9310 Core i7 FHD | |
| Average Intel Core i7-1165G7 (442 - 589, n=81) | |
| Huawei MateBook X Pro 2021 | |
| Lenovo ThinkPad X13-20UGS00800 | |
| HP EliteBook 830 G7 | |
| Apple MacBook Pro 13 Late 2020 M1 Entry (8 / 256 GB) | |
| Lenovo ThinkPad X13-20T20033GE | |
| Cinebench R20 / CPU (Multi Core) | |
| Average of class Subnotebook (579 - 8541, n=56, last 2 years) | |
| Lenovo ThinkPad X13-20UGS00800 | |
| Lenovo ThinkPad X13 G2 20WK0024GE | |
| Apple MacBook Pro 13 Late 2020 M1 Entry (8 / 256 GB) | |
| Average Intel Core i7-1165G7 (1060 - 2657, n=81) | |
| Dell XPS 13 9310 Core i7 FHD | |
| Huawei MateBook X Pro 2021 | |
| HP EliteBook 830 G7 | |
| Lenovo ThinkPad X13-20T20033GE | |
| Cinebench R15 / CPU Single 64Bit | |
| Average of class Subnotebook (72.4 - 322, n=56, last 2 years) | |
| Lenovo ThinkPad X13 G2 20WK0024GE | |
| Dell XPS 13 9310 Core i7 FHD | |
| Average Intel Core i7-1165G7 (115 - 230, n=78) | |
| Huawei MateBook X Pro 2021 | |
| Apple MacBook Pro 13 Late 2020 M1 Entry (8 / 256 GB) | |
| Lenovo ThinkPad X13-20UGS00800 | |
| HP EliteBook 830 G7 | |
| Lenovo ThinkPad X13-20T20033GE | |
| Cinebench R15 / CPU Multi 64Bit | |
| Average of class Subnotebook (327 - 3345, n=56, last 2 years) | |
| Lenovo ThinkPad X13-20UGS00800 | |
| Apple MacBook Pro 13 Late 2020 M1 Entry (8 / 256 GB) | |
| Lenovo ThinkPad X13 G2 20WK0024GE | |
| Dell XPS 13 9310 Core i7 FHD | |
| Average Intel Core i7-1165G7 (553 - 1027, n=86) | |
| Lenovo ThinkPad X13-20T20033GE | |
| Huawei MateBook X Pro 2021 | |
| Blender / v2.79 BMW27 CPU | |
| Lenovo ThinkPad X13-20T20033GE | |
| Huawei MateBook X Pro 2021 | |
| HP EliteBook 830 G7 | |
| Dell XPS 13 9310 Core i7 FHD | |
| Average Intel Core i7-1165G7 (468 - 1138, n=80) | |
| Lenovo ThinkPad X13 G2 20WK0024GE | |
| Lenovo ThinkPad X13-20UGS00800 | |
| Average of class Subnotebook (159 - 2271, n=57, last 2 years) | |
| 7-Zip 18.03 / 7z b 4 -mmt1 | |
| Average of class Subnotebook (2643 - 6699, n=58, last 2 years) | |
| Dell XPS 13 9310 Core i7 FHD | |
| Lenovo ThinkPad X13 G2 20WK0024GE | |
| Average Intel Core i7-1165G7 (4478 - 5507, n=80) | |
| Huawei MateBook X Pro 2021 | |
| HP EliteBook 830 G7 | |
| Lenovo ThinkPad X13-20UGS00800 | |
| Lenovo ThinkPad X13-20T20033GE | |
| 7-Zip 18.03 / 7z b 4 | |
| Average of class Subnotebook (11668 - 77867, n=56, last 2 years) | |
| Lenovo ThinkPad X13-20UGS00800 | |
| Lenovo ThinkPad X13 G2 20WK0024GE | |
| Average Intel Core i7-1165G7 (15347 - 27405, n=80) | |
| HP EliteBook 830 G7 | |
| Dell XPS 13 9310 Core i7 FHD | |
| Huawei MateBook X Pro 2021 | |
| Lenovo ThinkPad X13-20T20033GE | |
| Geekbench 5.5 / Single-Core | |
| Average of class Subnotebook (726 - 2224, n=49, last 2 years) | |
| Apple MacBook Pro 13 Late 2020 M1 Entry (8 / 256 GB) | |
| Dell XPS 13 9310 Core i7 FHD | |
| Lenovo ThinkPad X13 G2 20WK0024GE | |
| Average Intel Core i7-1165G7 (1302 - 1595, n=77) | |
| Huawei MateBook X Pro 2021 | |
| HP EliteBook 830 G7 | |
| Lenovo ThinkPad X13-20UGS00800 | |
| Lenovo ThinkPad X13-20T20033GE | |
| Geekbench 5.5 / Multi-Core | |
| Average of class Subnotebook (2557 - 17218, n=49, last 2 years) | |
| Apple MacBook Pro 13 Late 2020 M1 Entry (8 / 256 GB) | |
| Dell XPS 13 9310 Core i7 FHD | |
| Lenovo ThinkPad X13 G2 20WK0024GE | |
| Lenovo ThinkPad X13-20UGS00800 | |
| Huawei MateBook X Pro 2021 | |
| Average Intel Core i7-1165G7 (3078 - 5926, n=77) | |
| Lenovo ThinkPad X13-20T20033GE | |
| HP EliteBook 830 G7 | |
| HWBOT x265 Benchmark v2.2 / 4k Preset | |
| Average of class Subnotebook (0.97 - 25.1, n=56, last 2 years) | |
| Lenovo ThinkPad X13-20UGS00800 | |
| Lenovo ThinkPad X13 G2 20WK0024GE | |
| Average Intel Core i7-1165G7 (1.39 - 8.47, n=80) | |
| Dell XPS 13 9310 Core i7 FHD | |
| Huawei MateBook X Pro 2021 | |
| HP EliteBook 830 G7 | |
| Lenovo ThinkPad X13-20T20033GE | |
| LibreOffice / 20 Documents To PDF | |
| HP EliteBook 830 G7 | |
| Lenovo ThinkPad X13-20UGS00800 | |
| Average of class Subnotebook (39.9 - 220, n=55, last 2 years) | |
| Lenovo ThinkPad X13-20T20033GE | |
| Average Intel Core i7-1165G7 (21.5 - 88.1, n=78) | |
| Dell XPS 13 9310 Core i7 FHD | |
| Lenovo ThinkPad X13 G2 20WK0024GE | |
| Huawei MateBook X Pro 2021 | |
| R Benchmark 2.5 / Overall mean | |
| Lenovo ThinkPad X13-20T20033GE | |
| HP EliteBook 830 G7 | |
| Lenovo ThinkPad X13-20UGS00800 | |
| Huawei MateBook X Pro 2021 | |
| Average Intel Core i7-1165G7 (0.552 - 1.002, n=80) | |
| Dell XPS 13 9310 Core i7 FHD | |
| Lenovo ThinkPad X13 G2 20WK0024GE | |
| Average of class Subnotebook (0.4024 - 1.456, n=57, last 2 years) | |
* ... smaller is better
系统性能
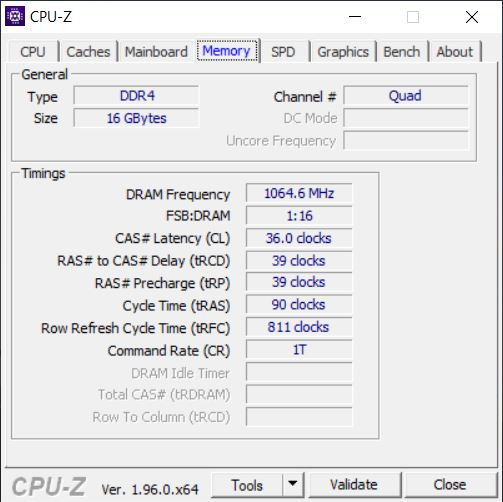
ThinkPad X13 G2的主观性能印象非常好,所有输入的执行都没有明显的延迟。合成基准测试的结果也很好,尽管大多数对比设备由于采用了类似的组件而非常接近,你在实践中不会注意到差异。X13 G2的内存(LPDDR4x-4266)现在是焊接的,不能扩展。考虑到高昂的价格,我们建议至少要有16GB;你可以得到32GB。
| PCMark 10 / Score | |
| Average of class Subnotebook (4920 - 9939, n=46, last 2 years) | |
| Lenovo ThinkPad X13 G2 20WK0024GE | |
| Average Intel Core i7-1165G7, Intel Iris Xe Graphics G7 96EUs (4531 - 5454, n=50) | |
| Lenovo ThinkPad X13-20UGS00800 | |
| Dell XPS 13 9310 Core i7 FHD | |
| Huawei MateBook X Pro 2021 | |
| HP EliteBook 830 G7 | |
| Lenovo ThinkPad X13-20T20033GE | |
| PCMark 10 / Essentials | |
| Average of class Subnotebook (8552 - 11646, n=46, last 2 years) | |
| Huawei MateBook X Pro 2021 | |
| Lenovo ThinkPad X13 G2 20WK0024GE | |
| Average Intel Core i7-1165G7, Intel Iris Xe Graphics G7 96EUs (8997 - 11505, n=50) | |
| Dell XPS 13 9310 Core i7 FHD | |
| Lenovo ThinkPad X13-20UGS00800 | |
| Lenovo ThinkPad X13-20T20033GE | |
| HP EliteBook 830 G7 | |
| PCMark 10 / Productivity | |
| Average of class Subnotebook (5435 - 16606, n=46, last 2 years) | |
| Lenovo ThinkPad X13-20UGS00800 | |
| HP EliteBook 830 G7 | |
| Lenovo ThinkPad X13 G2 20WK0024GE | |
| Dell XPS 13 9310 Core i7 FHD | |
| Lenovo ThinkPad X13-20T20033GE | |
| Huawei MateBook X Pro 2021 | |
| Average Intel Core i7-1165G7, Intel Iris Xe Graphics G7 96EUs (5570 - 7136, n=50) | |
| PCMark 10 / Digital Content Creation | |
| Average of class Subnotebook (5722 - 13779, n=46, last 2 years) | |
| Lenovo ThinkPad X13 G2 20WK0024GE | |
| Average Intel Core i7-1165G7, Intel Iris Xe Graphics G7 96EUs (4083 - 5550, n=50) | |
| Lenovo ThinkPad X13-20UGS00800 | |
| Dell XPS 13 9310 Core i7 FHD | |
| Huawei MateBook X Pro 2021 | |
| HP EliteBook 830 G7 | |
| Lenovo ThinkPad X13-20T20033GE | |
| PCMark 10 Score | 5105 points | |
Help | ||
DPC-Latency
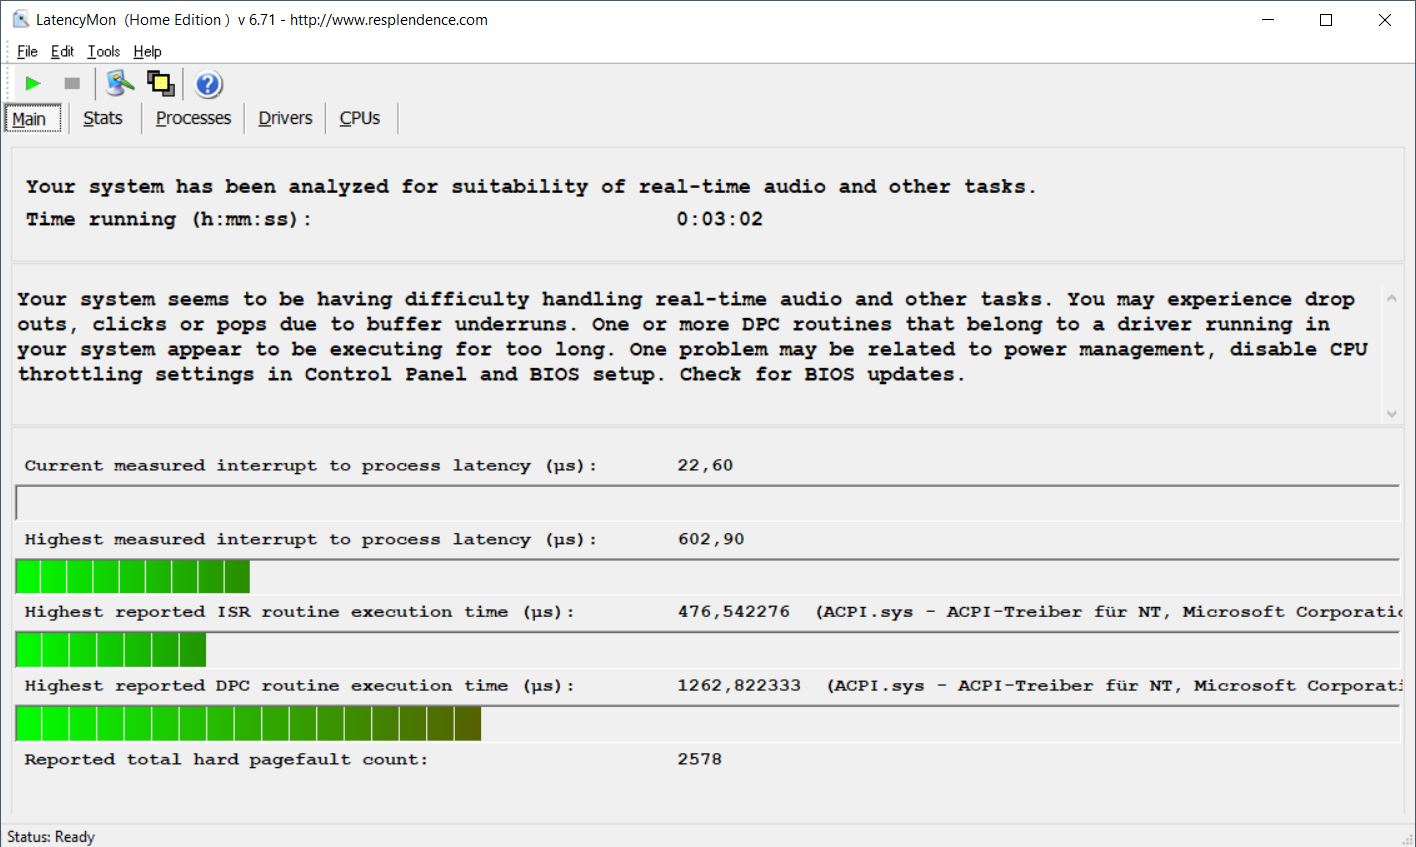
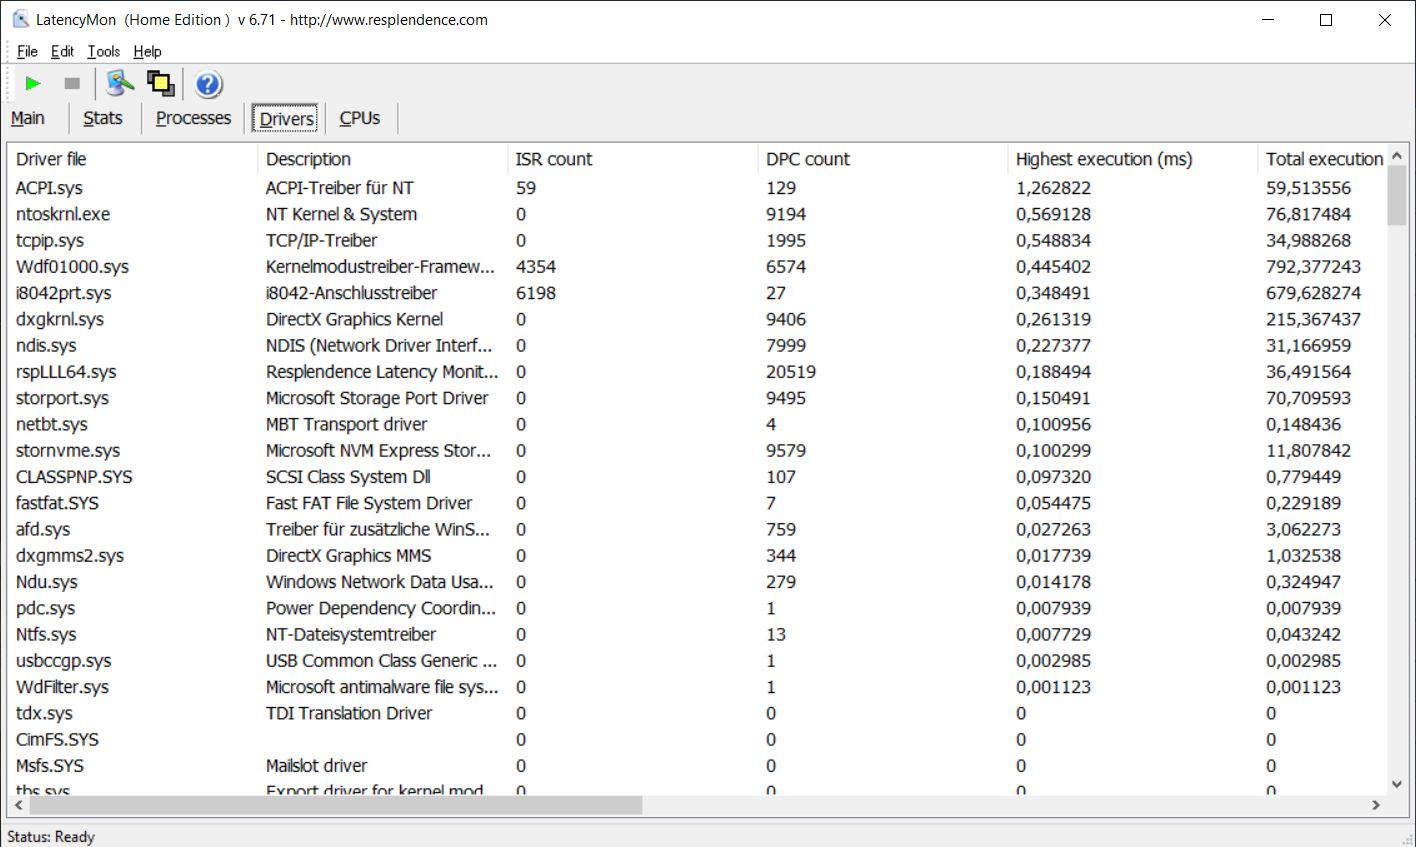
我们的标准化DPC延迟测试(网页浏览、YouTube 4K播放、CPU负载)没有显示ThinkPad X13 G2的任何问题,在YouTube视频播放过程中也没有出现丢帧。
| DPC Latencies / LatencyMon - interrupt to process latency (max), Web, Youtube, Prime95 | |
| Lenovo ThinkPad X13-20UGS00800 | |
| Huawei MateBook X Pro 2021 | |
| Dell XPS 13 9310 Core i7 FHD | |
| Lenovo ThinkPad X13-20T20033GE | |
| HP EliteBook 830 G7 | |
| Lenovo ThinkPad X13 G2 20WK0024GE | |
* ... smaller is better
存储设备 - ThinkPad支持PCIe 4.0
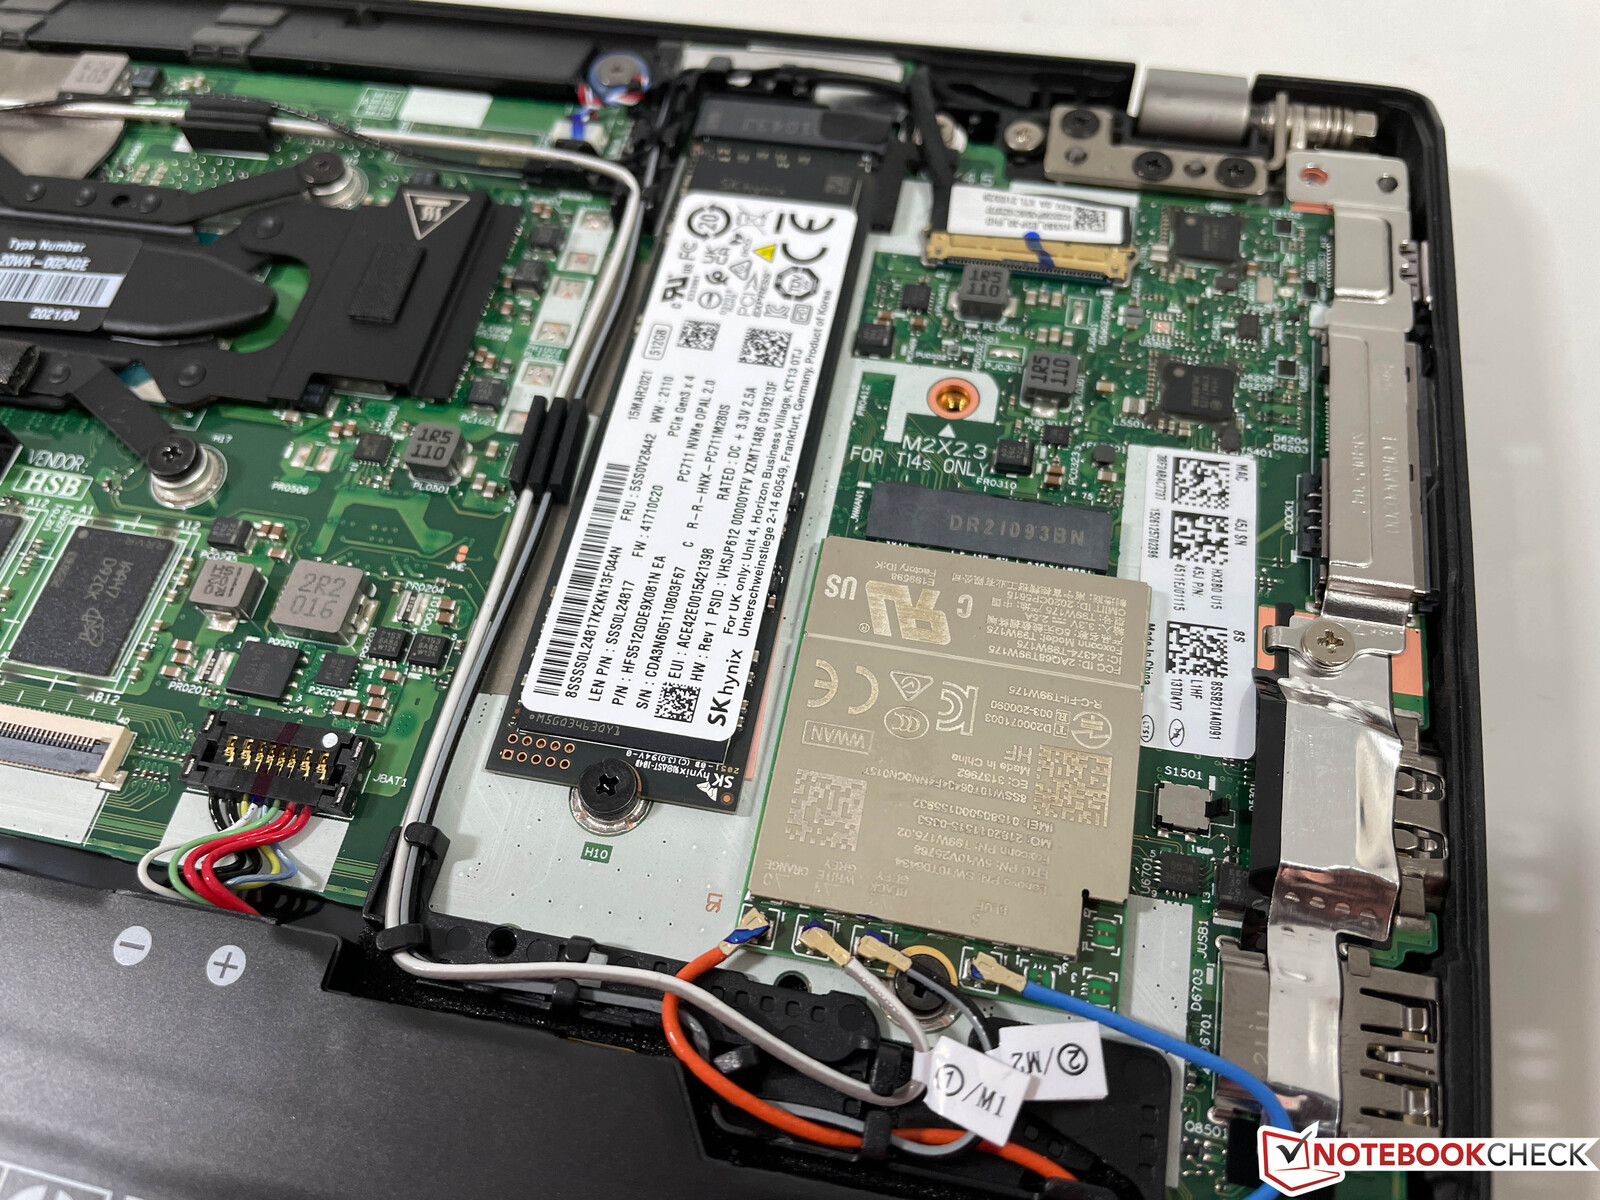
新的ThinkPad X13 G2确实支持快速的PCIe 4.0标准,但我们的设备仍然使用PCIe-3.0-x4硬盘。不过在实践中你几乎不会注意到区别,因为这是一个来自SK Hynix的非常快的驱动器。
存储容量为512GB,在初始设置后你可以使用大约411GB。我们可以看到传输率高达3.5 GB/s(读取)和近2.9 GB/s(写入)。更多的SSD基准测试可在 这里.
| Lenovo ThinkPad X13 G2 20WK0024GE SK Hynix HFS512 GDE9X081N | Dell XPS 13 9310 Core i7 FHD Micron 2300 512GB MTFDHBA512TDV | HP EliteBook 830 G7 Samsung SSD PM981a MZVLB512HBJQ | Huawei MateBook X Pro 2021 Samsung PM981a MZVLB1T0HBLR | Average SK Hynix HFS512 GDE9X081N | |
|---|---|---|---|---|---|
| CrystalDiskMark 5.2 / 6 | -12% | -7% | 14% | -5% | |
| Write 4K (MB/s) | 171.4 | 97.5 -43% | 118.3 -31% | 197.5 15% | 137.4 ? -20% |
| Read 4K (MB/s) | 70.8 | 50.9 -28% | 60.4 -15% | 52.9 -25% | 61.7 ? -13% |
| Write Seq (MB/s) | 1771 | 1811 2% | 2067 17% | 2174 23% | 2043 ? 15% |
| Read Seq (MB/s) | 1755 | 1836 5% | 2394 36% | 2156 23% | 1800 ? 3% |
| Write 4K Q32T1 (MB/s) | 525 | 521 -1% | 325.5 -38% | 632 20% | 463 ? -12% |
| Read 4K Q32T1 (MB/s) | 479.5 | 357.5 -25% | 332.2 -31% | 694 45% | 408 ? -15% |
| Write Seq Q32T1 (MB/s) | 2818 | 2879 2% | 2978 6% | 3017 7% | 2893 ? 3% |
| Read Seq Q32T1 (MB/s) | 3548 | 3204 -10% | 3552 0% | 3561 0% | 3585 ? 1% |
| AS SSD | -155% | -57% | -9% | -15% | |
| Seq Read (MB/s) | 2776 | 2091 -25% | 2081 -25% | 2794 1% | 2727 ? -2% |
| Seq Write (MB/s) | 1461 | 1396 -4% | 1433 -2% | 2385 63% | 1664 ? 14% |
| 4K Read (MB/s) | 63.8 | 49.29 -23% | 49.92 -22% | 60.7 -5% | 53.6 ? -16% |
| 4K Write (MB/s) | 209.4 | 104.2 -50% | 119.1 -43% | 180.8 -14% | 152.5 ? -27% |
| 4K-64 Read (MB/s) | 1148 | 827 -28% | 585 -49% | 1768 54% | 1025 ? -11% |
| 4K-64 Write (MB/s) | 1623 | 1636 1% | 1630 0% | 1800 11% | 1731 ? 7% |
| Access Time Read * (ms) | 0.032 | 0.066 -106% | 0.043 -34% | 0.037 -16% | 0.05417 ? -69% |
| Access Time Write * (ms) | 0.019 | 0.365 -1821% | 0.097 -411% | 0.073 -284% | 0.026 ? -37% |
| Score Read (Points) | 1489 | 1086 -27% | 843 -43% | 2108 42% | 1351 ? -9% |
| Score Write (Points) | 1978 | 1880 -5% | 1892 -4% | 2219 12% | 2051 ? 4% |
| Score Total (Points) | 4178 | 3499 -16% | 3149 -25% | 5392 29% | 4051 ? -3% |
| Copy ISO MB/s (MB/s) | 1833 | 1544 -16% | 2452 34% | 2065 13% | 2050 ? 12% |
| Copy Program MB/s (MB/s) | 993 | 613 -38% | 72.2 -93% | 734 -26% | 542 ? -45% |
| Copy Game MB/s (MB/s) | 1607 | 1451 -10% | 404 -75% | 1629 1% | 1228 ? -24% |
| Total Average (Program / Settings) | -84% /
-103% | -32% /
-39% | 3% /
-1% | -10% /
-11% |
* ... smaller is better

Disk Throttling: DiskSpd Read Loop, Queue Depth 8
GPU性能 - Iris Xe Graphics G7
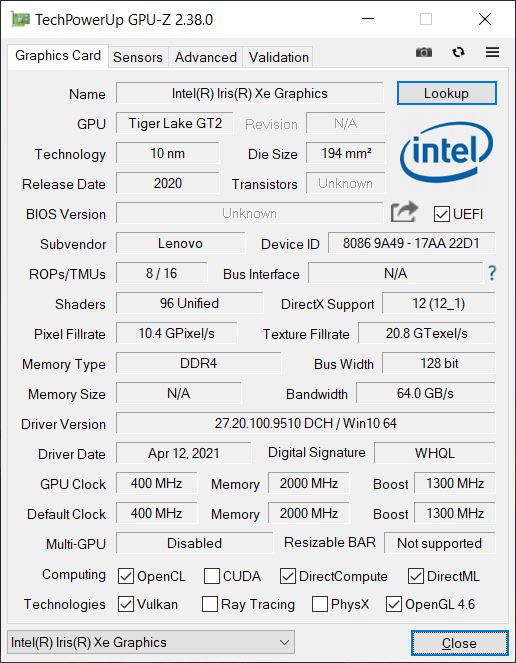
芯片酷睿i7-1165G7配备了集成的Xe Graphics G7.它是更快的版本,有96个EUs,最大时钟为1300 MHz。iGPU还得益于双通道配置的快速内存。
X13 G2在合成基准测试中比竞争对手更快,在持续工作负荷下图形性能也很稳定;它通过了3DMark压力测试(Fire Strike )。与旧的配备英特尔iGPU的X13 G1相比,性能几乎提高了3倍,现代Ryzen iGPU也被打败了。你可以在电池电源上使用全部的GPU性能。
| 3DMark 11 Performance | 7169 points | |
| 3DMark Ice Storm Standard Score | 95856 points | |
| 3DMark Cloud Gate Standard Score | 20532 points | |
| 3DMark Fire Strike Score | 4795 points | |
| 3DMark Time Spy Score | 1746 points | |
Help | ||
游戏性能
尽管图形性能有所提高,但X13 G2仍然不是游戏笔记本电脑,但你至少可以用iGPU玩旧的或要求不高的游戏。在较长时间的游戏过程中,游戏性能也很稳定。更多的游戏基准测试可在我们的 技术部分.
| F1 2020 | |
| 1920x1080 Ultra High Preset AA:T AF:16x | |
| Lenovo ThinkPad X13 G2 20WK0024GE | |
| Average Intel Iris Xe Graphics G7 96EUs (15 - 28, n=31) | |
| 1920x1080 High Preset AA:T AF:16x | |
| Lenovo ThinkPad X13 G2 20WK0024GE | |
| Average Intel Iris Xe Graphics G7 96EUs (22 - 44.4, n=32) | |
| 1920x1080 Medium Preset AF:16x | |
| Lenovo ThinkPad X13 G2 20WK0024GE | |
| Average Intel Iris Xe Graphics G7 96EUs (23.1 - 57.5, n=34) | |
| 1280x720 Ultra Low Preset | |
| Lenovo ThinkPad X13 G2 20WK0024GE | |
| Average Intel Iris Xe Graphics G7 96EUs (49 - 109.6, n=34) | |
Witcher 3 FPS Diagram
| low | med. | high | ultra | |
|---|---|---|---|---|
| GTA V (2015) | 89.2 | 27.4 | 10.8 | |
| The Witcher 3 (2015) | 97 | 58 | 31 | 12.7 |
| Dota 2 Reborn (2015) | 83 | 72.1 | 46.9 | 44.4 |
| Final Fantasy XV Benchmark (2018) | 39.3 | 21.3 | 15.8 | |
| X-Plane 11.11 (2018) | 43.2 | 36.1 | 32.4 | |
| Far Cry 5 (2018) | 55 | 26 | 24 | 21 |
| Strange Brigade (2018) | 91.2 | 38.9 | 30.9 | 25 |
| F1 2020 (2020) | 88 | 46 | 34 | 23 |
排放--性能更强,风扇噪音更大
系统噪音
由于功率限制较高,风扇在负载情况下必须加快旋转速度,而且新机型的声音明显比非常安静的前代产品大。不过,风扇的杂音并不令人讨厌,也没有高亢的声音。在日常情况下,当你使用 "最佳性能 "模式(Windows电源滑块)时,风扇也会很快启动。如果你不需要最大的性能,我们肯定会推荐两个不太强大的能源设置之一。我们的测试装置没有任何电子噪音的问题,如线圈啸叫。
Noise level
| Idle |
| 25.5 / 25.5 / 29 dB(A) |
| Load |
| 37.4 / 37.4 dB(A) |
 | ||
30 dB silent 40 dB(A) audible 50 dB(A) loud |
||
min: | ||
| Lenovo ThinkPad X13 G2 20WK0024GE Iris Xe G7 96EUs, i7-1165G7, SK Hynix HFS512 GDE9X081N | Dell XPS 13 9310 Core i7 FHD Iris Xe G7 96EUs, i7-1165G7, Micron 2300 512GB MTFDHBA512TDV | Apple MacBook Pro 13 Late 2020 M1 Entry (8 / 256 GB) M1 8-Core GPU, M1, Apple SSD AP0256 | HP EliteBook 830 G7 UHD Graphics 620, i7-10810U, Samsung SSD PM981a MZVLB512HBJQ | Huawei MateBook X Pro 2021 Iris Xe G7 96EUs, i7-1165G7, Samsung PM981a MZVLB1T0HBLR | Lenovo ThinkPad X13-20UGS00800 Vega 7, R7 PRO 4750U, Samsung SSD PM981a MZVLB512HBJQ | |
|---|---|---|---|---|---|---|
| Noise | 6% | -7% | 0% | 7% | -2% | |
| off / environment * (dB) | 25.5 | 25.7 -1% | 29.2 -15% | 26.8 -5% | 25.4 -0% | 29.1 -14% |
| Idle Minimum * (dB) | 25.5 | 25.7 -1% | 29.2 -15% | 27.1 -6% | 25.6 -0% | 29.1 -14% |
| Idle Average * (dB) | 25.5 | 25.7 -1% | 29.2 -15% | 27.1 -6% | 25.6 -0% | 29.1 -14% |
| Idle Maximum * (dB) | 29 | 25.9 11% | 29.2 -1% | 27.1 7% | 25.6 12% | 29.1 -0% |
| Load Average * (dB) | 37.4 | 26.2 30% | 32.1 14% | 31.4 16% | 28.7 23% | 31.1 17% |
| Witcher 3 ultra * (dB) | 37.4 | 36.5 2% | 32 14% | |||
| Load Maximum * (dB) | 37.4 | 36.6 2% | 41.9 -12% | 39 -4% | 38.2 -2% | 31.8 15% |
* ... smaller is better
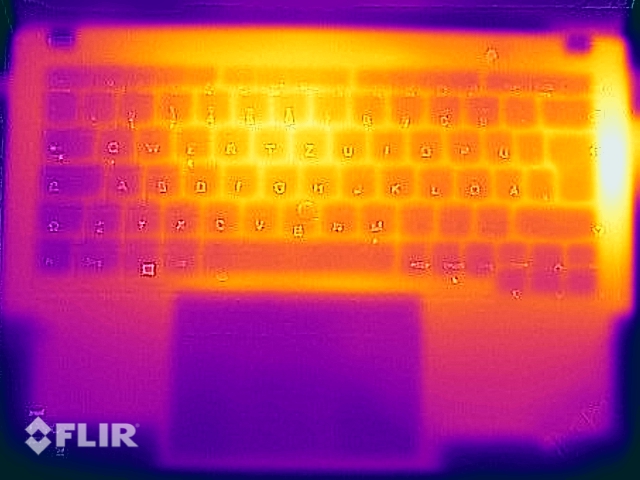
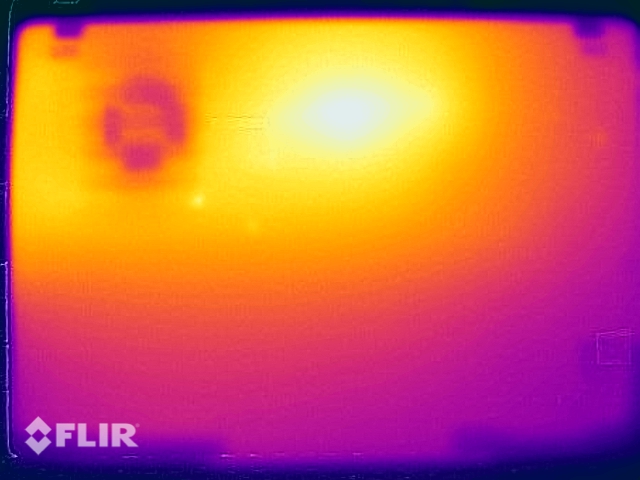
温度
紧凑的X13 G2在负载下变得相当热,我们可以测量到在风扇排气口周围的底座右侧有超过50℃的温度。底部面板主要在CPU所在的中心位置发热。当你给笔记本施加压力时,你不应该把它放在腿上,但在日常情况下没有限制。
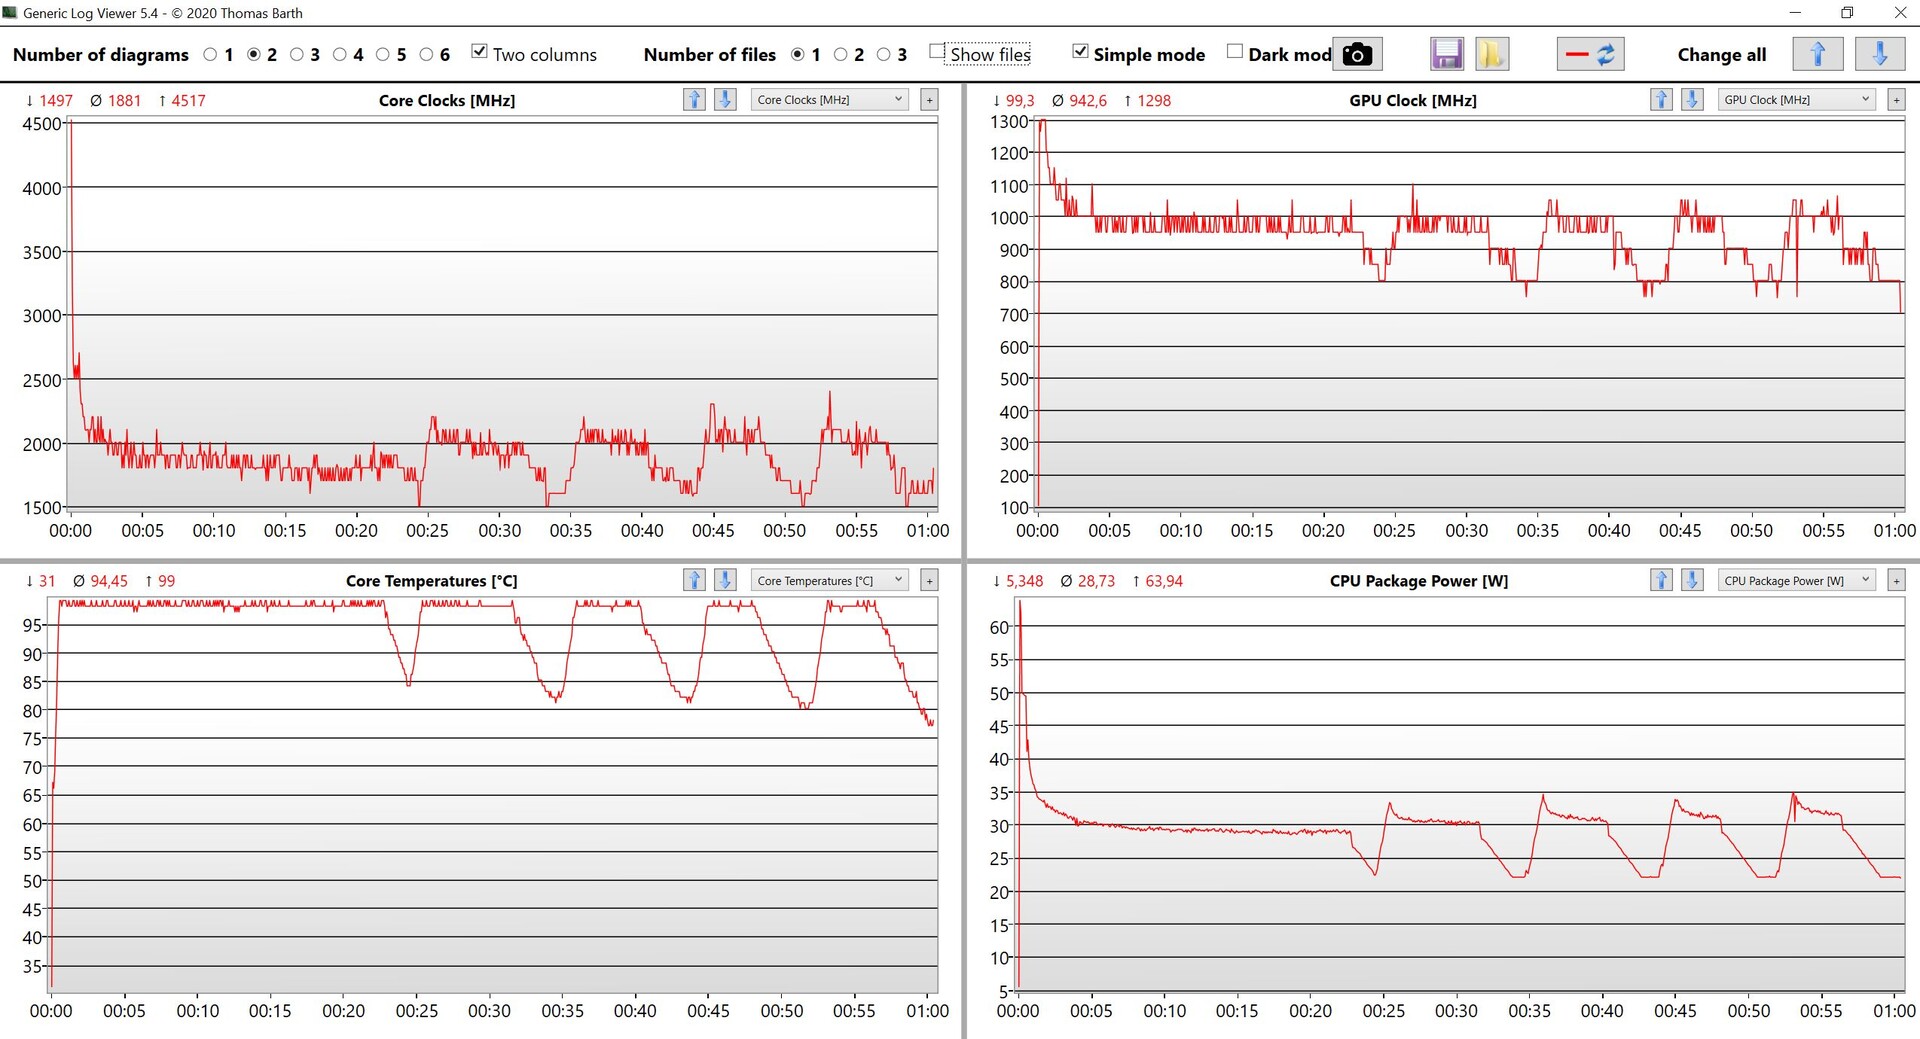
我们可以再次看到,在综合工作负载中,处理器在30W左右迅速趋于平稳(~1.9GHz CPU和~950MHz iGPU)。大约25分钟后,我们可以看到一个波动,但平均值大致相同。未来可能会有一个软件更新来稳定性能。
(-) The maximum temperature on the upper side is 53.9 °C / 129 F, compared to the average of 35.9 °C / 97 F, ranging from 21.4 to 59 °C for the class Subnotebook.
(-) The bottom heats up to a maximum of 49.1 °C / 120 F, compared to the average of 39.2 °C / 103 F
(+) In idle usage, the average temperature for the upper side is 24 °C / 75 F, compared to the device average of 30.8 °C / 87 F.
(-) Playing The Witcher 3, the average temperature for the upper side is 39.4 °C / 103 F, compared to the device average of 30.8 °C / 87 F.
(±) The palmrests and touchpad can get very hot to the touch with a maximum of 37 °C / 98.6 F.
(-) The average temperature of the palmrest area of similar devices was 28.2 °C / 82.8 F (-8.8 °C / -15.8 F).
发言人
两个立体声扬声器位于键盘上方,将声音导向用户。质量上留有优化的余地,这一点从像X1 Carbon,比如说。消费类机型如MacBook Pro 13或华为MateBook X Pro在这方面也有很大优势。扬声器对于视频会议来说绝对够用,但当你听音乐或看电影时,我们建议使用耳机或外部扬声器。预装的杜比软件提供了不同的配置文件,但声音差异很小。
Lenovo ThinkPad X13 G2 20WK0024GE audio analysis
(±) | speaker loudness is average but good (77.4 dB)
Bass 100 - 315 Hz
(-) | nearly no bass - on average 21.2% lower than median
(±) | linearity of bass is average (7.8% delta to prev. frequency)
Mids 400 - 2000 Hz
(+) | balanced mids - only 3.5% away from median
(±) | linearity of mids is average (7.6% delta to prev. frequency)
Highs 2 - 16 kHz
(+) | balanced highs - only 1.5% away from median
(+) | highs are linear (2.8% delta to prev. frequency)
Overall 100 - 16.000 Hz
(±) | linearity of overall sound is average (18% difference to median)
Compared to same class
» 51% of all tested devices in this class were better, 8% similar, 41% worse
» The best had a delta of 5%, average was 18%, worst was 53%
Compared to all devices tested
» 38% of all tested devices were better, 8% similar, 54% worse
» The best had a delta of 4%, average was 23%, worst was 134%
Apple MacBook Pro 13 Late 2020 M1 Entry (8 / 256 GB) audio analysis
(±) | speaker loudness is average but good (77.5 dB)
Bass 100 - 315 Hz
(±) | reduced bass - on average 8.7% lower than median
(±) | linearity of bass is average (8.6% delta to prev. frequency)
Mids 400 - 2000 Hz
(+) | balanced mids - only 4.2% away from median
(+) | mids are linear (4.2% delta to prev. frequency)
Highs 2 - 16 kHz
(+) | balanced highs - only 1.2% away from median
(+) | highs are linear (4% delta to prev. frequency)
Overall 100 - 16.000 Hz
(+) | overall sound is linear (12.9% difference to median)
Compared to same class
» 20% of all tested devices in this class were better, 5% similar, 75% worse
» The best had a delta of 5%, average was 18%, worst was 53%
Compared to all devices tested
» 12% of all tested devices were better, 3% similar, 85% worse
» The best had a delta of 4%, average was 23%, worst was 134%
Huawei MateBook X Pro 2021 audio analysis
(+) | speakers can play relatively loud (82.7 dB)
Bass 100 - 315 Hz
(±) | reduced bass - on average 13.6% lower than median
(±) | linearity of bass is average (10.1% delta to prev. frequency)
Mids 400 - 2000 Hz
(+) | balanced mids - only 2.9% away from median
(+) | mids are linear (3.3% delta to prev. frequency)
Highs 2 - 16 kHz
(+) | balanced highs - only 4.6% away from median
(±) | linearity of highs is average (8.2% delta to prev. frequency)
Overall 100 - 16.000 Hz
(+) | overall sound is linear (11.8% difference to median)
Compared to same class
» 13% of all tested devices in this class were better, 4% similar, 83% worse
» The best had a delta of 5%, average was 18%, worst was 53%
Compared to all devices tested
» 9% of all tested devices were better, 3% similar, 89% worse
» The best had a delta of 4%, average was 23%, worst was 134%
能源管理 - 体面的耐力
消耗功率
我们的能量测量没有显示出任何惊喜。X13 G2在空转时非常高效,也比旧的配备AMD处理器的X13 G1.我们已经迫不及待地想看看配备Ryzen 5000的新X13 G2将如何表现。你应该只使用电池供电的第一级键盘照明,因为它只增加了约0.4W的消耗(第二级+1.4W)。
在我们的压力测试中,消耗量攀升至68.2W,但很快就在45W左右趋于平稳。这意味着附带的65W电源适配器是完全足够的。
| Off / Standby | |
| Idle | |
| Load |
|
Key:
min: | |
| Lenovo ThinkPad X13 G2 20WK0024GE i7-1165G7, Iris Xe G7 96EUs, SK Hynix HFS512 GDE9X081N, IPS, 1920x1200, 13.3" | Dell XPS 13 9310 Core i7 FHD i7-1165G7, Iris Xe G7 96EUs, Micron 2300 512GB MTFDHBA512TDV, IPS, 1920x1200, 13.4" | Apple MacBook Pro 13 Late 2020 M1 Entry (8 / 256 GB) M1, M1 8-Core GPU, Apple SSD AP0256, IPS, 2560x1600, 13.3" | HP EliteBook 830 G7 i7-10810U, UHD Graphics 620, Samsung SSD PM981a MZVLB512HBJQ, IPS, 1920x1080, 13.3" | Huawei MateBook X Pro 2021 i7-1165G7, Iris Xe G7 96EUs, Samsung PM981a MZVLB1T0HBLR, IPS, 3000x2000, 13.9" | Lenovo ThinkPad X13-20UGS00800 R7 PRO 4750U, Vega 7, Samsung SSD PM981a MZVLB512HBJQ, IPS LED, 1920x1080, 13.3" | Average Intel Iris Xe Graphics G7 96EUs | Average of class Subnotebook | |
|---|---|---|---|---|---|---|---|---|
| Power Consumption | 0% | 16% | 7% | -40% | -34% | -43% | -11% | |
| Idle Minimum * (Watt) | 2.8 | 3.9 -39% | 1.67 40% | 3.6 -29% | 6.7 -139% | 6 -114% | 5.51 ? -97% | 3.73 ? -33% |
| Idle Average * (Watt) | 5.9 | 5.9 -0% | 6.7 -14% | 4.7 20% | 10 -69% | 8.9 -51% | 8.66 ? -47% | 6.57 ? -11% |
| Idle Maximum * (Watt) | 6.8 | 6.3 7% | 7.4 -9% | 5.1 25% | 10.3 -51% | 11.3 -66% | 10.9 ? -60% | 7.93 ? -17% |
| Load Average * (Watt) | 41.5 | 39.7 4% | 28 33% | 33.3 20% | 35.7 14% | 34.2 18% | 45.6 ? -10% | 42.1 ? -1% |
| Witcher 3 ultra * (Watt) | 34.2 | 34.8 -2% | 32.7 4% | |||||
| Load Maximum * (Watt) | 68.2 | 47.5 30% | 47.5 30% | 70 -3% | 67.6 1% | 37.2 45% | 67.8 ? 1% | 65.1 ? 5% |
* ... smaller is better
Power Consumption Witcher 3
电池运行时间
联想将电池容量从48Wh增加到54.7Wh,电池运行时间得到改善。在视频测试中,X13 G2得益于更高效的视频解码器,在150尼特的亮度下,运行时间为15小时。在150尼特的Wi-Fi测试中,运行时间接近10小时,但竞争对手的持续时间更长。我们仍然认为10小时对于大多数情况来说应该是足够的。全亮度下的Wi-Fi测试仍可运行约8.5小时。
当设备开机时,电池充满电需要111分钟。约28分钟后可使用50%的容量;54分钟后可使用80%。
| Lenovo ThinkPad X13 G2 20WK0024GE i7-1165G7, Iris Xe G7 96EUs, 54.7 Wh | Dell XPS 13 9310 Core i7 FHD i7-1165G7, Iris Xe G7 96EUs, 52 Wh | Apple MacBook Pro 13 Late 2020 M1 Entry (8 / 256 GB) M1, M1 8-Core GPU, 58.2 Wh | HP EliteBook 830 G7 i7-10810U, UHD Graphics 620, 53 Wh | Huawei MateBook X Pro 2021 i7-1165G7, Iris Xe G7 96EUs, 56 Wh | Lenovo ThinkPad X13-20UGS00800 R7 PRO 4750U, Vega 7, 48 Wh | Lenovo ThinkPad X13-20T20033GE i5-10210U, UHD Graphics 620, 48 Wh | Average of class Subnotebook | |
|---|---|---|---|---|---|---|---|---|
| Battery runtime | 70% | 66% | 90% | 60% | -17% | 21% | 29% | |
| H.264 (h) | 15 | 19.2 28% | 8.3 -45% | 11.7 -22% | 15.3 ? 2% | |||
| WiFi v1.3 (h) | 10 | 11 10% | 20.4 104% | 11.5 15% | 10.5 5% | 8.7 -13% | 9.3 -7% | 13.9 ? 39% |
| Load (h) | 1.4 | 3.2 129% | 3.7 164% | 3 114% | 1.5 7% | 2.7 93% | 2.04 ? 46% |
Pros
Cons
结论--ThinkPad X13 G2具有未使用的潜力
新的ThinkPad X13 G2是一个很好的更新。该设备略微紧凑,你得到了16:10的显示屏,Tiger Lake 处理器的性能不错,联想还设法增加了电池容量。
与消费类设备相比,最大的优势是戴尔XPS 13,Apple MacBook Pro 13和华为MateBook X Pro是全面的连接,包括智能卡读卡器和可选的WWAN模块,用于LTE甚至5G:商务设备在保修方面也有优势。
联想仍然遵循键盘的趋势,减少行程和较浅的按键以节省空间。制造商仍在宣传经过验证的ThinkPad质量,键盘也不差,但如果你将键盘与目前的ThinkPad E14 G3(价格为一半)进行比较,例如,你很快就会发现它可以做得更好。
5G的伟大连接,16:10的屏幕,以及长的电池运行时间。ThinkPad X13 G2仍然是一个非常好的移动伴侣,尽管键盘已经不像以前那么好了。
在屏幕方面,我们也略感失望。哑光IPS显示屏的画质很好,但我们只想看到更亮的面板。我们肯定会推荐可选的2560 x 1600像素的WQXGA面板,它更亮,提供更好的画质,而且对电池运行时间没有大的影响,我们在对X13 Yoga G2的评测中已经看到了这一点。X13 Yoga G2.我们将对新的EliteBook 830 G8和(一旦上市)ThinkPad X13 G2的AMD版本进行评论。
价格和可用性
你可以在Lenovo.com上配置自己的ThinkPad X13 G2,起价约1200美元。.我们的评测配置现在约为1500美元。
Lenovo ThinkPad X13 G2 20WK0024GE
- 07/06/2021 v7 (old)
Andreas Osthoff
Price comparison

