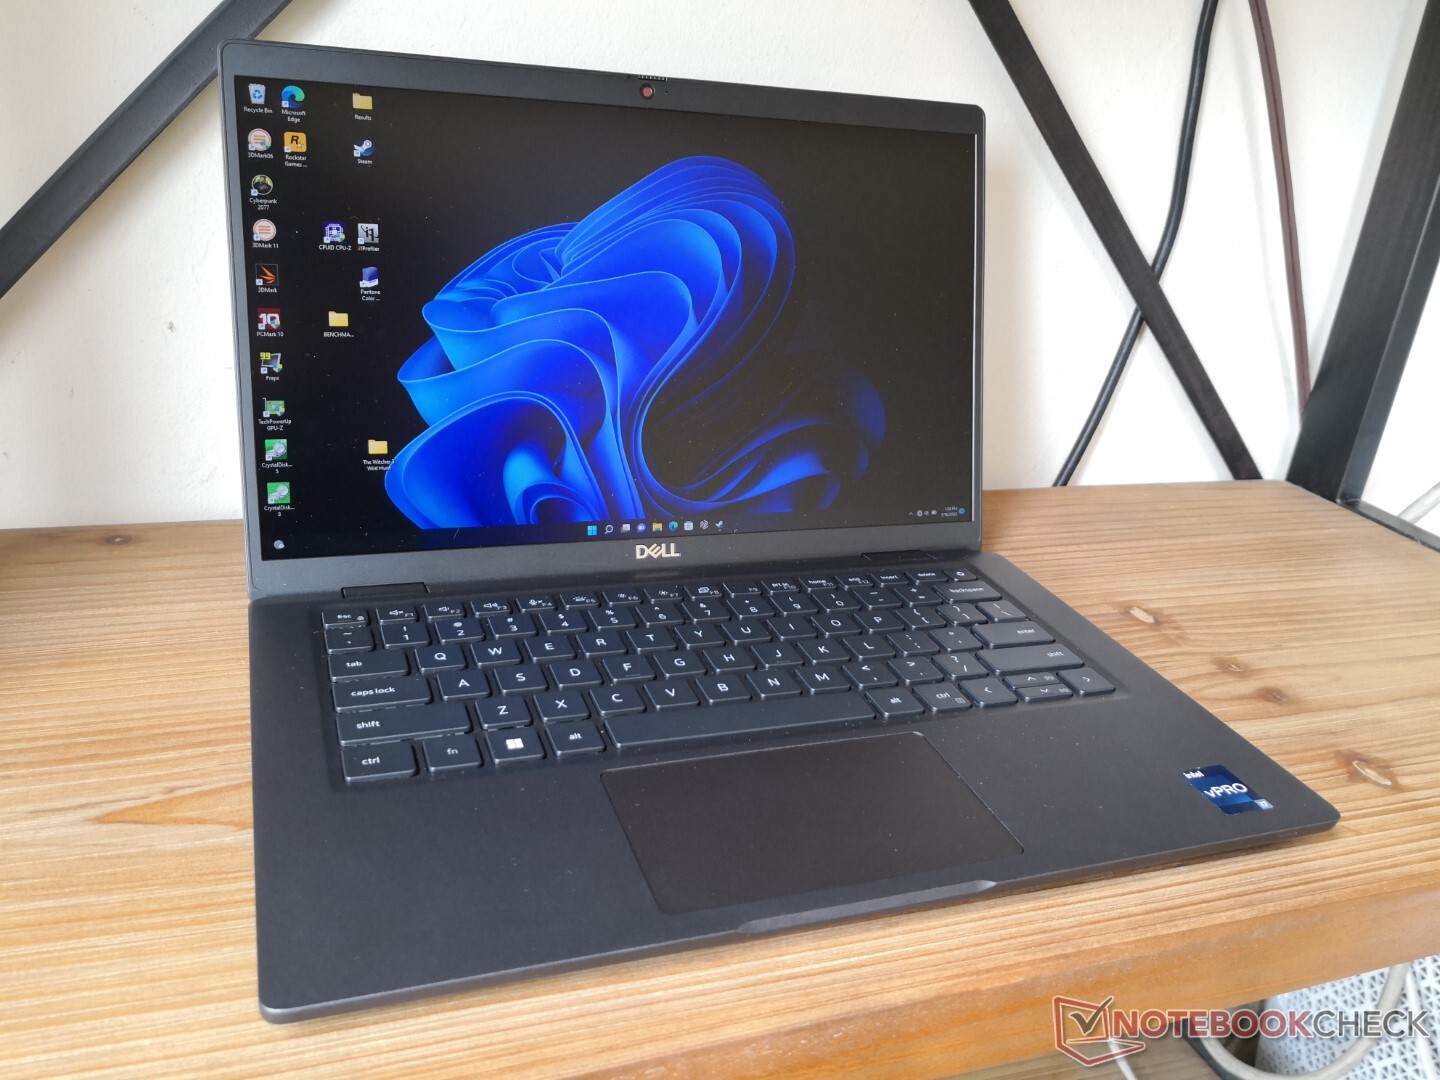
英特尔酷睿i7-1265U首次亮相。戴尔Latitude 13 7330 1公斤笔记本电脑评测
不要与 DellLatitude 7330 RuggedLatitude 7330是更传统的笔记本电脑,适合办公室和企业。它有蛤壳式和可转换二合一两种选择,每种选择都有类似的英特尔12代酷睿U处理器选项、端口和整体机箱设计,但有不同的显示屏和机箱材料选项可供选择。我们建议查看产品页面或公开的technical PDFLatitude 7330,因为它提供了比其他大多数笔记本电脑更多的可配置选项,包括不同的网络摄像头、电池尺寸、WAN,甚至MicroSD读卡器。
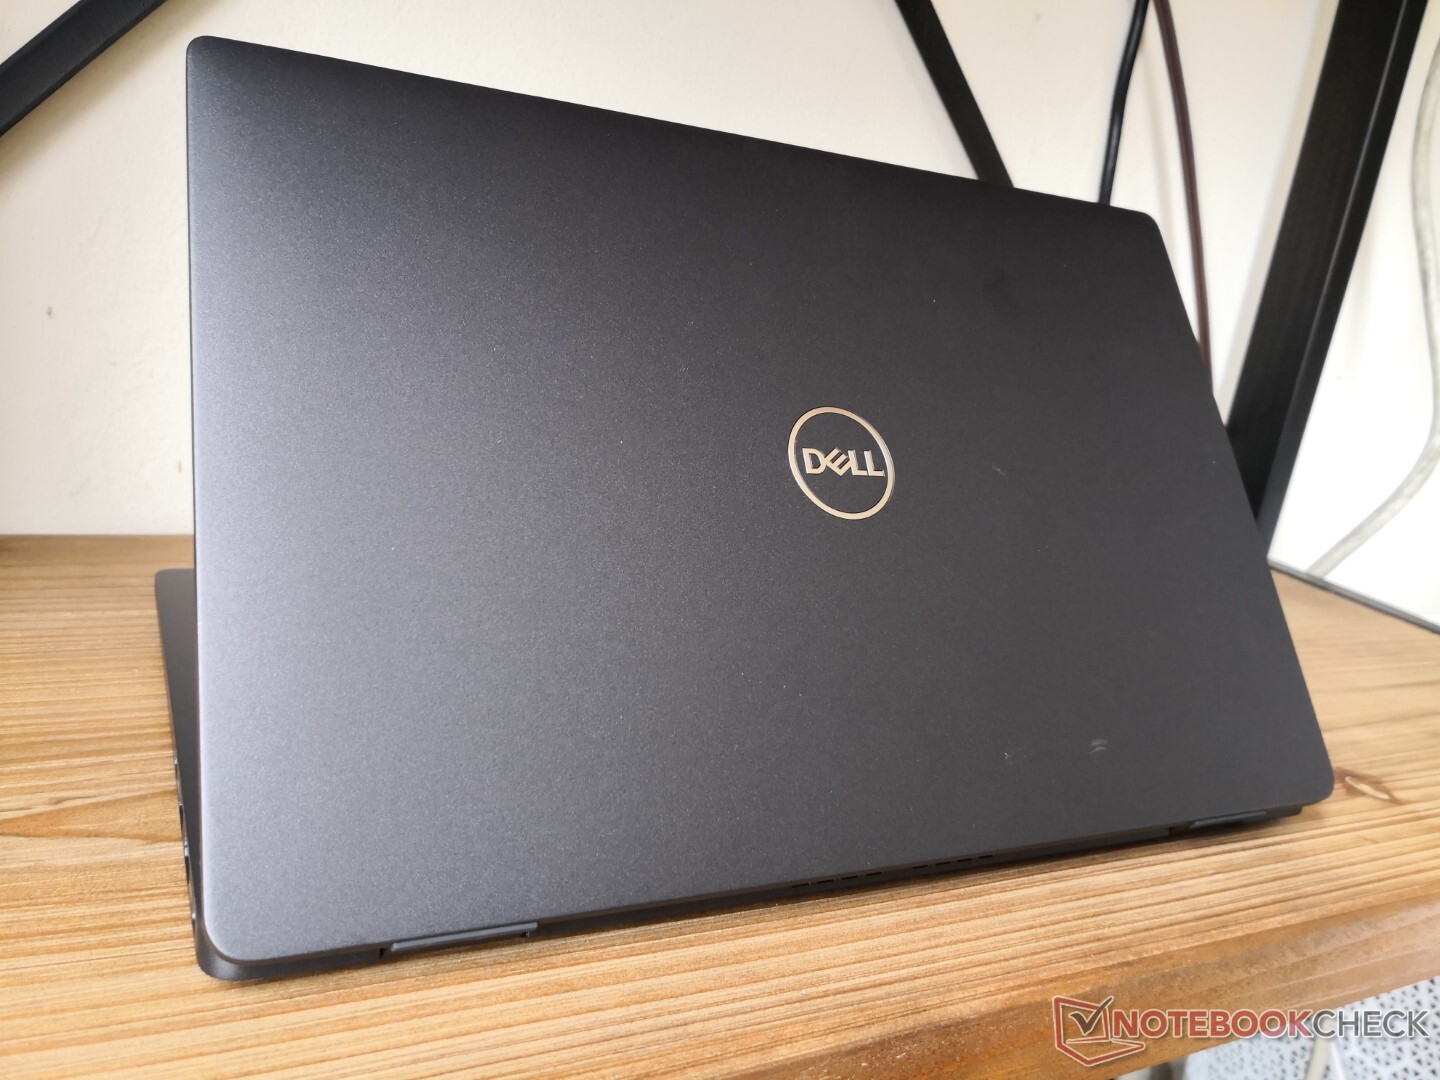
我们的具体审查单位是镁合金Latitude 7330蛤壳,目标重量仅为1公斤,是市场上最轻的13.3英寸商务笔记本电脑之一。其他一些笔记本电脑在过去也曾承诺过类似的超轻设计,如 LG Gram系列, 三星Galaxy Book Pro系列, HP Elite Dragonfly, 或 东芝Portege Z系列所有这些都可以作为Latitude 7330的替代品。我们审查的配置售价约为2000美元。
更多戴尔评论。
潜在的竞争对手比较
Rating | Date | Model | Weight | Height | Size | Resolution | Price |
|---|---|---|---|---|---|---|---|
| 89 % v7 (old) | 07 / 2022 | Dell Latitude 13 7330 i7-1265U, Iris Xe G7 96EUs | 1 kg | 16.96 mm | 13.30" | 1920x1080 | |
| 87.9 % v7 (old) | 02 / 2021 | Lenovo ThinkPad X13 Yoga 20SX0004GE i7-10510U, UHD Graphics 620 | 1.3 kg | 15.95 mm | 13.30" | 1920x1080 | |
| 85.1 % v7 (old) | 07 / 2022 | Framework Laptop 13.5 12th Gen Intel i7-1260P, Iris Xe G7 96EUs | 1.3 kg | 15.85 mm | 13.50" | 2256x1504 | |
| 86.6 % v7 (old) | 12 / 2020 | Razer Book 13 FHD i7-1165G7, Iris Xe G7 96EUs | 1.4 kg | 15.15 mm | 13.40" | 1920x1200 | |
| 89.4 % v7 (old) | 09 / 2020 | Dell Latitude 7310 i7-10610U, UHD Graphics 620 | 1.2 kg | 18.3 mm | 13.30" | 1920x1080 | |
| 85.2 % v7 (old) | 06 / 2021 | Microsoft Surface Laptop 4 13 Ryzen 5 R5 4680U, Vega 7 | 1.3 kg | 14 mm | 13.50" | 2256x1504 |
案例--三种不同的选择
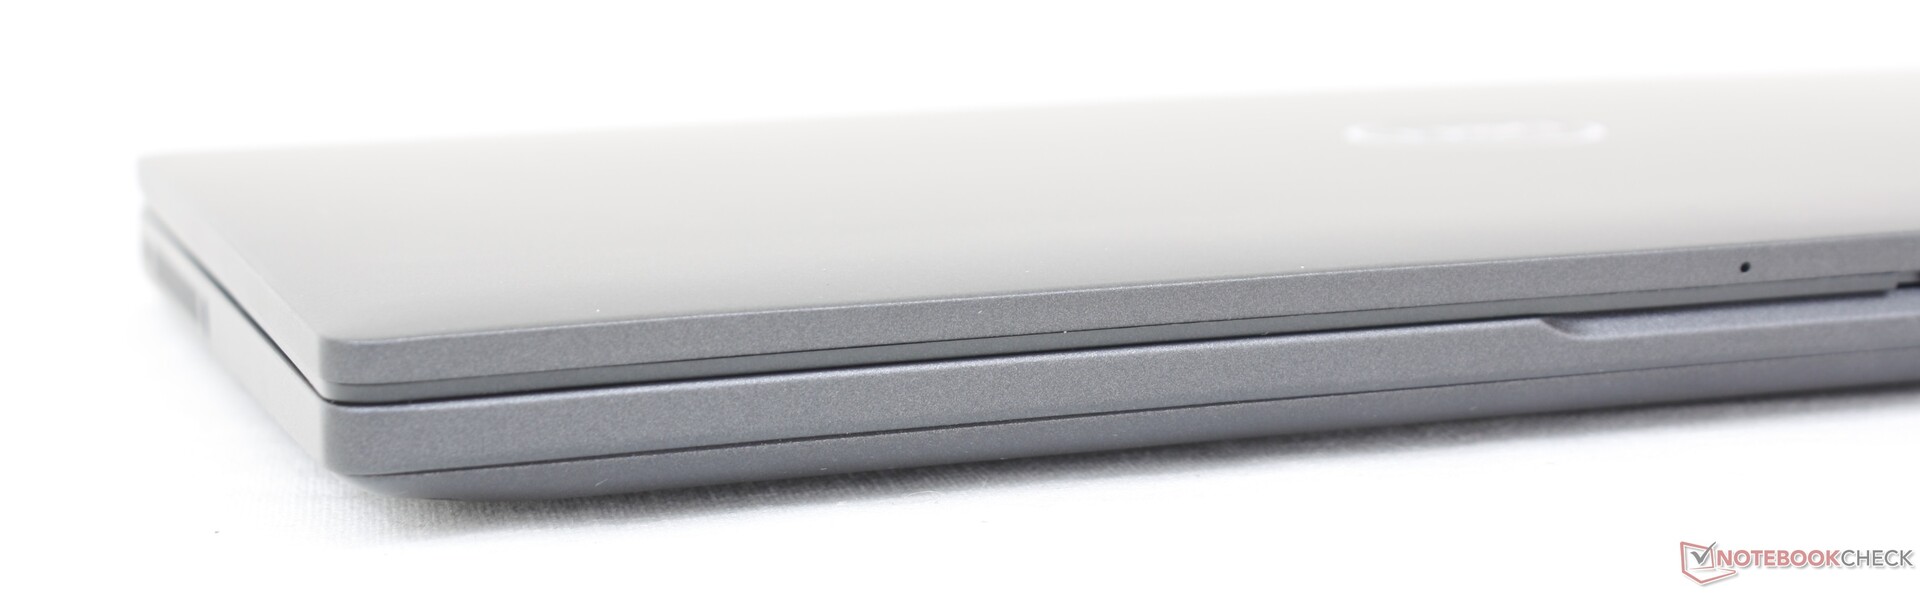
承诺1公斤甚至更轻的13英寸笔记本电脑已经存在,但它们几乎总是伴随着一些注意事项。最值得注意的是,这类机型通常表现出更多的弯曲,当涉及到耐用性时,整体印象较弱。只需花一分钟时间,将LG Gram 13与更重的 戴尔XPS 13 9310和它们的骨架的薄度差异就会立即显现出来。Latitude 7330在某种程度上避免了这一趋势,它比预期的1公斤的结构更加坚硬。例如,底座几乎没有像上述LG那样扭曲或弯曲。整体刚性介于Gram 13和XPS 13之间,如果你重视超轻的重量,我们认为这是一个公平的权衡。
仅1公斤的极低重量是镁合金选项的主要卖点。在这个尺寸类别中,大多数副笔记本通常要重几百克,在旅行或外出工作时非常明显。整体尺寸只是略小于 Latitude 7310它已经相当小了。
选择碳纤维或铝制选项,会比我们的镁制选项分别增加约160克和240克的重量。


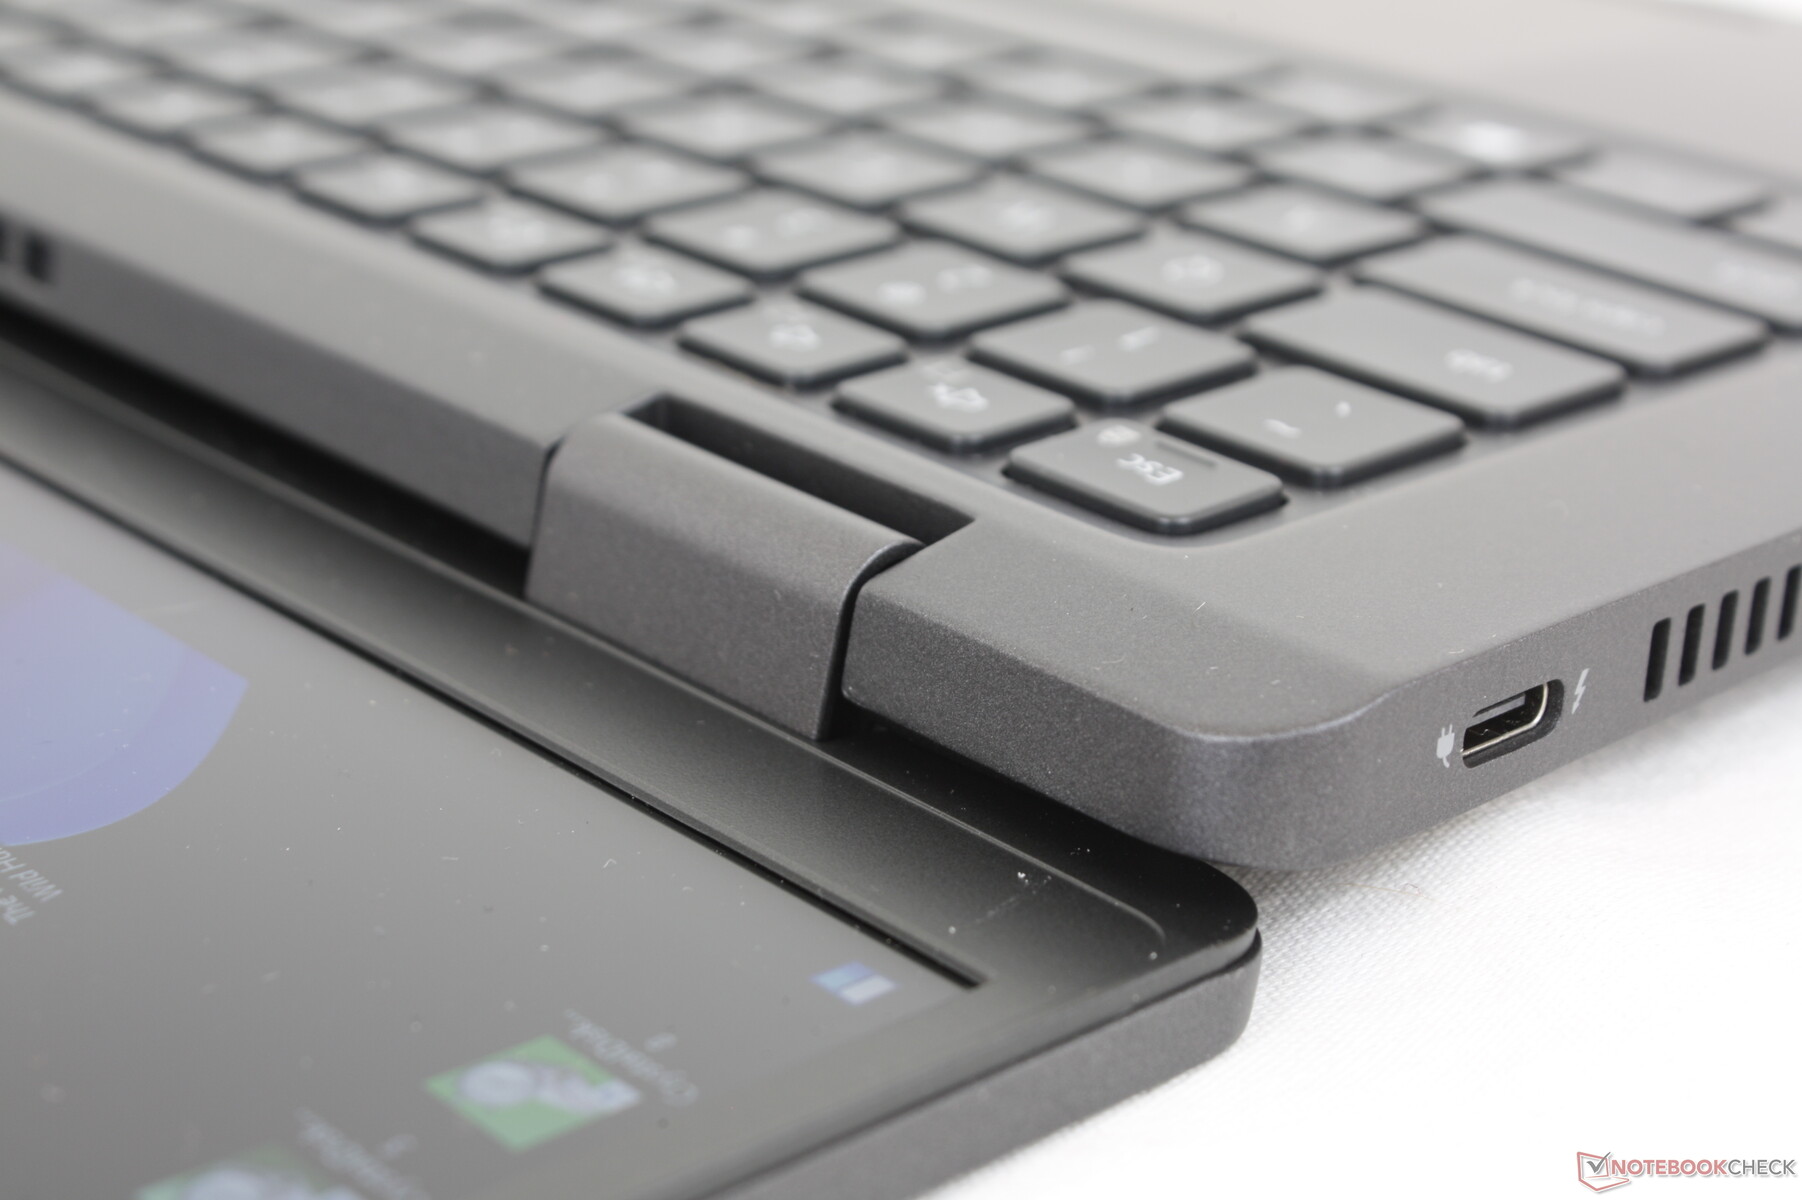

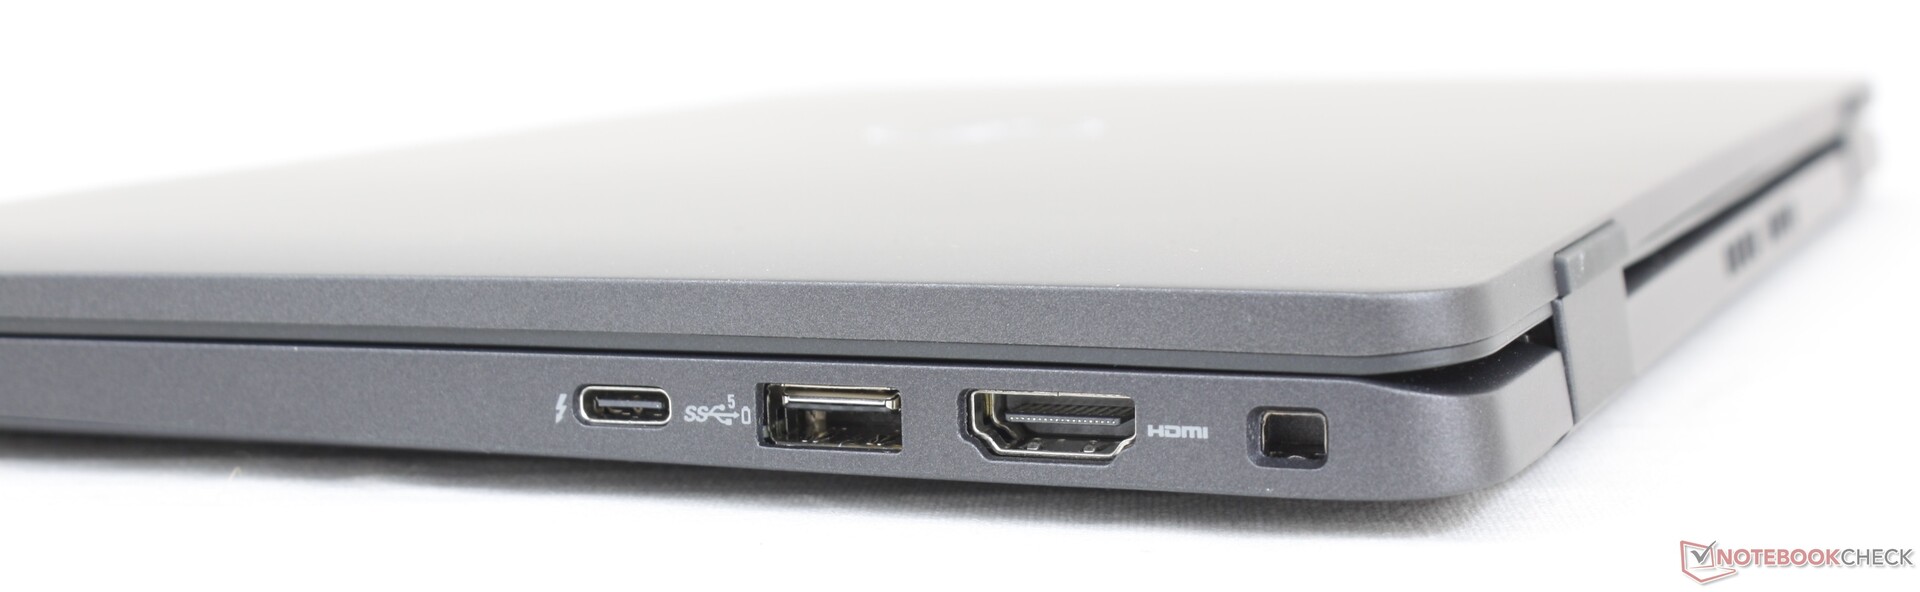
连接性 - 支持Thunderbolt 4
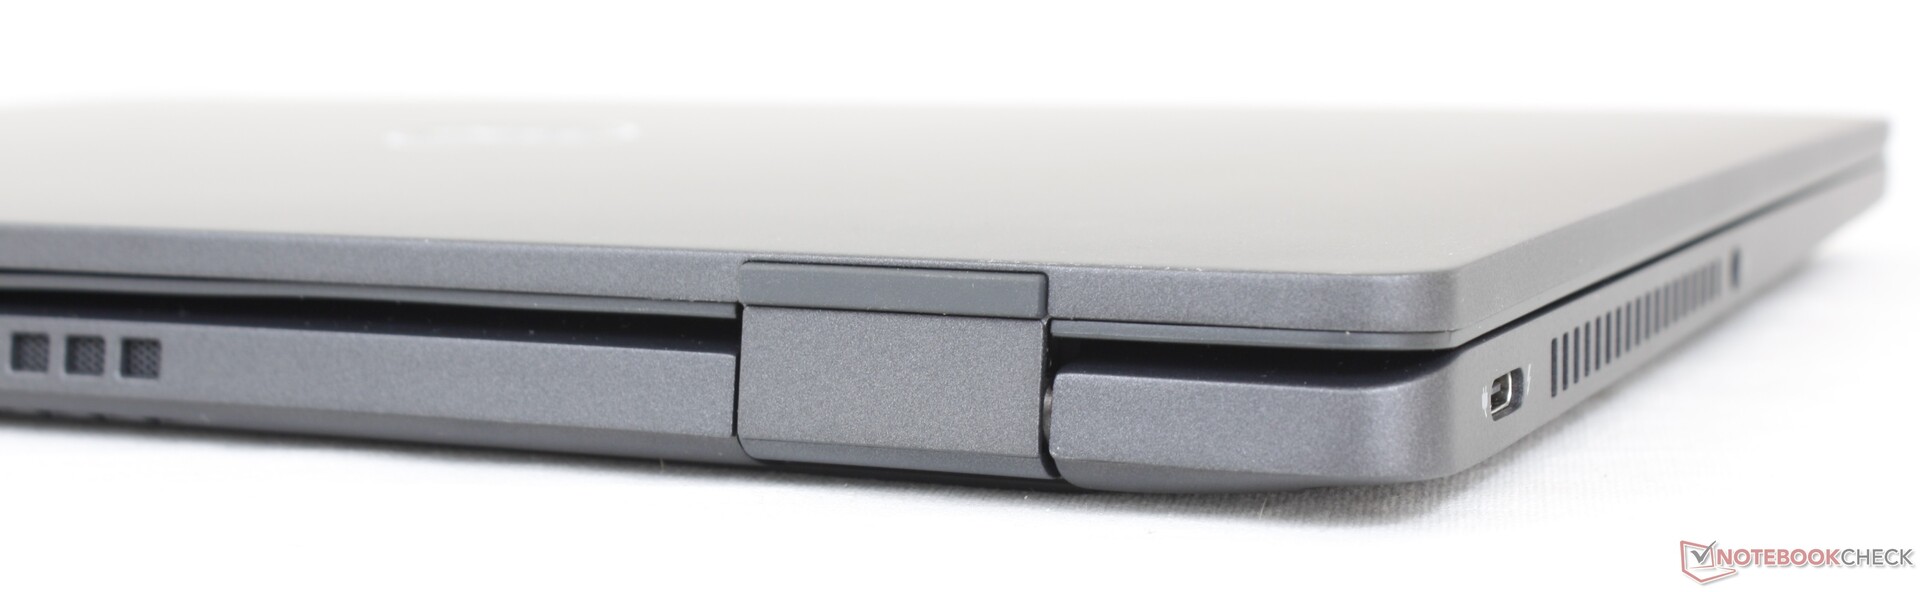
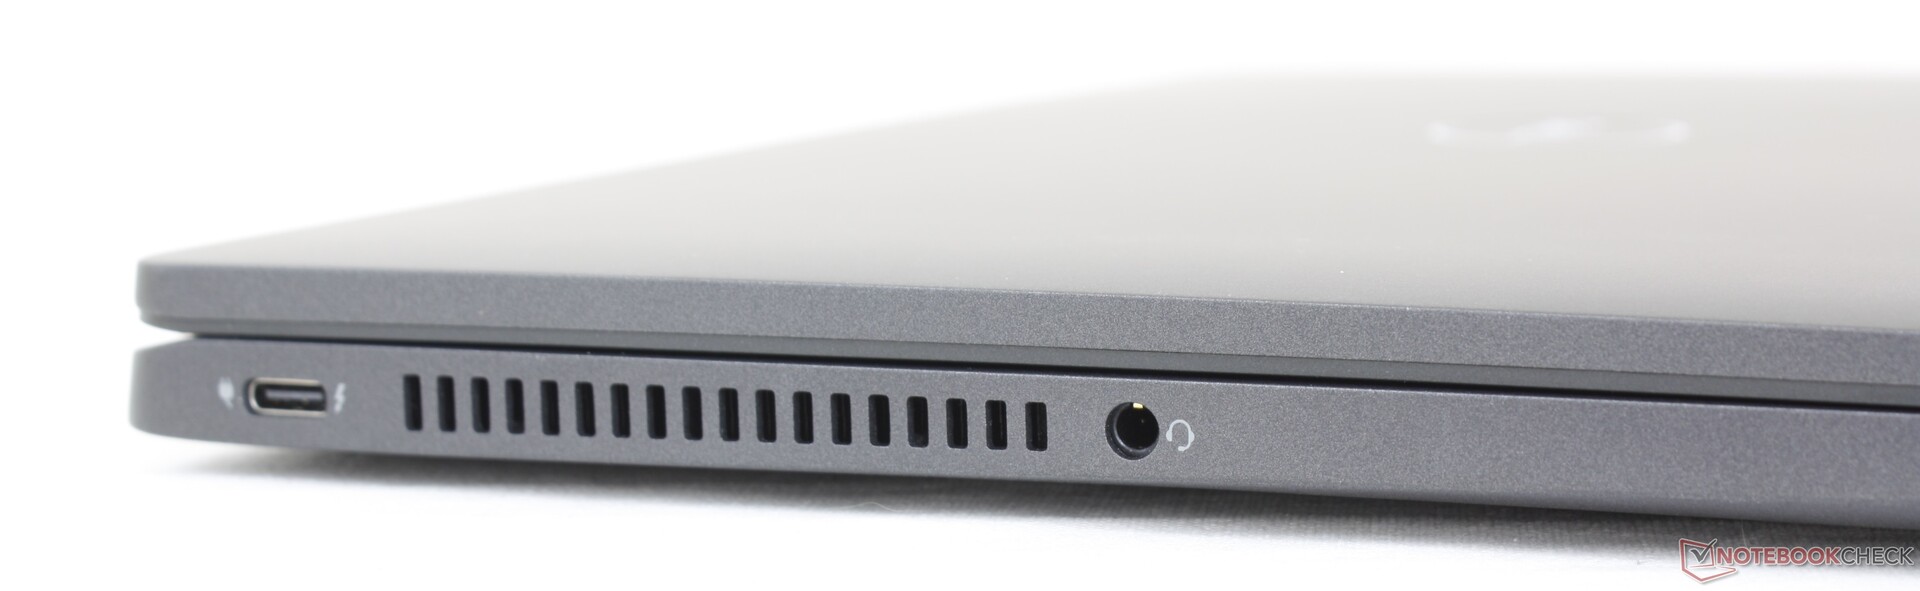
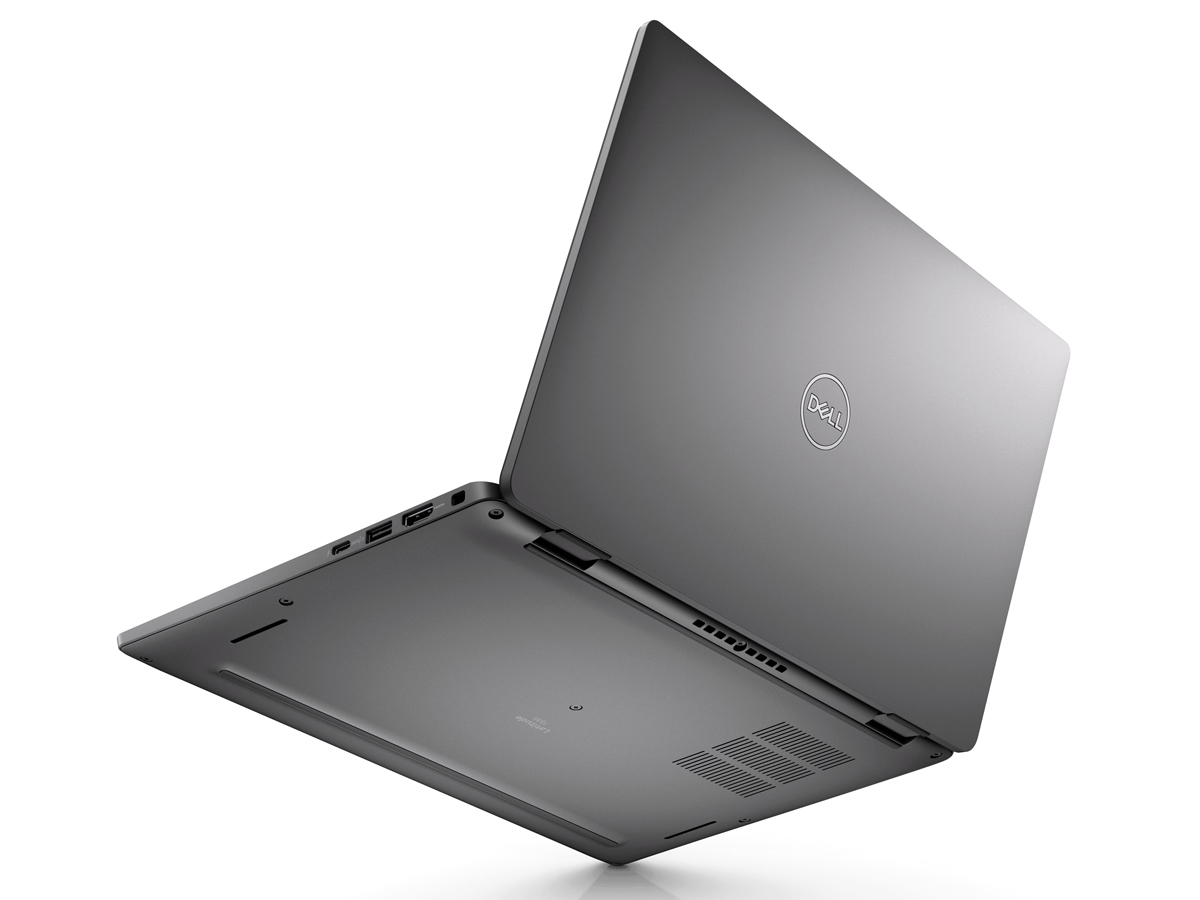
端口选项与Latitude 7310上的相同,但经过重新安排,以提高便利性。例如,两个USB-C接口现在分别位于机身的左侧和右侧,而老款产品只有左侧。这一变化使用户可以从任何一侧为笔记本电脑充电。
通信 - 可选的LTE
英特尔AX211的标准配置是Wi-Fi 6E和蓝牙5.2连接。在与我们的6GHz网络配对时,我们没有遇到重大的连接问题。对大多数用户来说,Wi-Fi 6和Wi-Fi 6E之间的性能差异将是最小的。
虽然我们的设备没有配置广域网,但用户可以选择配置一个支持eSIM的高通骁龙X20 LTE-A CAT 9或CAT 16模块。
| Networking | |
| iperf3 transmit AX12 | |
| Microsoft Surface Laptop 4 13 Ryzen 5 | |
| Dell Latitude 7310 | |
| Razer Book 13 FHD | |
| Lenovo ThinkPad X13 Yoga 20SX0004GE | |
| iperf3 receive AX12 | |
| Razer Book 13 FHD | |
| Microsoft Surface Laptop 4 13 Ryzen 5 | |
| Dell Latitude 7310 | |
| Lenovo ThinkPad X13 Yoga 20SX0004GE | |
| iperf3 receive AXE11000 6GHz | |
| Framework Laptop 13.5 12th Gen Intel | |
| Dell Latitude 13 7330 | |
| iperf3 transmit AXE11000 6GHz | |
| Dell Latitude 13 7330 | |
| Framework Laptop 13.5 12th Gen Intel | |
网络摄像头
用户可以在高清(720p)或FHD(1080p)网络摄像头之间进行配置,并可选择支持Windows Hello的IR。我们建议升级到1080p,因为我们的720p配置的图片质量是模糊的,而且粗暴地过时了。
为了保护隐私,安装了一个手动快门滑块。


维护
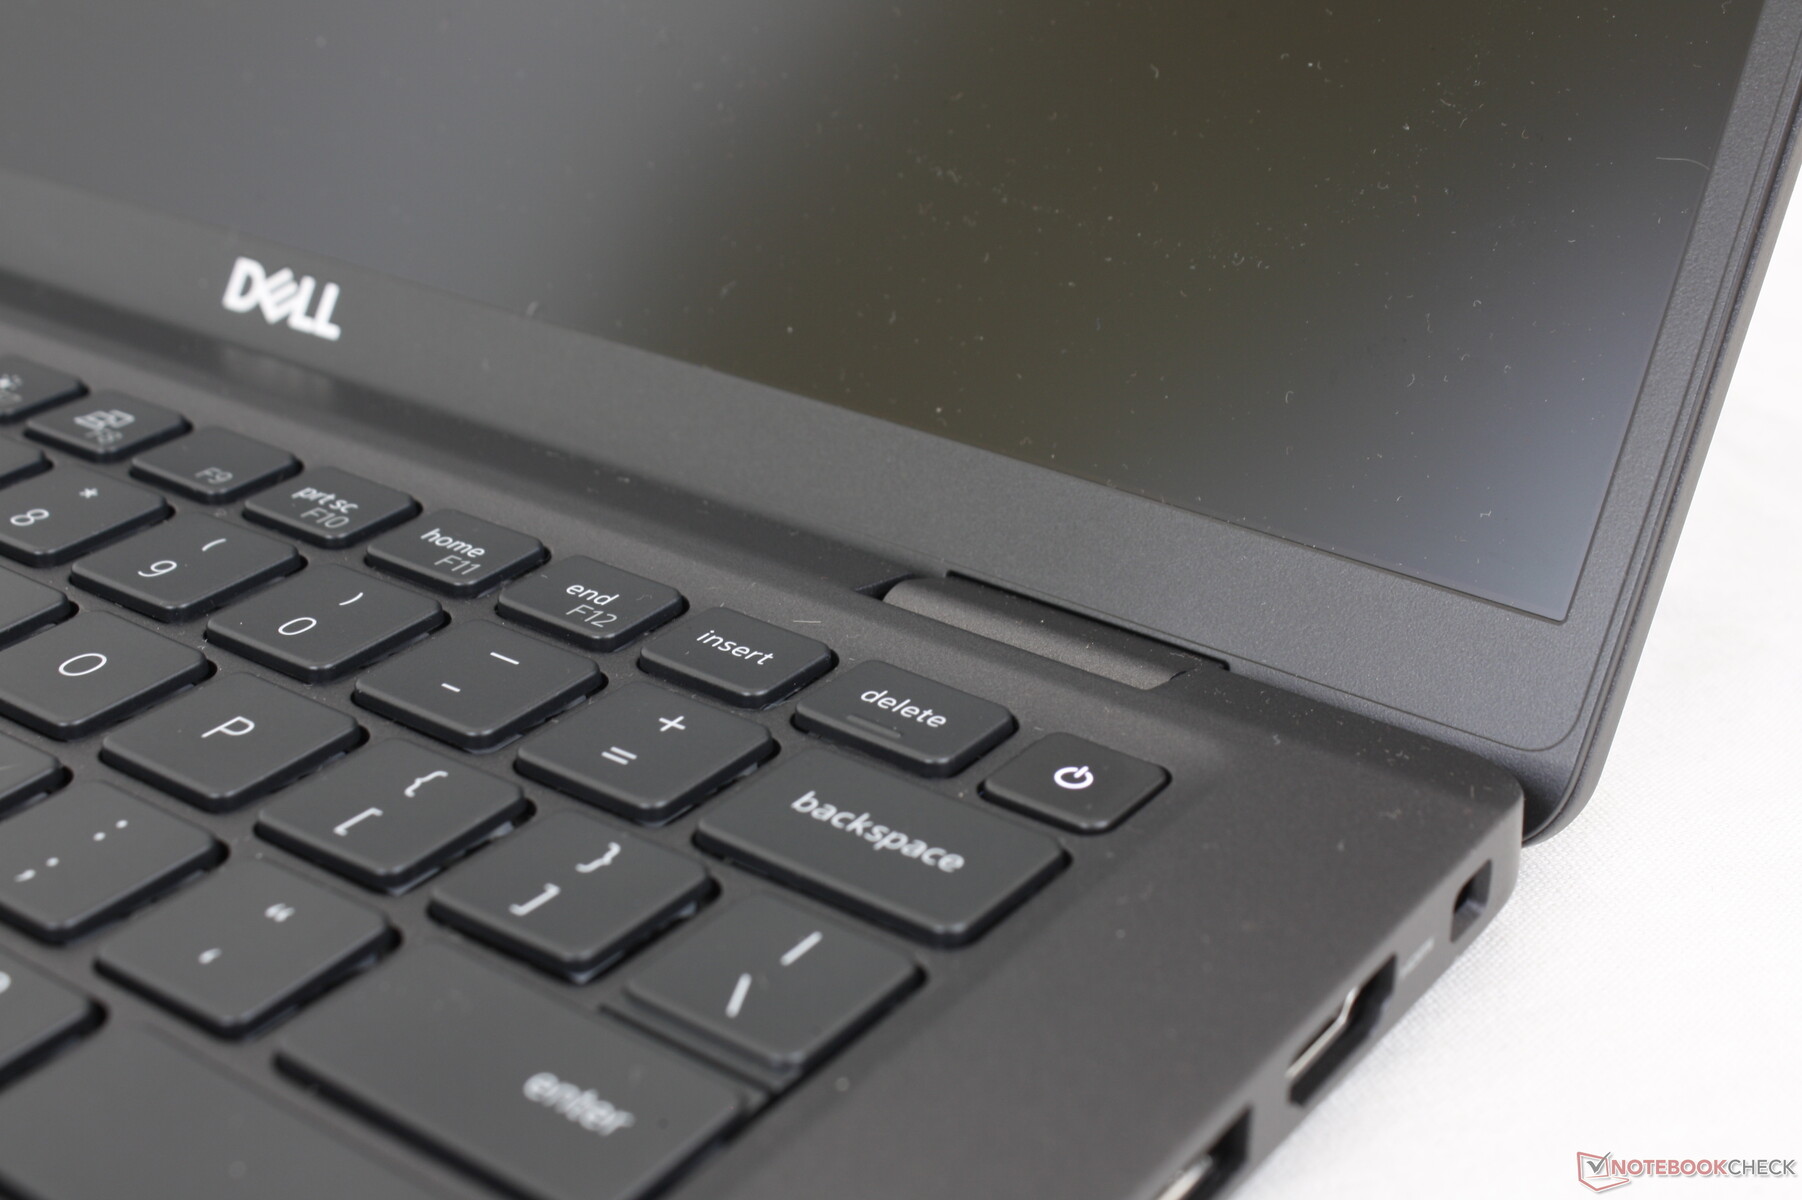
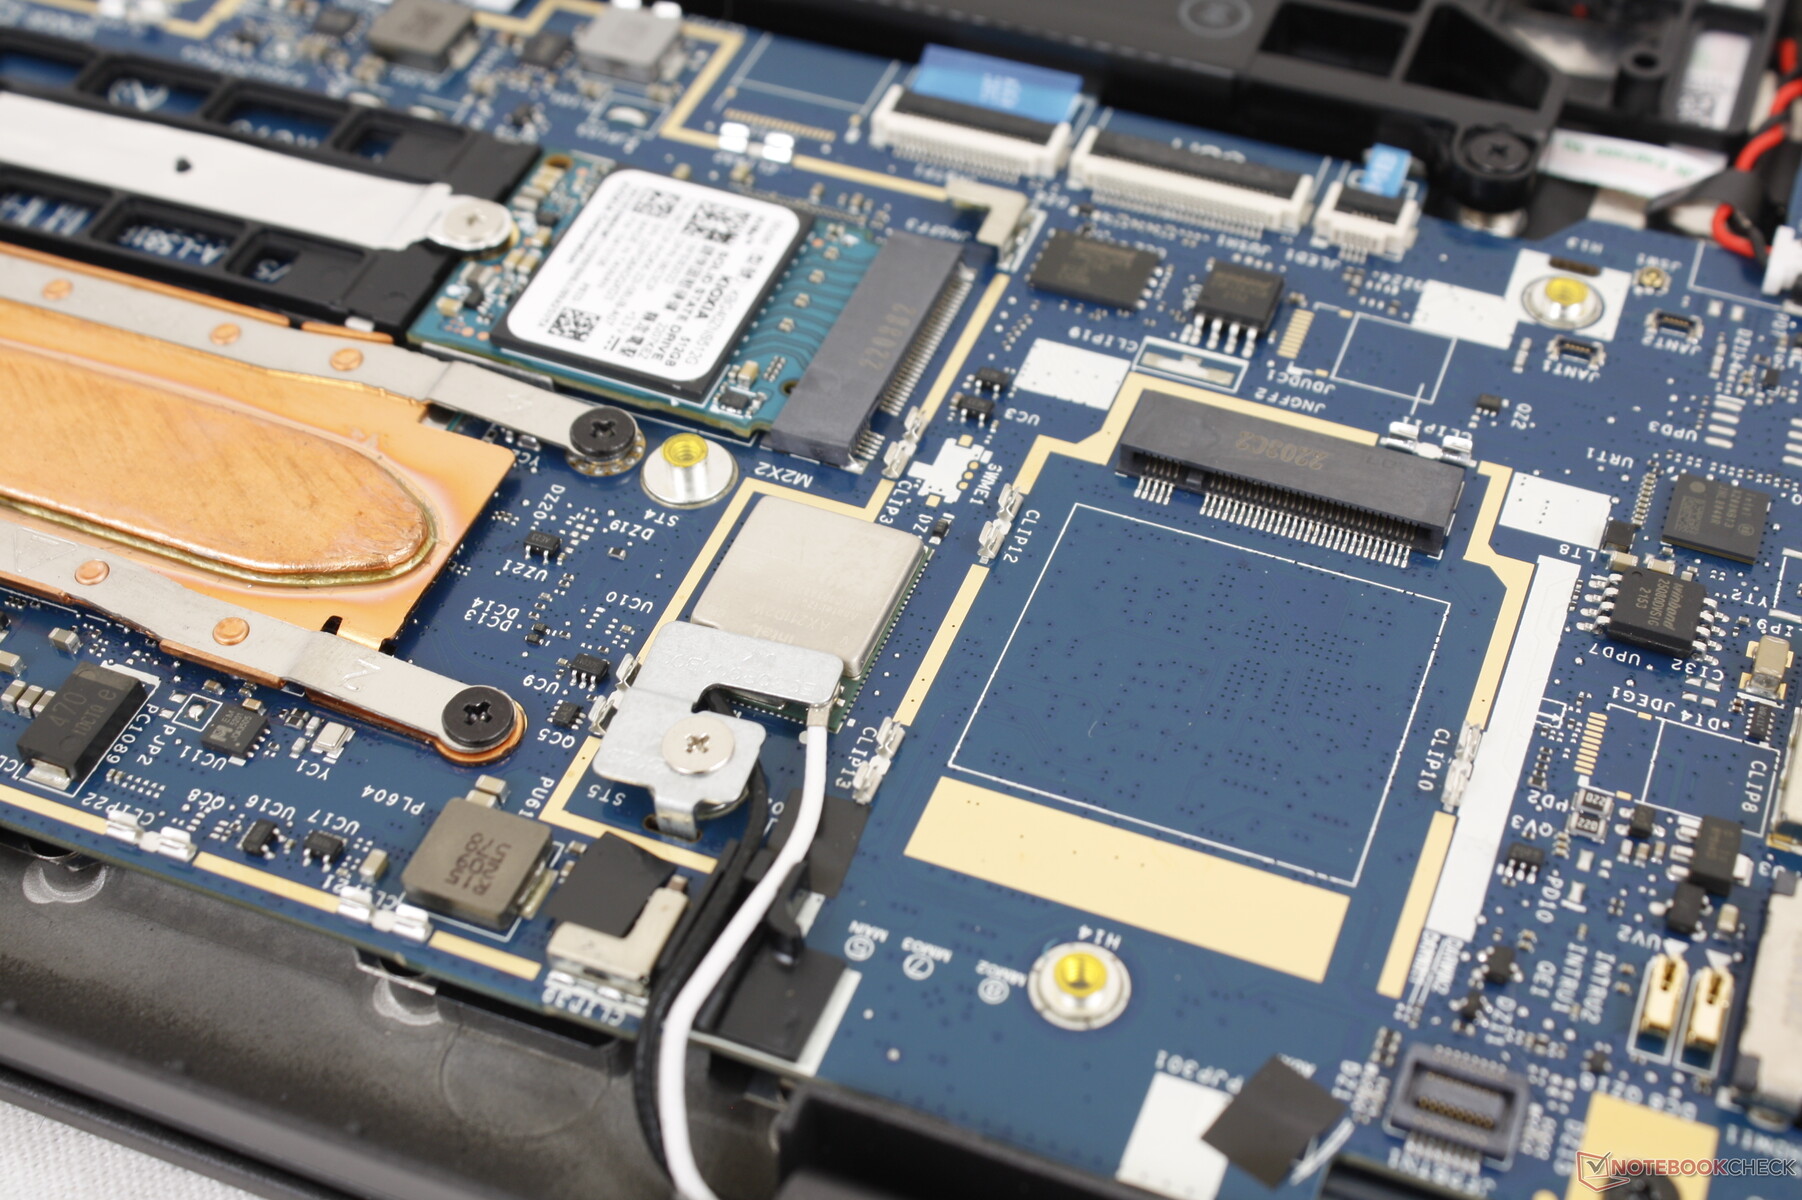
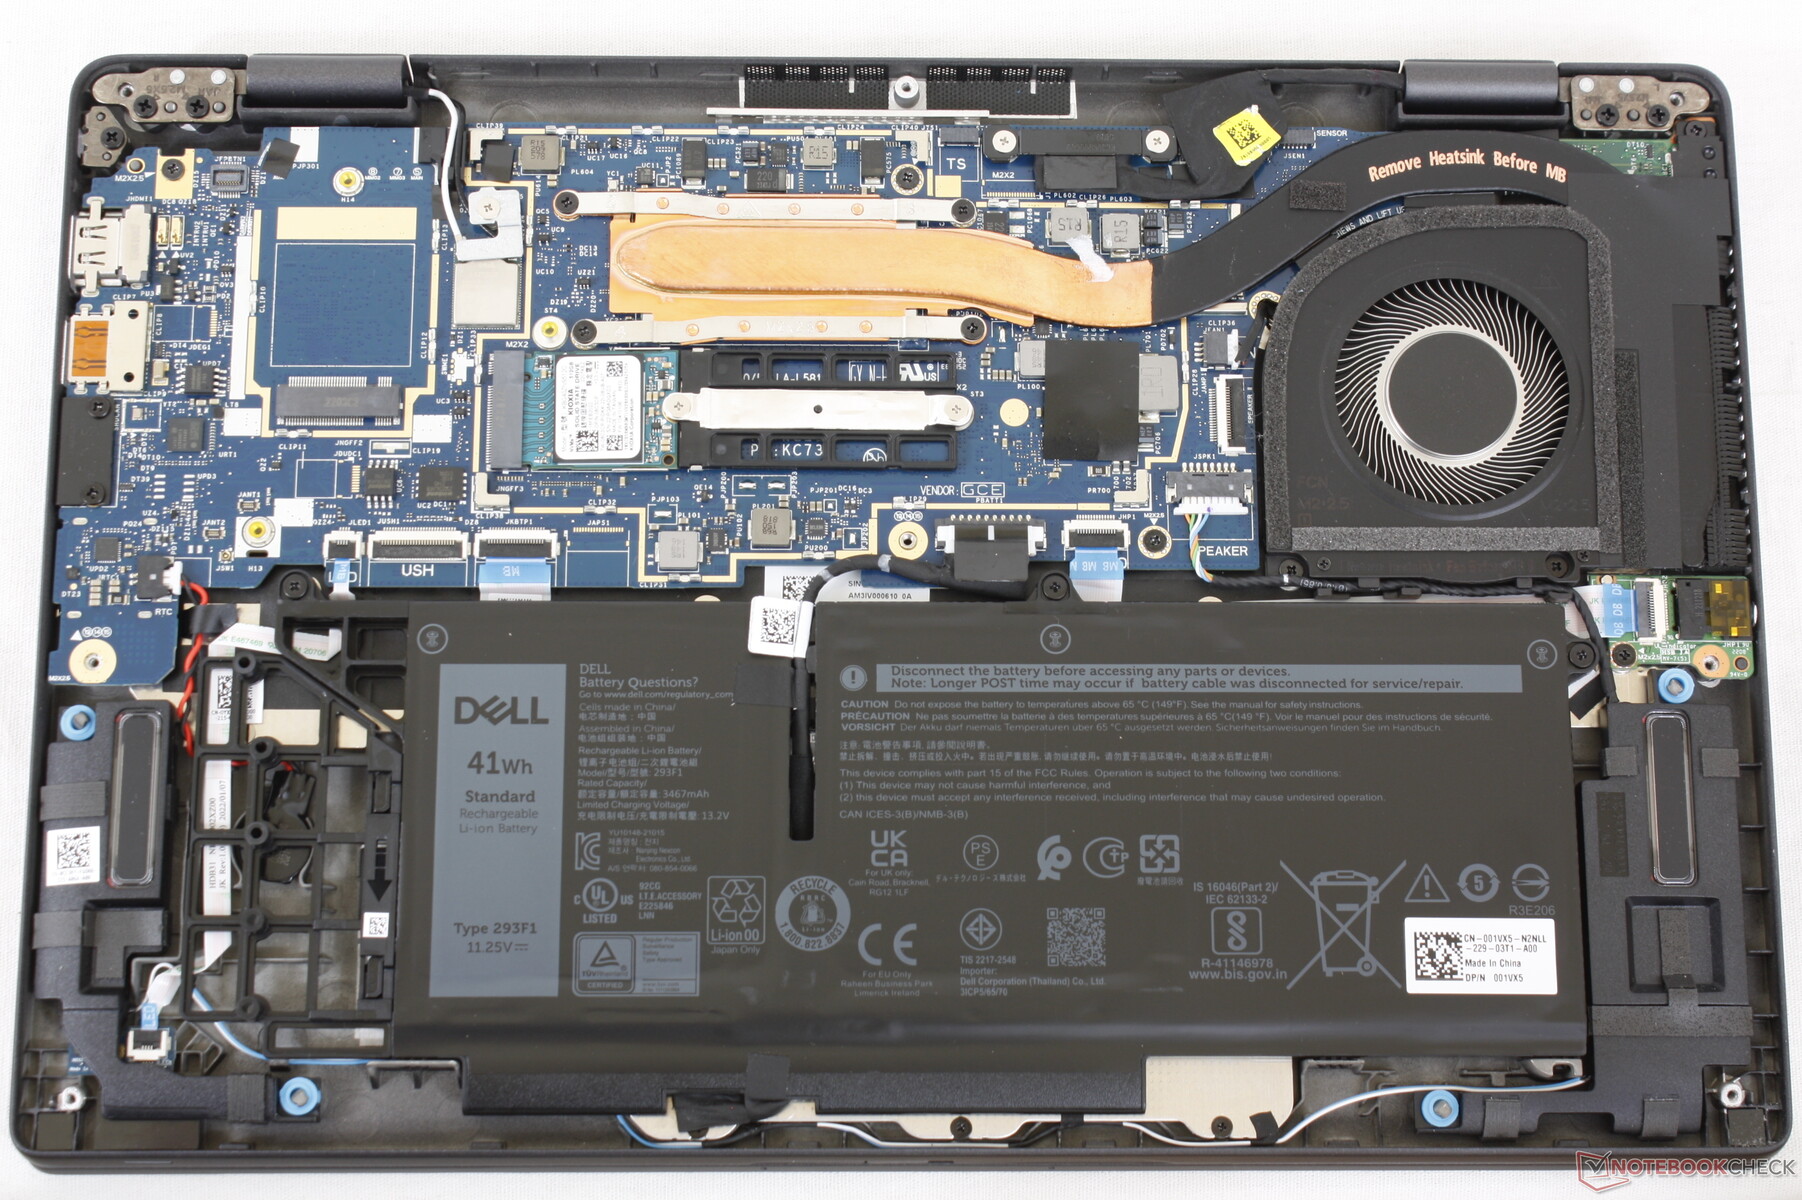
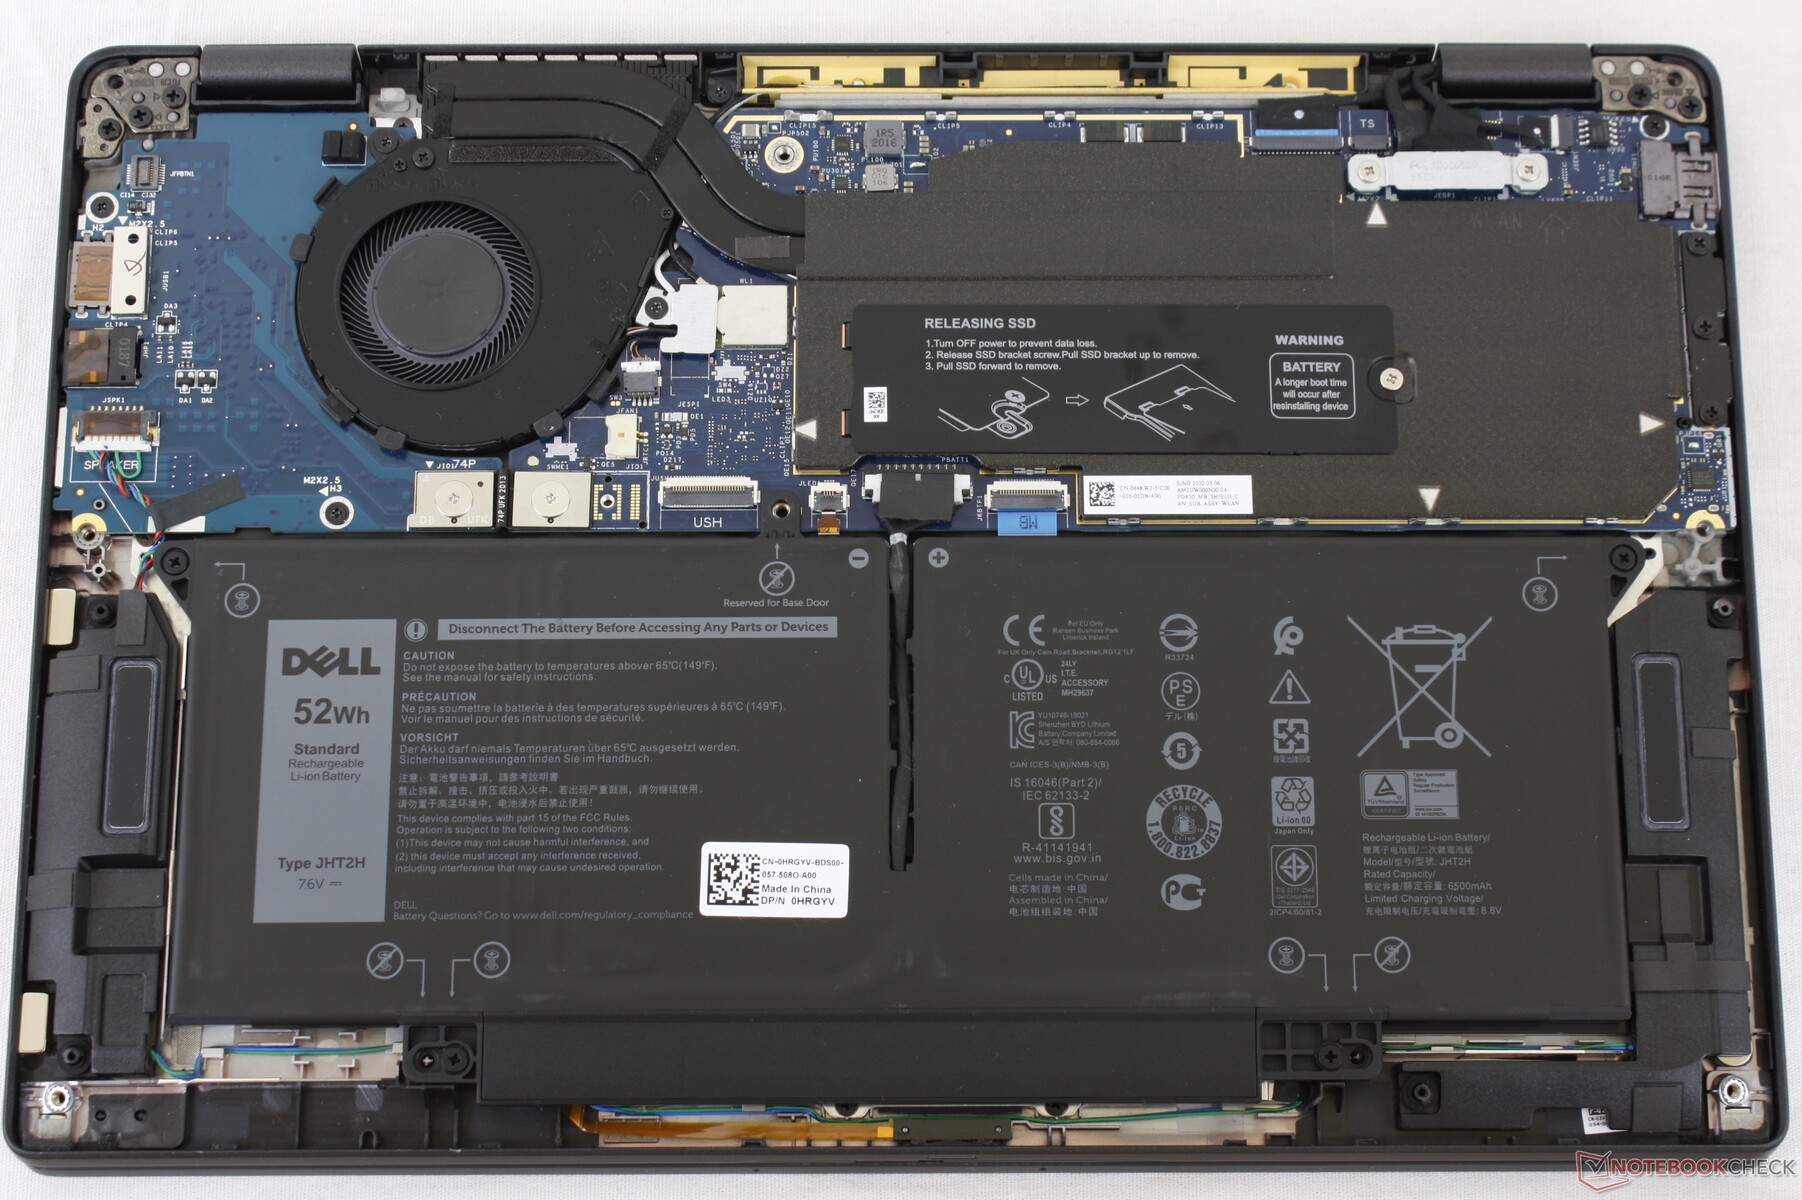
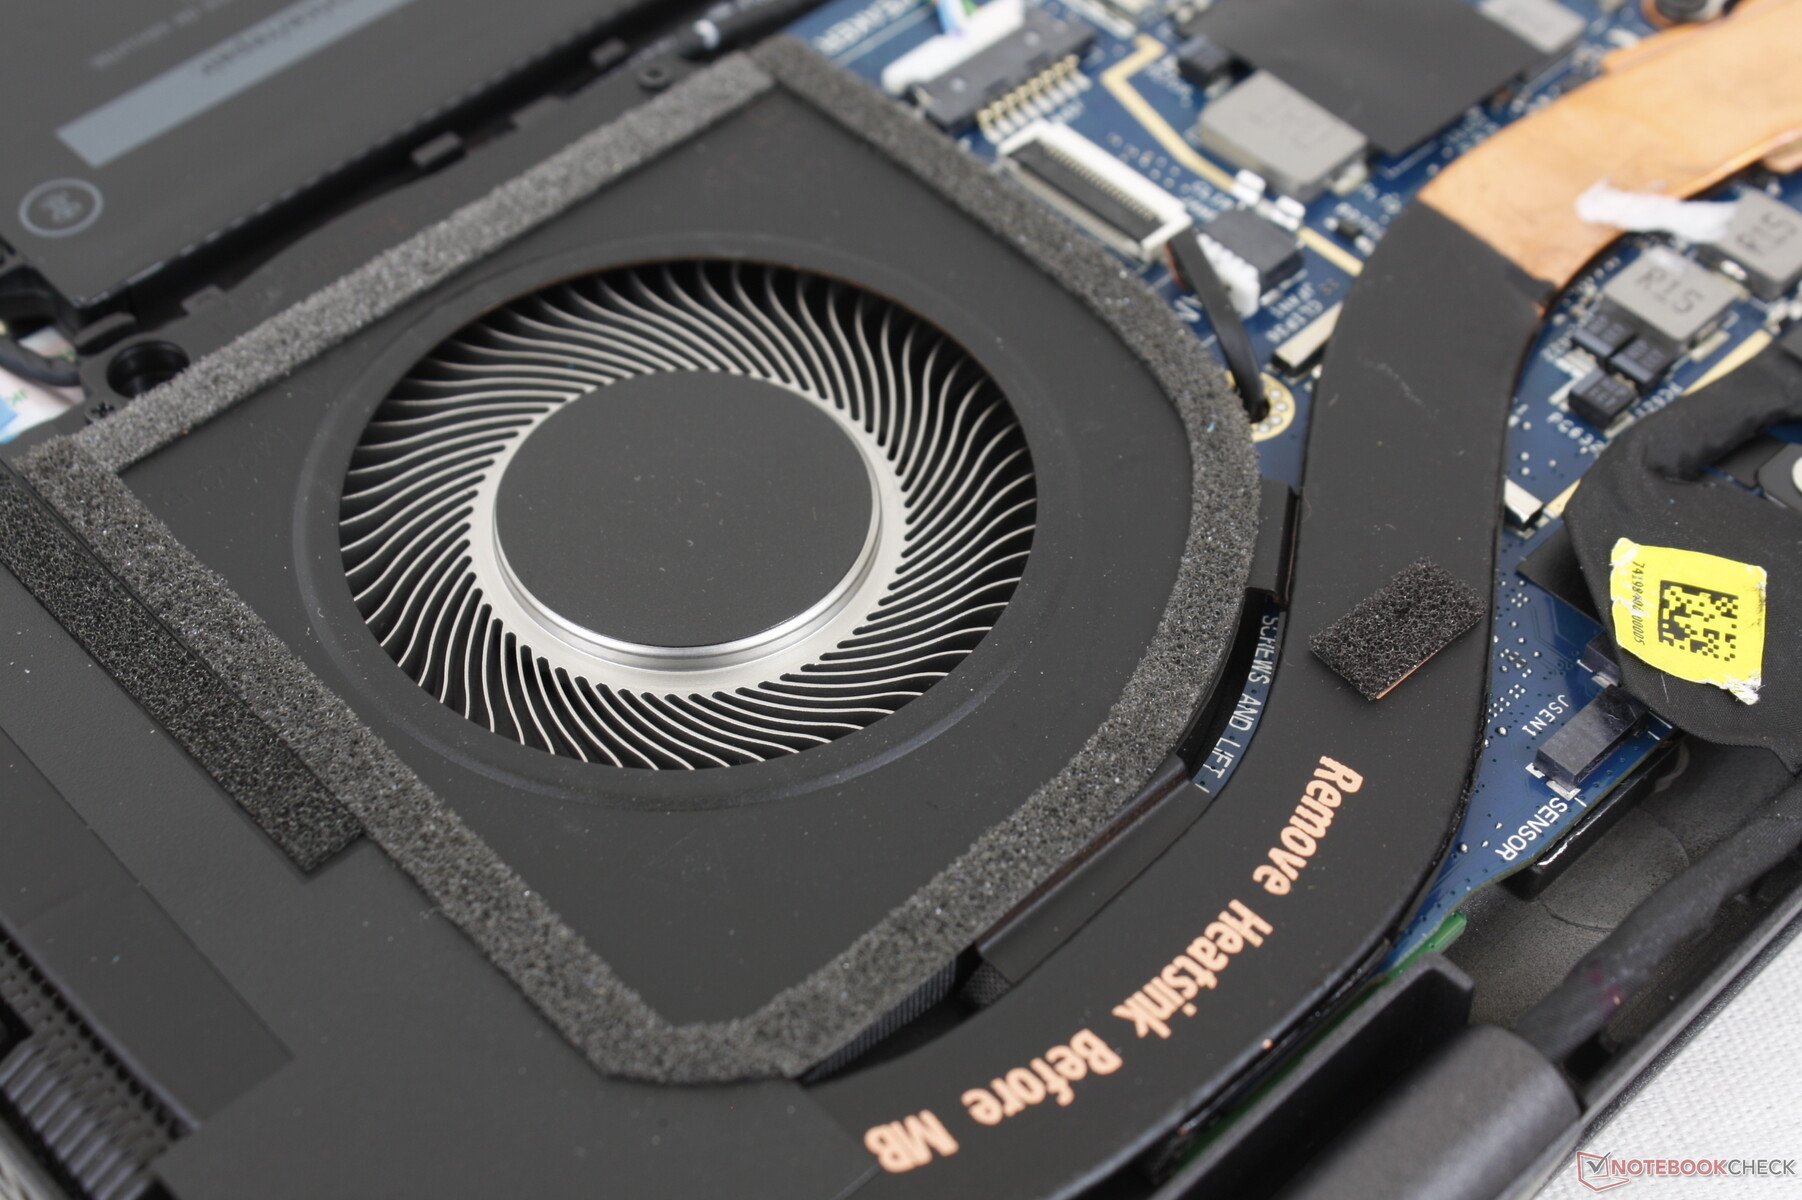
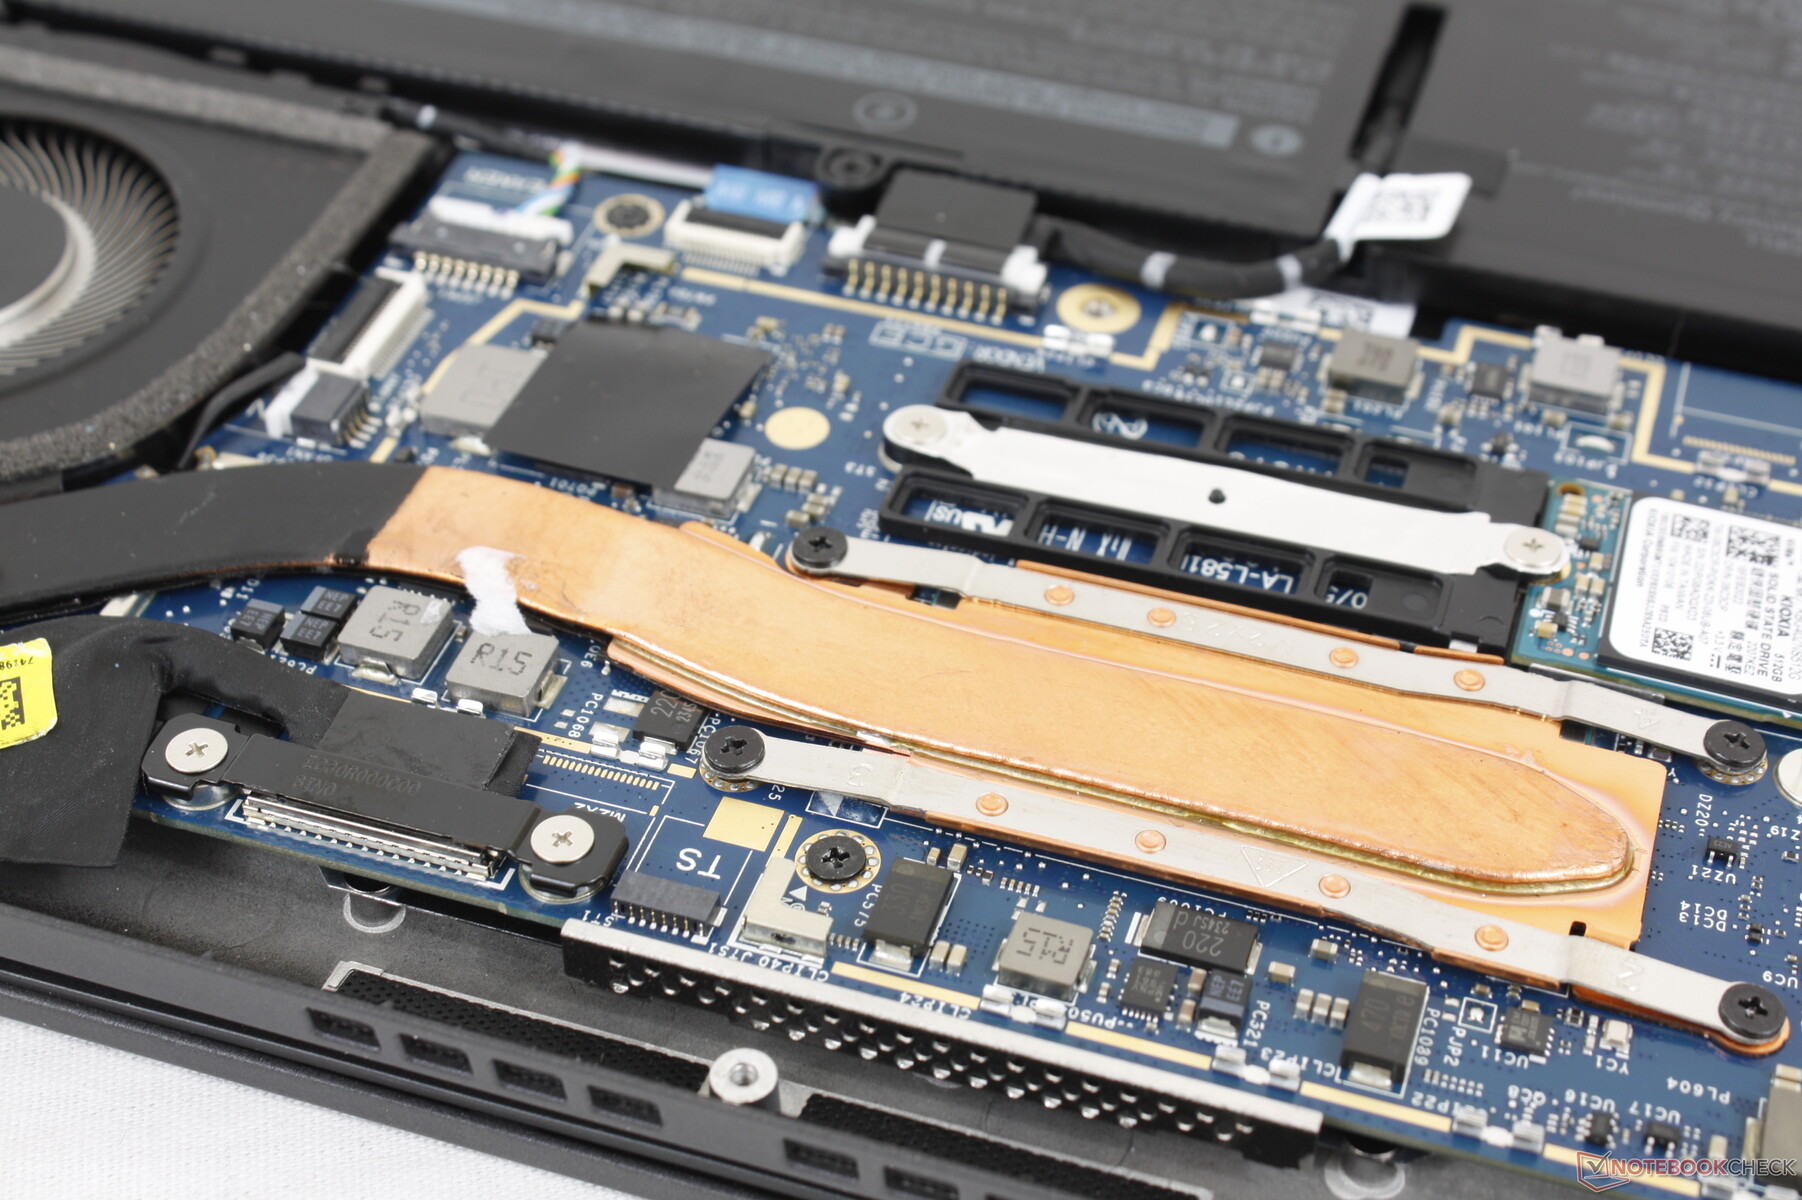
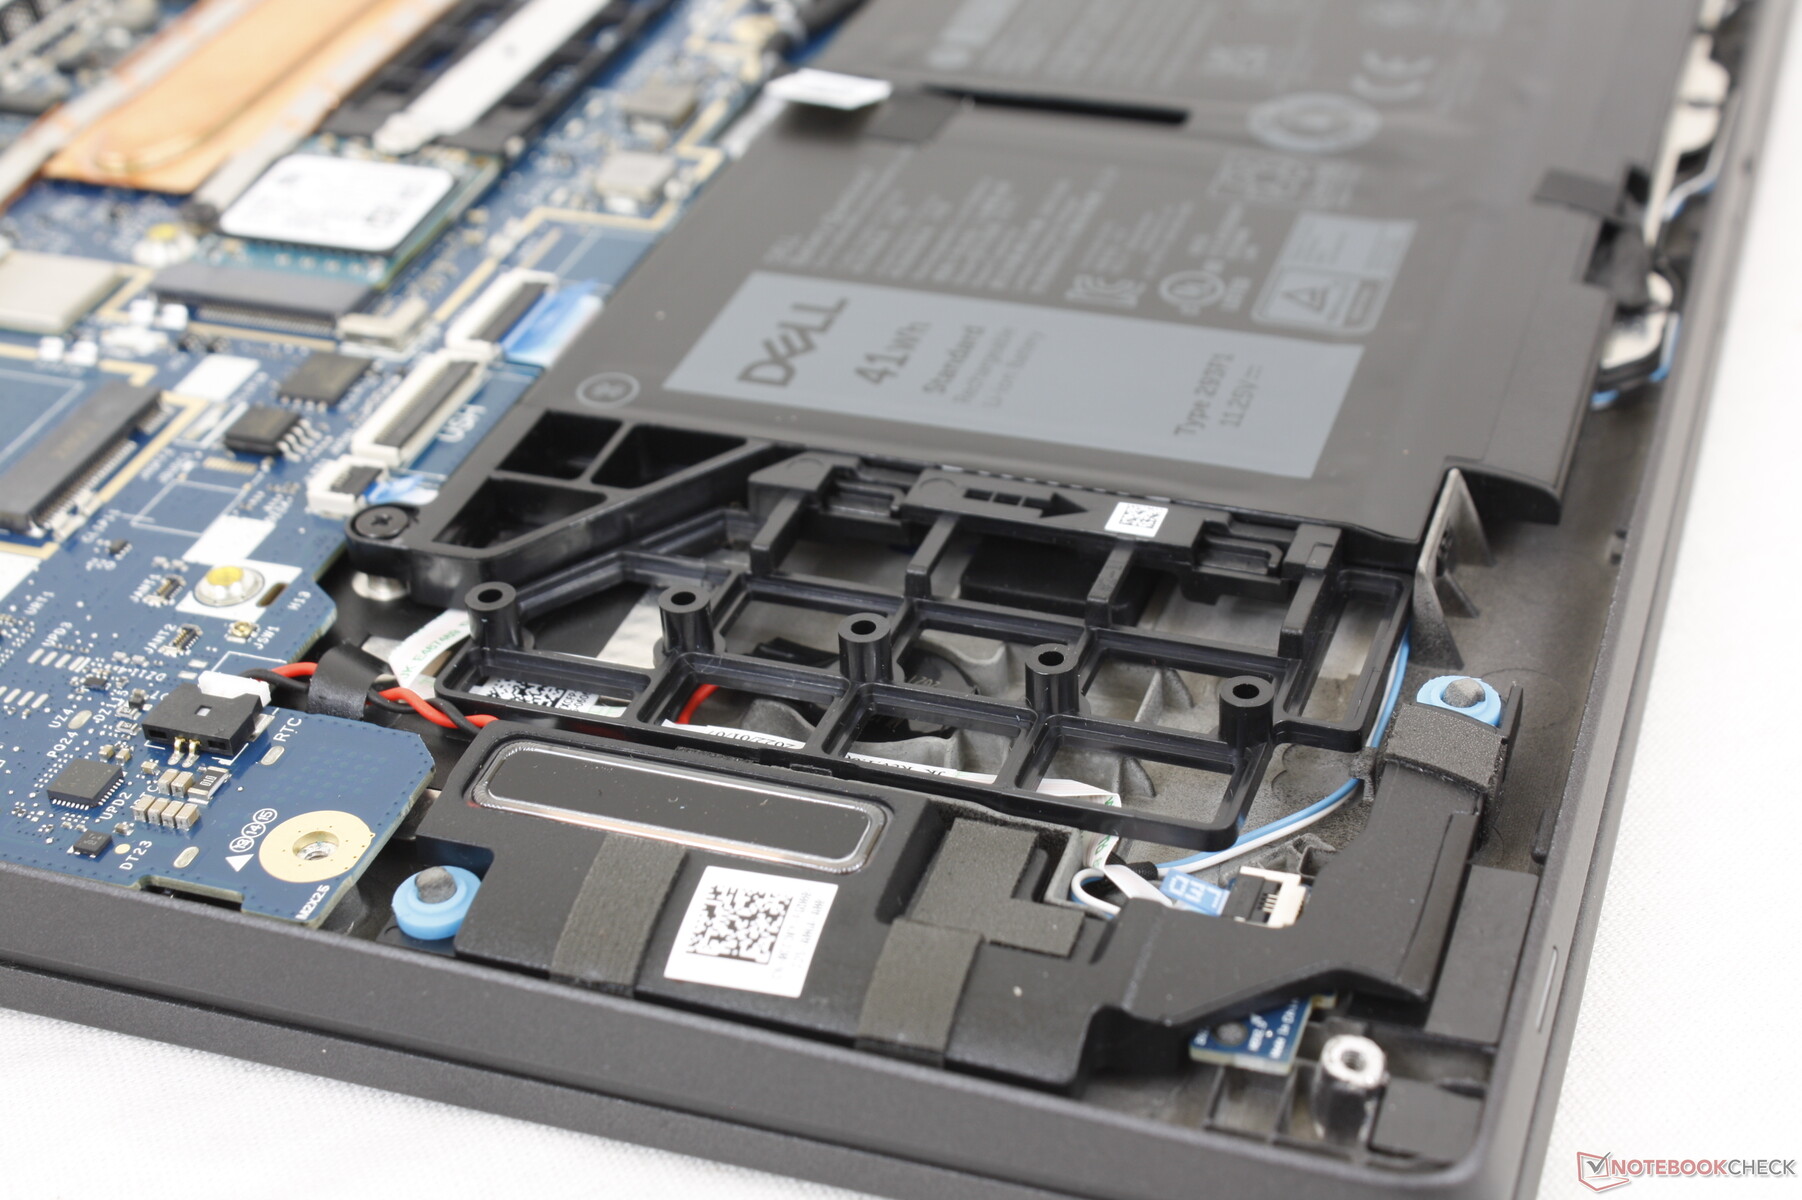
底部面板只需一把飞利浦螺丝刀就可以轻松拆卸。除了M.2固态硬盘和电池之外,没有什么需要维修的,因为WLAN和RAM模块是焊接的。
请注意,如果不配置广域网,则不包括天线,以阻止用户安装自己的广域网模块。此外,注意41Wh电池左边的空位,以减轻重量;如果配置更大的58Wh电池,这个空间就会被占用。
配件和保修
除了交流电适配器和文件之外,盒子里没有任何额外的东西。按照大多数Latitude 型号的惯例,三年的保修期是标准的。
输入设备 - 和以前一样
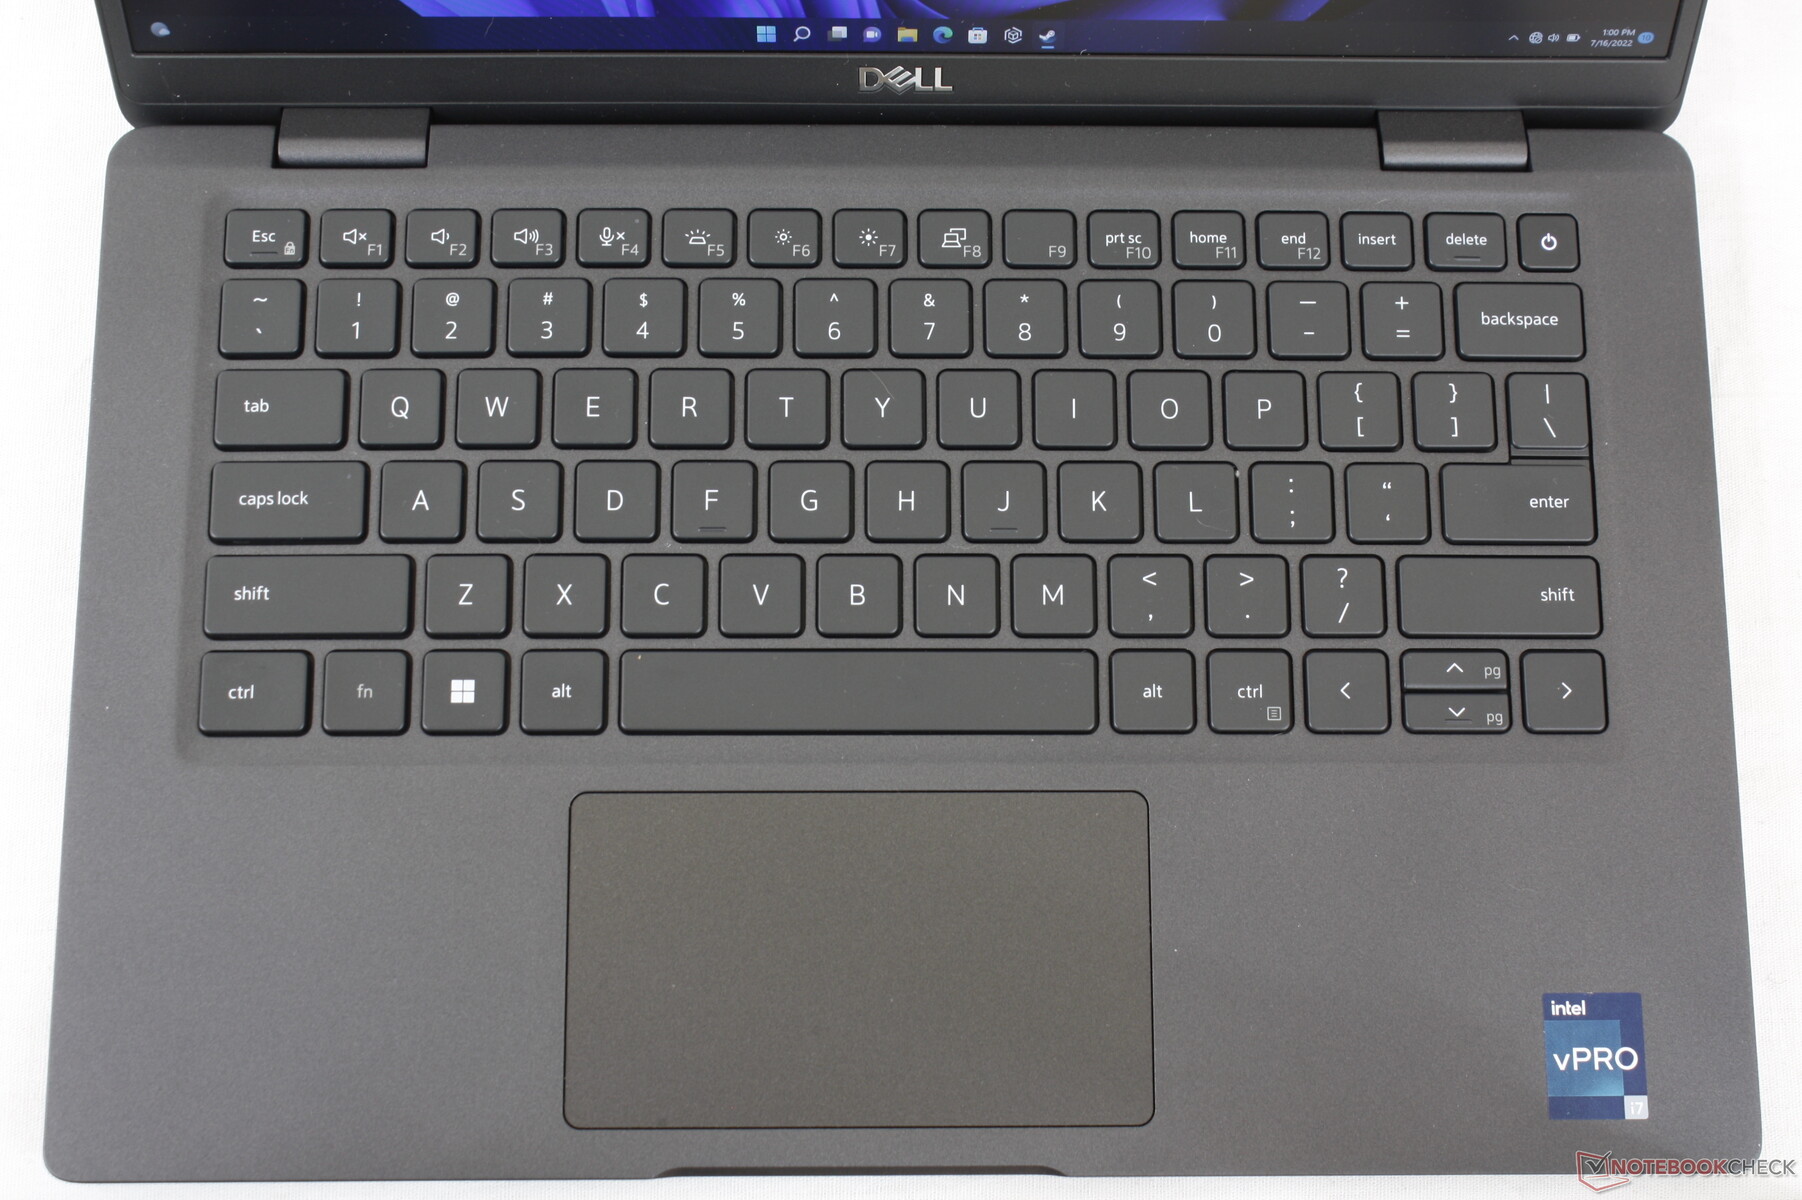
键盘
戴尔在Latitude 7310和Latitude 7330之间没有对键盘进行改动。事实上,许多较新的Latitude 型号共享相同的键盘设计和布局,包括Latitude 7400 7410、7310和7330。我们发现,与XPS 13的较轻按键相比,Latitude 的较硬按键在打字时更舒适。LG Gram 14的按键或 惠普EliteBook系列有更清晰或更锐利的反馈。
触摸板
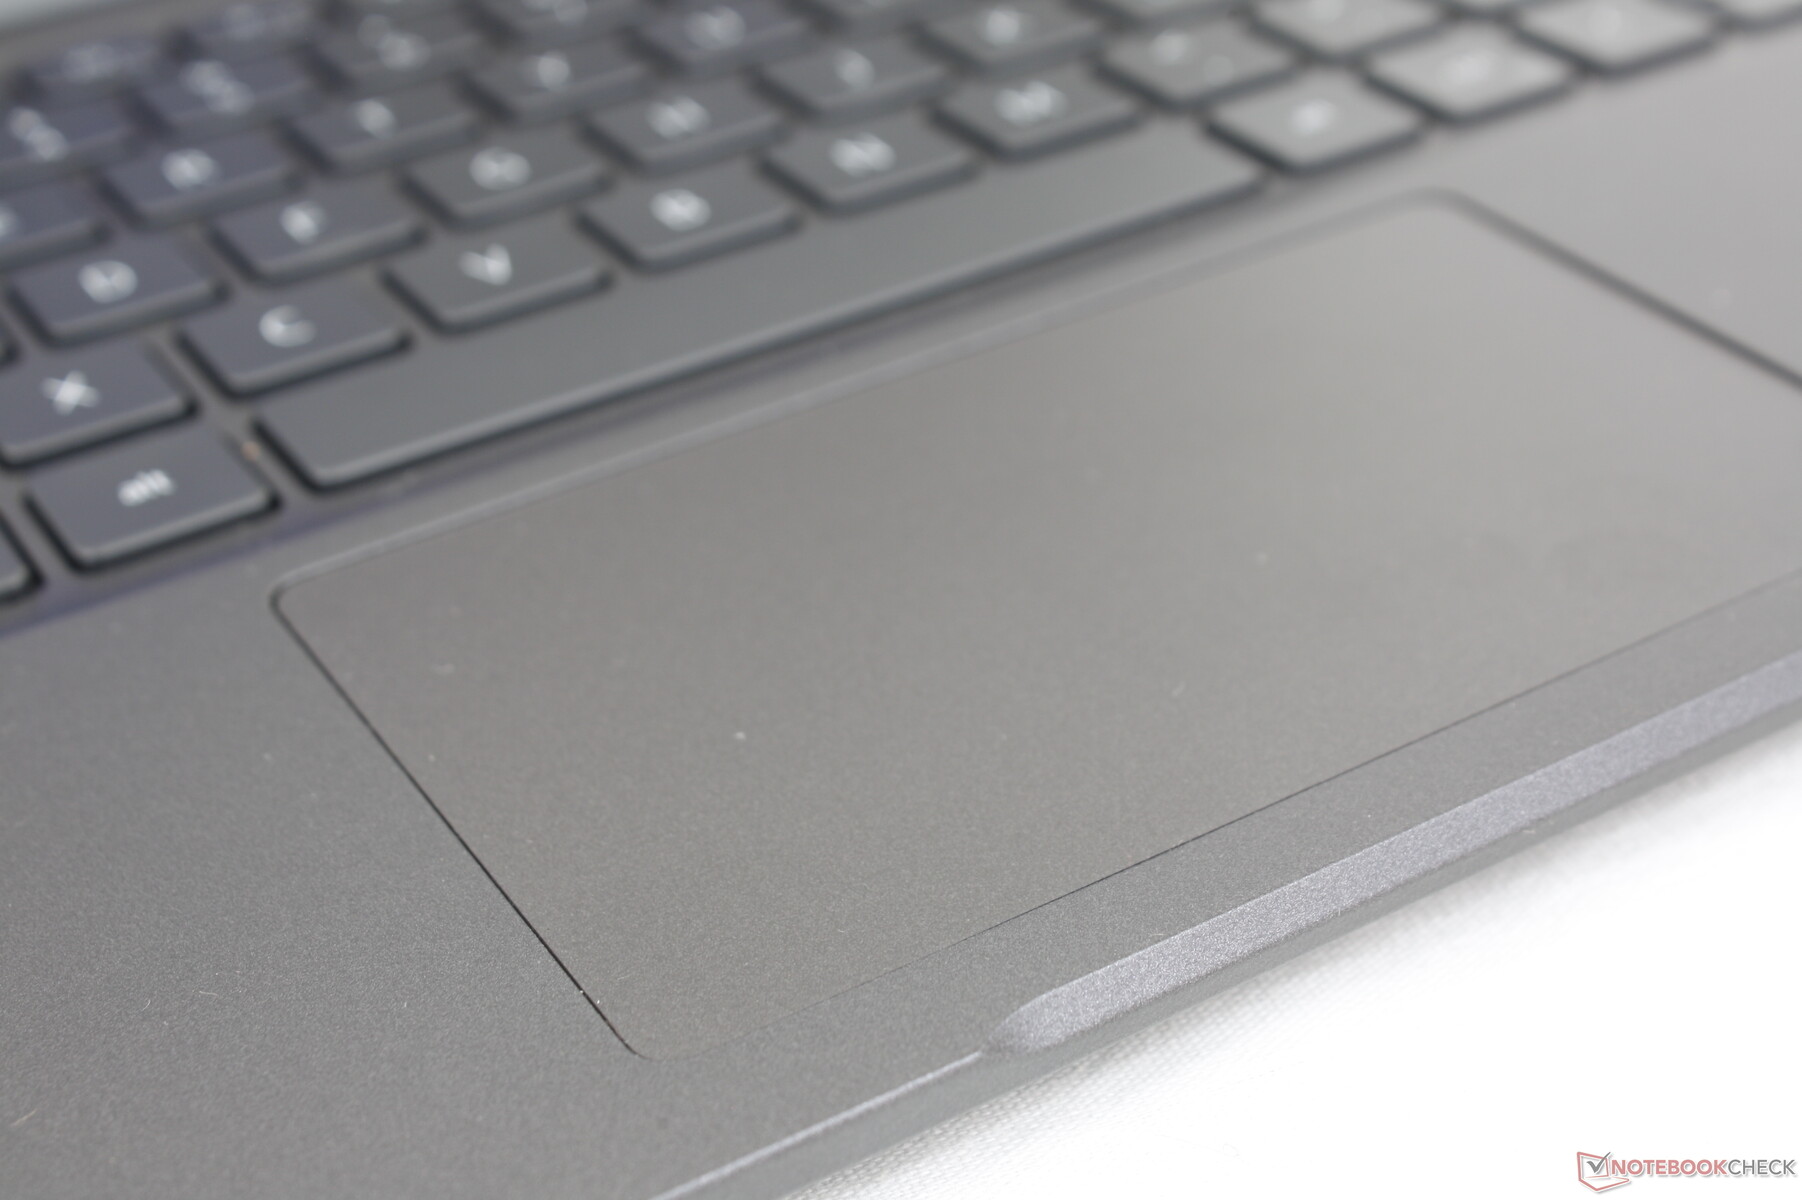
点击板的尺寸与老款Latitude 7310相比没有变化,约为10 x 6.1厘米。然而,我们确实希望它能更高一些,因为垂直光标移动和多点触摸滚动会感觉有点拥挤。集成的鼠标键也比我们希望的要软,按一会儿就会觉得累。

显示器 - 没有OLED或快速刷新率
有四种显示方式可供选择,从最差到最好。
- 非触摸式,250尼特,~60% sRGB
- 触摸,300尼特,~60%sRGB
- 非触控,400尼特,100% sRGB,低蓝光,低功率
- 非触摸,400尼特,100%sRGB,低蓝光,低功率,超轻。
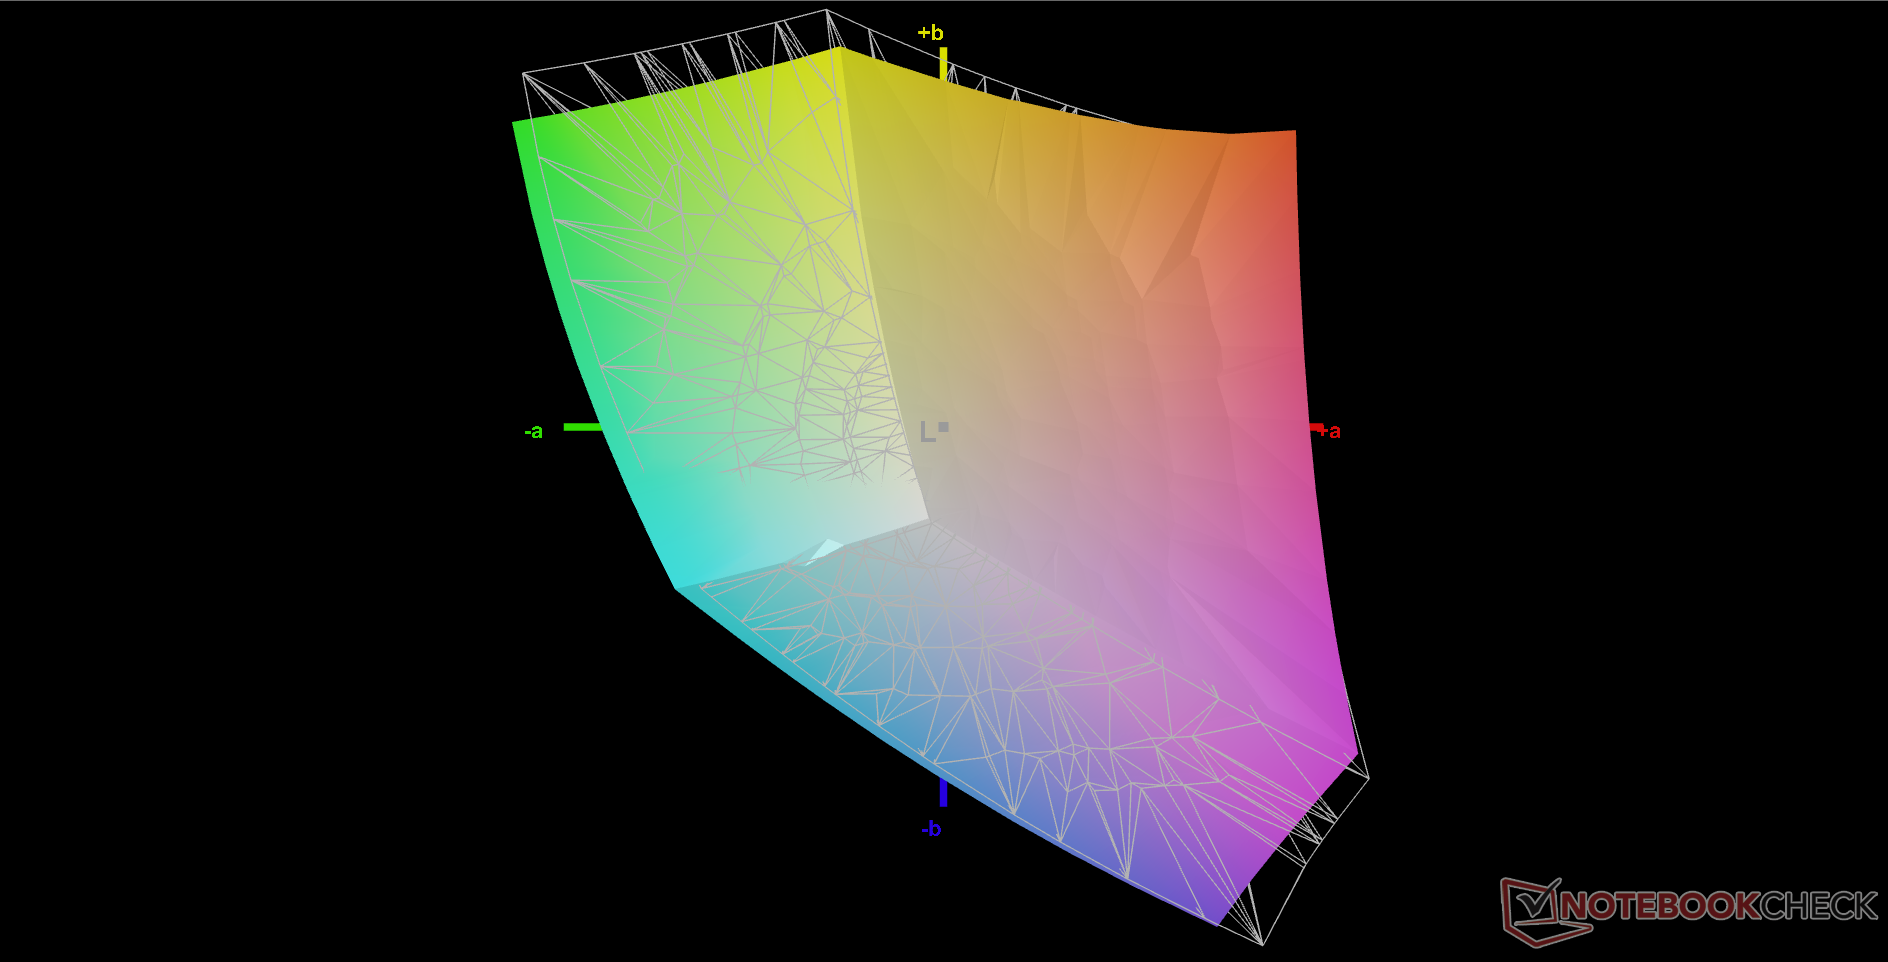
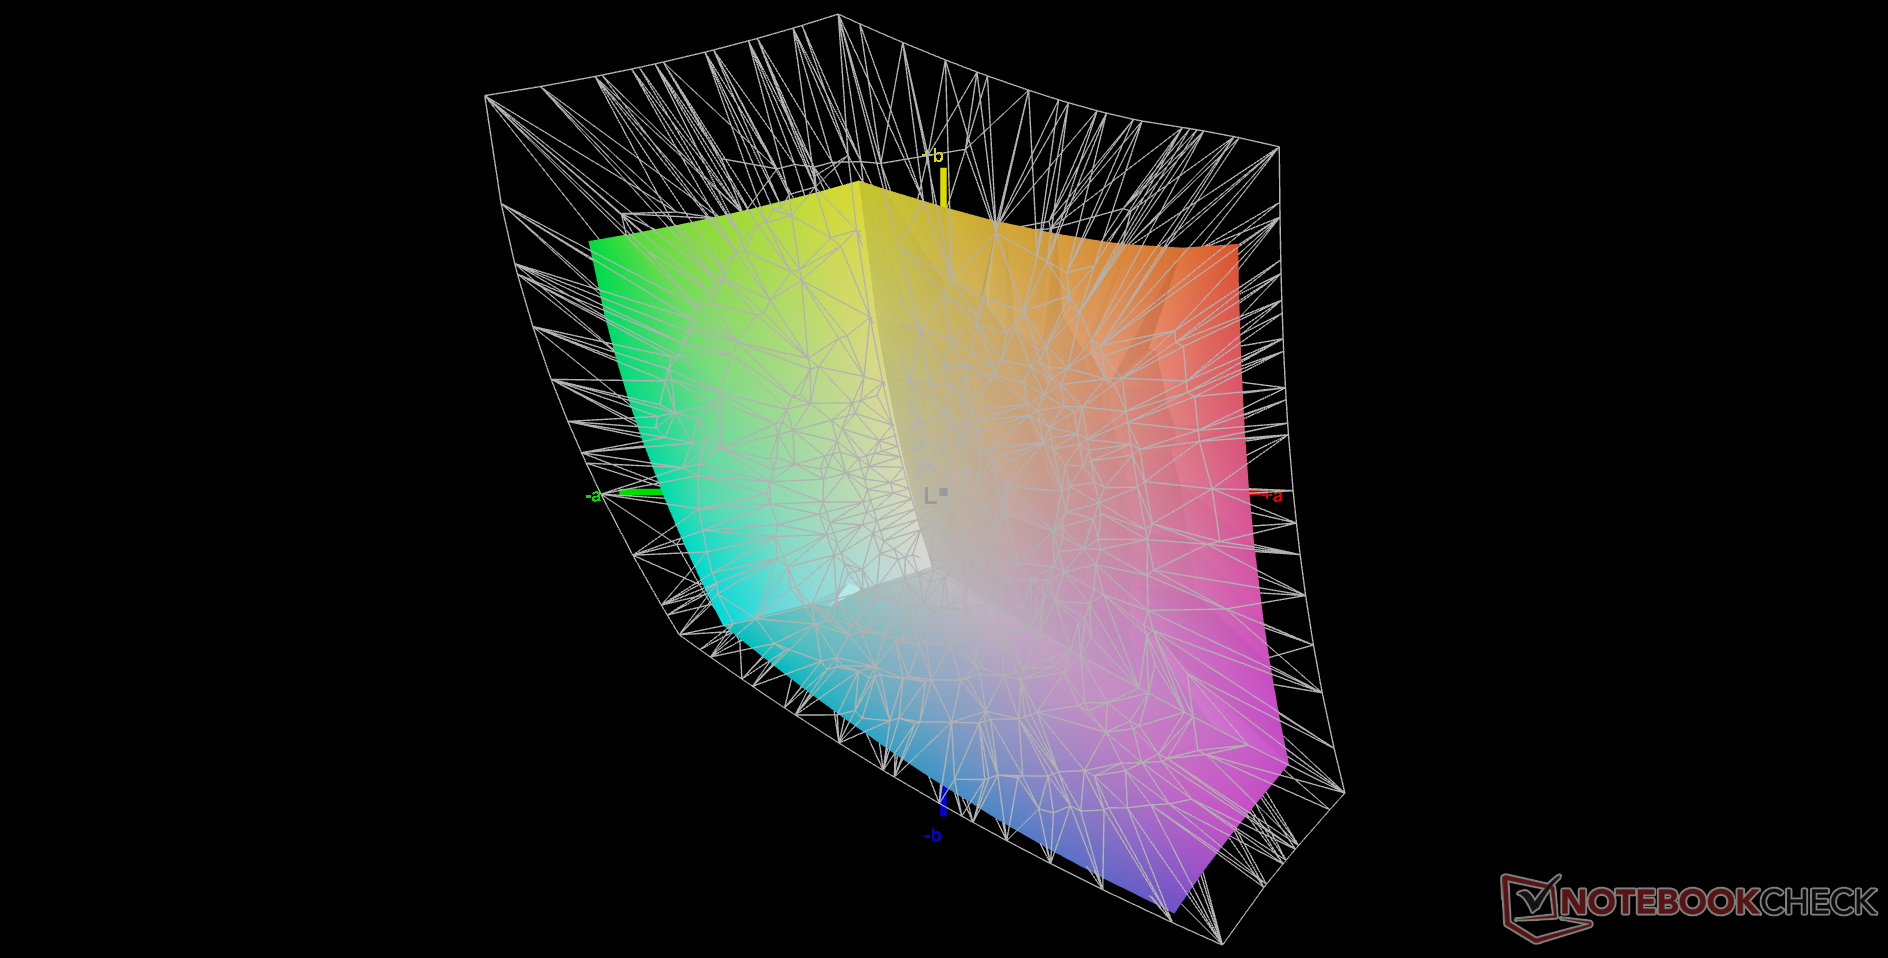
所有选项都是FHD、WVA/IPS和哑光,意味着这里没有2K、4K、OLED或光面的替代品。我们建议避免使用第一种面板,因为它的背光很暗,色彩范围很窄。我们的具体测试装置配备了上述第四种选择。
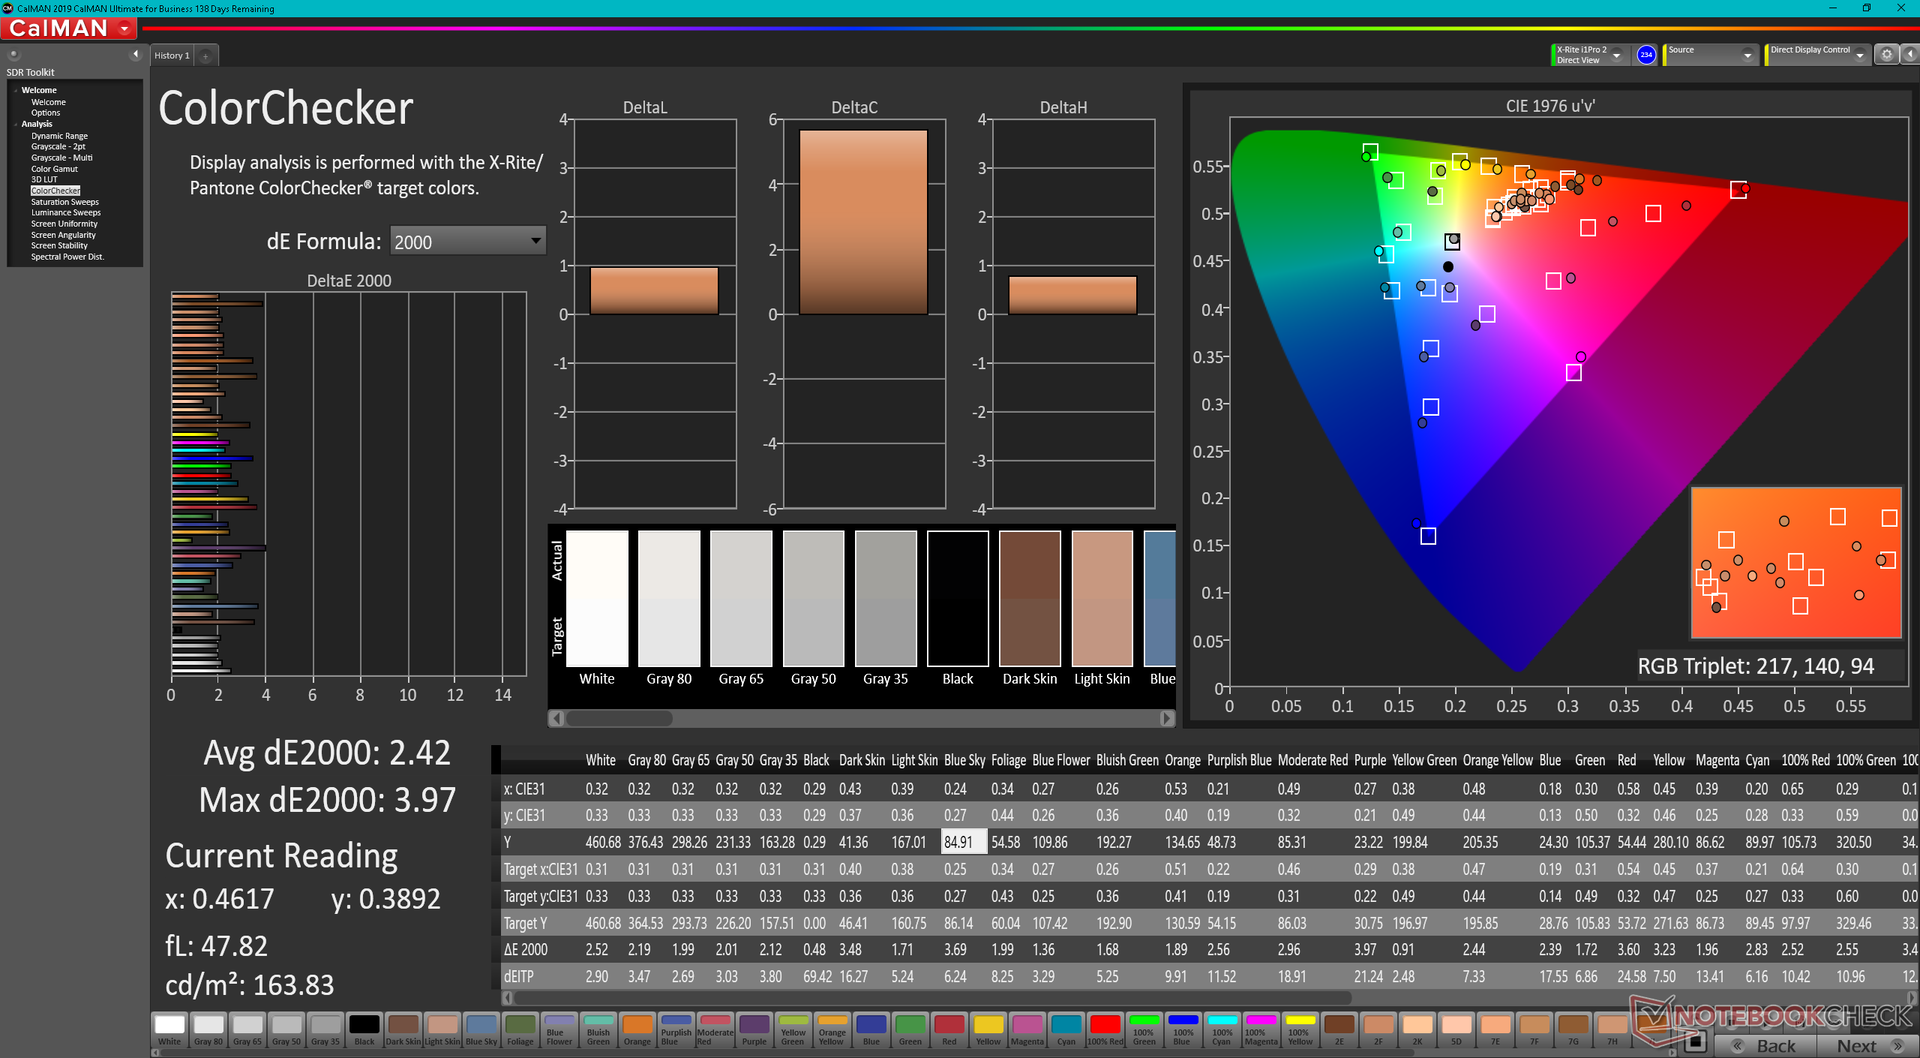
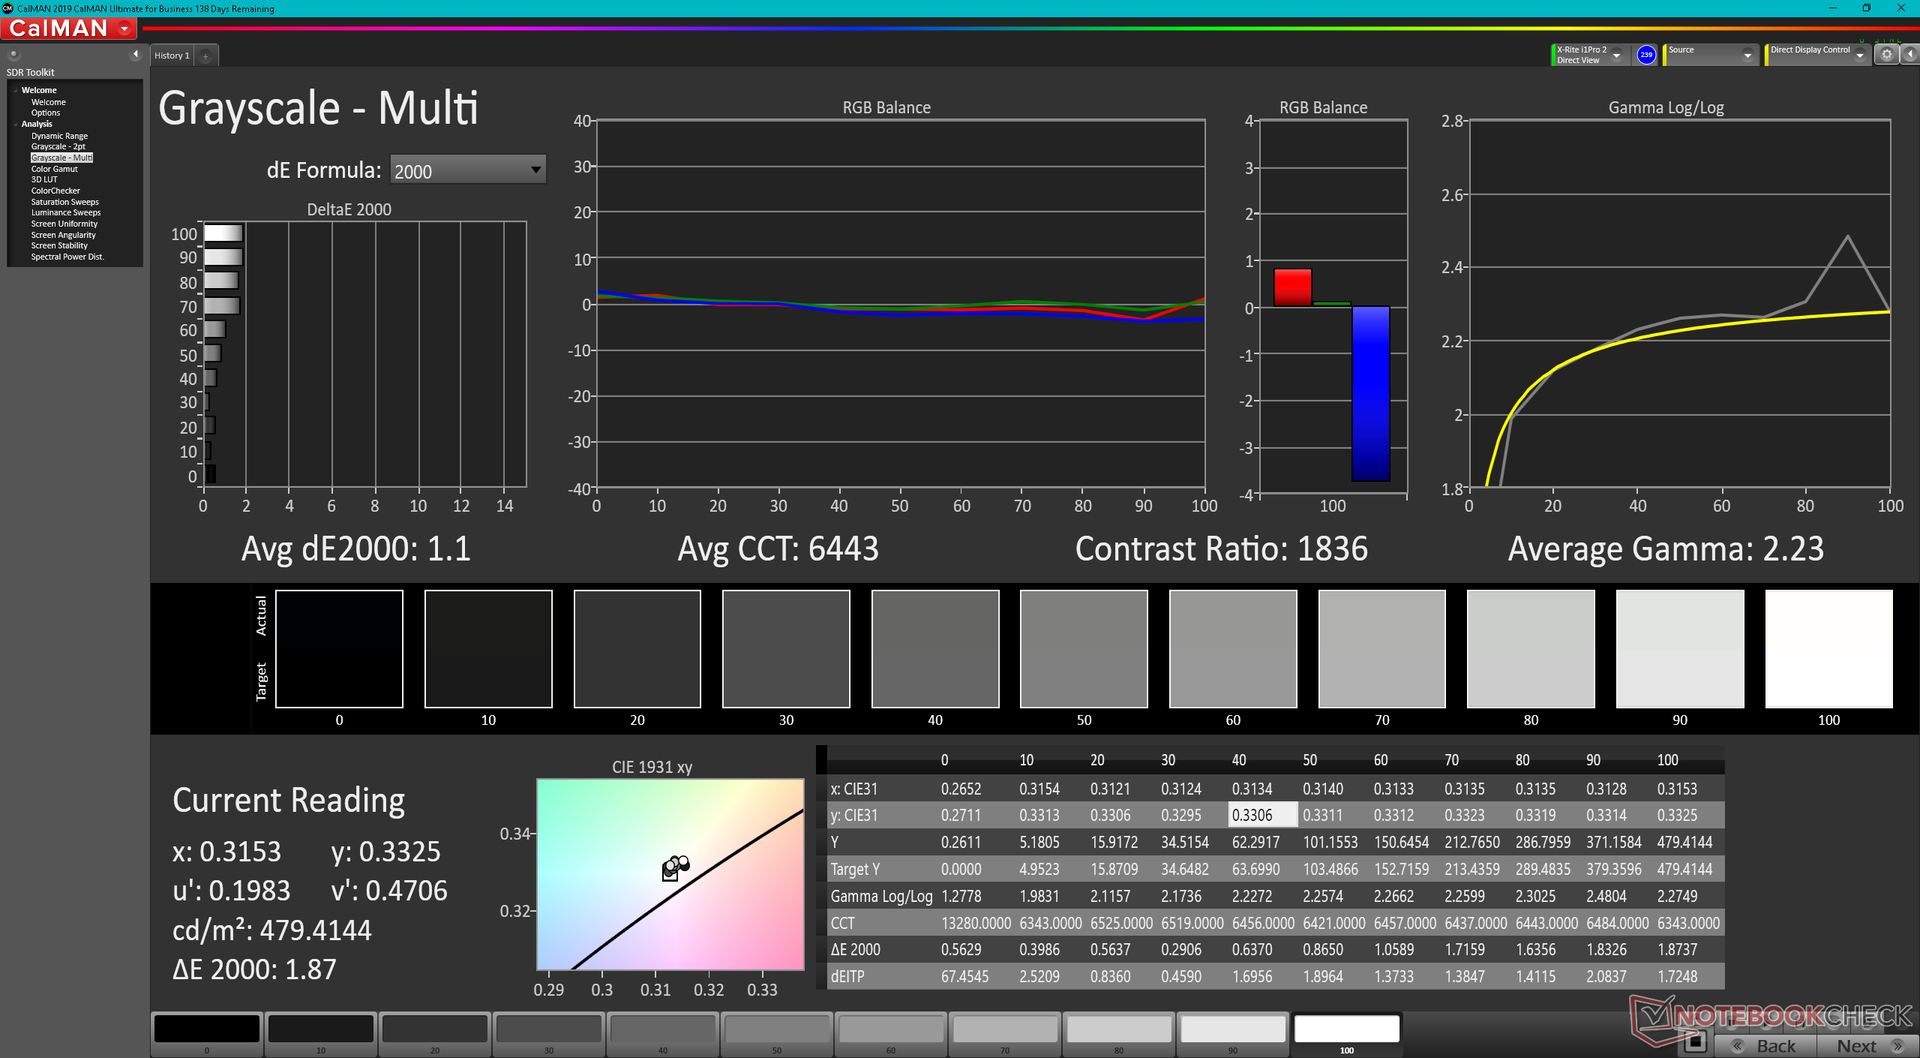
我们的独立测量结果显示,其sRGB覆盖率略小,为93%,但平均最大亮度为445尼特,略显明亮。考虑到其超过1000:1的高对比度,这仍然是一个高质量的显示器,但我们希望未来的SKU将包括OLED,以获得更快的黑白和灰度响应时间,或者至少是更高的刷新率面板,以获得更流畅的用户界面。
| |||||||||||||||||||||||||
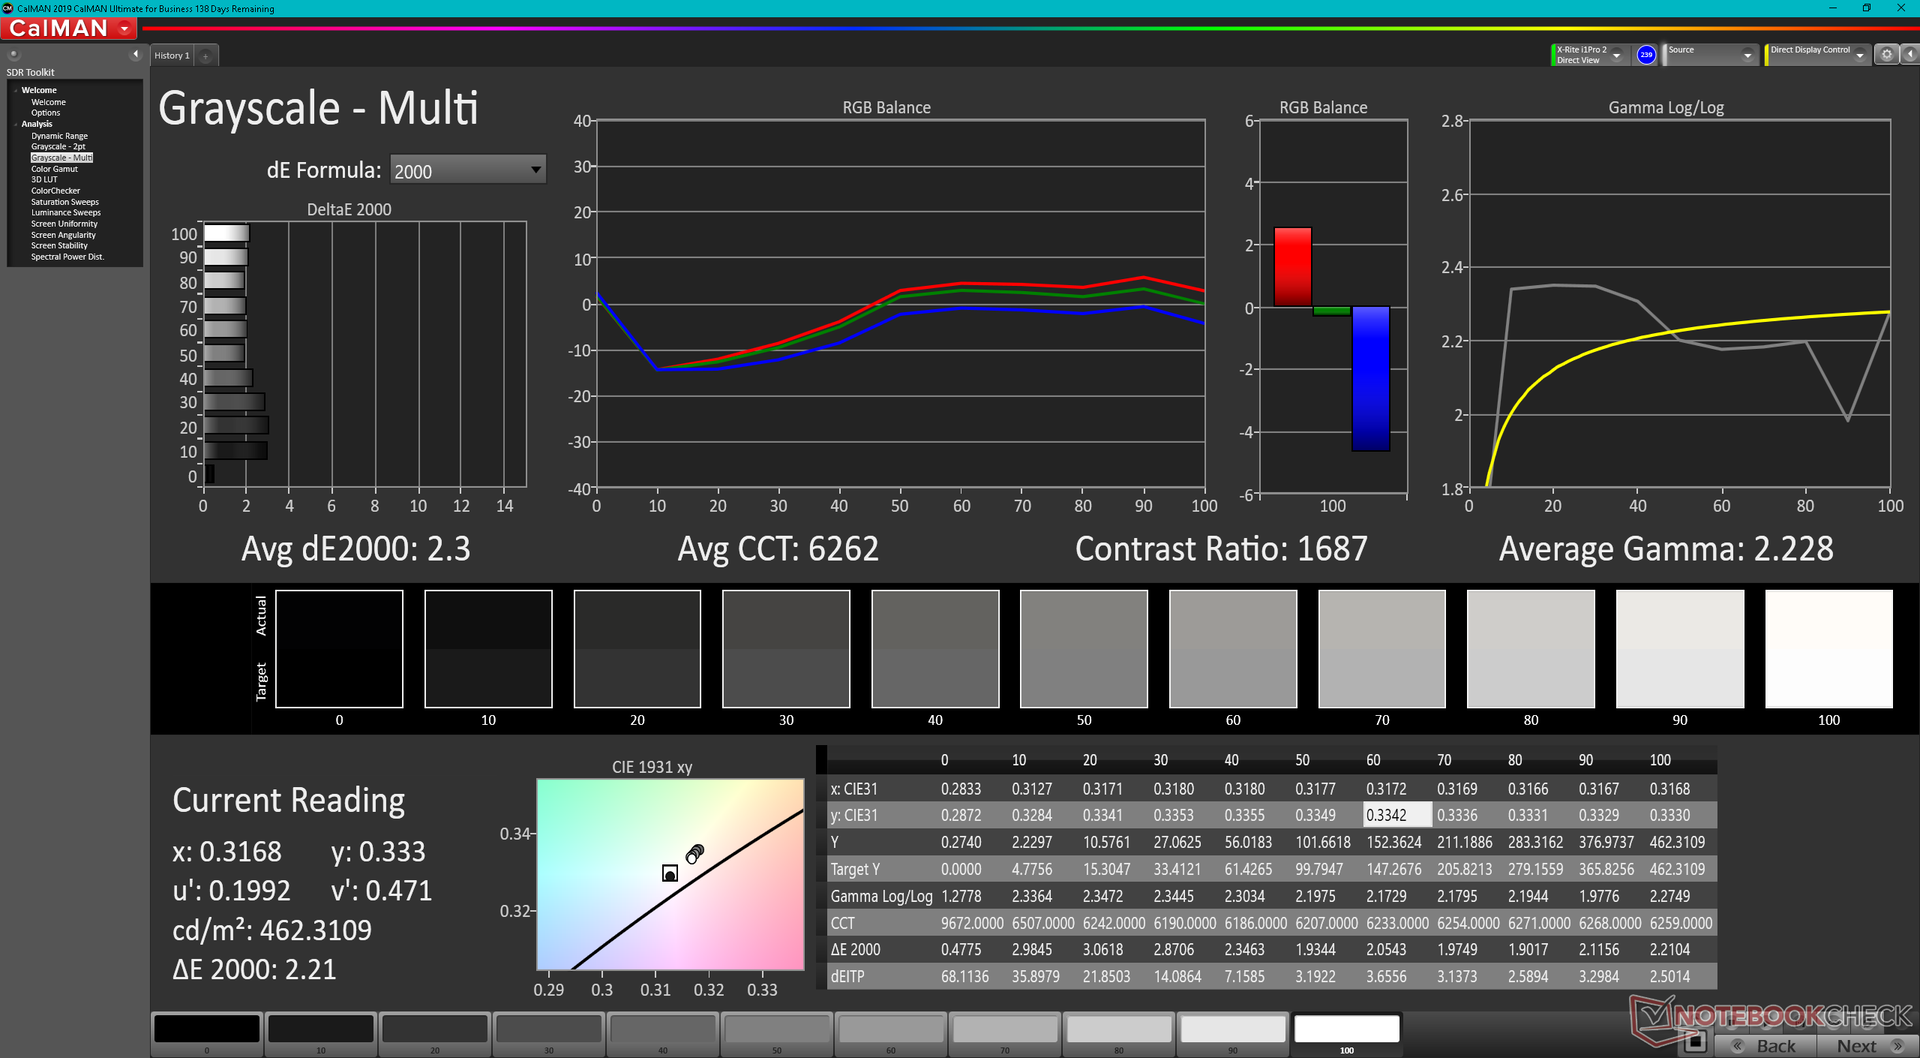
Brightness Distribution: 89 %
Center on Battery: 460.1 cd/m²
Contrast: 1484:1 (Black: 0.31 cd/m²)
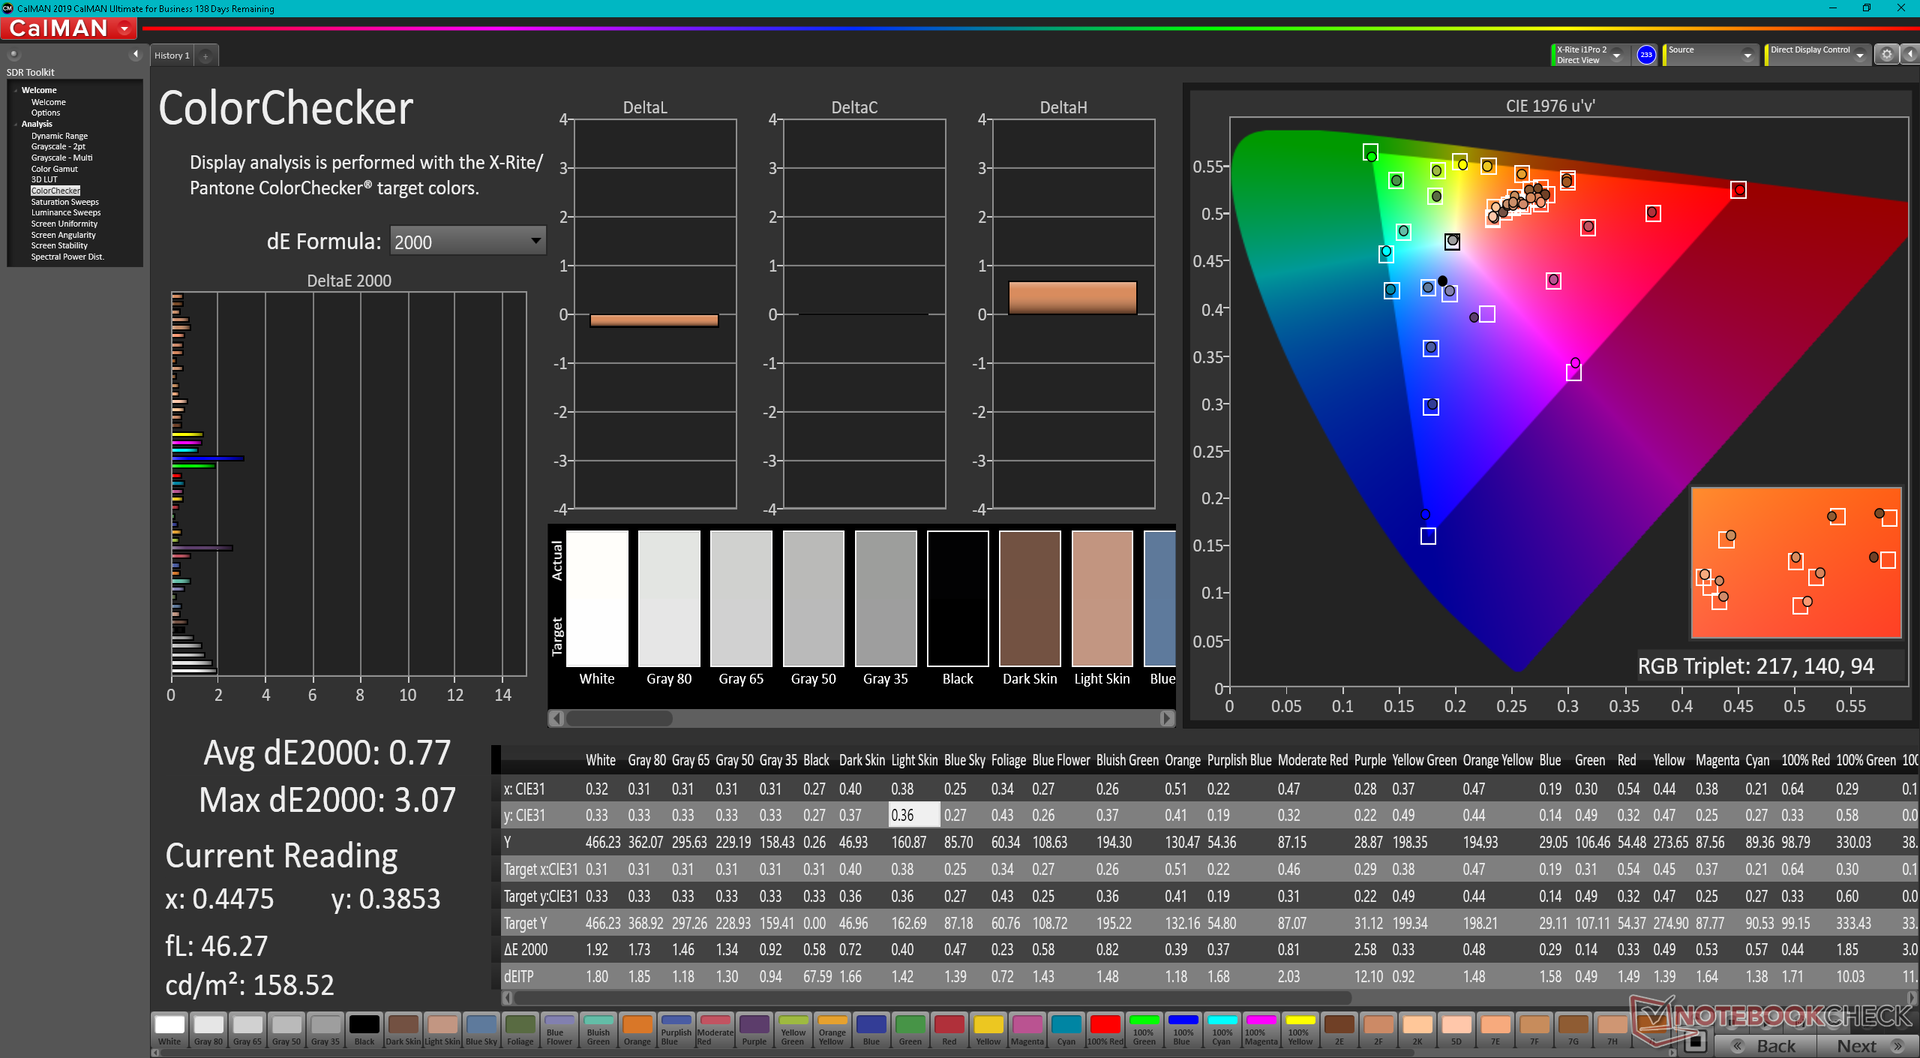
ΔE ColorChecker Calman: 2.42 | ∀{0.5-29.43 Ø4.73}
calibrated: 0.77
ΔE Greyscale Calman: 2.3 | ∀{0.09-98 Ø4.97}
68.2% AdobeRGB 1998 (Argyll 3D)
93.5% sRGB (Argyll 3D)
66.1% Display P3 (Argyll 3D)
Gamma: 2.23
CCT: 6262 K
| Dell Latitude 13 7330 LG Philips 133WF9, IPS, 1920x1080, 13.3" | Lenovo ThinkPad X13 Yoga 20SX0004GE N133HCG-GR3, IPS, 1920x1080, 13.3" | Framework Laptop 13.5 12th Gen Intel BOE CQ NE135FBM-N41, IPS, 2256x1504, 13.5" | Razer Book 13 FHD Sharp LQ134N1JW48, IPS, 1920x1200, 13.4" | Dell Latitude 7310 AU Optronics B133HAN, IPS, 1920x1080, 13.3" | Microsoft Surface Laptop 4 13 i7 LQ135P1JX51, IPS, 2256x1504, 13.5" | |
|---|---|---|---|---|---|---|
| Display | 3% | 5% | 6% | 7% | 0% | |
| Display P3 Coverage (%) | 66.1 | 67.2 2% | 69.9 6% | 70.1 6% | 71.8 9% | 64.7 -2% |
| sRGB Coverage (%) | 93.5 | 98.1 5% | 99.4 6% | 99.3 6% | 99.3 6% | 97.2 4% |
| AdobeRGB 1998 Coverage (%) | 68.2 | 69 1% | 71.1 4% | 71.6 5% | 72.4 6% | 66.9 -2% |
| Response Times | -6% | 18% | -24% | 10% | -32% | |
| Response Time Grey 50% / Grey 80% * (ms) | 48.4 ? | 56 ? -16% | 34.7 ? 28% | 56.8 ? -17% | 40.8 ? 16% | 62.8 ? -30% |
| Response Time Black / White * (ms) | 29.6 ? | 28 ? 5% | 27.5 ? 7% | 38.8 ? -31% | 28.8 ? 3% | 39.8 ? -34% |
| PWM Frequency (Hz) | 2475 ? | 21930 ? | ||||
| Screen | 2% | -25% | -9% | -9% | -11% | |
| Brightness middle (cd/m²) | 460.1 | 401 -13% | 449.6 -2% | 545.3 19% | 332.7 -28% | 413 -10% |
| Brightness (cd/m²) | 445 | 383 -14% | 431 -3% | 507 14% | 329 -26% | 400 -10% |
| Brightness Distribution (%) | 89 | 91 2% | 90 1% | 88 -1% | 89 0% | 94 6% |
| Black Level * (cd/m²) | 0.31 | 0.16 48% | 0.31 -0% | 0.31 -0% | 0.25 19% | 0.29 6% |
| Contrast (:1) | 1484 | 2506 69% | 1450 -2% | 1759 19% | 1331 -10% | 1424 -4% |
| Colorchecker dE 2000 * | 2.42 | 2.6 -7% | 2.76 -14% | 1.39 43% | 2.15 11% | 2.8 -16% |
| Colorchecker dE 2000 max. * | 3.97 | 4.2 -6% | 7.96 -101% | 2.61 34% | 3.89 2% | 7.2 -81% |
| Colorchecker dE 2000 calibrated * | 0.77 | 0.9 -17% | 0.58 25% | 2.72 -253% | 1.09 -42% | 0.8 -4% |
| Greyscale dE 2000 * | 2.3 | 3.3 -43% | 5.2 -126% | 1.3 43% | 2.5 -9% | 1.9 17% |
| Gamma | 2.23 99% | 2.01 109% | 2.23 99% | 2.2 100% | 2.3 96% | 2.12 104% |
| CCT | 6262 104% | 6076 107% | 6475 100% | 6476 100% | 6347 102% | 6510 100% |
| Color Space (Percent of AdobeRGB 1998) (%) | 62.7 | 65.9 | 64.1 | 61.6 | ||
| Color Space (Percent of sRGB) (%) | 98.1 | 99.6 | 99.4 | 97.2 | ||
| Total Average (Program / Settings) | -0% /
1% | -1% /
-12% | -9% /
-8% | 3% /
-3% | -14% /
-11% |
* ... smaller is better
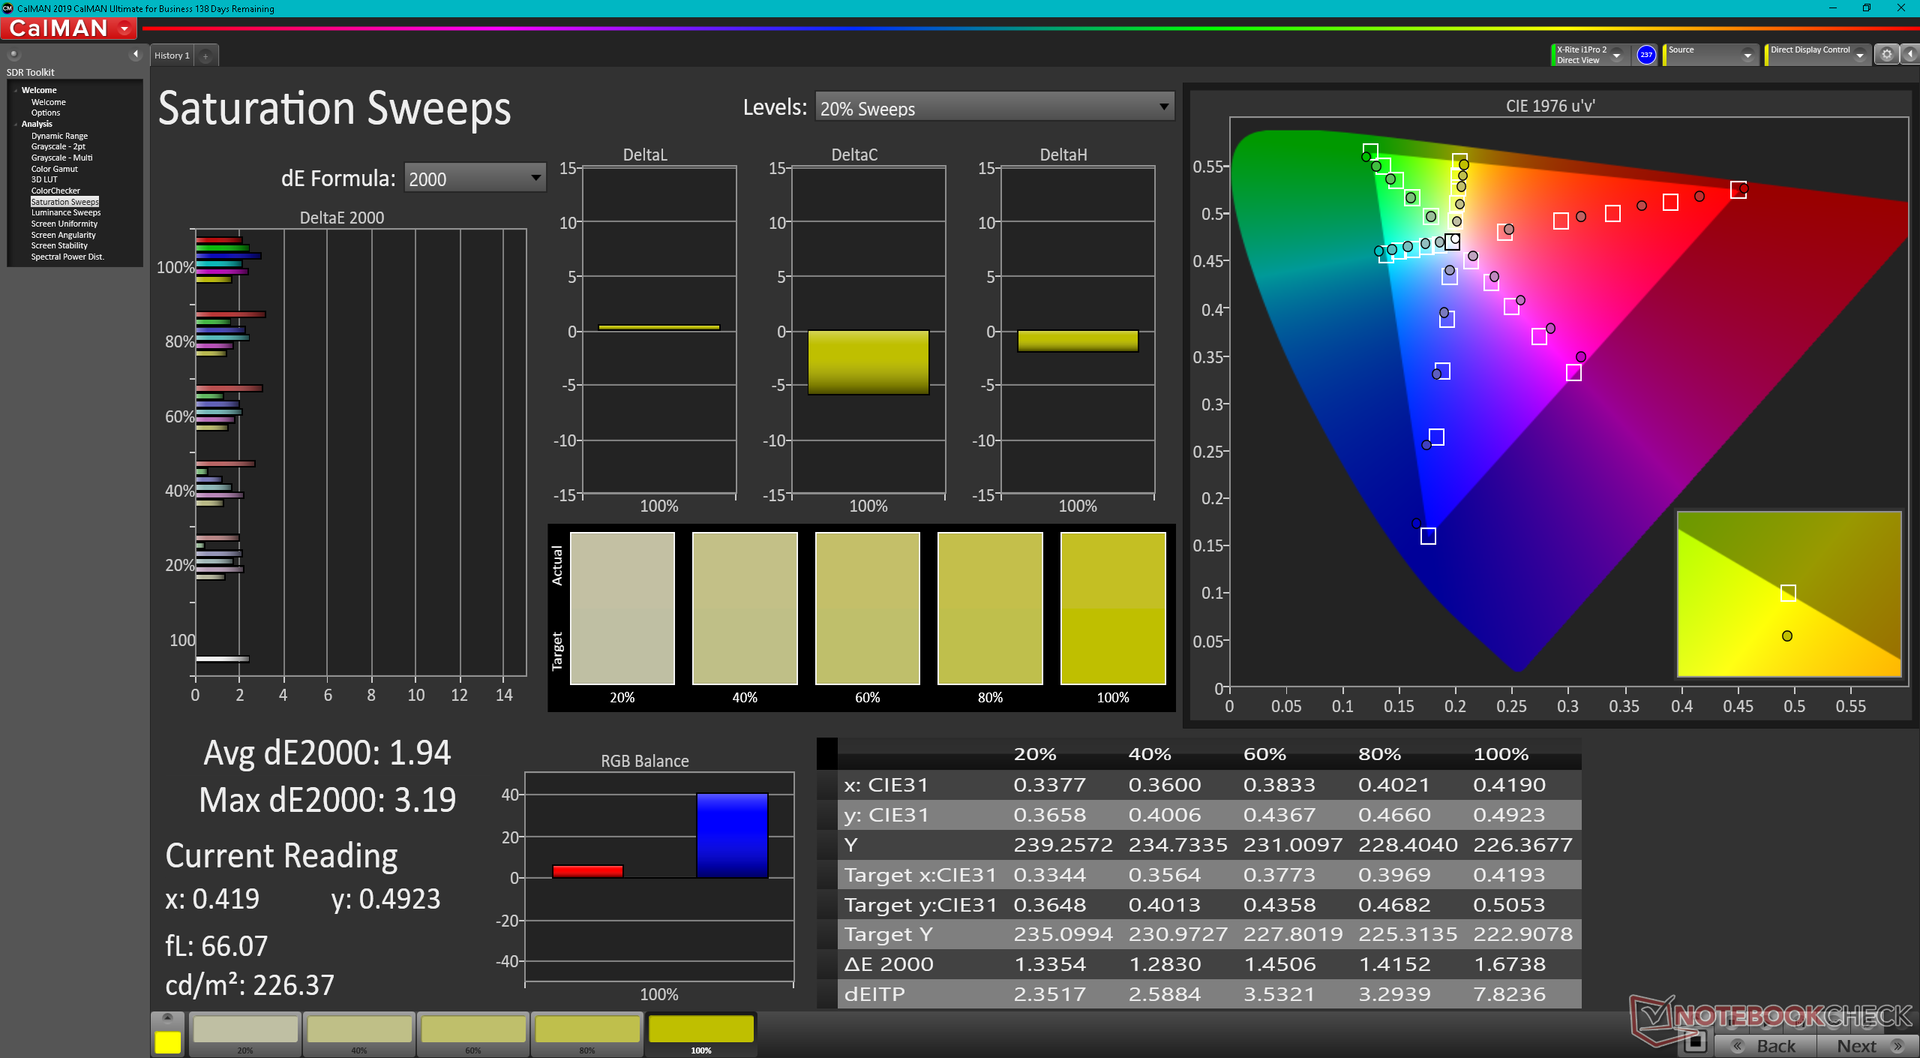
正如我们下面的CalMAN结果所显示的那样,该显示器开箱即被很好地校准,平均灰度和deltaE值分别仅为2.3和2.42。我们用X-Rite色度计进一步校准它,可以将平均DeltaE值提高到1以下。
Display Response Times
| ↔ Response Time Black to White | ||
|---|---|---|
| 29.6 ms ... rise ↗ and fall ↘ combined | ↗ 14.8 ms rise | 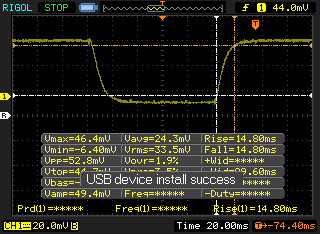 |
| ↘ 14.8 ms fall | ||
| The screen shows relatively slow response rates in our tests and may be too slow for gamers. In comparison, all tested devices range from 0.1 (minimum) to 240 (maximum) ms. » 79 % of all devices are better. This means that the measured response time is worse than the average of all tested devices (19.9 ms). | ||
| ↔ Response Time 50% Grey to 80% Grey | ||
| 48.4 ms ... rise ↗ and fall ↘ combined | ↗ 23.6 ms rise | 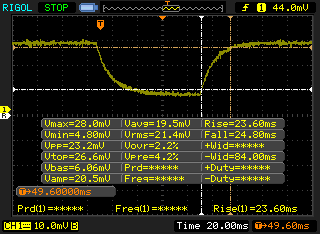 |
| ↘ 24.8 ms fall | ||
| The screen shows slow response rates in our tests and will be unsatisfactory for gamers. In comparison, all tested devices range from 0.165 (minimum) to 636 (maximum) ms. » 84 % of all devices are better. This means that the measured response time is worse than the average of all tested devices (31.1 ms). | ||
Screen Flickering / PWM (Pulse-Width Modulation)
| Screen flickering / PWM not detected | 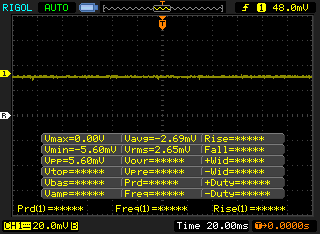 | ||
In comparison: 52 % of all tested devices do not use PWM to dim the display. If PWM was detected, an average of 7798 (minimum: 5 - maximum: 343500) Hz was measured. | |||
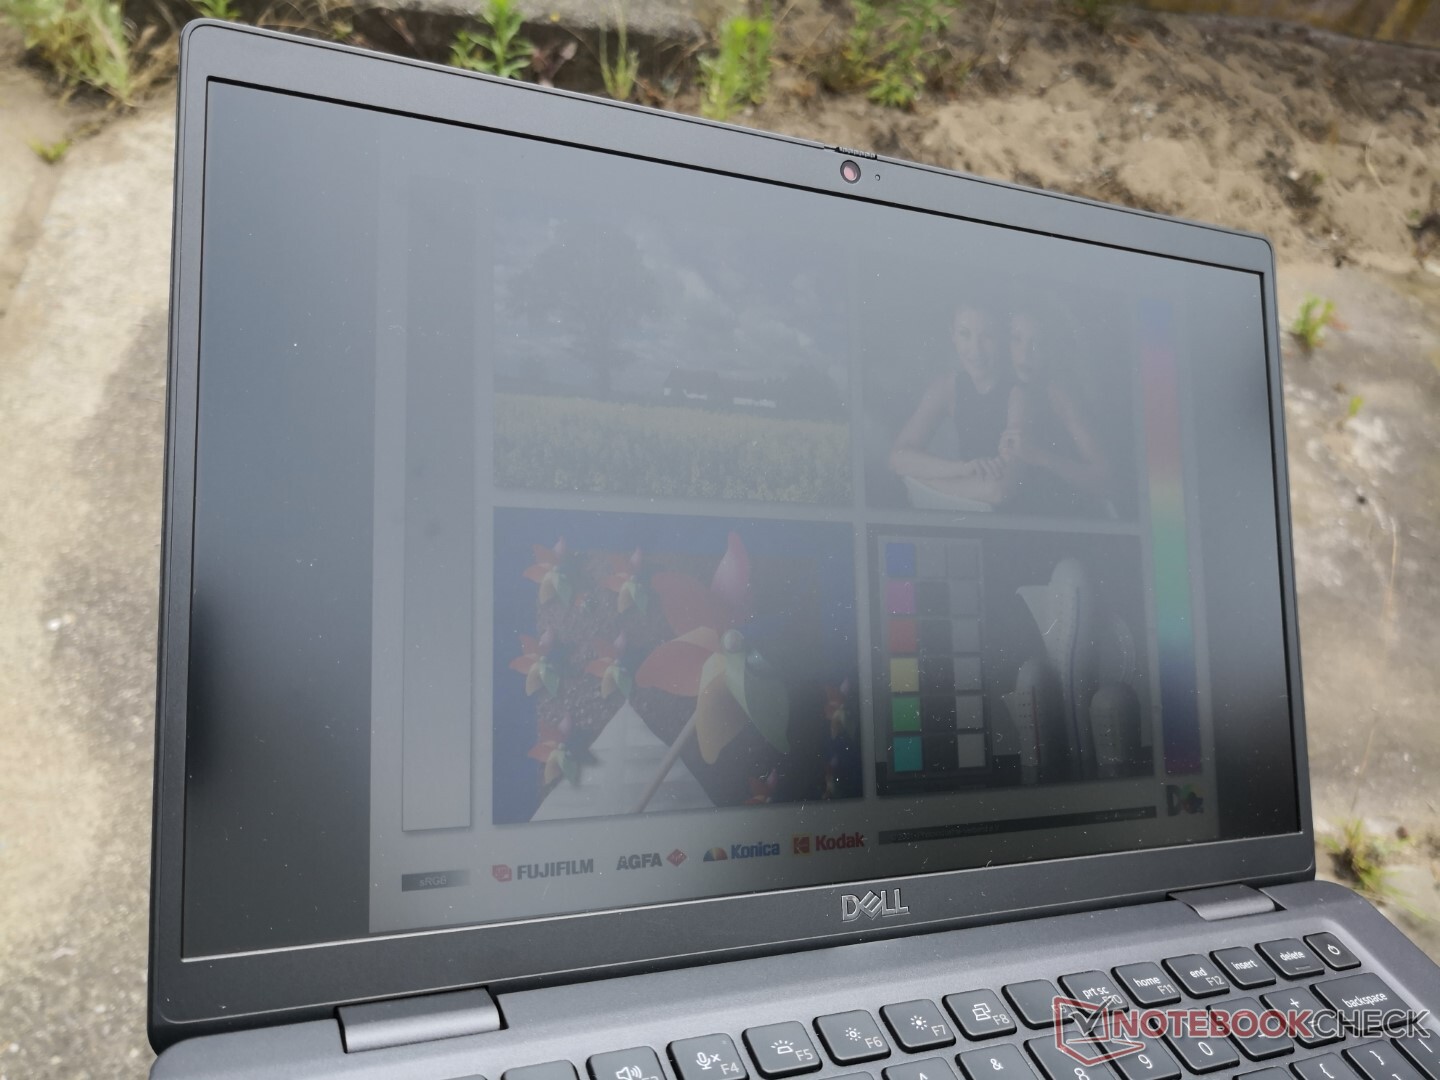
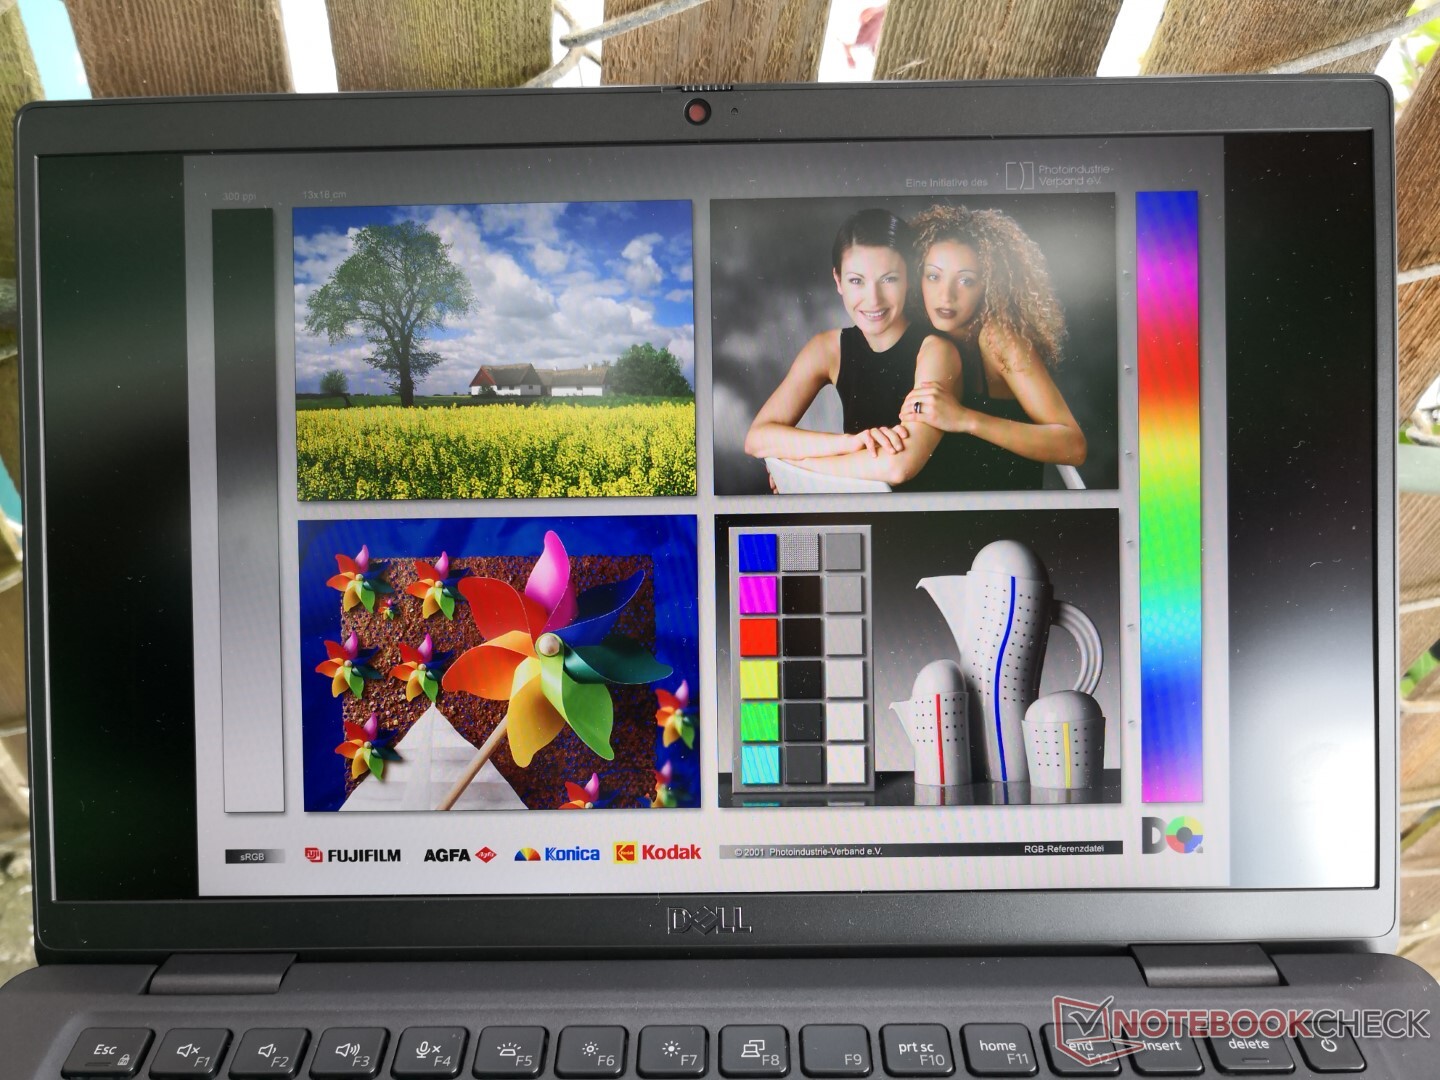
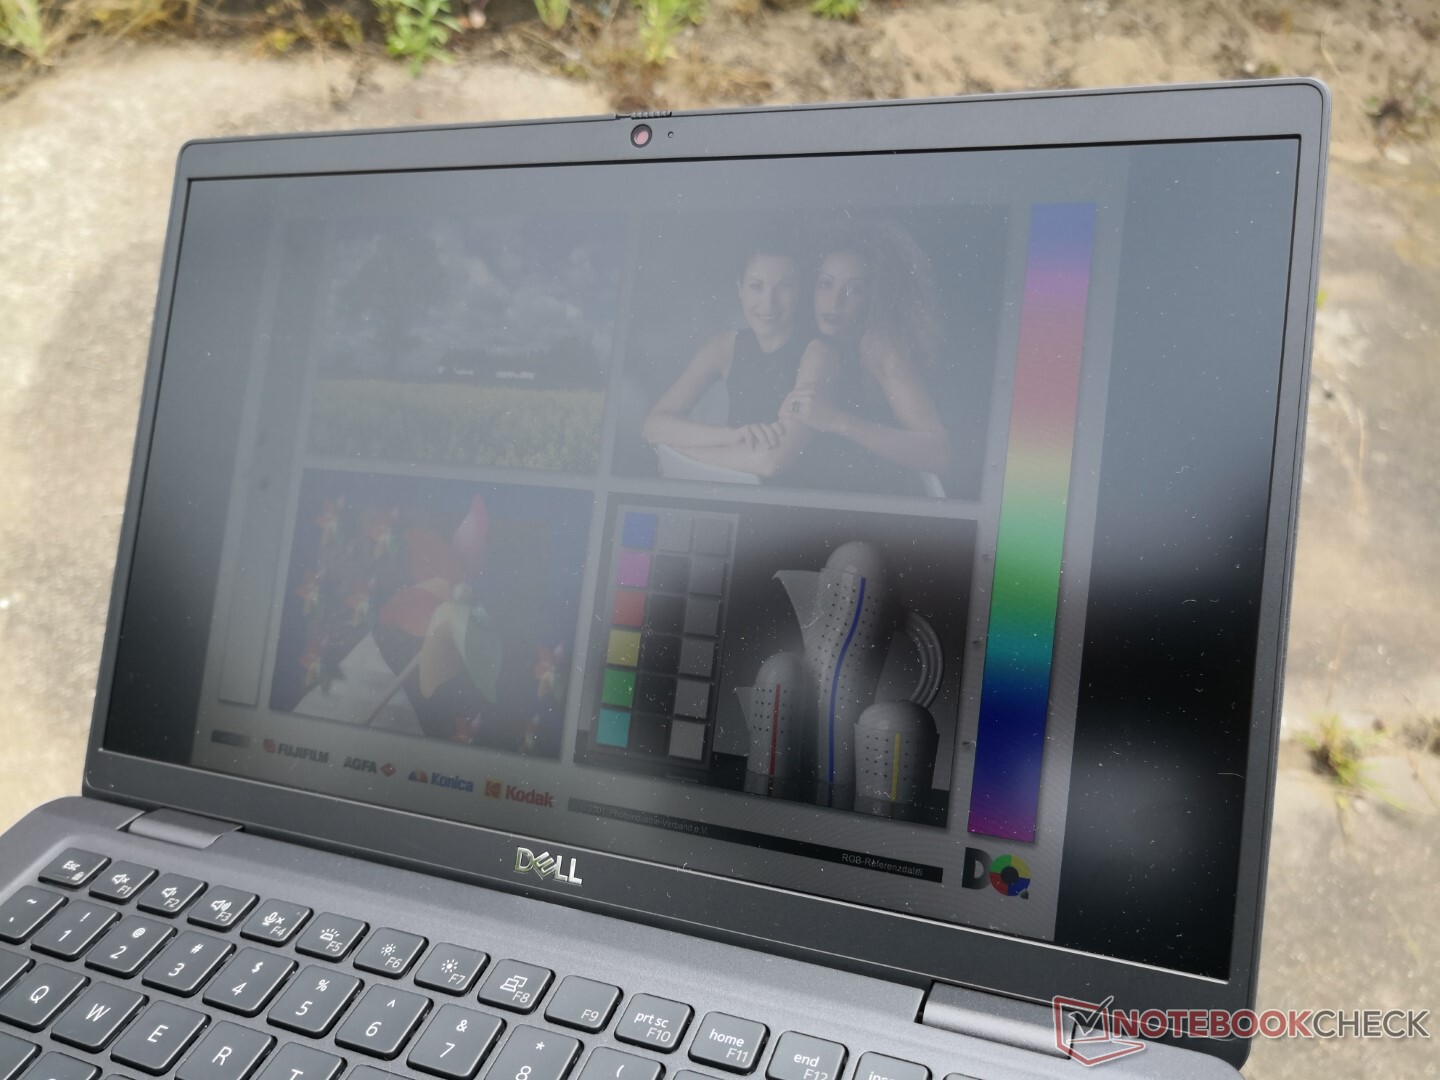
如果在阴凉处工作,户外能见度相当好,因为相对明亮的~450尼特显示屏和哑光覆盖层可以减少眩光。然而,在晴天或明亮的阴天,它仍然不够明亮,无法让人舒适地观看。

性能 - 酷睿i7-1265U令人印象深刻
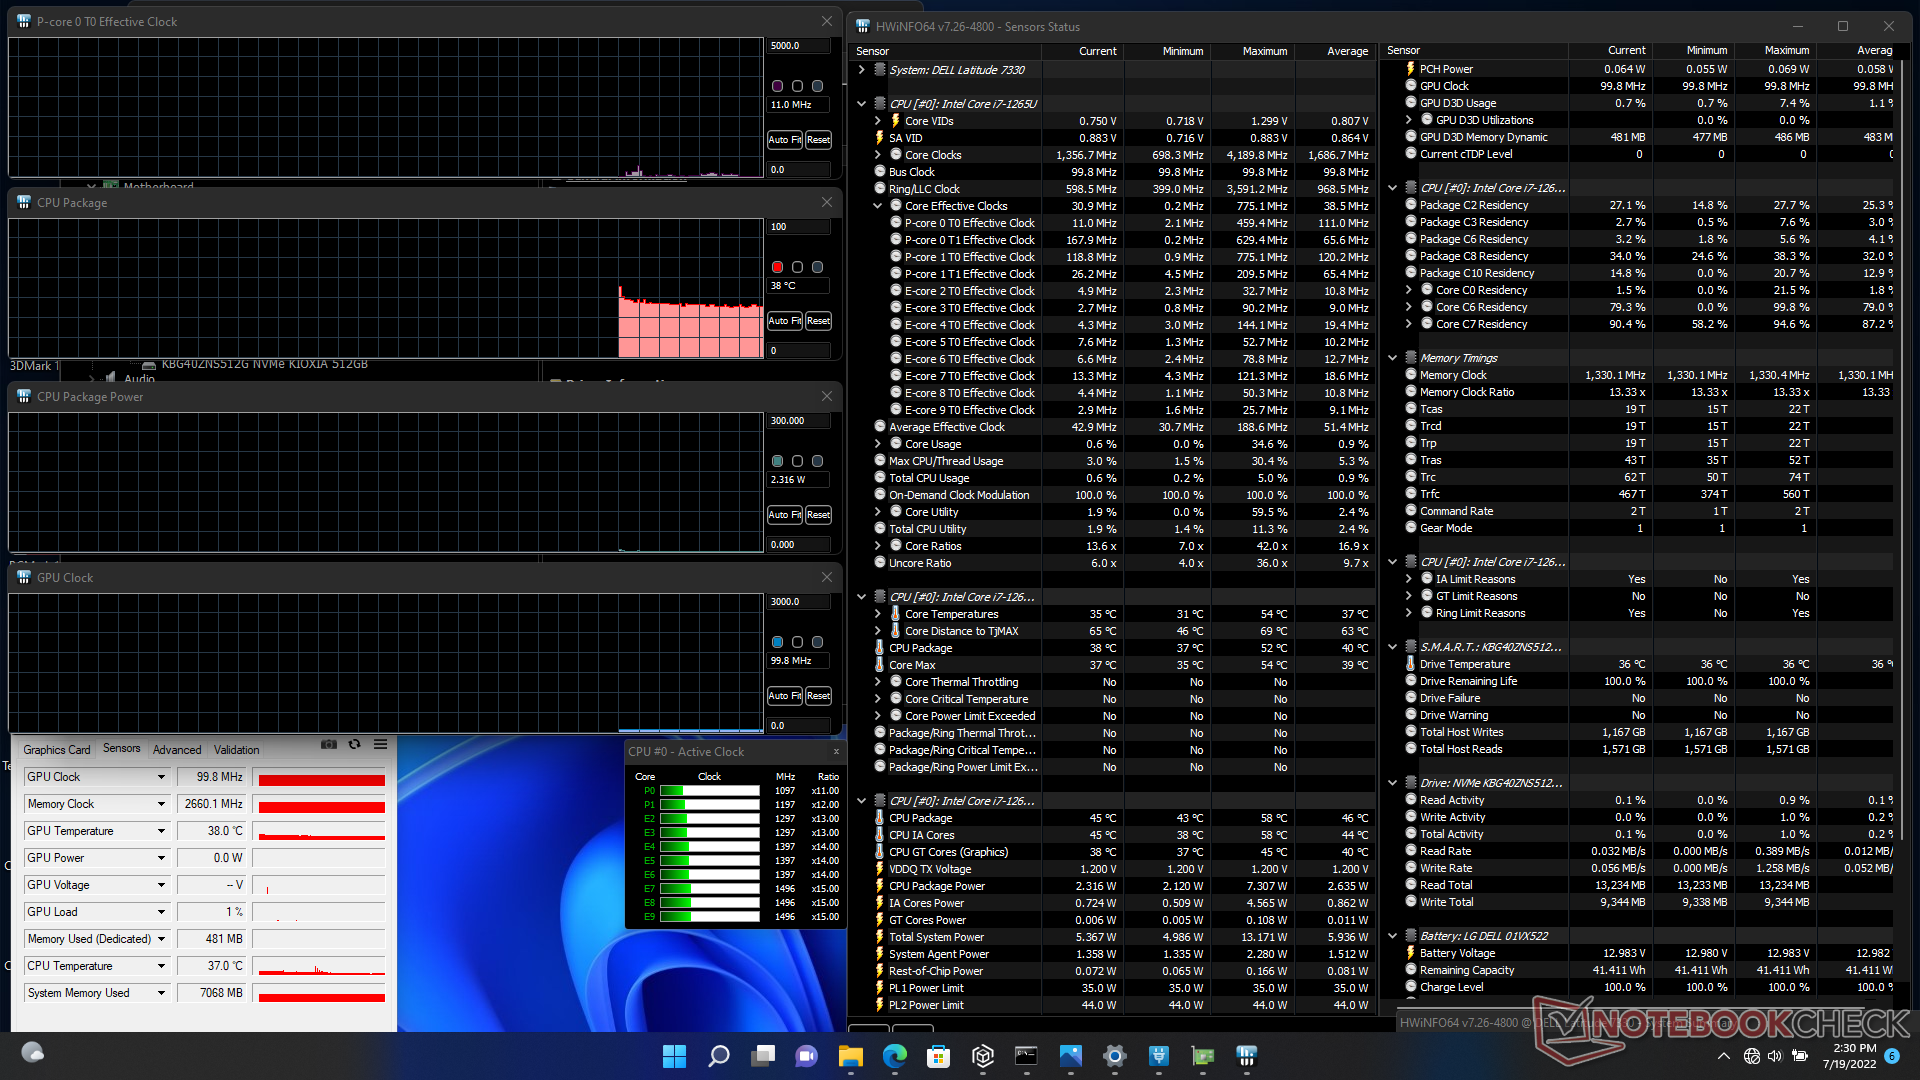
测试条件
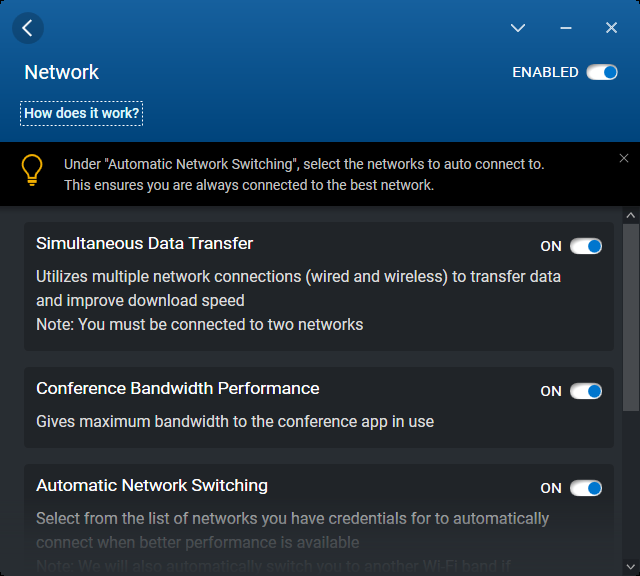
在运行下面的任何基准测试之前,我们将我们的设备分别设置为性能模式和超性能模式,在Windows和戴尔电源管理器软件上。建议用户熟悉预装的戴尔电源管理器、优化器和命令应用程序,因为它们是切换特定型号更新和功能的枢纽。
处理器
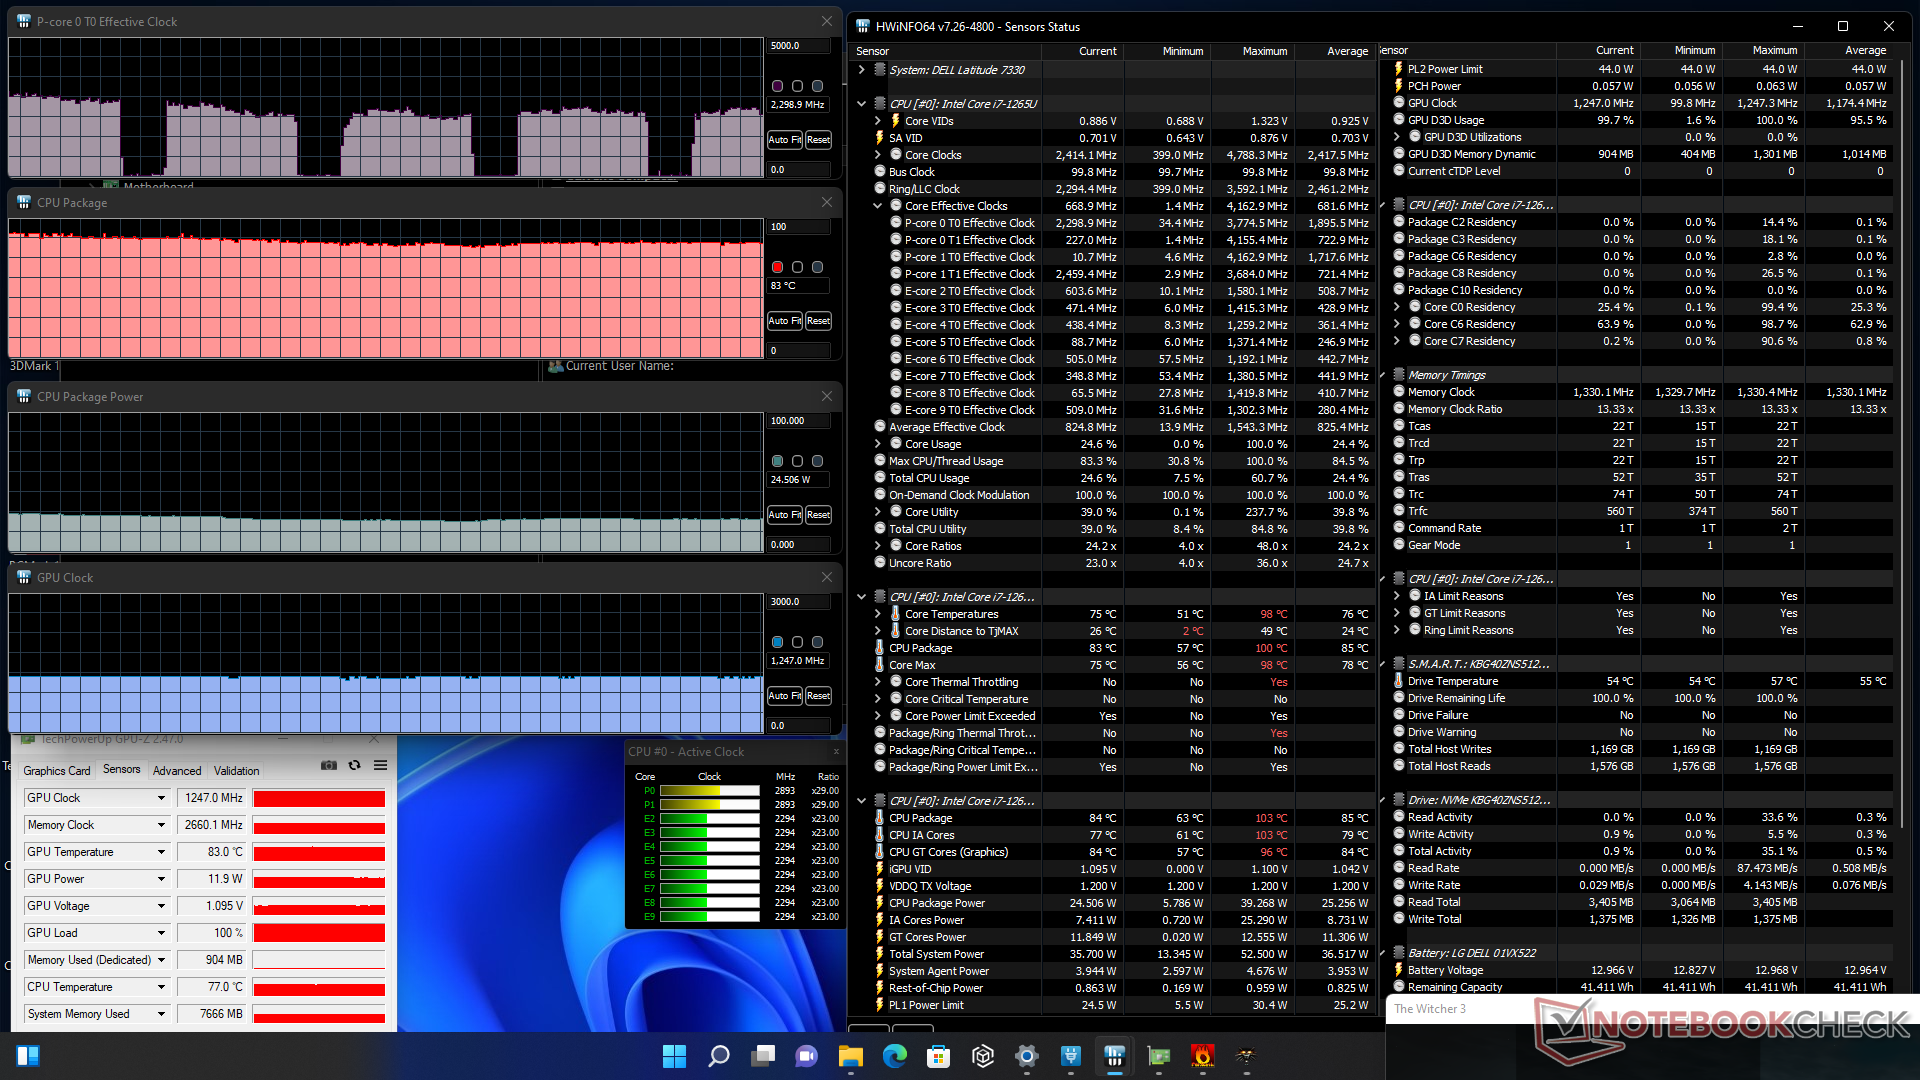
经过 感到失望 感到失望之后 感到失望后,我们对酷睿i5-1235U后,我们对酷睿i7-1265U的希望并不高。 酷睿i7-1265U.幸运的是,尽管i7-1265U属于U系列,但它被证明是一个相当快的恶魔。原始的单线程和多线程性能比我们数据库中配备上一代的笔记本高出20%和60%。 酷睿i7-1165G7.事实上,该CPU仅比要求更高的 酷睿i7-1260P.一些更高端的AMD CPU,如 Ryzen 7 5700U或5800U 可以在多线程工作负载中与酷睿i7-1265U相媲美或超过其性能,但在单线程操作中仍然落后。
性能的可持续性很好,但绝对可以做得更好。循环运行CineBench R15 xT显示,最初的得分是1379分,然后稳步下降并稳定在1000分左右,代表性能下降了约27%。小型冷却解决方案的有限冷却潜力很可能使CPU无法在更高的时钟速率下长时间运行。
Cinebench R15 Multi Loop
Cinebench R23: Multi Core | Single Core
Cinebench R15: CPU Multi 64Bit | CPU Single 64Bit
Blender: v2.79 BMW27 CPU
7-Zip 18.03: 7z b 4 | 7z b 4 -mmt1
Geekbench 5.5: Multi-Core | Single-Core
HWBOT x265 Benchmark v2.2: 4k Preset
LibreOffice : 20 Documents To PDF
R Benchmark 2.5: Overall mean
| Cinebench R20 / CPU (Multi Core) | |
| Framework Laptop 13.5 12th Gen Intel | |
| MSI Summit E14 Flip Evo A12MT | |
| Dell Latitude 13 7330 | |
| HP Pavilion Aero 13 be0097nr | |
| Average Intel Core i7-1265U (1669 - 3584, n=10) | |
| Asus ZenBook 13 OLED UM325UA | |
| Microsoft Surface Laptop 4 13 Ryzen 5 | |
| Razer Book 13 FHD | |
| Samsung Galaxy Book2 Pro 13 NP930XED-KA1DE | |
| Average Intel Core i7-1165G7 (1060 - 2657, n=81) | |
| Gateway Ultra Slim 14.1 GWTC51427 | |
| Dell Latitude 5320-TM4V2 | |
| Asus Zenbook S UX393JA | |
| Dell XPS 13 9300 i5 FHD | |
| Dell Latitude 7310 | |
| Lenovo ThinkPad X13 Yoga 20SX0004GE | |
| HP EliteBook x360 830 G6 | |
| Cinebench R20 / CPU (Single Core) | |
| Framework Laptop 13.5 12th Gen Intel | |
| MSI Summit E14 Flip Evo A12MT | |
| Dell Latitude 13 7330 | |
| Average Intel Core i7-1265U (528 - 701, n=10) | |
| Razer Book 13 FHD | |
| Gateway Ultra Slim 14.1 GWTC51427 | |
| HP Pavilion Aero 13 be0097nr | |
| Average Intel Core i7-1165G7 (442 - 589, n=81) | |
| Asus ZenBook 13 OLED UM325UA | |
| Dell Latitude 5320-TM4V2 | |
| Microsoft Surface Laptop 4 13 Ryzen 5 | |
| Asus Zenbook S UX393JA | |
| Dell Latitude 7310 | |
| Dell XPS 13 9300 i5 FHD | |
| Lenovo ThinkPad X13 Yoga 20SX0004GE | |
| HP EliteBook x360 830 G6 | |
| Samsung Galaxy Book2 Pro 13 NP930XED-KA1DE | |
| Cinebench R23 / Multi Core | |
| Framework Laptop 13.5 12th Gen Intel | |
| MSI Summit E14 Flip Evo A12MT | |
| Dell Latitude 13 7330 | |
| HP Pavilion Aero 13 be0097nr | |
| Asus ZenBook 13 OLED UM325UA | |
| Average Intel Core i7-1265U (4332 - 9219, n=10) | |
| Microsoft Surface Laptop 4 13 Ryzen 5 | |
| Razer Book 13 FHD | |
| Samsung Galaxy Book2 Pro 13 NP930XED-KA1DE | |
| Average Intel Core i7-1165G7 (2525 - 6862, n=64) | |
| Gateway Ultra Slim 14.1 GWTC51427 | |
| Dell Latitude 5320-TM4V2 | |
| Cinebench R23 / Single Core | |
| MSI Summit E14 Flip Evo A12MT | |
| Dell Latitude 13 7330 | |
| Framework Laptop 13.5 12th Gen Intel | |
| Average Intel Core i7-1265U (1144 - 1820, n=10) | |
| Gateway Ultra Slim 14.1 GWTC51427 | |
| Average Intel Core i7-1165G7 (1110 - 1539, n=59) | |
| HP Pavilion Aero 13 be0097nr | |
| Dell Latitude 5320-TM4V2 | |
| Asus ZenBook 13 OLED UM325UA | |
| Microsoft Surface Laptop 4 13 Ryzen 5 | |
| Samsung Galaxy Book2 Pro 13 NP930XED-KA1DE | |
| Cinebench R15 / CPU Multi 64Bit | |
| Framework Laptop 13.5 12th Gen Intel | |
| Dell Latitude 13 7330 | |
| Asus ZenBook 13 OLED UM325UA | |
| MSI Summit E14 Flip Evo A12MT | |
| HP Pavilion Aero 13 be0097nr | |
| Microsoft Surface Laptop 4 13 Ryzen 5 | |
| Average Intel Core i7-1265U (706 - 1572, n=10) | |
| Razer Book 13 FHD | |
| Samsung Galaxy Book2 Pro 13 NP930XED-KA1DE | |
| Average Intel Core i7-1165G7 (553 - 1027, n=86) | |
| Gateway Ultra Slim 14.1 GWTC51427 | |
| Dell XPS 13 9300 i5 FHD | |
| Dell XPS 13 9300 i5 FHD | |
| Dell Latitude 5320-TM4V2 | |
| Asus Zenbook S UX393JA | |
| Dell Latitude 7310 | |
| Lenovo ThinkPad X13 Yoga 20SX0004GE | |
| HP EliteBook x360 830 G6 | |
| Cinebench R15 / CPU Single 64Bit | |
| Framework Laptop 13.5 12th Gen Intel | |
| Dell Latitude 13 7330 | |
| MSI Summit E14 Flip Evo A12MT | |
| Average Intel Core i7-1265U (165.3 - 260, n=10) | |
| HP Pavilion Aero 13 be0097nr | |
| Razer Book 13 FHD | |
| Average Intel Core i7-1165G7 (115 - 230, n=78) | |
| Gateway Ultra Slim 14.1 GWTC51427 | |
| Dell Latitude 5320-TM4V2 | |
| Asus ZenBook 13 OLED UM325UA | |
| Dell Latitude 7310 | |
| Asus Zenbook S UX393JA | |
| Lenovo ThinkPad X13 Yoga 20SX0004GE | |
| Microsoft Surface Laptop 4 13 Ryzen 5 | |
| Dell XPS 13 9300 i5 FHD | |
| HP EliteBook x360 830 G6 | |
| Samsung Galaxy Book2 Pro 13 NP930XED-KA1DE | |
| Blender / v2.79 BMW27 CPU | |
| Lenovo ThinkPad X13 Yoga 20SX0004GE | |
| Dell Latitude 7310 | |
| Asus Zenbook S UX393JA | |
| Dell XPS 13 9300 i5 FHD | |
| Dell Latitude 5320-TM4V2 | |
| Average Intel Core i7-1165G7 (468 - 1138, n=80) | |
| Gateway Ultra Slim 14.1 GWTC51427 | |
| Samsung Galaxy Book2 Pro 13 NP930XED-KA1DE | |
| Razer Book 13 FHD | |
| Average Intel Core i7-1265U (364 - 684, n=10) | |
| Microsoft Surface Laptop 4 13 Ryzen 5 | |
| Dell Latitude 13 7330 | |
| Asus ZenBook 13 OLED UM325UA | |
| HP Pavilion Aero 13 be0097nr | |
| MSI Summit E14 Flip Evo A12MT | |
| Framework Laptop 13.5 12th Gen Intel | |
| 7-Zip 18.03 / 7z b 4 -mmt1 | |
| Framework Laptop 13.5 12th Gen Intel | |
| Dell Latitude 13 7330 | |
| HP Pavilion Aero 13 be0097nr | |
| MSI Summit E14 Flip Evo A12MT | |
| Razer Book 13 FHD | |
| Average Intel Core i7-1265U (4614 - 5617, n=10) | |
| Average Intel Core i7-1165G7 (4478 - 5507, n=80) | |
| Dell Latitude 7310 | |
| Dell Latitude 5320-TM4V2 | |
| Lenovo ThinkPad X13 Yoga 20SX0004GE | |
| Asus ZenBook 13 OLED UM325UA | |
| Asus Zenbook S UX393JA | |
| HP EliteBook x360 830 G6 | |
| Gateway Ultra Slim 14.1 GWTC51427 | |
| Dell XPS 13 9300 i5 FHD | |
| Microsoft Surface Laptop 4 13 Ryzen 5 | |
| Samsung Galaxy Book2 Pro 13 NP930XED-KA1DE | |
| Geekbench 5.5 / Multi-Core | |
| MSI Summit E14 Flip Evo A12MT | |
| Framework Laptop 13.5 12th Gen Intel | |
| Average Intel Core i7-1265U (5022 - 8981, n=10) | |
| Dell Latitude 13 7330 | |
| Asus ZenBook 13 OLED UM325UA | |
| Razer Book 13 FHD | |
| Microsoft Surface Laptop 4 13 Ryzen 5 | |
| Gateway Ultra Slim 14.1 GWTC51427 | |
| Average Intel Core i7-1165G7 (3078 - 5926, n=77) | |
| Samsung Galaxy Book2 Pro 13 NP930XED-KA1DE | |
| Asus Zenbook S UX393JA | |
| Dell Latitude 5320-TM4V2 | |
| Dell XPS 13 9300 i5 FHD | |
| Dell Latitude 7310 | |
| Lenovo ThinkPad X13 Yoga 20SX0004GE | |
| Geekbench 5.5 / Single-Core | |
| Dell Latitude 13 7330 | |
| Framework Laptop 13.5 12th Gen Intel | |
| MSI Summit E14 Flip Evo A12MT | |
| Average Intel Core i7-1265U (1429 - 1806, n=10) | |
| Razer Book 13 FHD | |
| Average Intel Core i7-1165G7 (1302 - 1595, n=77) | |
| Gateway Ultra Slim 14.1 GWTC51427 | |
| Dell Latitude 5320-TM4V2 | |
| Asus Zenbook S UX393JA | |
| Dell Latitude 7310 | |
| Dell XPS 13 9300 i5 FHD | |
| Lenovo ThinkPad X13 Yoga 20SX0004GE | |
| Asus ZenBook 13 OLED UM325UA | |
| Microsoft Surface Laptop 4 13 Ryzen 5 | |
| Samsung Galaxy Book2 Pro 13 NP930XED-KA1DE | |
| HWBOT x265 Benchmark v2.2 / 4k Preset | |
| MSI Summit E14 Flip Evo A12MT | |
| Framework Laptop 13.5 12th Gen Intel | |
| HP Pavilion Aero 13 be0097nr | |
| Dell Latitude 13 7330 | |
| Asus ZenBook 13 OLED UM325UA | |
| Average Intel Core i7-1265U (5.09 - 10.6, n=10) | |
| Razer Book 13 FHD | |
| Microsoft Surface Laptop 4 13 Ryzen 5 | |
| Samsung Galaxy Book2 Pro 13 NP930XED-KA1DE | |
| Average Intel Core i7-1165G7 (1.39 - 8.47, n=80) | |
| Gateway Ultra Slim 14.1 GWTC51427 | |
| Asus Zenbook S UX393JA | |
| Dell Latitude 7310 | |
| Lenovo ThinkPad X13 Yoga 20SX0004GE | |
| Dell XPS 13 9300 i5 FHD | |
| LibreOffice / 20 Documents To PDF | |
| Samsung Galaxy Book2 Pro 13 NP930XED-KA1DE | |
| Microsoft Surface Laptop 4 13 Ryzen 5 | |
| Gateway Ultra Slim 14.1 GWTC51427 | |
| Asus ZenBook 13 OLED UM325UA | |
| Dell Latitude 5320-TM4V2 | |
| Dell Latitude 7310 | |
| Lenovo ThinkPad X13 Yoga 20SX0004GE | |
| HP Pavilion Aero 13 be0097nr | |
| Average Intel Core i7-1265U (44 - 61.6, n=10) | |
| Razer Book 13 FHD | |
| MSI Summit E14 Flip Evo A12MT | |
| Average Intel Core i7-1165G7 (21.5 - 88.1, n=78) | |
| Dell Latitude 13 7330 | |
| Asus Zenbook S UX393JA | |
| Framework Laptop 13.5 12th Gen Intel | |
| R Benchmark 2.5 / Overall mean | |
| Samsung Galaxy Book2 Pro 13 NP930XED-KA1DE | |
| Dell XPS 13 9300 i5 FHD | |
| Asus Zenbook S UX393JA | |
| Lenovo ThinkPad X13 Yoga 20SX0004GE | |
| Microsoft Surface Laptop 4 13 Ryzen 5 | |
| Dell Latitude 5320-TM4V2 | |
| Dell Latitude 7310 | |
| Gateway Ultra Slim 14.1 GWTC51427 | |
| Asus ZenBook 13 OLED UM325UA | |
| Average Intel Core i7-1165G7 (0.552 - 1.002, n=80) | |
| Razer Book 13 FHD | |
| HP Pavilion Aero 13 be0097nr | |
| Average Intel Core i7-1265U (0.4666 - 0.578, n=10) | |
| MSI Summit E14 Flip Evo A12MT | |
| Dell Latitude 13 7330 | |
| Framework Laptop 13.5 12th Gen Intel | |
Cinebench R23: Multi Core | Single Core
Cinebench R15: CPU Multi 64Bit | CPU Single 64Bit
Blender: v2.79 BMW27 CPU
7-Zip 18.03: 7z b 4 | 7z b 4 -mmt1
Geekbench 5.5: Multi-Core | Single-Core
HWBOT x265 Benchmark v2.2: 4k Preset
LibreOffice : 20 Documents To PDF
R Benchmark 2.5: Overall mean
* ... smaller is better
AIDA64: FP32 Ray-Trace | FPU Julia | CPU SHA3 | CPU Queen | FPU SinJulia | FPU Mandel | CPU AES | CPU ZLib | FP64 Ray-Trace | CPU PhotoWorxx
| Performance rating | |
| Microsoft Surface Laptop 4 13 Ryzen 5 | |
| Framework Laptop 13.5 12th Gen Intel | |
| Dell Latitude 13 7330 | |
| Dell Latitude 7310 | |
| Lenovo ThinkPad X13 Yoga 20SX0004GE | |
| AIDA64 / FP32 Ray-Trace | |
| Microsoft Surface Laptop 4 13 Ryzen 5 | |
| Dell Latitude 13 7330 | |
| Framework Laptop 13.5 12th Gen Intel | |
| Dell Latitude 7310 | |
| Lenovo ThinkPad X13 Yoga 20SX0004GE | |
| AIDA64 / FPU Julia | |
| Microsoft Surface Laptop 4 13 Ryzen 5 | |
| Dell Latitude 13 7330 | |
| Framework Laptop 13.5 12th Gen Intel | |
| Dell Latitude 7310 | |
| Lenovo ThinkPad X13 Yoga 20SX0004GE | |
| AIDA64 / CPU SHA3 | |
| Dell Latitude 13 7330 | |
| Framework Laptop 13.5 12th Gen Intel | |
| Microsoft Surface Laptop 4 13 Ryzen 5 | |
| Lenovo ThinkPad X13 Yoga 20SX0004GE | |
| Dell Latitude 7310 | |
| AIDA64 / CPU Queen | |
| Framework Laptop 13.5 12th Gen Intel | |
| Microsoft Surface Laptop 4 13 Ryzen 5 | |
| Dell Latitude 13 7330 | |
| Dell Latitude 7310 | |
| Lenovo ThinkPad X13 Yoga 20SX0004GE | |
| AIDA64 / FPU SinJulia | |
| Microsoft Surface Laptop 4 13 Ryzen 5 | |
| Framework Laptop 13.5 12th Gen Intel | |
| Dell Latitude 13 7330 | |
| Dell Latitude 7310 | |
| Lenovo ThinkPad X13 Yoga 20SX0004GE | |
| AIDA64 / FPU Mandel | |
| Microsoft Surface Laptop 4 13 Ryzen 5 | |
| Dell Latitude 13 7330 | |
| Framework Laptop 13.5 12th Gen Intel | |
| Dell Latitude 7310 | |
| Lenovo ThinkPad X13 Yoga 20SX0004GE | |
| AIDA64 / CPU AES | |
| Framework Laptop 13.5 12th Gen Intel | |
| Dell Latitude 13 7330 | |
| Microsoft Surface Laptop 4 13 Ryzen 5 | |
| Lenovo ThinkPad X13 Yoga 20SX0004GE | |
| Dell Latitude 7310 | |
| AIDA64 / CPU ZLib | |
| Framework Laptop 13.5 12th Gen Intel | |
| Microsoft Surface Laptop 4 13 Ryzen 5 | |
| Dell Latitude 13 7330 | |
| Lenovo ThinkPad X13 Yoga 20SX0004GE | |
| Dell Latitude 7310 | |
| AIDA64 / FP64 Ray-Trace | |
| Microsoft Surface Laptop 4 13 Ryzen 5 | |
| Dell Latitude 13 7330 | |
| Framework Laptop 13.5 12th Gen Intel | |
| Dell Latitude 7310 | |
| Lenovo ThinkPad X13 Yoga 20SX0004GE | |
| AIDA64 / CPU PhotoWorxx | |
| Framework Laptop 13.5 12th Gen Intel | |
| Dell Latitude 13 7330 | |
| Dell Latitude 7310 | |
| Microsoft Surface Laptop 4 13 Ryzen 5 | |
| Lenovo ThinkPad X13 Yoga 20SX0004GE | |
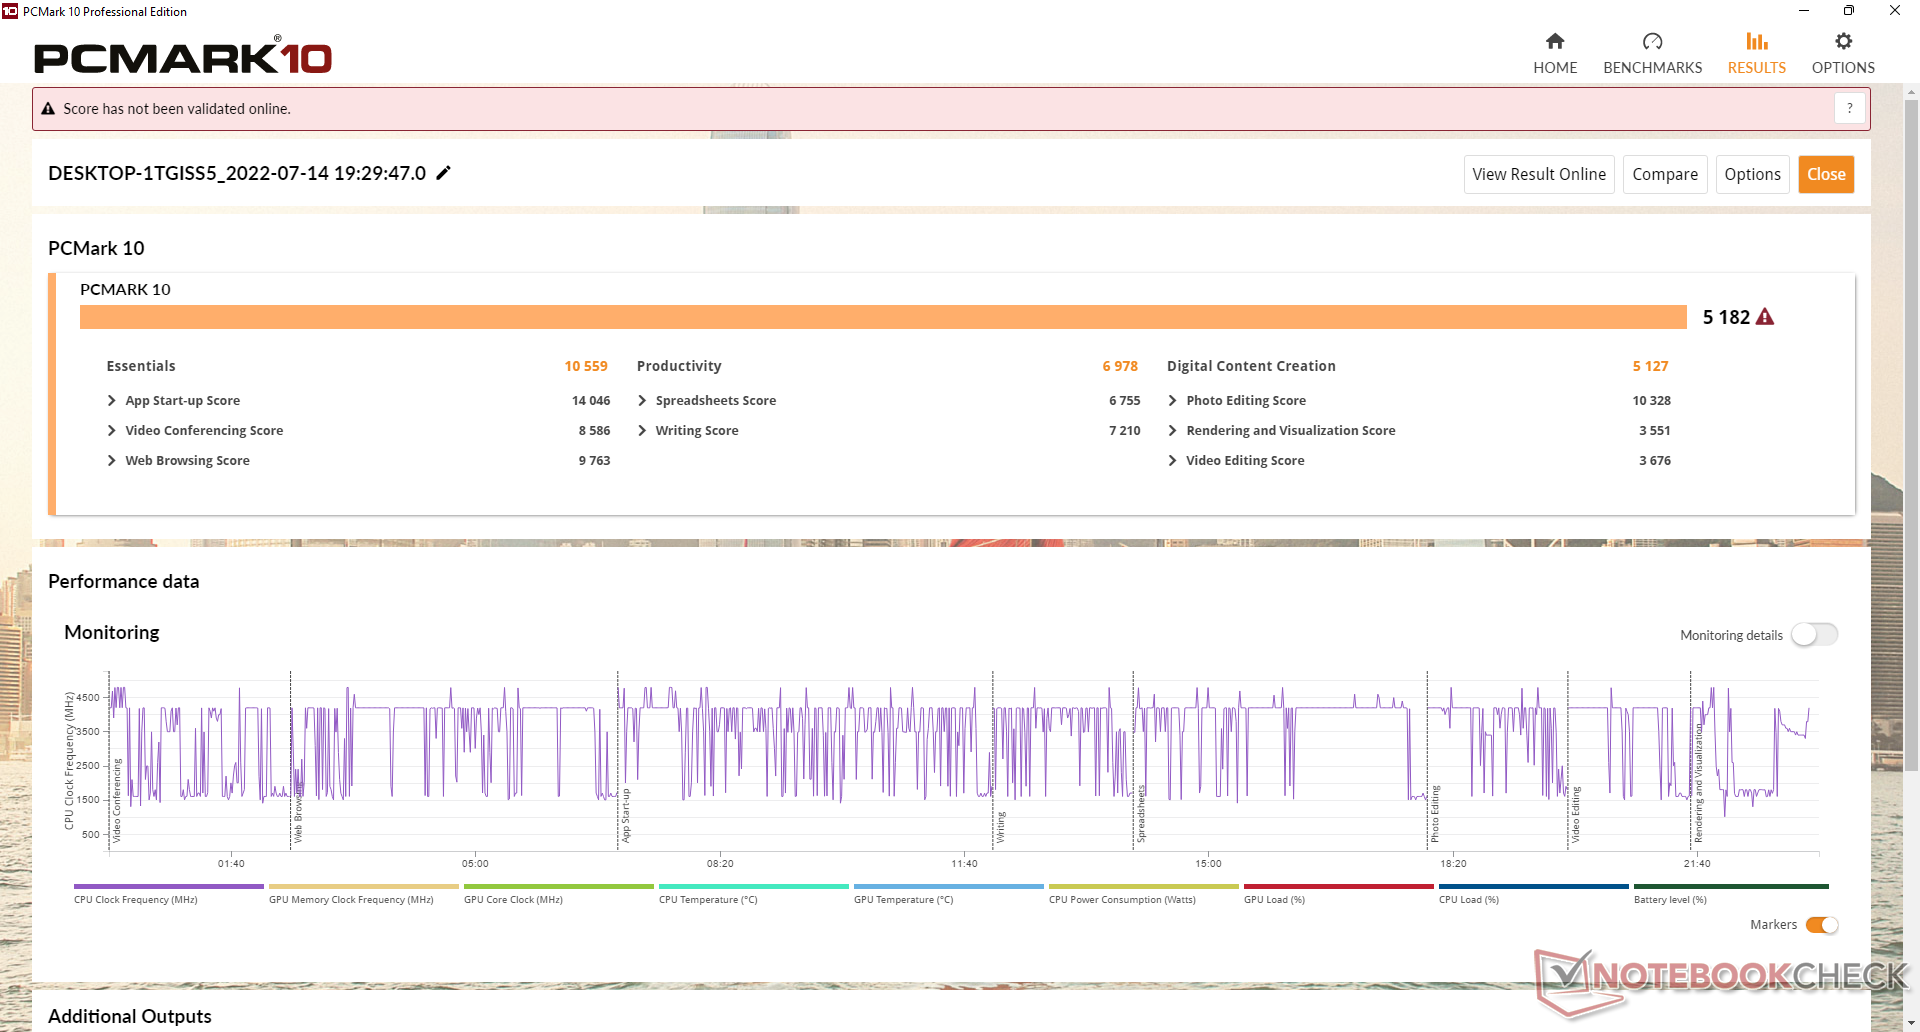
系统性能
PCMark得分高于许多其他运行在上一代或更早的CPU上的商务笔记本电脑,如微软Surface Laptop 4或特别是Latitude 7310。的Razer Book 13由于其更快的固态硬盘和集成图形性能,非常接近。
CrossMark: Overall | Productivity | Creativity | Responsiveness
| PCMark 10 / Score | |
| Framework Laptop 13.5 12th Gen Intel | |
| Average Intel Core i7-1265U, Intel Iris Xe Graphics G7 96EUs (4753 - 5766, n=7) | |
| Dell Latitude 13 7330 | |
| Razer Book 13 FHD | |
| Microsoft Surface Laptop 4 13 Ryzen 5 | |
| Dell Latitude 7310 | |
| Lenovo ThinkPad X13 Yoga 20SX0004GE | |
| PCMark 10 / Essentials | |
| Framework Laptop 13.5 12th Gen Intel | |
| Dell Latitude 13 7330 | |
| Average Intel Core i7-1265U, Intel Iris Xe Graphics G7 96EUs (9278 - 11418, n=7) | |
| Razer Book 13 FHD | |
| Lenovo ThinkPad X13 Yoga 20SX0004GE | |
| Dell Latitude 7310 | |
| Microsoft Surface Laptop 4 13 Ryzen 5 | |
| PCMark 10 / Productivity | |
| Dell Latitude 7310 | |
| Framework Laptop 13.5 12th Gen Intel | |
| Dell Latitude 13 7330 | |
| Lenovo ThinkPad X13 Yoga 20SX0004GE | |
| Razer Book 13 FHD | |
| Average Intel Core i7-1265U, Intel Iris Xe Graphics G7 96EUs (5828 - 7311, n=7) | |
| Microsoft Surface Laptop 4 13 Ryzen 5 | |
| PCMark 10 / Digital Content Creation | |
| Framework Laptop 13.5 12th Gen Intel | |
| Average Intel Core i7-1265U, Intel Iris Xe Graphics G7 96EUs (5127 - 6330, n=7) | |
| Razer Book 13 FHD | |
| Dell Latitude 13 7330 | |
| Microsoft Surface Laptop 4 13 Ryzen 5 | |
| Dell Latitude 7310 | |
| Lenovo ThinkPad X13 Yoga 20SX0004GE | |
| CrossMark / Overall | |
| Framework Laptop 13.5 12th Gen Intel | |
| Average Intel Core i7-1265U, Intel Iris Xe Graphics G7 96EUs (1301 - 1615, n=7) | |
| Dell Latitude 13 7330 | |
| CrossMark / Productivity | |
| Framework Laptop 13.5 12th Gen Intel | |
| Dell Latitude 13 7330 | |
| Average Intel Core i7-1265U, Intel Iris Xe Graphics G7 96EUs (1230 - 1586, n=7) | |
| CrossMark / Creativity | |
| Framework Laptop 13.5 12th Gen Intel | |
| Average Intel Core i7-1265U, Intel Iris Xe Graphics G7 96EUs (1413 - 1706, n=7) | |
| Dell Latitude 13 7330 | |
| CrossMark / Responsiveness | |
| Framework Laptop 13.5 12th Gen Intel | |
| Average Intel Core i7-1265U, Intel Iris Xe Graphics G7 96EUs (1193 - 1521, n=7) | |
| Dell Latitude 13 7330 | |
| PCMark 10 Score | 5182 points | |
Help | ||
| AIDA64 / Memory Copy | |
| Average Intel Core i7-1265U (40212 - 72204, n=10) | |
| Framework Laptop 13.5 12th Gen Intel | |
| Dell Latitude 13 7330 | |
| Microsoft Surface Laptop 4 13 Ryzen 5 | |
| Dell Latitude 7310 | |
| Lenovo ThinkPad X13 Yoga 20SX0004GE | |
| AIDA64 / Memory Read | |
| Average Intel Core i7-1265U (41808 - 69493, n=10) | |
| Framework Laptop 13.5 12th Gen Intel | |
| Microsoft Surface Laptop 4 13 Ryzen 5 | |
| Dell Latitude 13 7330 | |
| Dell Latitude 7310 | |
| Lenovo ThinkPad X13 Yoga 20SX0004GE | |
| AIDA64 / Memory Write | |
| Average Intel Core i7-1265U (41382 - 76027, n=10) | |
| Framework Laptop 13.5 12th Gen Intel | |
| Dell Latitude 13 7330 | |
| Microsoft Surface Laptop 4 13 Ryzen 5 | |
| Dell Latitude 7310 | |
| Lenovo ThinkPad X13 Yoga 20SX0004GE | |
| AIDA64 / Memory Latency | |
| Microsoft Surface Laptop 4 13 Ryzen 5 | |
| Average Intel Core i7-1265U (74.6 - 112.4, n=10) | |
| Lenovo ThinkPad X13 Yoga 20SX0004GE | |
| Dell Latitude 7310 | |
| Framework Laptop 13.5 12th Gen Intel | |
| Dell Latitude 13 7330 | |
* ... smaller is better
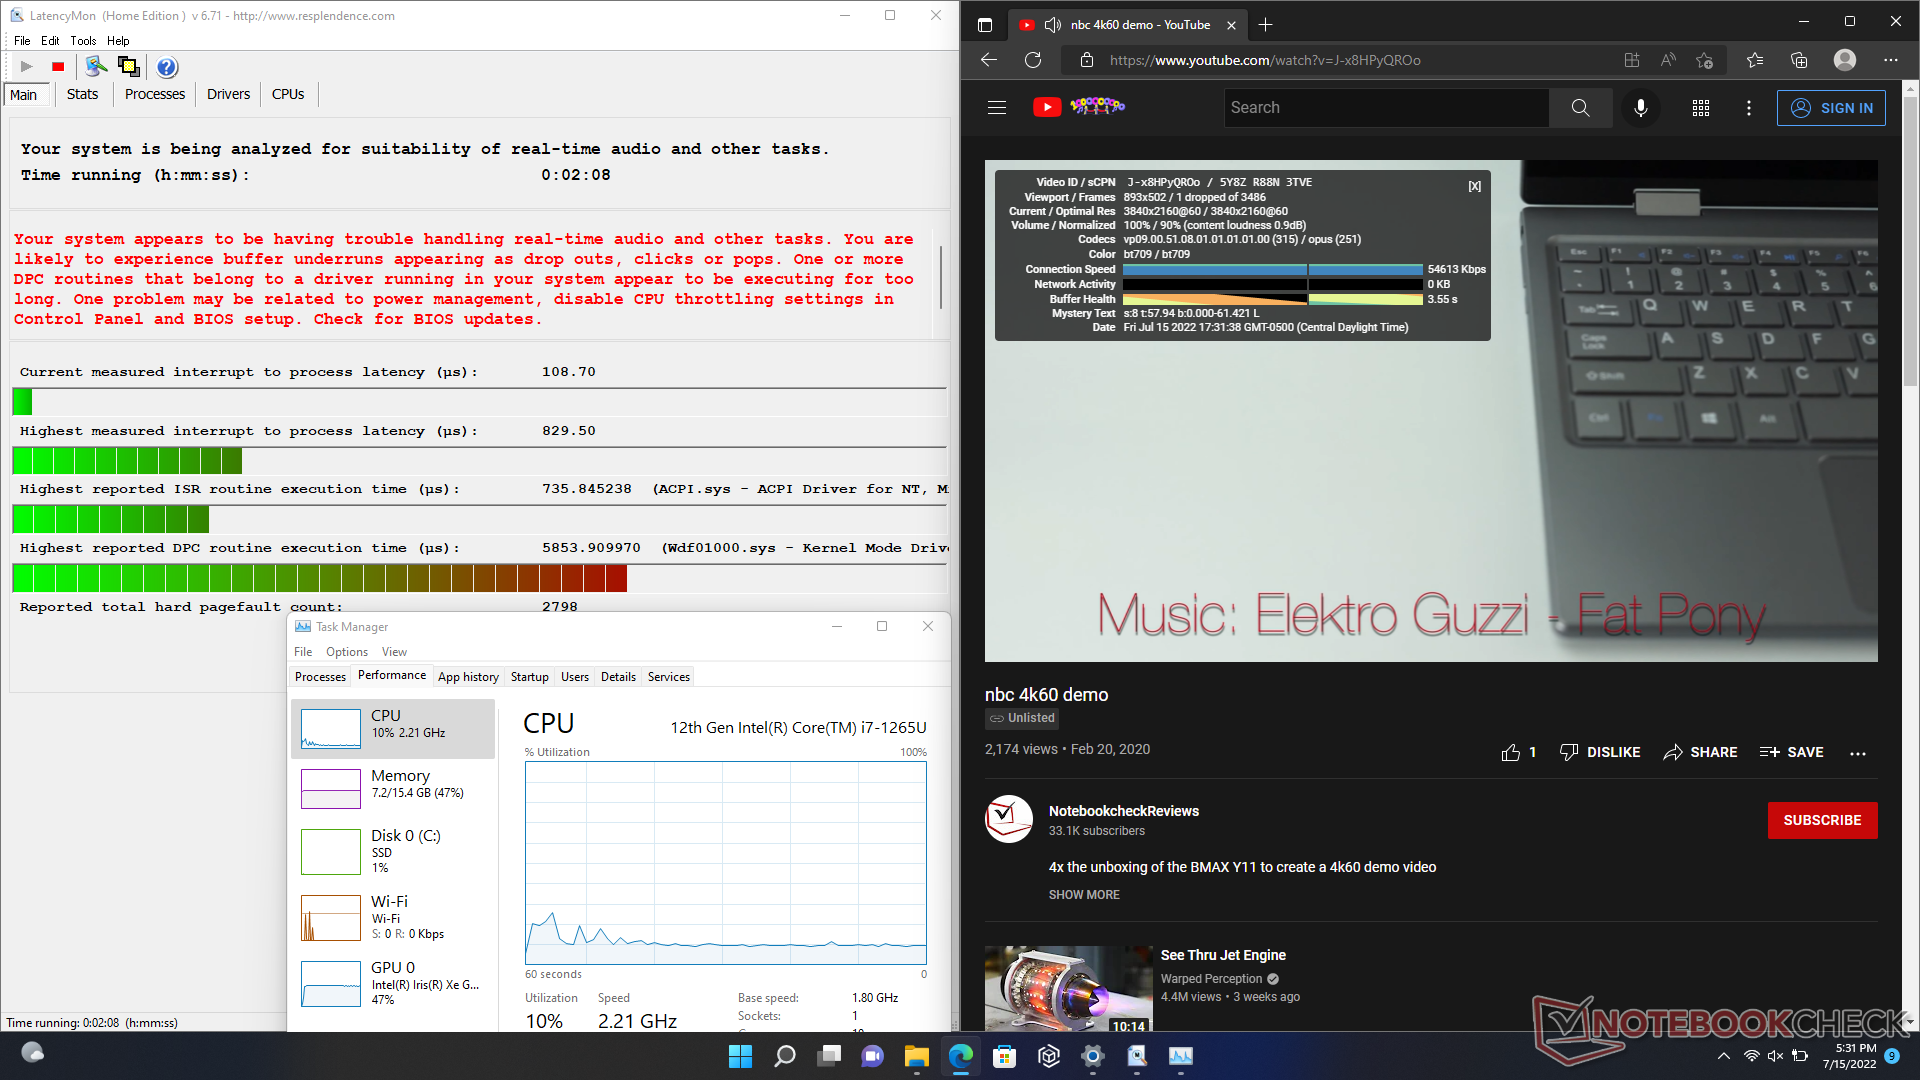
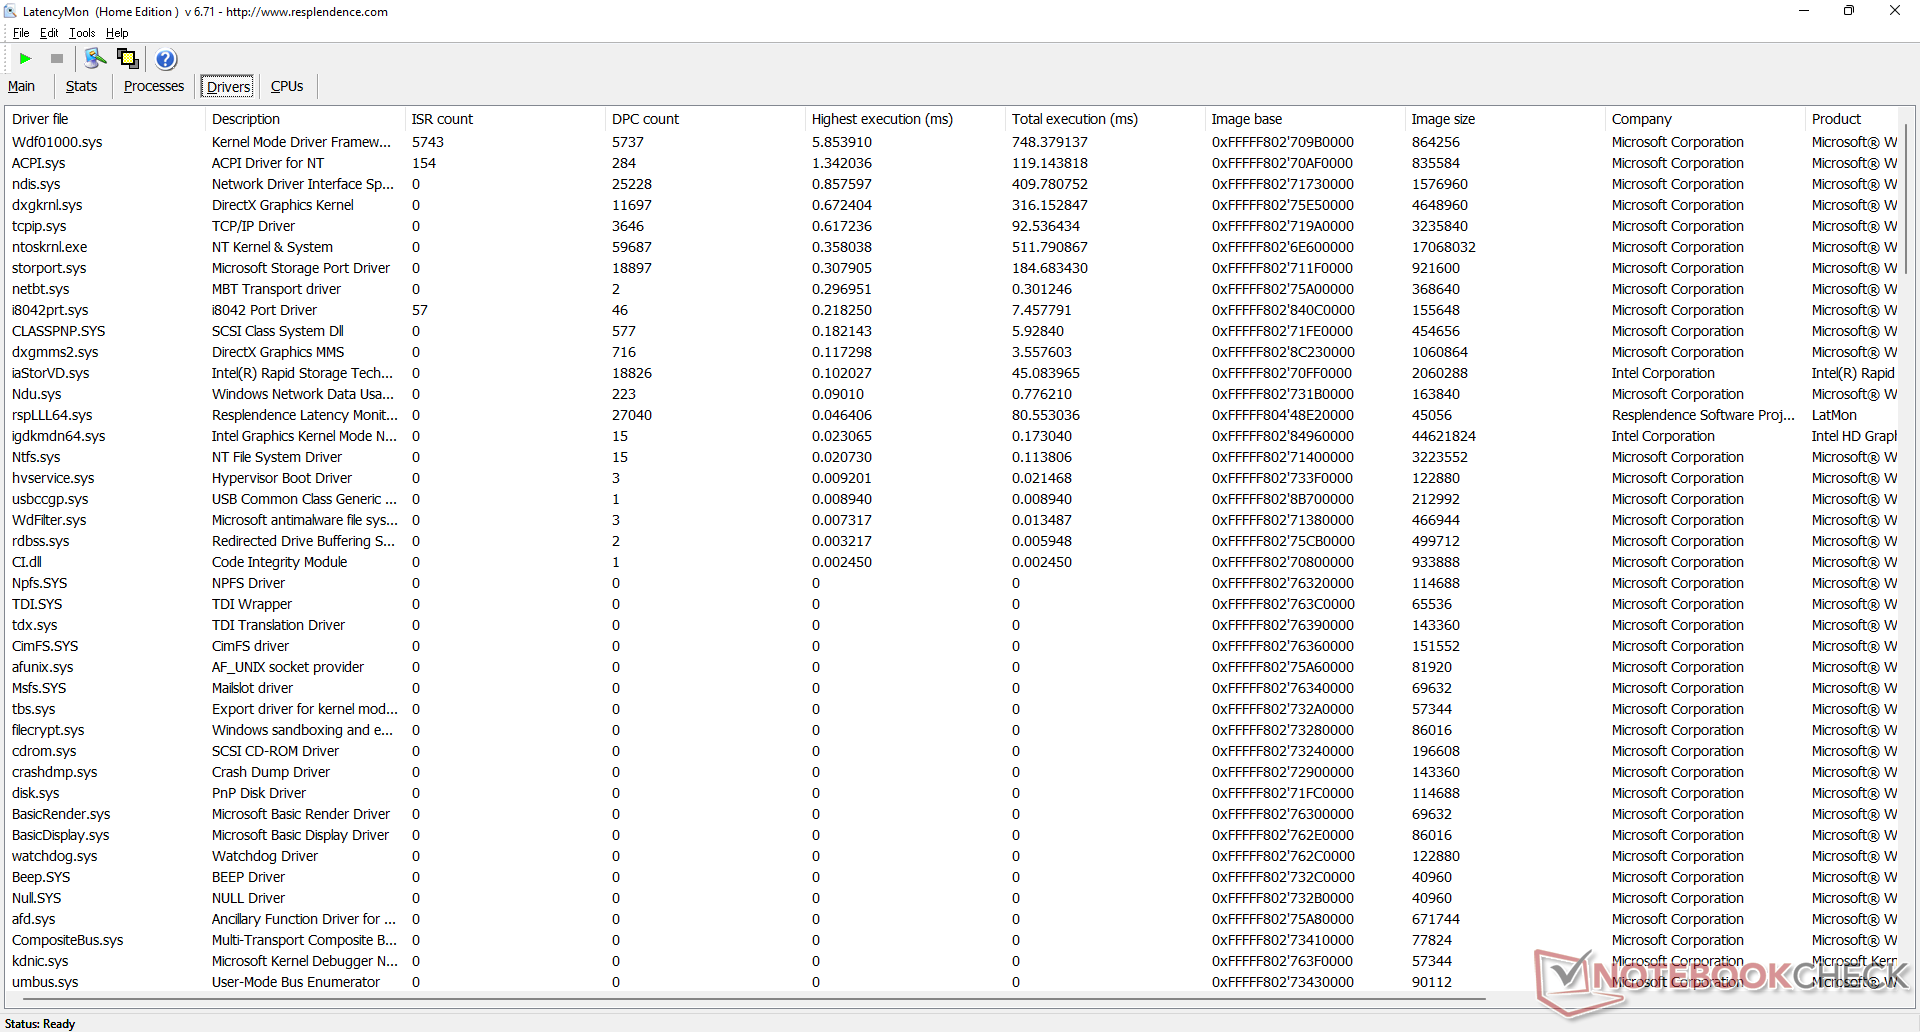
DPC延时
LatencyMon显示了在我们的主页上打开多个浏览器标签时的DPC问题。在60FPS下的4K视频播放是完美的,在我们60秒的测试视频中只有一个丢帧。
| DPC Latencies / LatencyMon - interrupt to process latency (max), Web, Youtube, Prime95 | |
| Razer Book 13 FHD | |
| Framework Laptop 13.5 12th Gen Intel | |
| Lenovo ThinkPad X13 Yoga 20SX0004GE | |
| Microsoft Surface Laptop 4 13 Ryzen 5 | |
| Dell Latitude 13 7330 | |
| Dell Latitude 7310 | |
* ... smaller is better
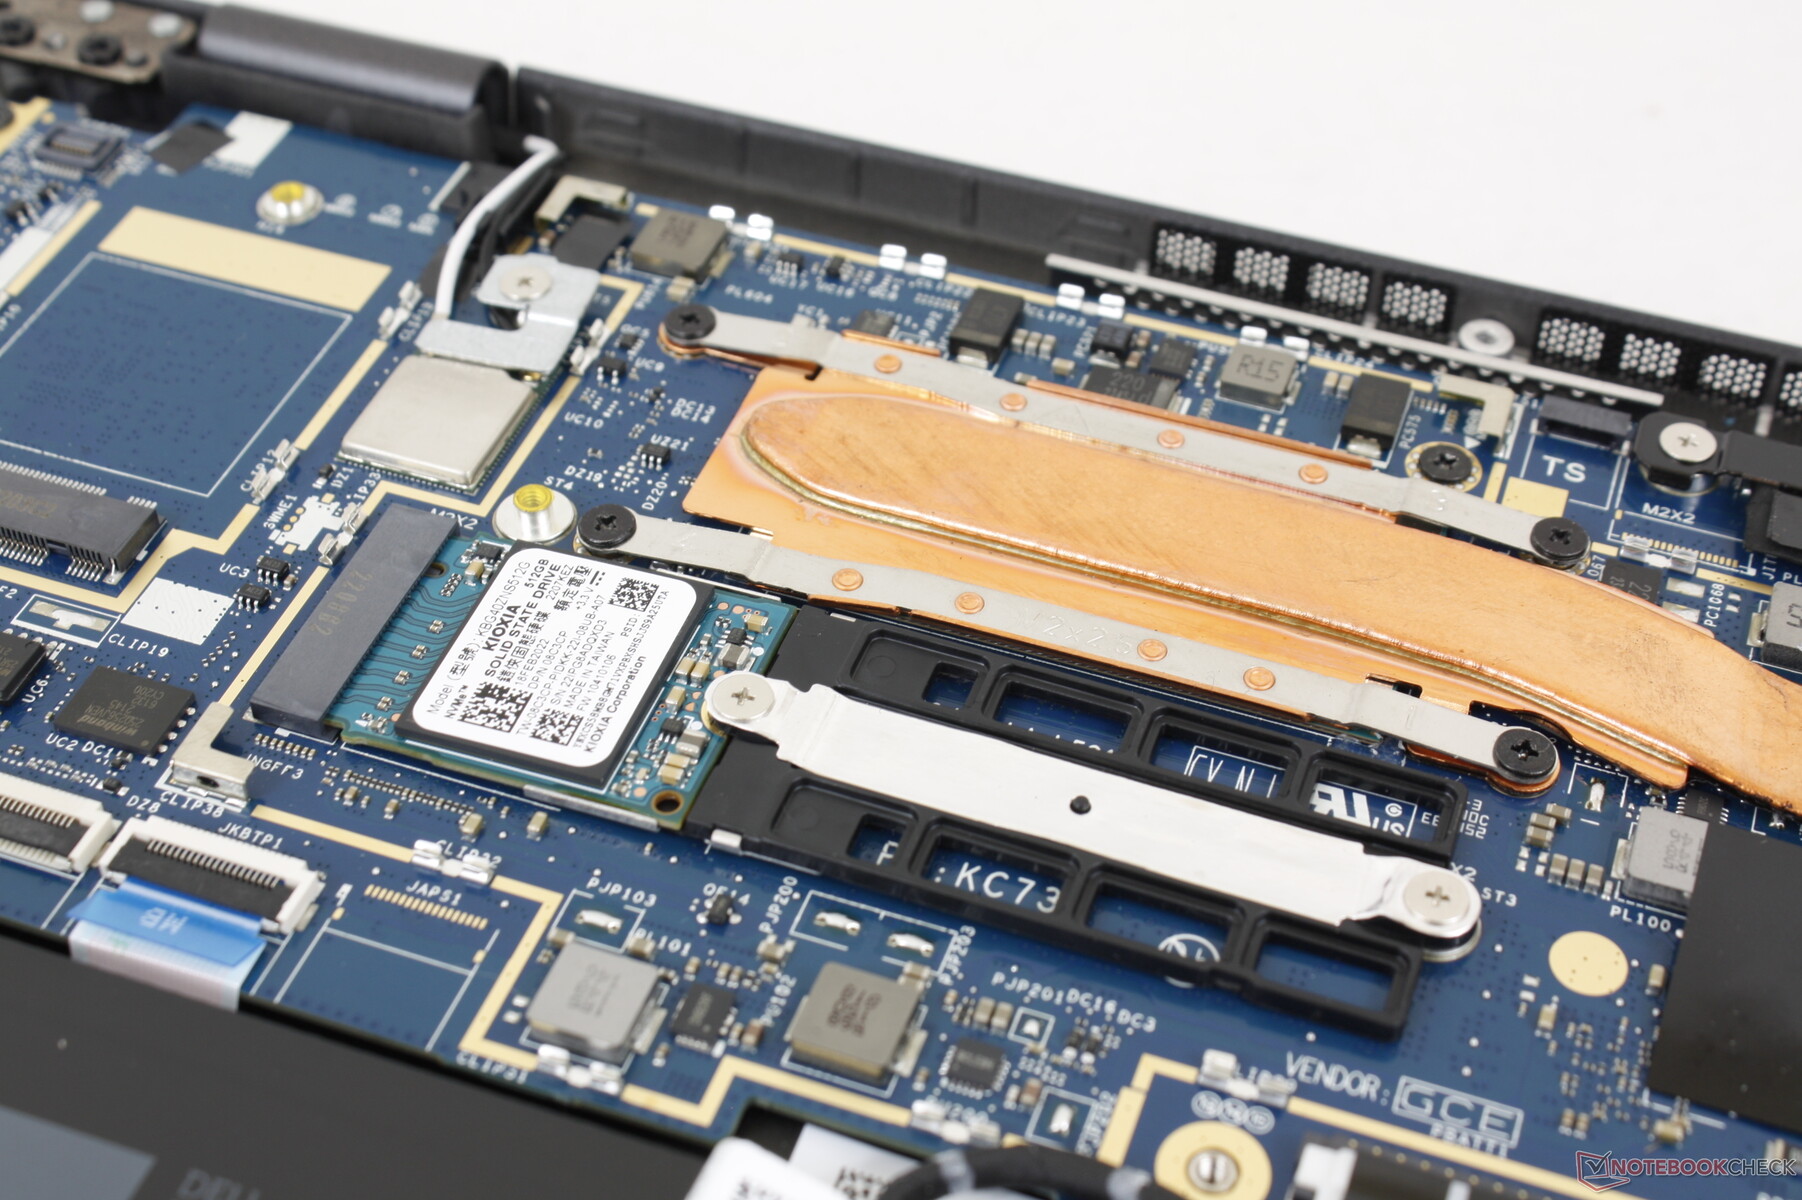
存储设备 - 只有一个内部驱动器
戴尔喜欢用较短的M.2 2230固态硬盘运送其许多子笔记本,而大多数其他笔记本上的2280硬盘则较长。这款 512GB KioxiaPCIe3 x4硬盘在我们的测试装置中的最高速度为2400 MB/s,然后节流启动,将传输率降低到1200 MB/s,如下图DiskSpd循环测试结果所示。该硬盘在承受压力时可能会遇到温度限制。相比之下,HP EliteBook 845 G9在相同的测试条件下,惠普EliteBook 845 G9的PCIe4 x4硬盘能够在更长的时间内维持明显更快的传输速率。

| Drive Performance rating - Percent | |
| Lenovo ThinkPad X13 Yoga 20SX0004GE | |
| Framework Laptop 13.5 12th Gen Intel | |
| Dell Latitude 7310 | |
| Razer Book 13 FHD | |
| Dell Latitude 13 7330 | |
| Microsoft Surface Laptop 4 13 Ryzen 5 | |
* ... smaller is better
Disk Throttling: DiskSpd Read Loop, Queue Depth 8
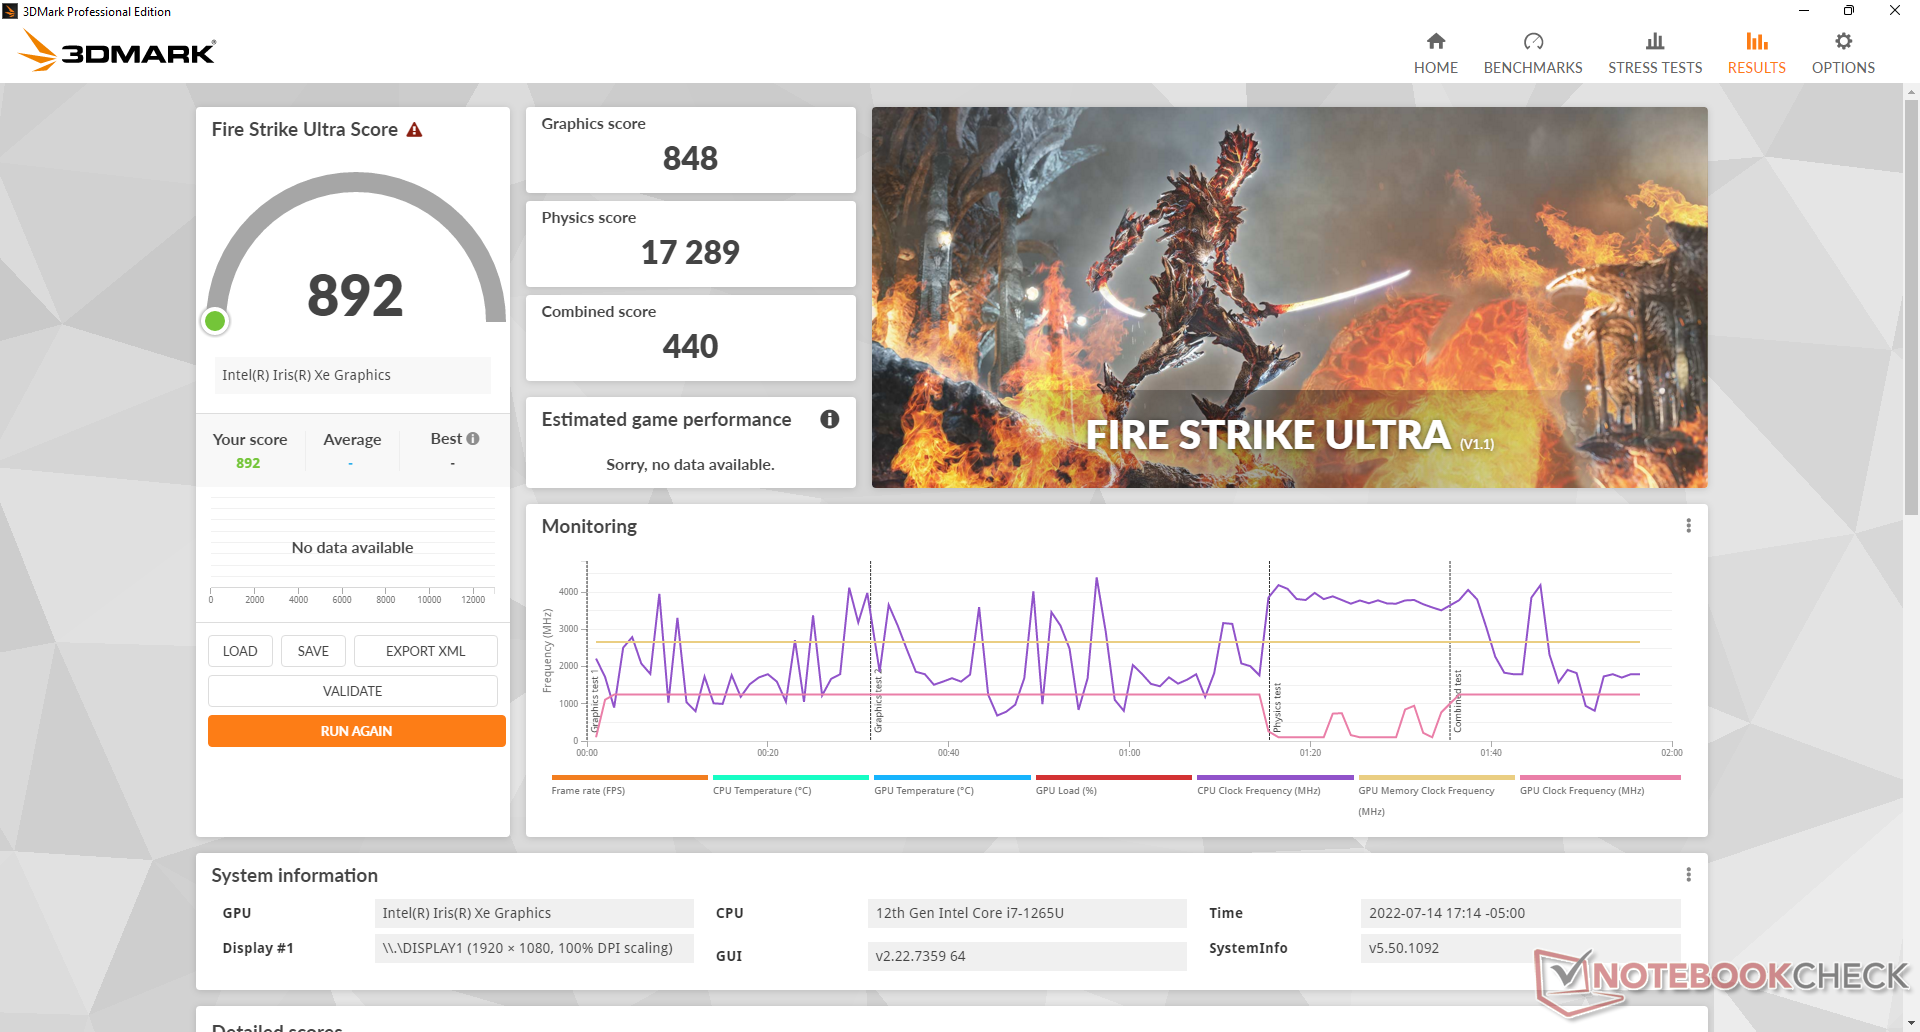
GPU性能--Iris Xe在不断进步
图形性能大约比我们数据库中配备相同的笔记本电脑慢5%到20%。 Iris Xe 96 EUsGPU。对于一个集成图形芯片来说,它仍然很快,但肯定有更快的选择,如 Razer Book 13或 AMD驱动的华硕Zenbook S 13如果最大限度地提高GPU性能是一个优先事项。
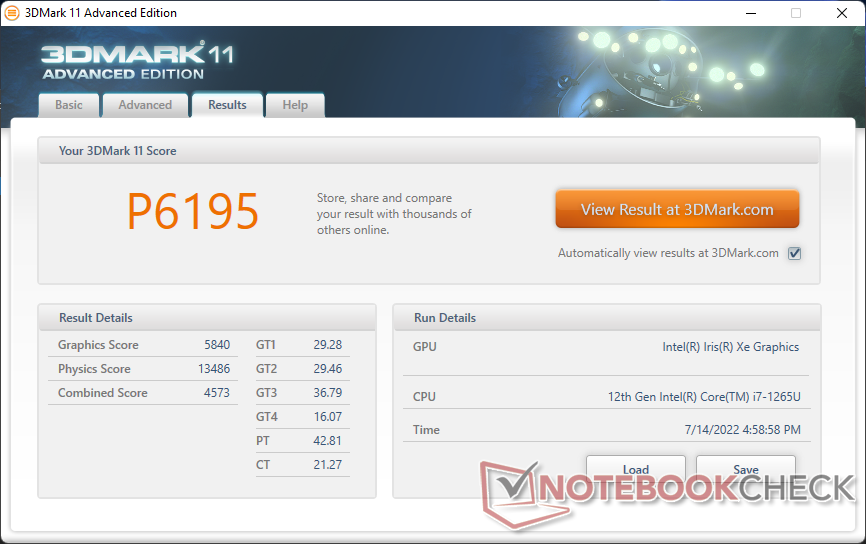
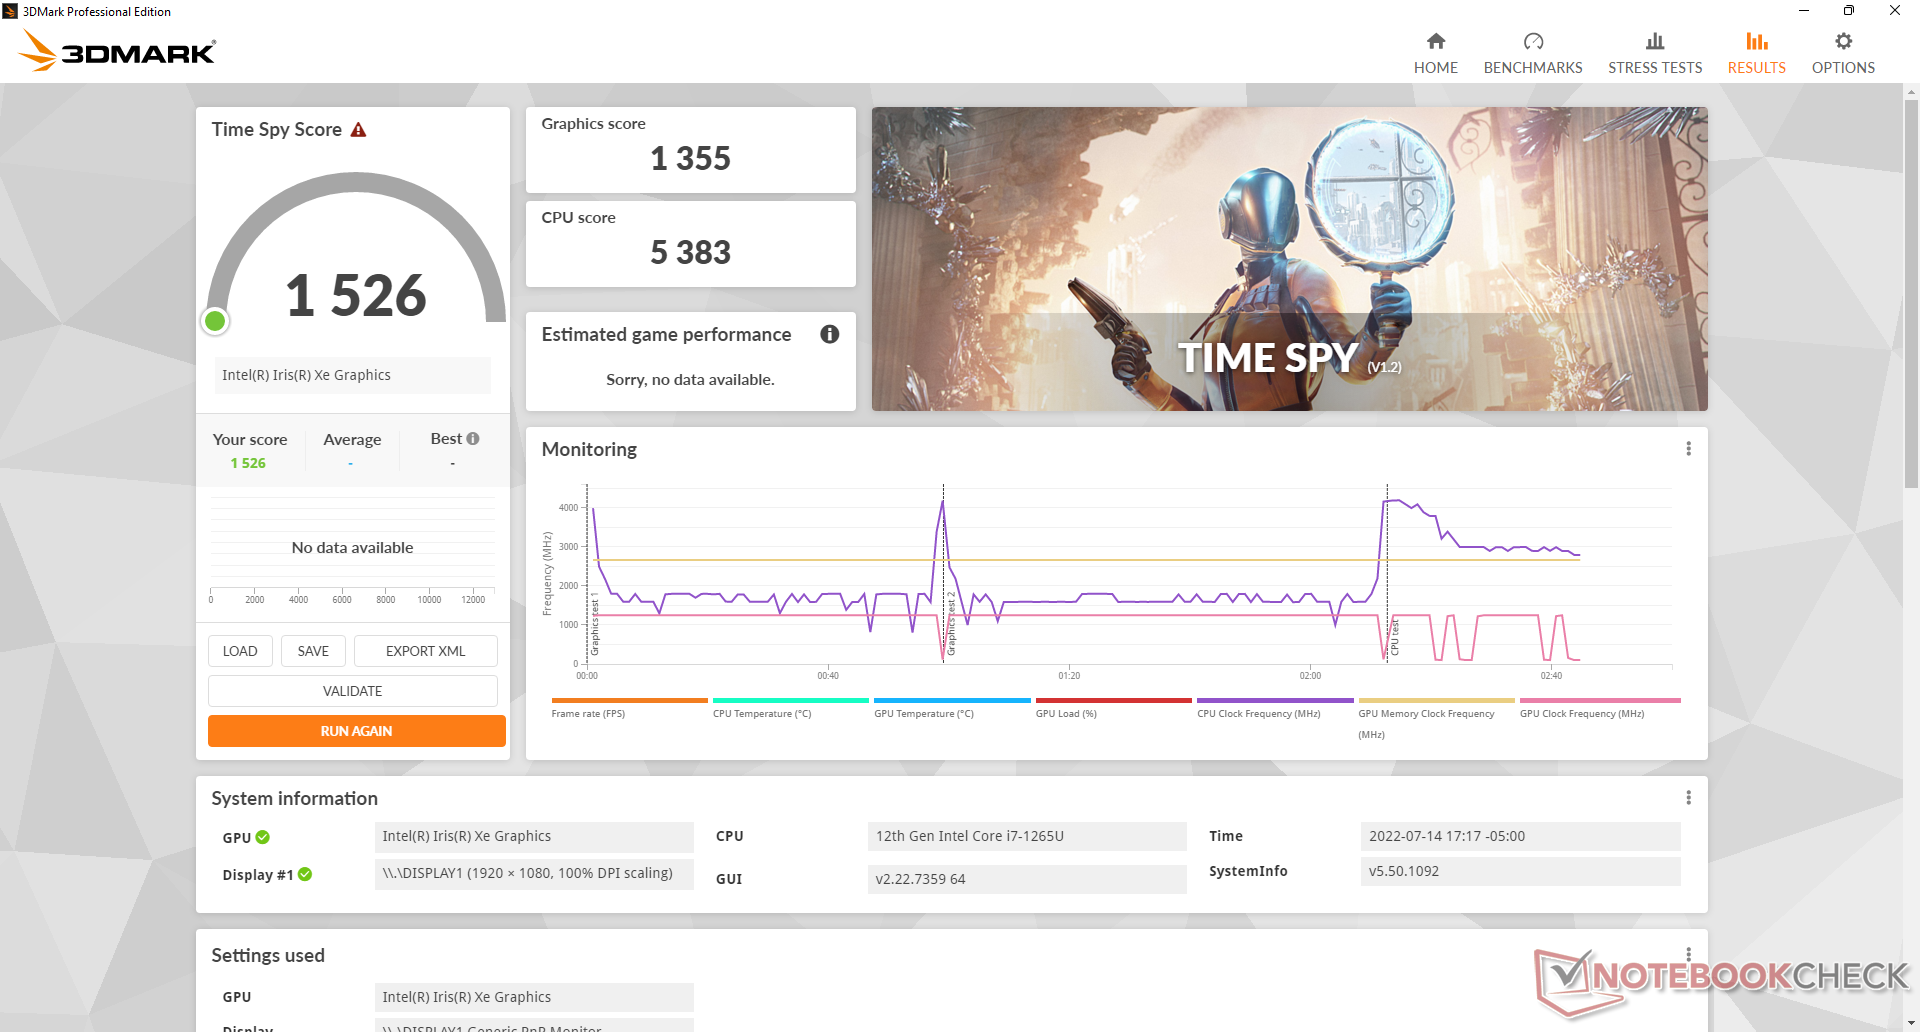
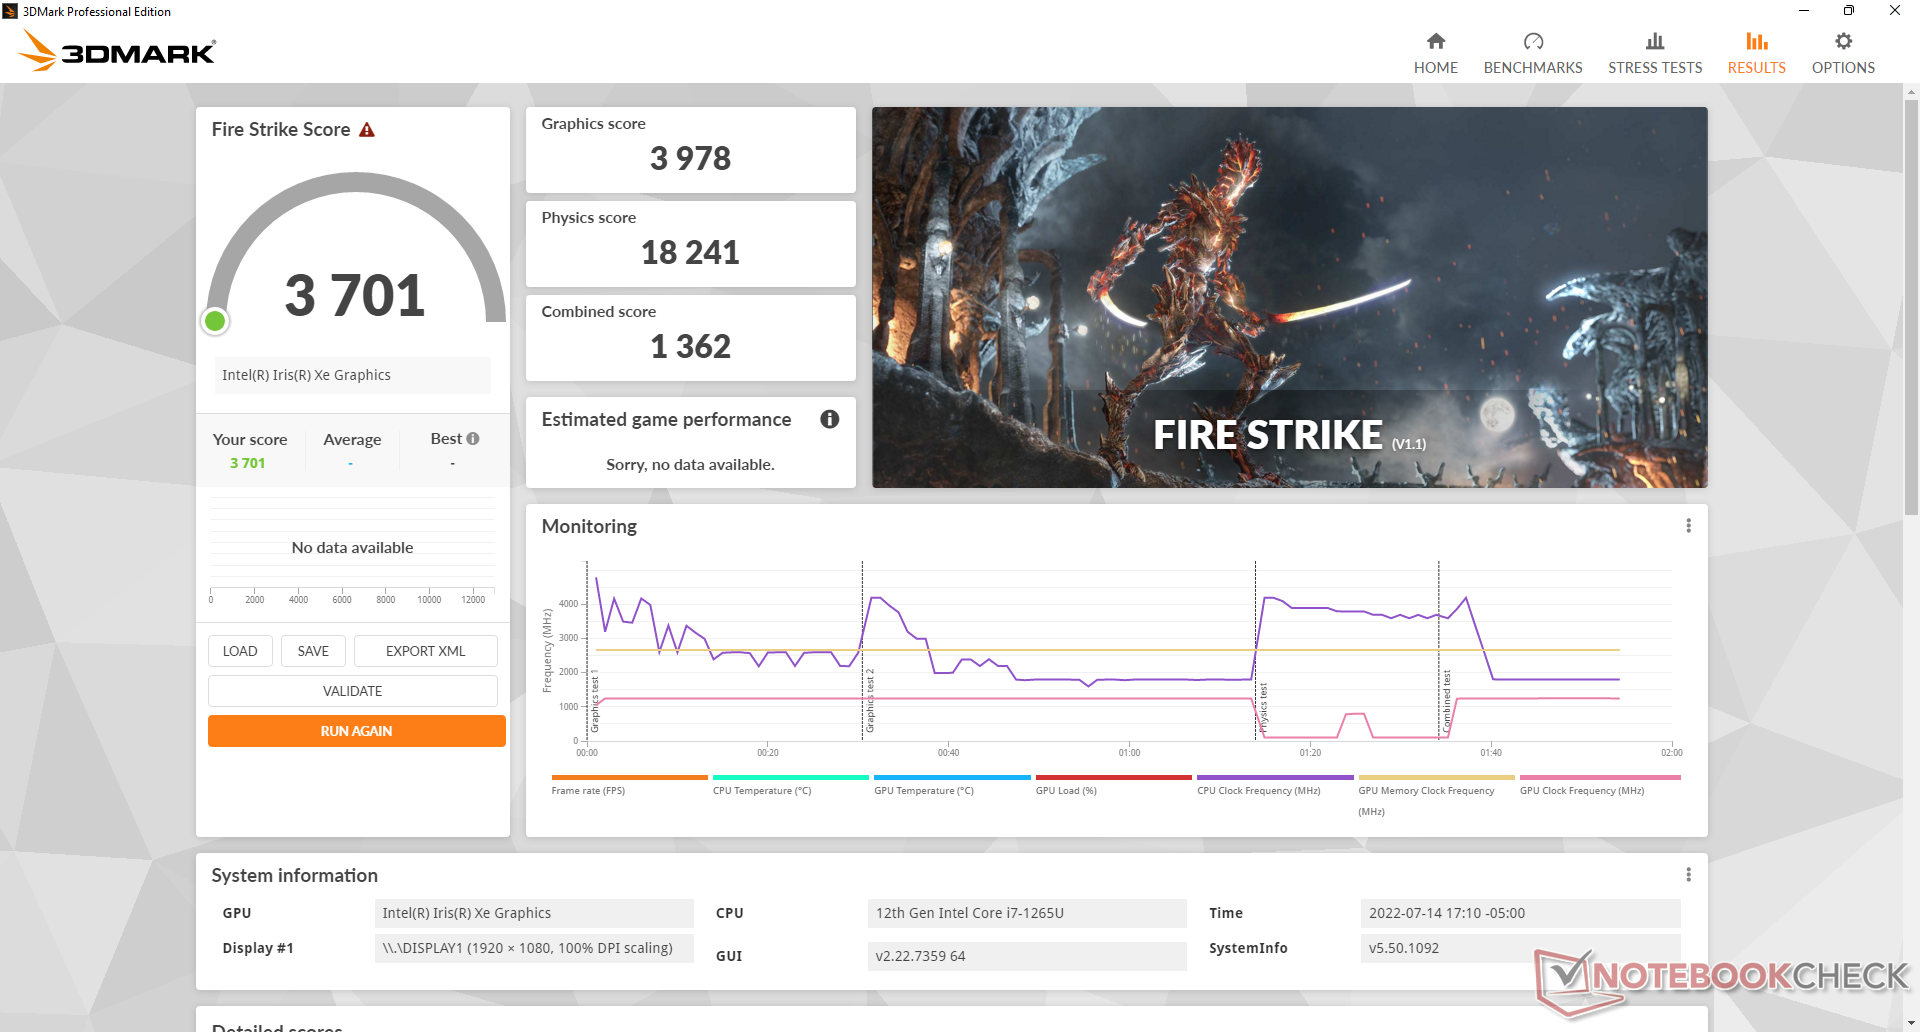
| 3DMark 11 Performance | 6195 points | |
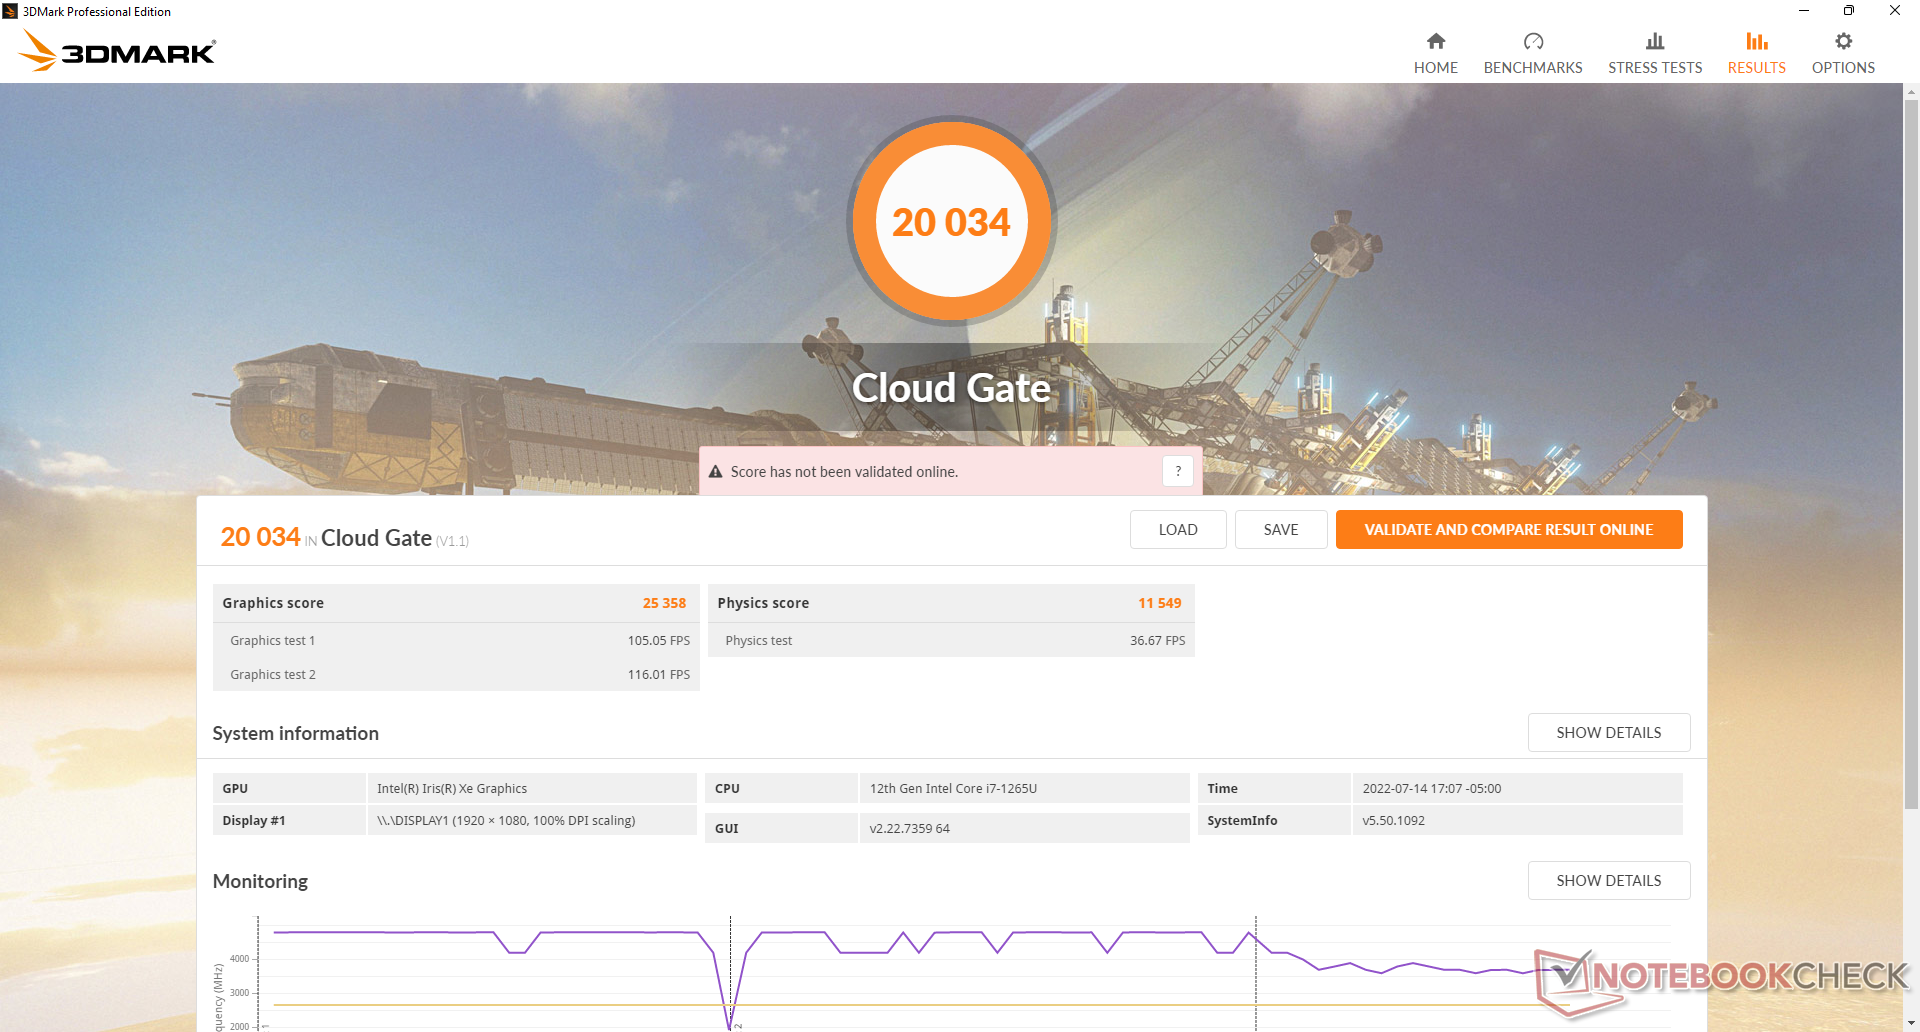
| 3DMark Cloud Gate Standard Score | 20034 points | |
| 3DMark Fire Strike Score | 3701 points | |
| 3DMark Time Spy Score | 1526 points | |
Help | ||
| Cyberpunk 2077 1.6 | |
| 1920x1080 Low Preset | |
| Framework Laptop 13.5 12th Gen Intel | |
| Average Intel Iris Xe Graphics G7 96EUs (13 - 25.9, n=42) | |
| Dell Latitude 13 7330 | |
| 1920x1080 Medium Preset | |
| Framework Laptop 13.5 12th Gen Intel | |
| Average Intel Iris Xe Graphics G7 96EUs (10.8 - 21.7, n=37) | |
| Dell Latitude 13 7330 | |
| 1920x1080 High Preset | |
| Framework Laptop 13.5 12th Gen Intel | |
| Average Intel Iris Xe Graphics G7 96EUs (9.8 - 16.9, n=34) | |
| Dell Latitude 13 7330 | |
Witcher 3 FPS Chart
| low | med. | high | ultra | |
|---|---|---|---|---|
| GTA V (2015) | 84.5 | 64.7 | 13.9 | 6.15 |
| The Witcher 3 (2015) | 71.6 | 47.3 | 23.6 | 11.9 |
| Dota 2 Reborn (2015) | 109.7 | 79.6 | 50.6 | 44.9 |
| Final Fantasy XV Benchmark (2018) | 32.9 | 17.5 | 12.9 | |
| X-Plane 11.11 (2018) | 47.3 | 33.8 | 30.3 | |
| Strange Brigade (2018) | 75.8 | 29.8 | 24.9 | 20 |
| Cyberpunk 2077 1.6 (2022) | 18.7 | 15.4 | 11.2 |
排放
系统噪音 - 基本上是安静的
当浏览网页或处理文字时,风扇噪音往往徘徊在23.4 dB(A)和25.3 dB(A)的无声背景之间,在大多数环境中几乎听不见。然而,当运行要求更高的负载(如3DMark 06)时,它开始迅速回升,风扇噪音可以达到38 dB(A),比我们在ThinkPad X13 Yoga上记录的还要响亮。 ThinkPad X13 Yoga,Razer Book 13,或更老的Latitude 7310。在运行时,风扇噪音会在37和39 dB(A)之间循环,而不是保持稳定。 Witcher 3而不是保持稳定,这本来是最好的。
当运行Prime95时,风扇噪音会在短时间内飙升到43分贝(A),然后迅速回落到39分贝(A)的范围。
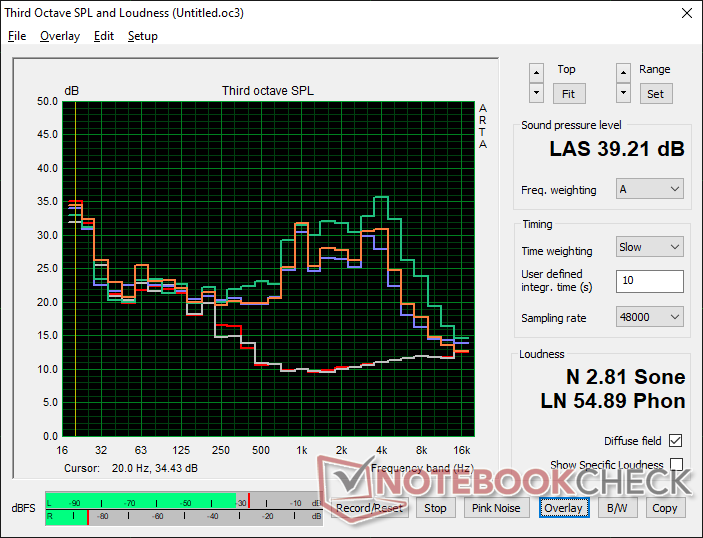
Noise level
| Idle |
| 23.4 / 23.4 / 23.4 dB(A) |
| Load |
| 37.8 / 43 dB(A) |
 | ||
30 dB silent 40 dB(A) audible 50 dB(A) loud |
||
min: | ||
| Dell Latitude 13 7330 Iris Xe G7 96EUs, i7-1265U, Toshiba KBG40ZNS512G NVMe | Lenovo ThinkPad X13 Yoga 20SX0004GE UHD Graphics 620, i7-10510U, Samsung SSD PM981a MZVLB512HBJQ | Framework Laptop 13.5 12th Gen Intel Iris Xe G7 96EUs, i7-1260P, WDC PC SN730 SDBPNTY-512G | Razer Book 13 FHD Iris Xe G7 96EUs, i7-1165G7, Samsung SSD PM981a MZVLB256HBHQ | Dell Latitude 7310 UHD Graphics 620, i7-10610U, Samsung SSD PM981a MZVLB512HBJQ | Microsoft Surface Laptop 4 13 Ryzen 5 Vega 7, R5 4680U, Samsung PM991 MZ9LQ256HBJQ | |
|---|---|---|---|---|---|---|
| Noise | -13% | -8% | -4% | -12% | -3% | |
| off / environment * (dB) | 23.4 | 29.3 -25% | 22.8 3% | 27 -15% | 29 -24% | 24.6 -5% |
| Idle Minimum * (dB) | 23.4 | 29.3 -25% | 23 2% | 27 -15% | 29 -24% | 24.6 -5% |
| Idle Average * (dB) | 23.4 | 29.3 -25% | 23 2% | 27 -15% | 29 -24% | 24.6 -5% |
| Idle Maximum * (dB) | 23.4 | 31.4 -34% | 23 2% | 27.1 -16% | 29 -24% | 24.6 -5% |
| Load Average * (dB) | 37.8 | 33 13% | 47.3 -25% | 29 23% | 30.1 20% | 39.5 -4% |
| Witcher 3 ultra * (dB) | 39.2 | 47.3 -21% | 33.3 15% | |||
| Load Maximum * (dB) | 43 | 34.9 19% | 49.8 -16% | 44.8 -4% | 41.3 4% | 39.5 8% |
* ... smaller is better
温度
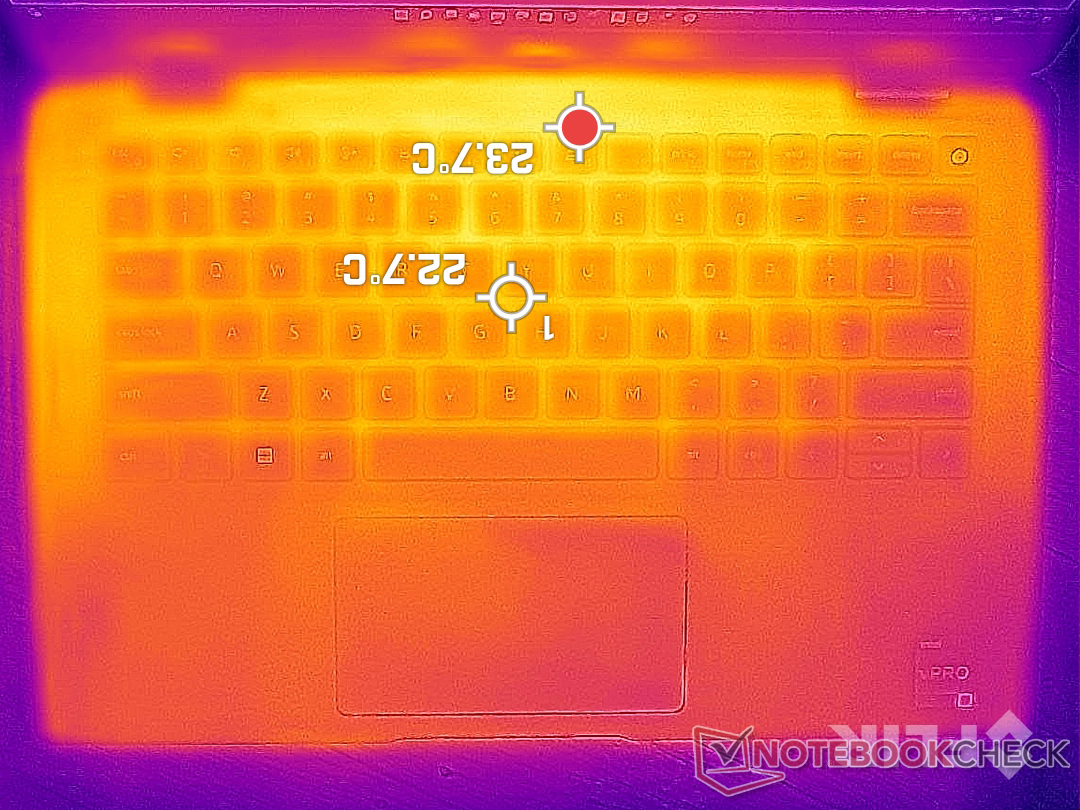
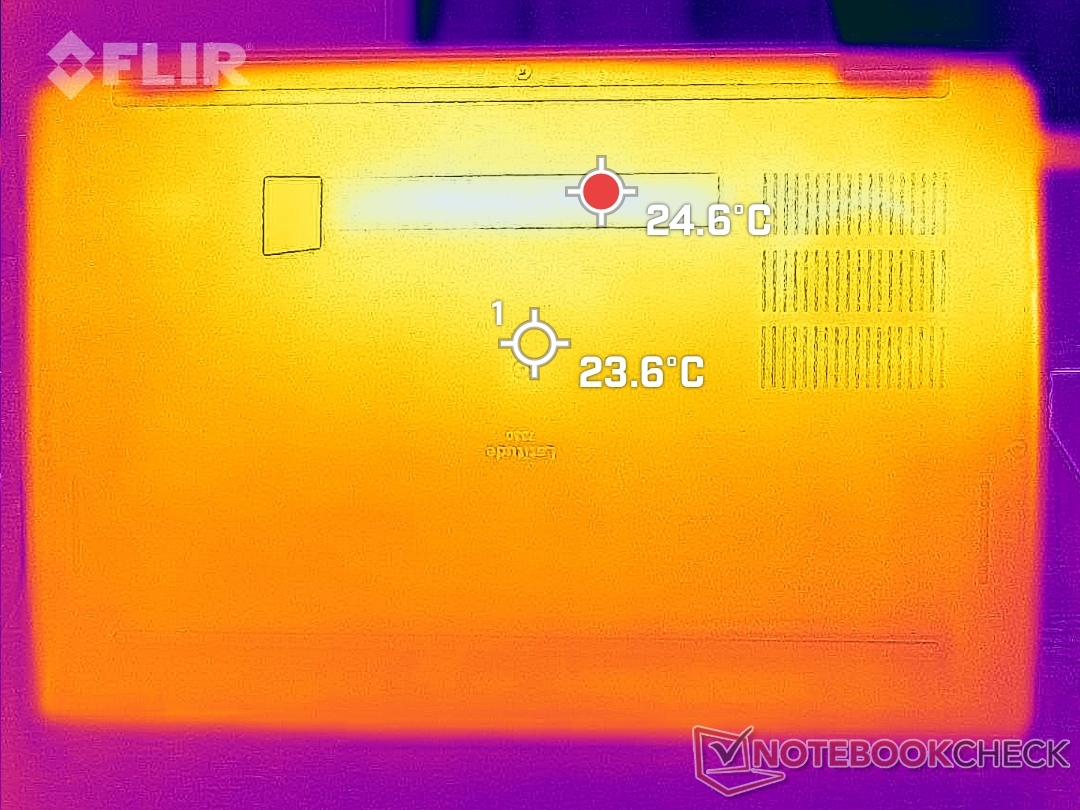
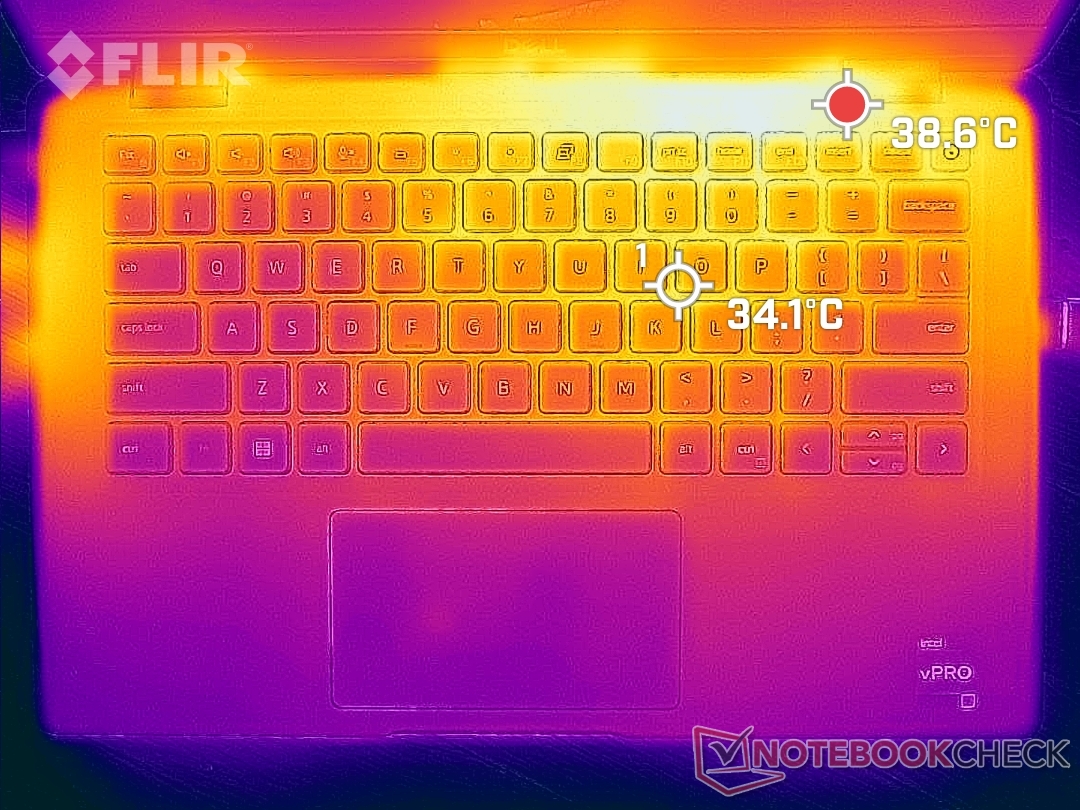
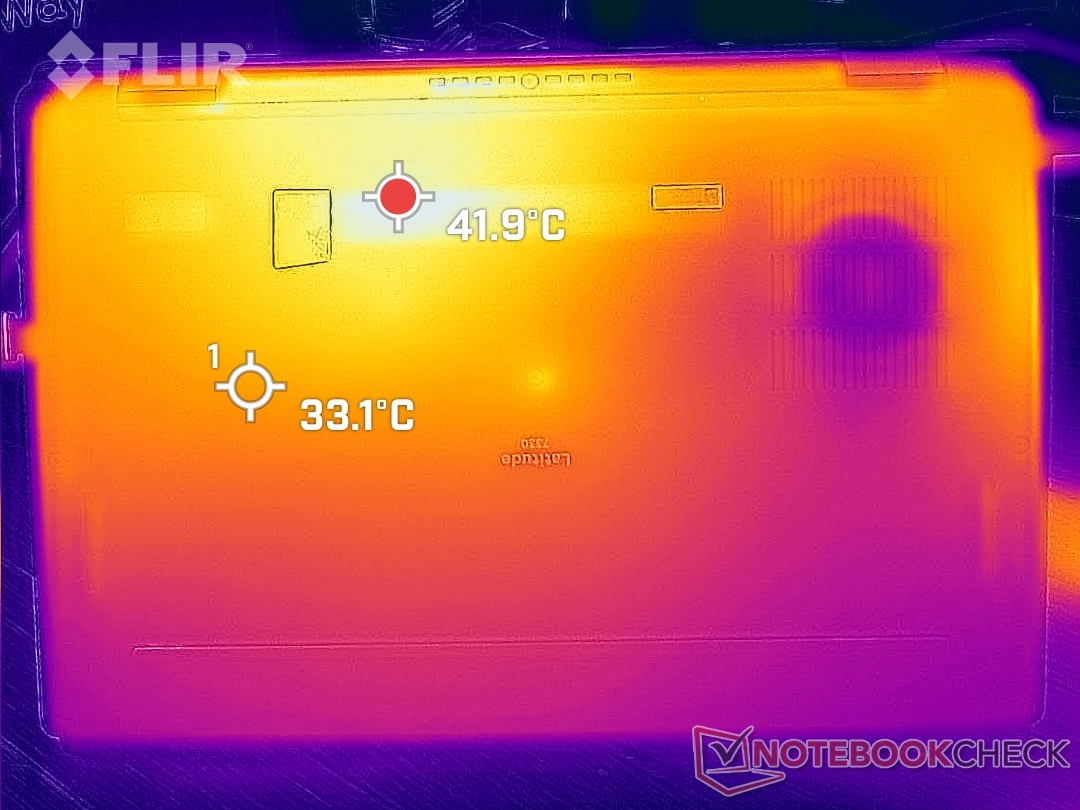
表面温度在Latitude 7330上不是一个问题。在最坏的情况下,我们能够在顶部和底部表面分别记录到39 C和42 C的热点,要比我们在老款Latitude 7310上记录的46 C和53 C的温度要低。这些热点也是朝向机箱的后部,远离键盘键和掌托。
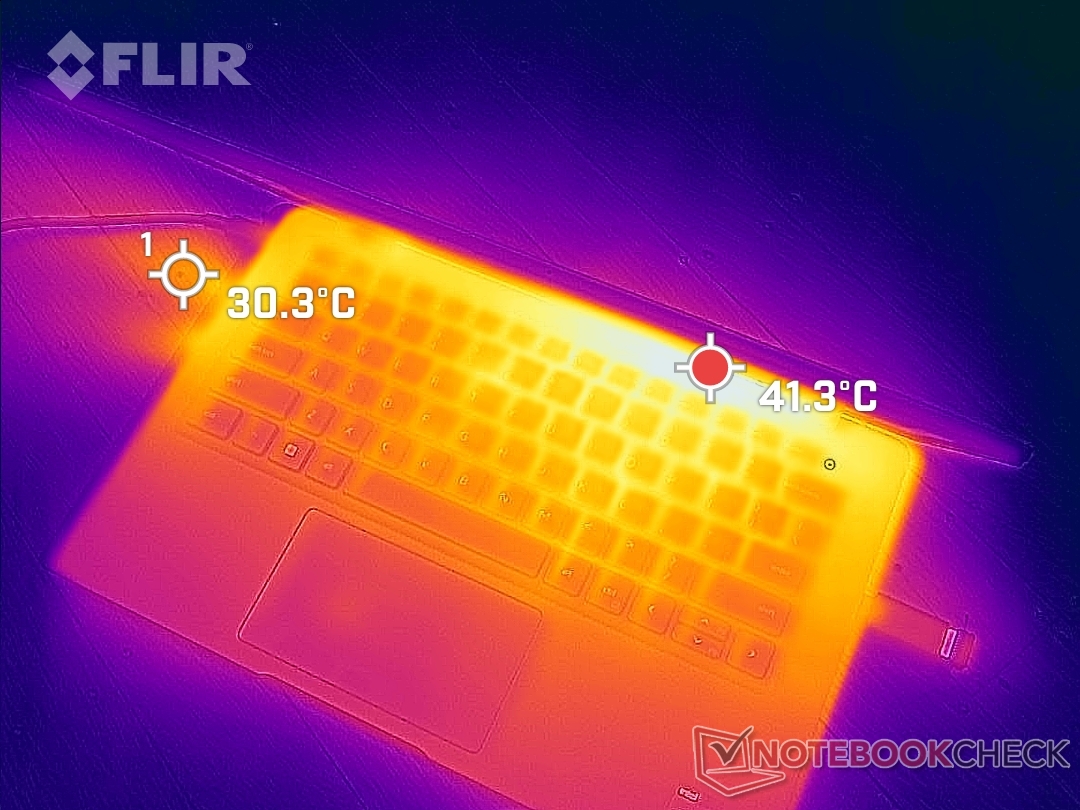
(+) The maximum temperature on the upper side is 38.6 °C / 101 F, compared to the average of 34.3 °C / 94 F, ranging from 21.2 to 62.5 °C for the class Office.
(±) The bottom heats up to a maximum of 42 °C / 108 F, compared to the average of 36.8 °C / 98 F
(+) In idle usage, the average temperature for the upper side is 22.2 °C / 72 F, compared to the device average of 29.5 °C / 85 F.
(+) The palmrests and touchpad are cooler than skin temperature with a maximum of 23.2 °C / 73.8 F and are therefore cool to the touch.
(+) The average temperature of the palmrest area of similar devices was 27.5 °C / 81.5 F (+4.3 °C / 7.7 F).
| Dell Latitude 13 7330 Intel Core i7-1265U, Intel Iris Xe Graphics G7 96EUs | Lenovo ThinkPad X13 Yoga 20SX0004GE Intel Core i7-10510U, Intel UHD Graphics 620 | Framework Laptop 13.5 12th Gen Intel Intel Core i7-1260P, Intel Iris Xe Graphics G7 96EUs | Razer Book 13 FHD Intel Core i7-1165G7, Intel Iris Xe Graphics G7 96EUs | Dell Latitude 7310 Intel Core i7-10610U, Intel UHD Graphics 620 | Microsoft Surface Laptop 4 13 Ryzen 5 AMD Ryzen 5 4680U, AMD Radeon RX Vega 7 | |
|---|---|---|---|---|---|---|
| Heat | -31% | -4% | -3% | -22% | -9% | |
| Maximum Upper Side * (°C) | 38.6 | 43.8 -13% | 36.8 5% | 39.2 -2% | 45.2 -17% | 45.8 -19% |
| Maximum Bottom * (°C) | 42 | 65 -55% | 42.4 -1% | 44 -5% | 52.8 -26% | 45.5 -8% |
| Idle Upper Side * (°C) | 23.8 | 29.2 -23% | 24.2 -2% | 23 3% | 28.2 -18% | 24.9 -5% |
| Idle Bottom * (°C) | 24.6 | 32.7 -33% | 29 -18% | 26.8 -9% | 31.6 -28% | 25.7 -4% |
* ... smaller is better
压力测试
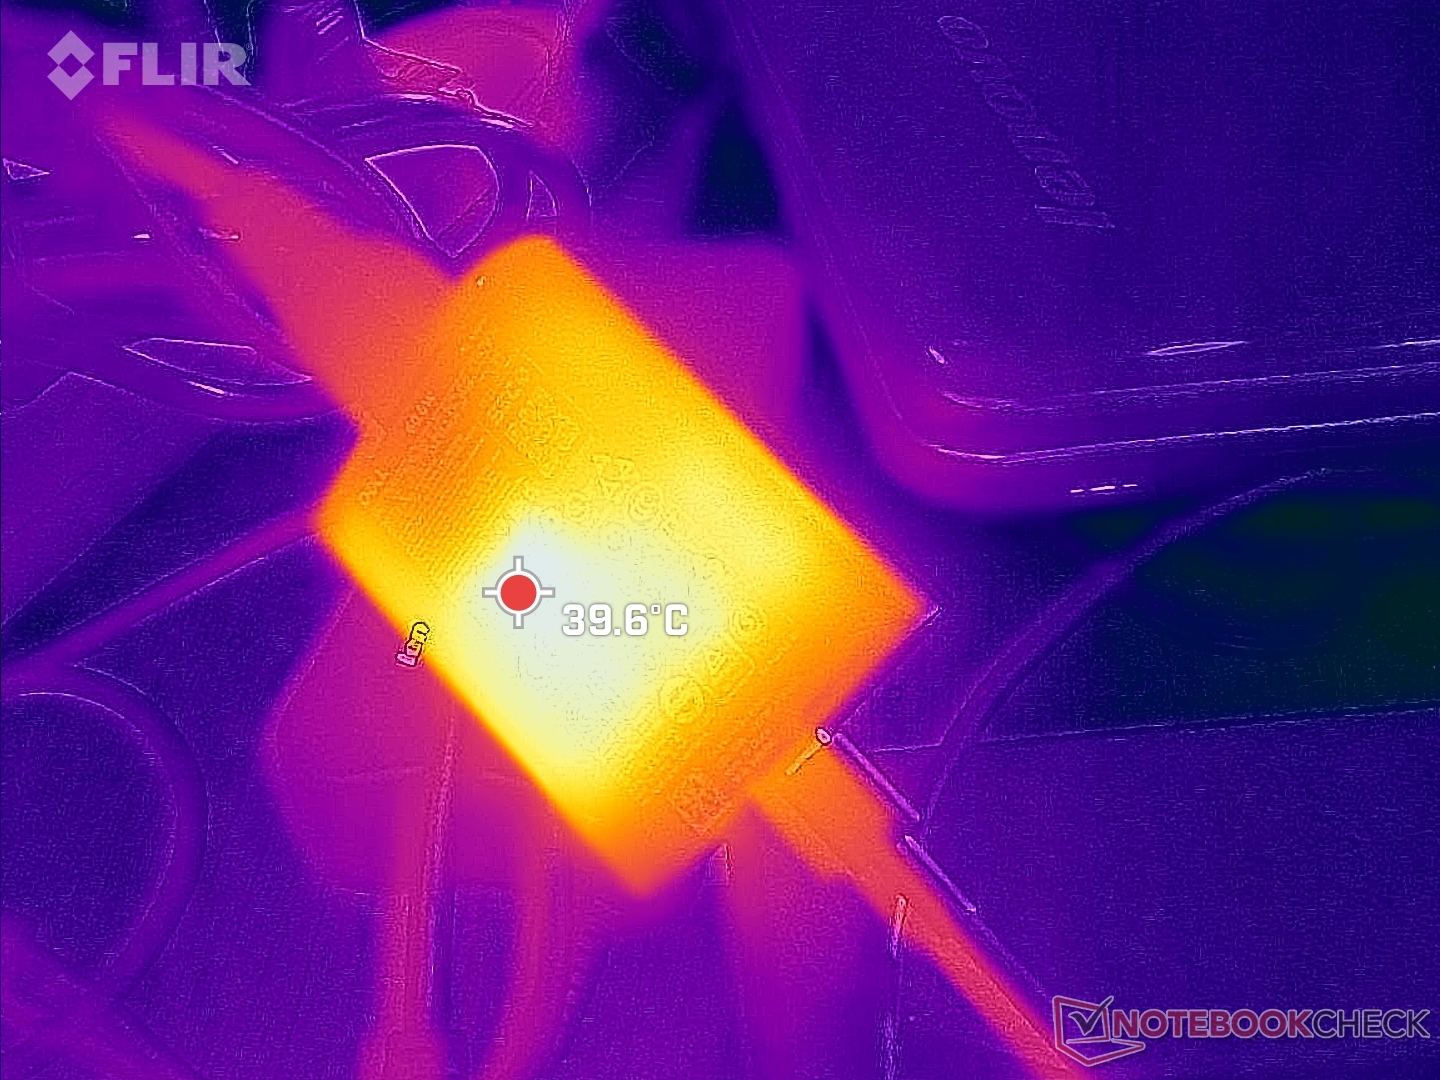
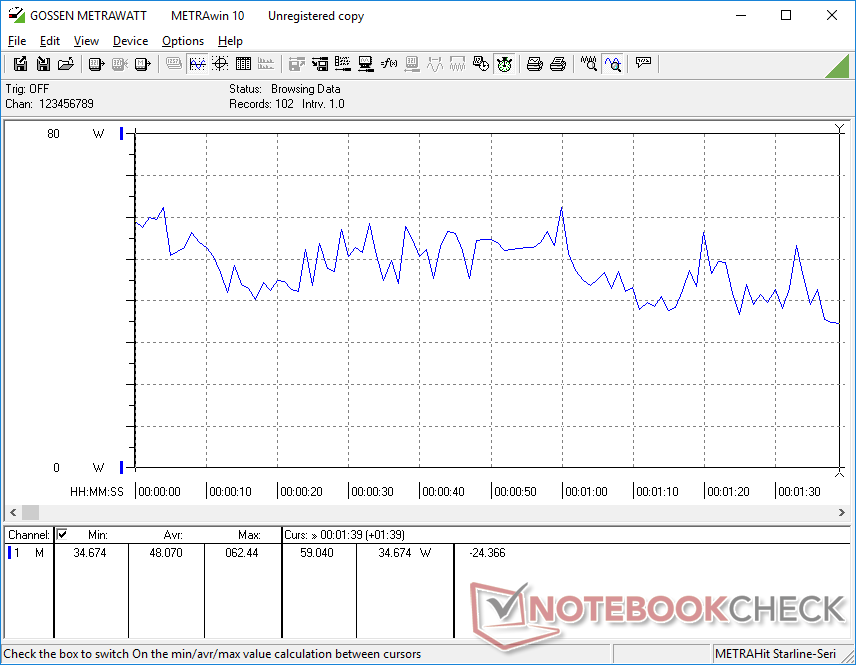
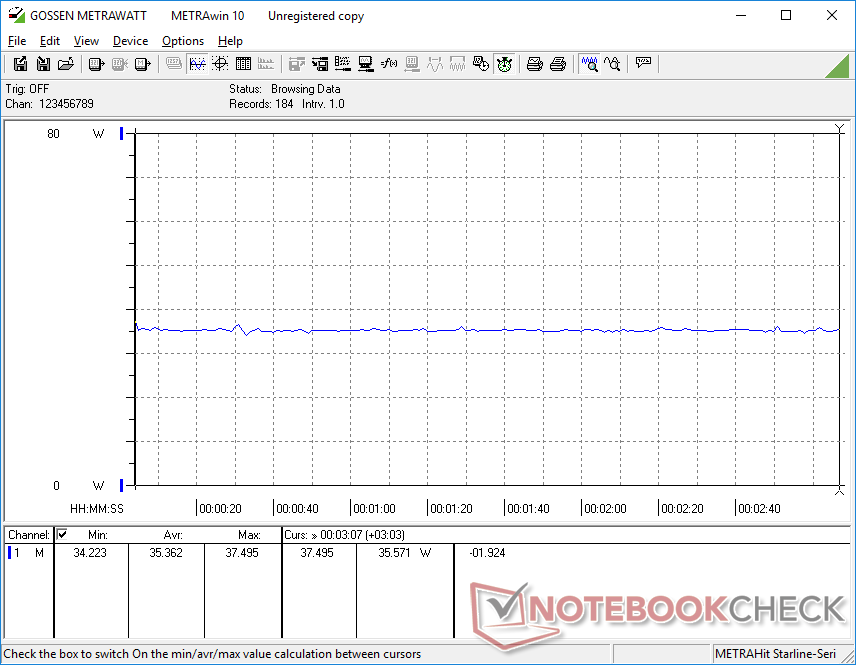
当运行Prime95时,CPU时钟速率在最初的几秒钟会提升到3.8GHz,主板功耗和核心温度分别为44W和97C。然而,几秒钟后,时钟速率开始稳步下降,然后稳定在2.1至2.5GHz和72至85C的范围内。由于高的Turbo Boost时钟速率是不可持续的,因此电路板的功耗也将下降到23至25瓦。这些结果与我们上面的CineBench R15循环观察相关。在Razer Book 13上重复这个测试 雷蛇书13将导致60℃的更低的核心温度。
运行 Witcher 3代表高负载将导致稳定的GPU时钟频率和温度分别为1247 MHz和83 C,而上述Razer上为1300 MHz和59 C。Latitude 中的处理器必须运行得更热,以弥补较小的冷却解决方案。
用电池供电运行限制了性能。在电池上进行的3DMark 11测试将返回物理和图形分数,分别为8511和4764分,而在主电源上则为13486和5840分。
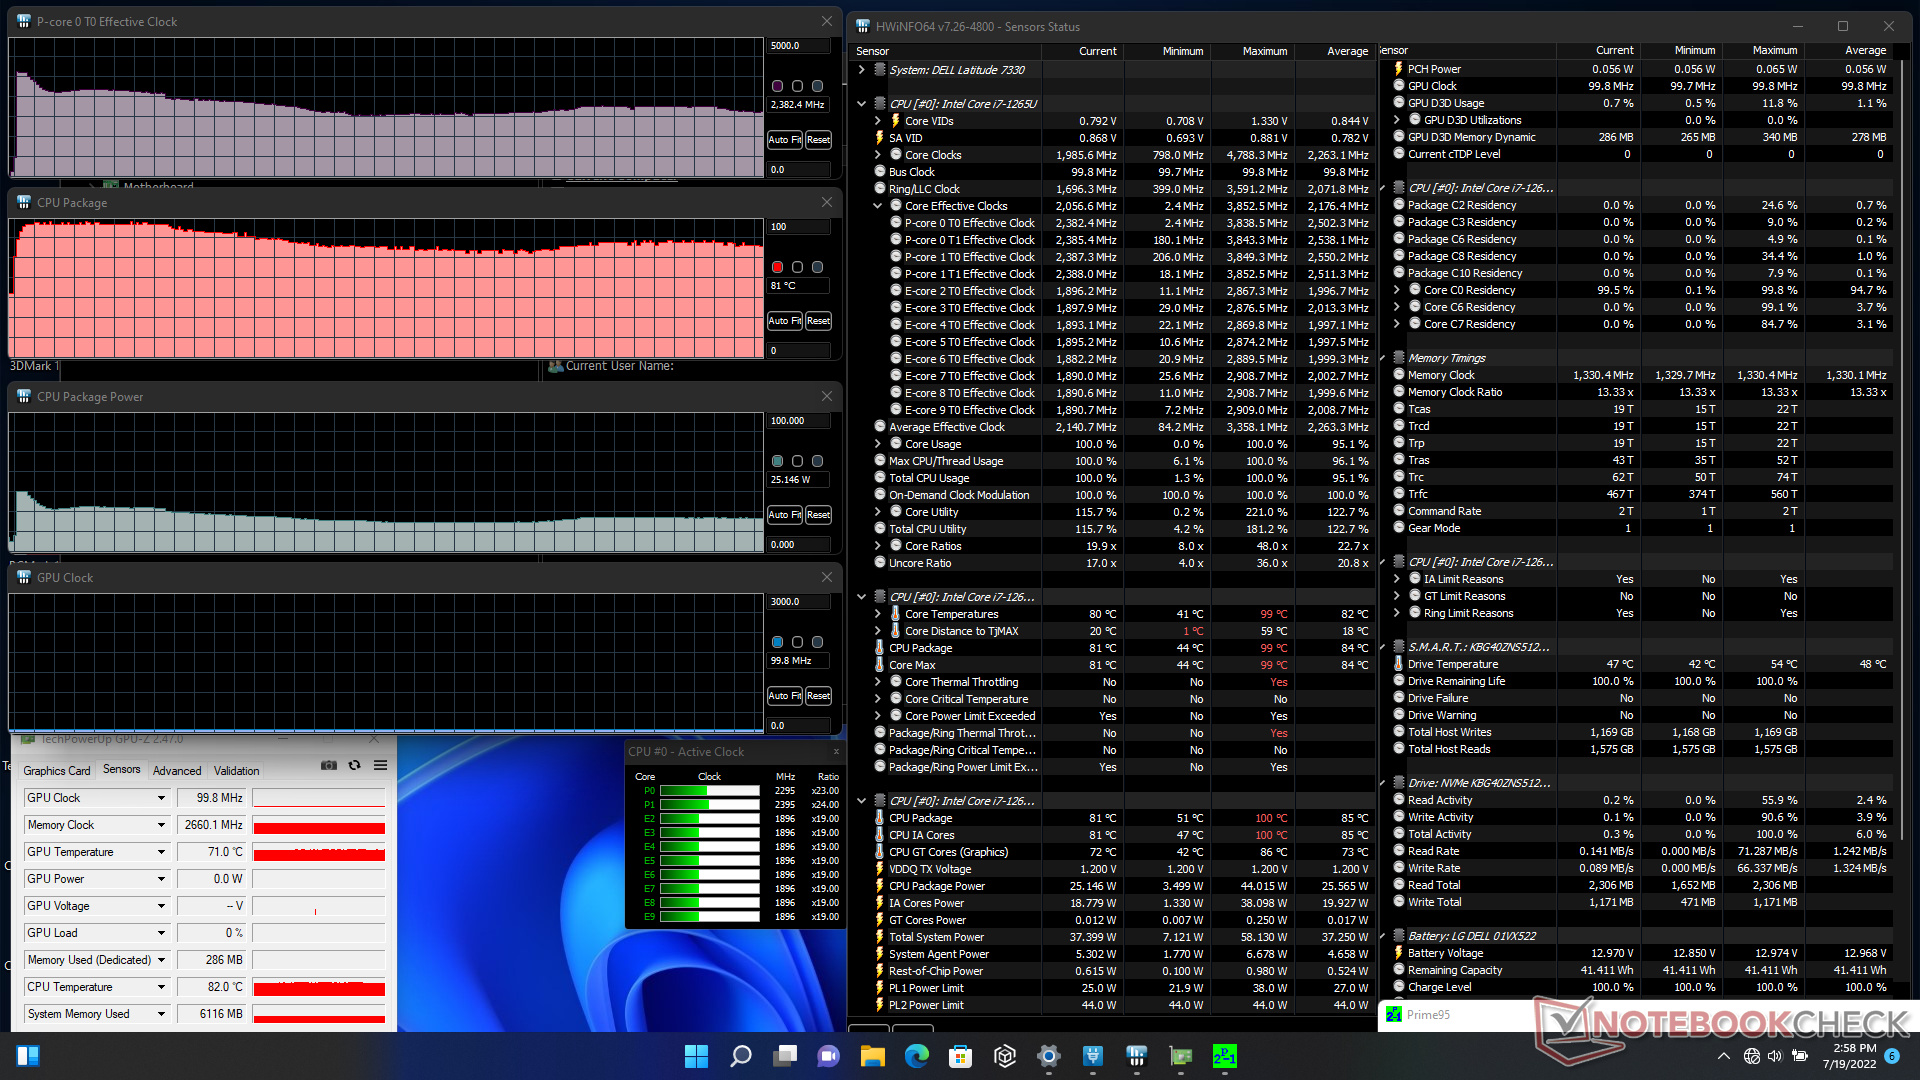
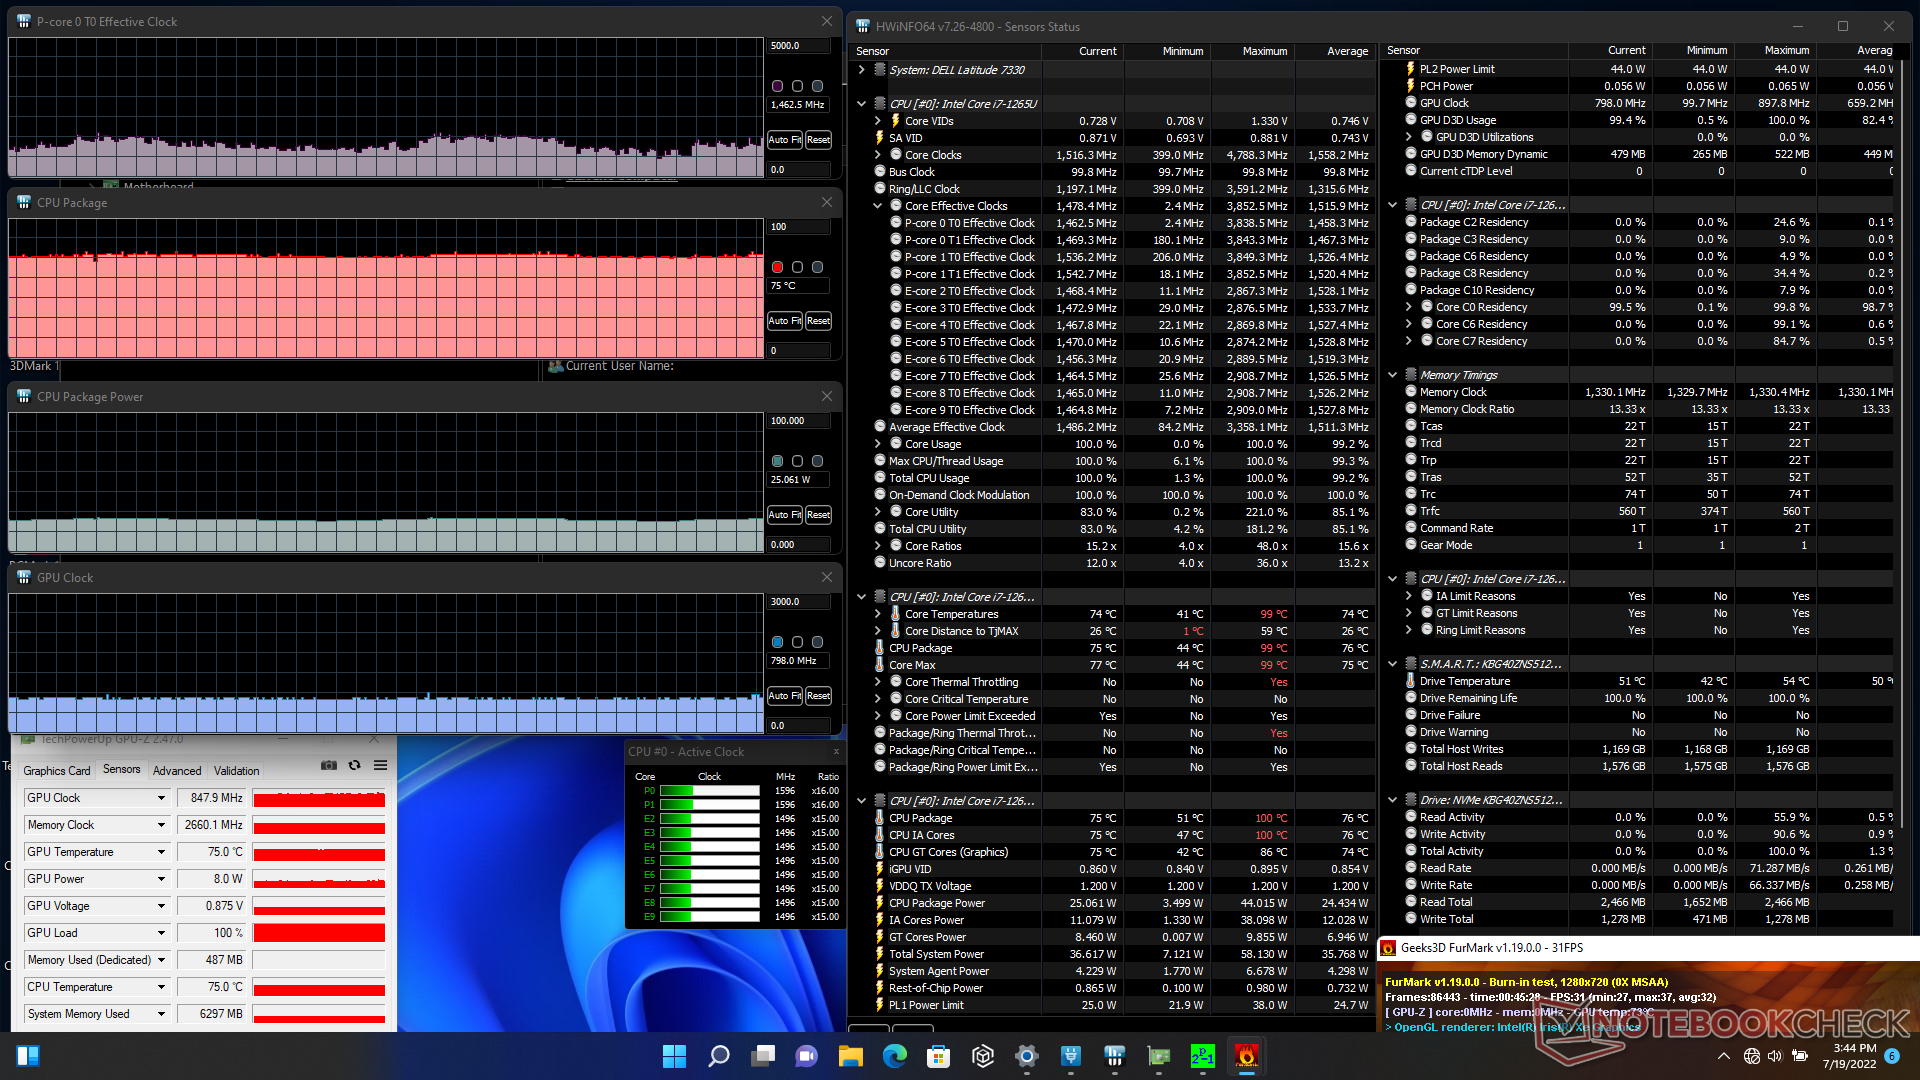
| CPU时钟(GHz) | GPU时钟(MHz) | CPU平均温度(°C) | |
| 系统空闲 | -- | -- | 38 |
| Prime95压力 | 2.1 - 2.5 | - | 72 - 85 |
| Prime95 + FurMark 压力 | ~1.4 | 848 | 75 |
| Witcher 3 应力 | ~2.3 | 1247 | 83 |
发言人
Dell Latitude 13 7330 audio analysis
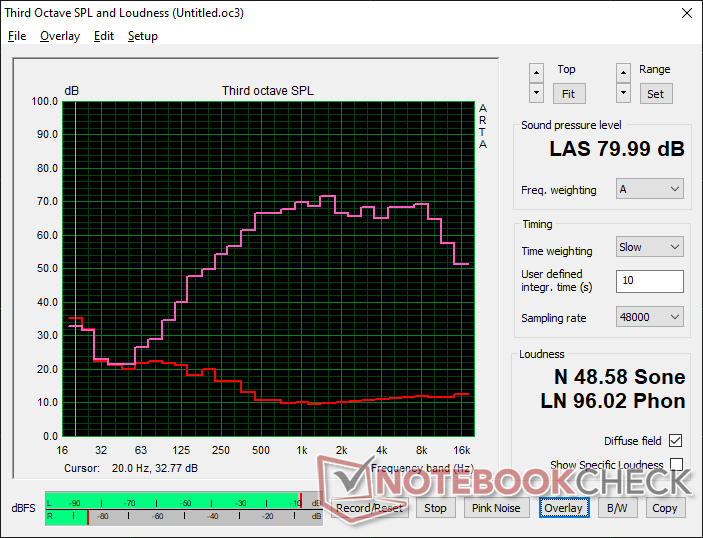
(±) | speaker loudness is average but good (80 dB)
Bass 100 - 315 Hz
(-) | nearly no bass - on average 18.6% lower than median
(±) | linearity of bass is average (8.6% delta to prev. frequency)
Mids 400 - 2000 Hz
(+) | balanced mids - only 2.7% away from median
(+) | mids are linear (5.1% delta to prev. frequency)
Highs 2 - 16 kHz
(+) | balanced highs - only 1.9% away from median
(+) | highs are linear (4.1% delta to prev. frequency)
Overall 100 - 16.000 Hz
(+) | overall sound is linear (14.8% difference to median)
Compared to same class
» 13% of all tested devices in this class were better, 4% similar, 83% worse
» The best had a delta of 7%, average was 21%, worst was 53%
Compared to all devices tested
» 20% of all tested devices were better, 4% similar, 76% worse
» The best had a delta of 4%, average was 24%, worst was 134%
Apple MacBook Pro 16 2021 M1 Pro audio analysis
(+) | speakers can play relatively loud (84.7 dB)
Bass 100 - 315 Hz
(+) | good bass - only 3.8% away from median
(+) | bass is linear (5.2% delta to prev. frequency)
Mids 400 - 2000 Hz
(+) | balanced mids - only 1.3% away from median
(+) | mids are linear (2.1% delta to prev. frequency)
Highs 2 - 16 kHz
(+) | balanced highs - only 1.9% away from median
(+) | highs are linear (2.7% delta to prev. frequency)
Overall 100 - 16.000 Hz
(+) | overall sound is linear (4.6% difference to median)
Compared to same class
» 0% of all tested devices in this class were better, 0% similar, 100% worse
» The best had a delta of 5%, average was 17%, worst was 45%
Compared to all devices tested
» 0% of all tested devices were better, 0% similar, 100% worse
» The best had a delta of 4%, average was 24%, worst was 134%
能源管理
耗电量 - 要求更高
与在上一代硬件上运行的笔记本电脑相比,功耗普遍较高,这与我们对Alder Lake平台整体的观察一致。例如,运行3DMark06和Prime95,将分别比Core i7-1165G7 Razer Book 13多消耗30%和21%的电力。性能可能更高,但每瓦性能并不像我们希望的那样高。
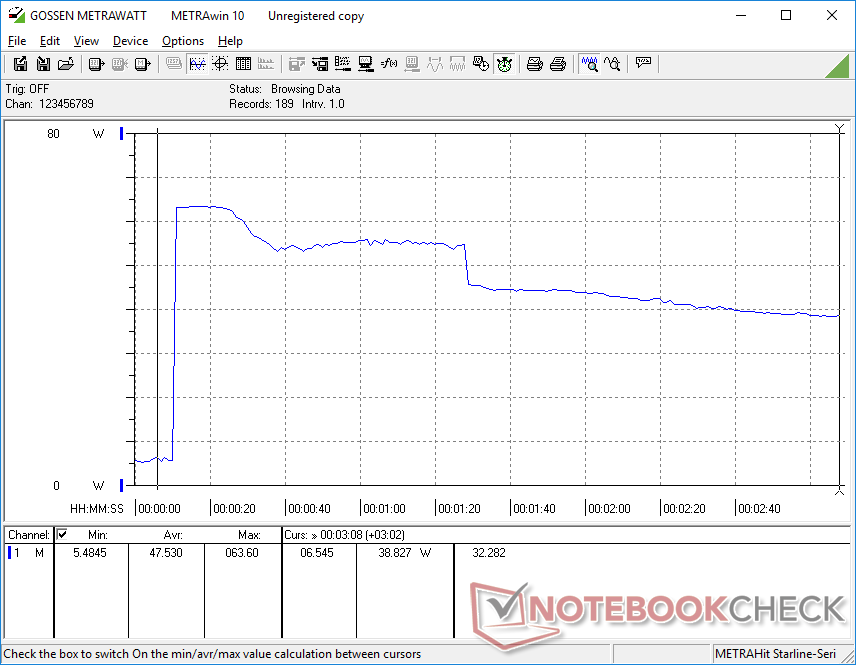
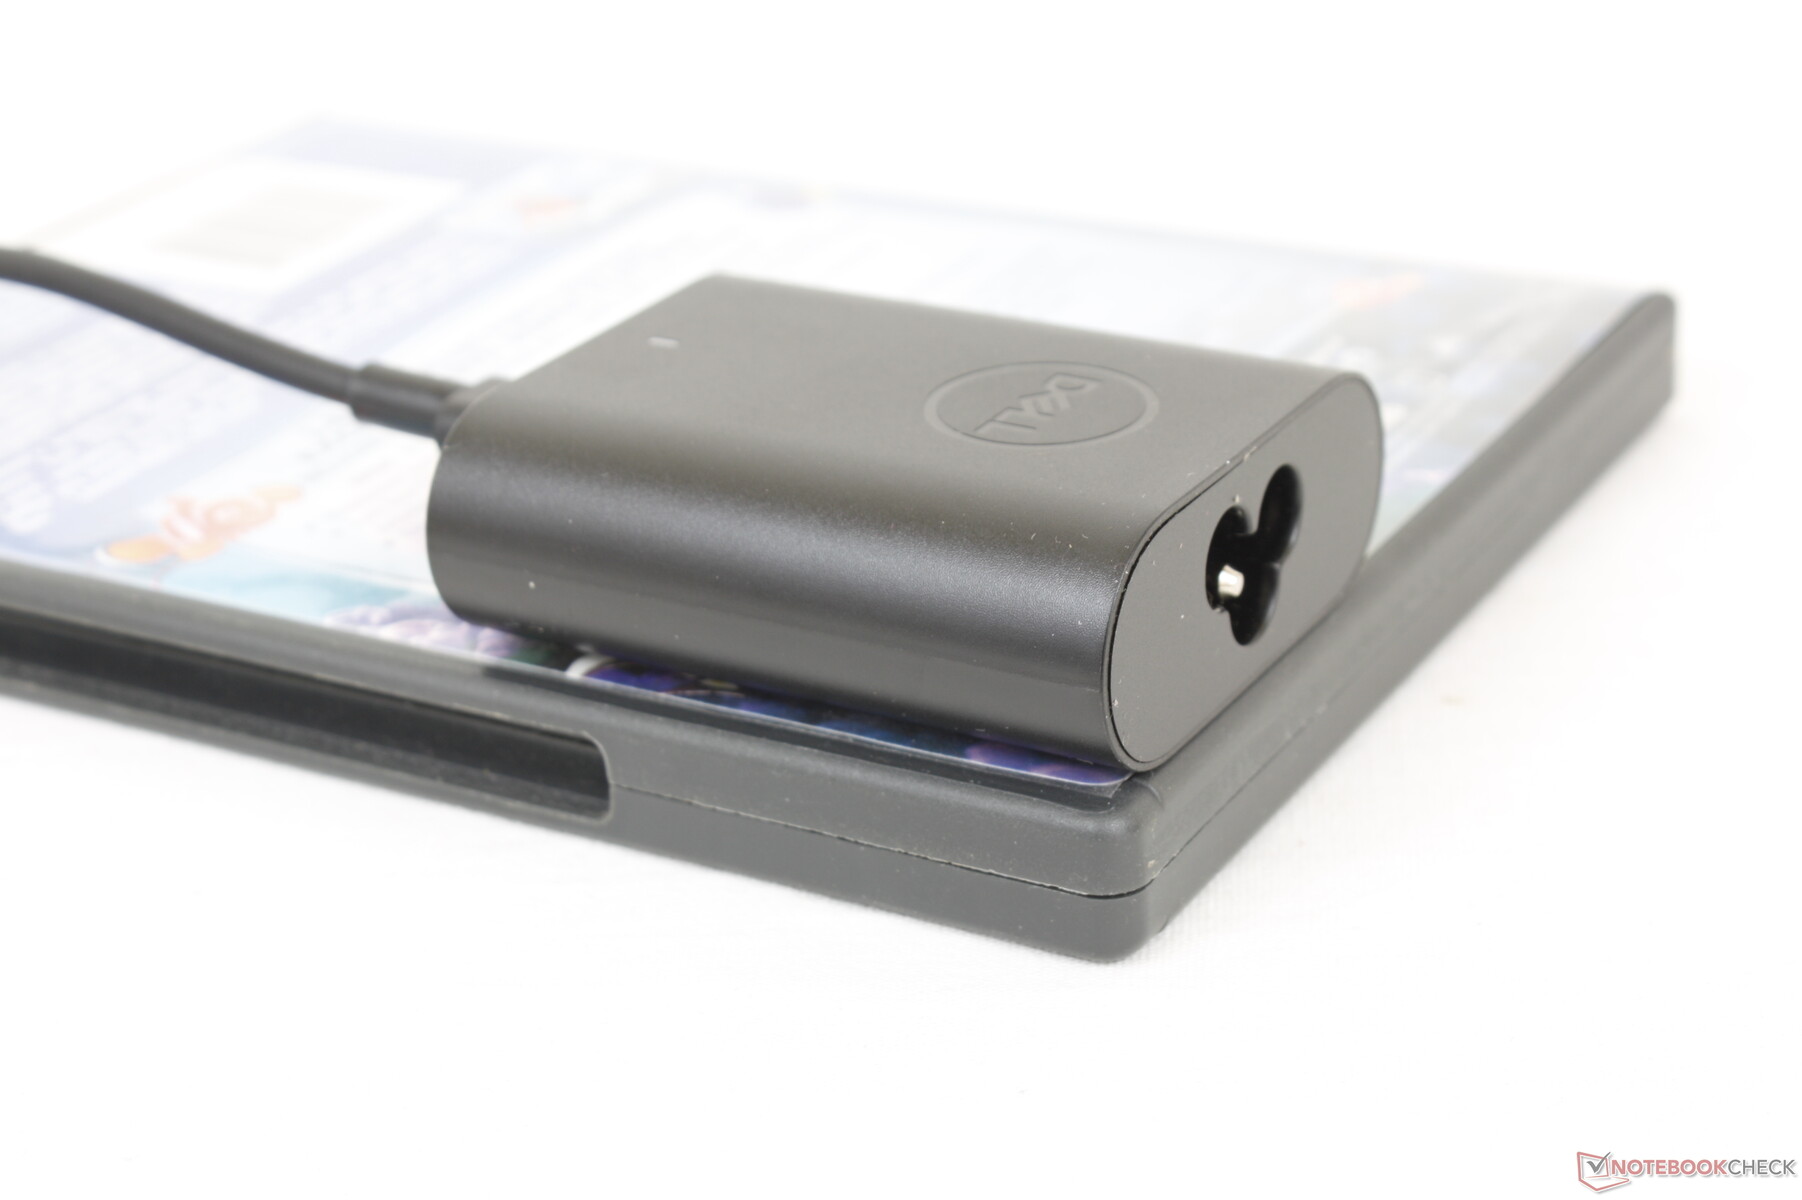
我们能够从非常小的(约6.6×5.5×2.2厘米)60瓦的USB-C交流适配器上记录到63.6瓦的最大消耗。如下面的截图所示,由于CPU冷却解决方案的热限制,这个速率只是暂时的。在重度处理压力下,系统仍然会以一个体面的速度充电。
较大的65W或90W交流适配器也是可选项,这取决于配置。

| Off / Standby | |
| Idle | |
| Load |
|
Key:
min: | |
| Dell Latitude 13 7330 i7-1265U, Iris Xe G7 96EUs, Toshiba KBG40ZNS512G NVMe, IPS, 1920x1080, 13.3" | Lenovo ThinkPad X13 Yoga 20SX0004GE i7-10510U, UHD Graphics 620, Samsung SSD PM981a MZVLB512HBJQ, IPS, 1920x1080, 13.3" | Framework Laptop 13.5 12th Gen Intel i7-1260P, Iris Xe G7 96EUs, WDC PC SN730 SDBPNTY-512G, IPS, 2256x1504, 13.5" | Razer Book 13 FHD i7-1165G7, Iris Xe G7 96EUs, Samsung SSD PM981a MZVLB256HBHQ, IPS, 1920x1200, 13.4" | Dell Latitude 7310 i7-10610U, UHD Graphics 620, Samsung SSD PM981a MZVLB512HBJQ, IPS, 1920x1080, 13.3" | Microsoft Surface Laptop 4 13 Ryzen 5 R5 4680U, Vega 7, Samsung PM991 MZ9LQ256HBJQ, IPS, 2256x1504, 13.5" | |
|---|---|---|---|---|---|---|
| Power Consumption | -3% | -44% | -2% | 13% | -8% | |
| Idle Minimum * (Watt) | 2.8 | 3.4 -21% | 5.3 -89% | 3.3 -18% | 2.7 4% | 3.4 -21% |
| Idle Average * (Watt) | 4.8 | 4.98 -4% | 8.4 -75% | 6.4 -33% | 4.4 8% | 6.3 -31% |
| Idle Maximum * (Watt) | 7.3 | 8.1 -11% | 11.2 -53% | 7 4% | 4.8 34% | 8.1 -11% |
| Load Average * (Watt) | 48.1 | 37.2 23% | 57.4 -19% | 37.3 22% | 33.4 31% | 36.2 25% |
| Witcher 3 ultra * (Watt) | 35.4 | 46.7 -32% | 36.4 -3% | |||
| Load Maximum * (Watt) | 63.6 | 63.3 -0% | 61.2 4% | 53.7 16% | 69.7 -10% | 64.1 -1% |
* ... smaller is better
Power Consumption Witcher 3 / Stresstest
Power Consumption external Monitor
电池寿命
用户可以选择配置较轻的41Wh电池或较重但持续时间更长的58Wh电池。我们能够从41Wh的测试装置中挤出超过8小时的实际无线网络使用时间,这对大多数用户来说应该是绰绰有余。
用附带的USB-C交流适配器从空电到满电需要2至2.5小时。
| Dell Latitude 13 7330 i7-1265U, Iris Xe G7 96EUs, 41 Wh | Lenovo ThinkPad X13 Yoga 20SX0004GE i7-10510U, UHD Graphics 620, 50 Wh | Framework Laptop 13.5 12th Gen Intel i7-1260P, Iris Xe G7 96EUs, 55 Wh | Razer Book 13 FHD i7-1165G7, Iris Xe G7 96EUs, 55 Wh | Dell Latitude 7310 i7-10610U, UHD Graphics 620, 52 Wh | Microsoft Surface Laptop 4 13 Ryzen 5 R5 4680U, Vega 7, 47.4 Wh | |
|---|---|---|---|---|---|---|
| Battery runtime | 53% | -10% | 65% | 51% | 31% | |
| Reader / Idle (h) | 21.9 | 36.8 68% | 37.4 71% | |||
| WiFi v1.3 (h) | 8.3 | 8.2 -1% | 7.5 -10% | 14.8 78% | 12.6 52% | 10.9 31% |
| Load (h) | 1.4 | 2.9 107% | 2.1 50% | 1.8 29% |
Pros
Cons
判决--选项、选项、选项
高水平的配置有助于将Latitude 7330与其他商务副笔记本区分开来。像MicroSD读卡器、4G LTE连接、1080p网络摄像头、二合一外形、碳纤维、电池尺寸、甚至AC适配器等功能都是可选的,取决于买方的需求。如果你的日常工作负荷不需要某些功能,那么它们可以在结账时简单地省略,以获得更轻的整体重量。其他超轻笔记本电脑,如LG Gram 13或东芝X30系列的可配置选项要少得多,如由于它们的生产规模相对于戴尔Latitude 系列要小。
Latitude
7330系列很注重可配置的选项和定制,以更好地满足用户的具体需求。然而,其16:9的长宽比已经开始显示其年龄。
与Latitude 7330最接近的替代品是 HP EliteBook 830 G8和G9型号,它们提供的功能包括更大的16:10长宽比、更清晰的500万像素网络摄像头、可拆卸的内存模块和明显更亮的1000尼特显示屏选项,所有这些都是Latitude 7330上所没有的。然而,它们比我们的戴尔略重,但对于一些用户来说,其更强的属性可能值得增加重量。
价格和可用性
Latitude 7330还没有在亚马逊或百思买上广泛销售。直接从戴尔购买https://www.dell.com/en-us/work/shop/dell-laptops-and-notebooks/dell-latitude-7330-laptop-or-2-in-1/spd/latitude-13-7330-2-in-1-laptop/s102l7330usvp建议直接从戴尔购买,目前价格徘徊在2000美元左右。
Dell Latitude 13 7330
- 07/22/2022 v7 (old)
Allen Ngo
Price comparison

