


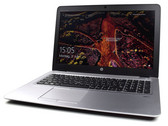
惠普 EliteBook 755 G4 (AMD PRO A12-9800B) 笔记本电脑简短评测
表现适当? 惠普EliteBook 系列电脑代表高需求客户的商务所需。您将在EliteBook 755 G4的评测中了解到,这一努力是否成功,它的表现是否可以胜任。
AMD PRO A12-9800B, Radeon R7 (Bristol Ridge), 15.6", 1.8 kg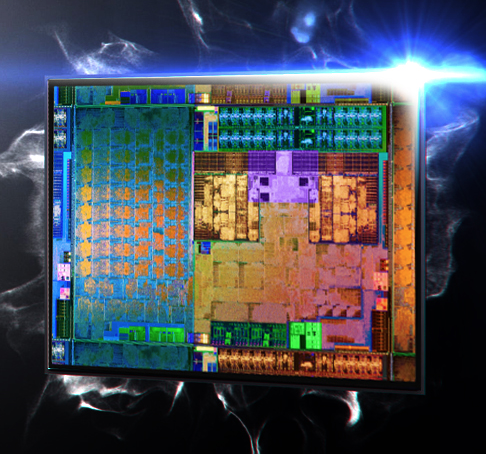
AMD Radeon R7(Bristol Ridge)是AMD移动版Carrizo APU中最快的一款集成显卡。R7目前搭配于最高端处理器型号FX9830P中,核心频率900 MHz,有512个GCN着色单元。它的技术参数相比Carrizo架构的AMD Radeon R7相同,但频率高出至少100MHz。根据不同的散热系统和热设计功率(12-45瓦),它的性能会有不小的区别。它的性能还取决于内存设置(双通道DDR4可提供最佳性能)。
架构和特性
根据AMD的信息,Radeon R7包括基于第三代GCN架构(通常称为GCN 1.2或2.0)的8个核心。因此,它与Tonga架构桌面芯片十分相似,支持DirectX 12(FL 12_0)。此外,它的着色器支持Mantle,OpenGL和OpenCL的调用。它的处理器和显卡核心同时支持HSA 1.0。
相较于Kaveri架构(Kaveri R7与GCN 1.1),它有更高的内存利用率和新的色彩压缩格式,这将可提高5-7%的游戏性能。
改进后的Carrizo/Bristol Ridge架构视频解码器现在支持UVD 6,并可以硬件解码高达4K分辨率的HVEC / H.265视频。此外,VCE(Video Codec Engine)为H.264的转码进行了改进。对Bristol Ridge架构的特性分析信息可以在我们的详尽分析文章中找到。
性能
根据从12瓦到高达45瓦不等的热设计功率设置,它在游戏中的表现会有不小差异。总的来说,由于稍高的频率,它的表现比Carrizo Radeon R7稍高。您仍然可以使用Carrizo R7的基准测试成绩来作为它的性能参考。
功耗
取决于热设计功率配置,这块28纳米制程技术芯片功耗在12-45瓦之间。因此,它可用于轻薄笔记本以及中型设备或一体机中。
Radeon R (Stoney / Bristol Ridge) Series
| ||||||||||||||||
| Codename | Bristol Ridge | |||||||||||||||
| Architecture | GCN 1.2 | |||||||||||||||
| iGPU | Integrated Graphics | |||||||||||||||
| Pipelines | 512 - unified | |||||||||||||||
| Core Speed | 900 (Boost) MHz | |||||||||||||||
| Memory Bus Width | 64/128 Bit | |||||||||||||||
| Shared Memory | yes | |||||||||||||||
| API | DirectX 12 (FL 12_0), OpenGL 4.4 | |||||||||||||||
| Power Consumption | 12-45 Watt | |||||||||||||||
| Transistor Count | 2.4 Billion | |||||||||||||||
| Man. Technology | 28 nm | |||||||||||||||
| Features | UVD 6, VCE | |||||||||||||||
| Notebook Size | medium sized | |||||||||||||||
| Date of Announcement | 01.06.2016 | |||||||||||||||
| ||||||||||||||||||||||||
The following benchmarks stem from our benchmarks of review laptops. The performance depends on the used graphics memory, clock rate, processor, system settings, drivers, and operating systems. So the results don't have to be representative for all laptops with this GPU. For detailed information on the benchmark results, click on the fps number.


For more games that might be playable and a list of all games and graphics cards visit our Gaming List
Asus VivoBook S15 S510QR-BR011T: AMD FX-9800P, 15.60", 1.7 kg
External Review » Asus VivoBook S15 S510QR-BR011T
Lenovo ThinkPad A275: AMD PRO A12-9800B, 12.50", 1.6 kg
External Review » Lenovo ThinkPad A275
Lenovo Ideapad 320-15ABR-80XS007XGE: AMD A12-9720P, 15.60", 2.2 kg
External Review » Lenovo Ideapad 320-15ABR-80XS007XGE
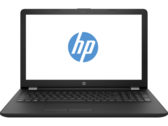
HP Pavilion 15-cd0000nu: AMD A12-9720P, 15.60", 2 kg
External Review » HP Pavilion 15-cd0000nu
HP Envy 15-bq015nd x360: AMD A12-9720P, 15.60", 2.2 kg
External Review » HP Envy 15-bq015nd x360
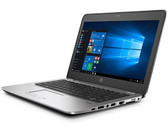
HP EliteBook 755 G4 Z2W11EA: AMD PRO A12-9800B, 15.60", 1.8 kg
External Review » HP EliteBook 755 G4 Z2W11EA
HP EliteBook 745 G4 Z2W06EA: AMD PRO A12-9800B, 14.00", 1.5 kg
External Review » HP EliteBook 745 G4 Z2W06EA
Lenovo Ideapad 310-15ABR 80ST: AMD A12-9700P, 15.60", 2.2 kg
External Review » Lenovo Ideapad 310-15ABR 80ST
Asus X555QG: AMD FX-9800P, 15.60", 2.2 kg
External Review » Asus X555QG
» Comparison of GPUs
Detailed list of all laptop GPUs sorted by class and performance.
» Benchmark List
Sort and restrict laptop GPUs based on performance in synthetic benchmarks.
» Notebook Gaming List
Playable games for each graphics card and their average FPS results.
* Approximate position of the graphics adapter
» Notebookcheck多媒体笔记本电脑Top 10排名
» Notebookcheck游戏笔记本电脑Top 10排名
» Notebookcheck低价办公/商务笔记本电脑Top 10排名
» Notebookcheck高端办公/商务笔记本电脑Top 10排名
» Notebookcheck工作站笔记本电脑Top 10排名
» Notebookcheck亚笔记本电脑Top 10排名
» Notebookcheck超级本产品Top 10排名
» Notebookcheck变形本产品Top 10排名
» Notebookcheck平板电脑Top 10排名
» Notebookcheck智能手机Top 10排名
» Notebookcheck评测过最出色的笔记本电脑屏幕
» Notebookcheck售价500欧元以下笔记本电脑Top 10排名
» Notebookcheck售价300欧元以下笔记本电脑Top 10排名