微软Surface Pro 8 Convertible评测。强大的,120赫兹和最终的Thunderbolt
多年来,Surface Pro一直是微软试图在普通笔记本电脑的性能和平板电脑的灵活性之间提供最佳的折衷方案。我们正处于第八代,今年最大的新功能是显示屏。13英寸,它不仅比以前大,而且现在还支持120赫兹的刷新率。微软的高端可折叠电脑在价格方面涵盖了一个广泛的范围。入门级价格被提高到1179欧元(Surface Pro 7上市时起价900欧元,配备酷睿i3),但作为回报,你现在得到了更快的处理器和两倍的默认内存。根据配置的不同,你可以很容易地支付超过2000欧元,最昂贵的SKU配备酷睿i7-1185G7,32GB内存和1TB SSD存储,售价为2679欧元。这些价格是针对平板电脑的,键盘盖和手写笔必须单独购买。
我们的审查单位是一个体面的配置,配备了酷睿i7-1185G7CPU,16GB内存和256GB小型固态硬盘,零售价为1679欧元,加上额外的279欧元的Surface Pro签名键盘(熟悉的是Surface Pro X)和新的超薄笔2。其他商务转换机,如ThinkPad X12或戴尔Latitude 13也在这个价格范围内,就像目前的Apple iPad Pro(12.9英寸)配备了 M1处理器.
Potential competitors
Rating | Date | Model | Weight | Height | Size | Resolution | Price |
|---|---|---|---|---|---|---|---|
| 89.1 % v7 (old) | 11 / 2021 | Microsoft Surface Pro 8, i7-1185G7 i7-1185G7, Iris Xe G7 96EUs | 891 g | 8.5 mm | 13.00" | 2880x1920 | |
| 88.5 % v7 (old) | 04 / 2021 | Lenovo ThinkPad X12 20UVS03G00 i7-1160G7, Iris Xe G7 96EUs | 1.1 kg | 14.5 mm | 12.30" | 1920x1280 | |
| 87.7 % v7 (old) | 06 / 2021 | Dell Latitude 13 7320 Detachable, i7-1180G7 i7-1180G7, Iris Xe G7 96EUs | 782 g | 8.44 mm | 13.00" | 1920x1280 | |
| 91.3 % v7 (old) | 06 / 2021 | Apple iPad Pro 12.9 2021 A2378 M1, M1 8-Core GPU | 682 g | 6.4 mm | 12.90" | 2732x2048 | |
| 88.5 % v7 (old) | 03 / 2021 | Microsoft Surface Pro 7 Plus i5-1135G7, Iris Xe G7 80EUs | 796 g | 8.5 mm | 12.30" | 2736x1824 |
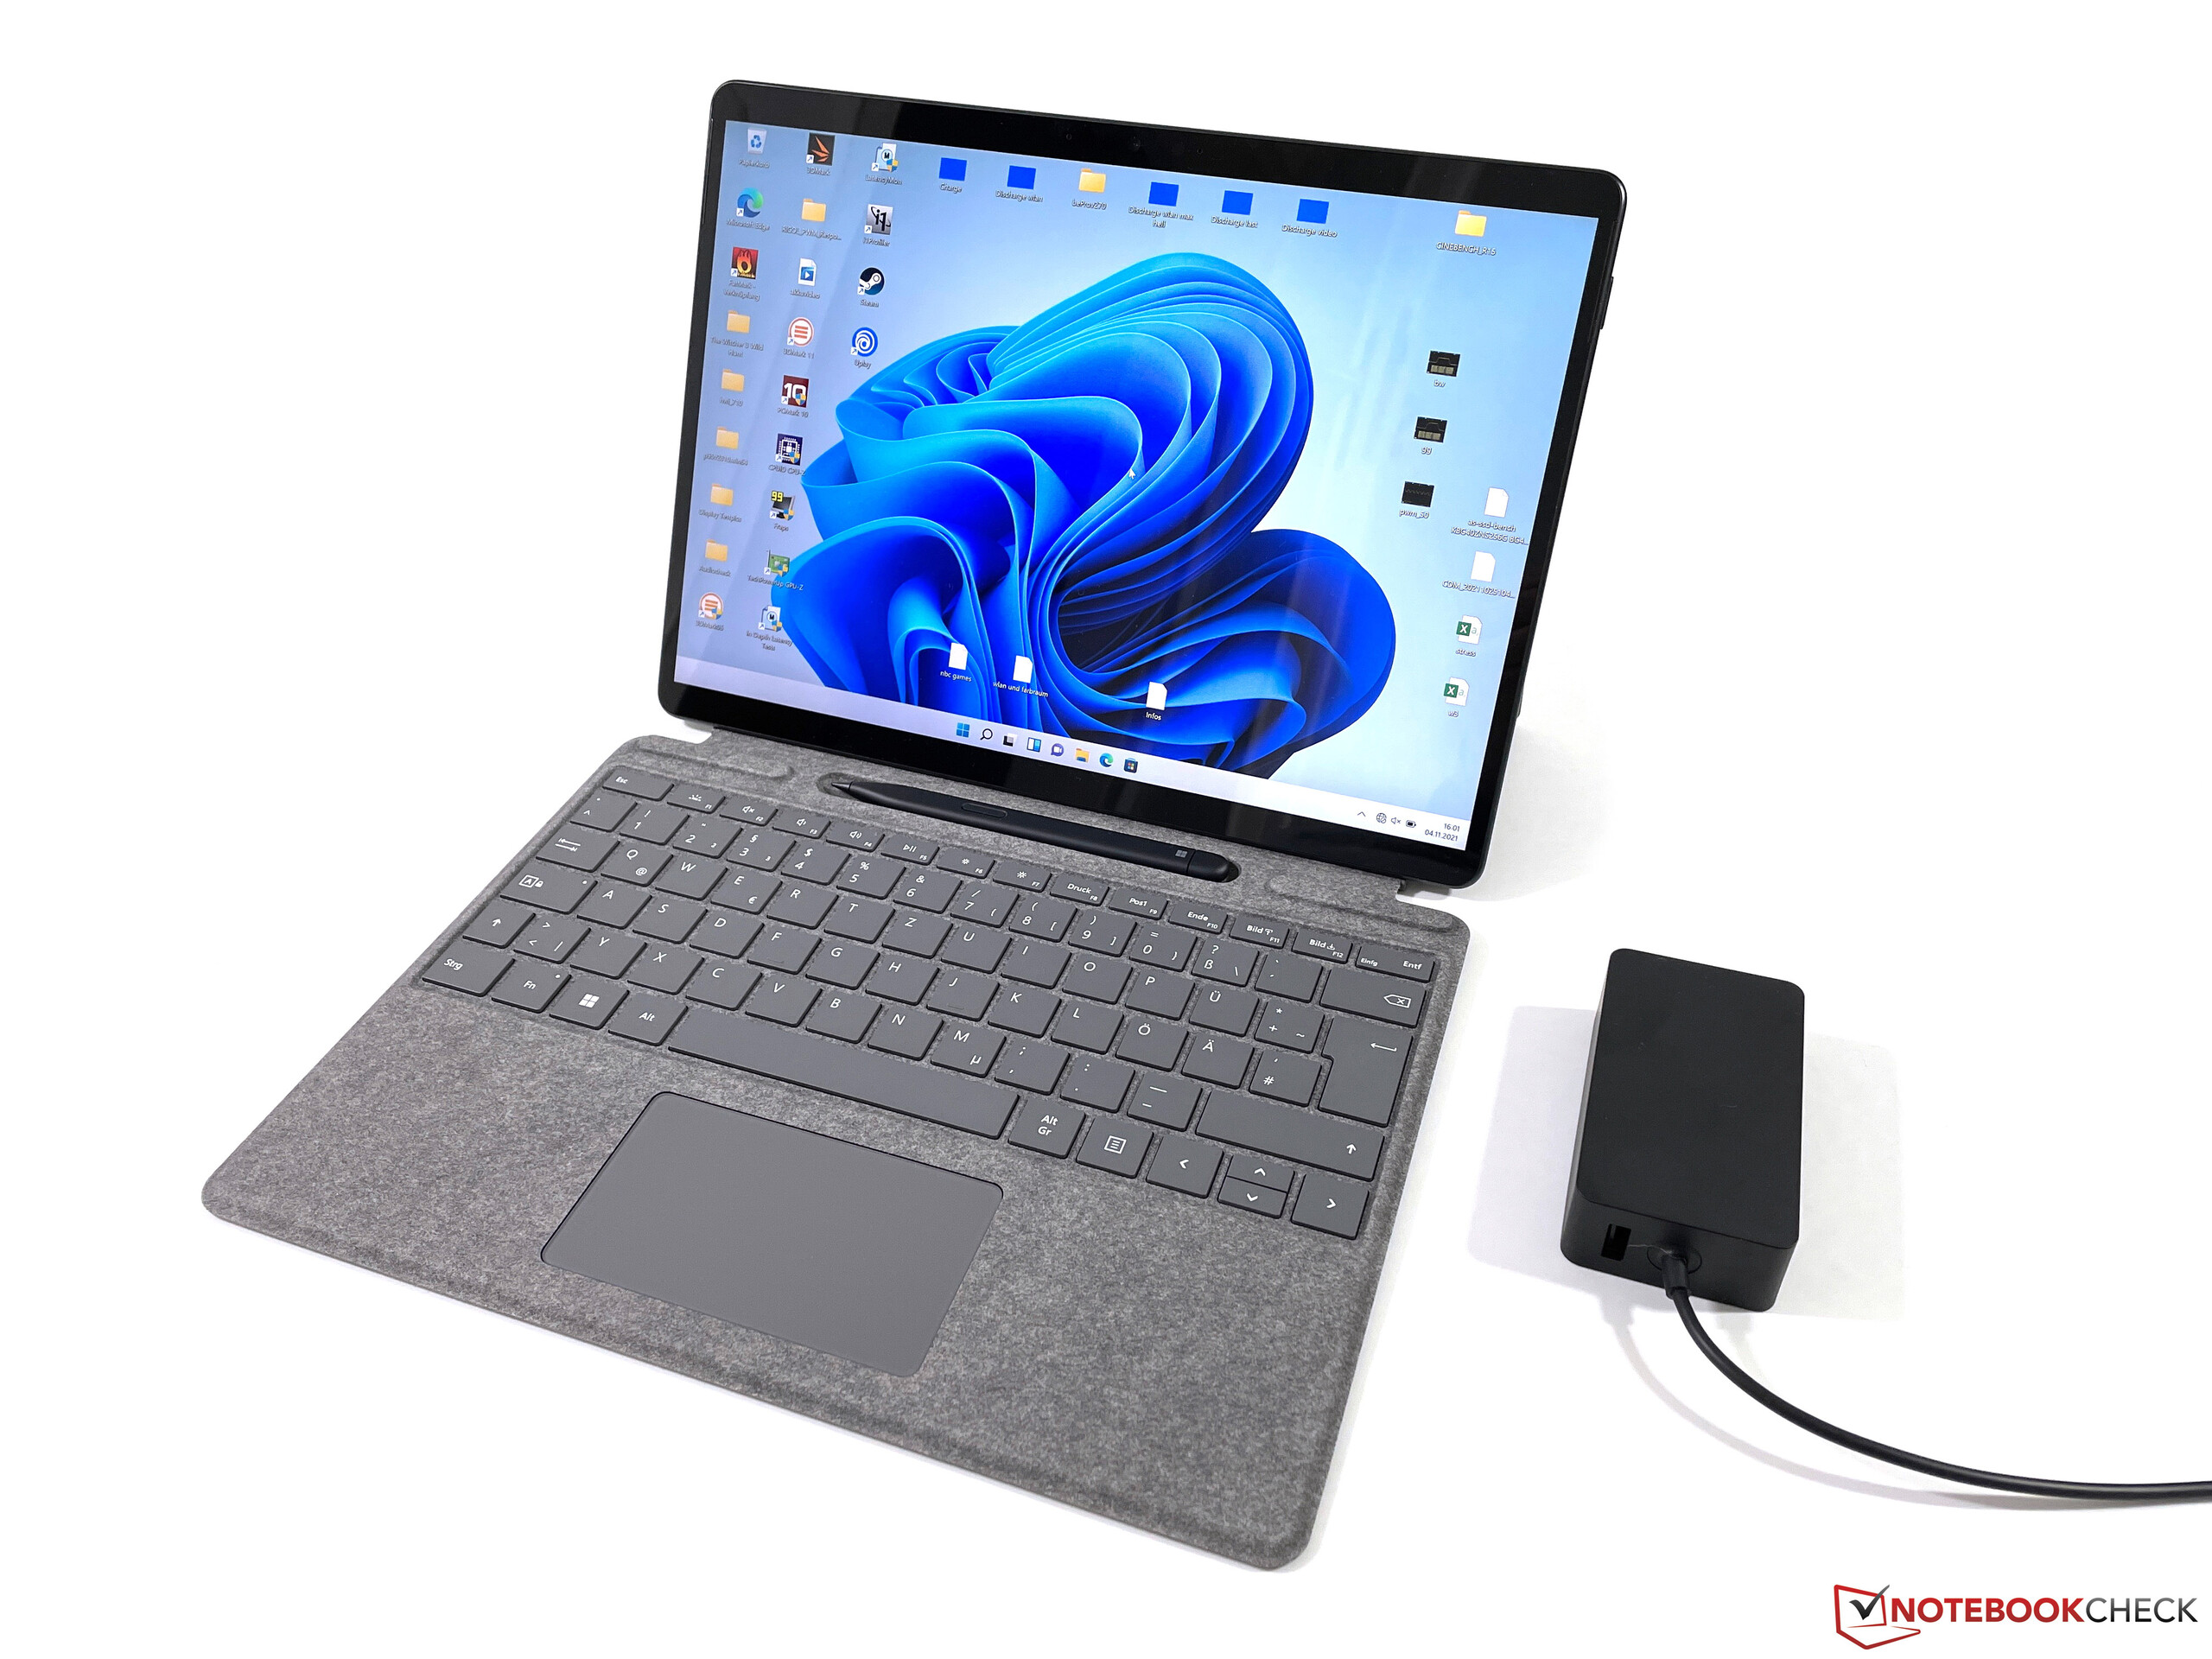
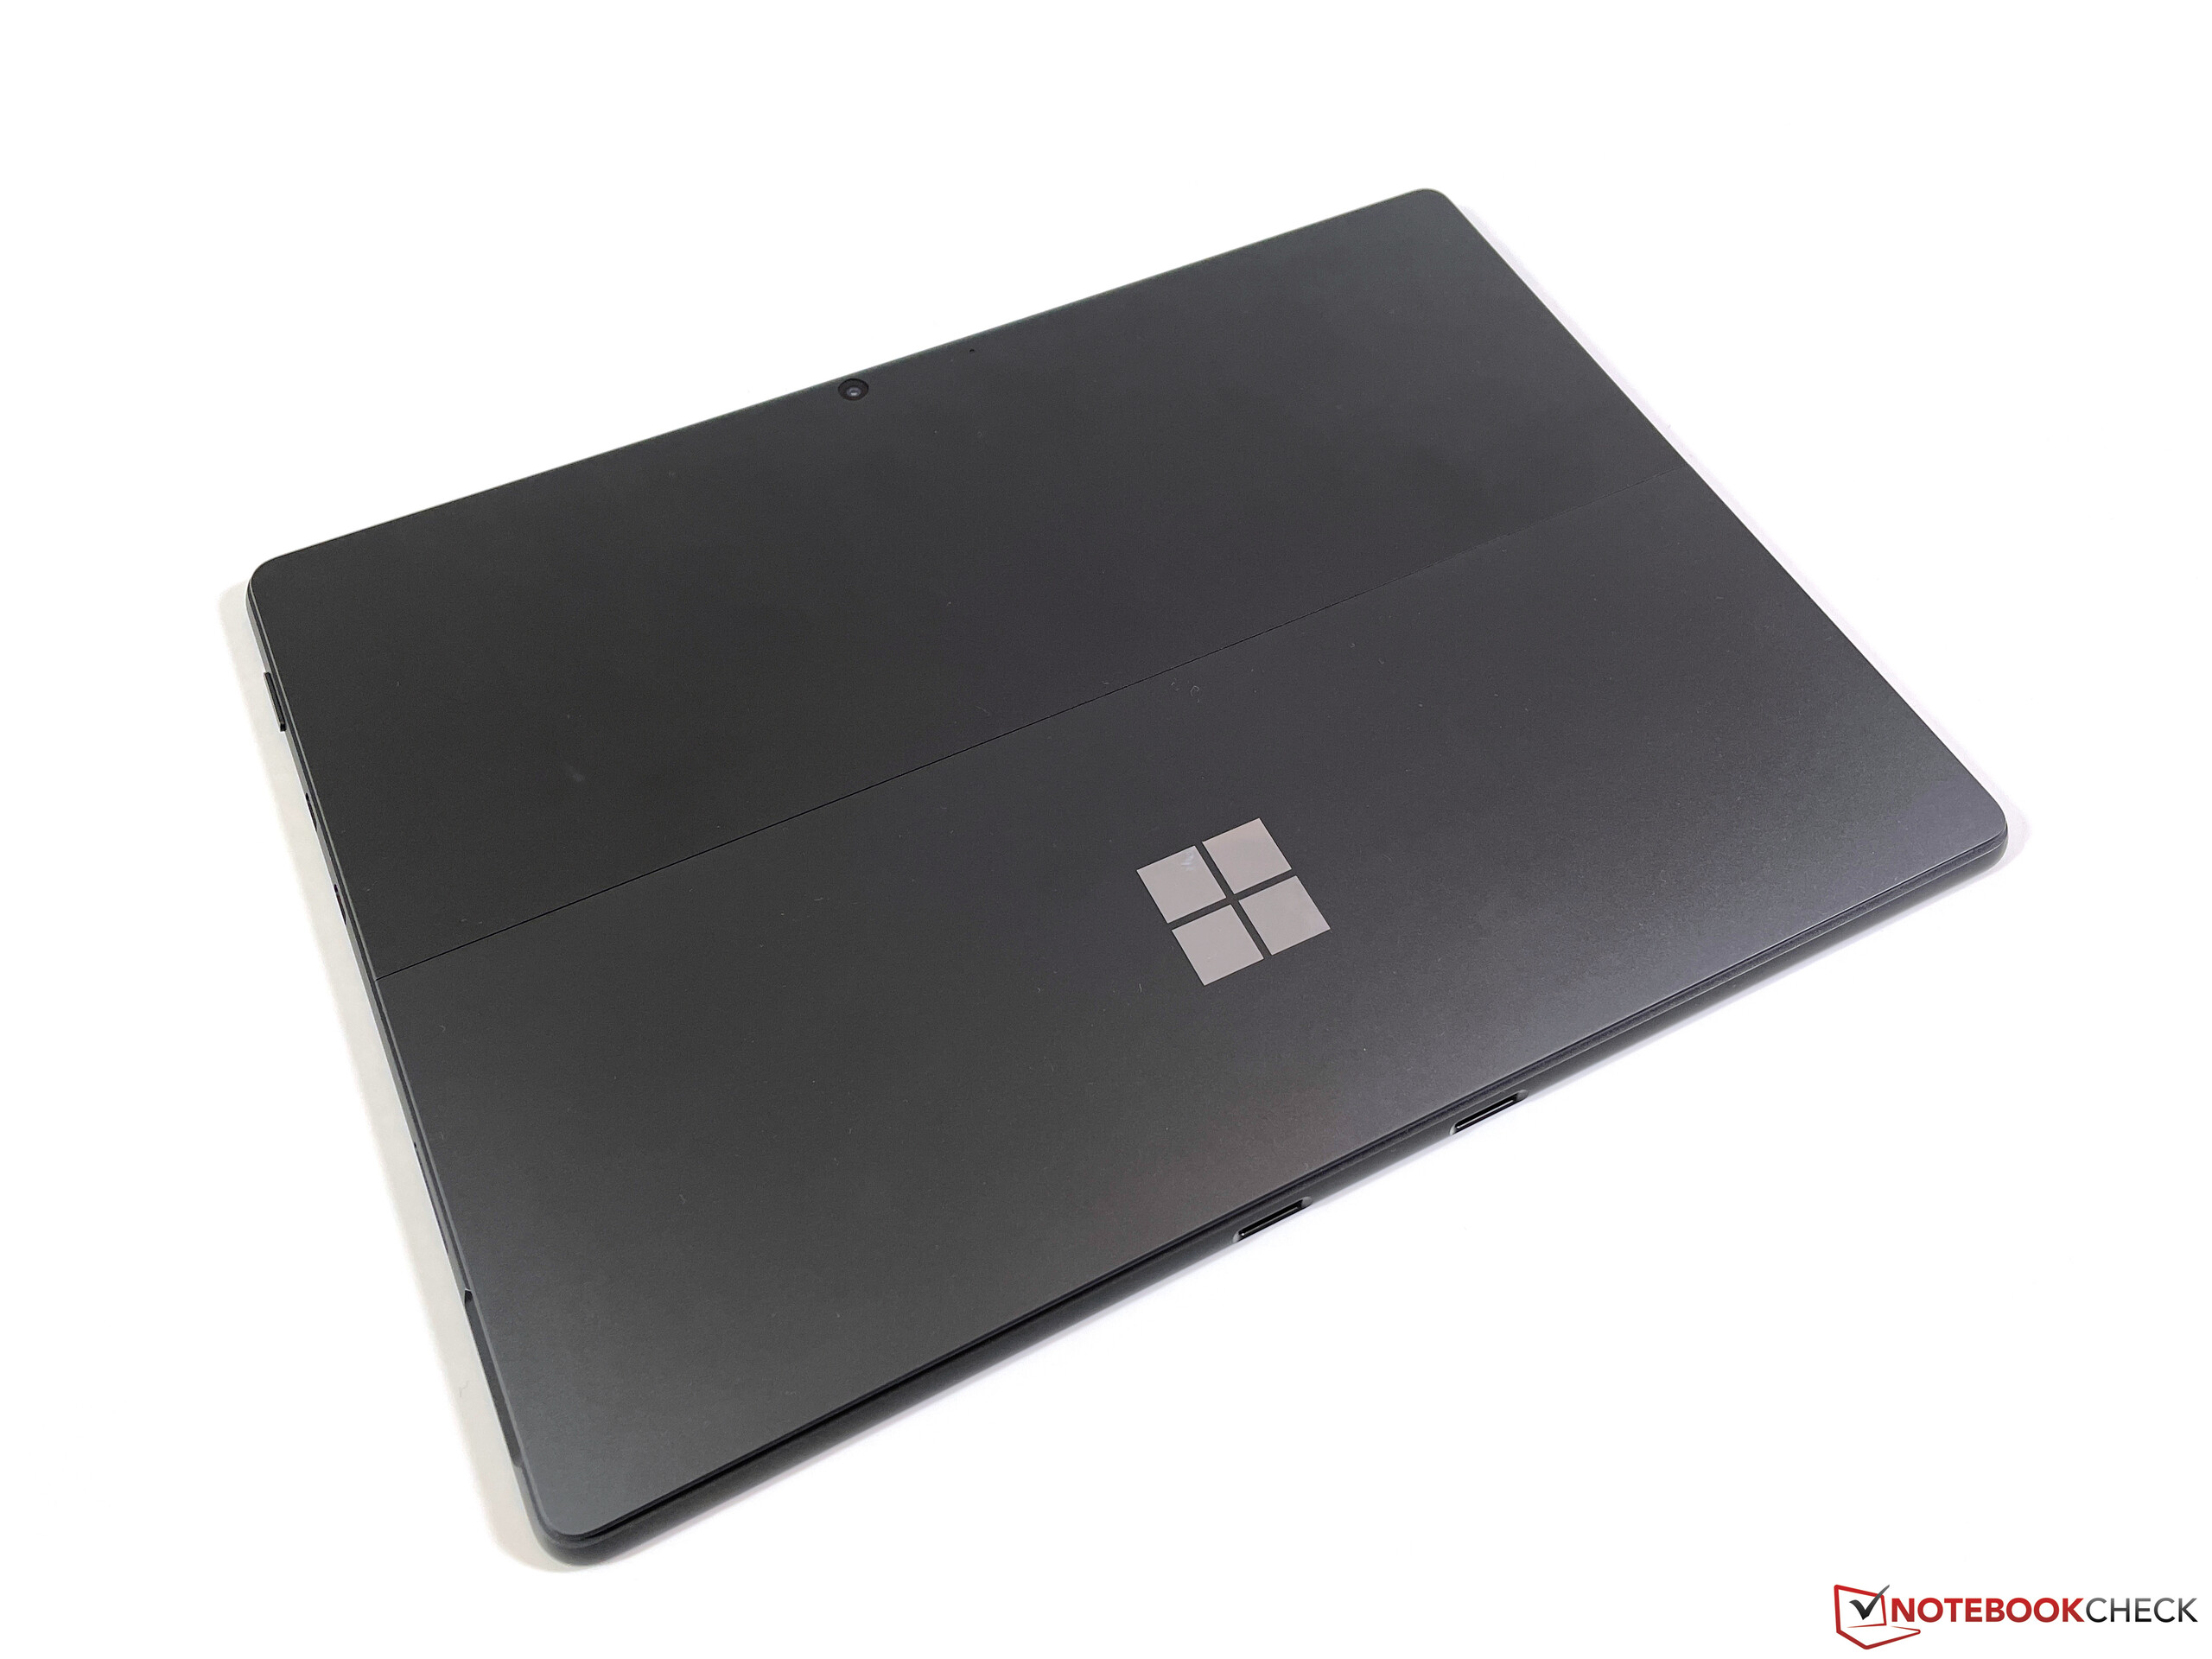
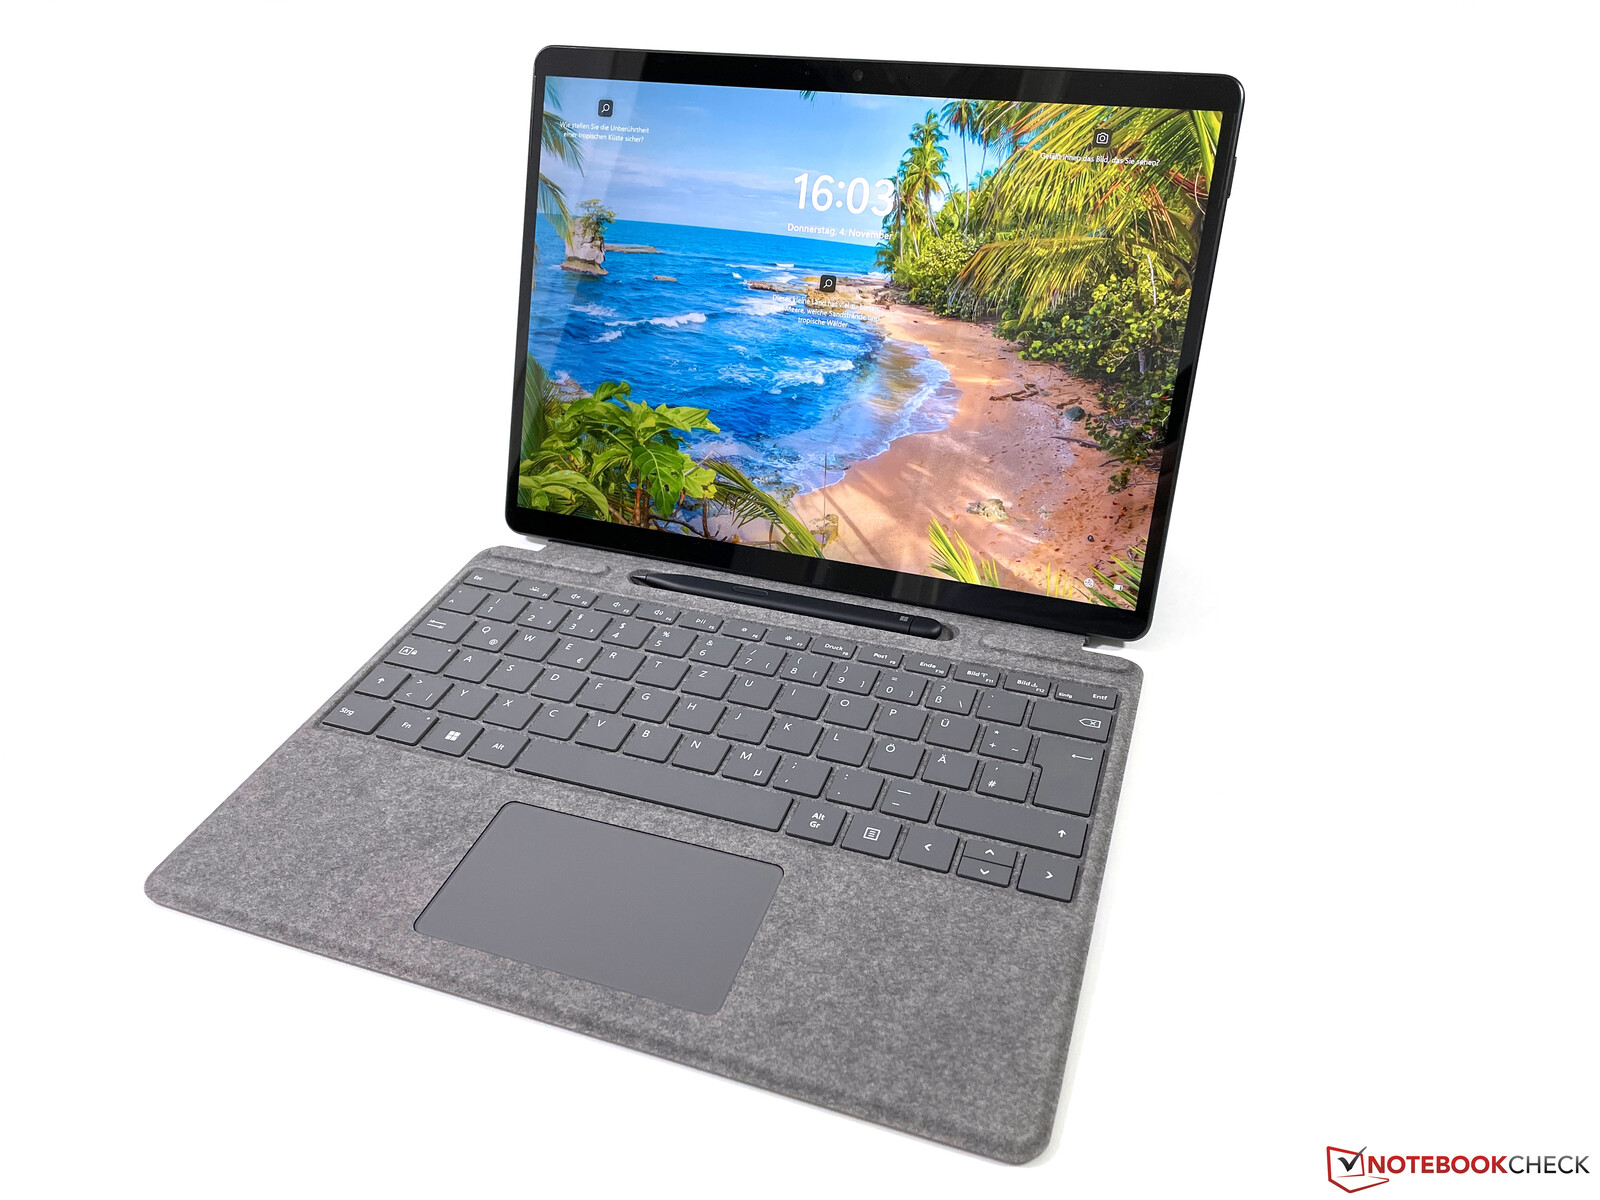
案例--Surface Pro 8现在有了更大的屏幕
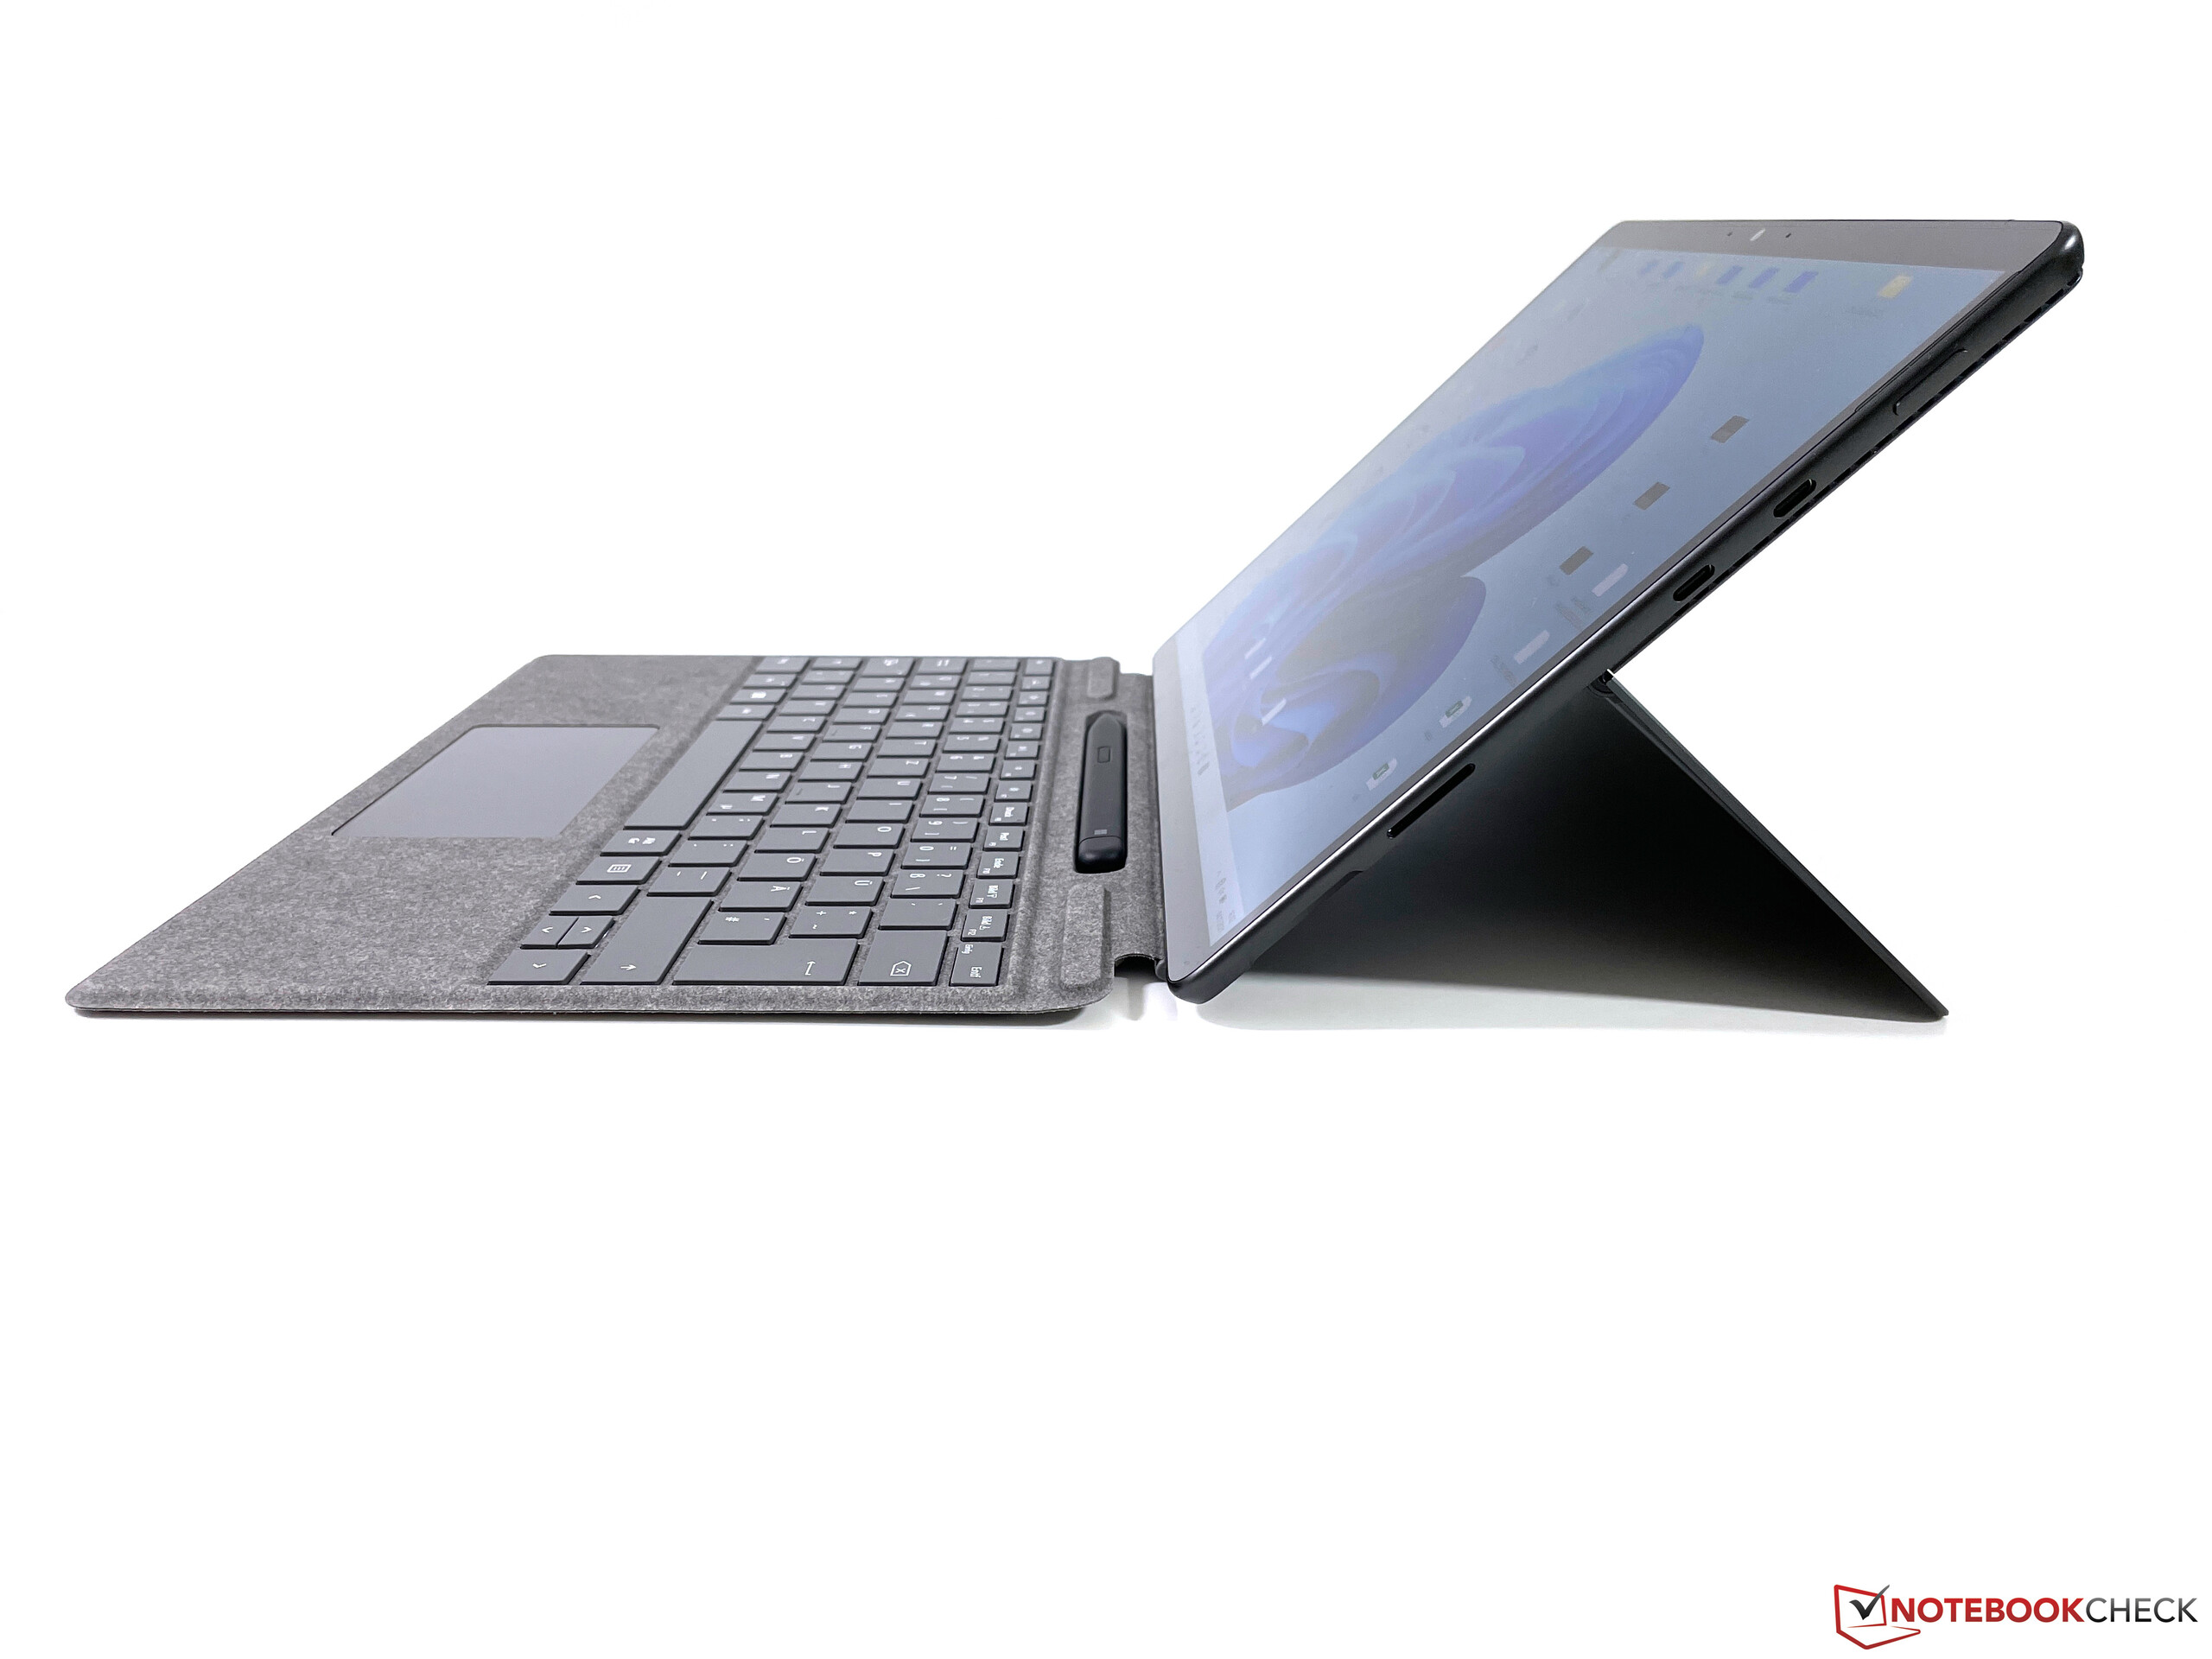
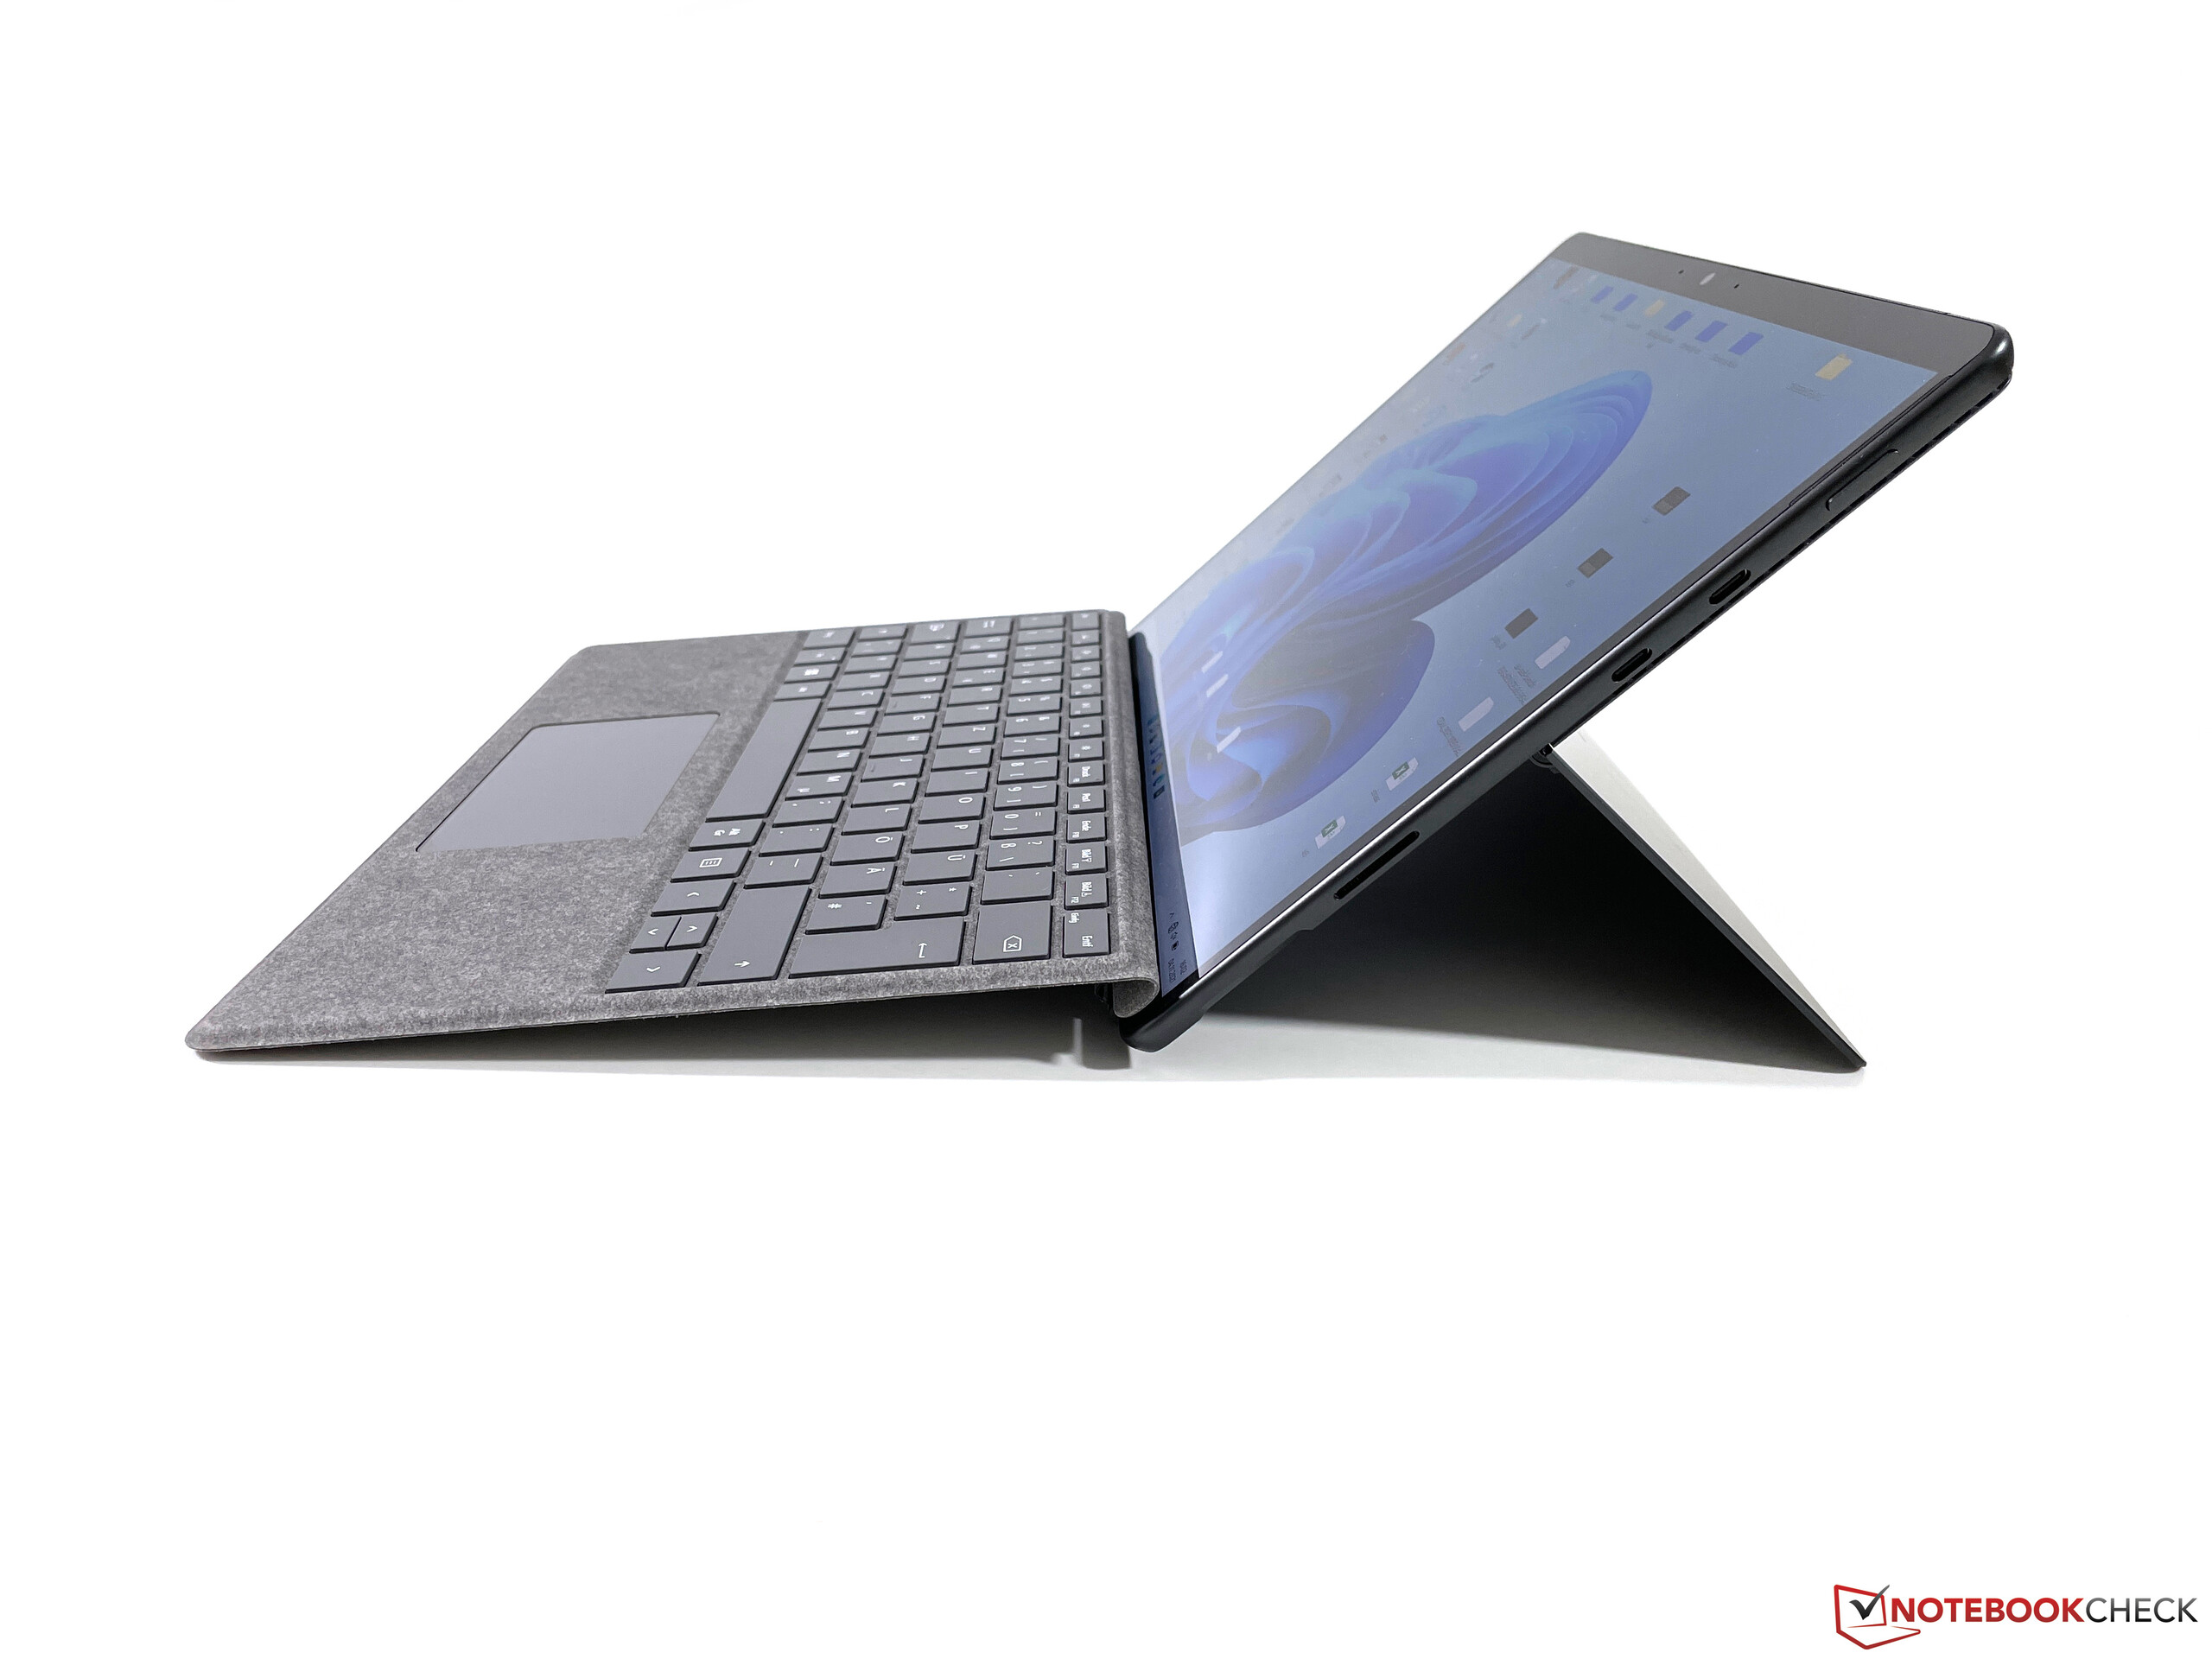
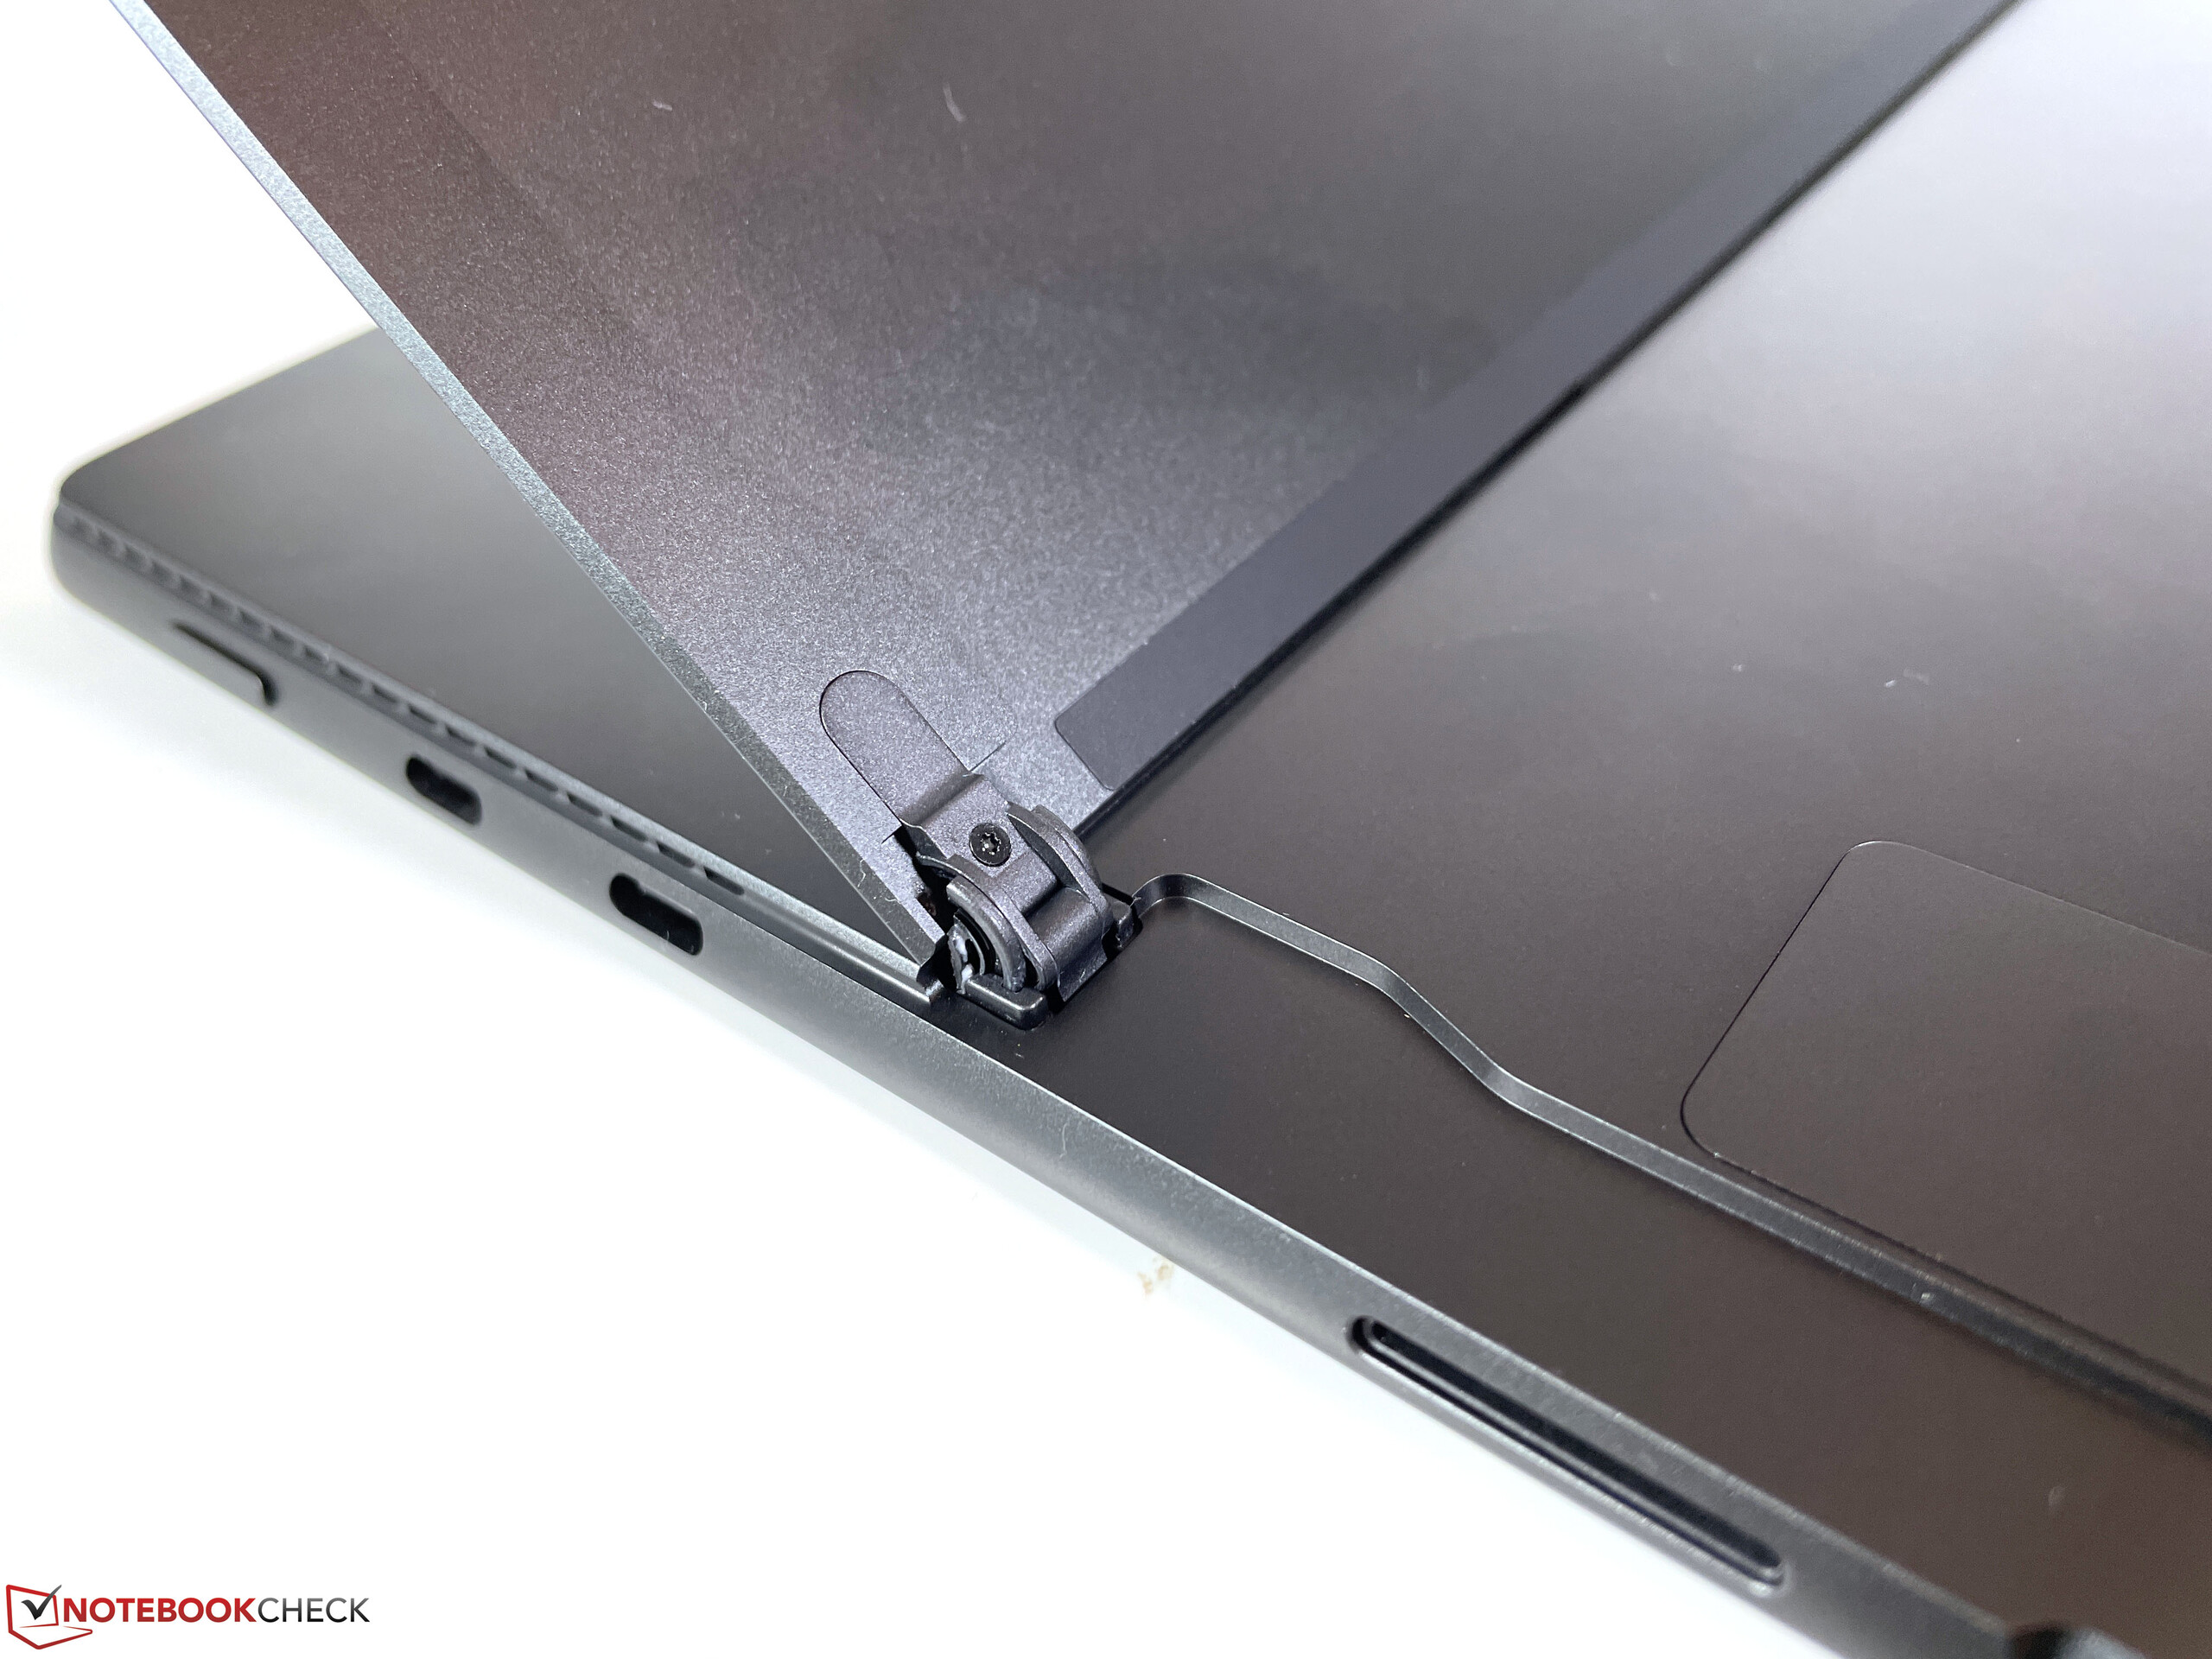
微软仍然使用相同的底盘设计,你可以选择铂金以及石墨两种颜色。金属机壳仍然给人留下了非常优质的印象,具有完美的制造质量,而且可折叠机的手感也不错。我们也没有注意到任何稳定性问题,当我们集中施压时,没有吱吱嘎嘎的声音或画面失真。集成的脚架,允许一个非常宽的开放角度,不能继续保持良好的印象。它非常薄,当你把它放在腿上使用时,很快就会留下痕迹。它也非常灵活,看起来有点不稳定。两个铰链,一般来说调整得非常好,但也有一些小的波动。
一旦你打开盖子,你可以立即注意到与前一个型号相比的巨大差异。 之前的型号.边框窄了很多,特别是在左右两侧,对角线尺寸从12.3英寸增加到13英寸,这使设备看起来更现代。
你可以完全平放或以小角度使用可选的键盘盖,这通过磁铁实现。这在一般情况下效果很好,但当你在腿上使用时,稳定性显然比固体底座的设备低。然而,几乎所有的转换机都有这个问题。
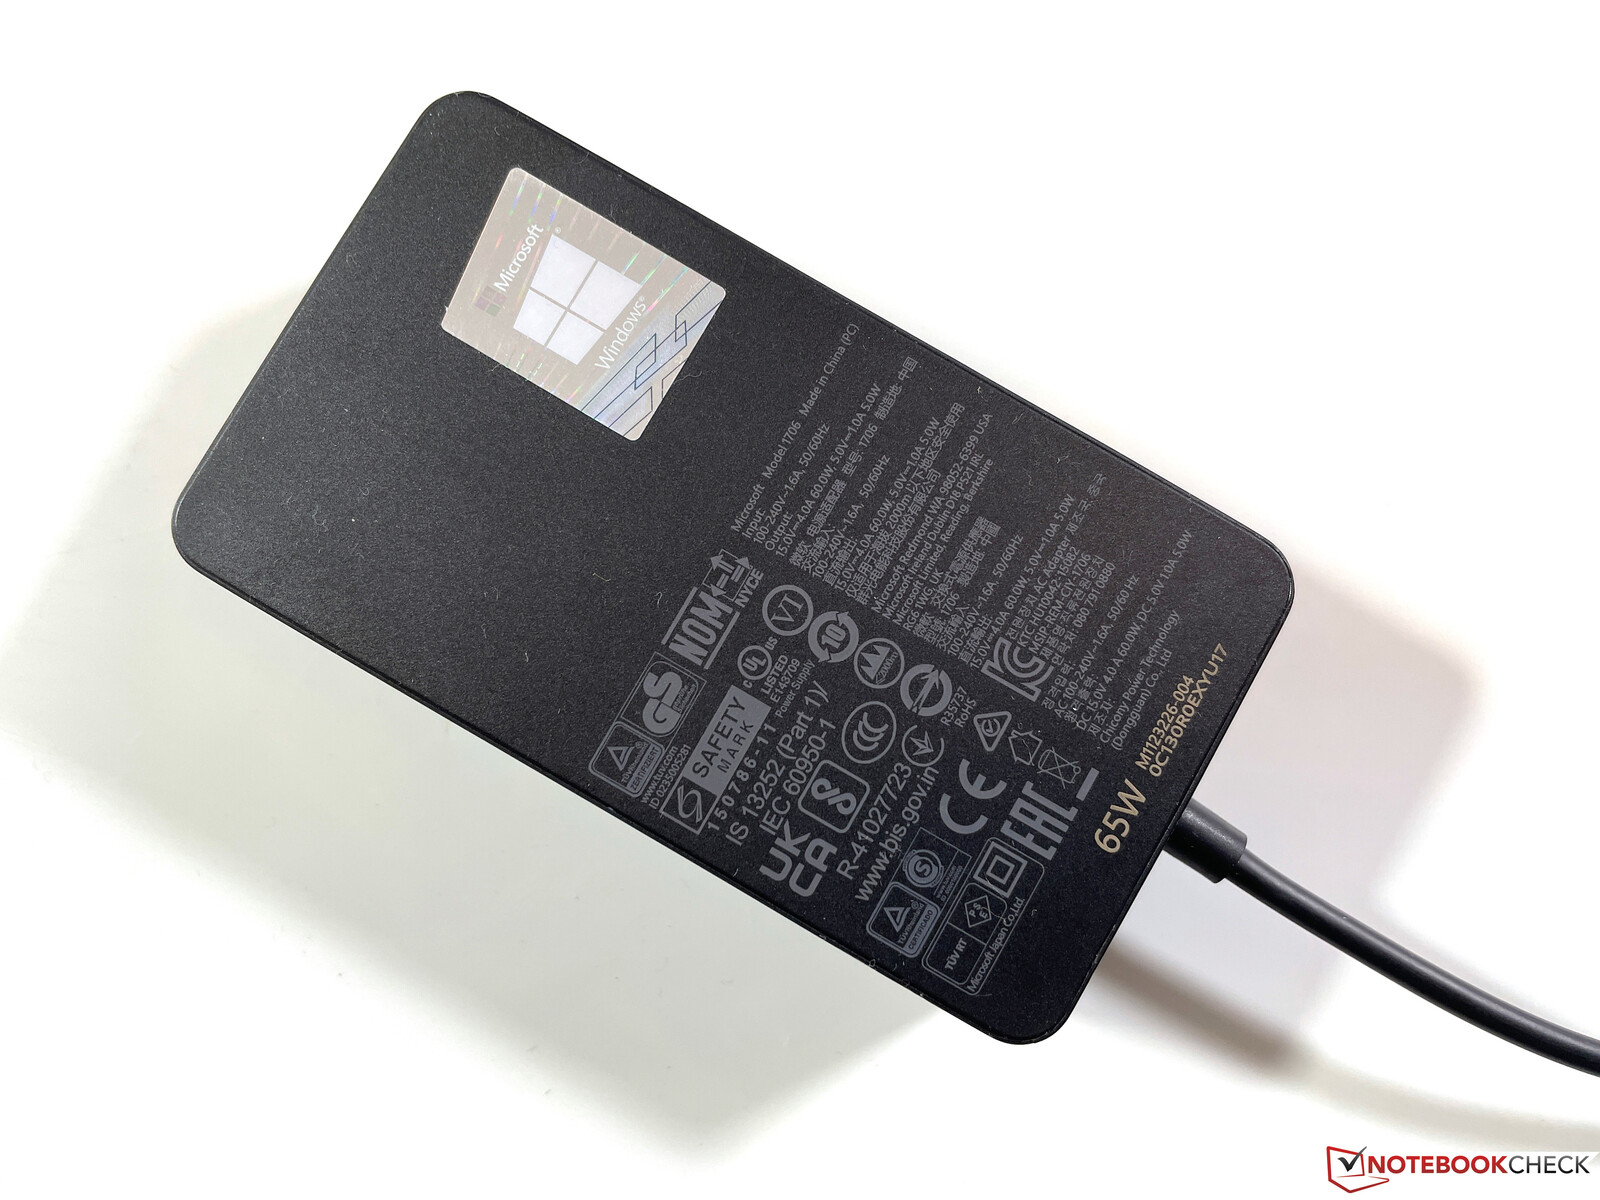
如前所述,机箱设计相似,但新机型比以前重了100克。加上签名键盘,总重量几乎达到1.2公斤,所以它比许多副笔记本轻不了多少。65W电源适配器的重量约为300克。Surface Pro 8仍然是对比组中最紧凑的设备之一,但差异不大。
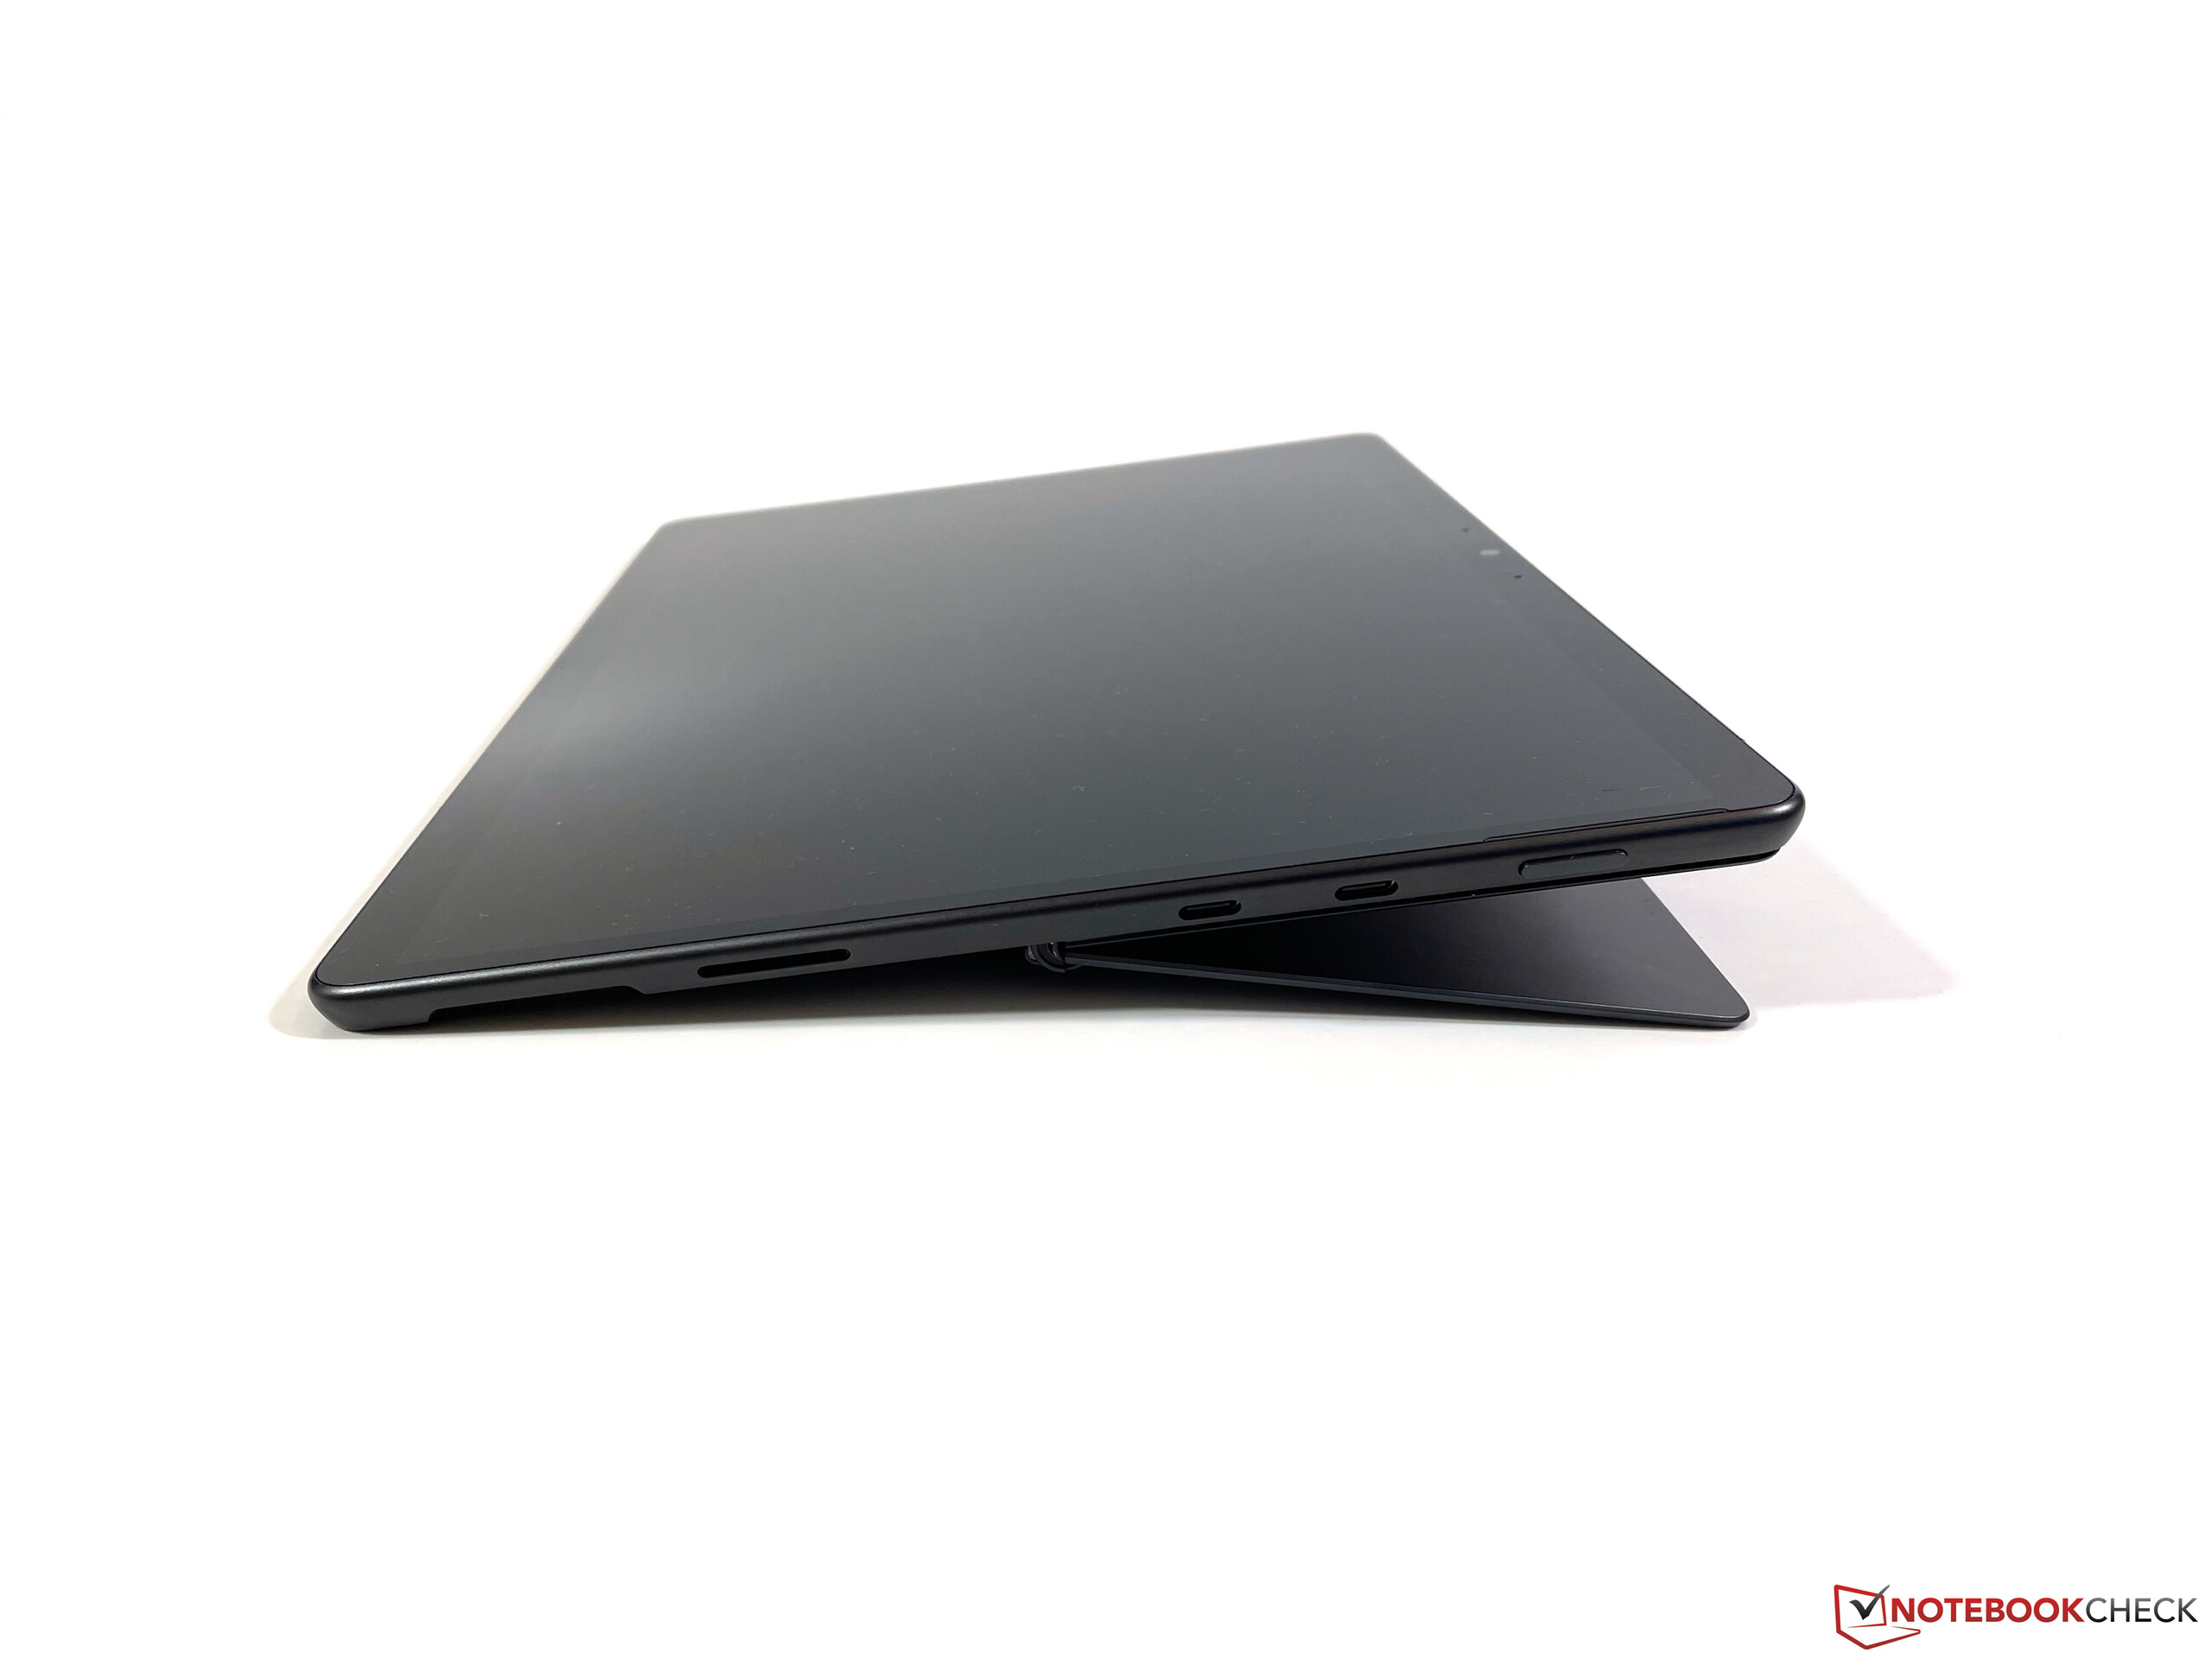
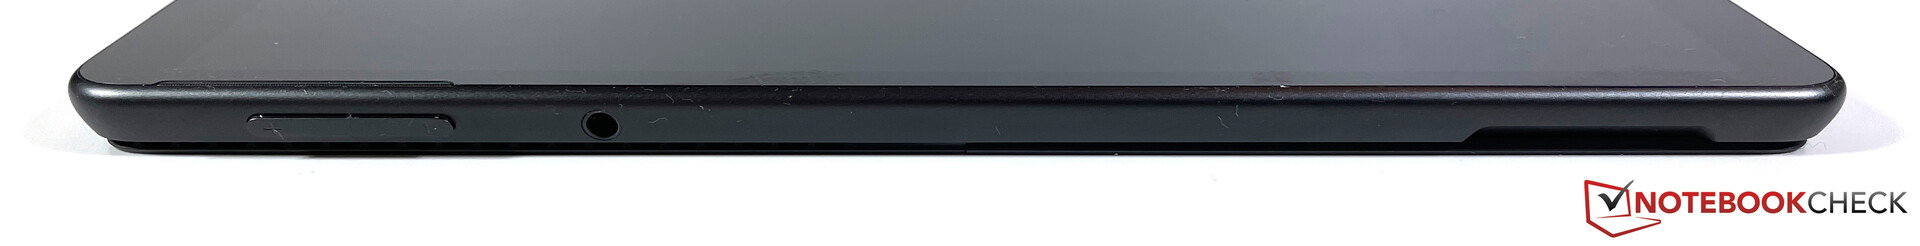
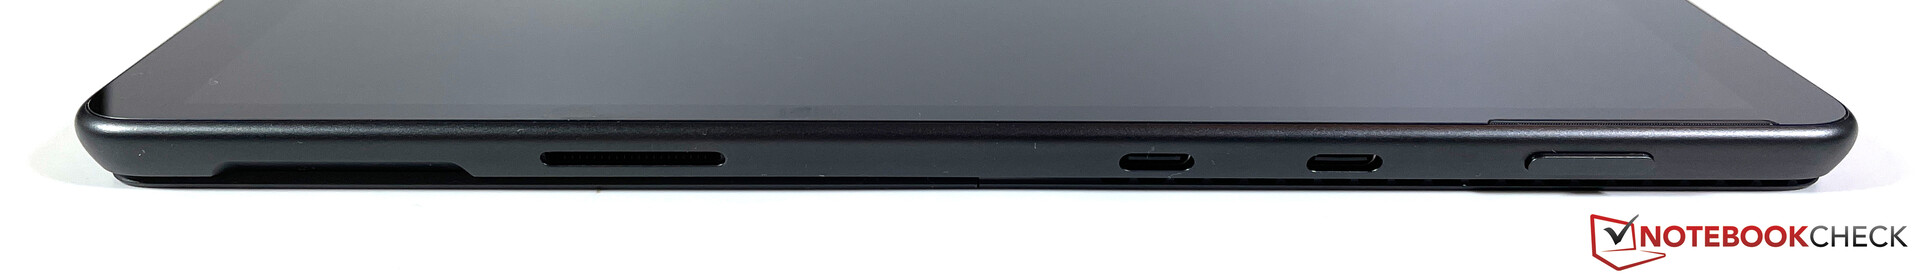
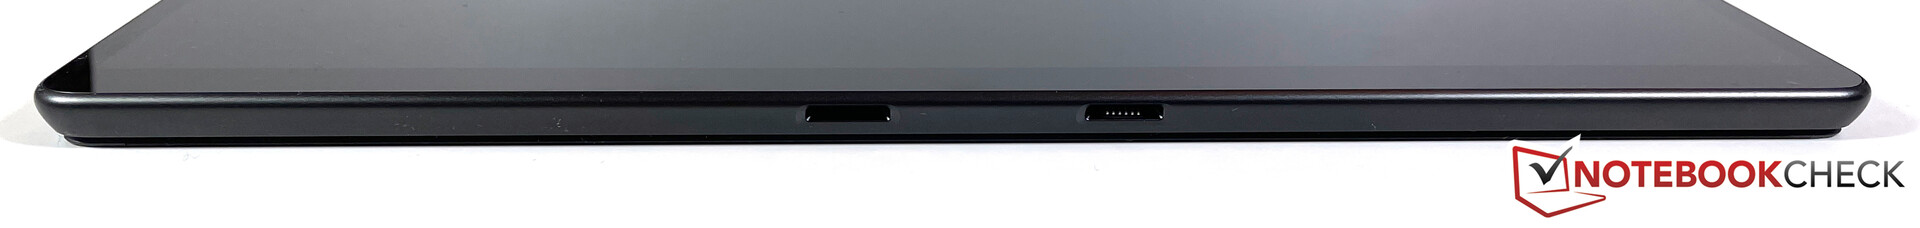
连接性 - 微软现在包括Thunderbolt 4
迄今为止,微软在其Surface产品中使用了自己的Surface连接器和普通USB端口(USB-A或USB-C)的组合,但新的Surface Pro 8现在首次支持Thunderbolt。两个USB-C端口都支持最新的Thunderbolt 4标准,也可用于对接站。
专有的Surface连接器仍然可用,这意味着你仍然可以使用以前所有的配件。附带的电源适配器也使用这个端口,但由于尺寸和形状不方便,我们仍然不是大粉丝。
沟通
微软采用了英特尔的现代Wi-Fi 6模块。除了目前的Wi-Fi标准外,AX201还支持蓝牙5.1。我们用参考路由器Netgear Nighthawk RAX120进行的Wi-Fi测试确定紧凑的可转换设备的传输速率非常高,约为1.5Gbps,我们没有遇到任何信号质量问题。这同样适用于Wi-Fi 5网络(用Fritz!Box 7590测试)。
微软为商业客户提供了一个可选的LTE模块,去年的Surface Pro 7 Plus这也是Surface Pro 8的情况。私人客户再次被忽视。对于2021年底的现代设备,我们希望看到为所有客户提供可选的5G模块,可选的SIM卡插槽是缺乏SD卡读卡器的原因。
网络摄像头
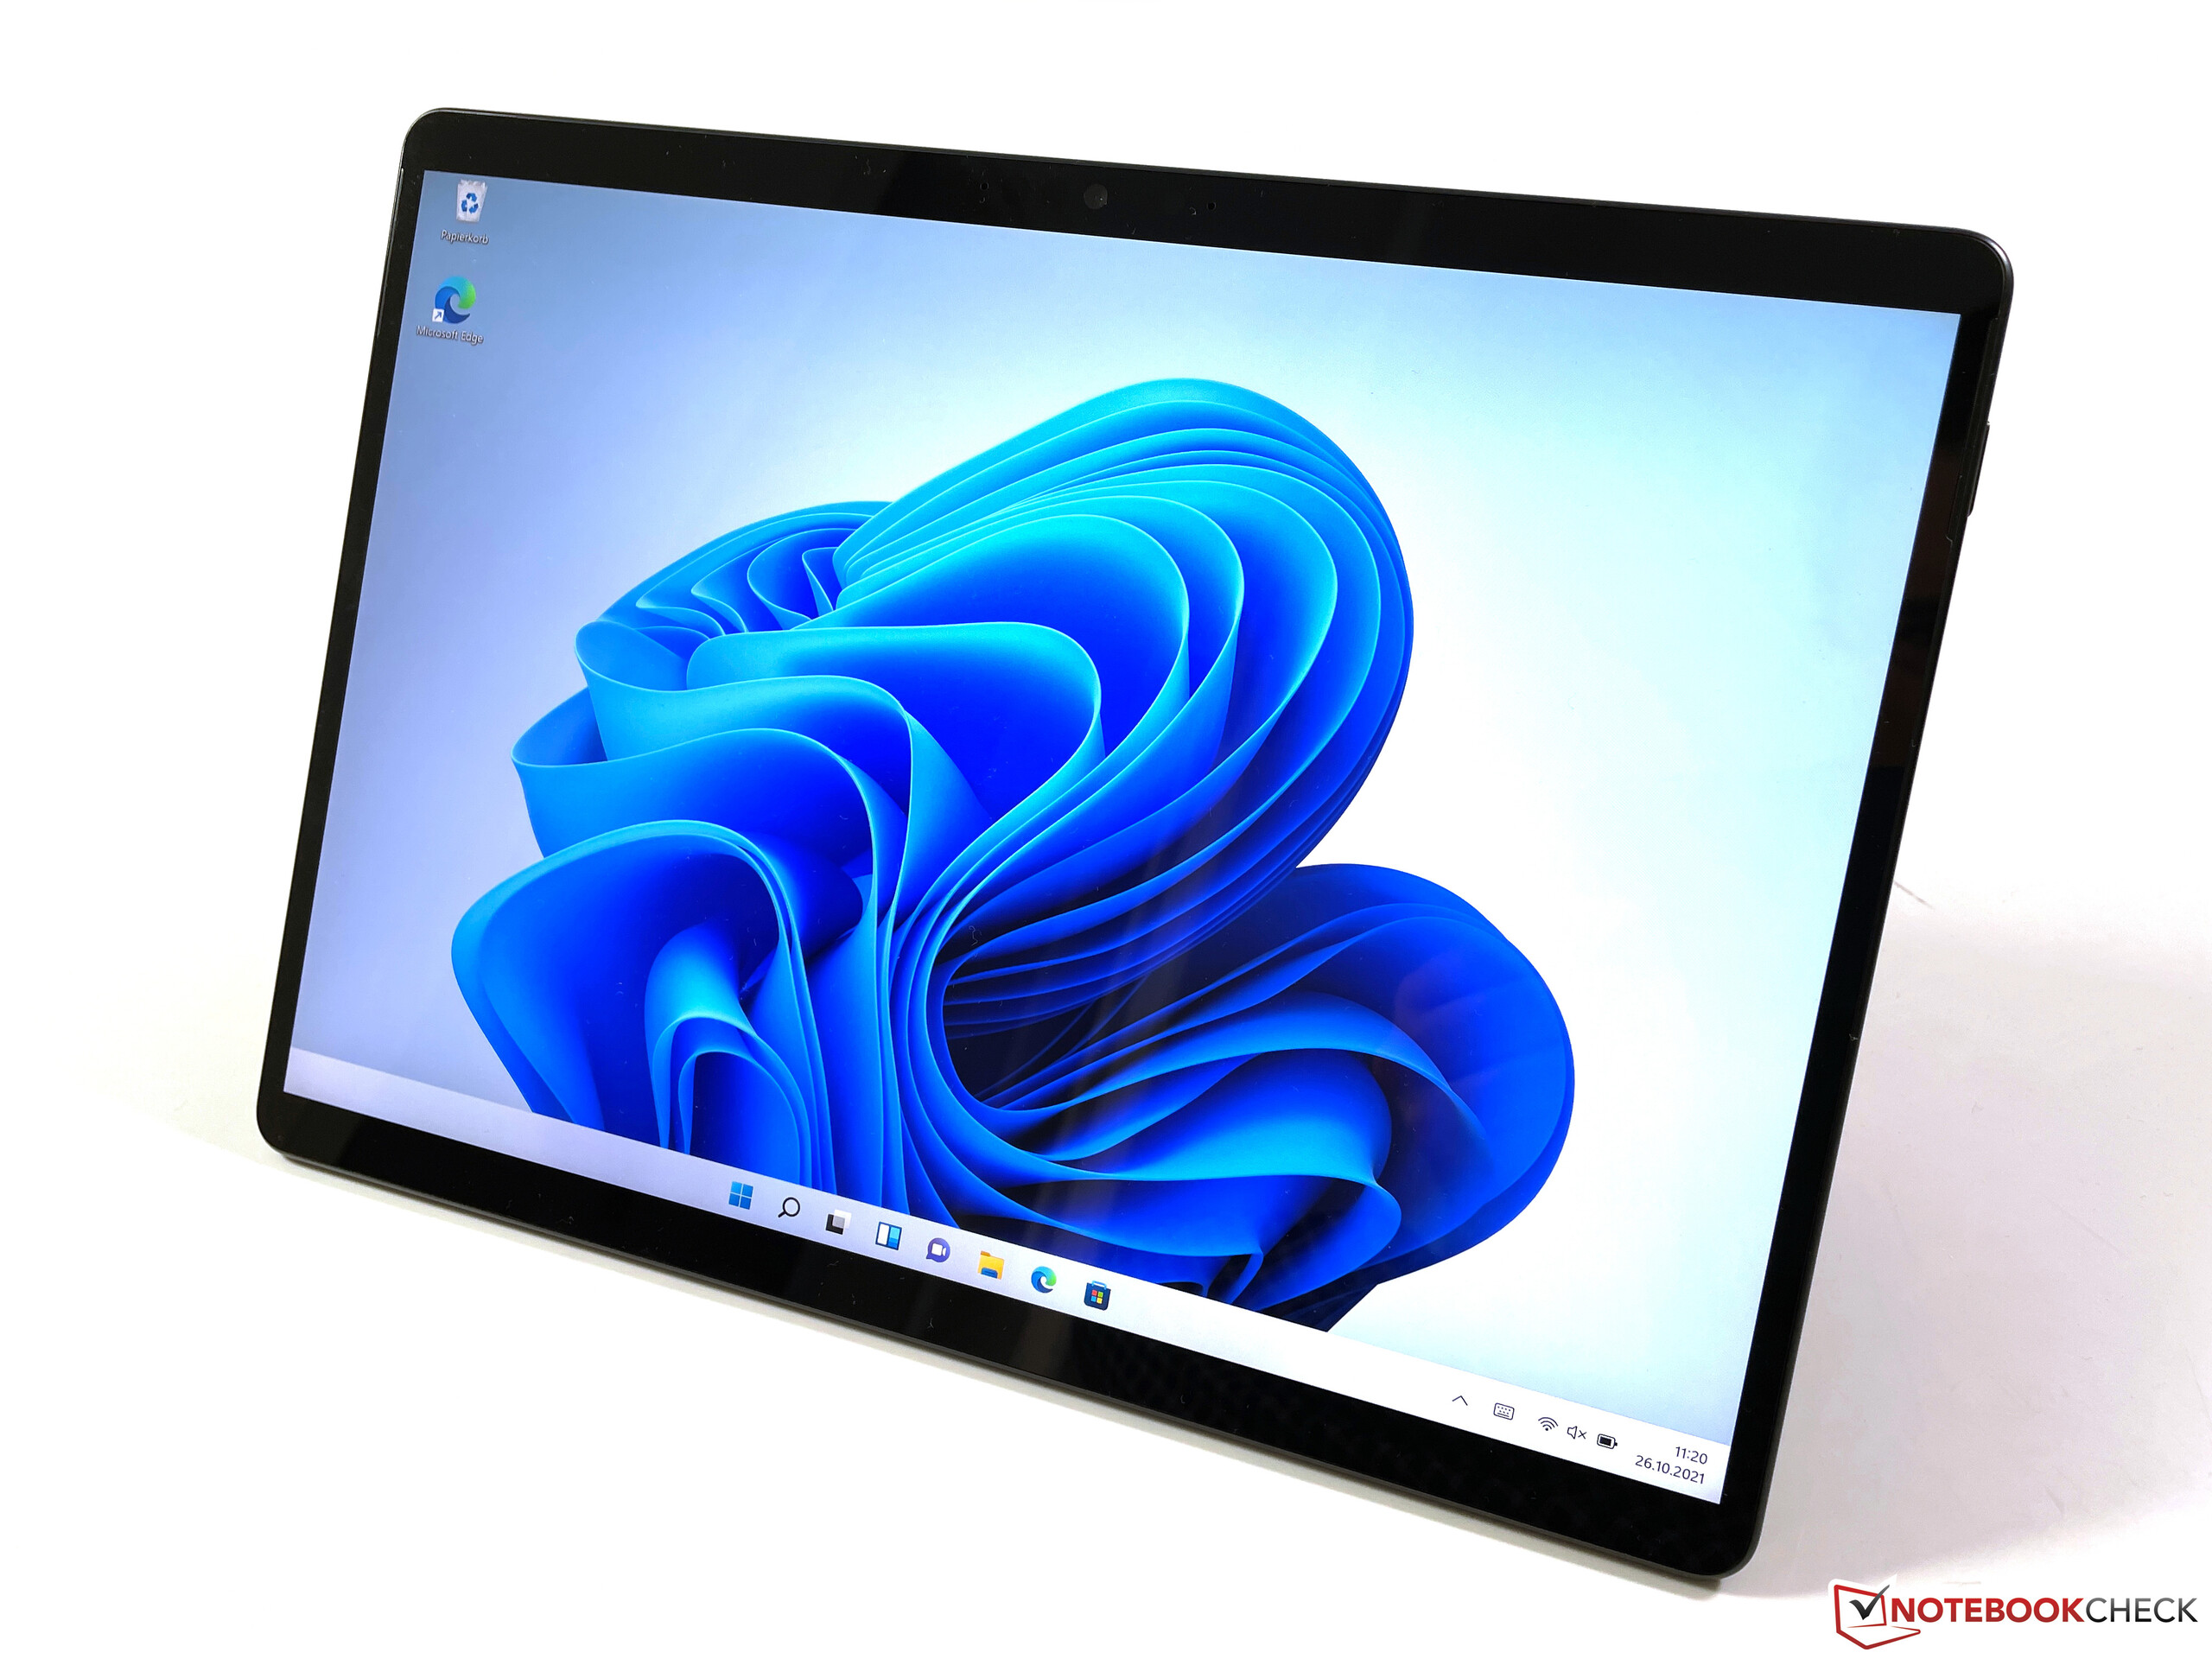
Surface产品传统上提供非常好的网络摄像头,新的Surface Pro 8也不例外。你在前面得到一个500万像素的传感器,甚至在后面得到一个1000万像素的单元,它还可以录制4K视频。这两个模块的质量(特别是在清晰度方面)比标准的720p传感器好得多,这种相机设备适合这个时代。


维护
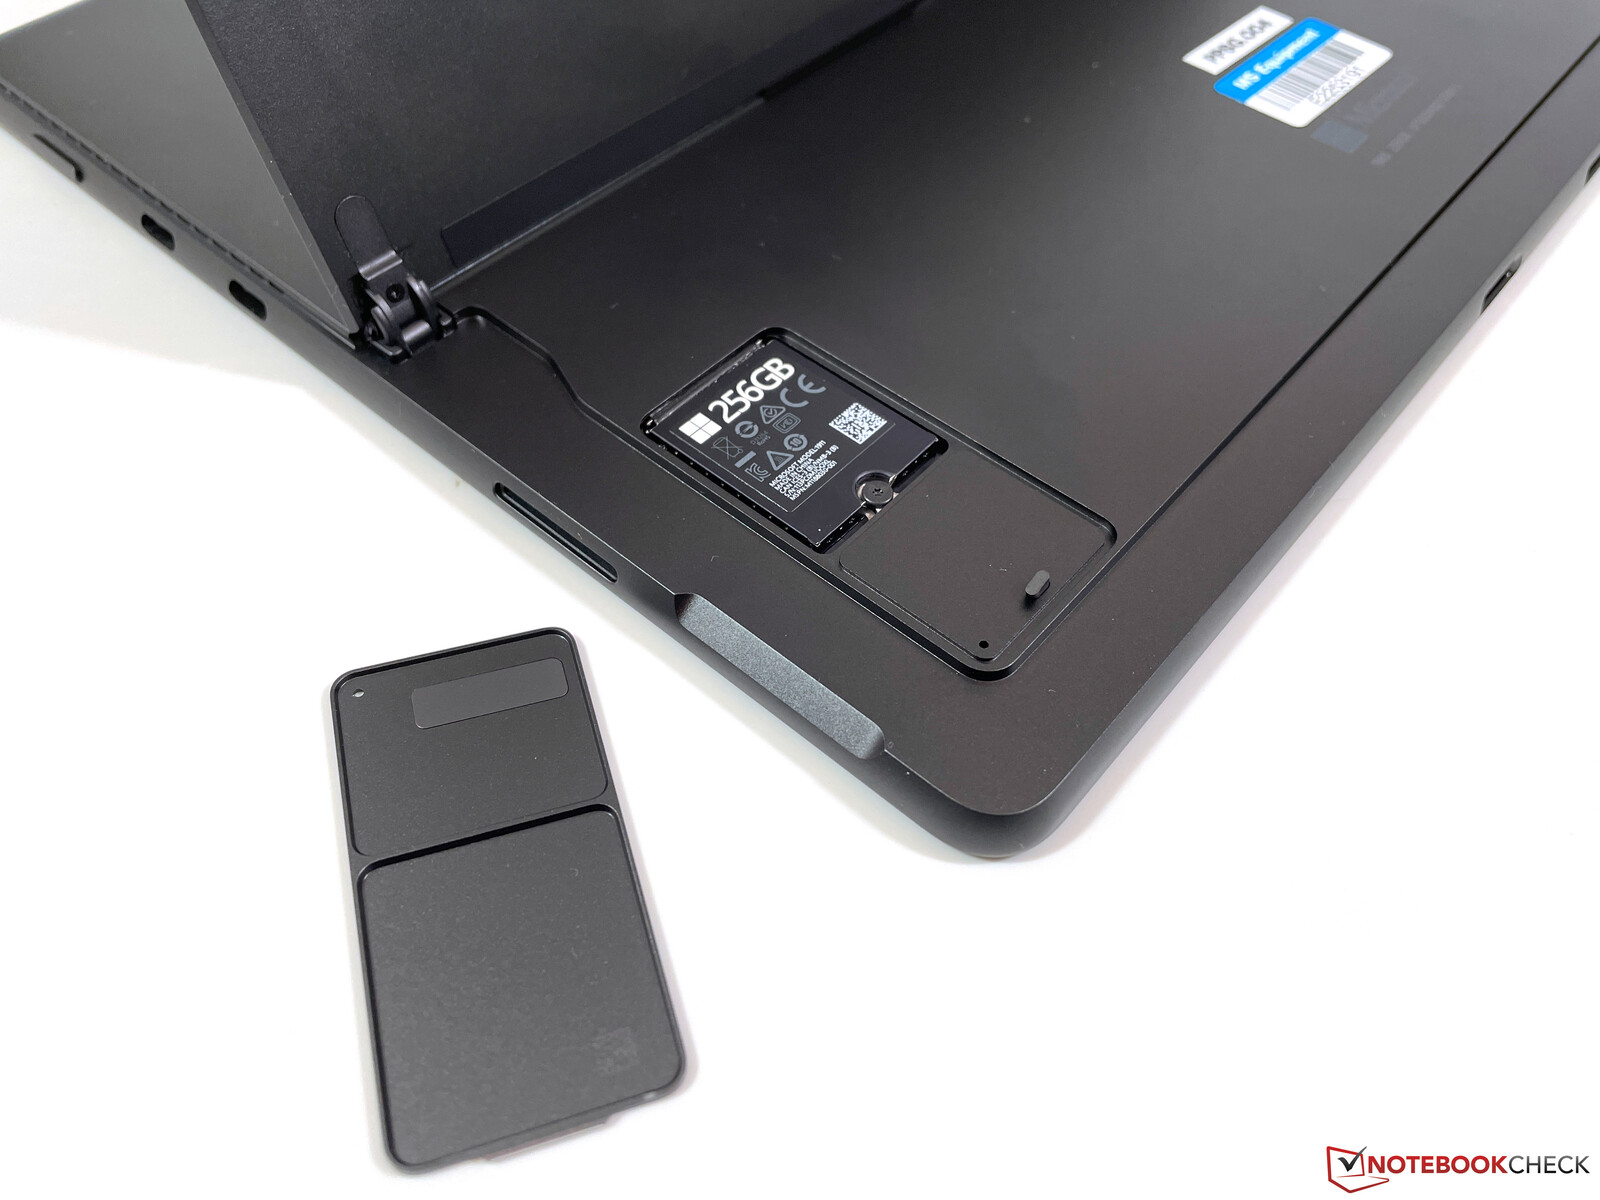
微软保留了小的维修舱口,从笔记本电脑.你可以用传统的SIM卡工具取下盖子,并接触到紧凑的M.2-2230固态硬盘,它可以被替换。没有其他维护选项,也不能进一步打开机箱。
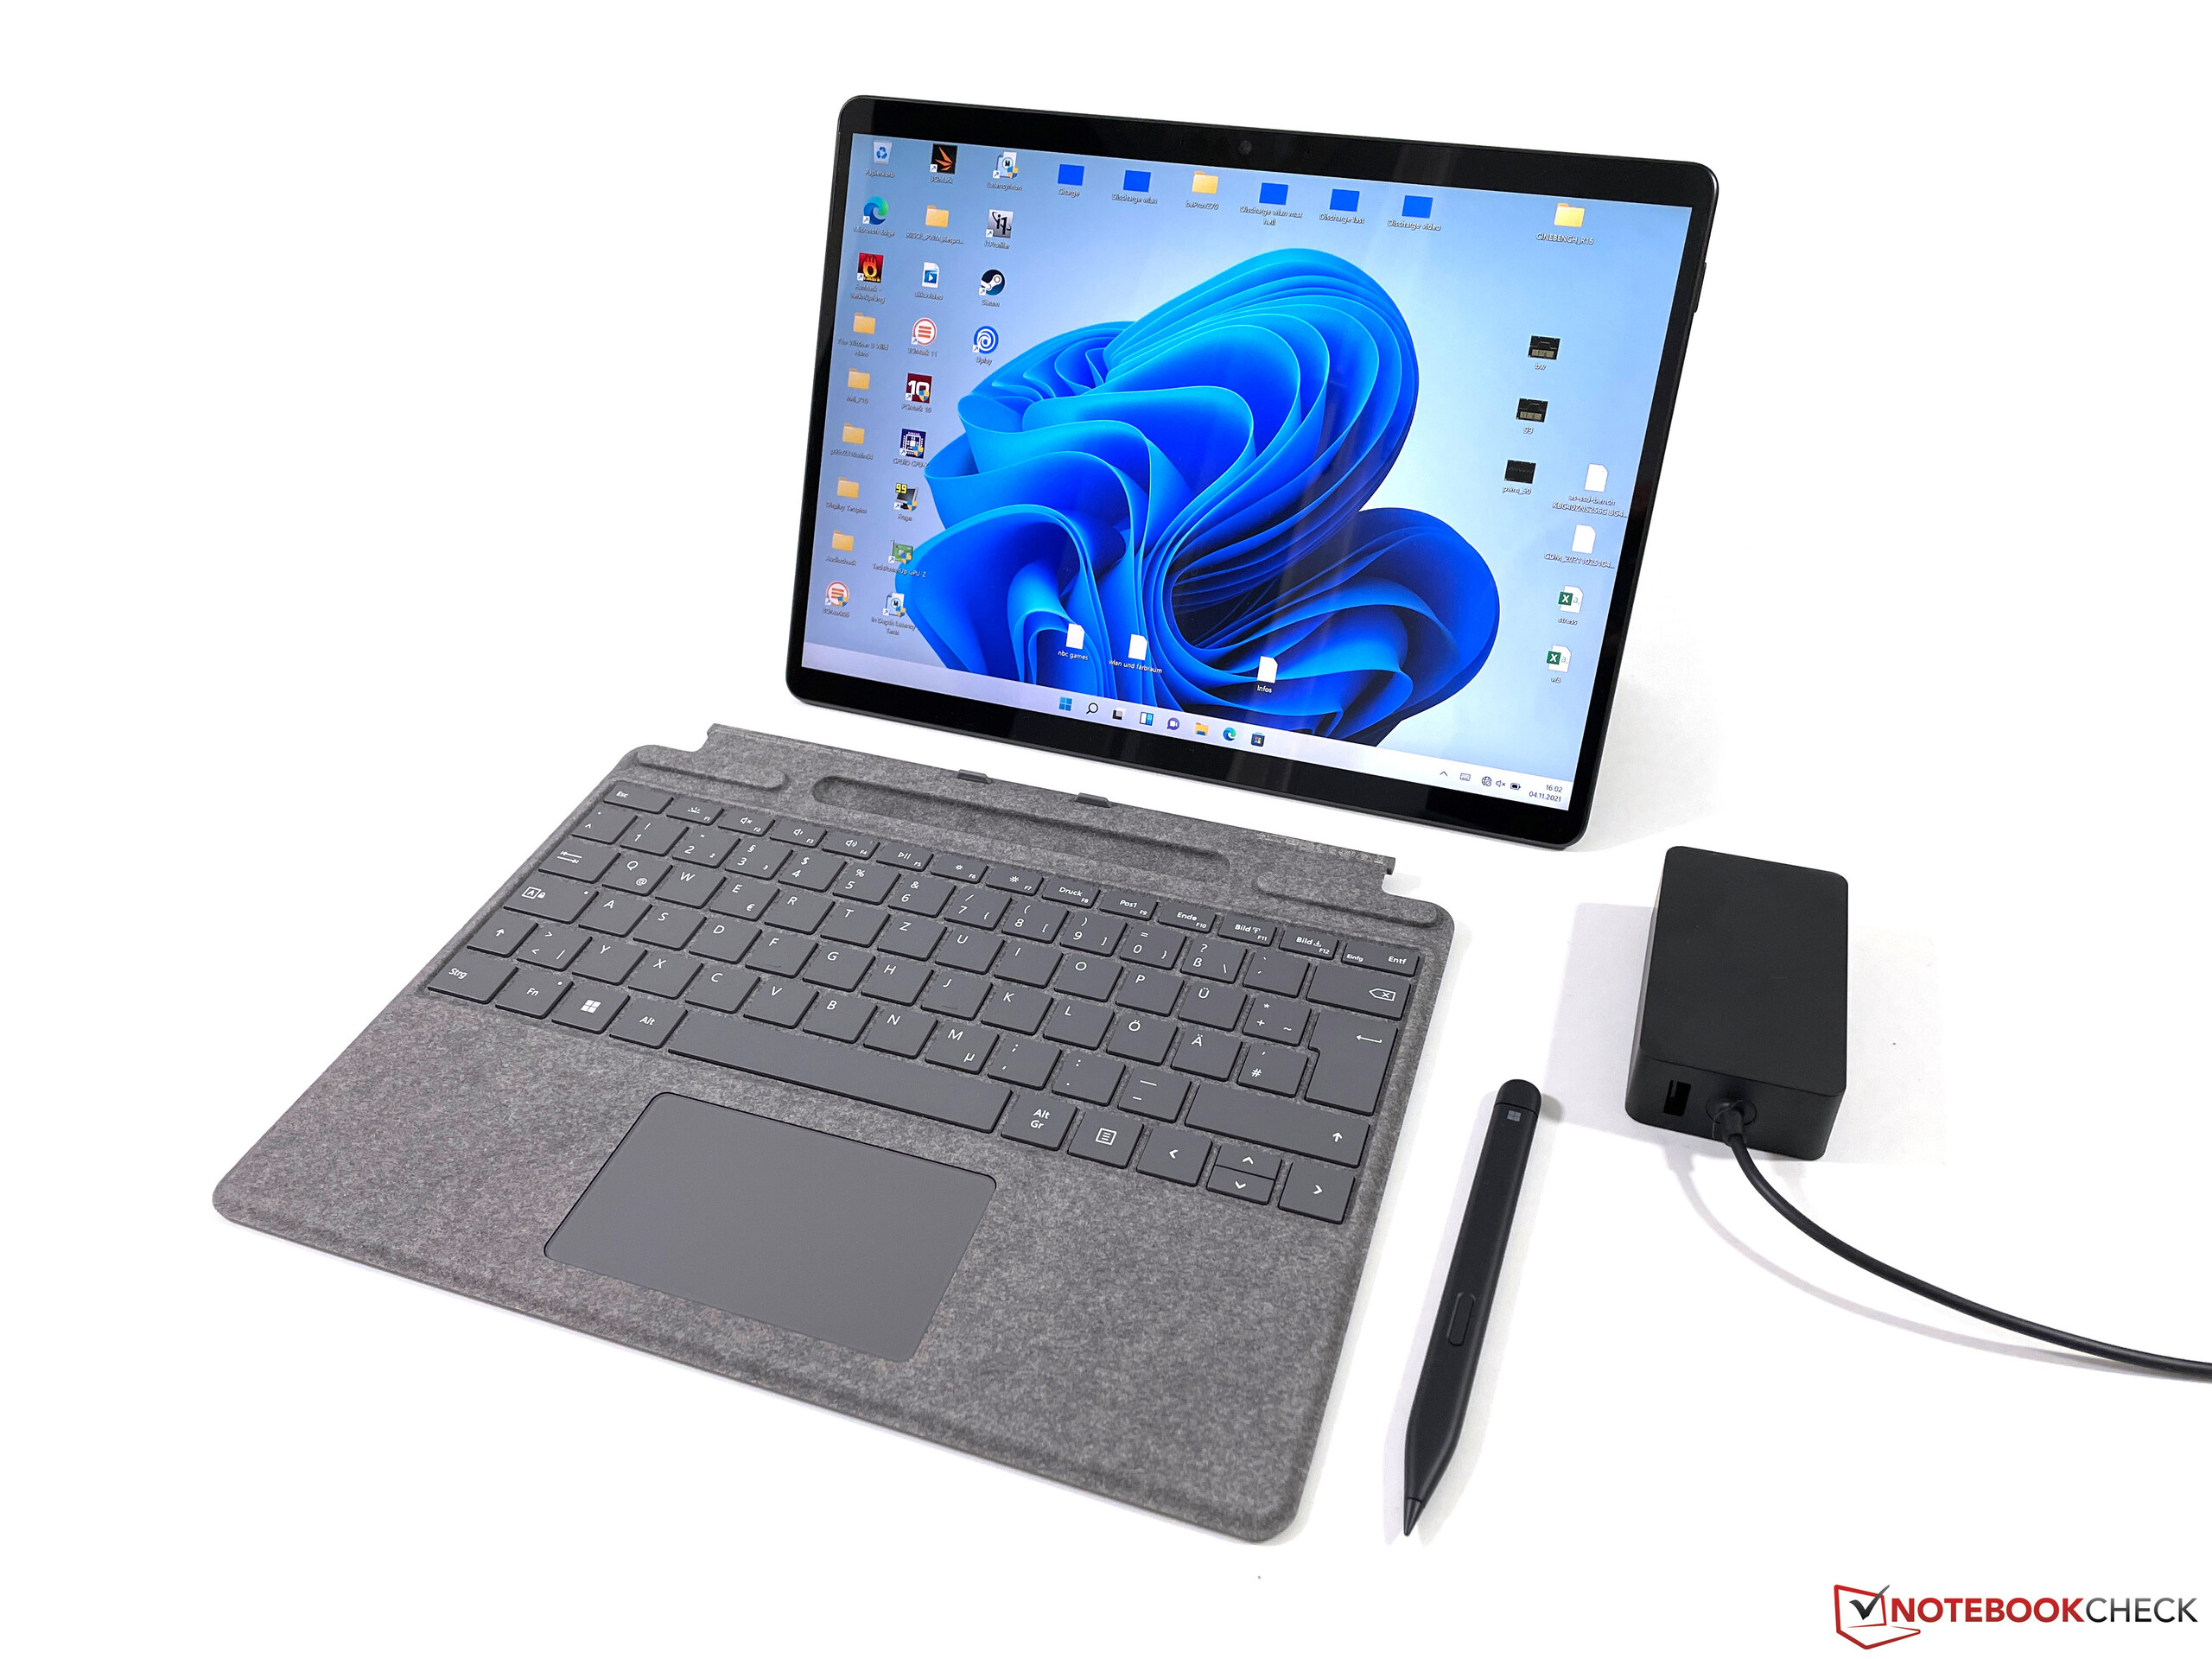
输入设备 - 带超薄笔的签名键盘2
键盘
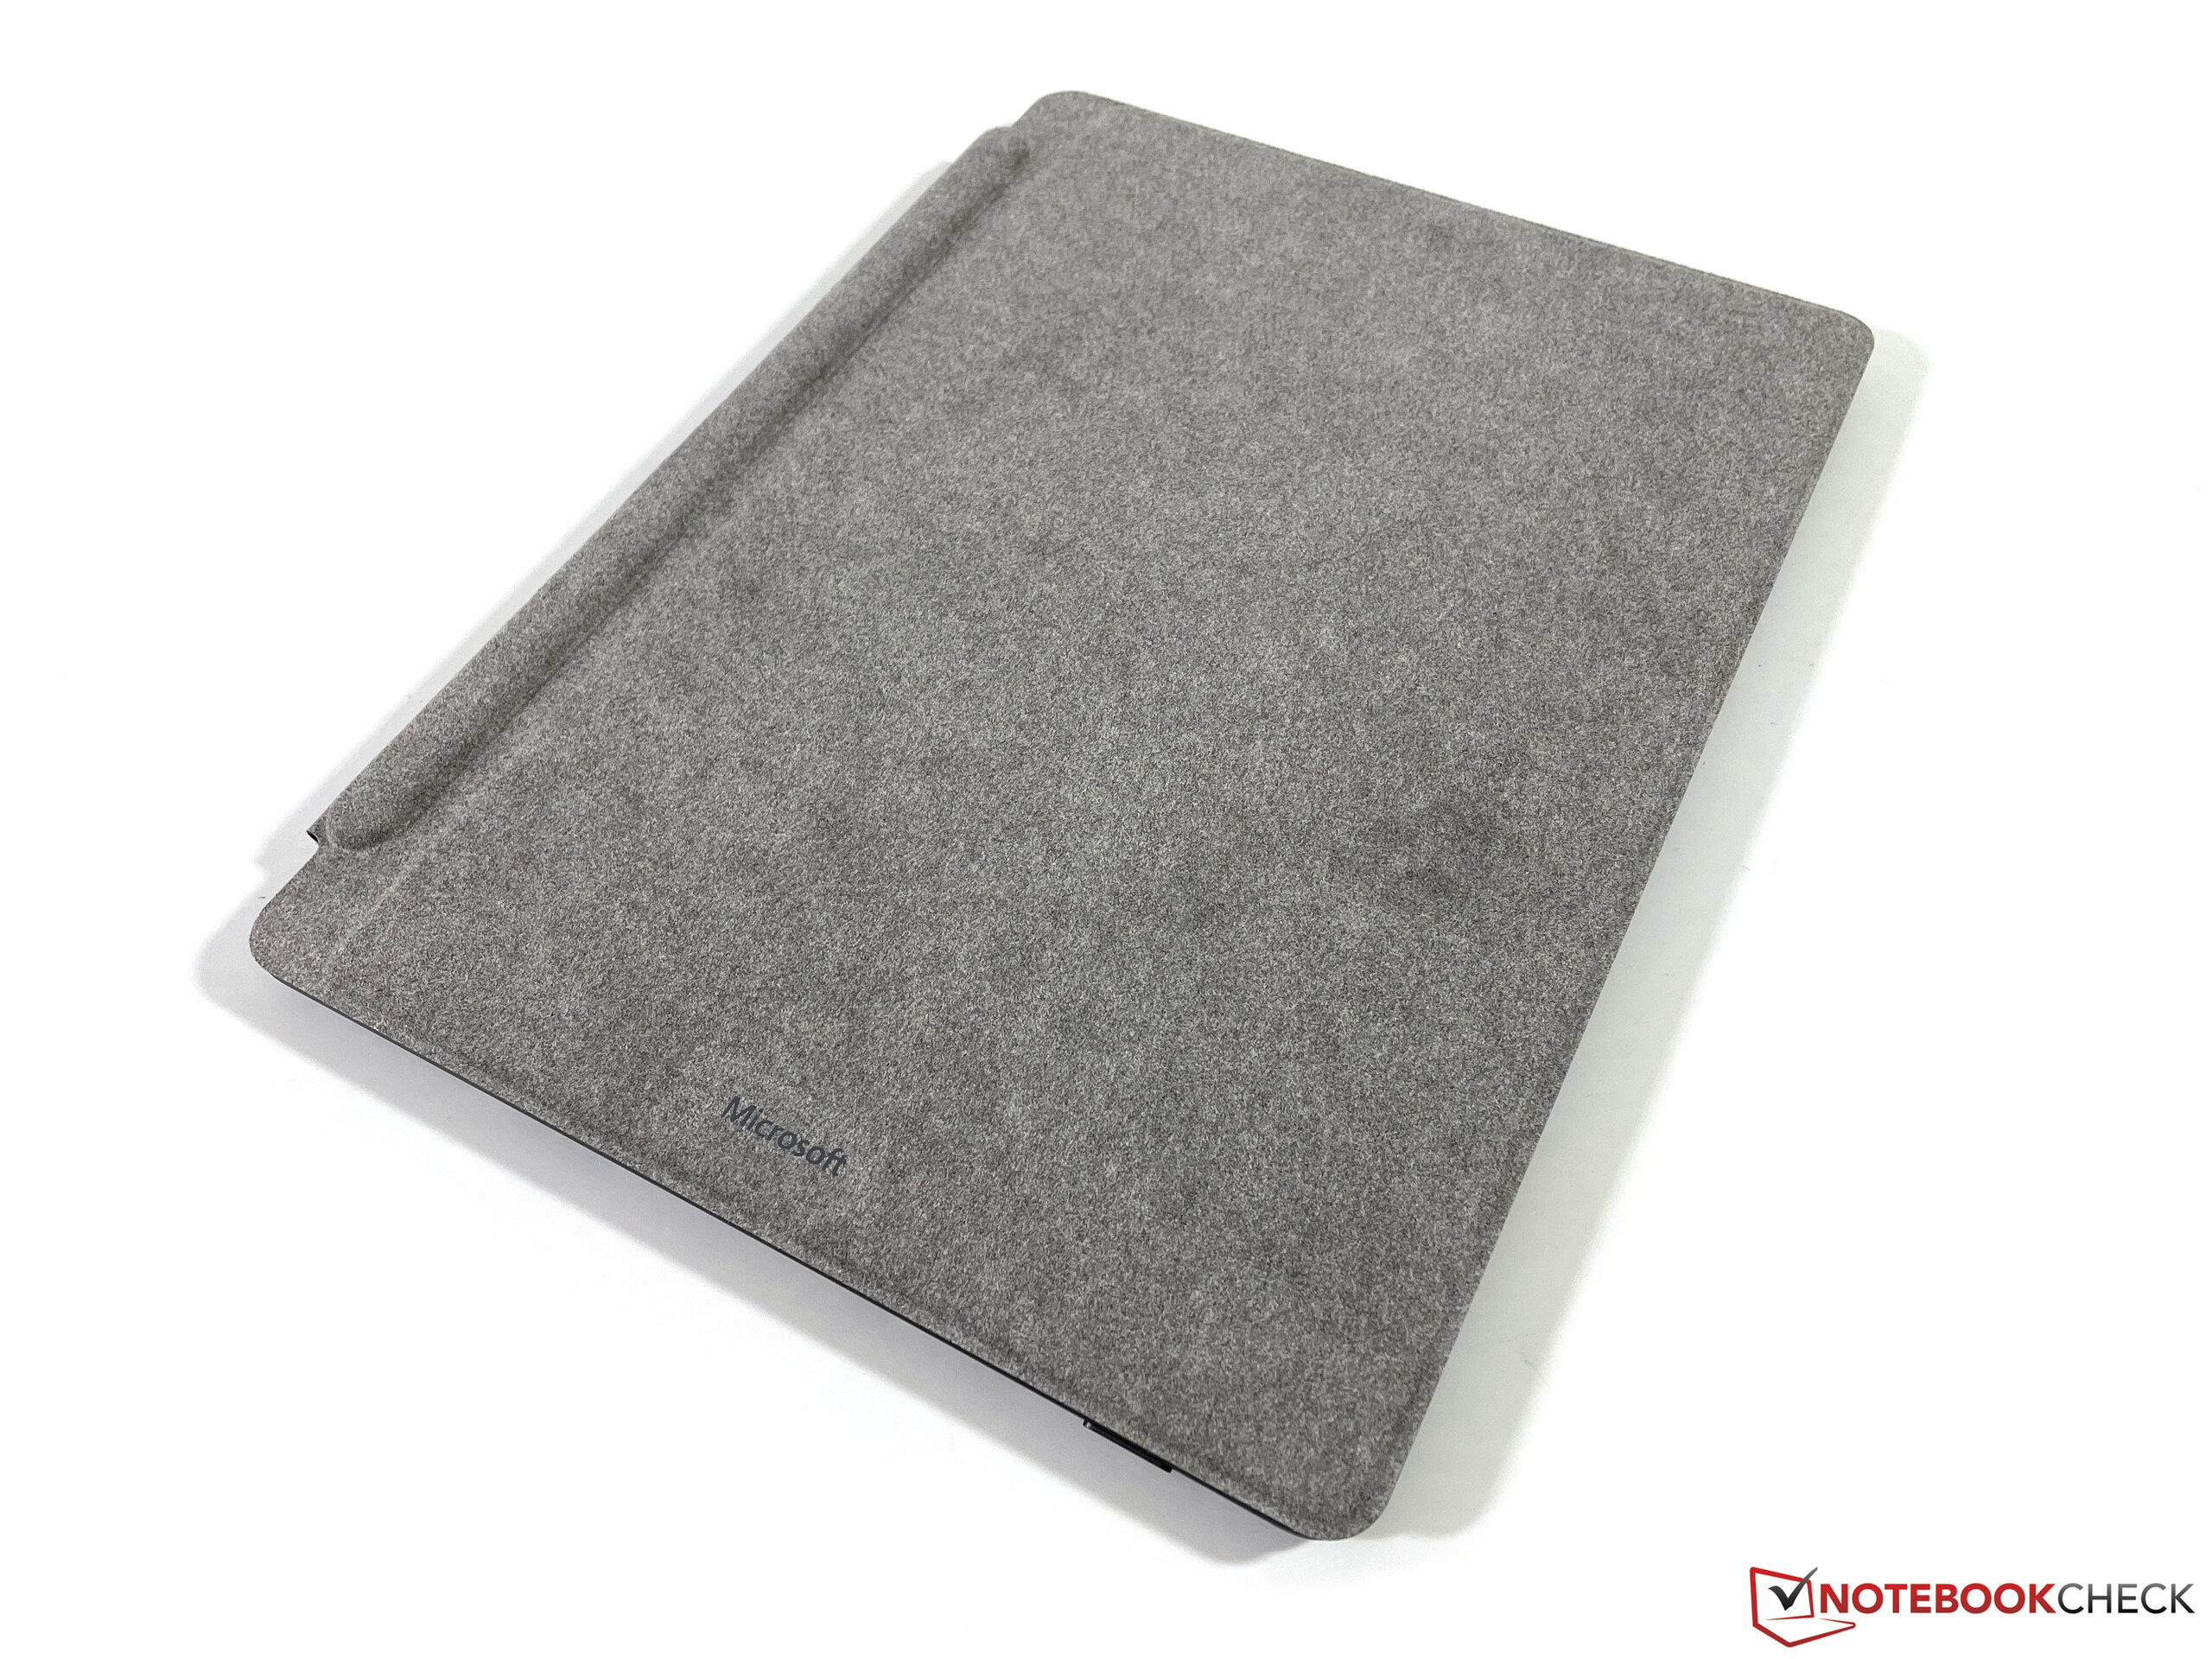
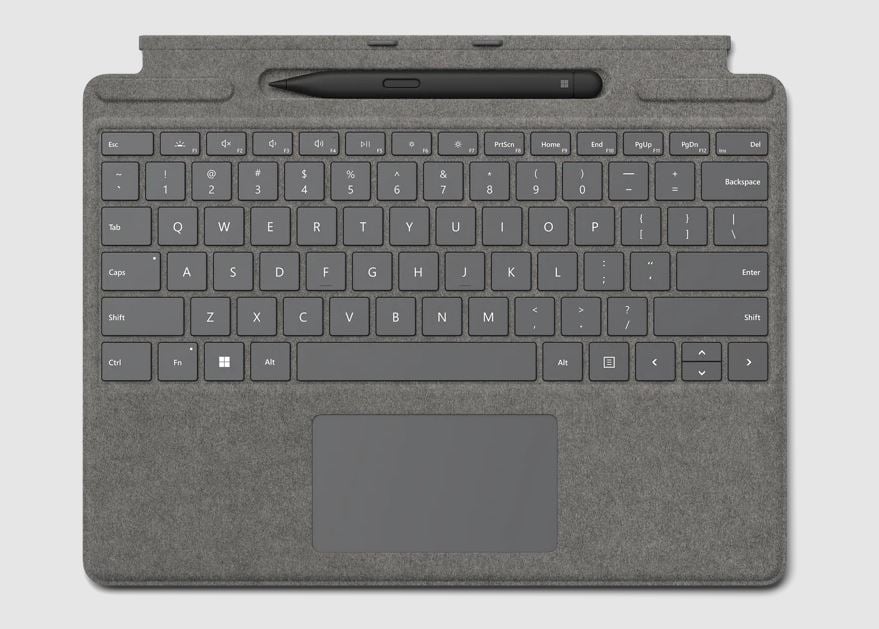
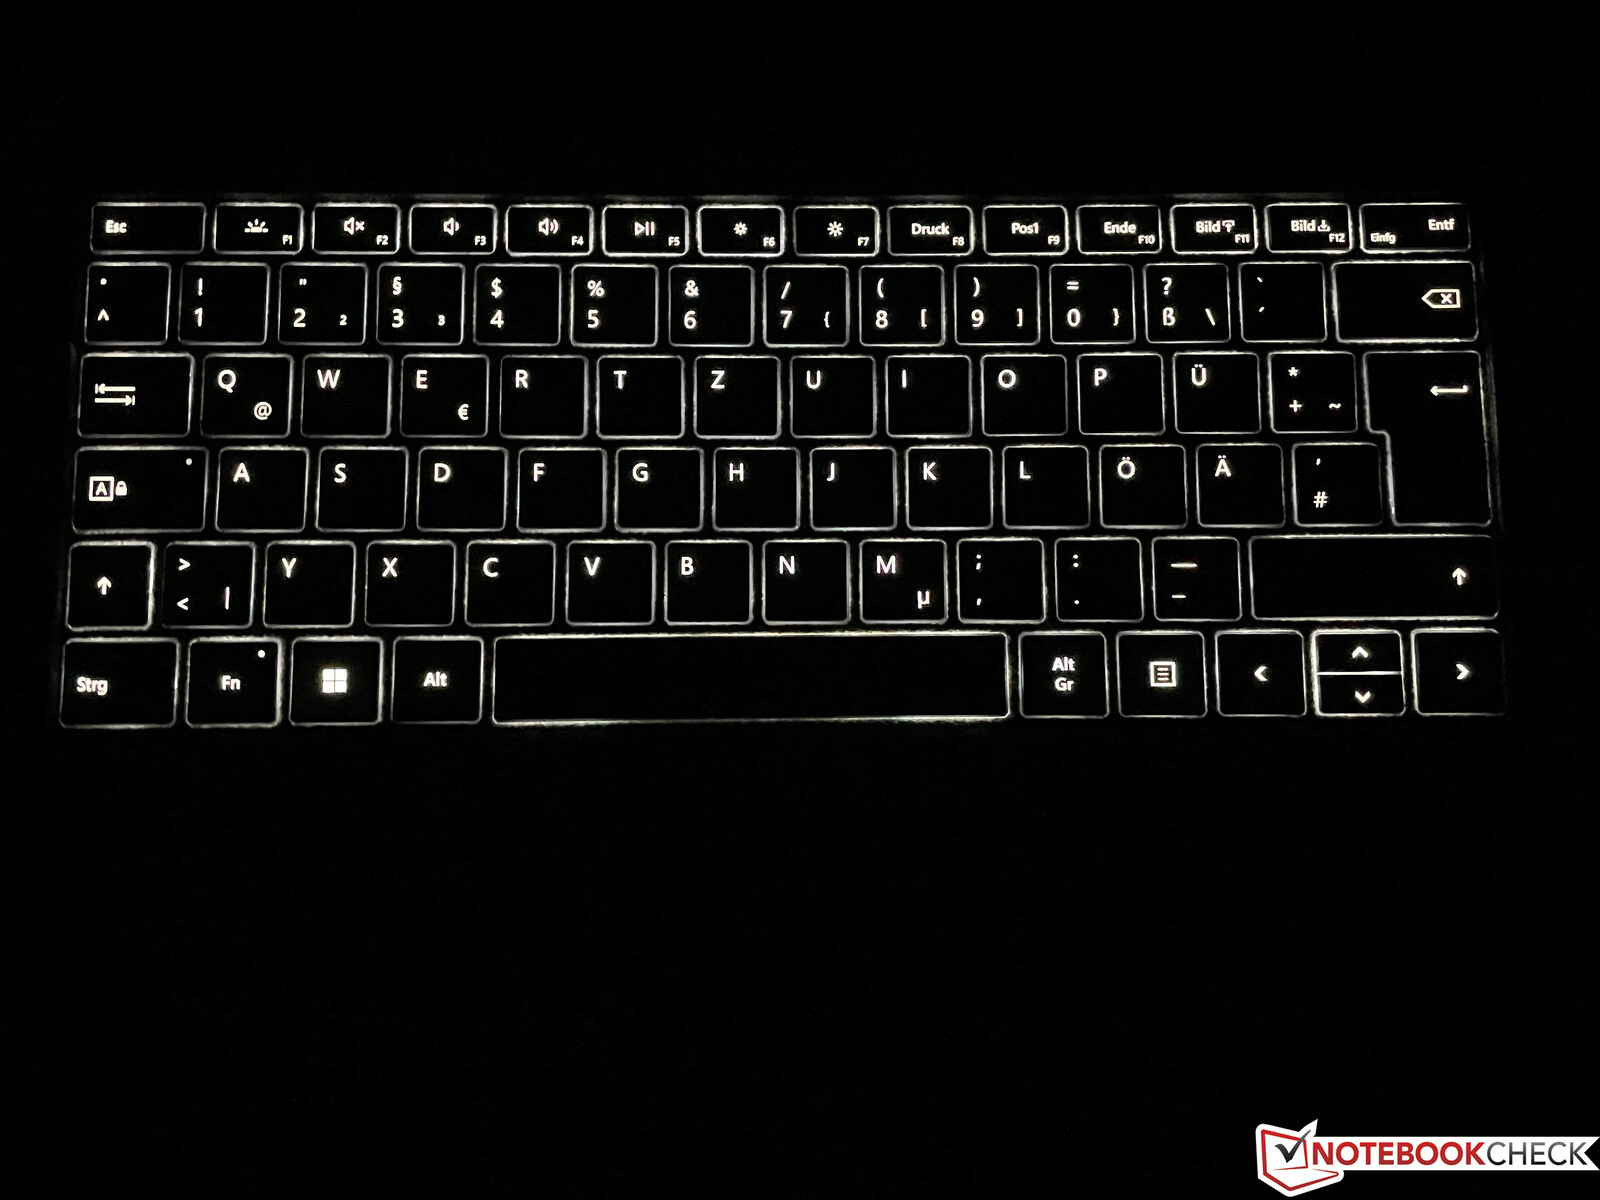
你仍然可以使用以前的Surface型号的键盘盖,但微软现在还提供了带有集成笔盘的Signature键盘,这已经是大家熟悉的了。Surface Pro X.我们的设备是白金色的,但还有更多选择(冰蓝、罂粟红、黑色)。基本单元使用Alcantara,触感非常好。打字体验本身是不错的,但较大的按键会明显发出咔哒声。稳定性也没有普通笔记本电脑好,但几乎所有可连接的键盘都有这个问题。在反馈方面仍有改进的余地,而Surface Go 3的小键盘也是如此。Surface Go 3的小键盘有更清晰的反馈,尽管按键明显更小。白色背景照明有助于在较暗的环境中使用,并提供三个强度级别。
触摸板和超薄笔2
就现代标准而言,ClickPad的空间不是很大,但标准的光标移动是没有问题的。只有点击的声音太大。在大型电容式触摸屏上做手势要容易得多,工作起来毫无瑕疵。
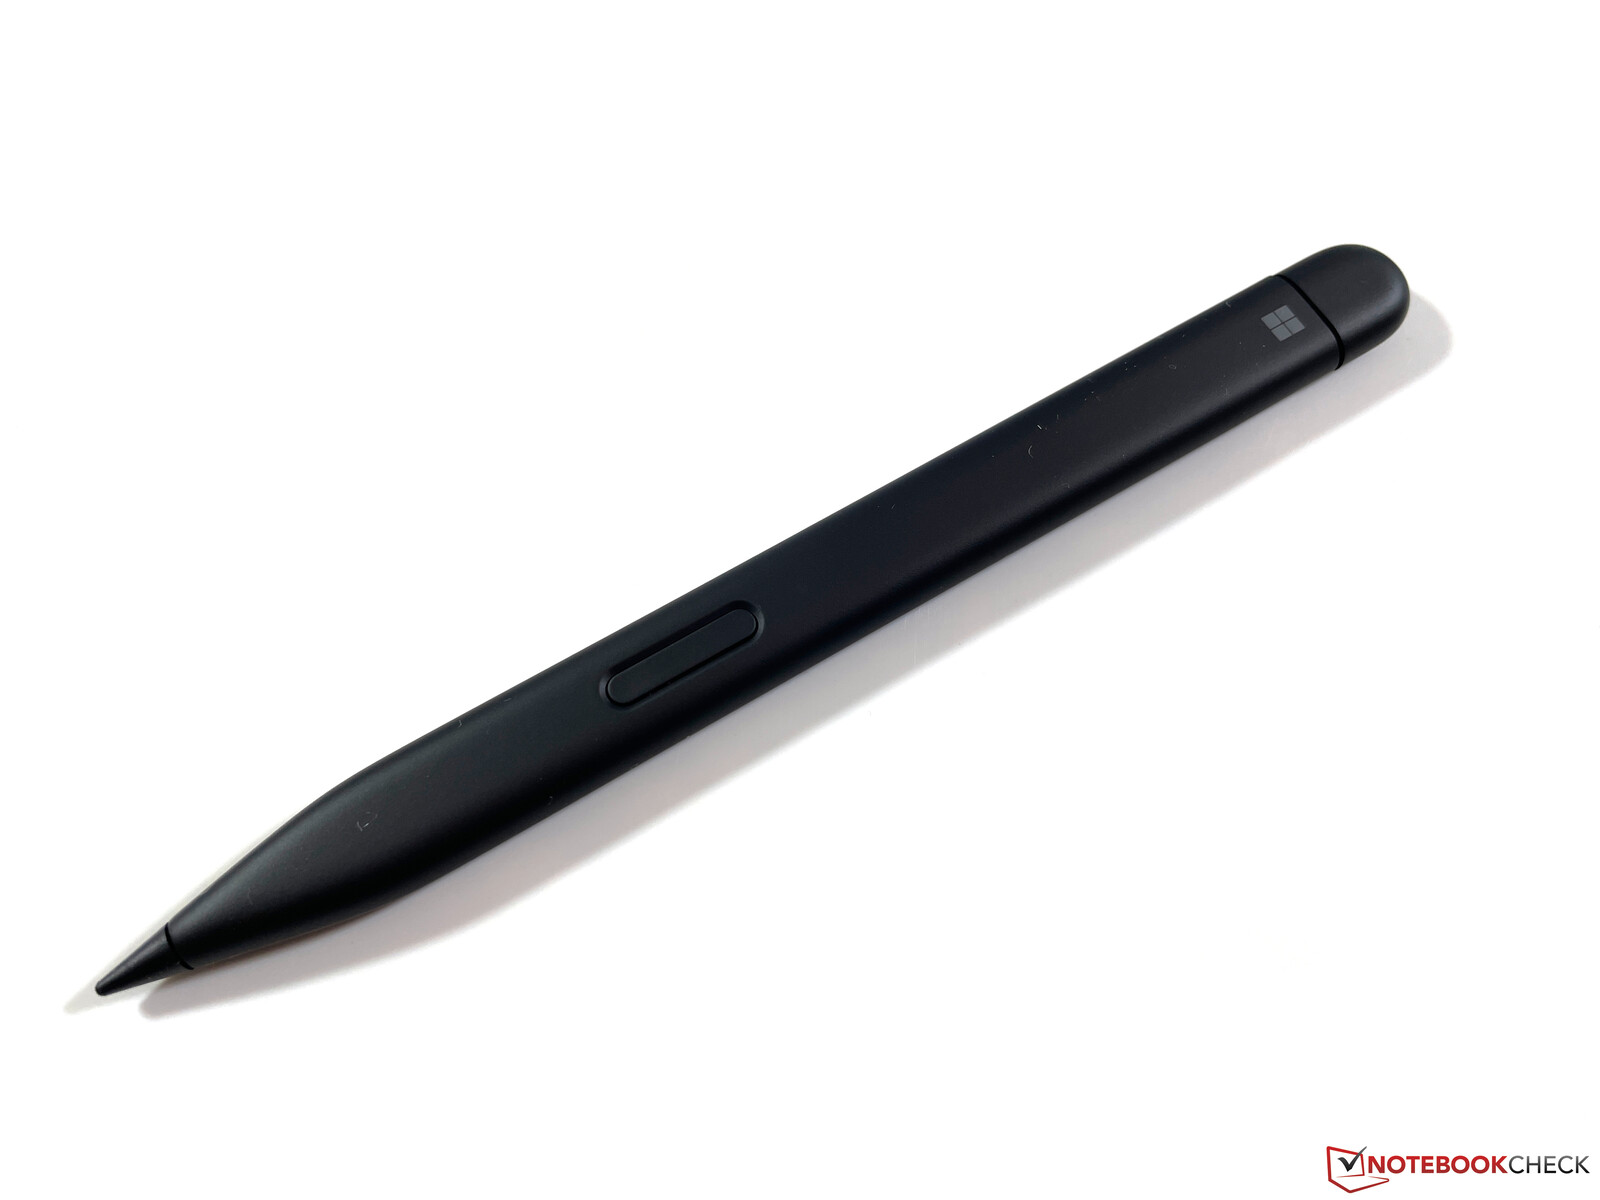
瘦身笔或新的瘦身笔2,分别可以存放在键盘上方的托盘中。它还可以自动充电,这非常方便。笔本身只有6.3毫米的平面,一开始感觉很不舒服,它不能与圆形笔相比。它支持4096个压力级别,结合Windows应用程序,Surface Pro 8上的某些应用程序支持触觉反馈,效果不错。我们在书写时可以注意到一个小的滞后,但这几乎不是一个问题。这支笔对于偶尔的笔记来说完全没有问题,但对于长篇文字来说,它就是不大符合人体工程学。
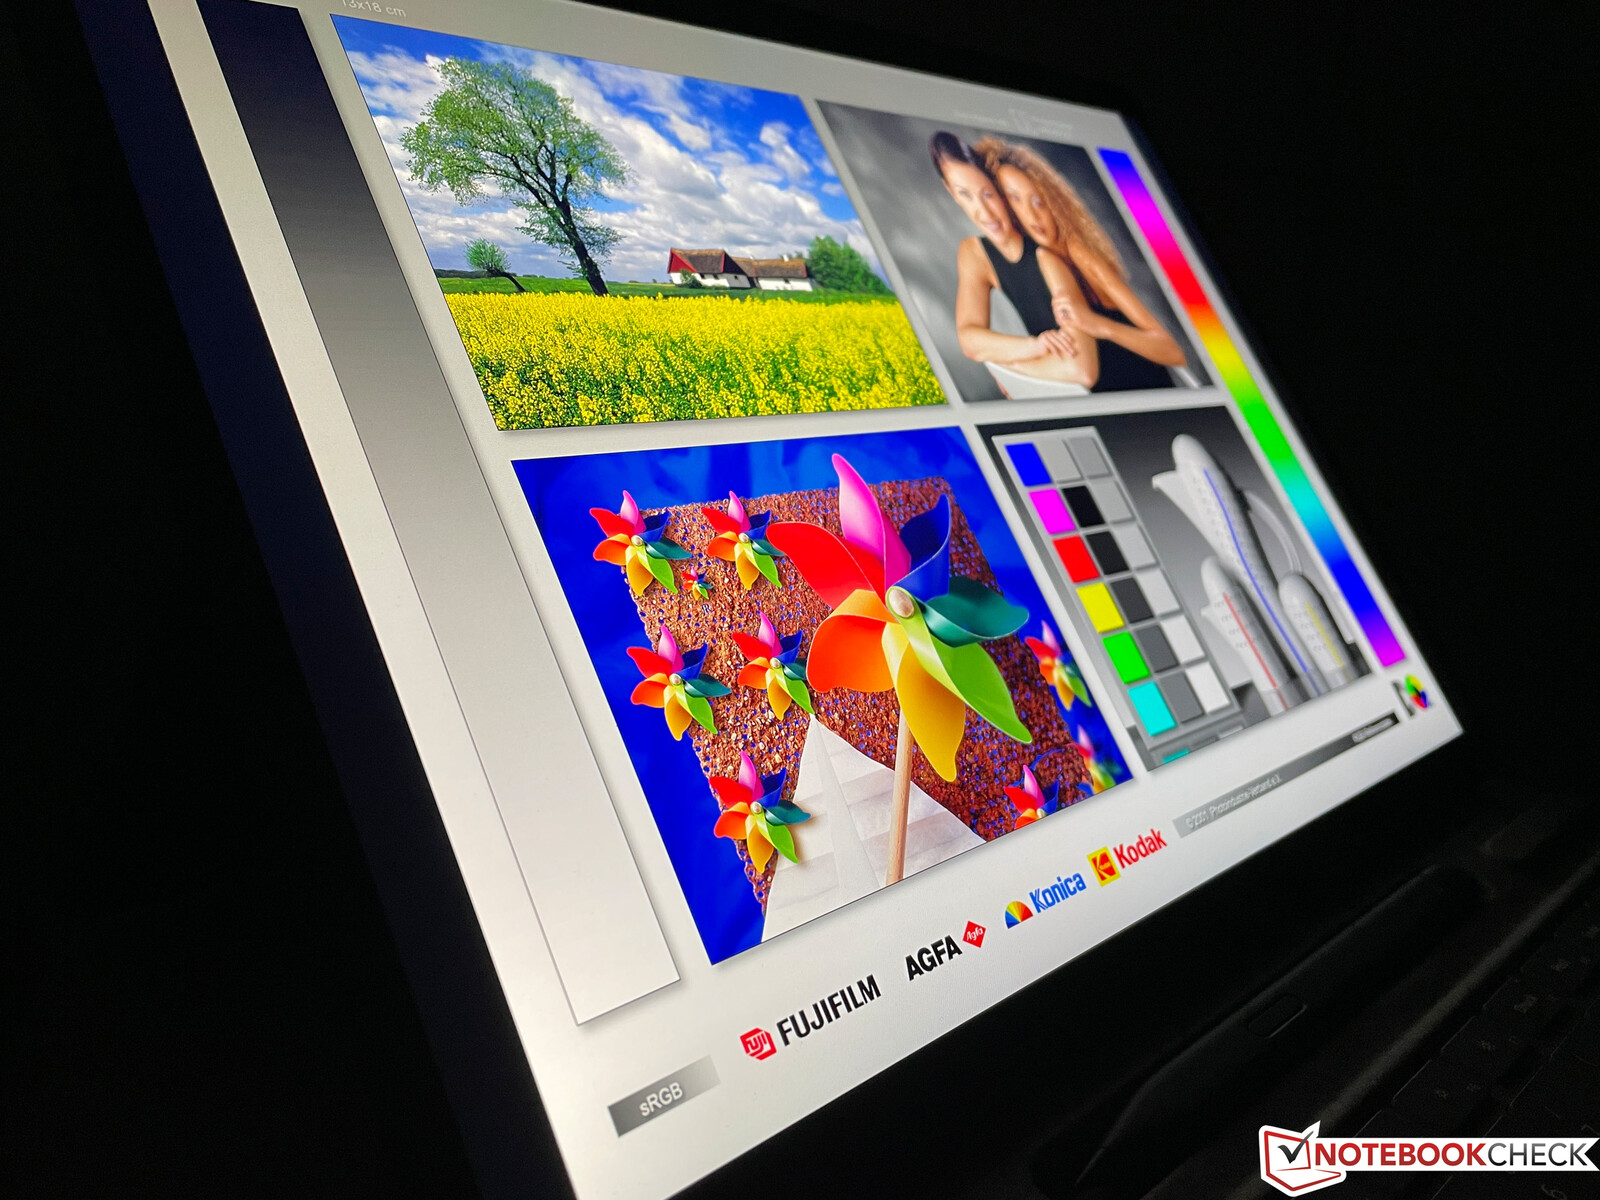
显示屏 - 微软将其设置为13英寸,120赫兹
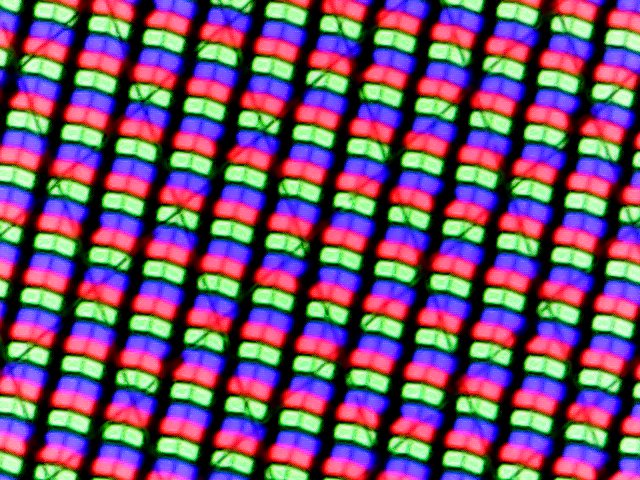
新的13英寸IPS屏幕(长宽比3:2)现在的分辨率比以前略高。2880 x 1920像素创造了非常清晰的图像,主观的画面印象非常好。虽然对比度不是很高,略高于1000:1。亮度略高(平均为451尼特),相比之下亮度略高(平均451尼特)。,但黑值更差,为0.43。
该面板支持120赫兹的刷新率,但你必须在设置中激活它。它在子菜单中有点隐藏,所以一些用户可能永远不会使用120赫兹模式。这是不幸的,因为它创造了明显更平滑的图片,也减少了一些重影,所以我们建议一直使用它,至少在主电源上使用,因为它增加了电力消耗。
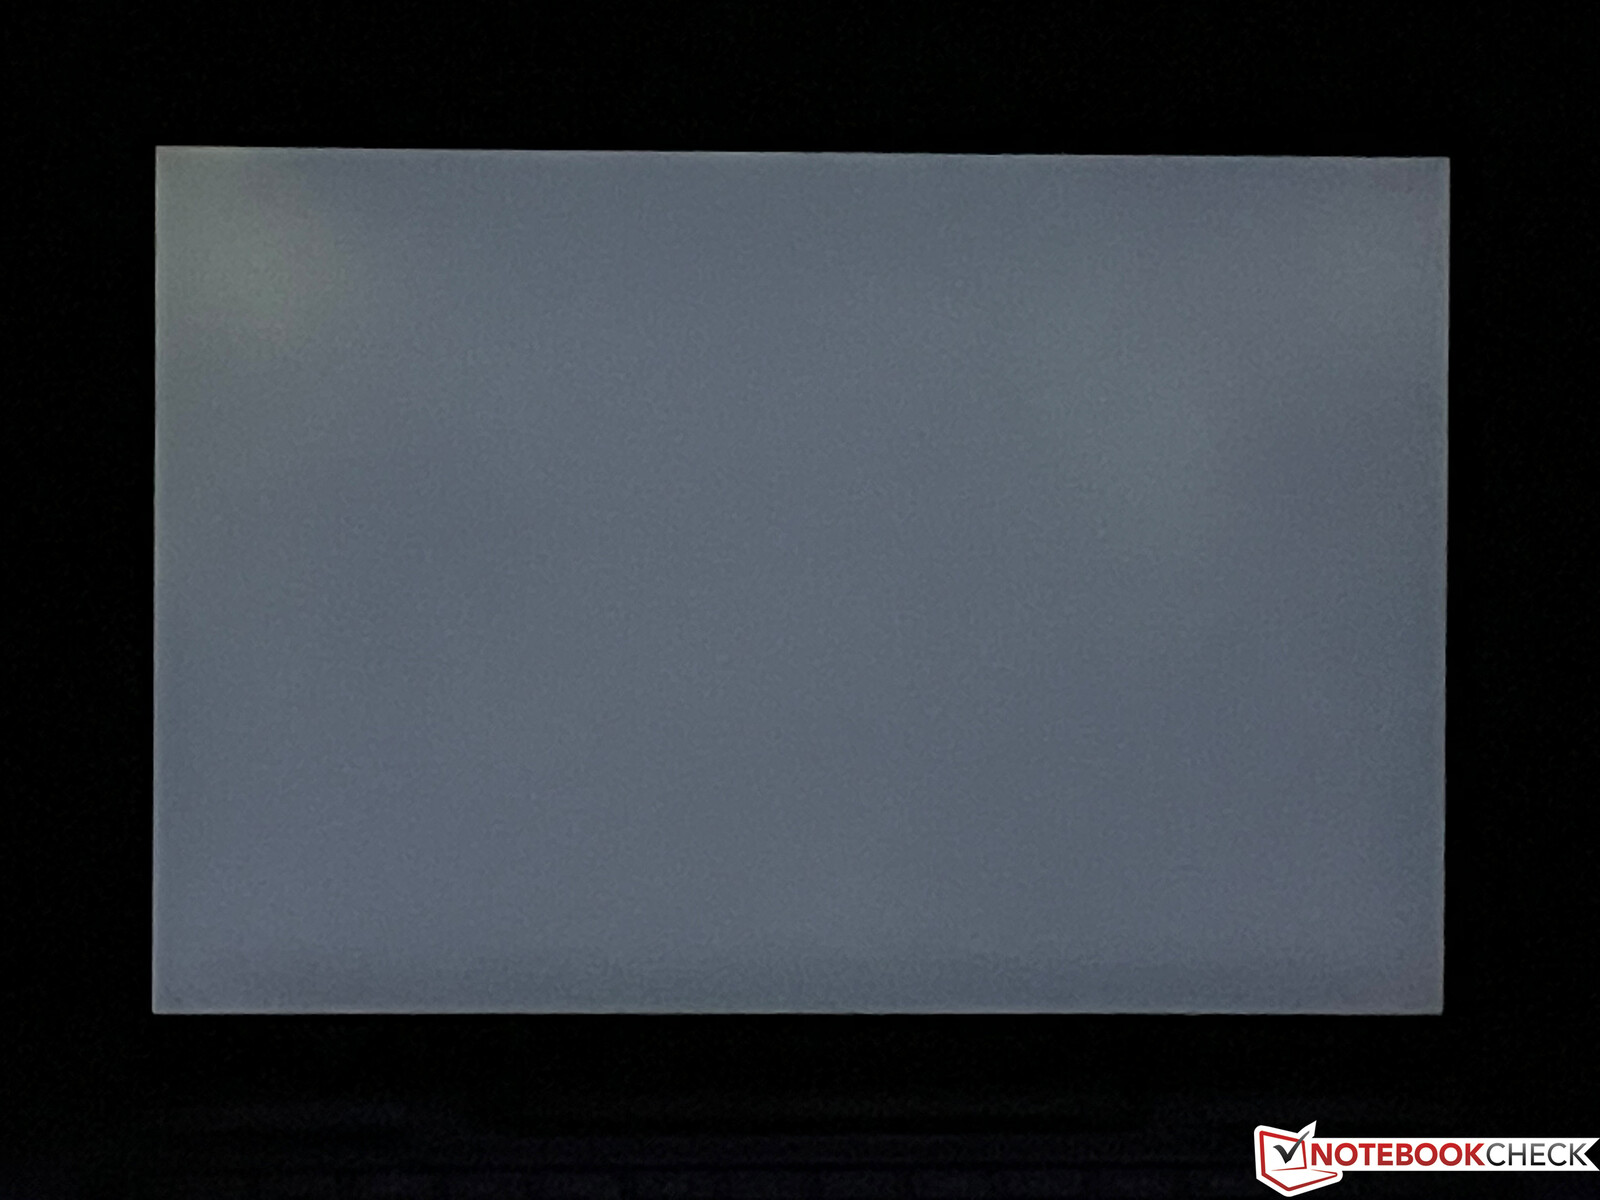
PWM行为也发生了变化。虽然Surface Pro 7 Plus的显示屏Surface Pro 7 Plus在200赫兹左右闪烁,而在新的Surface Pro 8上,我们可以测量到一个非常高的频率,几乎是30千赫兹,这对大多数用户来说应该不会造成任何限制。背光渗漏也不是一个大问题,只有在最大亮度和黑暗背景下的上角有明显的亮点。
由于集成了亮度传感器,显示屏亮度以及色温(与Apple"True Tone "相当)都可以自动调整,效果不错。
| |||||||||||||||||||||||||
Brightness Distribution: 91 %
Center on Battery: 446 cd/m²
Contrast: 1033:1 (Black: 0.43 cd/m²)
ΔE ColorChecker Calman: 2 | ∀{0.5-29.43 Ø4.71}
calibrated: 1.7
ΔE Greyscale Calman: 1.8 | ∀{0.09-98 Ø4.96}
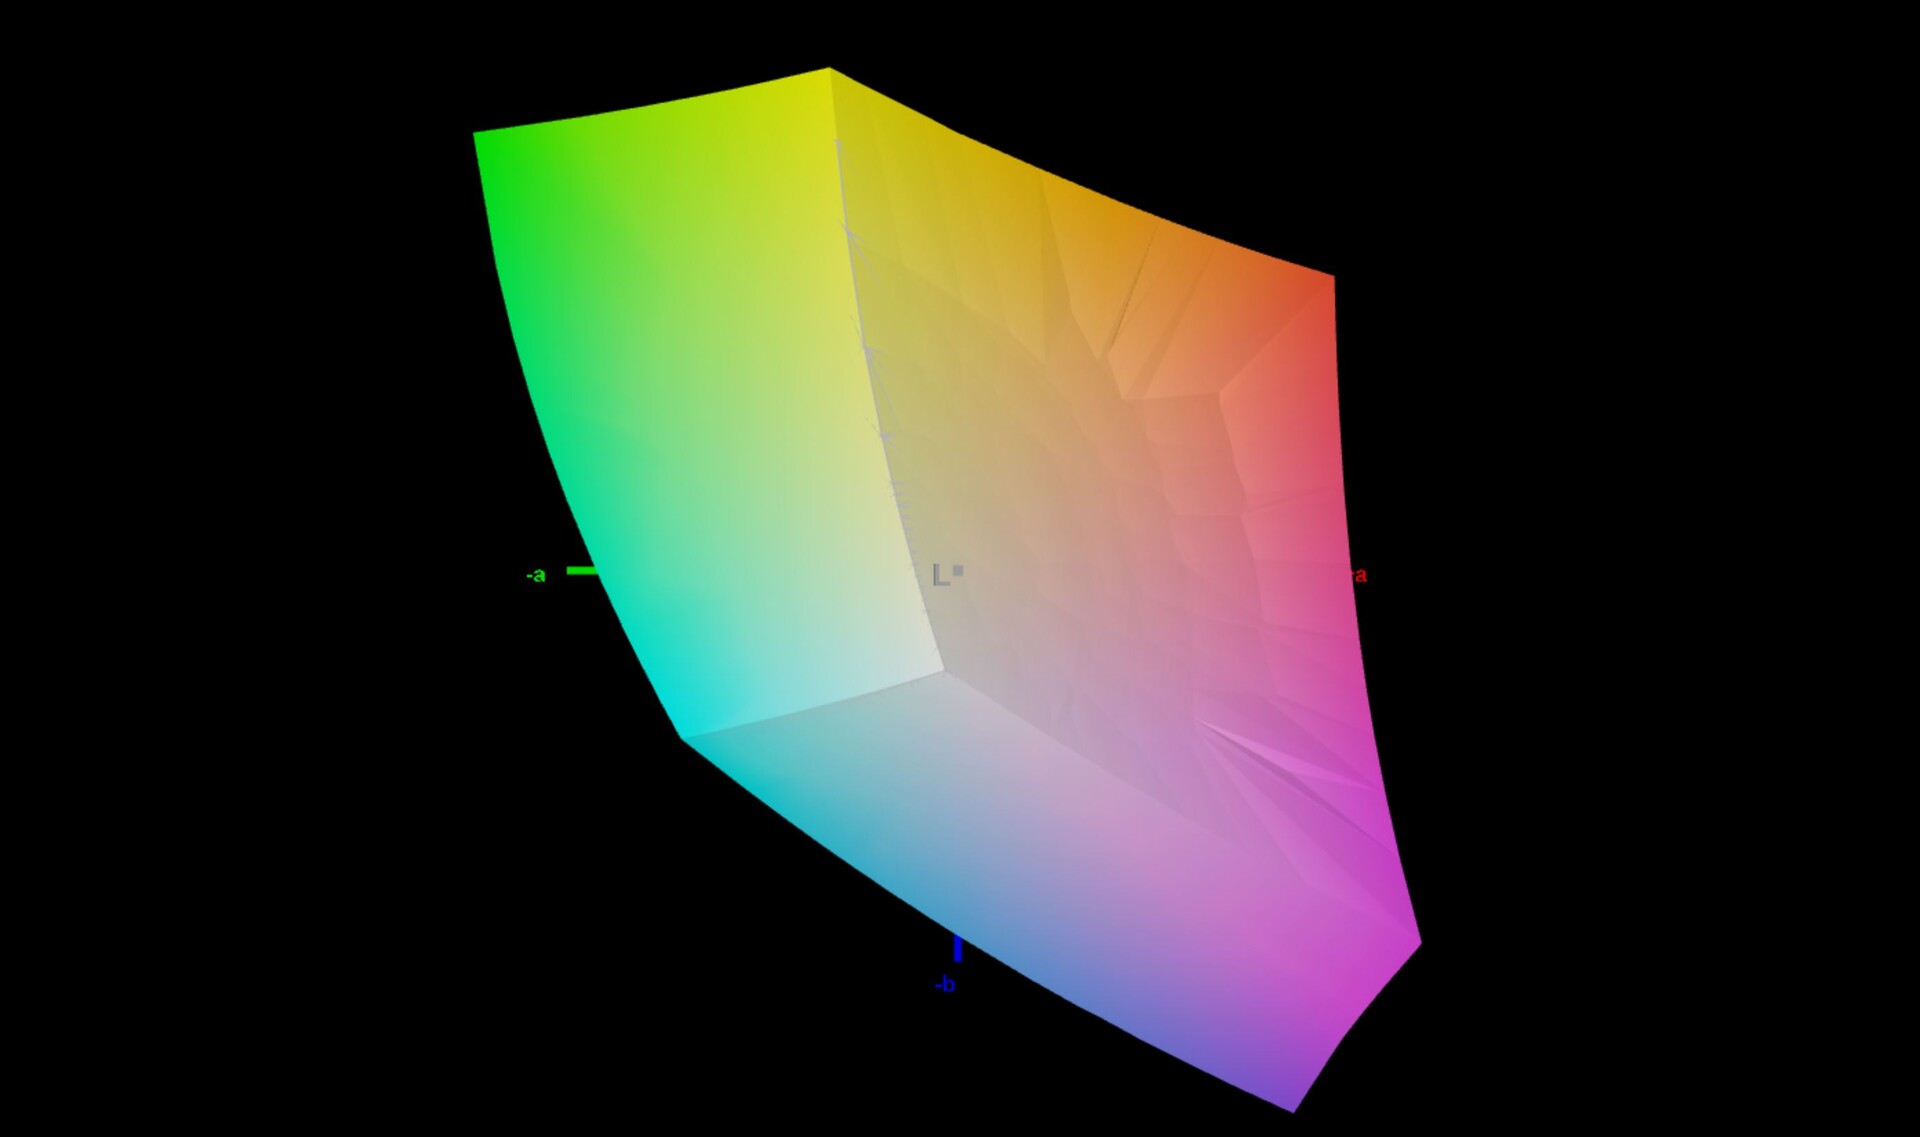
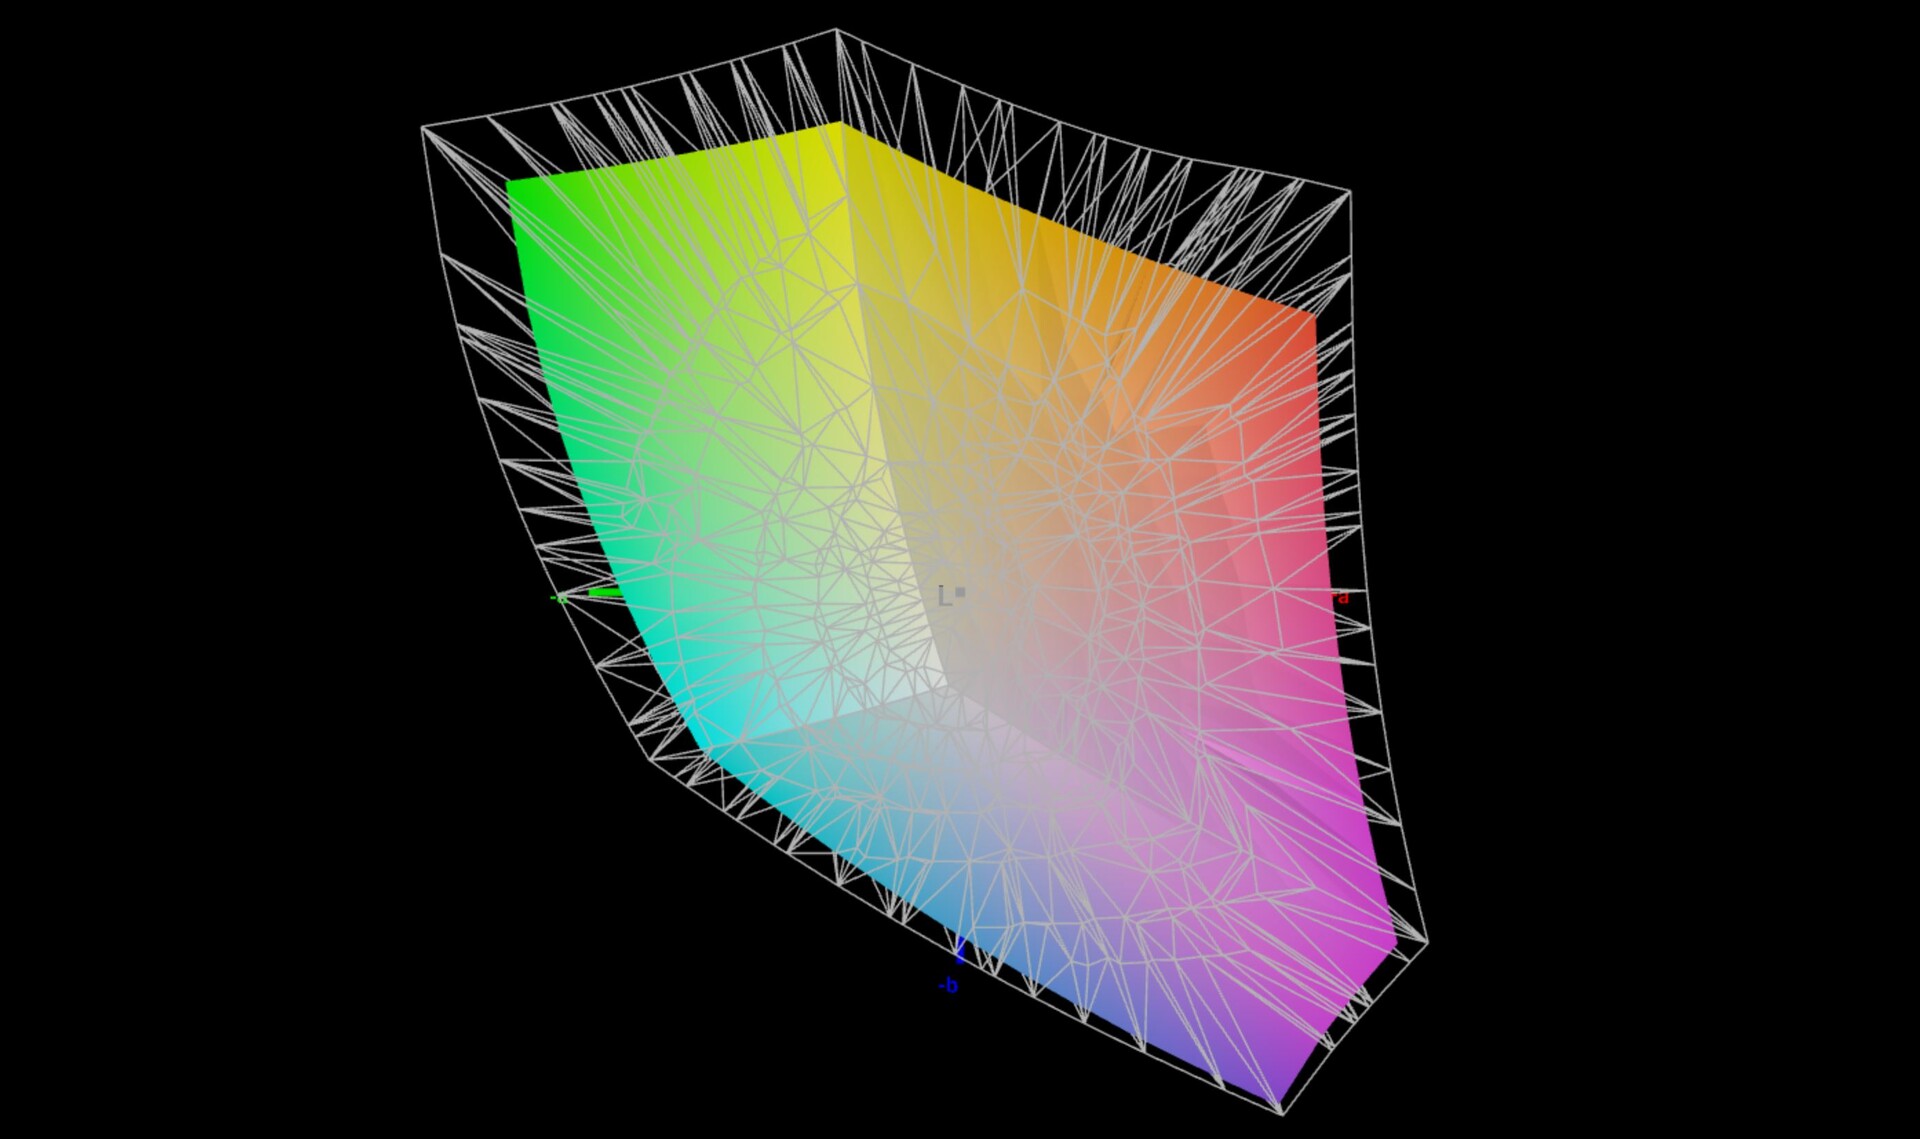
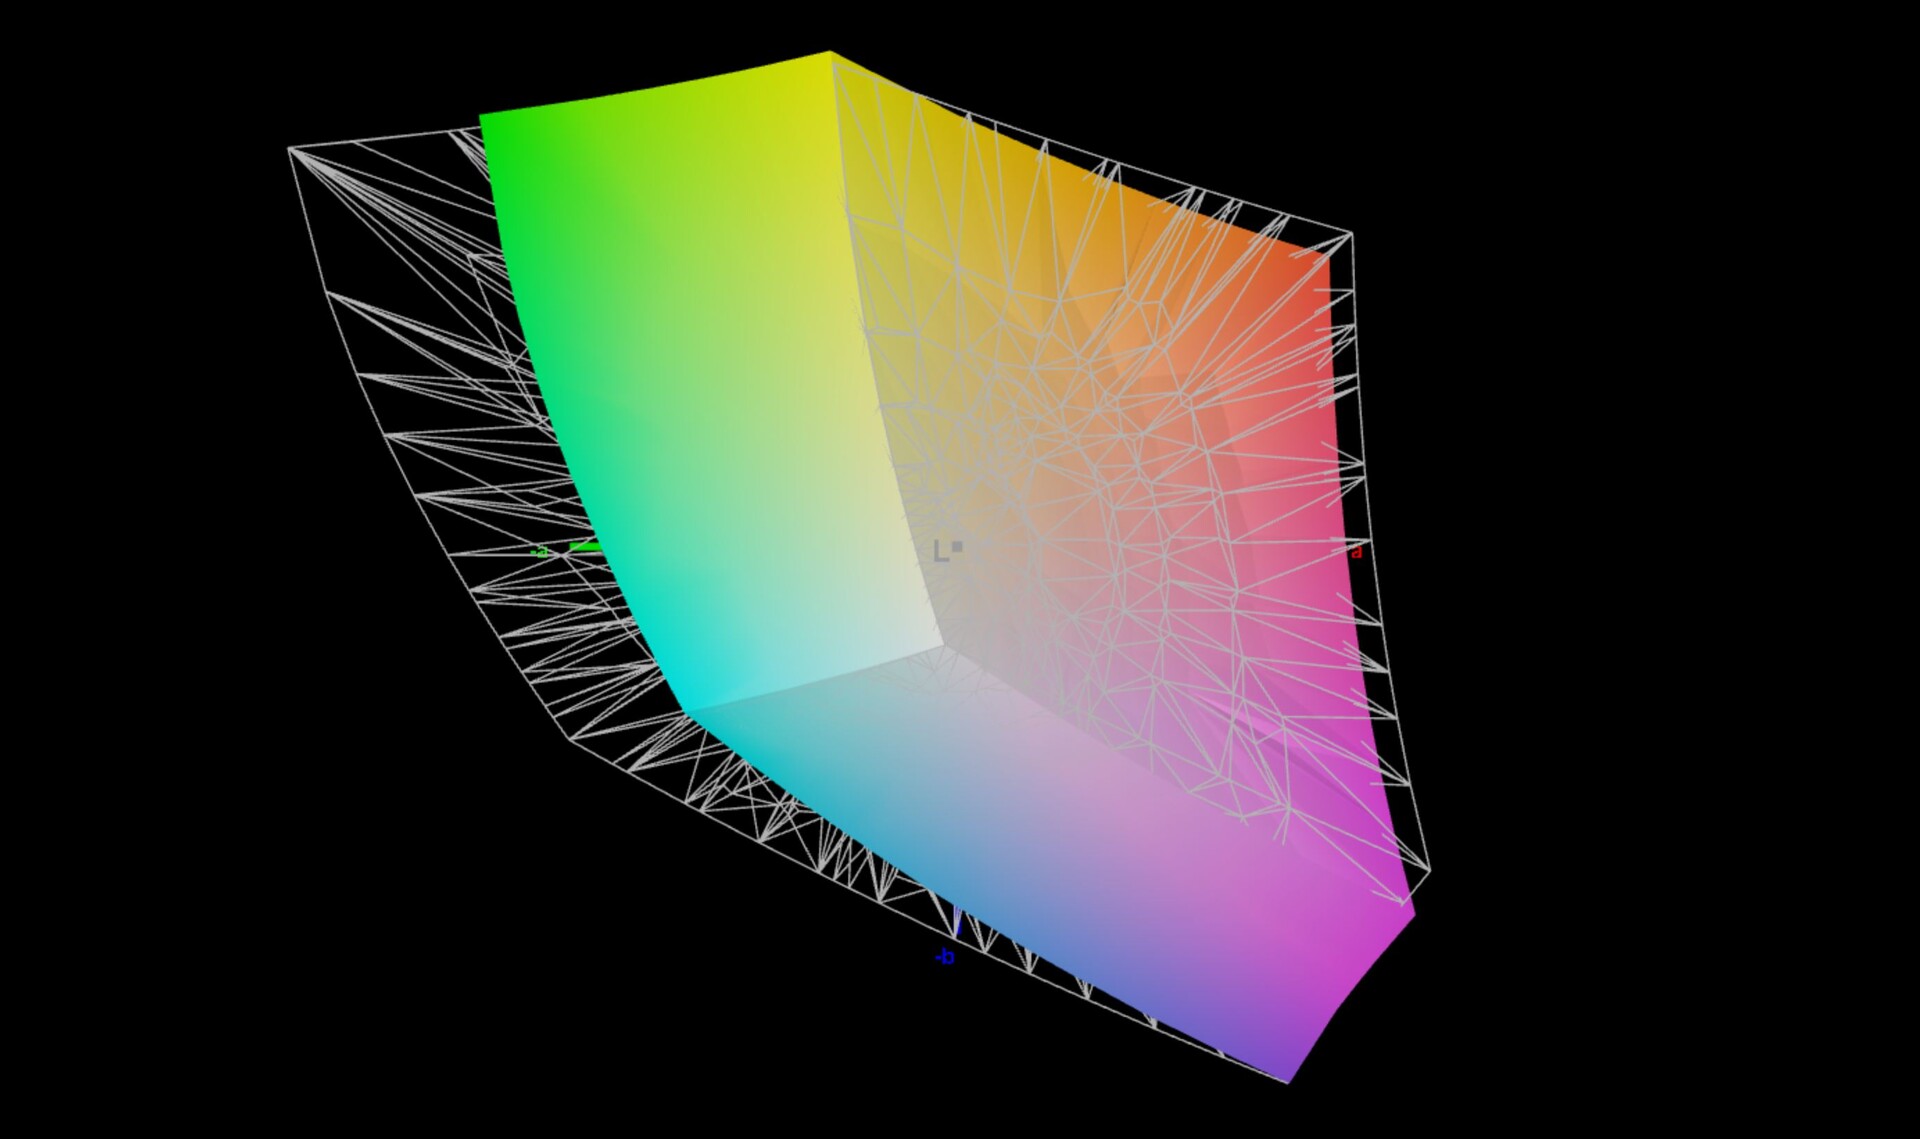
77.6% AdobeRGB 1998 (Argyll 3D)
100% sRGB (Argyll 3D)
78.2% Display P3 (Argyll 3D)
Gamma: 2.11
CCT: 6417 K
| Microsoft Surface Pro 8, i7-1185G7 LP129WT212166, IPS, 2880x1920, 13" | Lenovo ThinkPad X12 20UVS03G00 N123NCA-GS1, a-Si IPS LED, 1920x1280, 12.3" | Dell Latitude 13 7320 Detachable, i7-1180G7 Sharp LQ130N1, IPS, 1920x1280, 13" | Apple iPad Pro 12.9 2021 A2378 Liquid Retina XDR, IPS mini-LED, 2732x2048, 12.9" | Microsoft Surface Pro 7 Plus LG Philips LP123WQ332684, IPS, 2736x1824, 12.3" | |
|---|---|---|---|---|---|
| Display | -9% | 1% | -7% | -9% | |
| Display P3 Coverage (%) | 78.2 | 67 -14% | 79.5 2% | 68.7 -12% | 66.9 -14% |
| sRGB Coverage (%) | 100 | 99.2 -1% | 100 0% | 99.9 0% | 96.7 -3% |
| AdobeRGB 1998 Coverage (%) | 77.6 | 68.8 -11% | 78.4 1% | 70.5 -9% | 69.1 -11% |
| Response Times | -46% | -28% | -40% | -27% | |
| Response Time Grey 50% / Grey 80% * (ms) | 46.4 ? | 63.2 ? -36% | 53.2 ? -15% | 40 ? 14% | 50.8 ? -9% |
| Response Time Black / White * (ms) | 23.2 ? | 36 ? -55% | 32.8 ? -41% | 45 ? -94% | 33.6 ? -45% |
| PWM Frequency (Hz) | 29760 ? | 2451 ? | 19190 ? | 199.2 ? | |
| Screen | 30% | -25% | -6% | 10% | |
| Brightness middle (cd/m²) | 444 | 419 -6% | 521.8 18% | 620 40% | 408 -8% |
| Brightness (cd/m²) | 451 | 406 -10% | 504 12% | 612 36% | 425 -6% |
| Brightness Distribution (%) | 91 | 94 3% | 93 2% | 96 5% | 85 -7% |
| Black Level * (cd/m²) | 0.43 | 0.23 47% | 0.35 19% | 0.34 21% | |
| Contrast (:1) | 1033 | 1822 76% | 1491 44% | 1200 16% | |
| Colorchecker dE 2000 * | 2 | 1.1 45% | 3.83 -92% | 1.8 10% | 1.5 25% |
| Colorchecker dE 2000 max. * | 3.2 | 2.2 31% | 5.51 -72% | 4.9 -53% | 2.5 22% |
| Colorchecker dE 2000 calibrated * | 1.7 | 0.5 71% | 1.97 -16% | 1.4 18% | |
| Greyscale dE 2000 * | 1.8 | 1.5 17% | 4.4 -144% | 3.1 -72% | 1.6 11% |
| Gamma | 2.11 104% | 2.06 107% | 2.02 109% | 2214 0% | 2.05 107% |
| CCT | 6417 101% | 6524 100% | 6494 100% | 6892 94% | 6432 101% |
| Color Space (Percent of AdobeRGB 1998) (%) | 62.8 | 63.7 | |||
| Color Space (Percent of sRGB) (%) | 99.2 | 96.8 | |||
| Total Average (Program / Settings) | -8% /
11% | -17% /
-20% | -18% /
-12% | -9% /
1% |
* ... smaller is better
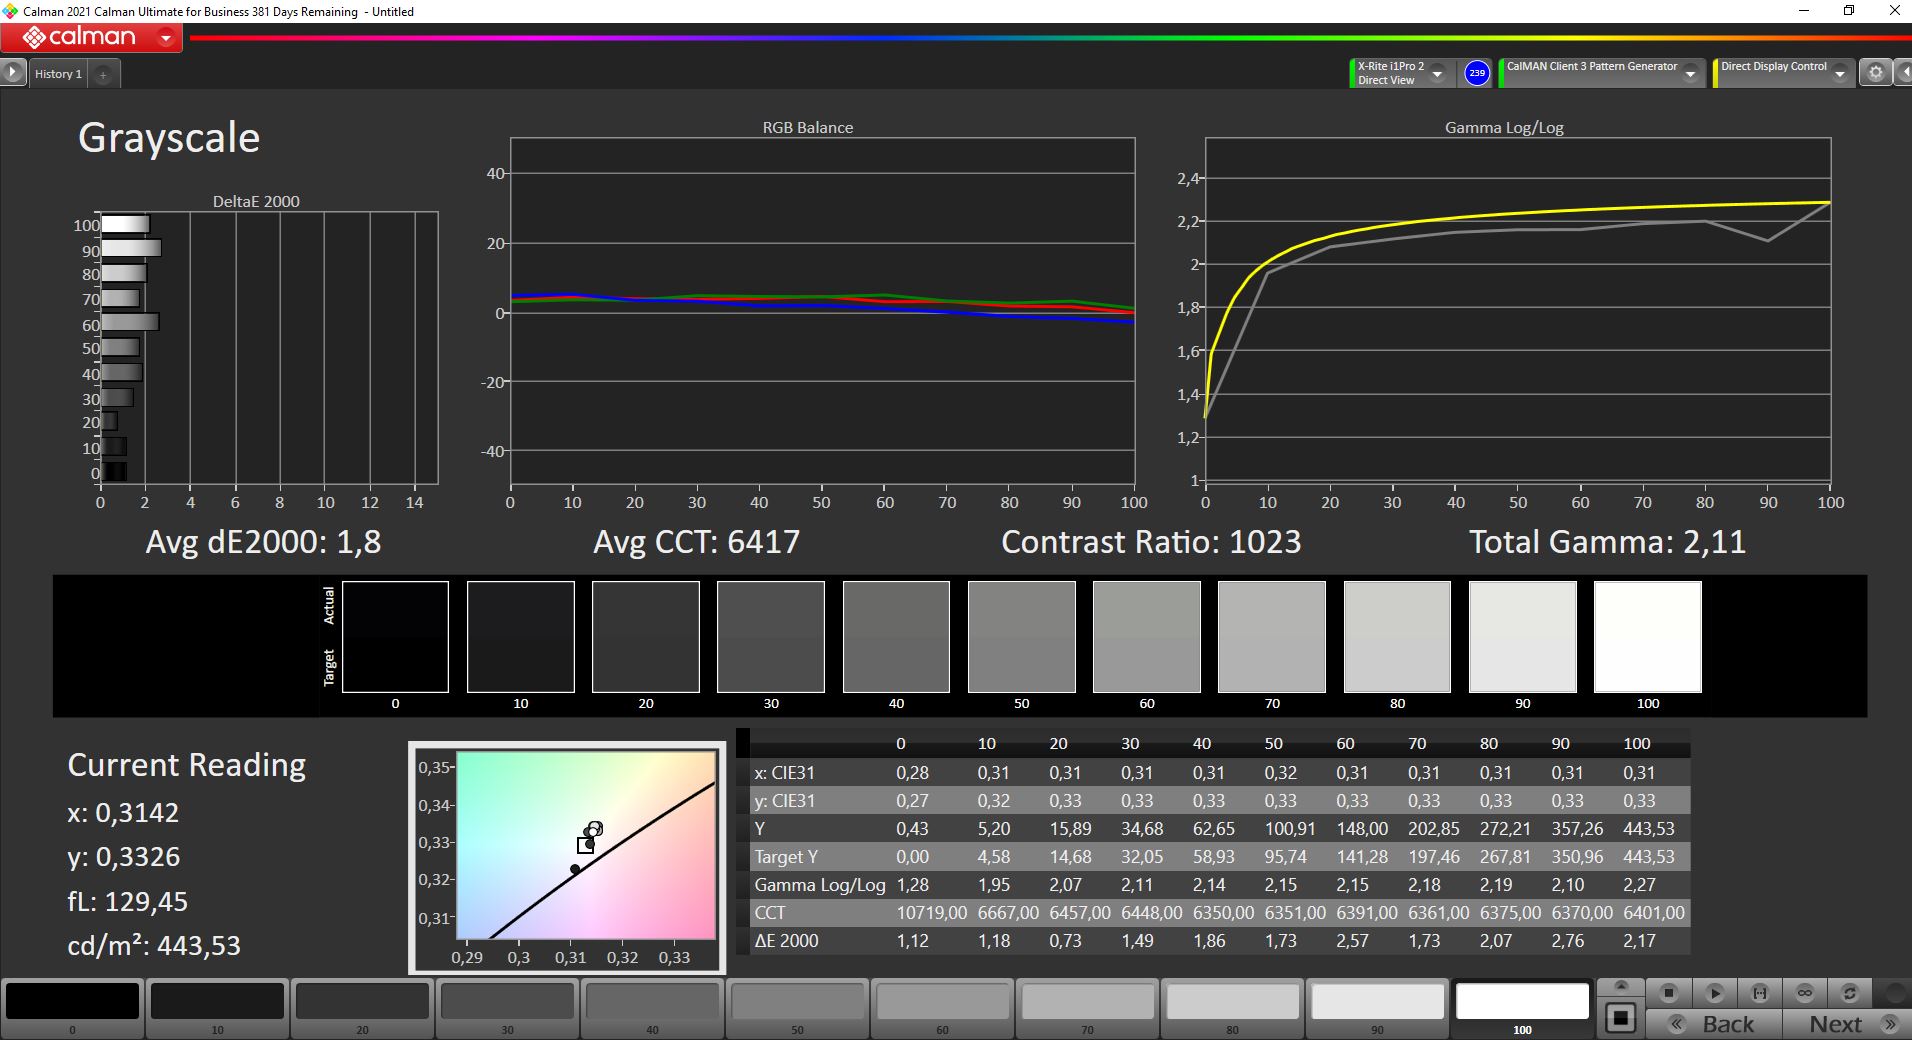

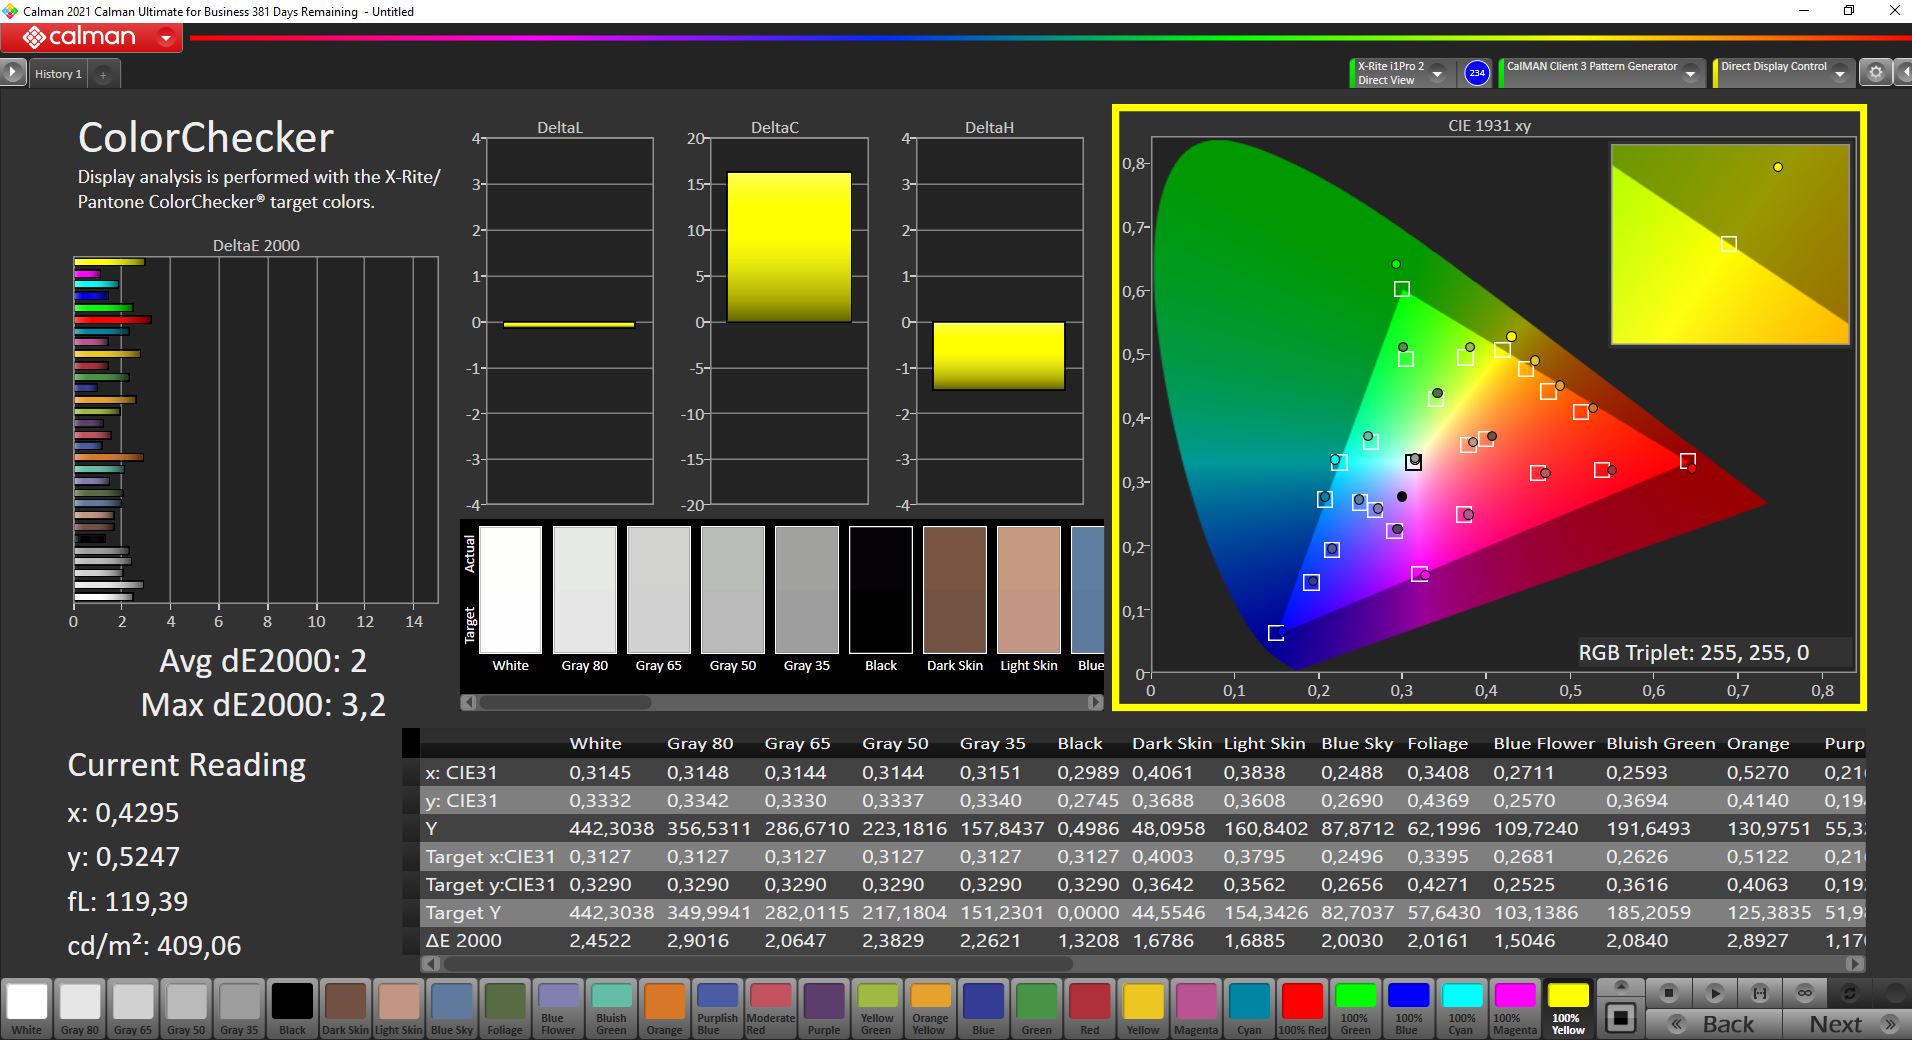

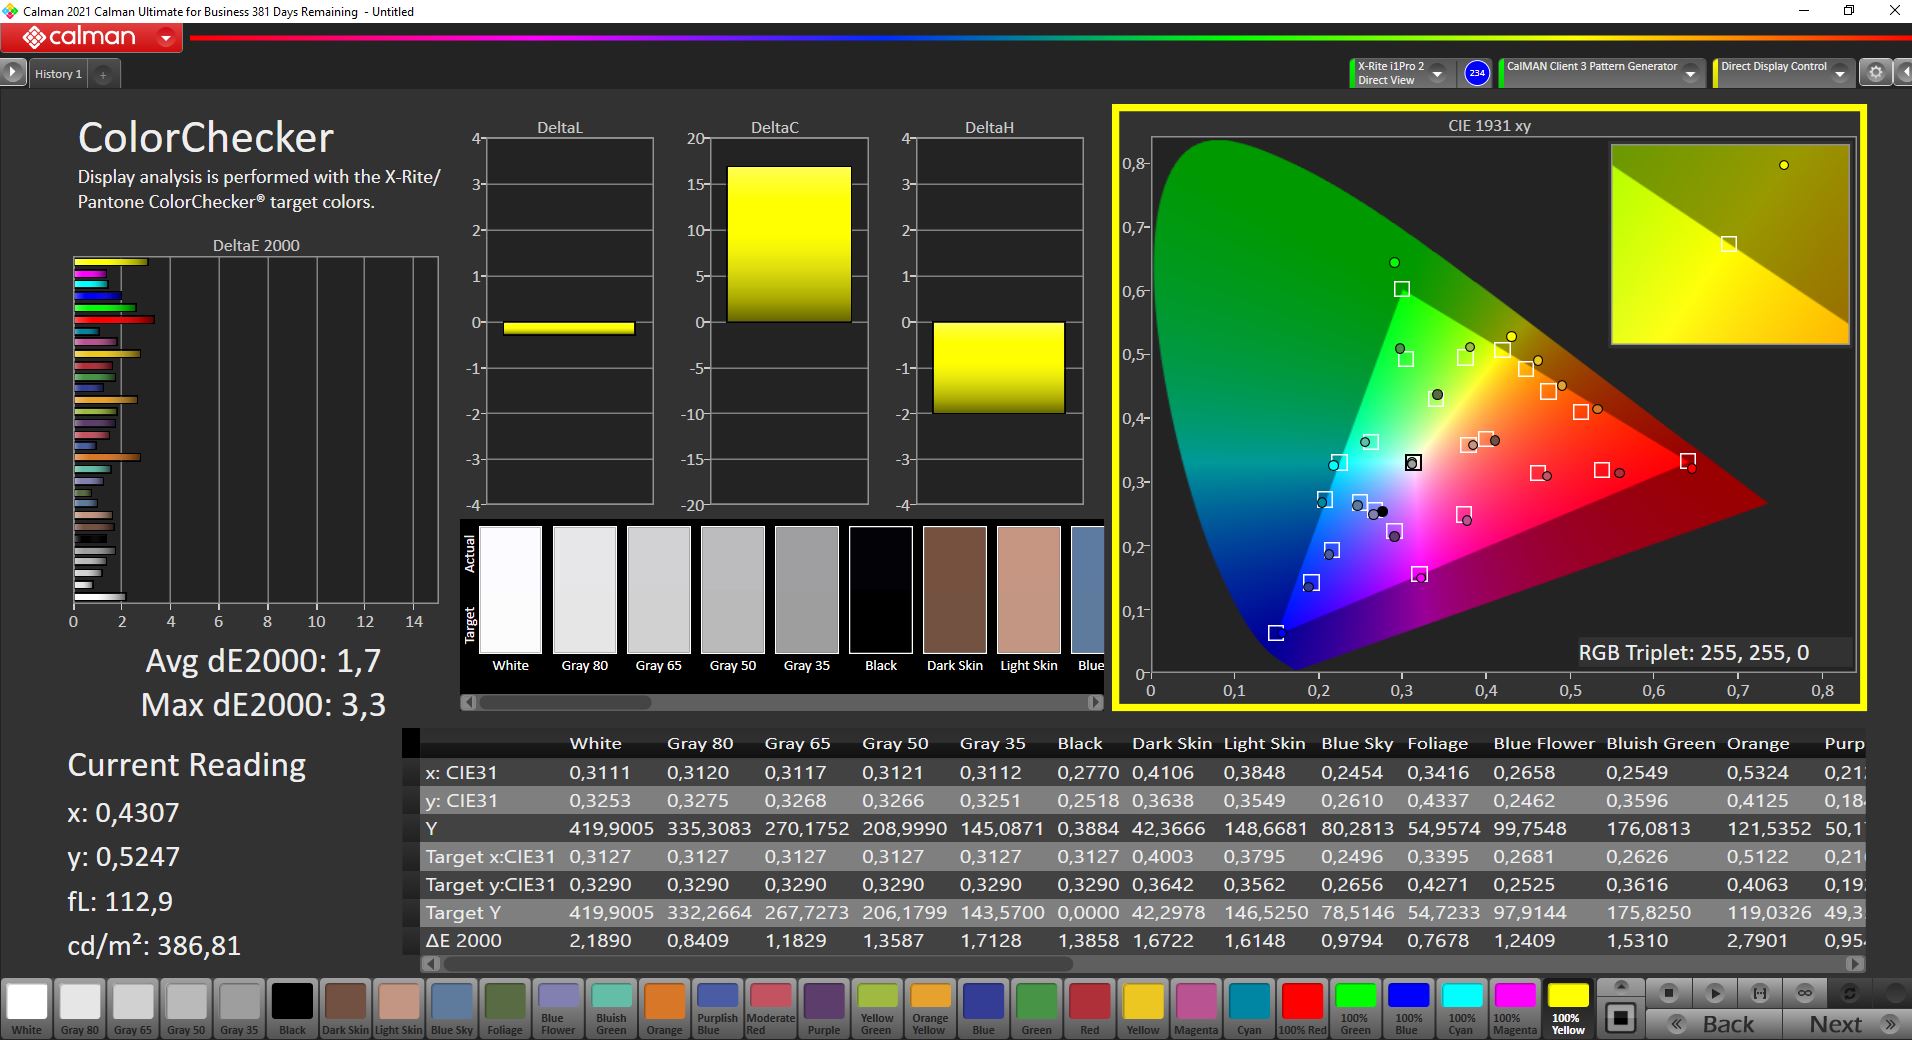
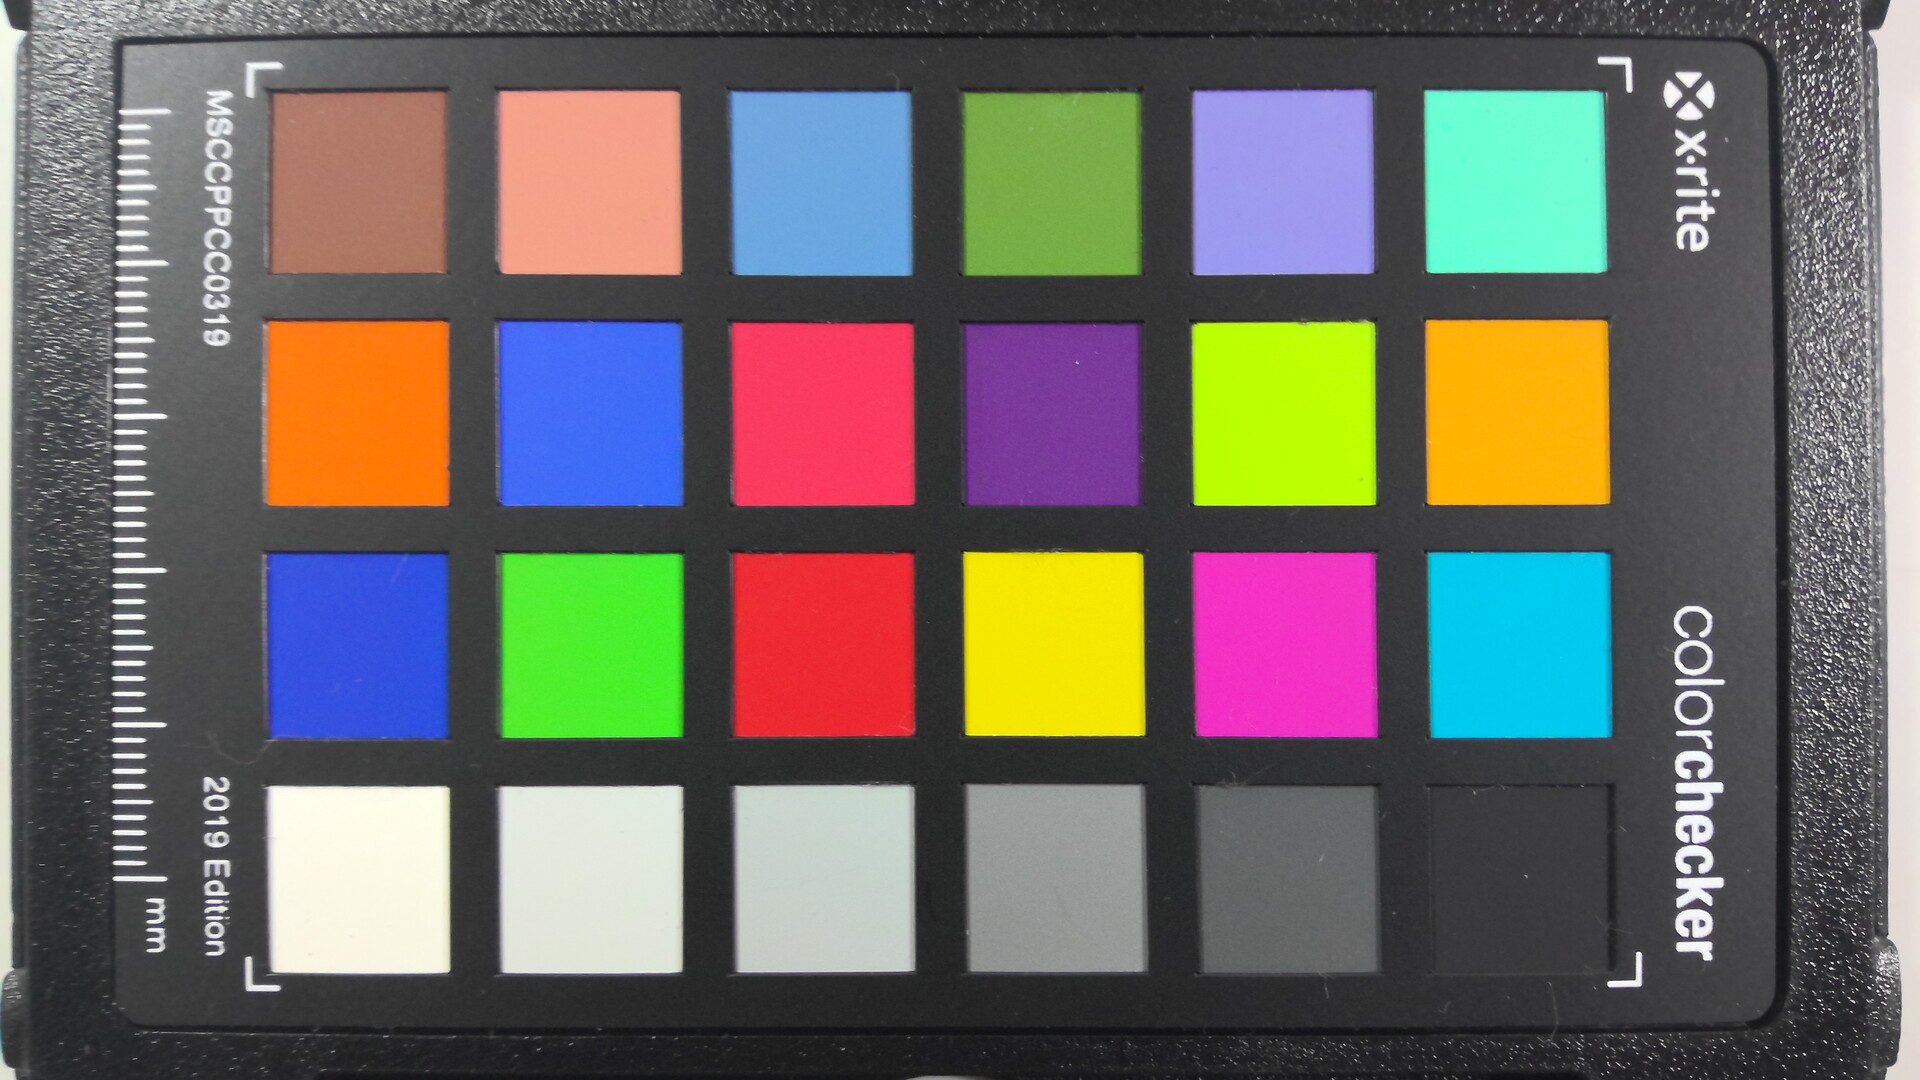
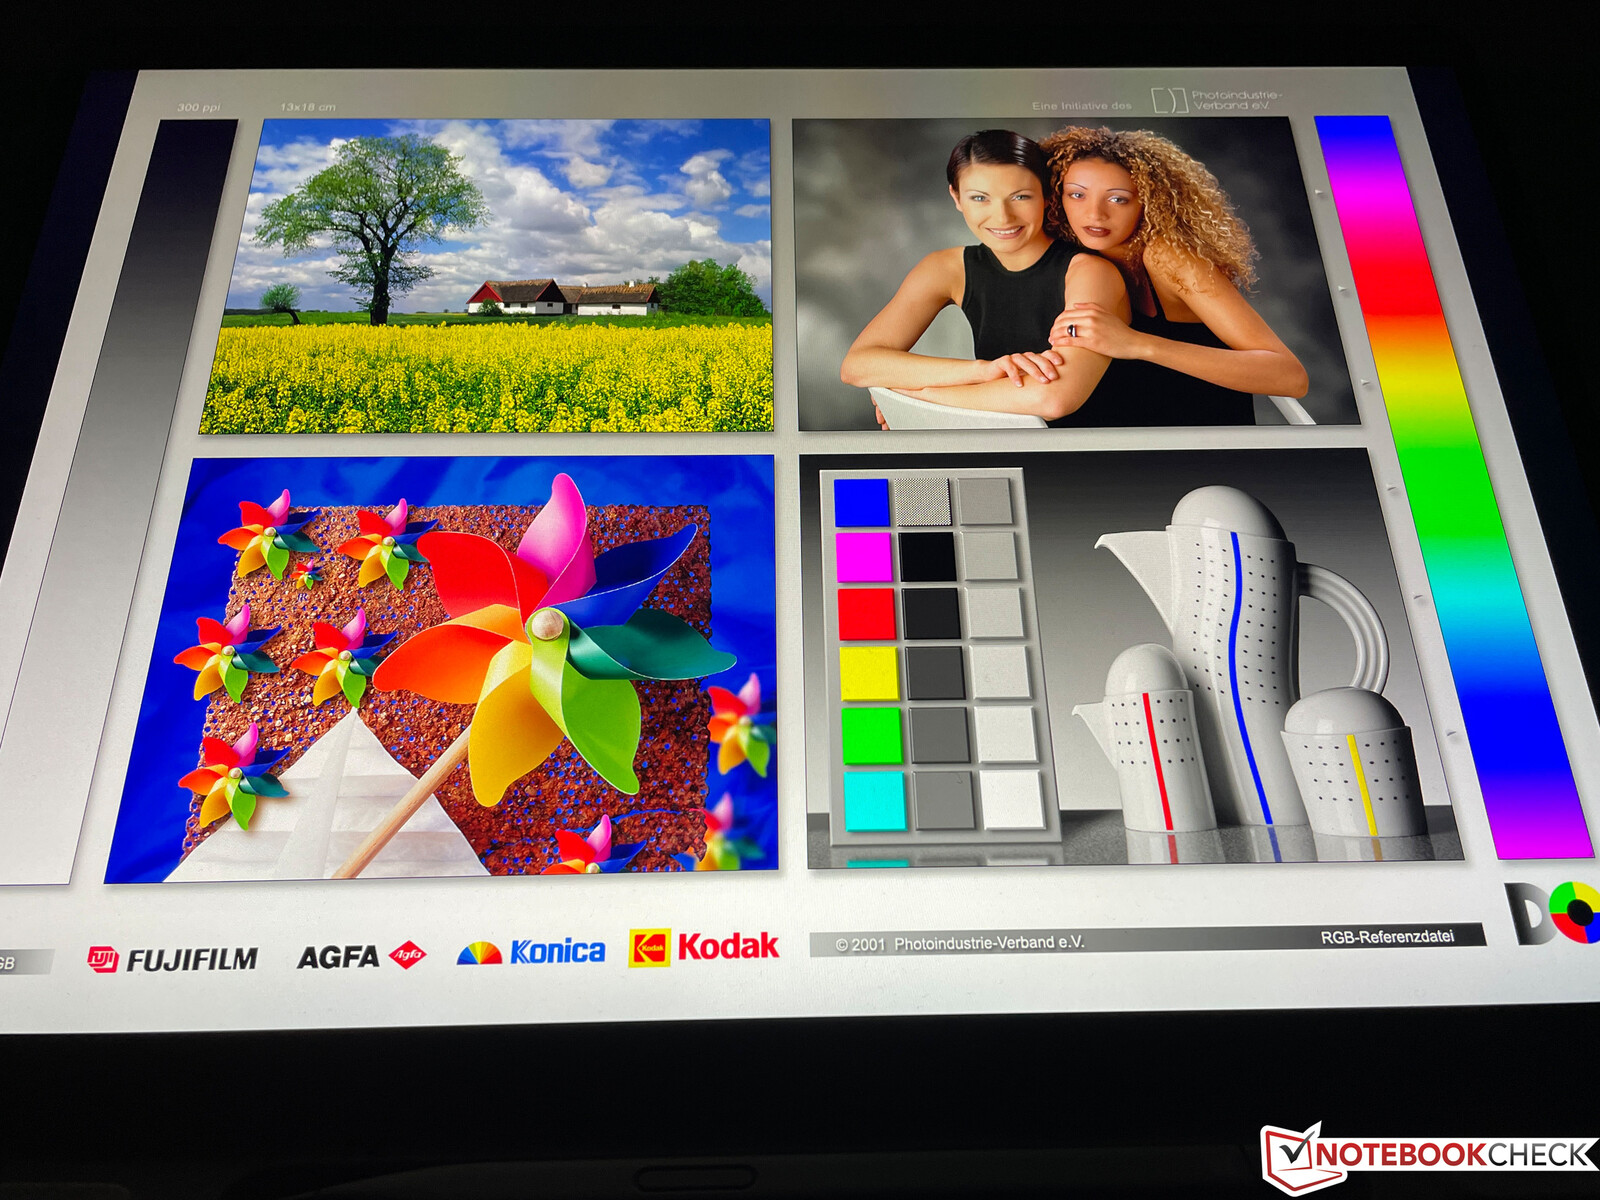
我们的分析(CalMAN和X-Rite i1 Pro 2)表明,该显示器在开箱时就已经得到了很好的校准,用户实际上没有必要再进行额外的校准。没有可见的偏色,所有DeltaE-2000的颜色偏差都低于3。sRGB色彩空间被完全覆盖,所以编辑图片是没有问题的。我们的校准(配置文件在上面有链接,可以免费下载)只能稍微改善结果。
Display Response Times
| ↔ Response Time Black to White | ||
|---|---|---|
| 23.2 ms ... rise ↗ and fall ↘ combined | ↗ 10.8 ms rise | 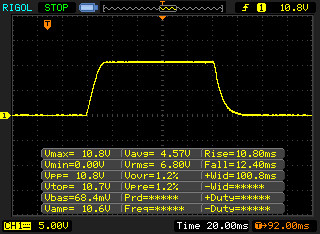 |
| ↘ 12.4 ms fall | ||
| The screen shows good response rates in our tests, but may be too slow for competitive gamers. In comparison, all tested devices range from 0.1 (minimum) to 240 (maximum) ms. » 53 % of all devices are better. This means that the measured response time is worse than the average of all tested devices (19.8 ms). | ||
| ↔ Response Time 50% Grey to 80% Grey | ||
| 46.4 ms ... rise ↗ and fall ↘ combined | ↗ 22.8 ms rise | 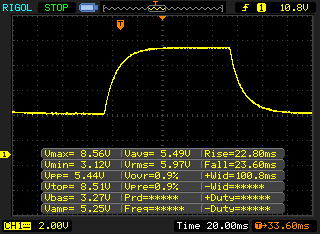 |
| ↘ 23.6 ms fall | ||
| The screen shows slow response rates in our tests and will be unsatisfactory for gamers. In comparison, all tested devices range from 0.165 (minimum) to 636 (maximum) ms. » 80 % of all devices are better. This means that the measured response time is worse than the average of all tested devices (31 ms). | ||
Screen Flickering / PWM (Pulse-Width Modulation)
| Screen flickering / PWM detected | 29760 Hz | ≤ 50 % brightness setting | 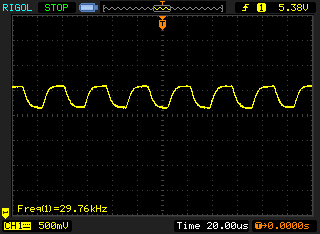 |
The display backlight flickers at 29760 Hz (worst case, e.g., utilizing PWM) Flickering detected at a brightness setting of 50 % and below. There should be no flickering or PWM above this brightness setting. The frequency of 29760 Hz is quite high, so most users sensitive to PWM should not notice any flickering. In comparison: 52 % of all tested devices do not use PWM to dim the display. If PWM was detected, an average of 7757 (minimum: 5 - maximum: 343500) Hz was measured. | |||
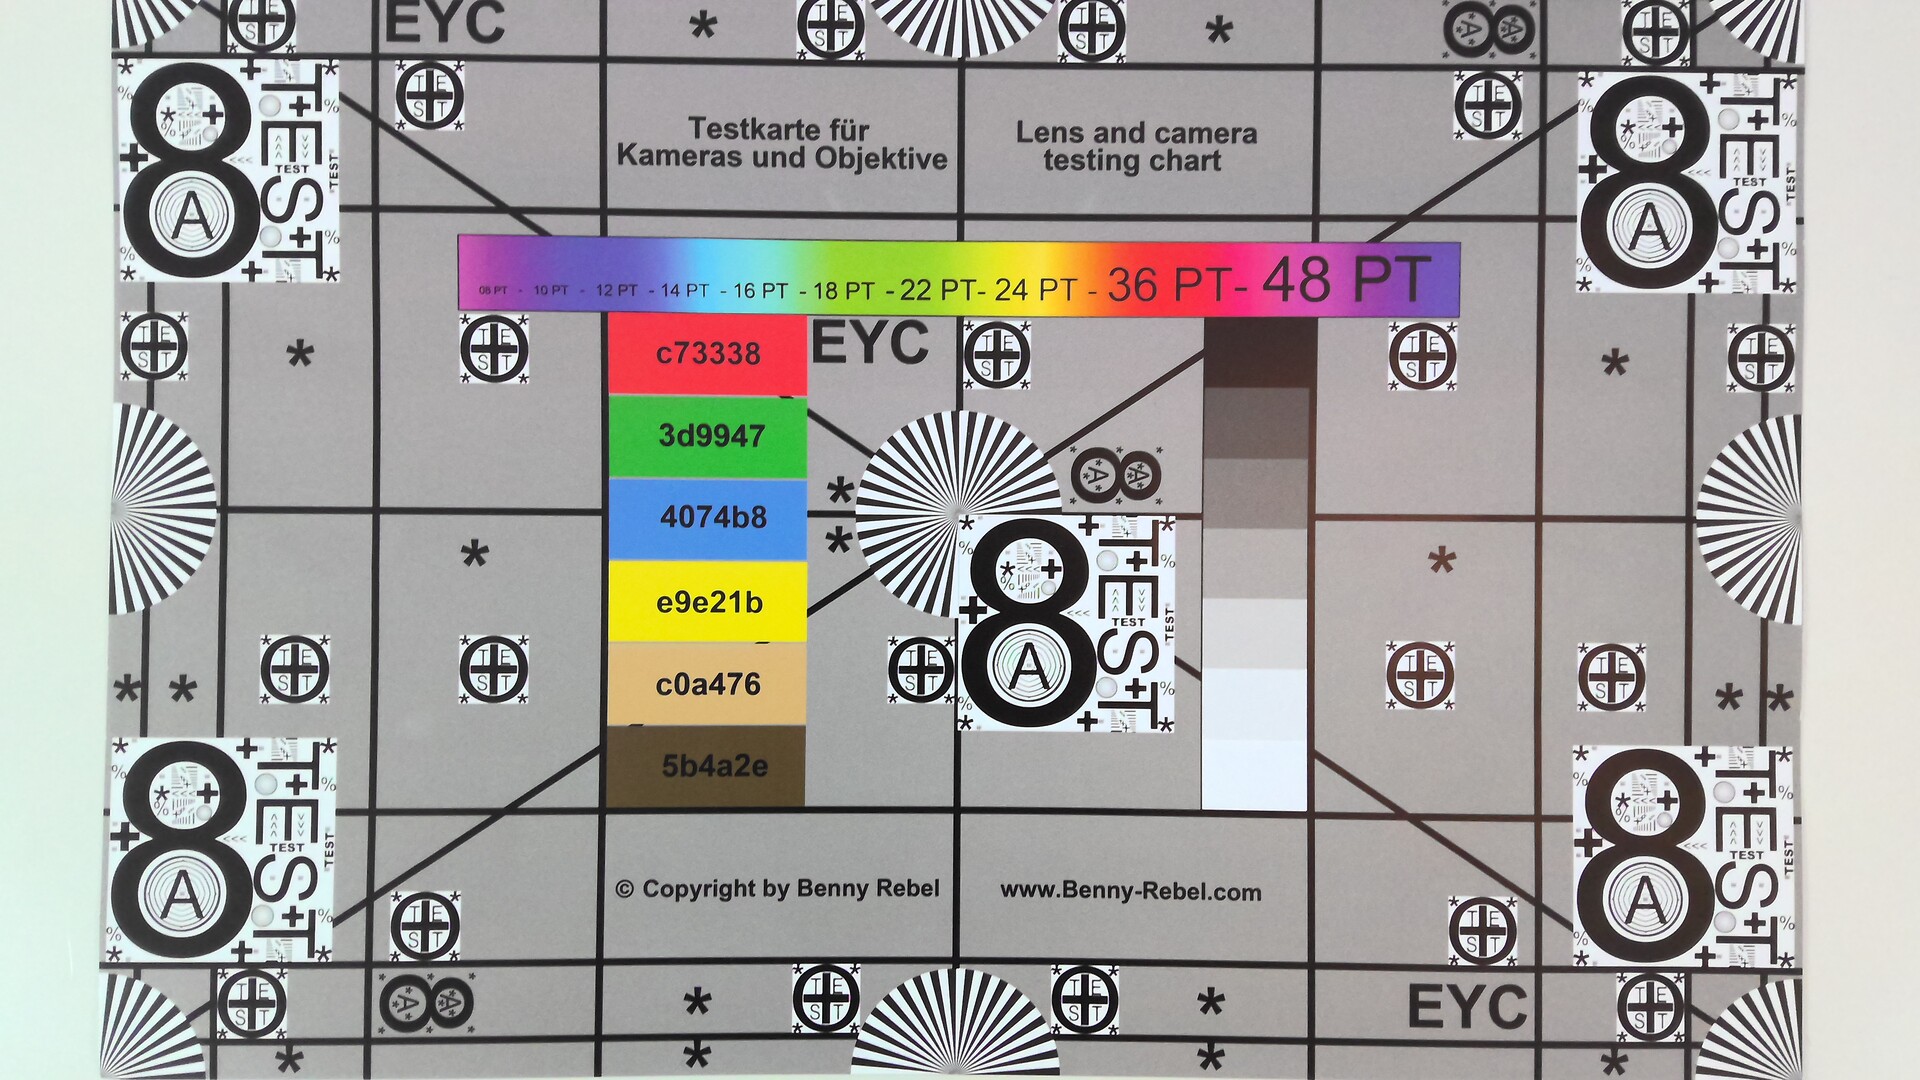
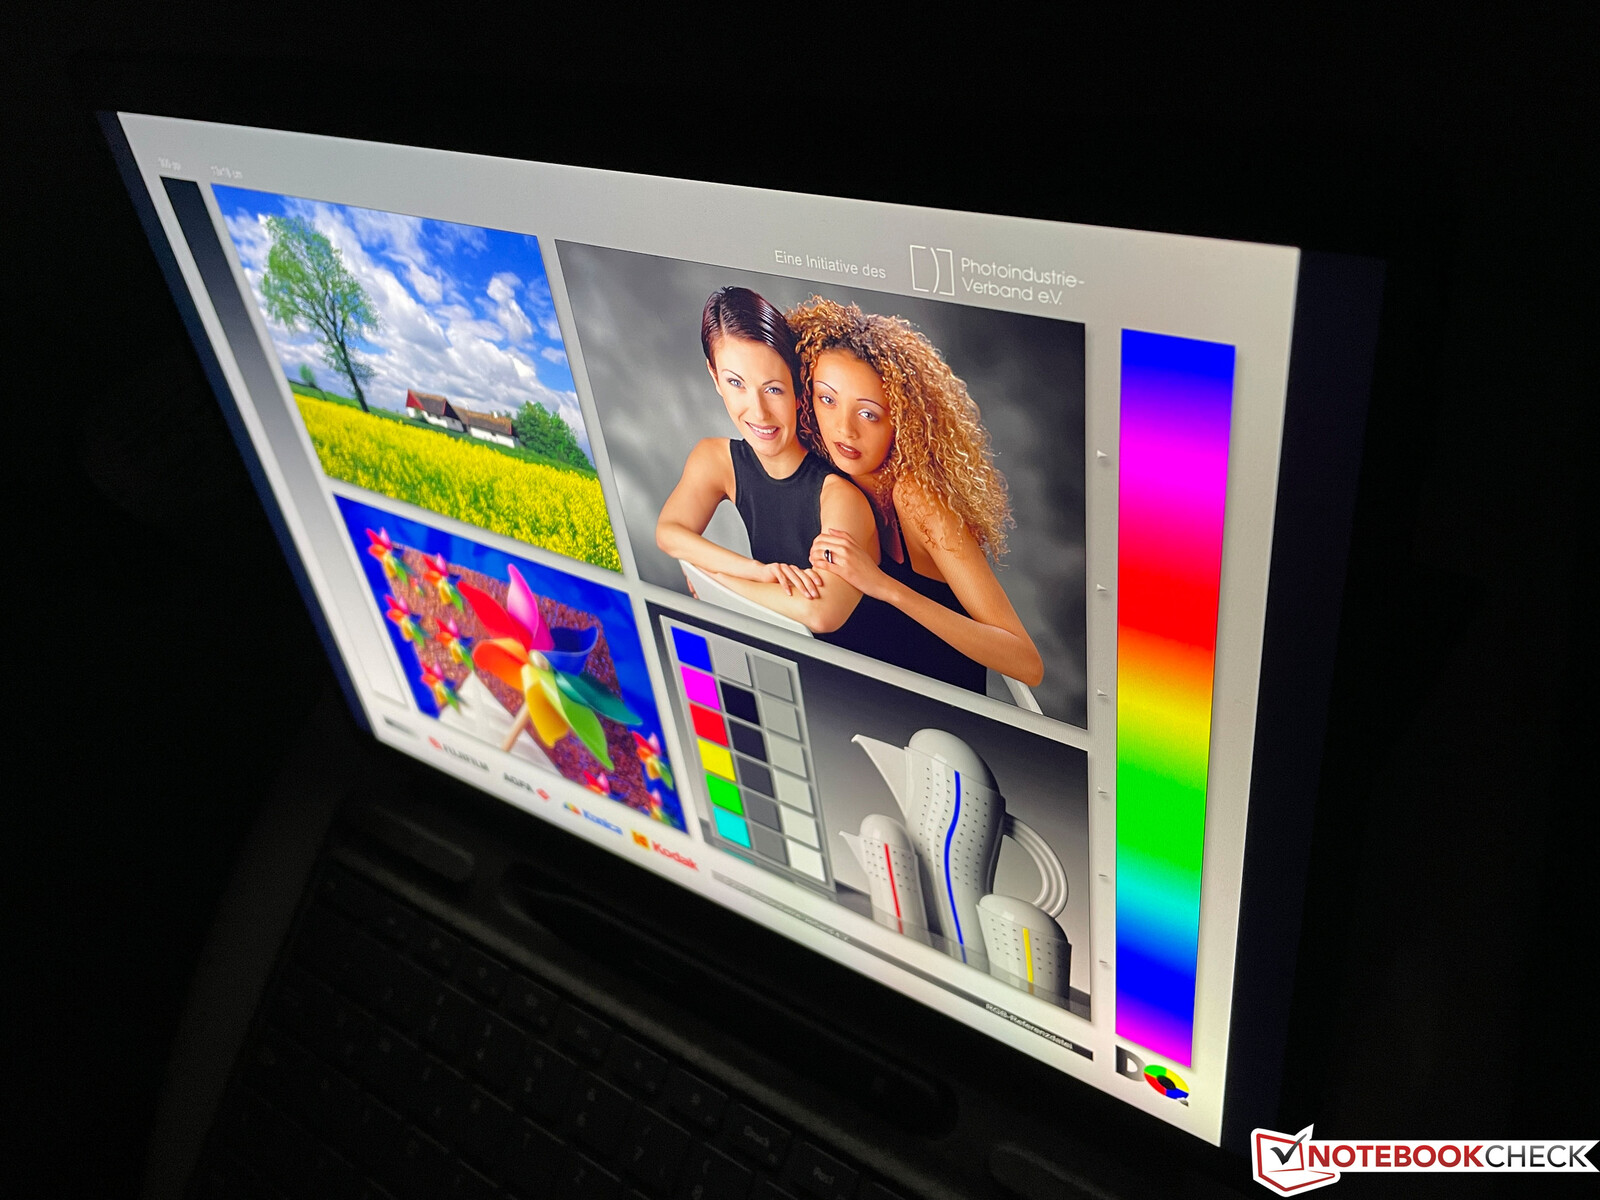
光滑的触摸屏在户外显然不理想,即使在阴天也会有反光的问题。因此,在非常明亮的环境中使用Surface Pro 5不是很舒服。在可视角度的稳定性方面没有任何限制。
性能 -Tiger Lake UP3
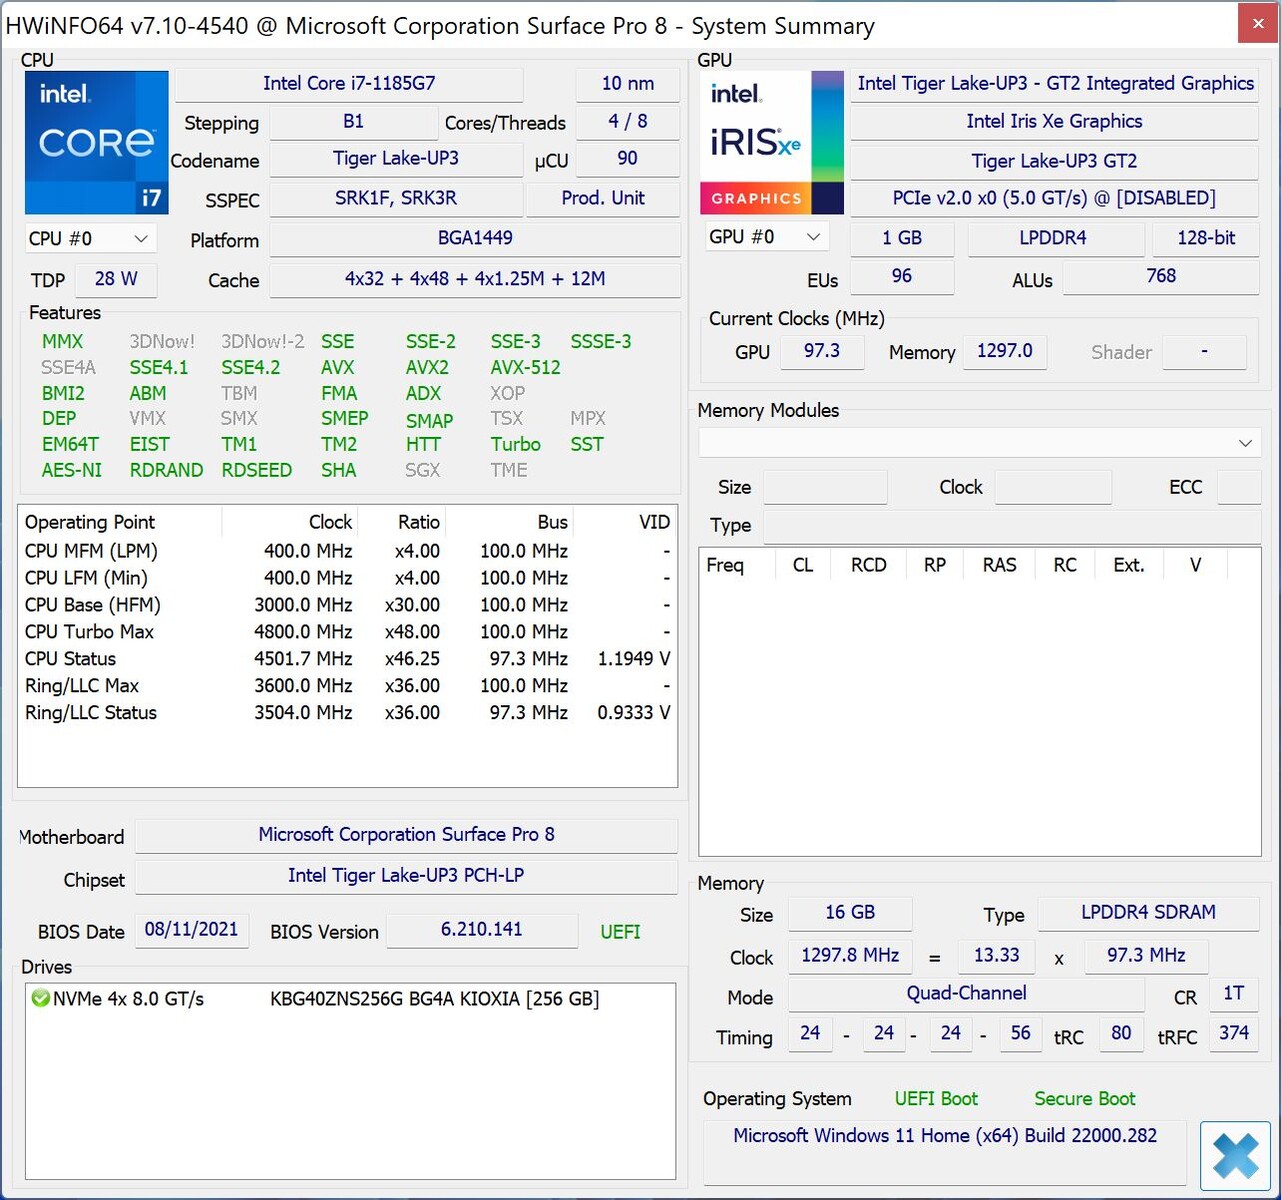
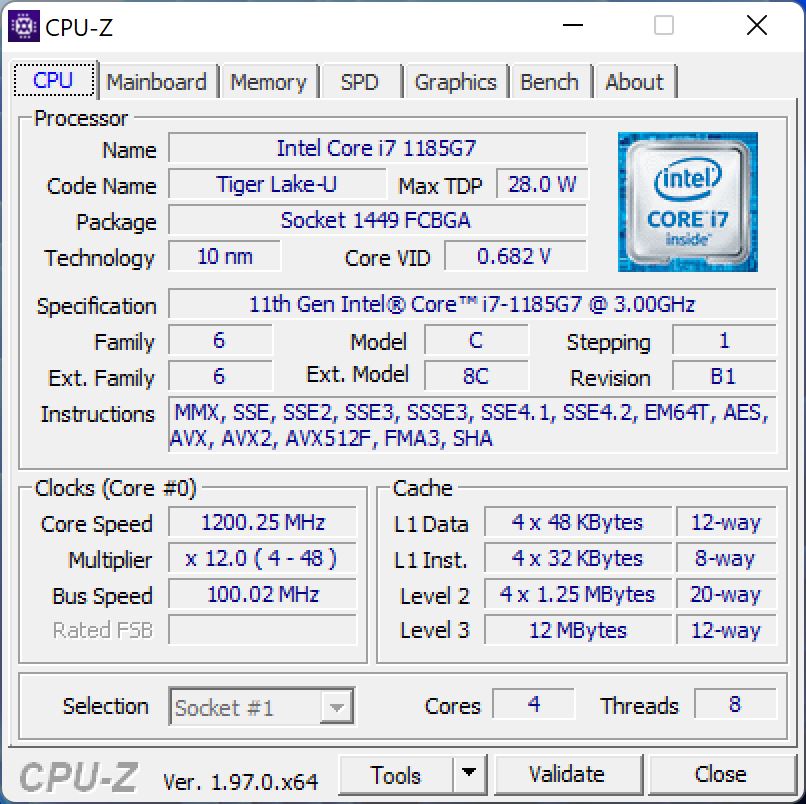
处理器
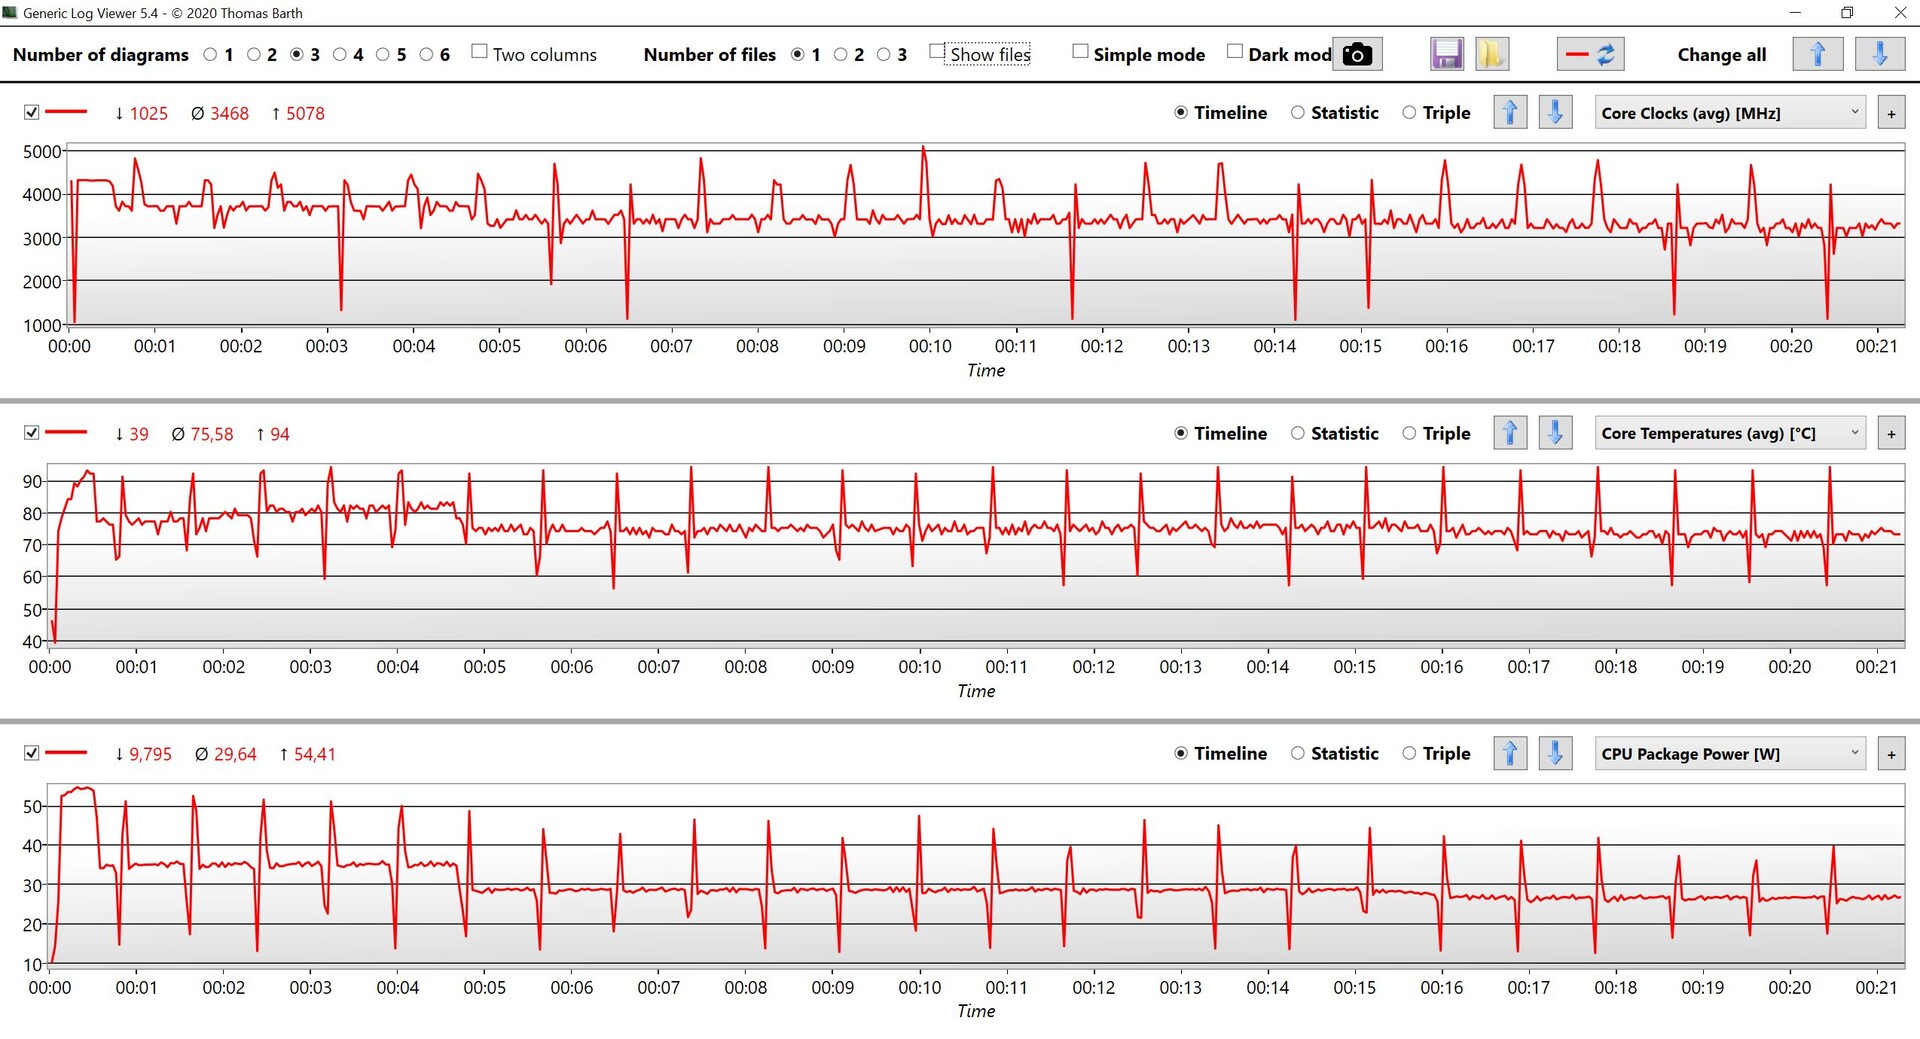
芯片酷睿i7-1185G7是目前英特尔Tiger Lake-U系列中最强大的移动处理器之一,时钟高达4.8GHz。微软允许Surface Pro 8在短时间内有54的高功率限制。CPU将迅速平息在35W,然后在5分钟后平息在28-29W。对于一个紧凑的敞篷车来说,这些都是非常好的结果,许多超薄的笔记本电脑都达不到。
这意味着Surface Pro 8领先于竞争对手,特别是与ThinkPad X12中较慢的UP4处理器相比。ThinkPad X12或Latitude 13.AMD的现代移动CPU效率更高,在多核情况下性能更强,但现在还没有配备AMD CPU的高端可转换产品。的iPad Pro配有Apple M1 SoC在原生应用中更强大,同时也更高效。
多核性能在电池电量上只降低了约10%。更多关于i7-1185G7的基准测试可在我们的 技术部分.
Cinebench R15 Multi Loop
Cinebench R23: Multi Core | Single Core
Cinebench R20: CPU (Multi Core) | CPU (Single Core)
Cinebench R15: CPU Multi 64Bit | CPU Single 64Bit
Blender: v2.79 BMW27 CPU
7-Zip 18.03: 7z b 4 | 7z b 4 -mmt1
Geekbench 5.5: Multi-Core | Single-Core
HWBOT x265 Benchmark v2.2: 4k Preset
LibreOffice : 20 Documents To PDF
R Benchmark 2.5: Overall mean
| CPU Performance rating | |
| Average of class Convertible | |
| Apple iPad Pro 12.9 2021 A2378 -12! | |
| Microsoft Surface Pro 8, i7-1185G7 | |
| Average Intel Core i7-1185G7 | |
| Microsoft Surface Pro 7 Plus | |
| Dell Latitude 13 7320 Detachable, i7-1180G7 | |
| Lenovo ThinkPad X12 20UVS03G00 -1! | |
| Cinebench R23 / Multi Core | |
| Average of class Convertible (1317 - 30959, n=48, last 2 years) | |
| Microsoft Surface Pro 8, i7-1185G7 | |
| Average Intel Core i7-1185G7 (3610 - 6383, n=24) | |
| Microsoft Surface Pro 7 Plus | |
| Dell Latitude 13 7320 Detachable, i7-1180G7 | |
| Lenovo ThinkPad X12 20UVS03G00 | |
| Cinebench R23 / Single Core | |
| Average of class Convertible (740 - 2188, n=48, last 2 years) | |
| Microsoft Surface Pro 8, i7-1185G7 | |
| Average Intel Core i7-1185G7 (1251 - 1532, n=24) | |
| Microsoft Surface Pro 7 Plus | |
| Dell Latitude 13 7320 Detachable, i7-1180G7 | |
| Lenovo ThinkPad X12 20UVS03G00 | |
| Cinebench R20 / CPU (Multi Core) | |
| Average of class Convertible (595 - 12102, n=48, last 2 years) | |
| Microsoft Surface Pro 8, i7-1185G7 | |
| Lenovo ThinkPad X12 20UVS03G00 | |
| Average Intel Core i7-1185G7 (1425 - 2493, n=28) | |
| Microsoft Surface Pro 7 Plus | |
| Dell Latitude 13 7320 Detachable, i7-1180G7 | |
| Cinebench R20 / CPU (Single Core) | |
| Average of class Convertible (273 - 834, n=48, last 2 years) | |
| Microsoft Surface Pro 8, i7-1185G7 | |
| Average Intel Core i7-1185G7 (489 - 593, n=28) | |
| Microsoft Surface Pro 7 Plus | |
| Lenovo ThinkPad X12 20UVS03G00 | |
| Dell Latitude 13 7320 Detachable, i7-1180G7 | |
| Cinebench R15 / CPU Multi 64Bit | |
| Average of class Convertible (478 - 4940, n=47, last 2 years) | |
| Microsoft Surface Pro 8, i7-1185G7 | |
| Lenovo ThinkPad X12 20UVS03G00 | |
| Average Intel Core i7-1185G7 (617 - 1066, n=32) | |
| Microsoft Surface Pro 7 Plus | |
| Dell Latitude 13 7320 Detachable, i7-1180G7 | |
| Cinebench R15 / CPU Single 64Bit | |
| Average of class Convertible (149.8 - 317, n=47, last 2 years) | |
| Microsoft Surface Pro 8, i7-1185G7 | |
| Average Intel Core i7-1185G7 (168 - 230, n=27) | |
| Microsoft Surface Pro 7 Plus | |
| Dell Latitude 13 7320 Detachable, i7-1180G7 | |
| Lenovo ThinkPad X12 20UVS03G00 | |
| Blender / v2.79 BMW27 CPU | |
| Lenovo ThinkPad X12 20UVS03G00 | |
| Dell Latitude 13 7320 Detachable, i7-1180G7 | |
| Microsoft Surface Pro 7 Plus | |
| Average Intel Core i7-1185G7 (478 - 745, n=28) | |
| Microsoft Surface Pro 8, i7-1185G7 | |
| Average of class Convertible (105 - 1051, n=47, last 2 years) | |
| 7-Zip 18.03 / 7z b 4 | |
| Average of class Convertible (12977 - 121368, n=47, last 2 years) | |
| Microsoft Surface Pro 8, i7-1185G7 | |
| Average Intel Core i7-1185G7 (18812 - 27693, n=27) | |
| Microsoft Surface Pro 7 Plus | |
| Dell Latitude 13 7320 Detachable, i7-1180G7 | |
| Lenovo ThinkPad X12 20UVS03G00 | |
| 7-Zip 18.03 / 7z b 4 -mmt1 | |
| Average of class Convertible (3672 - 6655, n=47, last 2 years) | |
| Microsoft Surface Pro 8, i7-1185G7 | |
| Average Intel Core i7-1185G7 (3678 - 5507, n=27) | |
| Dell Latitude 13 7320 Detachable, i7-1180G7 | |
| Microsoft Surface Pro 7 Plus | |
| Geekbench 5.5 / Multi-Core | |
| Average of class Convertible (1608 - 22023, n=48, last 2 years) | |
| Apple iPad Pro 12.9 2021 A2378 | |
| Microsoft Surface Pro 8, i7-1185G7 | |
| Average Intel Core i7-1185G7 (4620 - 5944, n=21) | |
| Dell Latitude 13 7320 Detachable, i7-1180G7 | |
| Microsoft Surface Pro 7 Plus | |
| Lenovo ThinkPad X12 20UVS03G00 | |
| Geekbench 5.5 / Single-Core | |
| Average of class Convertible (806 - 2275, n=48, last 2 years) | |
| Apple iPad Pro 12.9 2021 A2378 | |
| Microsoft Surface Pro 8, i7-1185G7 | |
| Dell Latitude 13 7320 Detachable, i7-1180G7 | |
| Average Intel Core i7-1185G7 (1398 - 1626, n=21) | |
| Lenovo ThinkPad X12 20UVS03G00 | |
| Microsoft Surface Pro 7 Plus | |
| HWBOT x265 Benchmark v2.2 / 4k Preset | |
| Average of class Convertible (3.43 - 36.2, n=47, last 2 years) | |
| Average Intel Core i7-1185G7 (5.02 - 8.13, n=27) | |
| Microsoft Surface Pro 8, i7-1185G7 | |
| Microsoft Surface Pro 7 Plus | |
| Dell Latitude 13 7320 Detachable, i7-1180G7 | |
| Lenovo ThinkPad X12 20UVS03G00 | |
| LibreOffice / 20 Documents To PDF | |
| Lenovo ThinkPad X12 20UVS03G00 | |
| Microsoft Surface Pro 7 Plus | |
| Average of class Convertible (42.5 - 84.3, n=47, last 2 years) | |
| Microsoft Surface Pro 8, i7-1185G7 | |
| Average Intel Core i7-1185G7 (41.3 - 61.7, n=26) | |
| Dell Latitude 13 7320 Detachable, i7-1180G7 | |
| R Benchmark 2.5 / Overall mean | |
| Lenovo ThinkPad X12 20UVS03G00 | |
| Microsoft Surface Pro 7 Plus | |
| Dell Latitude 13 7320 Detachable, i7-1180G7 | |
| Average Intel Core i7-1185G7 (0.55 - 0.615, n=27) | |
| Microsoft Surface Pro 8, i7-1185G7 | |
| Average of class Convertible (0.3915 - 0.84, n=47, last 2 years) | |
* ... smaller is better
AIDA64: FP32 Ray-Trace | FPU Julia | CPU SHA3 | CPU Queen | FPU SinJulia | FPU Mandel | CPU AES | CPU ZLib | FP64 Ray-Trace | CPU PhotoWorxx
| Performance rating | |
| Average of class Convertible | |
| Microsoft Surface Pro 8, i7-1185G7 | |
| Average Intel Core i7-1185G7 | |
| Microsoft Surface Pro 7 Plus | |
| Lenovo ThinkPad X12 20UVS03G00 | |
| Dell Latitude 13 7320 Detachable, i7-1180G7 | |
| AIDA64 / FP32 Ray-Trace | |
| Average of class Convertible (1480 - 64158, n=47, last 2 years) | |
| Microsoft Surface Pro 8, i7-1185G7 | |
| Average Intel Core i7-1185G7 (5621 - 7453, n=20) | |
| Microsoft Surface Pro 7 Plus | |
| Dell Latitude 13 7320 Detachable, i7-1180G7 | |
| Lenovo ThinkPad X12 20UVS03G00 | |
| AIDA64 / FPU Julia | |
| Average of class Convertible (11392 - 184800, n=47, last 2 years) | |
| Microsoft Surface Pro 8, i7-1185G7 | |
| Microsoft Surface Pro 7 Plus | |
| Average Intel Core i7-1185G7 (23248 - 32614, n=20) | |
| Lenovo ThinkPad X12 20UVS03G00 | |
| Dell Latitude 13 7320 Detachable, i7-1180G7 | |
| AIDA64 / CPU SHA3 | |
| Average of class Convertible (797 - 8291, n=47, last 2 years) | |
| Microsoft Surface Pro 8, i7-1185G7 | |
| Microsoft Surface Pro 7 Plus | |
| Average Intel Core i7-1185G7 (1530 - 2209, n=20) | |
| Lenovo ThinkPad X12 20UVS03G00 | |
| Dell Latitude 13 7320 Detachable, i7-1180G7 | |
| AIDA64 / CPU Queen | |
| Average of class Convertible (14686 - 148874, n=38, last 2 years) | |
| Average Intel Core i7-1185G7 (44677 - 52815, n=20) | |
| Microsoft Surface Pro 8, i7-1185G7 | |
| Dell Latitude 13 7320 Detachable, i7-1180G7 | |
| Microsoft Surface Pro 7 Plus | |
| Lenovo ThinkPad X12 20UVS03G00 | |
| AIDA64 / FPU SinJulia | |
| Average of class Convertible (1120 - 29155, n=47, last 2 years) | |
| Microsoft Surface Pro 8, i7-1185G7 | |
| Average Intel Core i7-1185G7 (3870 - 5027, n=20) | |
| Microsoft Surface Pro 7 Plus | |
| Dell Latitude 13 7320 Detachable, i7-1180G7 | |
| Lenovo ThinkPad X12 20UVS03G00 | |
| AIDA64 / FPU Mandel | |
| Average of class Convertible (4929 - 97193, n=47, last 2 years) | |
| Microsoft Surface Pro 8, i7-1185G7 | |
| Microsoft Surface Pro 7 Plus | |
| Average Intel Core i7-1185G7 (14584 - 19594, n=20) | |
| Dell Latitude 13 7320 Detachable, i7-1180G7 | |
| Lenovo ThinkPad X12 20UVS03G00 | |
| AIDA64 / CPU AES | |
| Lenovo ThinkPad X12 20UVS03G00 | |
| Average of class Convertible (5271 - 190280, n=47, last 2 years) | |
| Average Intel Core i7-1185G7 (33002 - 76826, n=20) | |
| Dell Latitude 13 7320 Detachable, i7-1180G7 | |
| Microsoft Surface Pro 8, i7-1185G7 | |
| Microsoft Surface Pro 7 Plus | |
| AIDA64 / CPU ZLib | |
| Average of class Convertible (218 - 2017, n=47, last 2 years) | |
| Microsoft Surface Pro 8, i7-1185G7 | |
| Microsoft Surface Pro 7 Plus | |
| Average Intel Core i7-1185G7 (258 - 412, n=22) | |
| Dell Latitude 13 7320 Detachable, i7-1180G7 | |
| Lenovo ThinkPad X12 20UVS03G00 | |
| AIDA64 / FP64 Ray-Trace | |
| Average of class Convertible (1169 - 34297, n=47, last 2 years) | |
| Microsoft Surface Pro 8, i7-1185G7 | |
| Average Intel Core i7-1185G7 (2821 - 4094, n=20) | |
| Microsoft Surface Pro 7 Plus | |
| Dell Latitude 13 7320 Detachable, i7-1180G7 | |
| Lenovo ThinkPad X12 20UVS03G00 | |
| AIDA64 / CPU PhotoWorxx | |
| Average of class Convertible (14193 - 85327, n=47, last 2 years) | |
| Microsoft Surface Pro 7 Plus | |
| Microsoft Surface Pro 8, i7-1185G7 | |
| Lenovo ThinkPad X12 20UVS03G00 | |
| Average Intel Core i7-1185G7 (22349 - 43701, n=20) | |
| Dell Latitude 13 7320 Detachable, i7-1180G7 | |
系统性能
由于快速的处理器和PCI-SSD,Surface Pro 8是一个反应非常迅速的伙伴,即使是更复杂的工作负载对这台可转换的设备来说也不是问题。我们在启动应用程序时也没有发现任何延迟。PCMark 10的高分证实了我们的主观印象。
| PCMark 10 / Score | |
| Average of class Convertible (3229 - 10123, n=45, last 2 years) | |
| Microsoft Surface Pro 8, i7-1185G7 | |
| Average Intel Core i7-1185G7, Intel Iris Xe Graphics G7 96EUs (4746 - 5561, n=20) | |
| Dell Latitude 13 7320 Detachable, i7-1180G7 | |
| Lenovo ThinkPad X12 20UVS03G00 | |
| Microsoft Surface Pro 7 Plus | |
| PCMark 10 / Essentials | |
| Average of class Convertible (7233 - 12222, n=45, last 2 years) | |
| Dell Latitude 13 7320 Detachable, i7-1180G7 | |
| Average Intel Core i7-1185G7, Intel Iris Xe Graphics G7 96EUs (8279 - 10664, n=20) | |
| Lenovo ThinkPad X12 20UVS03G00 | |
| Microsoft Surface Pro 8, i7-1185G7 | |
| Microsoft Surface Pro 7 Plus | |
| PCMark 10 / Productivity | |
| Average of class Convertible (5062 - 17914, n=45, last 2 years) | |
| Average Intel Core i7-1185G7, Intel Iris Xe Graphics G7 96EUs (5799 - 8770, n=20) | |
| Dell Latitude 13 7320 Detachable, i7-1180G7 | |
| Microsoft Surface Pro 8, i7-1185G7 | |
| Lenovo ThinkPad X12 20UVS03G00 | |
| Microsoft Surface Pro 7 Plus | |
| PCMark 10 / Digital Content Creation | |
| Average of class Convertible (2496 - 16551, n=45, last 2 years) | |
| Microsoft Surface Pro 8, i7-1185G7 | |
| Average Intel Core i7-1185G7, Intel Iris Xe Graphics G7 96EUs (4424 - 5684, n=20) | |
| Lenovo ThinkPad X12 20UVS03G00 | |
| Dell Latitude 13 7320 Detachable, i7-1180G7 | |
| Microsoft Surface Pro 7 Plus | |
| PCMark 10 Score | 5041 points | |
Help | ||
| AIDA64 / Memory Copy | |
| Average of class Convertible (23880 - 161475, n=47, last 2 years) | |
| Dell Latitude 13 7320 Detachable, i7-1180G7 | |
| Microsoft Surface Pro 7 Plus | |
| Microsoft Surface Pro 8, i7-1185G7 | |
| Lenovo ThinkPad X12 20UVS03G00 | |
| Average Intel Core i7-1185G7 (36515 - 68450, n=20) | |
| AIDA64 / Memory Read | |
| Average of class Convertible (19931 - 131960, n=47, last 2 years) | |
| Dell Latitude 13 7320 Detachable, i7-1180G7 | |
| Microsoft Surface Pro 8, i7-1185G7 | |
| Lenovo ThinkPad X12 20UVS03G00 | |
| Microsoft Surface Pro 7 Plus | |
| Average Intel Core i7-1185G7 (38394 - 64291, n=20) | |
| AIDA64 / Memory Write | |
| Average of class Convertible (17473 - 216896, n=47, last 2 years) | |
| Dell Latitude 13 7320 Detachable, i7-1180G7 | |
| Microsoft Surface Pro 7 Plus | |
| Lenovo ThinkPad X12 20UVS03G00 | |
| Microsoft Surface Pro 8, i7-1185G7 | |
| Average Intel Core i7-1185G7 (37684 - 66873, n=20) | |
| AIDA64 / Memory Latency | |
| Average of class Convertible (6.9 - 536, n=47, last 2 years) | |
| Microsoft Surface Pro 8, i7-1185G7 | |
| Lenovo ThinkPad X12 20UVS03G00 | |
| Dell Latitude 13 7320 Detachable, i7-1180G7 | |
| Microsoft Surface Pro 7 Plus | |
| Average Intel Core i7-1185G7 (78.3 - 117, n=22) | |
* ... smaller is better
DPC延时
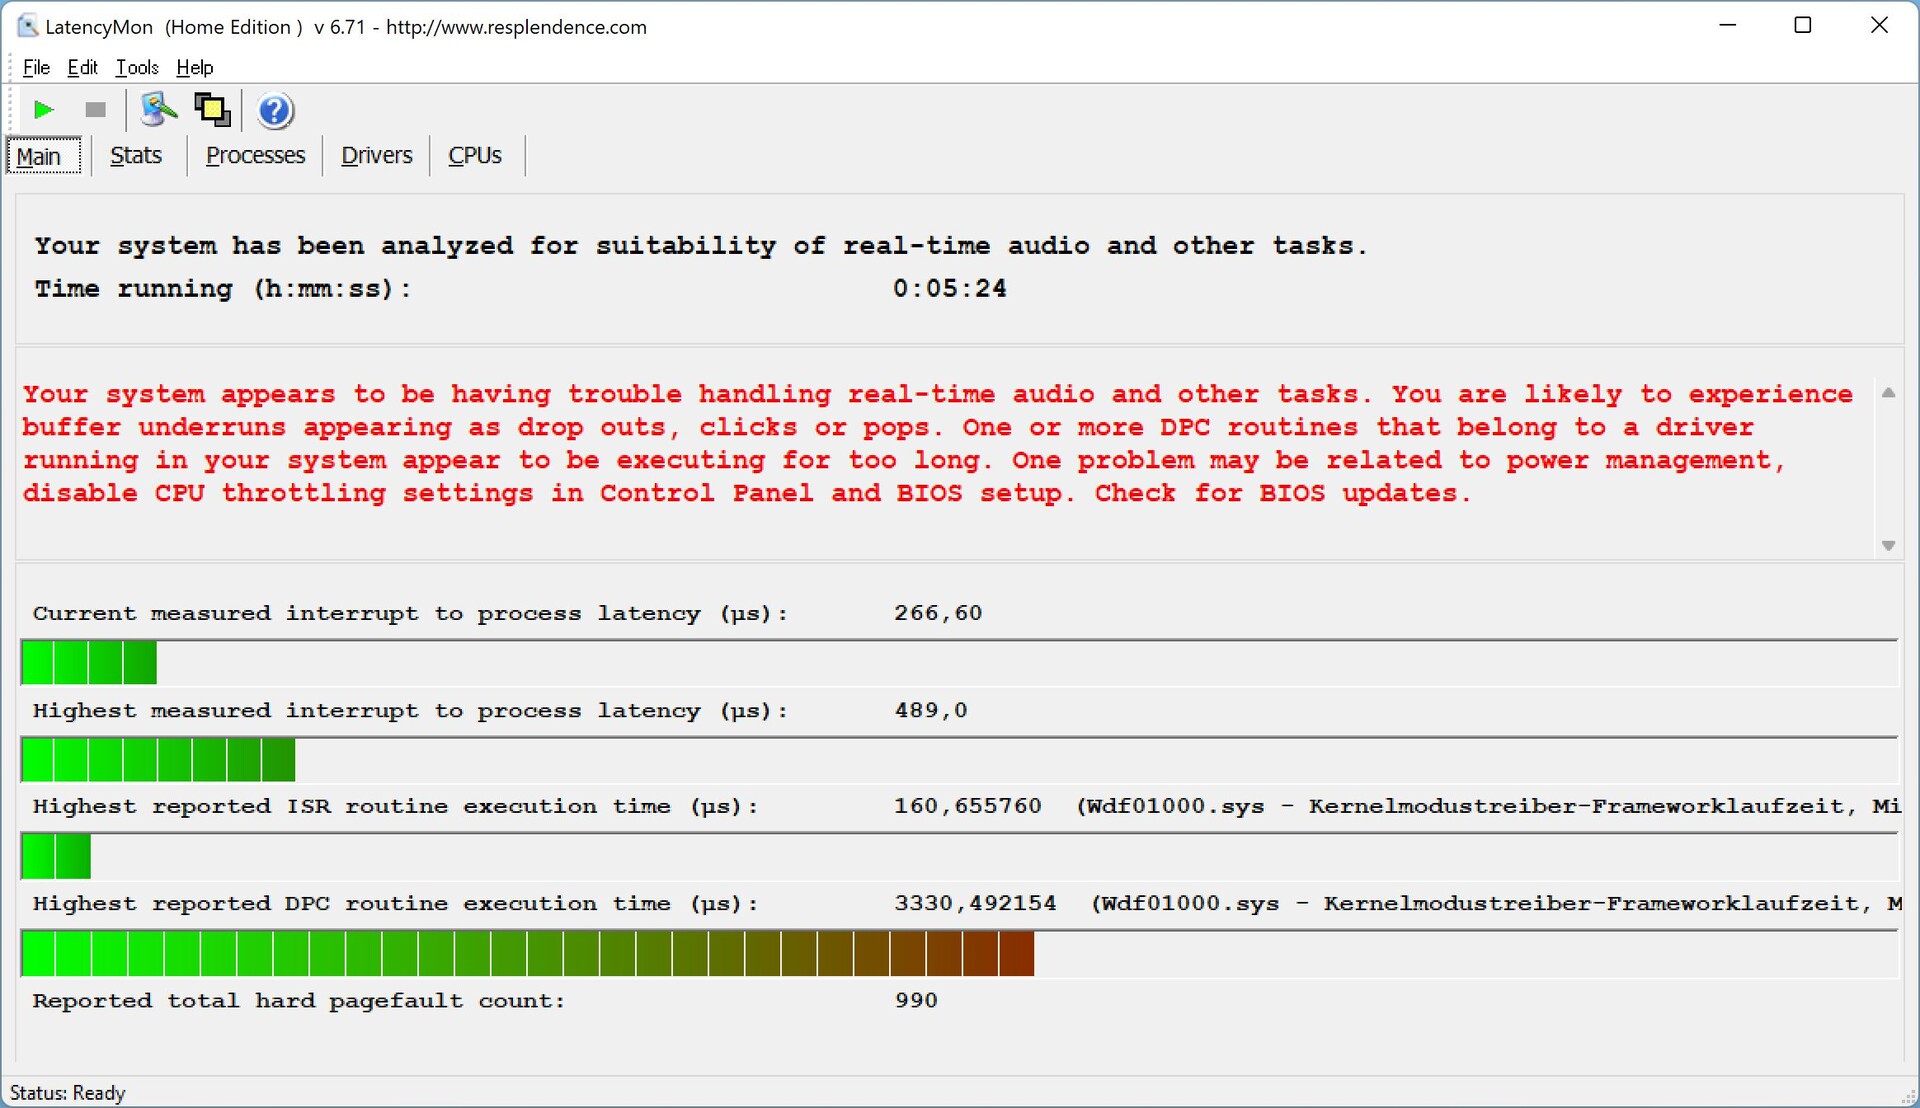
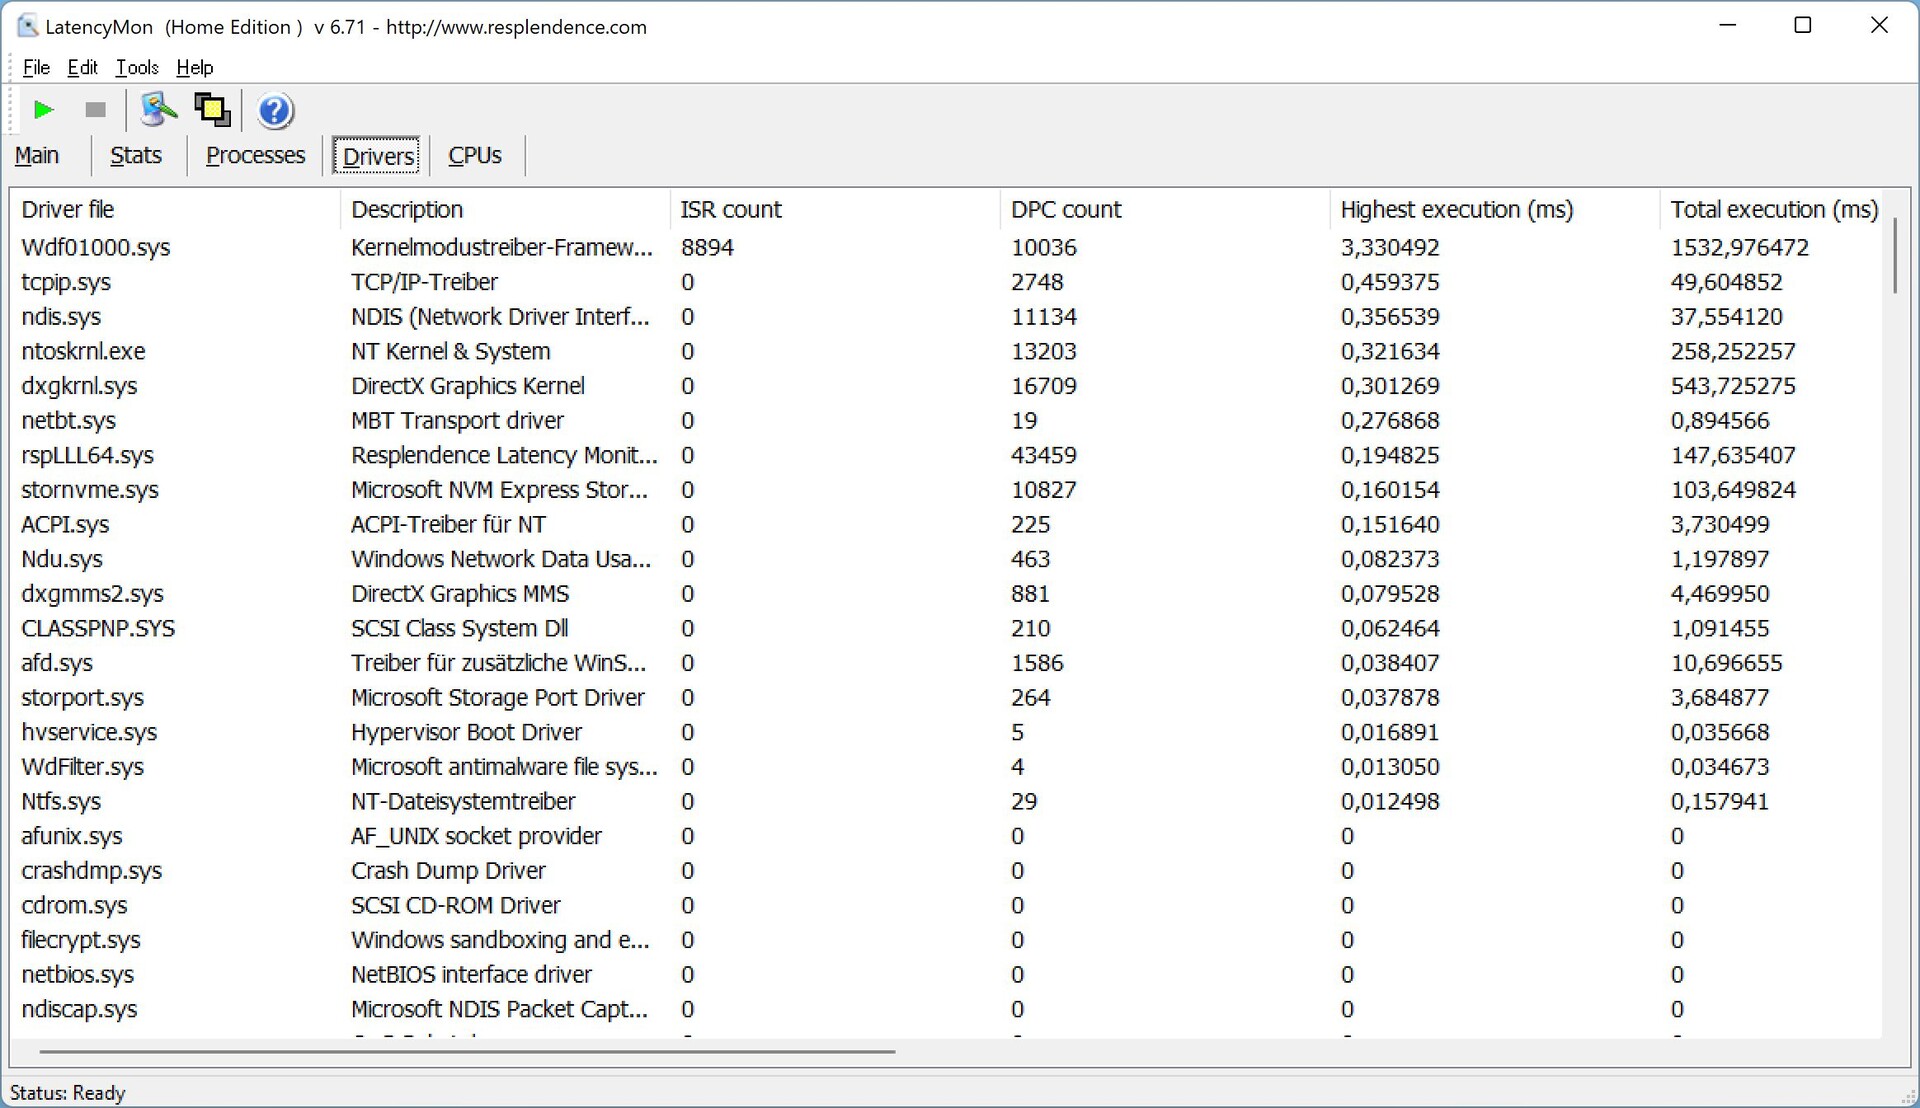
我们的标准化DPC延迟测试确实显示我们的Surface Pro 8评测单元的峰值很高,但 "中断到处理的延迟 "仍然很低,所以当你使用实时音频应用程序时应该没有任何限制。
| DPC Latencies / LatencyMon - interrupt to process latency (max), Web, Youtube, Prime95 | |
| Dell Latitude 13 7320 Detachable, i7-1180G7 | |
| Microsoft Surface Pro 8, i7-1185G7 | |
| Lenovo ThinkPad X12 20UVS03G00 | |
| Microsoft Surface Pro 7 Plus | |
* ... smaller is better
存储设备
微软仍然使用PCIe 3.0 x4接口的紧凑型M.2-2230 SSD。不支持更快的4.0标准,东芝的256GB硬盘也不是最快的硬盘之一,但其性能对于日常工作负荷来说仍然绰绰有余,与更快的硬盘相比,用户很可能永远不会发现缺点。
在初始设置之后,你可以将187GB用于自己的文件和应用程序。更多的SSD基准测试可在 这里.

* ... smaller is better
GPU性能
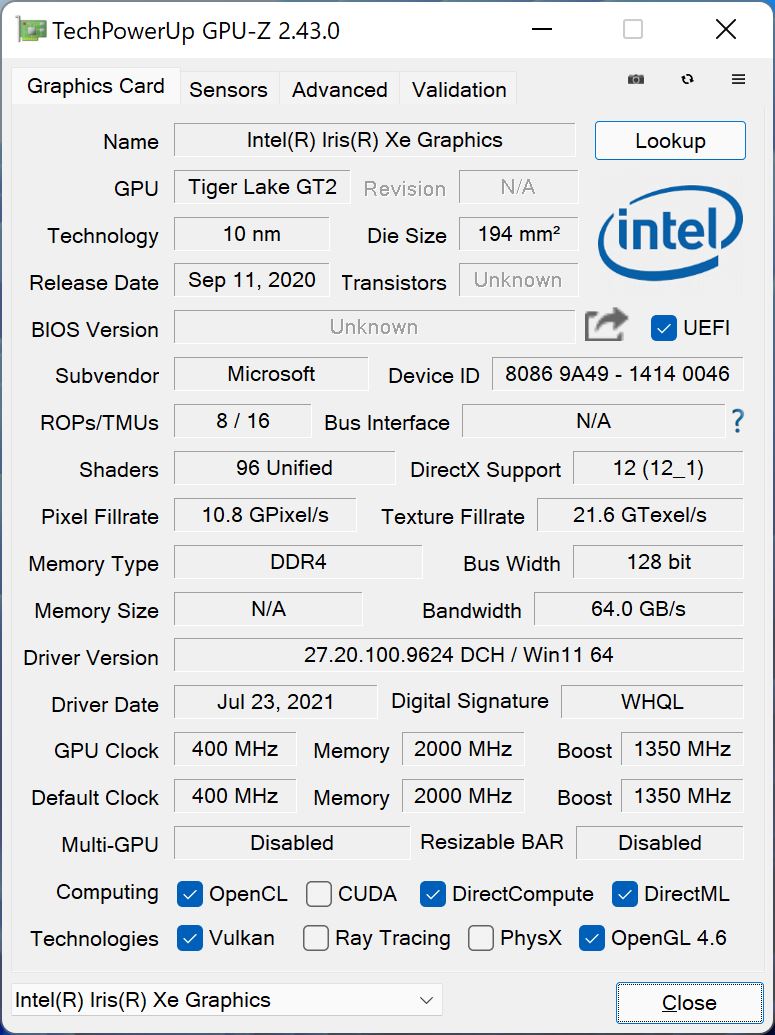
芯片酷睿i7-1185G7配备了最强大的Iris Xe图形G7版本。它有96个执行单元,最大核心时钟为1350 MHz。iGPU也受益于快速的双通道内存,并能管理高基准分数。在持续工作负荷和电池供电的情况下,性能也很稳定。更多的GPU基准测试被列在 这里.
由于快速的Iris GPU,Surface Pro 8非常适合日常多媒体任务,包括高分辨率视频的播放,甚至视频编辑,如果你能使用快速同步。然而,这款敞篷车并不是真正的游戏设备。在旧的或要求不高的游戏中,其性能通常足以满足中等细节的要求,但在现代游戏中,你通常被限制在最低的细节。请访问我们的 技术部分了解更多游戏基准。
| 3DMark 11 Performance | 7349 points | |
| 3DMark Cloud Gate Standard Score | 21039 points | |
| 3DMark Fire Strike Score | 5132 points | |
| 3DMark Time Spy Score | 1858 points | |
Help | ||
| The Witcher 3 | |
| 1366x768 Medium Graphics & Postprocessing | |
| Microsoft Surface Pro 8, i7-1185G7 | |
| Average of class Convertible (44.3 - 77.6, n=2, last 2 years) | |
| Microsoft Surface Pro 7 Plus | |
| Average Intel Iris Xe Graphics G7 96EUs (21.4 - 77.8, n=185) | |
| Dell Latitude 13 7320 Detachable, i7-1180G7 | |
| Lenovo ThinkPad X12 20UVS03G00 | |
| 1920x1080 High Graphics & Postprocessing (Nvidia HairWorks Off) | |
| Microsoft Surface Pro 8, i7-1185G7 | |
| Average of class Convertible (22.9 - 42.8, n=2, last 2 years) | |
| Dell Latitude 13 7320 Detachable, i7-1180G7 | |
| Microsoft Surface Pro 7 Plus | |
| Average Intel Iris Xe Graphics G7 96EUs (10.6 - 45.9, n=191) | |
| Lenovo ThinkPad X12 20UVS03G00 | |
| 1920x1080 Ultra Graphics & Postprocessing (HBAO+) | |
| Average of class Convertible (13.4 - 101, n=3, last 2 years) | |
| Microsoft Surface Pro 8, i7-1185G7 | |
| Average Intel Iris Xe Graphics G7 96EUs (8.79 - 20.1, n=181) | |
| Dell Latitude 13 7320 Detachable, i7-1180G7 | |
| Microsoft Surface Pro 7 Plus | |
| F1 2020 | |
| 1280x720 Ultra Low Preset | |
| Microsoft Surface Pro 8, i7-1185G7 | |
| Average Intel Iris Xe Graphics G7 96EUs (49 - 109.6, n=34) | |
| Microsoft Surface Pro 7 Plus | |
| Lenovo ThinkPad X12 20UVS03G00 | |
| 1920x1080 Medium Preset AF:16x | |
| Microsoft Surface Pro 8, i7-1185G7 | |
| Average Intel Iris Xe Graphics G7 96EUs (23.1 - 57.5, n=34) | |
| Microsoft Surface Pro 7 Plus | |
| Lenovo ThinkPad X12 20UVS03G00 | |
| 1920x1080 High Preset AA:T AF:16x | |
| Microsoft Surface Pro 8, i7-1185G7 | |
| Average Intel Iris Xe Graphics G7 96EUs (22 - 44.4, n=32) | |
| Microsoft Surface Pro 7 Plus | |
Witcher 3 FPS Chart
| low | med. | high | ultra | QHD | |
|---|---|---|---|---|---|
| GTA V (2015) | 96.2 | 83.7 | 33.2 | 12.8 | |
| The Witcher 3 (2015) | 103 | 65 | 35 | 14.7 | |
| Dota 2 Reborn (2015) | 82.2 | 108 | 63.4 | 56.7 | |
| Final Fantasy XV Benchmark (2018) | 48.5 | 26.9 | 26.9 | ||
| X-Plane 11.11 (2018) | 33.6 | 28.8 | 30.2 | ||
| Far Cry 5 (2018) | 55 | 30 | 28 | 26 | |
| Strange Brigade (2018) | 95 | 42 | 33 | 27 | 20 |
| F1 2020 (2020) | 88 | 50 | 36 | 24 |
排放--Surface Pro变得很吵,很热
系统噪音
良好的CPU性能对风扇的噪音也有影响。敞篷车在轻度工作负荷下通常是无声的,但当你给CPU或iGPU施加更多压力时(例如安装应用程序),风扇会很快旋转起来。在压力测试中,我们可以测出近44分贝(A),在游戏中约37分贝(A),所以它比旧的Surface Pro 7.戴尔的Latitude 13尽管采用了较慢的UP4处理器,但声音也同样大,而而ThinkPad X12负载下则安静得多。Apple'siPad Pro在这方面显然有很大的优势,它采用了被动冷却解决方案。我们没有注意到任何电子噪音,如线圈啸叫。
Noise level
| Idle |
| 24.7 / 24.7 / 24.7 dB(A) |
| Load |
| 36.8 / 43.8 dB(A) |
 | ||
30 dB silent 40 dB(A) audible 50 dB(A) loud |
||
min: | ||
| Microsoft Surface Pro 8, i7-1185G7 Iris Xe G7 96EUs, i7-1185G7, Toshiba KBG40ZNS256G NVMe | Lenovo ThinkPad X12 20UVS03G00 Iris Xe G7 96EUs, i7-1160G7, Toshiba BG4 KBG40ZNT512G | Dell Latitude 13 7320 Detachable, i7-1180G7 Iris Xe G7 96EUs, i7-1180G7, WDC PC SN530 SDBPMPZ-265G | Microsoft Surface Pro 7 Iris Plus Graphics G7 (Ice Lake 64 EU), i7-1065G7, Toshiba KBG40ZNS256G NVMe | |
|---|---|---|---|---|
| Noise | 2% | -3% | -9% | |
| off / environment * (dB) | 24.7 | 25.1 -2% | 25.3 -2% | 30.3 -23% |
| Idle Minimum * (dB) | 24.7 | 25.1 -2% | 25.4 -3% | 30.3 -23% |
| Idle Average * (dB) | 24.7 | 25.1 -2% | 25.4 -3% | 30.3 -23% |
| Idle Maximum * (dB) | 24.7 | 26 -5% | 25.4 -3% | 30.3 -23% |
| Load Average * (dB) | 36.8 | 34.6 6% | 37.7 -2% | 31.4 15% |
| Witcher 3 ultra * (dB) | 36.8 | 34.6 6% | 42 -14% | |
| Load Maximum * (dB) | 43.8 | 37 16% | 42.1 4% | 33.7 23% |
* ... smaller is better
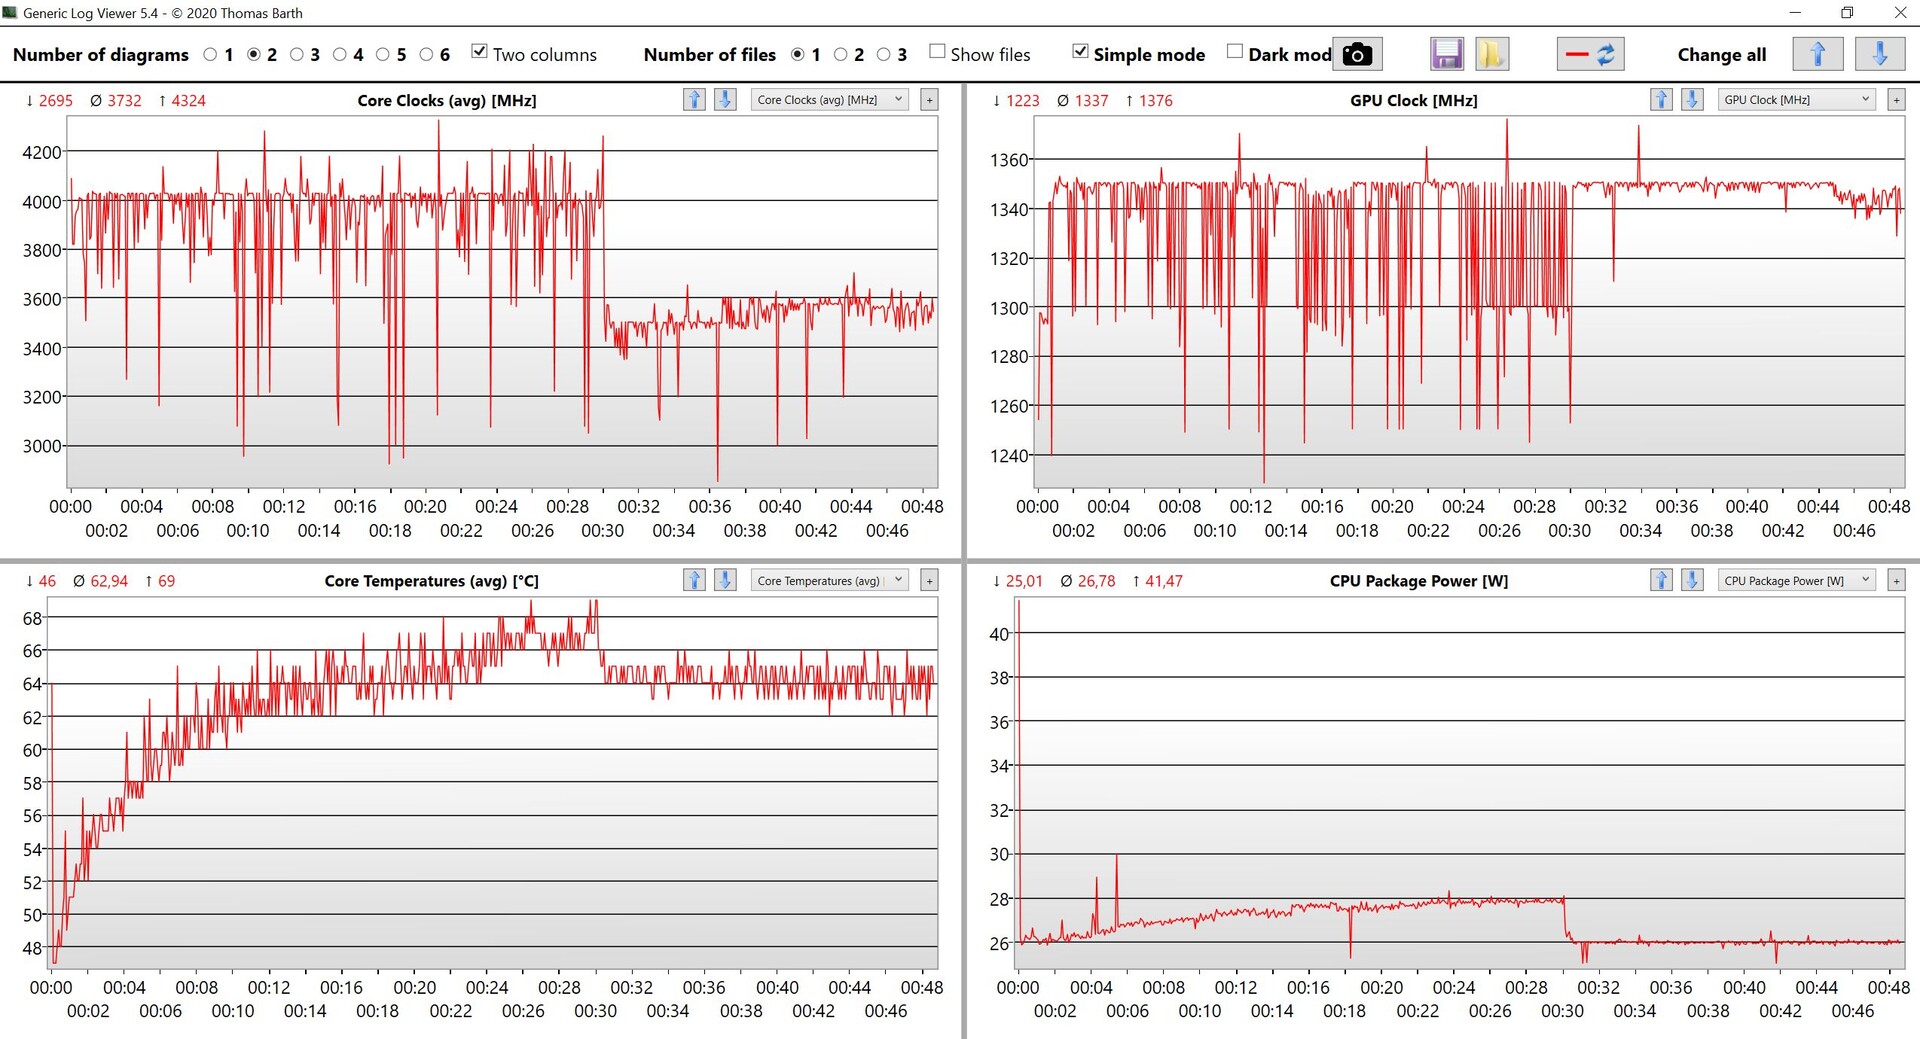
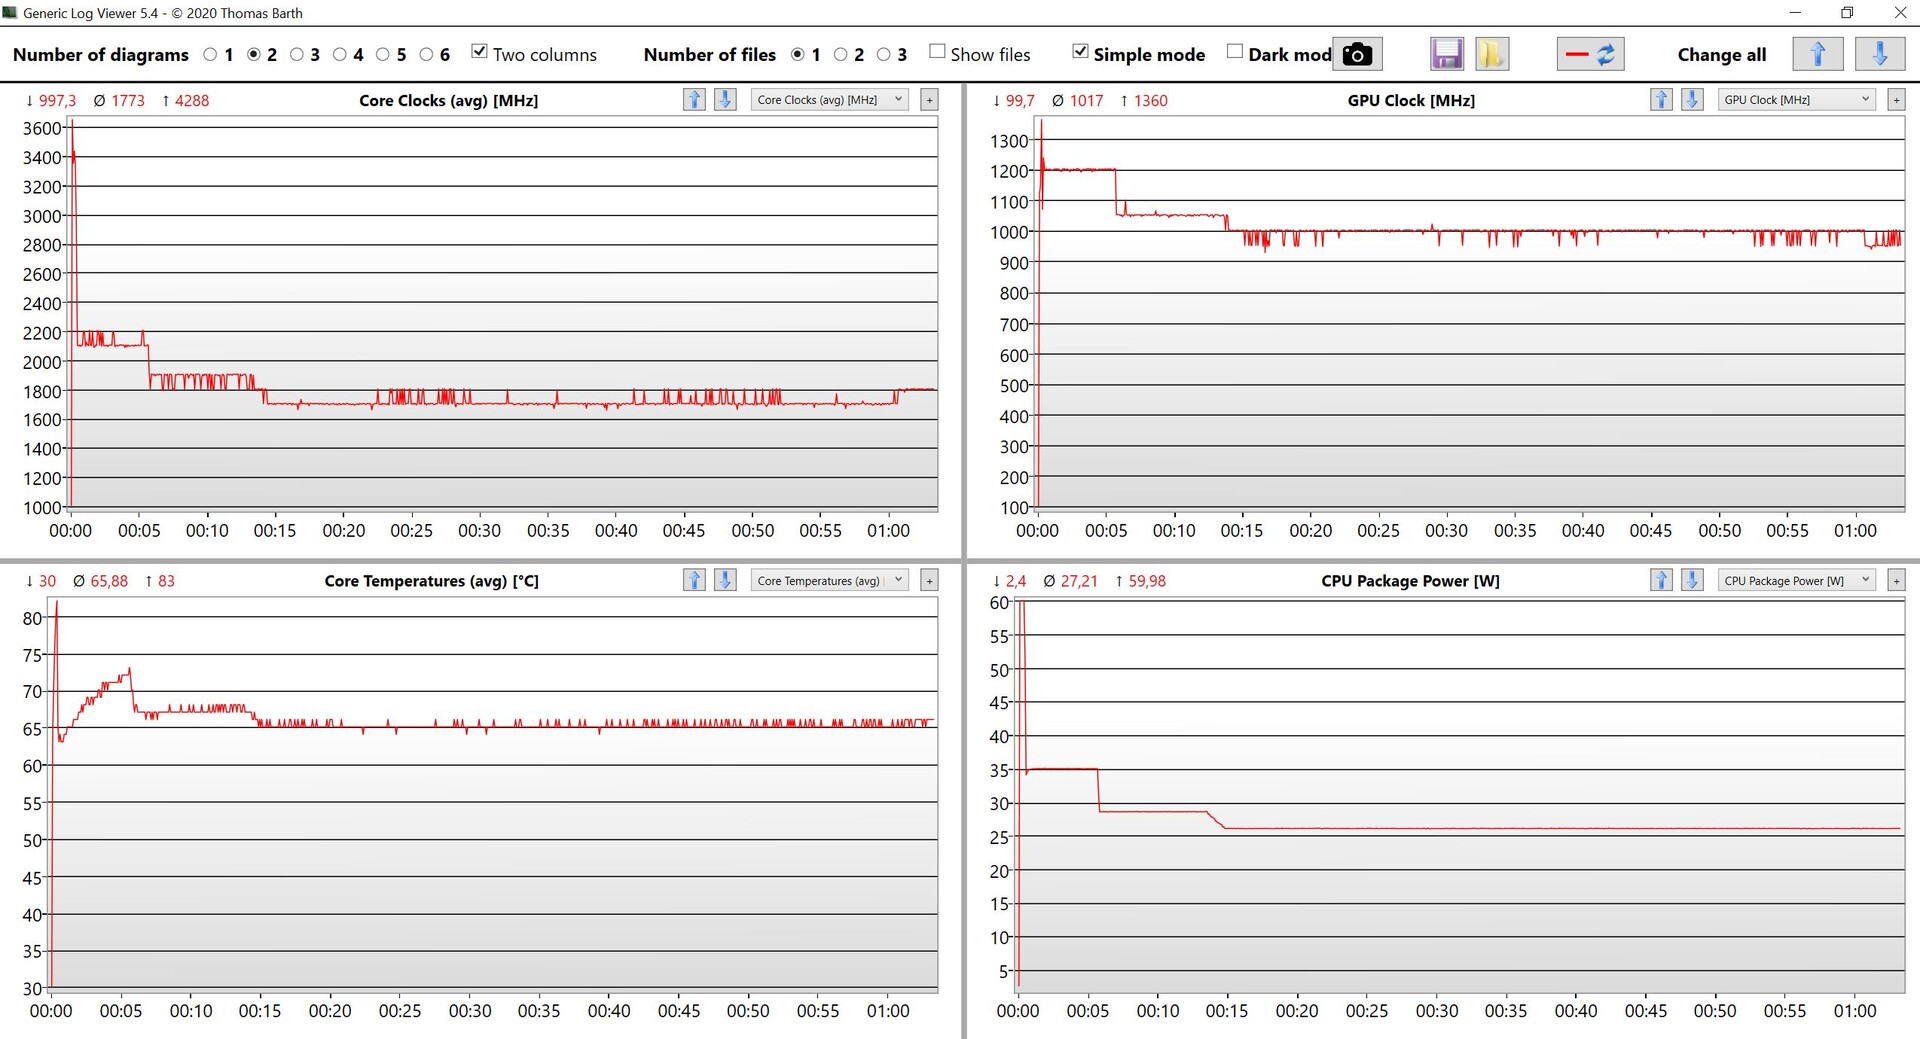
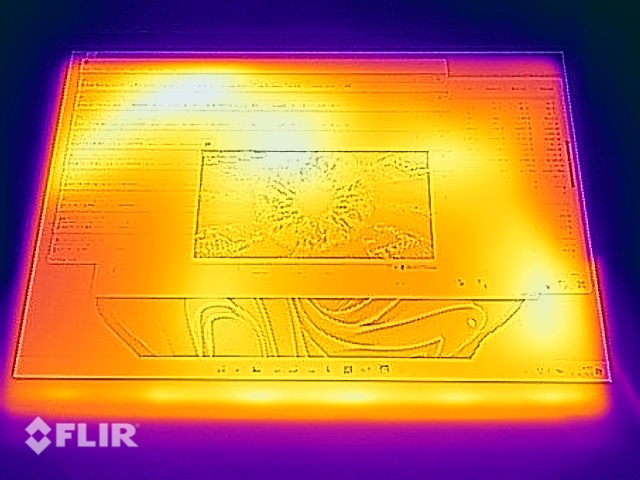
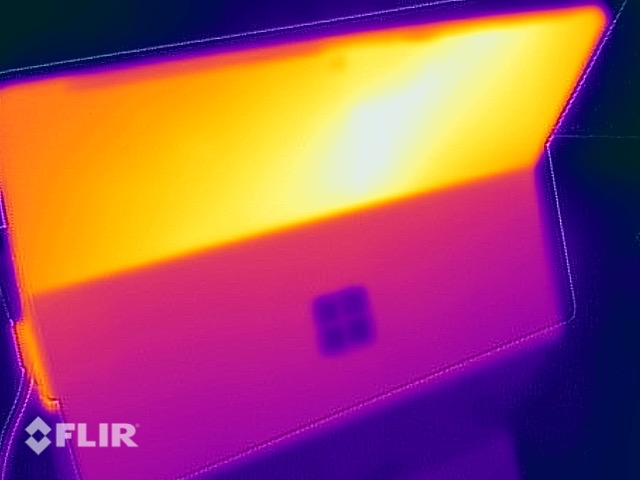
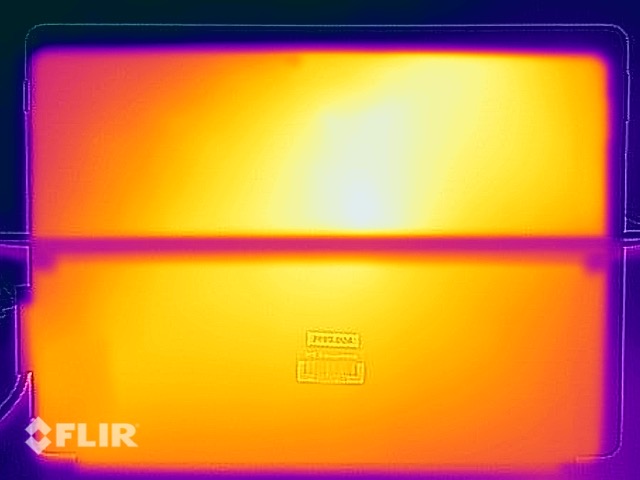
温度
在日常情况下没有温度问题,但金属表面在负载下会明显发热。在游戏和压力测试期间,我们可以在后部测量到约47°C的温度,由于金属表面的原因,这是不舒服的。正面也达到44℃左右,但由于玻璃表面,主观感觉更舒适。我们建议你触摸脚架,它可以保持凉爽,当你想在负载下携带敞篷车时。
在压力测试中,对于一个紧凑的敞篷车来说,其性能出奇的稳定。它可以在大约5分钟内保持35W的TDP,然后下降到~29W,大约9分钟后又下降到~26W。在压力测试之后,性能并没有立即受到限制。
(±) The maximum temperature on the upper side is 45 °C / 113 F, compared to the average of 35.4 °C / 96 F, ranging from 19.6 to 60 °C for the class Convertible.
(-) The bottom heats up to a maximum of 47.2 °C / 117 F, compared to the average of 36.9 °C / 98 F
(+) In idle usage, the average temperature for the upper side is 23.4 °C / 74 F, compared to the device average of 30.3 °C / 87 F.
(-) Playing The Witcher 3, the average temperature for the upper side is 44.1 °C / 111 F, compared to the device average of 30.3 °C / 87 F.
(-) The palmrests and touchpad can get very hot to the touch with a maximum of 45.1 °C / 113.2 F.
(-) The average temperature of the palmrest area of similar devices was 28 °C / 82.4 F (-17.1 °C / -30.8 F).
| Microsoft Surface Pro 8, i7-1185G7 Intel Core i7-1185G7, Intel Iris Xe Graphics G7 96EUs | Lenovo ThinkPad X12 20UVS03G00 Intel Core i7-1160G7, Intel Iris Xe Graphics G7 96EUs | Dell Latitude 13 7320 Detachable, i7-1180G7 Intel Core i7-1180G7, Intel Iris Xe Graphics G7 96EUs | Apple iPad Pro 12.9 2021 A2378 Apple M1, Apple M1 8-Core GPU | Microsoft Surface Pro 7 Plus Intel Core i5-1135G7, Intel Iris Xe Graphics G7 80EUs | |
|---|---|---|---|---|---|
| Heat | 3% | -9% | -5% | -5% | |
| Maximum Upper Side * (°C) | 45 | 39 13% | 38.8 14% | 37 18% | 42.9 5% |
| Maximum Bottom * (°C) | 47.2 | 41.7 12% | 40 15% | 35 26% | 44.8 5% |
| Idle Upper Side * (°C) | 24.1 | 25.6 -6% | 31 -29% | 33 -37% | 28.8 -20% |
| Idle Bottom * (°C) | 23.4 | 25.6 -9% | 31.6 -35% | 30 -28% | 25.8 -10% |
* ... smaller is better
发言人
两个扬声器位于屏幕的一侧,将声音引向用户。结果是非常好的,声音丰富而有力。机箱在较高音量时略有振动,但没有失真。Apple'siPad Pro有一个更好的声音系统,但你仍然可以在Surface Pro 8上享受一些音乐和视频。
Microsoft Surface Pro 8, i7-1185G7 audio analysis
(±) | speaker loudness is average but good (81.9 dB)
Bass 100 - 315 Hz
(±) | reduced bass - on average 13.1% lower than median
(±) | linearity of bass is average (10.5% delta to prev. frequency)
Mids 400 - 2000 Hz
(+) | balanced mids - only 4.3% away from median
(+) | mids are linear (3.8% delta to prev. frequency)
Highs 2 - 16 kHz
(+) | balanced highs - only 4.4% away from median
(+) | highs are linear (3.6% delta to prev. frequency)
Overall 100 - 16.000 Hz
(+) | overall sound is linear (13.7% difference to median)
Compared to same class
» 18% of all tested devices in this class were better, 5% similar, 77% worse
» The best had a delta of 6%, average was 20%, worst was 57%
Compared to all devices tested
» 15% of all tested devices were better, 4% similar, 81% worse
» The best had a delta of 4%, average was 23%, worst was 134%
Apple iPad Pro 12.9 2021 A2378 audio analysis
(+) | speakers can play relatively loud (83.9 dB)
Bass 100 - 315 Hz
(±) | reduced bass - on average 5.8% lower than median
(±) | linearity of bass is average (8.7% delta to prev. frequency)
Mids 400 - 2000 Hz
(+) | balanced mids - only 2.9% away from median
(+) | mids are linear (4.1% delta to prev. frequency)
Highs 2 - 16 kHz
(+) | balanced highs - only 2.9% away from median
(+) | highs are linear (6.9% delta to prev. frequency)
Overall 100 - 16.000 Hz
(+) | overall sound is linear (7.9% difference to median)
Compared to same class
» 1% of all tested devices in this class were better, 1% similar, 99% worse
» The best had a delta of 7%, average was 20%, worst was 129%
Compared to all devices tested
» 2% of all tested devices were better, 1% similar, 98% worse
» The best had a delta of 4%, average was 23%, worst was 134%
能源管理--120赫兹模式耗费电池寿命
消耗功率
我们的空闲测量显示出更好的消耗值,尽管屏幕略大。新的Surface Pro 8在负载下消耗更多电量,这是性能利用率提高的结果。我们的测量值高达63W,但该值会下降类似于TDP,并在48W时趋于平缓,所以附带的65W电源适配器已经足够了。
微软应该再看看待机时和设备关闭时的消耗,分别为1.6和1.26W,太高了。
| Off / Standby | |
| Idle | |
| Load |
|
Key:
min: | |
| Microsoft Surface Pro 8, i7-1185G7 i7-1185G7, Iris Xe G7 96EUs, Toshiba KBG40ZNS256G NVMe, IPS, 2880x1920, 13" | Lenovo ThinkPad X12 20UVS03G00 i7-1160G7, Iris Xe G7 96EUs, Toshiba BG4 KBG40ZNT512G, a-Si IPS LED, 1920x1280, 12.3" | Dell Latitude 13 7320 Detachable, i7-1180G7 i7-1180G7, Iris Xe G7 96EUs, WDC PC SN530 SDBPMPZ-265G, IPS, 1920x1280, 13" | Apple iPad Pro 12.9 2021 A2378 M1, M1 8-Core GPU, 128 GB NVMe, IPS mini-LED, 2732x2048, 12.9" | Microsoft Surface Pro 7 Plus i5-1135G7, Iris Xe G7 80EUs, Samsung PM991 MZ9LQ256HBJQ, IPS, 2736x1824, 12.3" | Average Intel Iris Xe Graphics G7 96EUs | Average of class Convertible | |
|---|---|---|---|---|---|---|---|
| Power Consumption | 19% | 32% | 39% | -8% | -11% | 5% | |
| Idle Minimum * (Watt) | 3.9 | 4 -3% | 2.5 36% | 1.8 54% | 5.5 -41% | 5.51 ? -41% | 4.2 ? -8% |
| Idle Average * (Watt) | 8.5 | 5.9 31% | 4.8 44% | 9.6 -13% | 9.1 -7% | 8.66 ? -2% | 6.89 ? 19% |
| Idle Maximum * (Watt) | 9.8 | 8.3 15% | 6 39% | 9.8 -0% | 10.8 -10% | 10.9 ? -11% | 8.63 ? 12% |
| Load Average * (Watt) | 48 | 30.1 37% | 31.9 34% | 12.2 75% | 39.2 18% | 45.6 ? 5% | 44.1 ? 8% |
| Witcher 3 ultra * (Watt) | 41.5 | 30.8 26% | 26.2 37% | ||||
| Load Maximum * (Watt) | 63 | 59 6% | 61 3% | 12.6 80% | 62.5 1% | 67.8 ? -8% | 66.5 ? -6% |
* ... smaller is better
Energieaufnahme Witcher 3 / Stresstest
电池运行时间
电池容量比以前略高(51.5瓦对48.9瓦),但Surface Pro 8在与对手的较量中很艰难。我们在150尼特的Wi-Fi测试中只运行了7.5小时,而在最大亮度下只运行了约5小时。你也可以注意到120赫兹刷新率对电池电量的影响,因为150尼特的Wi-Fi运行时间将下降到6小时多一点。在视频测试中,这款敞篷车确实受益于高效的视频解码器,我们确定了大约10小时。
| Microsoft Surface Pro 8, i7-1185G7 i7-1185G7, Iris Xe G7 96EUs, 51.5 Wh | Lenovo ThinkPad X12 20UVS03G00 i7-1160G7, Iris Xe G7 96EUs, 42 Wh | Dell Latitude 13 7320 Detachable, i7-1180G7 i7-1180G7, Iris Xe G7 96EUs, 40 Wh | Apple iPad Pro 12.9 2021 A2378 M1, M1 8-Core GPU, 40.88 Wh | Microsoft Surface Pro 7 Plus i5-1135G7, Iris Xe G7 80EUs, 48.9 Wh | Average of class Convertible | |
|---|---|---|---|---|---|---|
| Battery runtime | 25% | 60% | 113% | 80% | 50% | |
| H.264 (h) | 10.1 | 10 -1% | 13.6 35% | 10.8 7% | 15 ? 49% | |
| WiFi v1.3 (h) | 7.6 | 8.2 8% | 11 45% | 11.2 47% | 8.1 7% | 12 ? 58% |
| Load (h) | 1.2 | 2 67% | 2.1 75% | 4.3 258% | 3.9 225% | 1.713 ? 43% |
| Reader / Idle (h) | 17.7 | 13.6 | 26.7 ? |
Pros
Cons
结论 - Surface Pro 8有很多改进
第八代Surface Pro提供了一些重要的改进,你会立即注意到更大的屏幕。机箱尺寸相似,边框更窄,但仍有足够的空间容纳一个良好的5MP网络摄像头。的PWM问题。的PWM问题的PWM问题也消失了,120赫兹模式(不幸的是隐藏在设置中)创造了一个更平滑的画面印象。
高质量的机箱没有改变,只是集成的脚架仍然非常薄和灵活,而且铰链也有一些间隙。微软升级了连接性;除了熟悉的Surface连接器外,可折叠机现在配备了两个USB-C端口,包括支持雷电4。这意味着用户不再局限于微软的对接方案了。敞篷车通常很适合移动工作,但微软仍然没有为私人客户提供LTE模块。在2021年底,我们会期待所有型号的产品都有可选的5G调制解调器。
新的Surface Pro 8也比以前更快,其酷睿i7-1185G7受益于高功率限制和最快版本的Iris Xe Graphics G7。然而,这导致了更大的风扇噪音,以及负载下更高的机箱温度。我们可以接受这一点,因为在大多数日常工作负荷中,这款敞篷车仍然是安静的,而且你仍然可以通过Windows电源设置影响其行为。
新的微软Surface Pro 8现在具有Thunderbolt 4,一个具有120赫兹刷新率的更大的屏幕和一个强大的Core i7 CPU,但这样一个移动设备应该为所有客户群提供一个可选的5G调制解调器。
可选的键盘笔组合绝对是一个有用的补充,但280欧元的价格并不便宜。我们非常喜欢笔的集成托盘,它还支持自动充电。然而,平板电脑和键盘的组合并不比许多13英寸显示屏的副笔记本更轻或更薄。
戴尔和联想的两个主要可转换对手使用的Tiger Lake UP4处理器性能较差,但在其他方面有优势。这款ThinkPad X12提供了更好的键盘,更安静的风扇,并为所有用户提供了LTE连接,而Latitude 13 7320则以更亮的屏幕和更长的电池运行时间而令人信服。Apple'siPad Pro 12.9另一方面,iPad Pro提供了高效的M1处理器,并在某些方面领先(静音操作、更好的屏幕、更长的电池运行时间、可选的5G连接和更便宜的价格),但使用Windows的设备通常仍然更通用。这真的取决于你使用的软件,但对于一些用户来说,iPad Pro绝对是一个不错的选择。
价格和可用性
我们的Surface Pro 8测试装置在亚马逊上的售价为 1599美元。.
Microsoft Surface Pro 8, i7-1185G7
- 11/22/2021 v7 (old)
Andreas Osthoff
Price comparison

