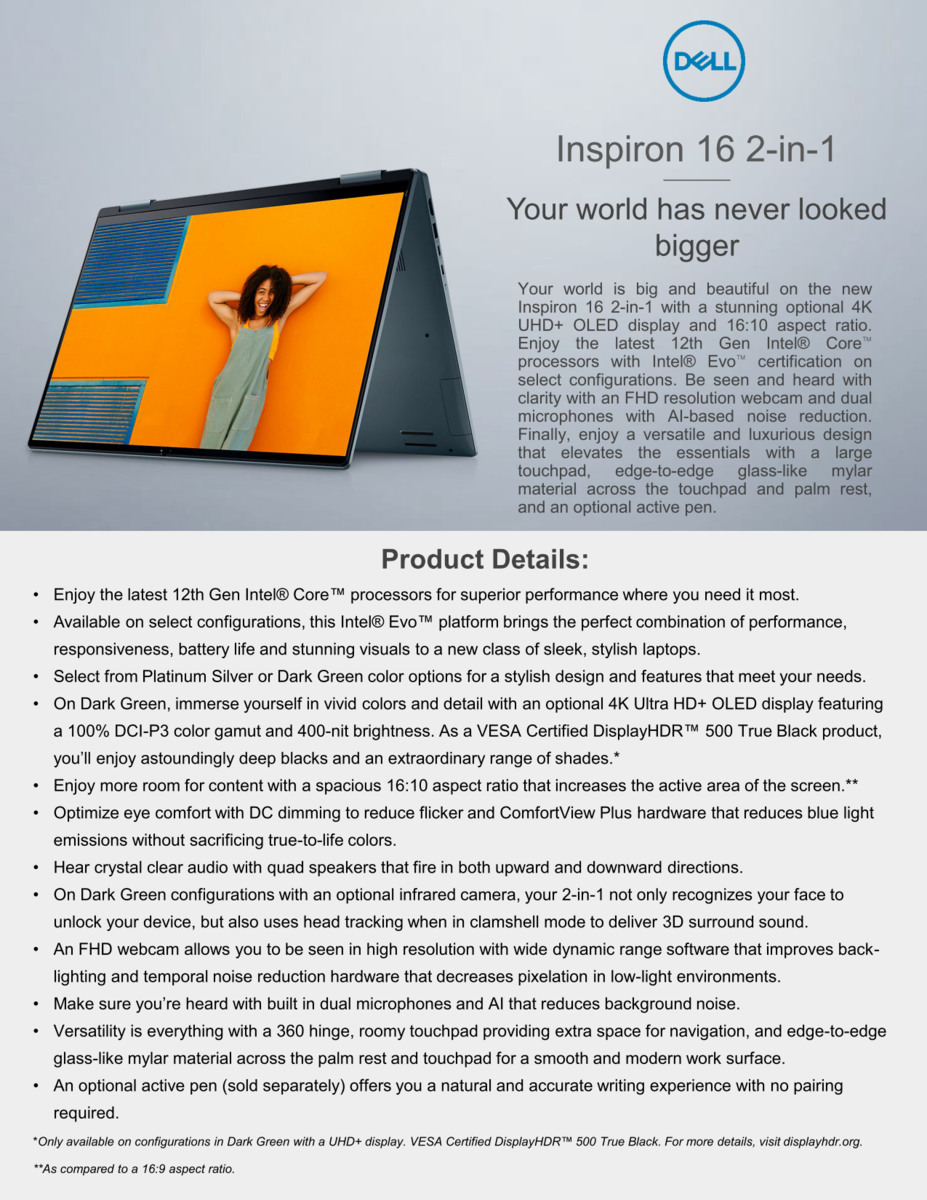
戴尔Inspiron 16 7620二合一敞篷车回顾。麦拉和铝制底盘
Inspiron 16 7620二合一产品接替了使用英特尔第11代CPU的老款Inspiron 16 7610。它引入了第12代英特尔酷睿P系列CPU选项和新的可转换机箱设计,与14英寸Inspiron 14 7420 2合1相似。
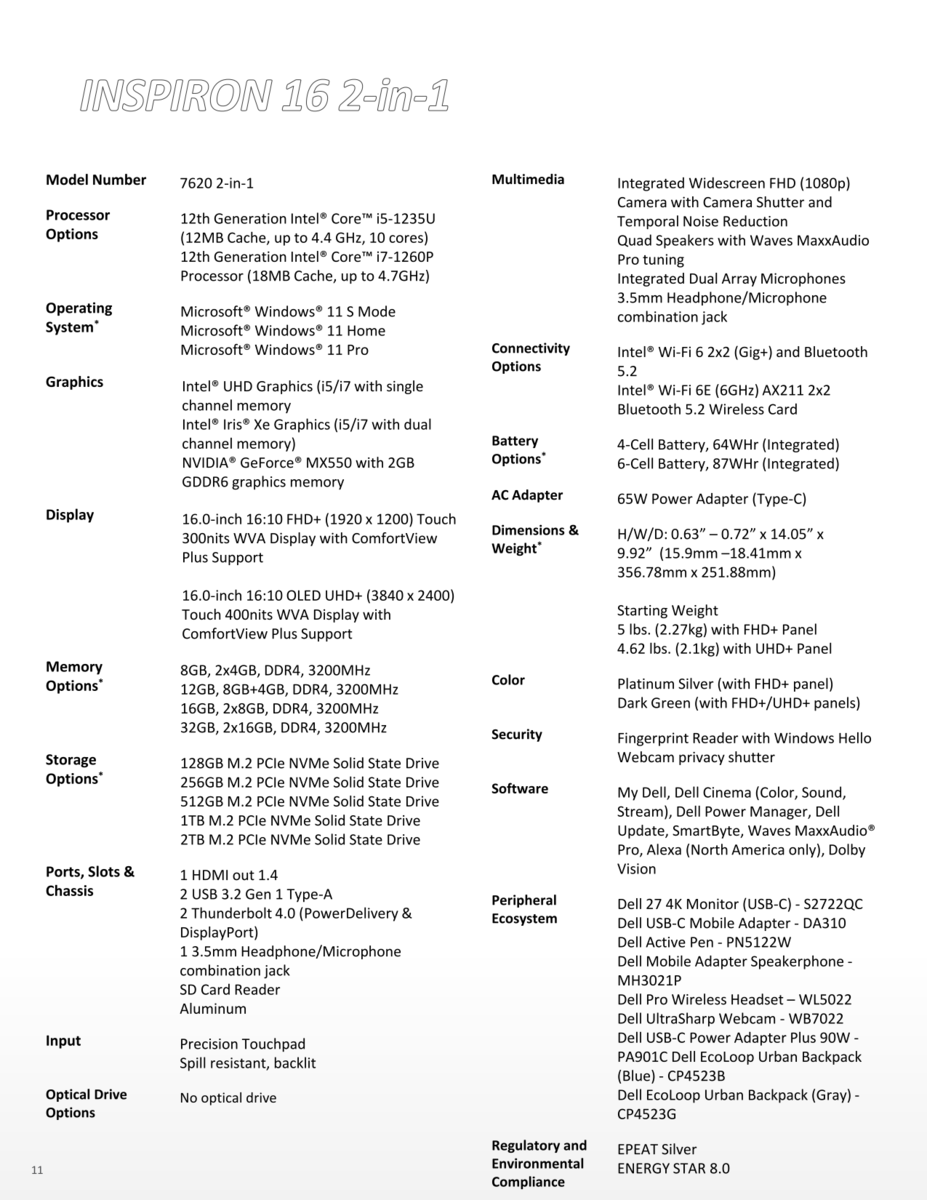
SKU范围从 酷睿i5-1235U到酷睿i7-1260P,配有UHD Graphics 、Iris Xe或独立的GeForce MX550图形,以及1200p或2400p触摸屏。我们审查的SKU是一个中档选择,配备Core i7-1260P CPU,集成Iris Xe和1200p触摸屏,零售价约1250美元。
Inspiron 16 7620二合一的直接竞争对手包括其他16.0英寸的转换机,如 LG Gram 16 2合1或惠普Spectre x360 16。更常见的是,用户会发现15.6英寸的转换产品,而不是像三星Galaxy Book Pro 360 15, HP Envy x360 15, 或华硕ZenBook Flip 15.
更多戴尔评论。
潜在的竞争对手比较
Rating | Date | Model | Weight | Height | Size | Resolution | Price |
|---|---|---|---|---|---|---|---|
| 85.7 % v7 (old) | 06 / 2022 | Dell Inspiron 16 7620 2-in-1 i7-1260P, Iris Xe G7 96EUs | 2.1 kg | 18.41 mm | 16.00" | 1920x1200 | |
| 85.8 % v7 (old) | 12 / 2021 | LG Gram 16 2-in-1 16T90P i7-1165G7, Iris Xe G7 96EUs | 1.5 kg | 17 mm | 16.00" | 2560x1600 | |
| 86.6 % v7 (old) | 03 / 2022 | Samsung Galaxy Book Pro 360 15 NP950QDB-KC3DE i5-1135G7, Iris Xe G7 80EUs | 1.4 kg | 11 mm | 15.60" | 1920x1080 | |
| 86.5 % v7 (old) | 03 / 2020 | Asus ZenBook Flip 15 UX563FD-A1027T i7-10510U, GeForce GTX 1050 Max-Q | 1.9 kg | 19.9 mm | 15.60" | 3840x2160 | |
| 81.2 % v6 (old) | Dell Inspiron 15 5579-9672 i5-8250U, UHD Graphics 620 | 2.1 kg | 20.2 mm | 15.60" | 1920x1080 | ||
| 85 % v7 (old) | HP Spectre X360 15-5ZV31AV i7-10510U, GeForce MX250 | 2.1 kg | 19.3 mm | 15.60" | 3840x2160 |
案例 - 坚固但沉重
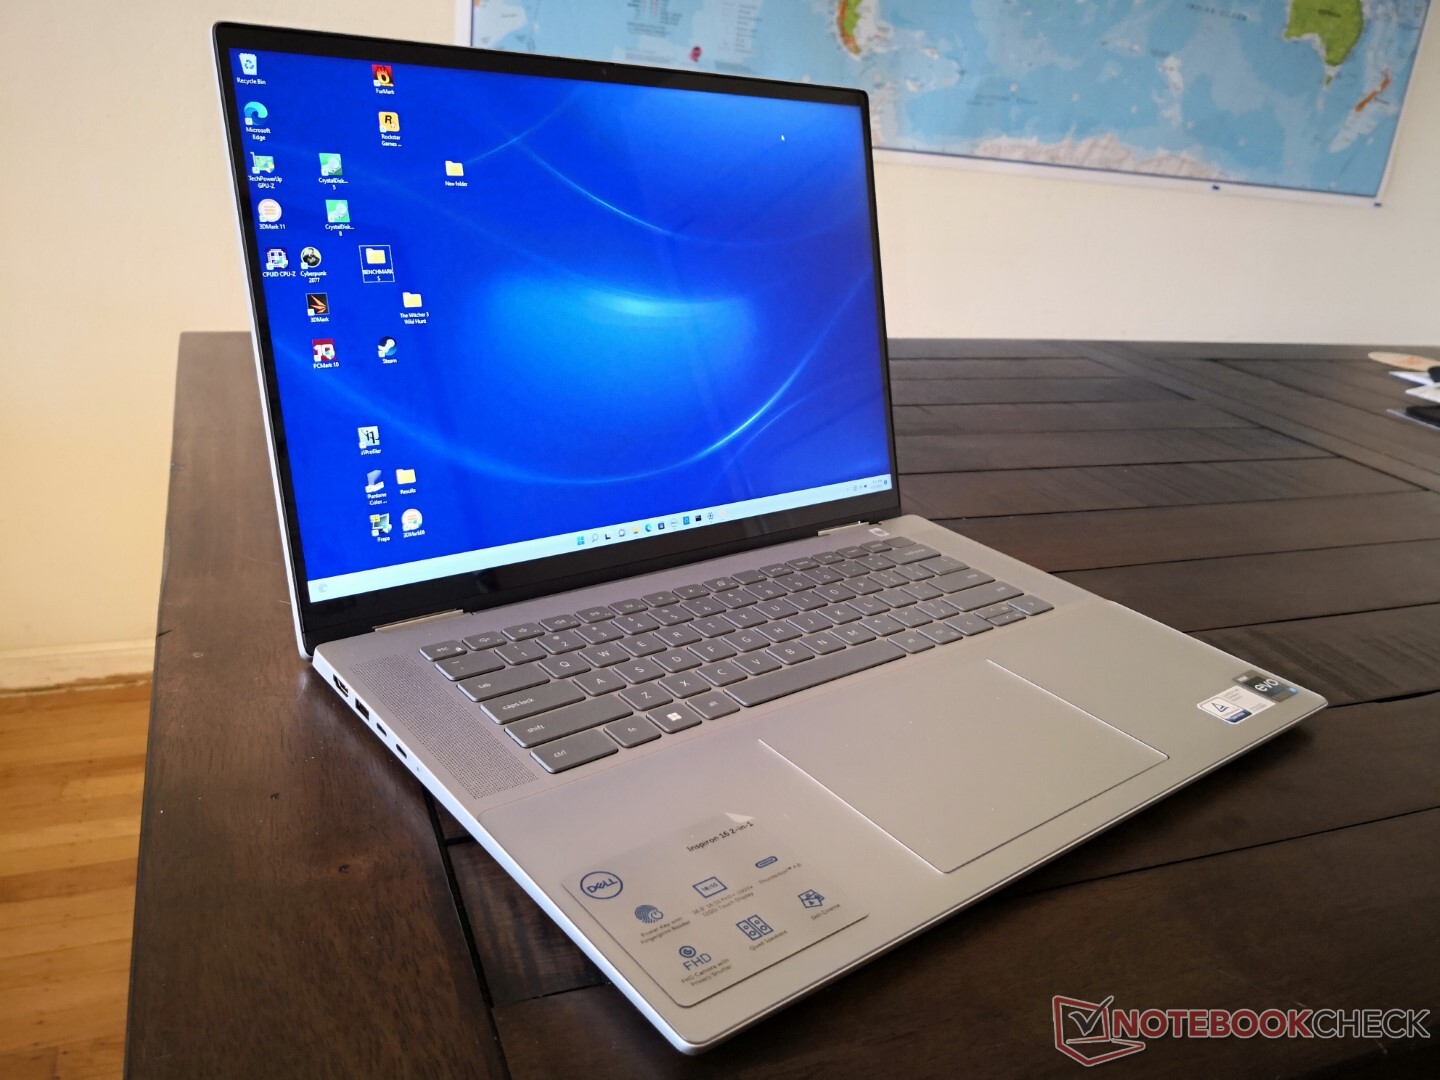
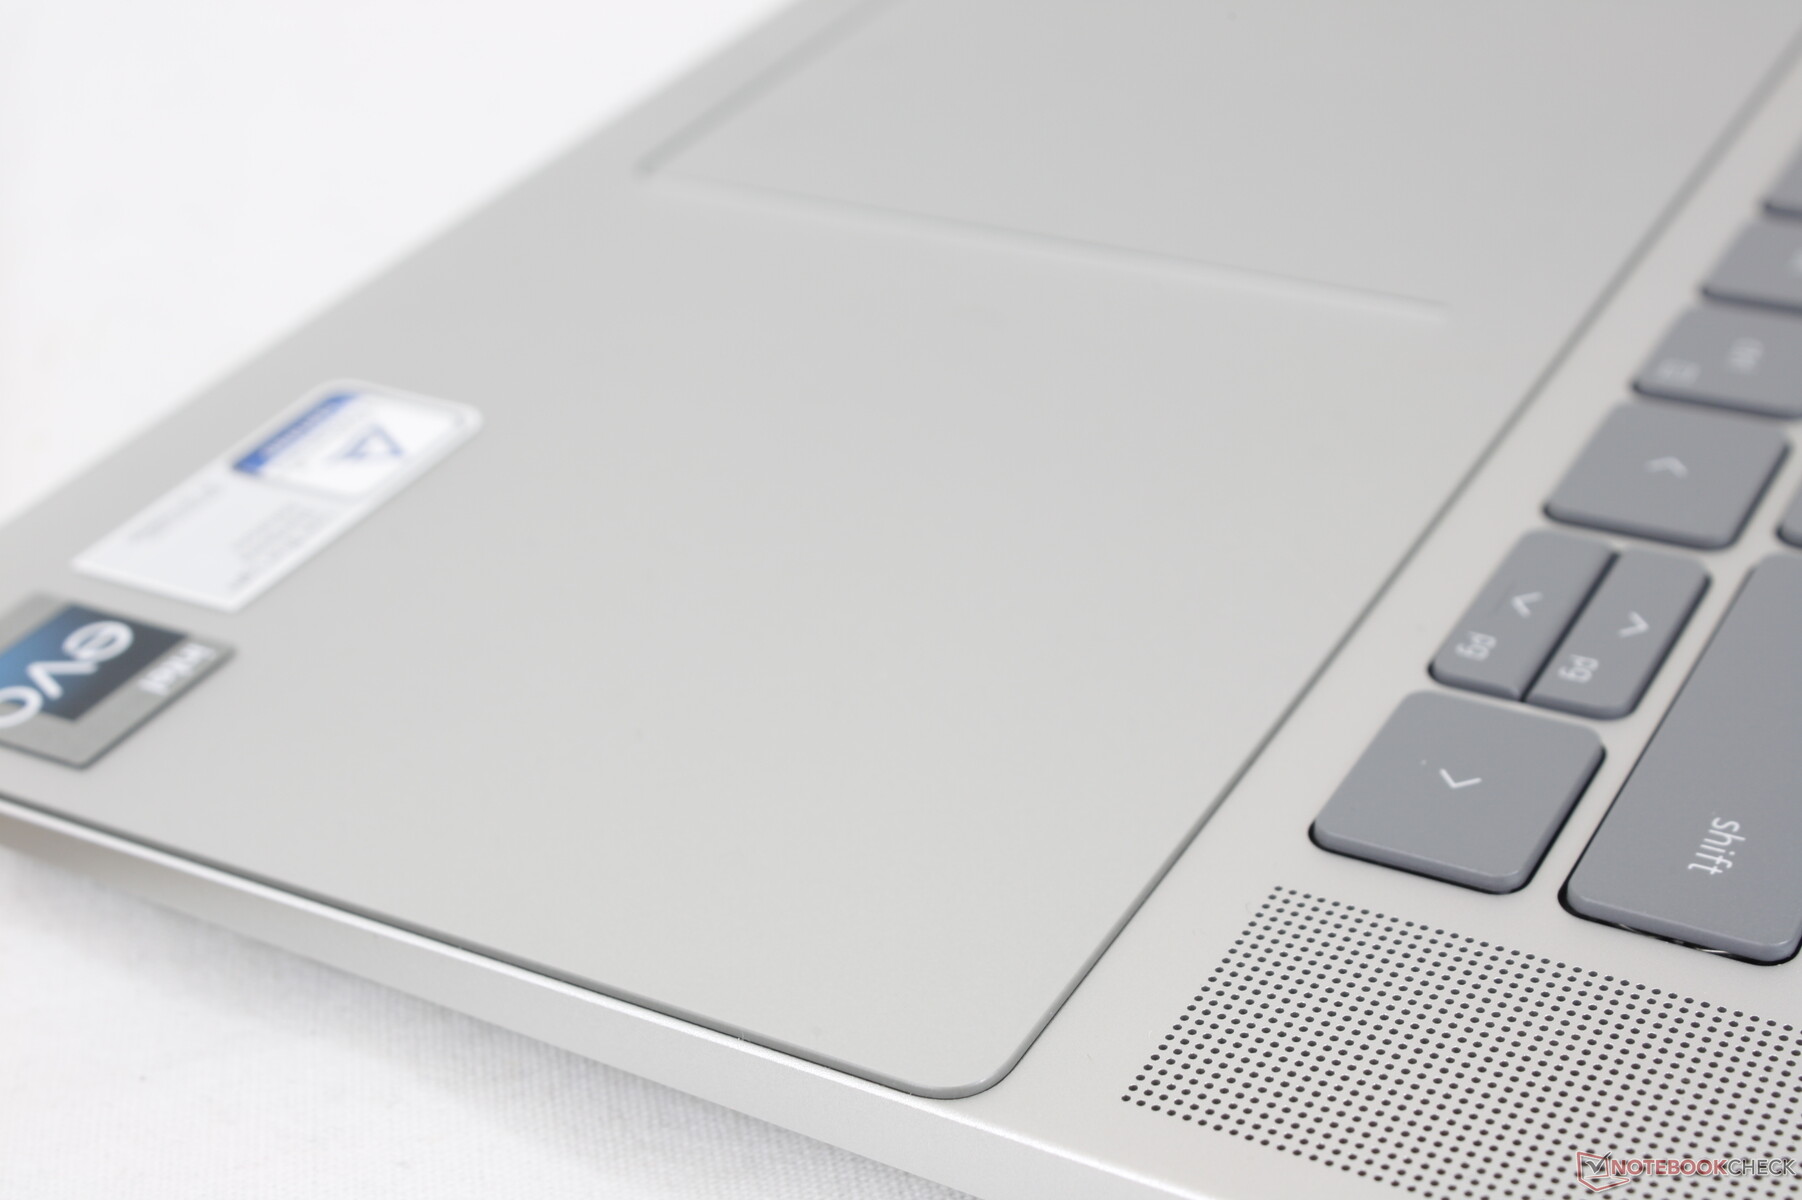
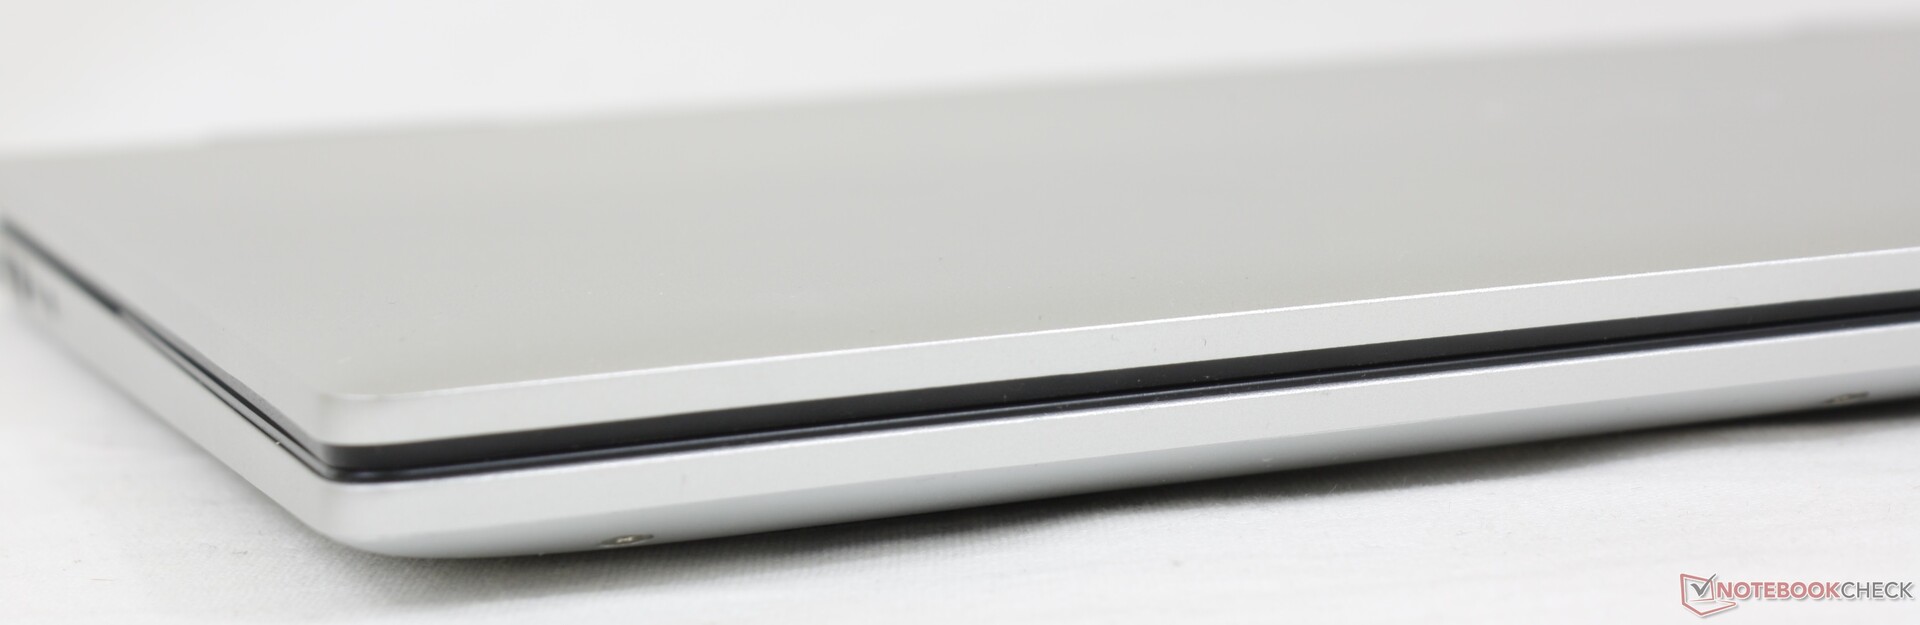
该系统设计基本上是Inspiron 14 7420二合一的放大版。光滑的哑光铝制机箱以及掌托和点击板上的标志性胶布层依然存在。建造质量很扎实,与上一代Inspiron 7610相当,只有在对键盘中心或外盖施加压力时才会出现轻微的翘曲。骨架明显比LG Gram 16 2-in-1和Samsung Book Pro x360 15-in-1要强。 三星Galaxy Book Pro x360 15例如。
就尺寸和重量而言,该机型实际上比即将推出的Inspiron 7610略大且重,正如我们下面的对比插件所示。我们怀疑,将7620系列变成可折叠式而不是传统的蛤壳式的决定很可能导致了尺寸和重量的增加。尺寸与2019年的惠普Spectre x360 15和LG Gram 16二合一产品相当接近,而重量却比超轻的LG多出半公斤。额外的重量是Inspiron用户为物理上更强大的底盘所必须付出的代价。
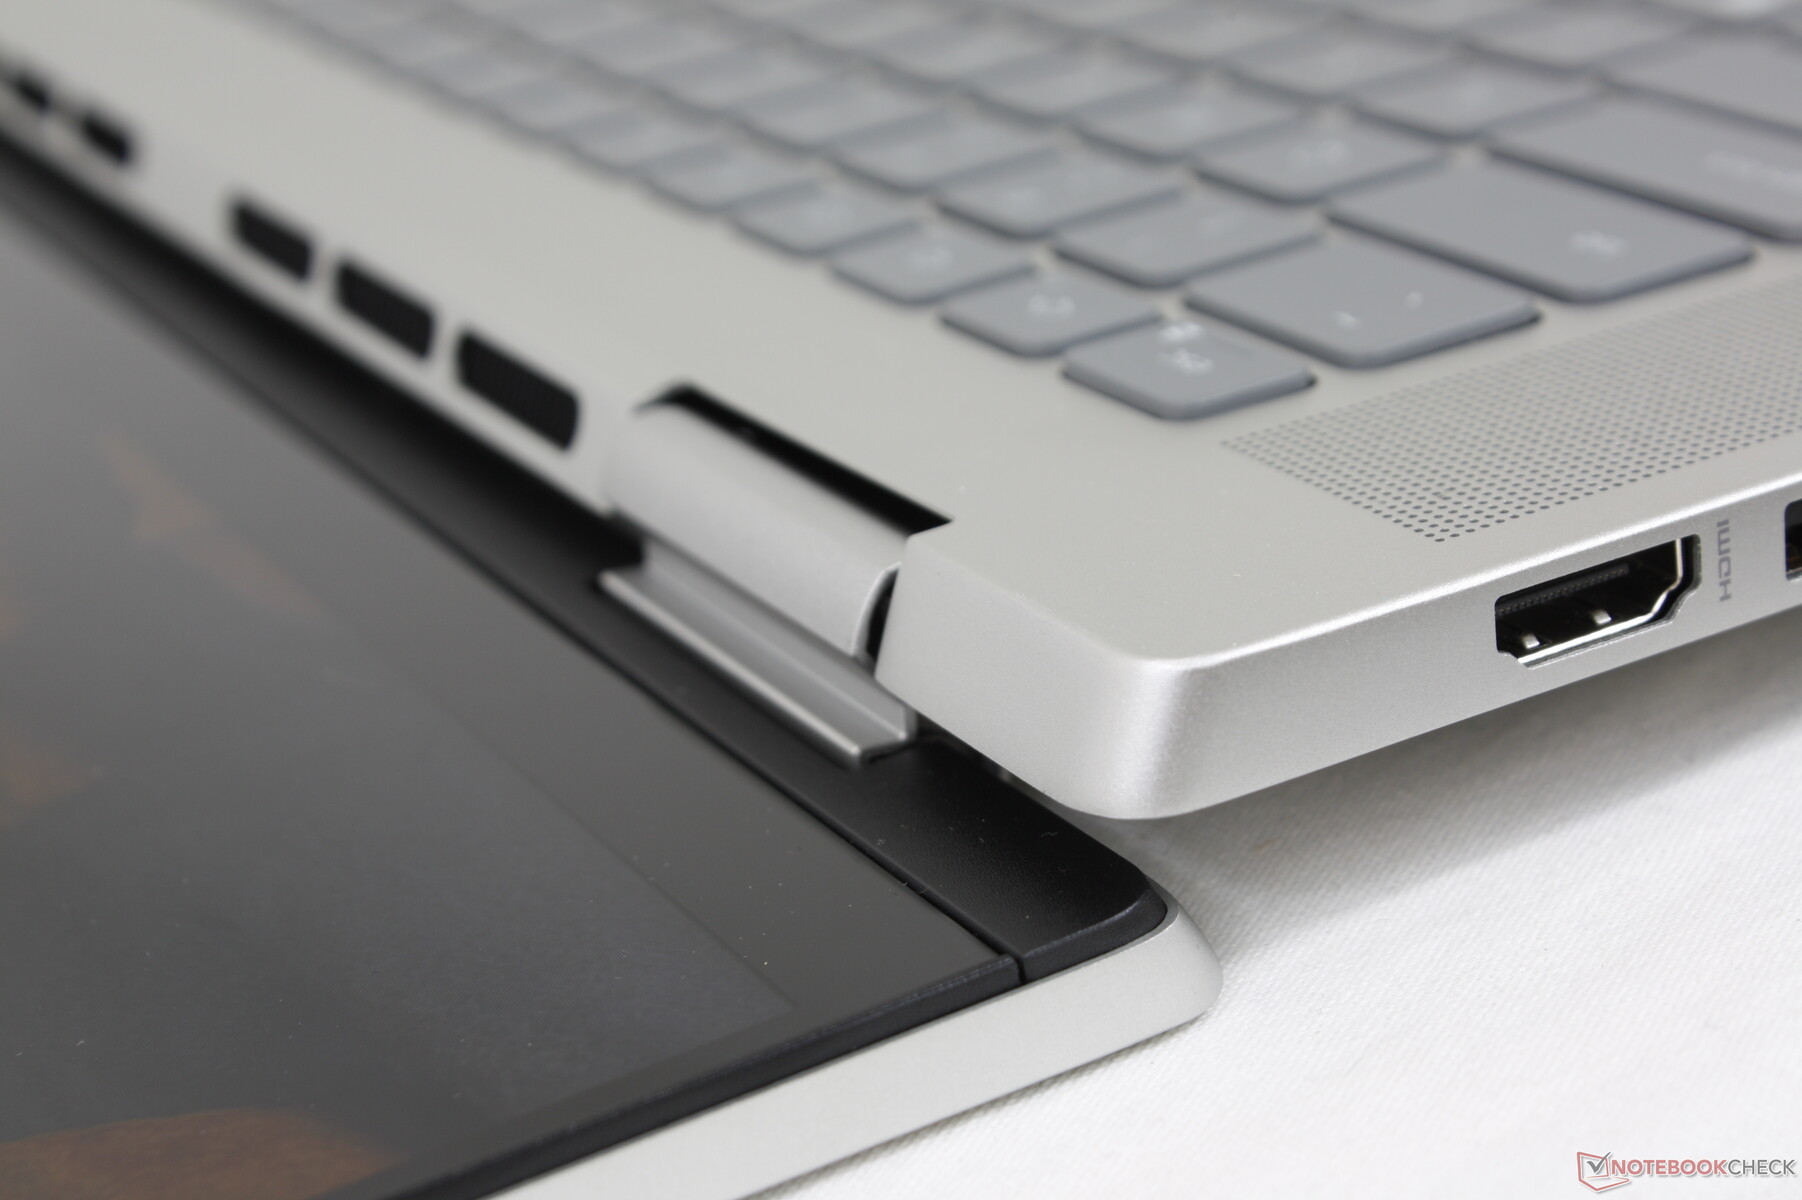
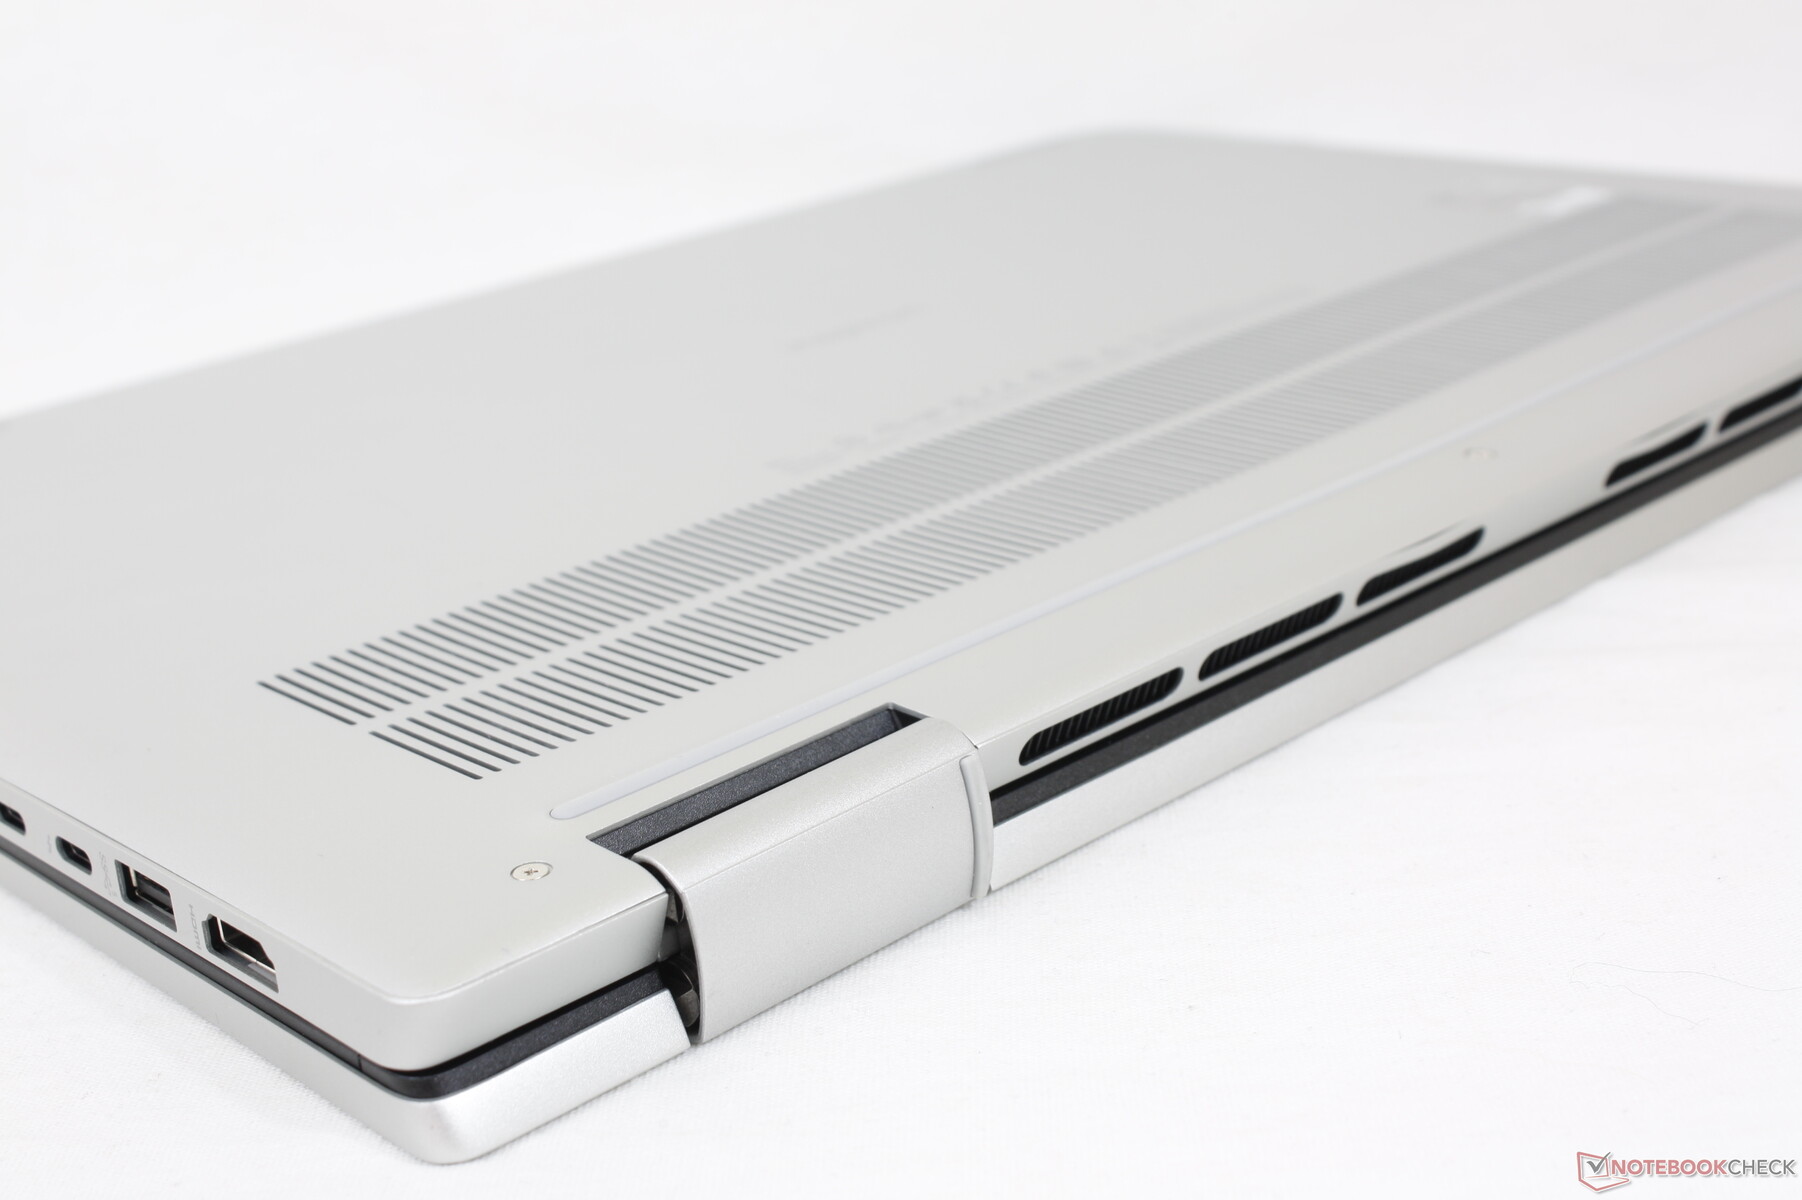
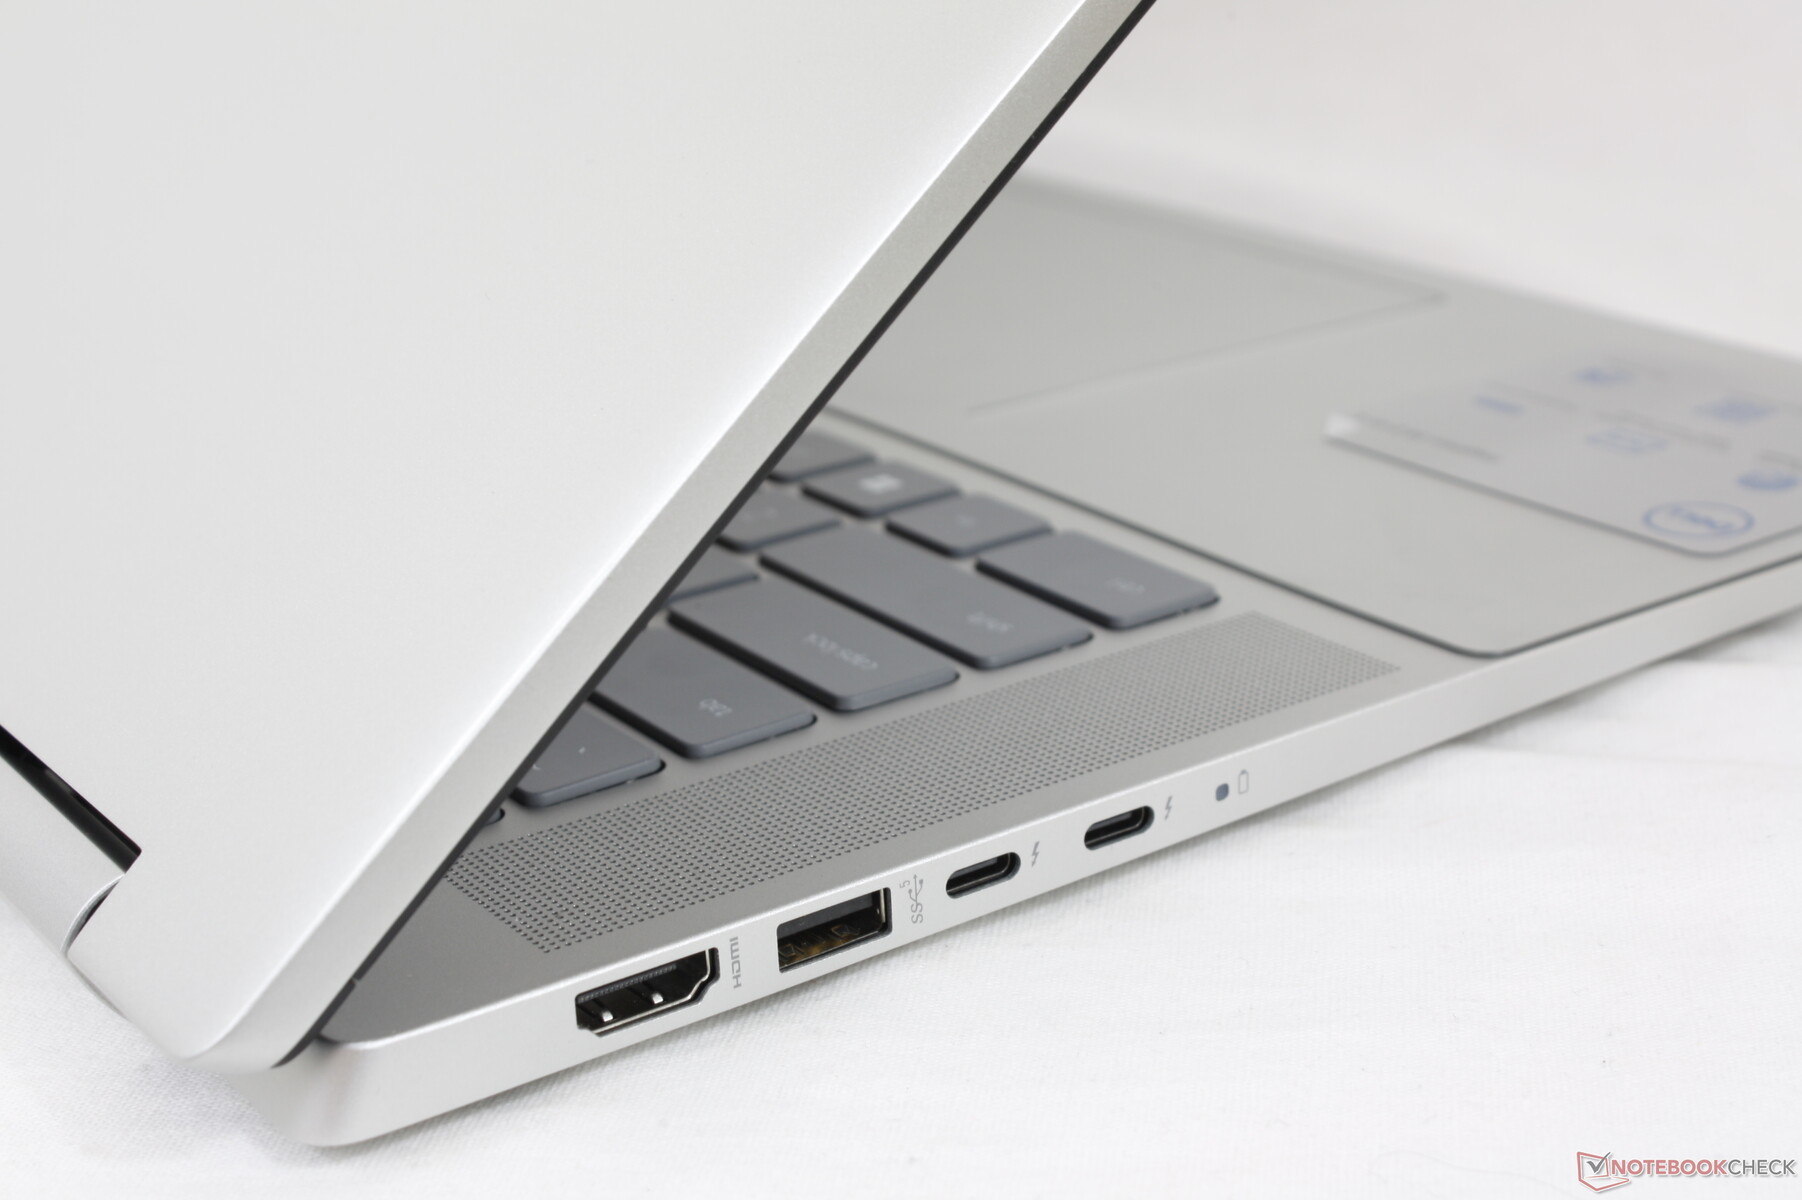
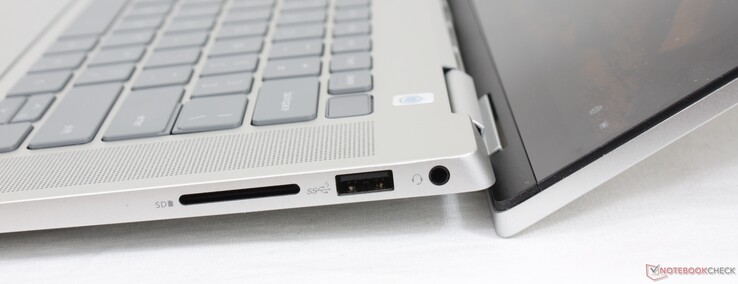
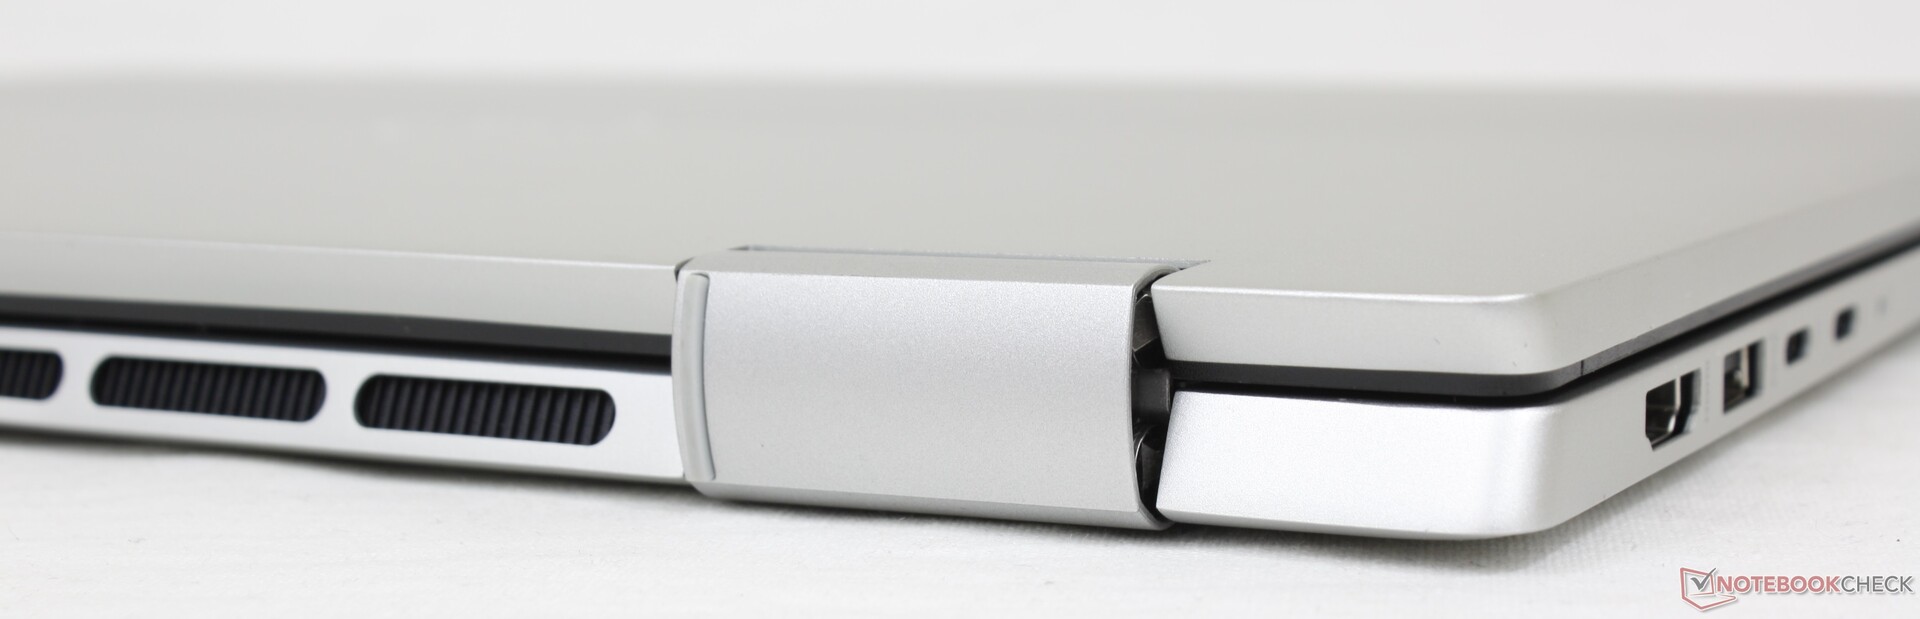
连接性 - 双雷电4
端口选项非常好,因为像LG Gram 16二合一或Spectre x360 15这样的竞争机型往往配备较少的USB-A端口或根本没有HDMI选项。然而,请记住,这里的HDMI 1.4端口不能支持60 FPS的4K视频输出。
沿着左侧边缘的两个USB-C端口都支持Thunderbolt设备,这意味着如果需要,用户可以连接外部GPU。
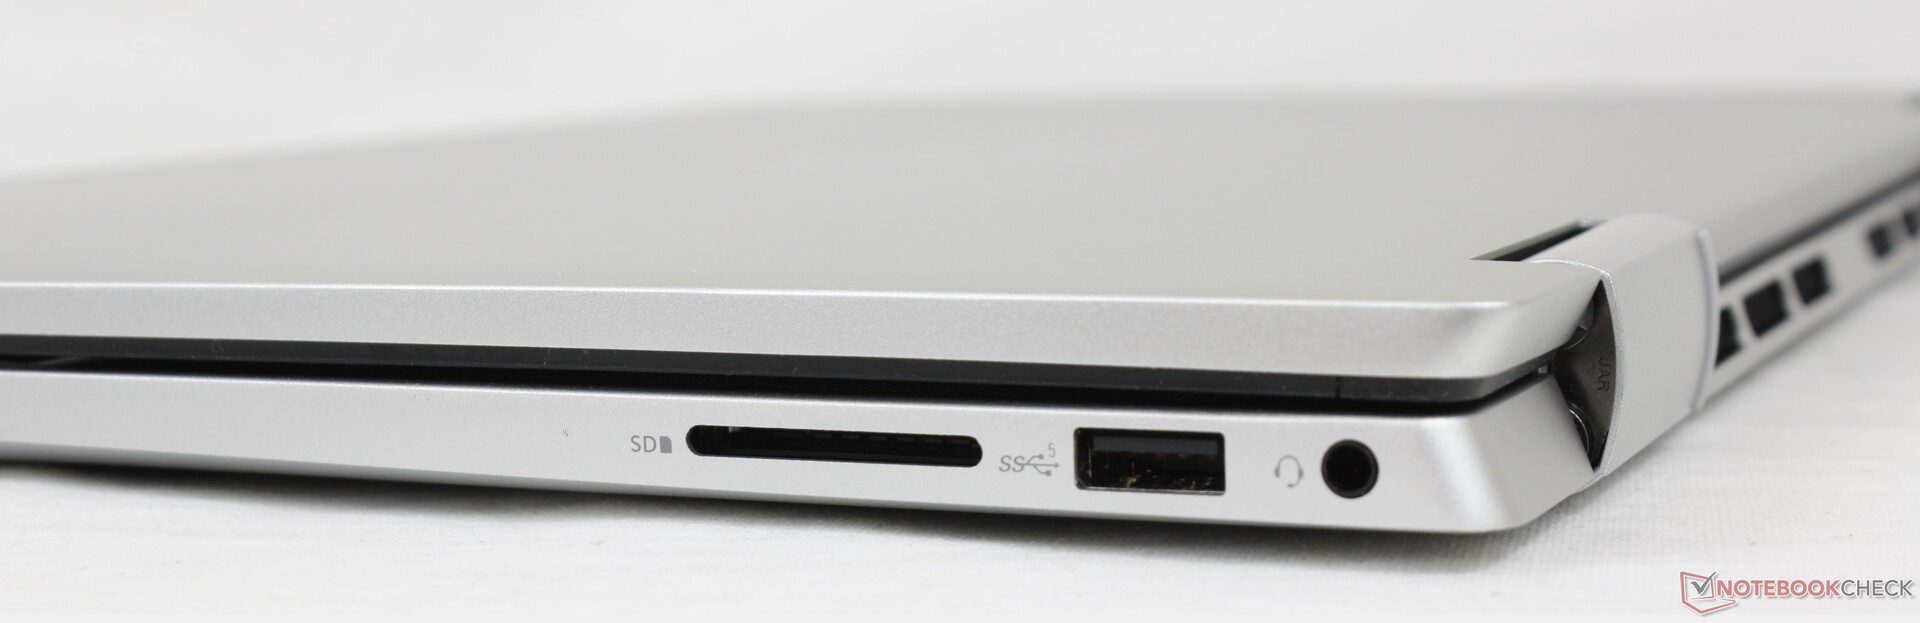

SD卡阅读器
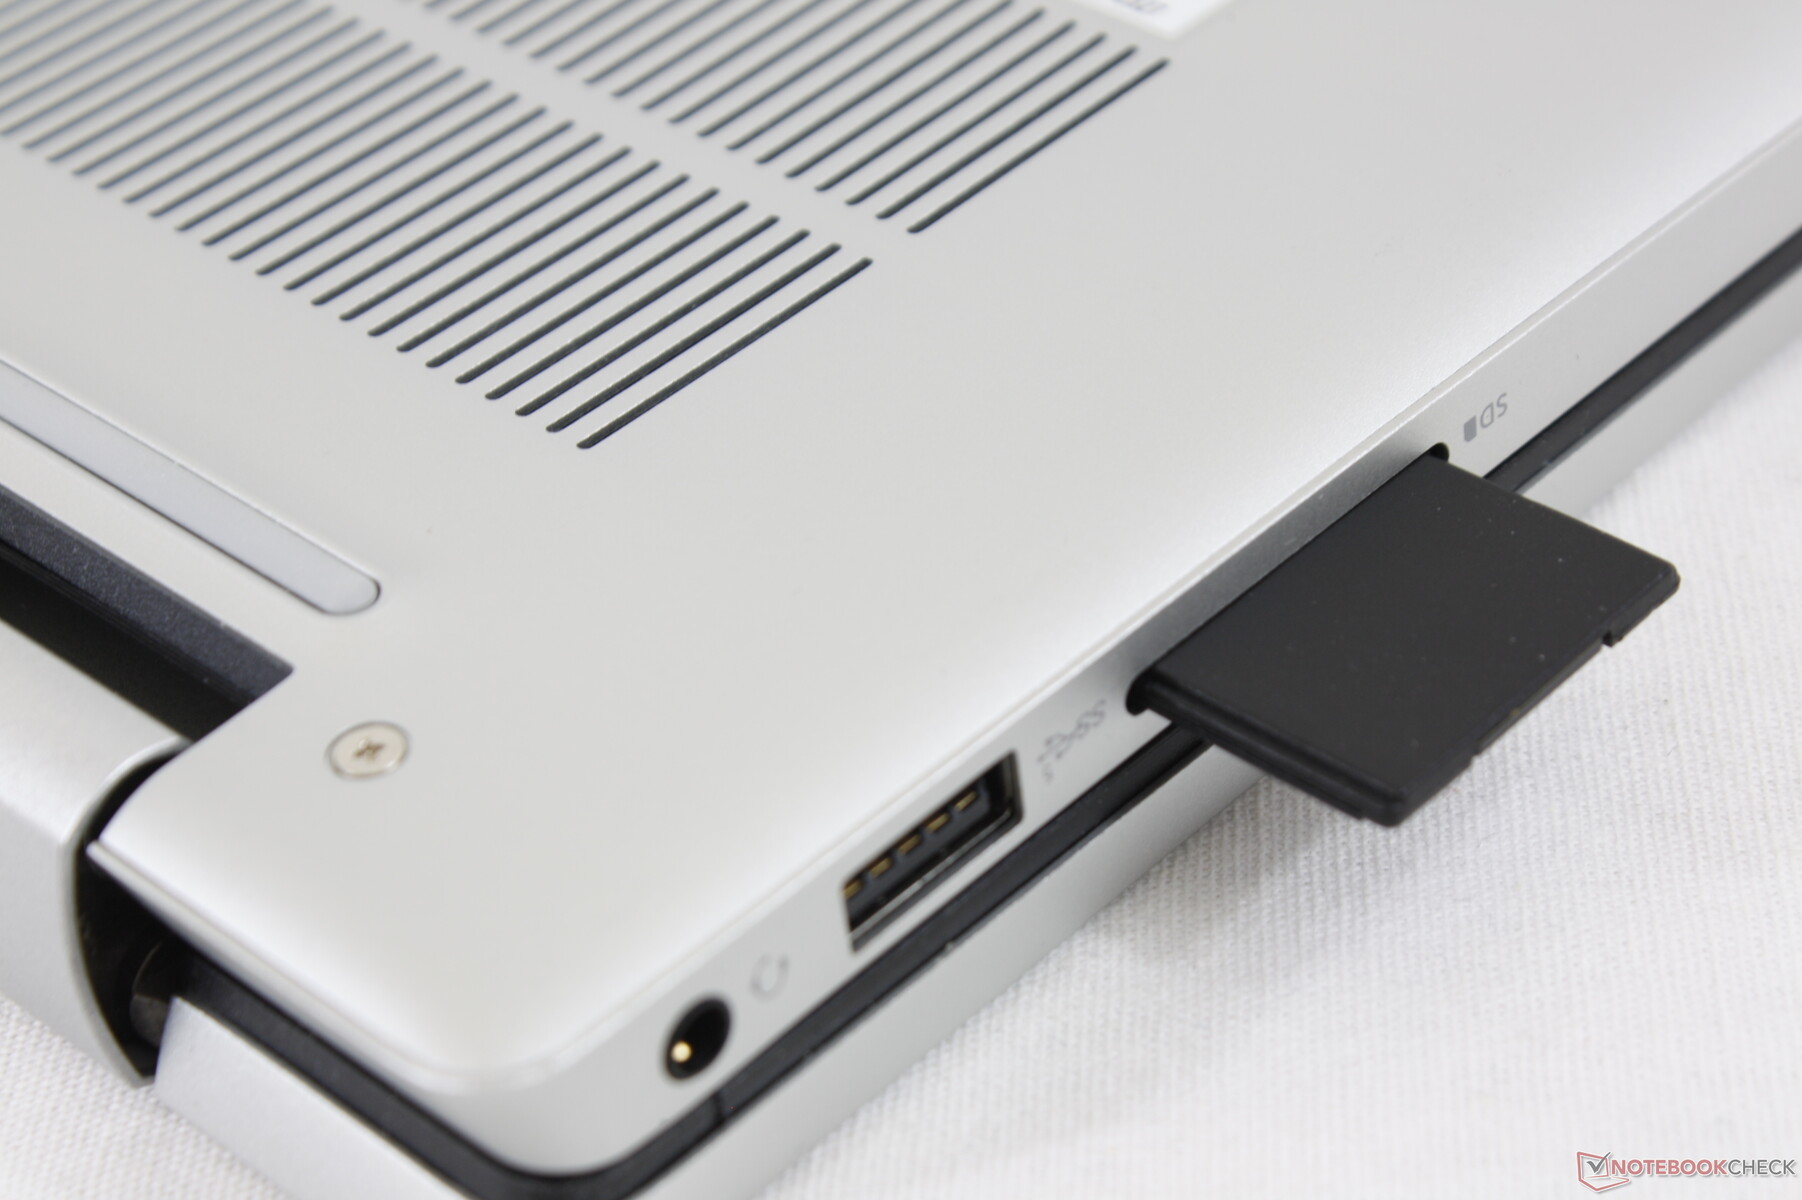
与其他Inspiron笔记本电脑一样,这里的集成SD卡读卡器非常慢,最多只有20到30MB/s。用户将不得不升级到更快的XPS或Latitude ,以获得更快的SD卡传输速率。
| SD Card Reader | |
| average JPG Copy Test (av. of 3 runs) | |
| HP Spectre X360 15-5ZV31AV (Toshiba Exceria Pro M501 UHS-II) | |
| LG Gram 16 2-in-1 16T90P (Toshiba Exceria Pro M501 UHS-II) | |
| Asus ZenBook Flip 15 UX563FD-A1027T (Toshiba Exceria Pro SDXC 64 GB UHS-II) | |
| Dell Inspiron 15 5579-9672 (Toshiba Exceria Pro SDXC 64 GB UHS-II) | |
| Samsung Galaxy Book Pro 360 15 NP950QDB-KC3DE (AV Pro SD microSD 128 GB V60) | |
| Dell Inspiron 16 7620 2-in-1 (Toshiba Exceria Pro SDXC 64 GB UHS-II) | |
| maximum AS SSD Seq Read Test (1GB) | |
| HP Spectre X360 15-5ZV31AV (Toshiba Exceria Pro M501 UHS-II) | |
| LG Gram 16 2-in-1 16T90P (Toshiba Exceria Pro M501 UHS-II) | |
| Dell Inspiron 15 5579-9672 (Toshiba Exceria Pro SDXC 64 GB UHS-II) | |
| Dell Inspiron 16 7620 2-in-1 (Toshiba Exceria Pro SDXC 64 GB UHS-II) | |
| Samsung Galaxy Book Pro 360 15 NP950QDB-KC3DE (AV Pro SD microSD 128 GB V60) | |
沟通
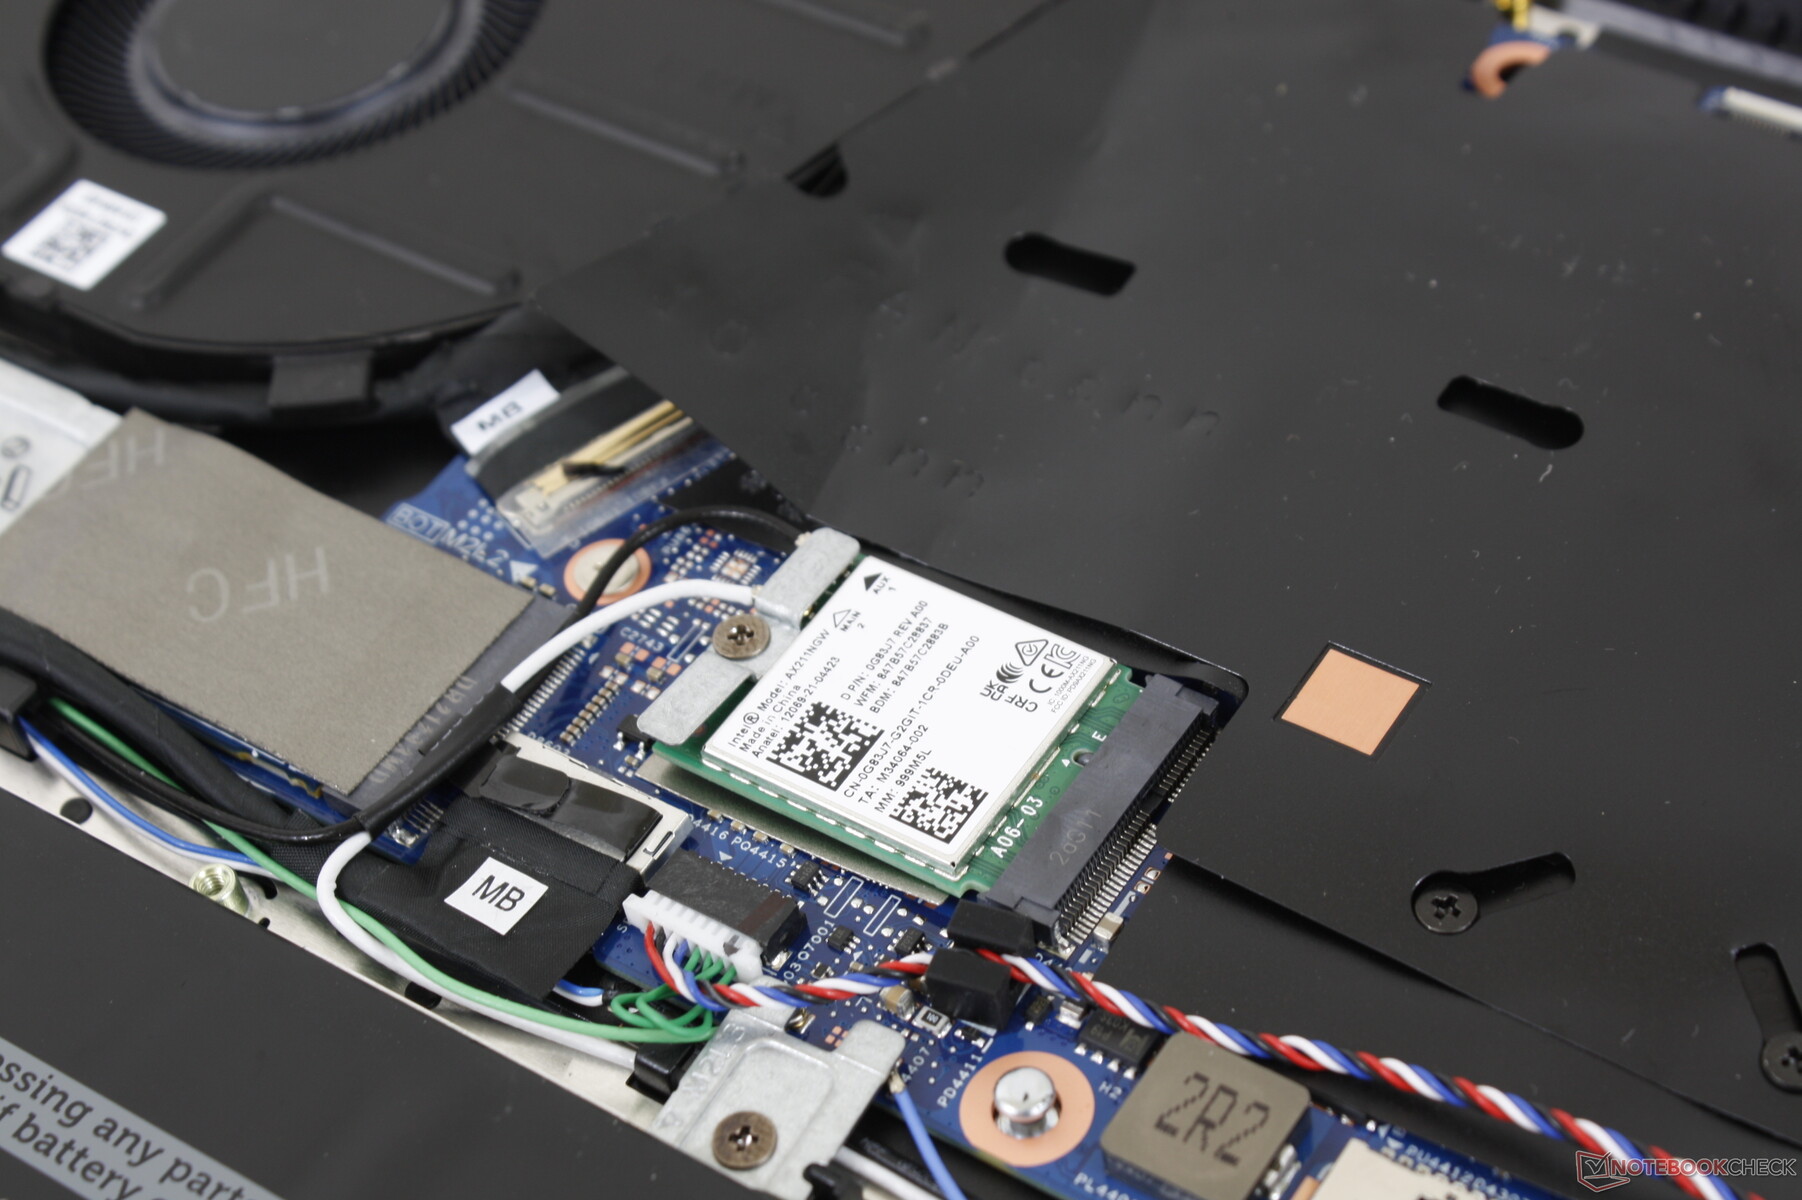
英特尔AX211是Wi-Fi 6E和蓝牙5.2连接的标准配置。当与我们的6GHz网络配对时,性能是稳定的,在我们使用该设备时没有明显的连接问题。
| Networking | |
| iperf3 transmit AX12 | |
| Samsung Galaxy Book Pro 360 15 NP950QDB-KC3DE | |
| LG Gram 16 2-in-1 16T90P | |
| Dell Inspiron 15 5579-9672 | |
| Asus ZenBook Flip 15 UX563FD-A1027T | |
| iperf3 receive AX12 | |
| LG Gram 16 2-in-1 16T90P | |
| Samsung Galaxy Book Pro 360 15 NP950QDB-KC3DE | |
| Asus ZenBook Flip 15 UX563FD-A1027T | |
| Dell Inspiron 15 5579-9672 | |
| iperf3 receive AXE11000 6GHz | |
| Dell Inspiron 16 7620 2-in-1 | |
| iperf3 transmit AXE11000 6GHz | |
| Dell Inspiron 16 7620 2-in-1 | |
网络摄像头
集成的摄像头是1080p的,比大多数其他预算到中档笔记本电脑的典型720p的图像更清晰。然而,颜色仍然很差。
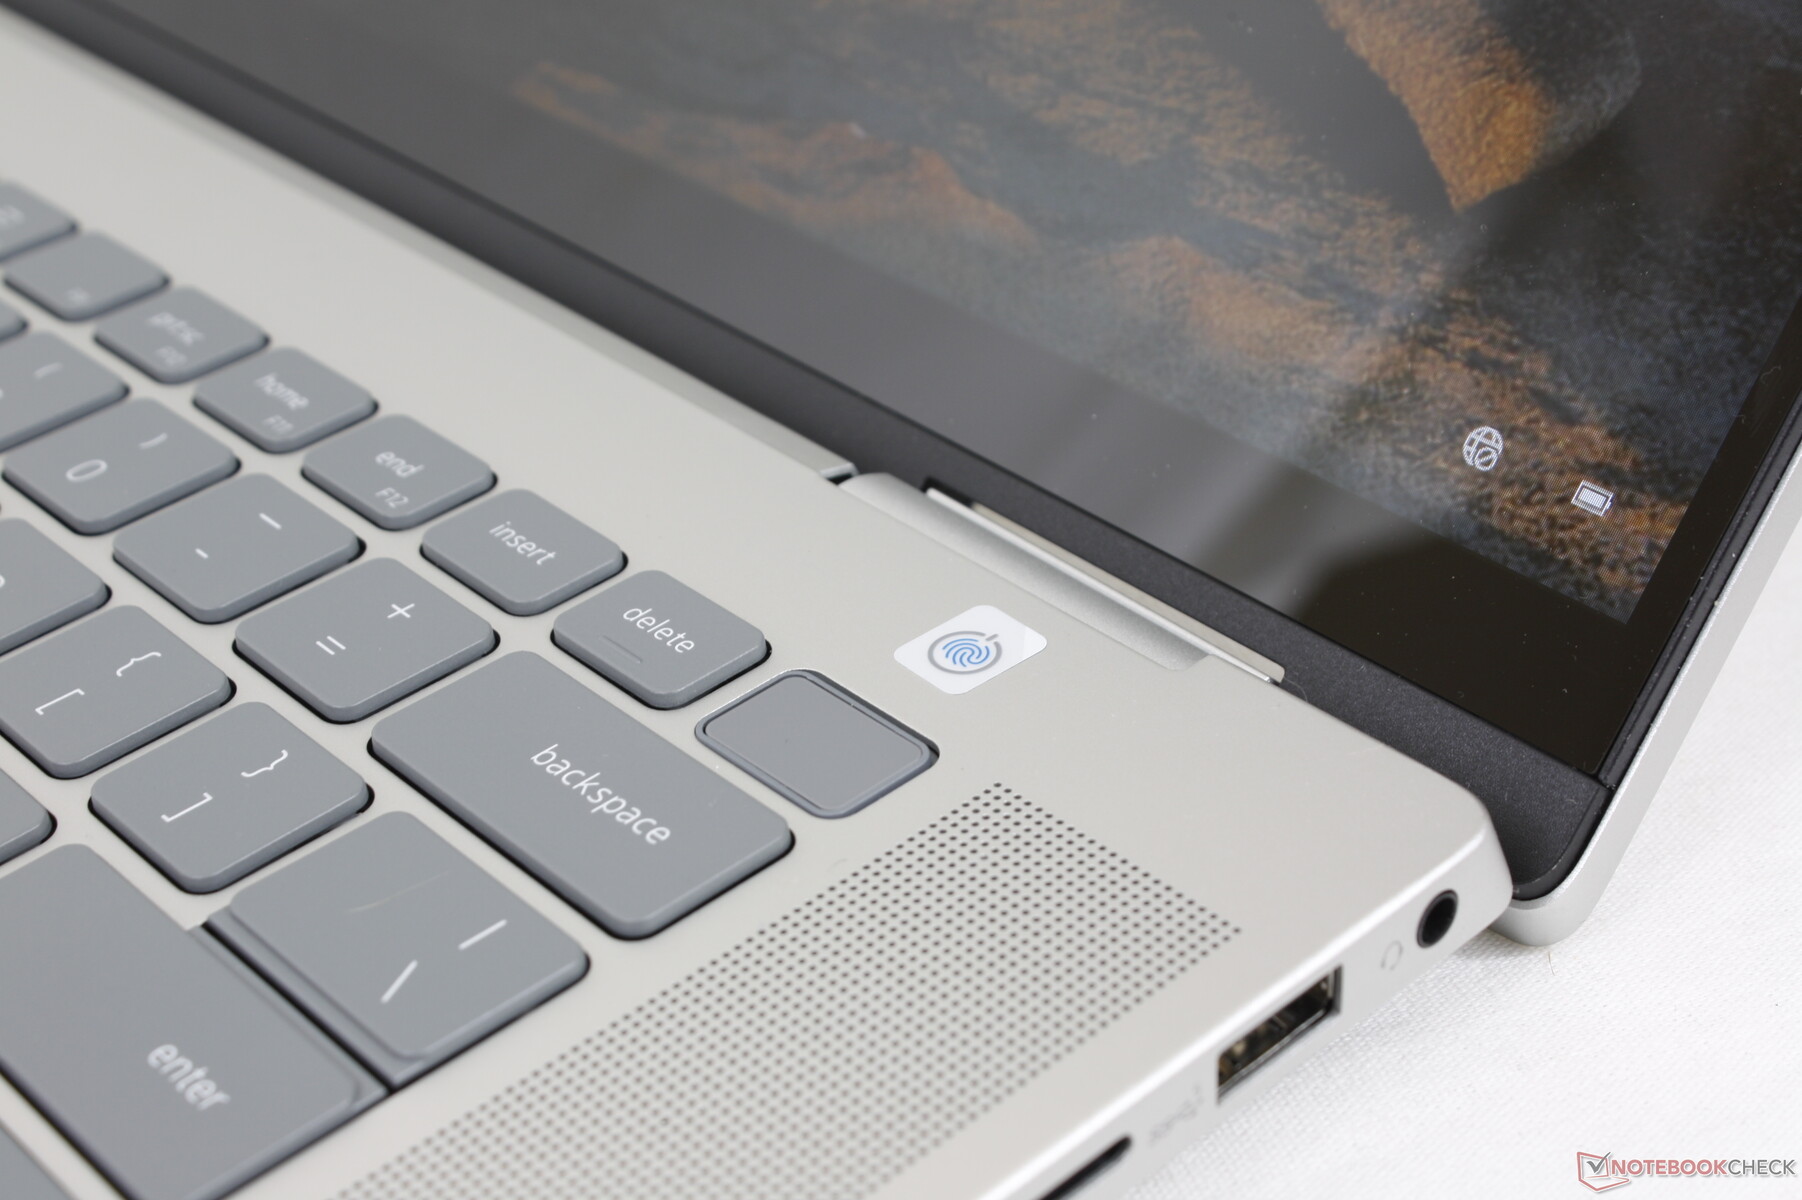
没有红外摄像头,因此不支持Windows Hello。一个手动网络摄像头滑块是标准配置,而不是电子快门开关。


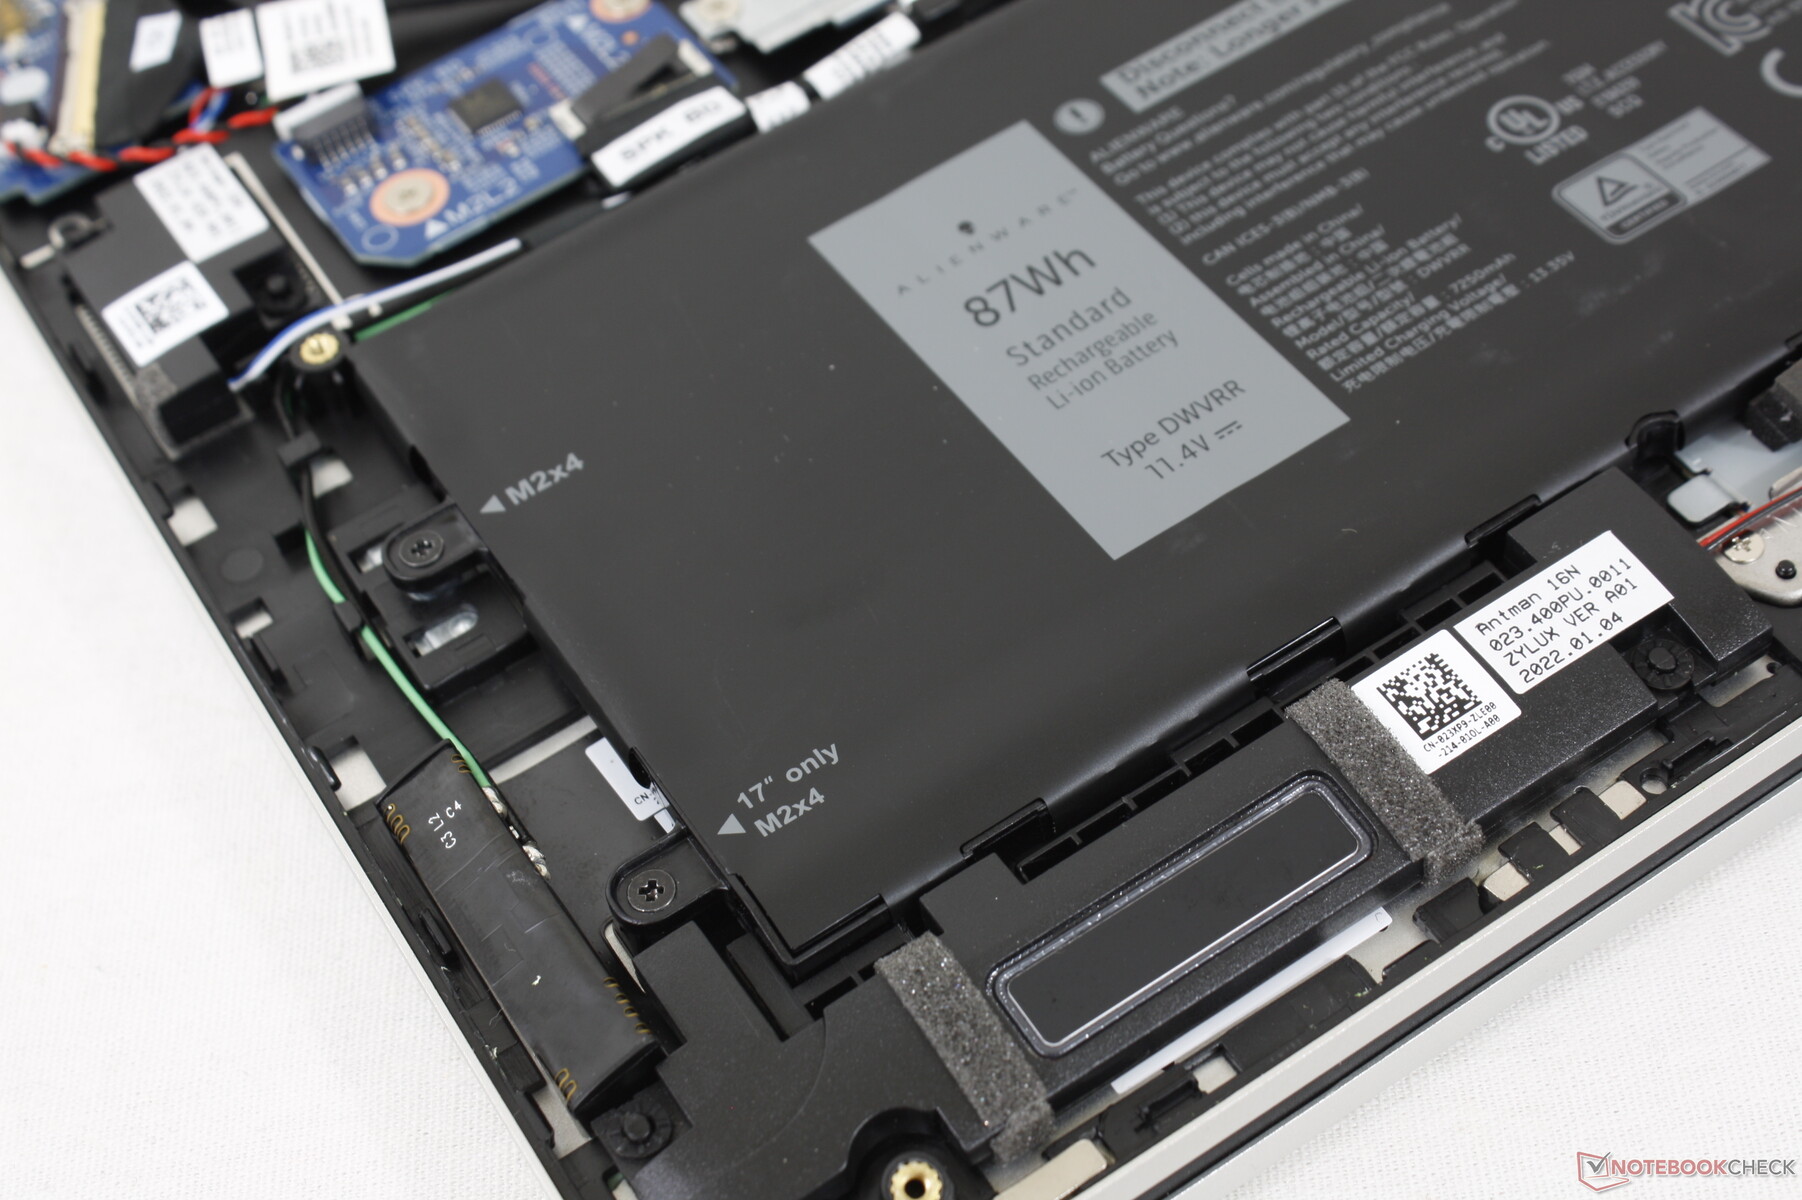
维护
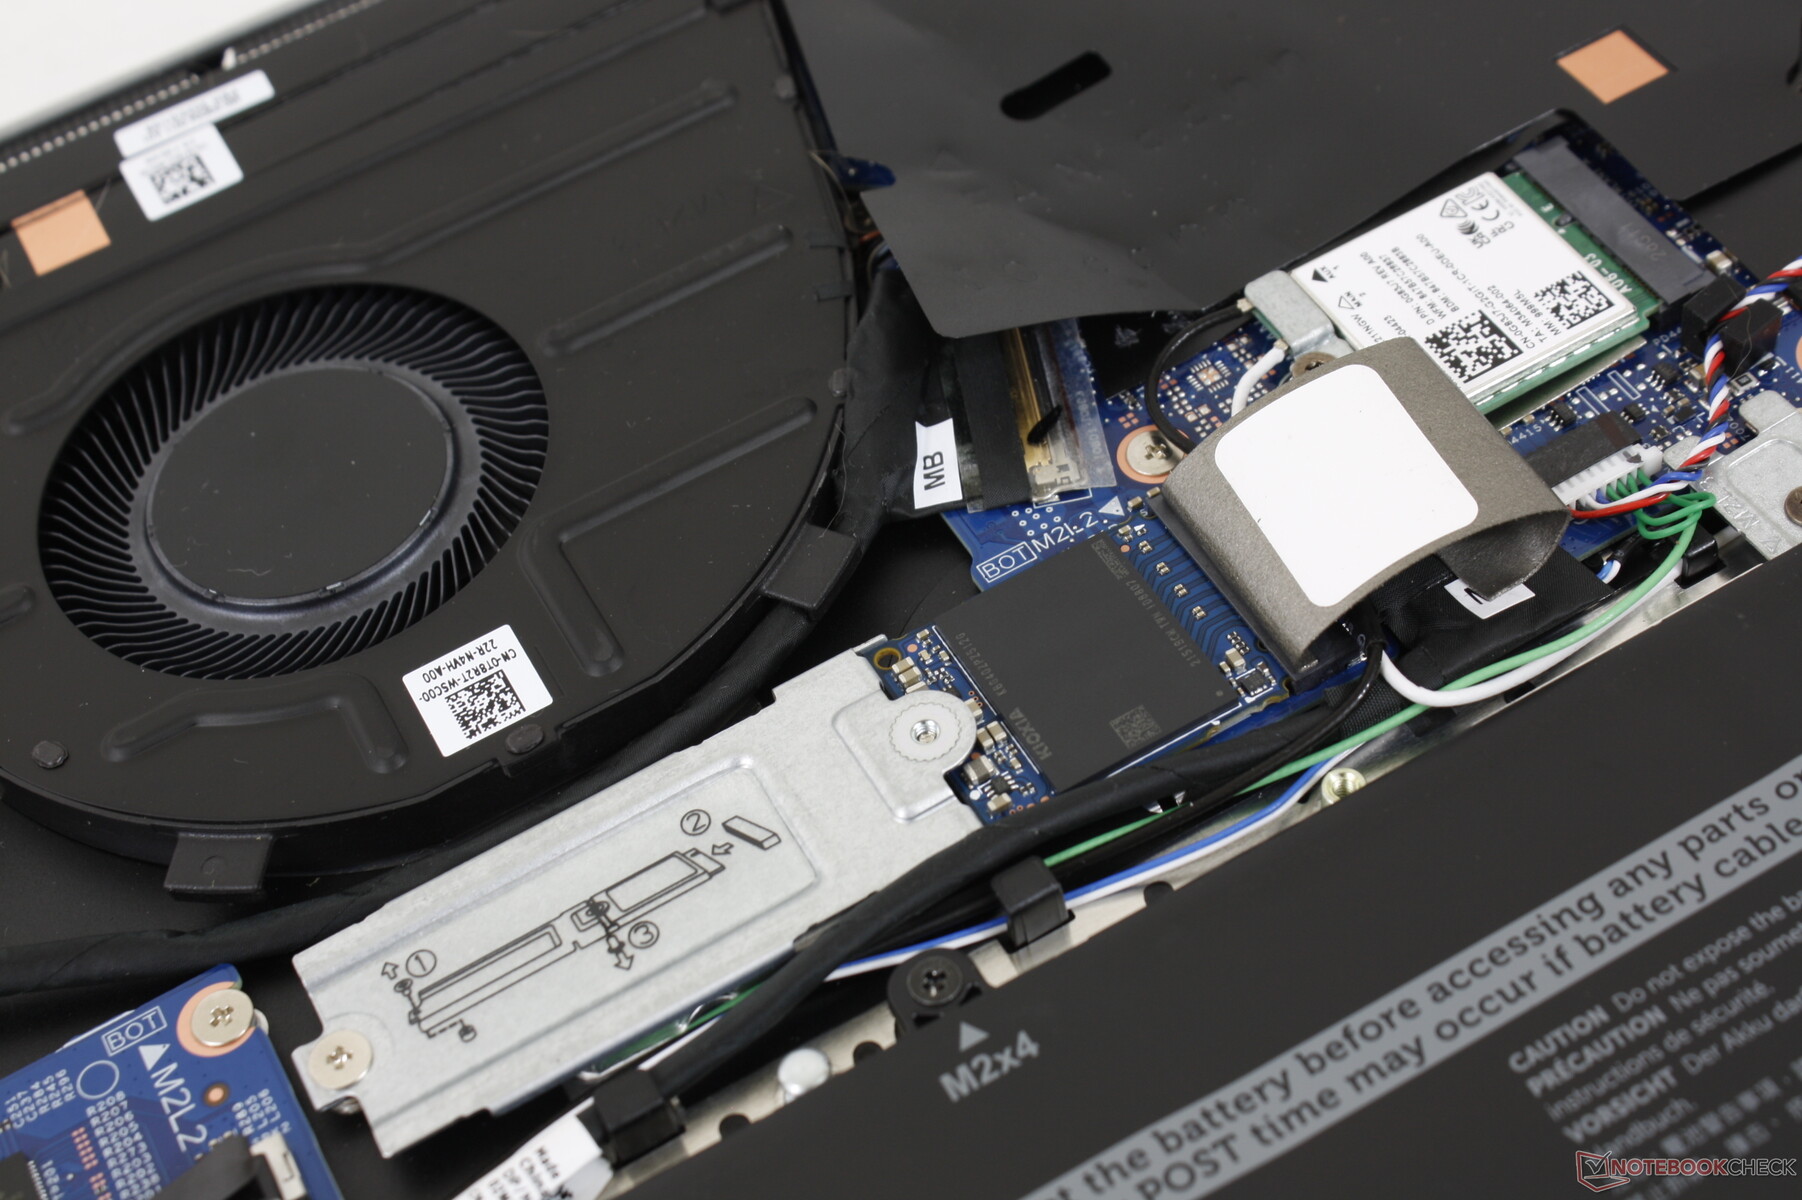
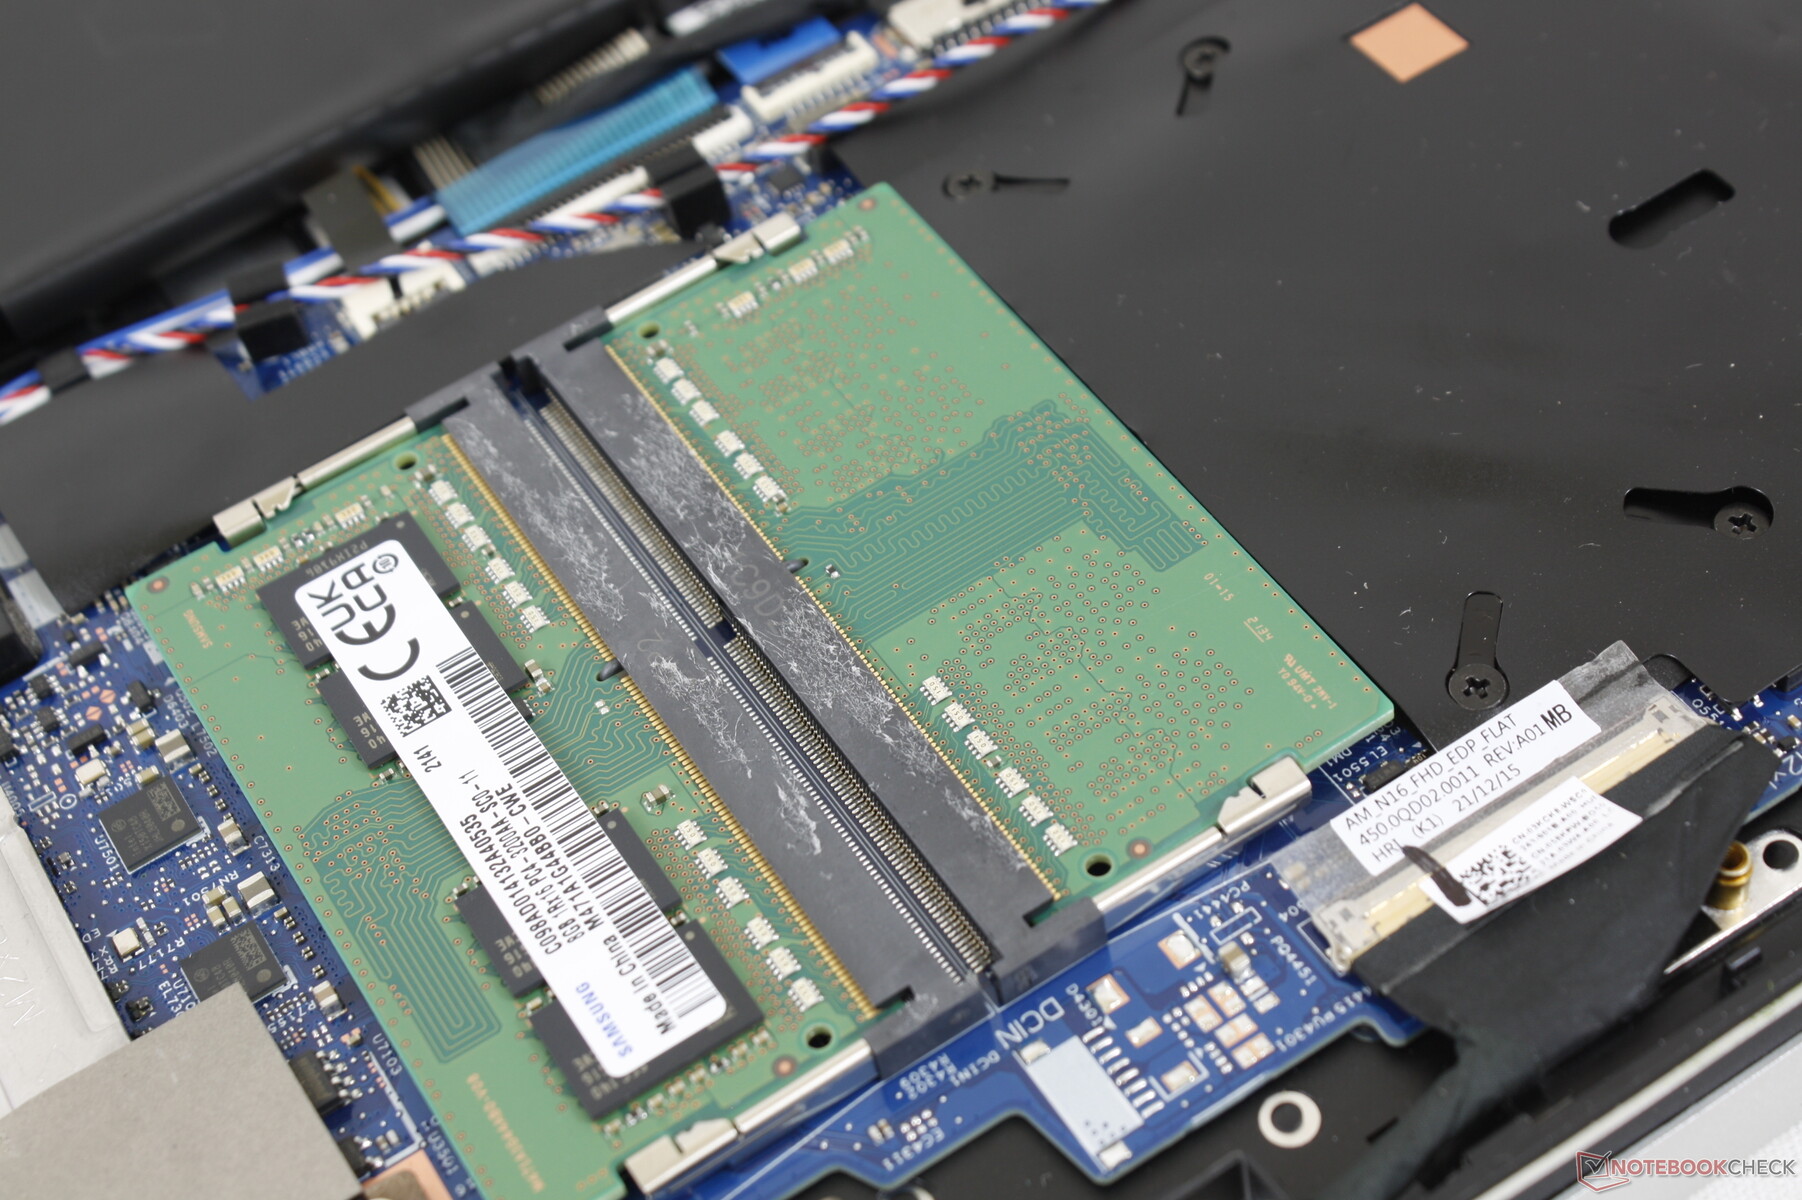
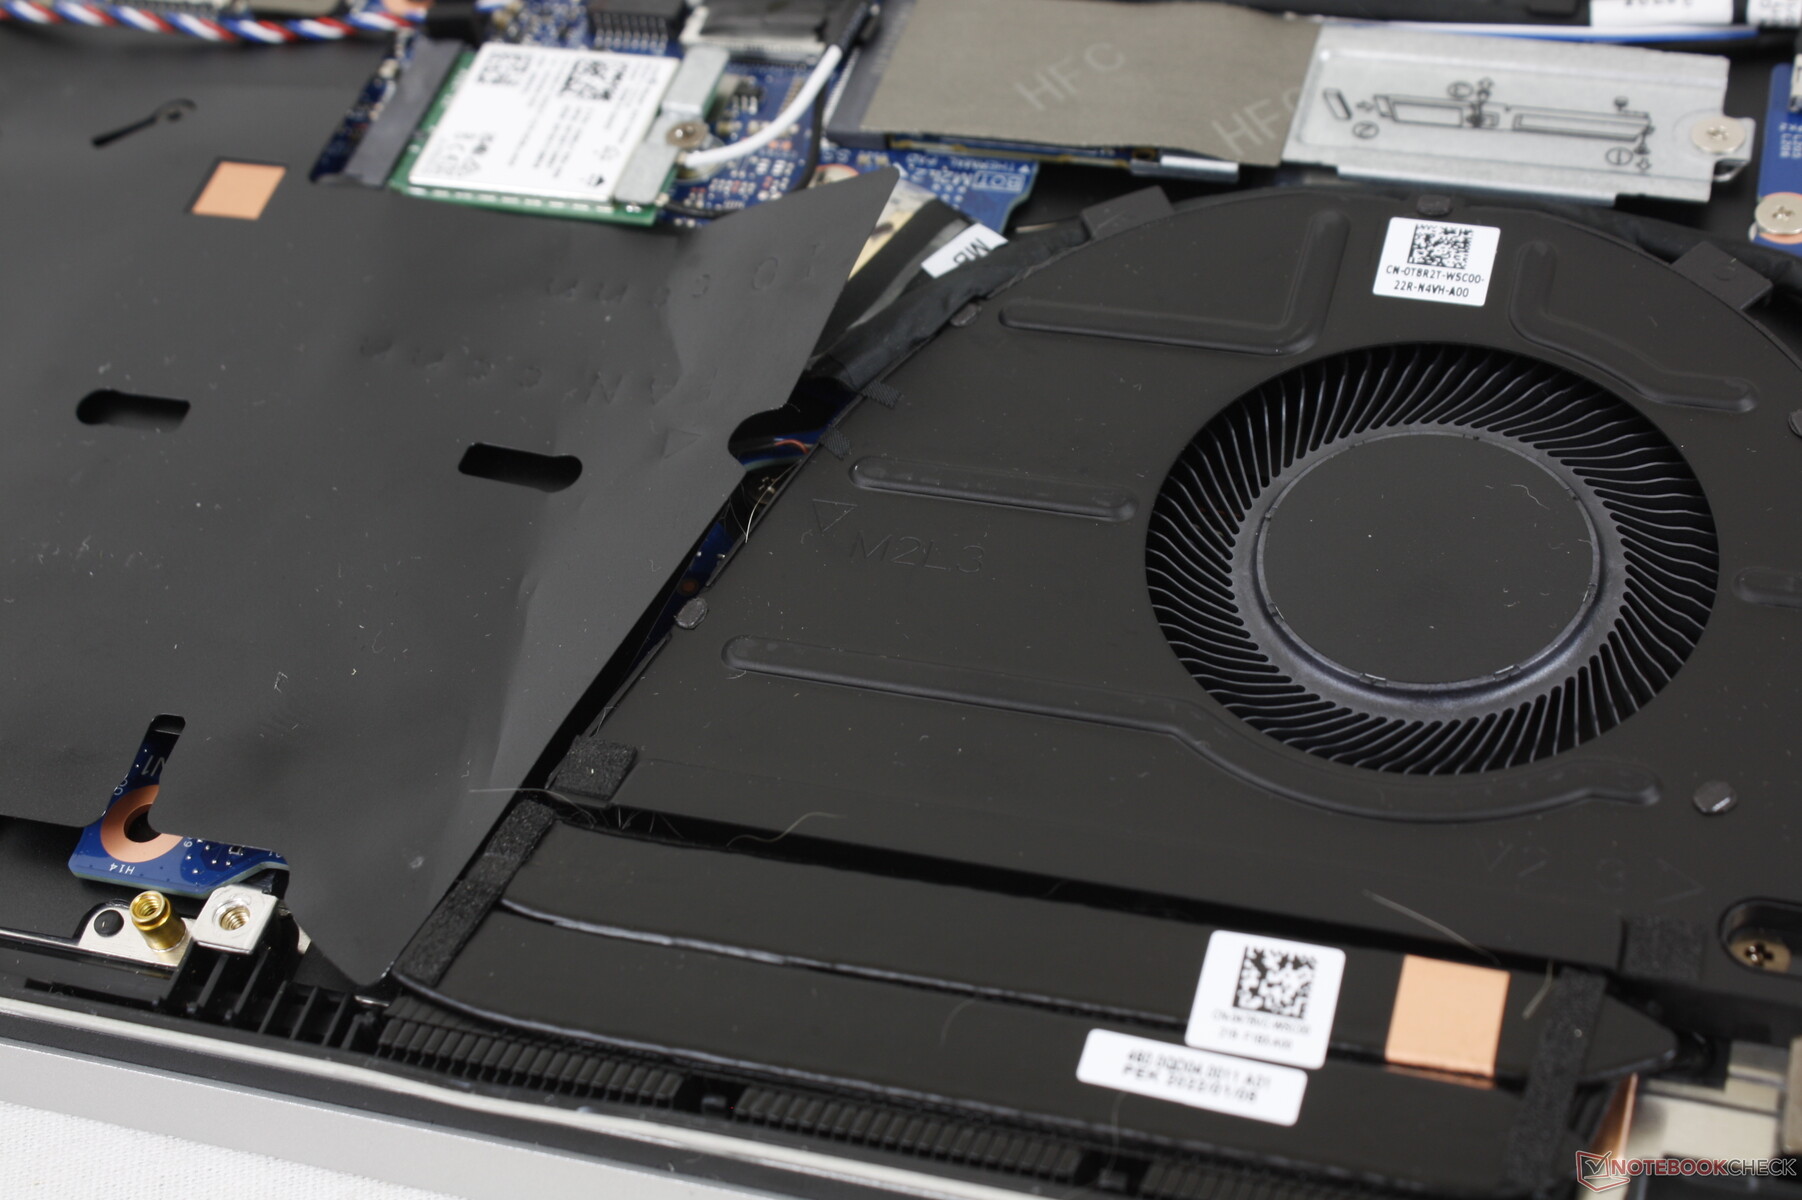
底部面板由9颗飞利浦螺钉固定,便于维修。如果需要,用户可以拆除或更换2个SODIMM模块、WLAN模块、电池或M.2驱动器。相比之下,许多其他可转换产品,如LG Gram 16二合一产品,使最终用户很难增加更多的存储空间或更换其他普通组件。
配件和保修
除了文件和交流电适配器外,没有任何额外的东西。该型号与压敏型PN5122W 有源触笔。
如果在美国购买,则适用标准的一年有限保修。
输入设备--没什么好说的
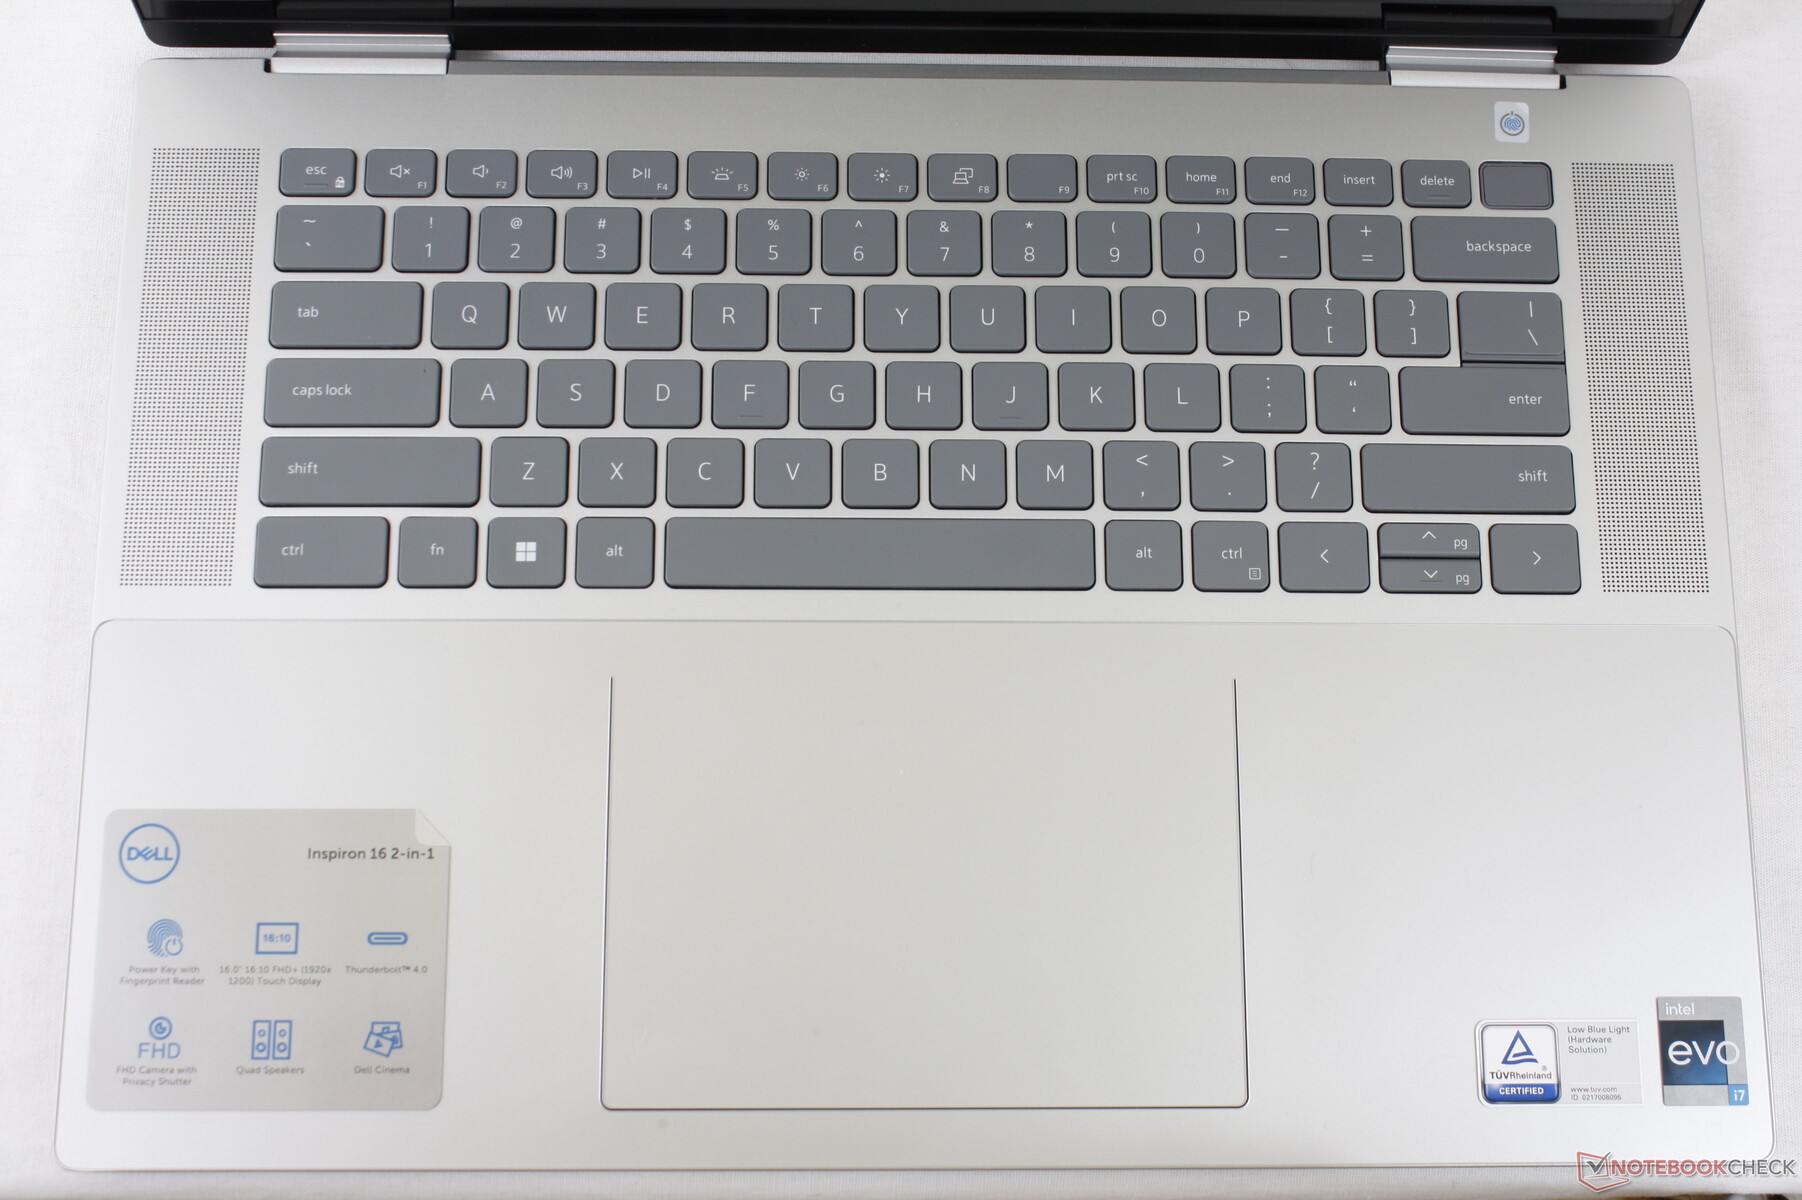
键盘
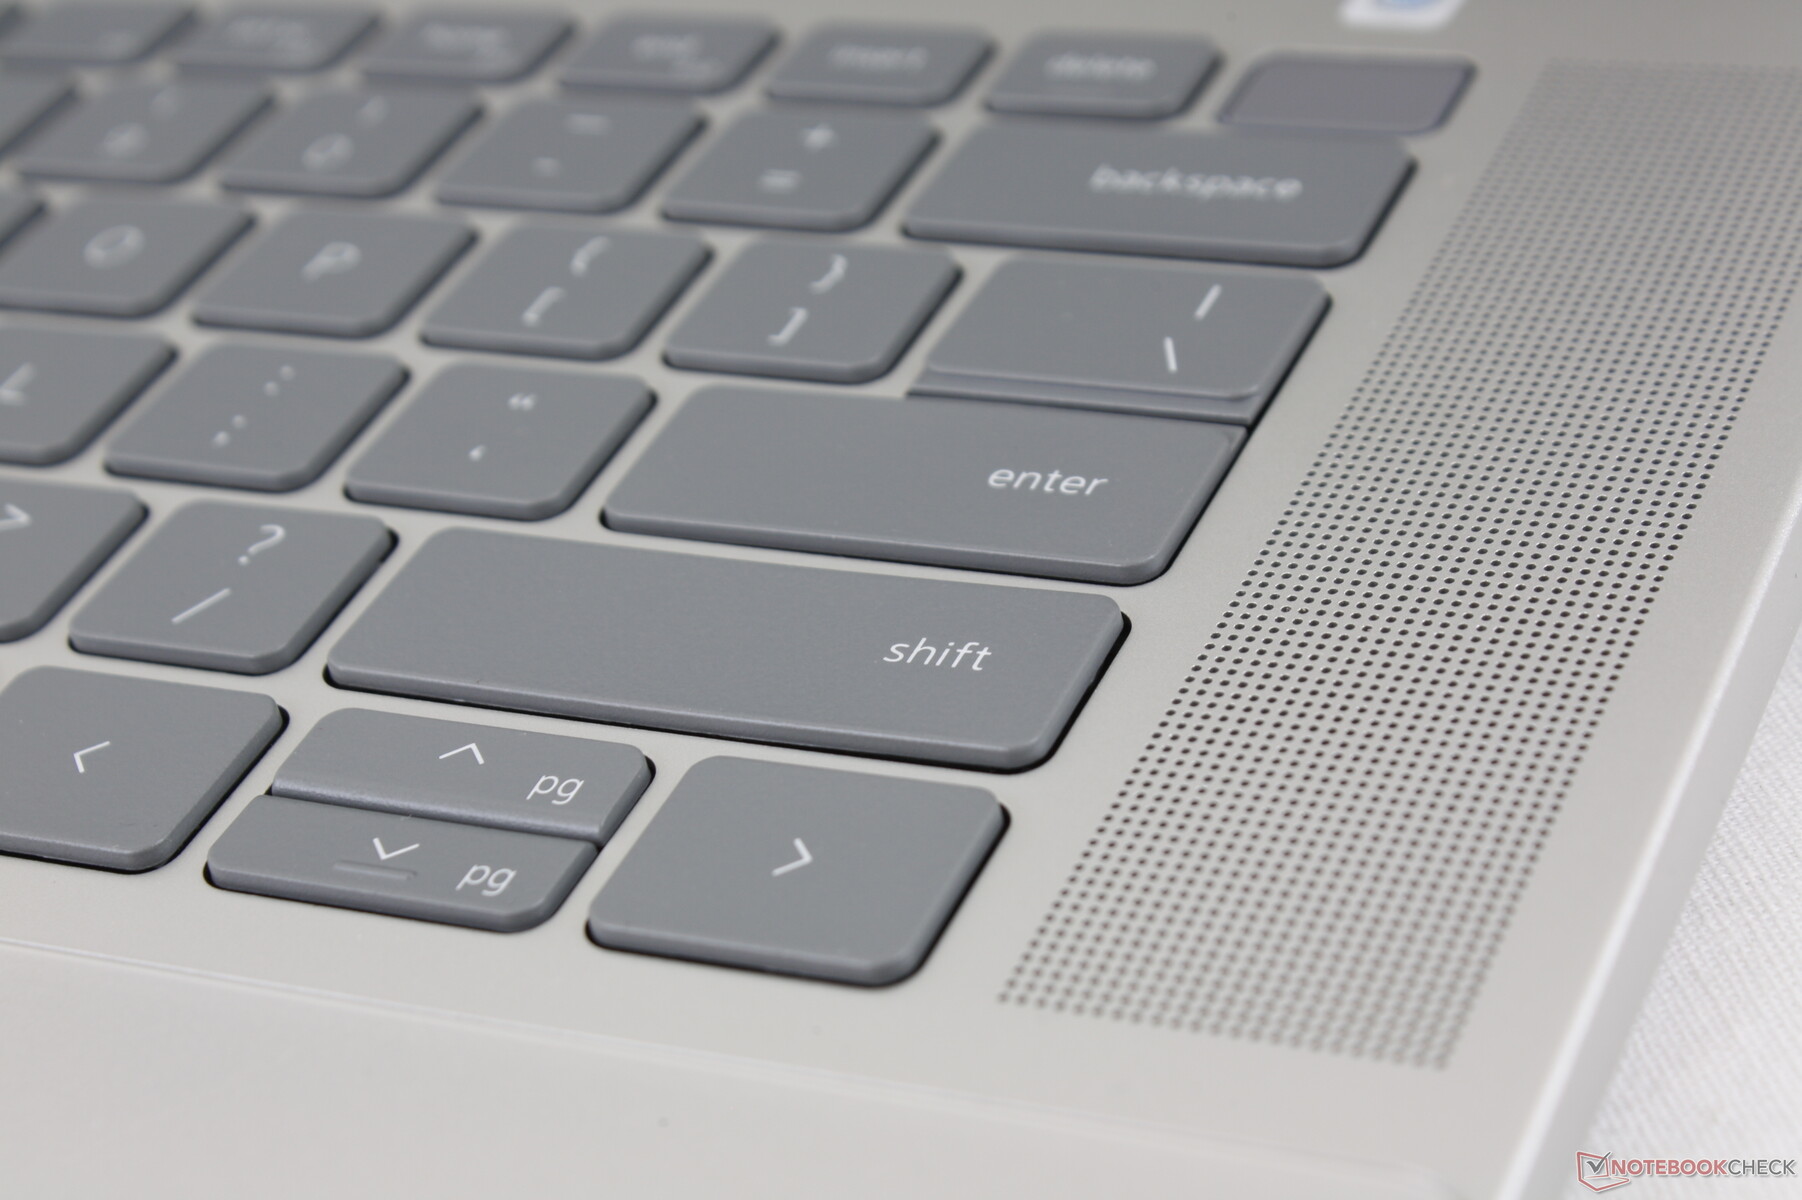
我们对14英寸的评论 键盘的评论在这里适用于Inspiron 14 7420 2-in-1 键盘的评论也适用于Inspiron 16 7620 2-in-1,因为尽管它们的外形尺寸不同,但都有相同的键盘。虽然打字体验一般,没有什么可写的,但我们确实发现,与更昂贵的LG Gram 16二合一或惠普Spectre x360系列上较硬的按键相比,按键更柔软,不那么卡顿。
当与 Inspiron 16 7610键盘相比,戴尔已经放弃了集成的小键盘,转而使用扬声器,无论好坏。在按键的反馈方面,似乎没有任何明显的改进,一年比一年好。
触摸板
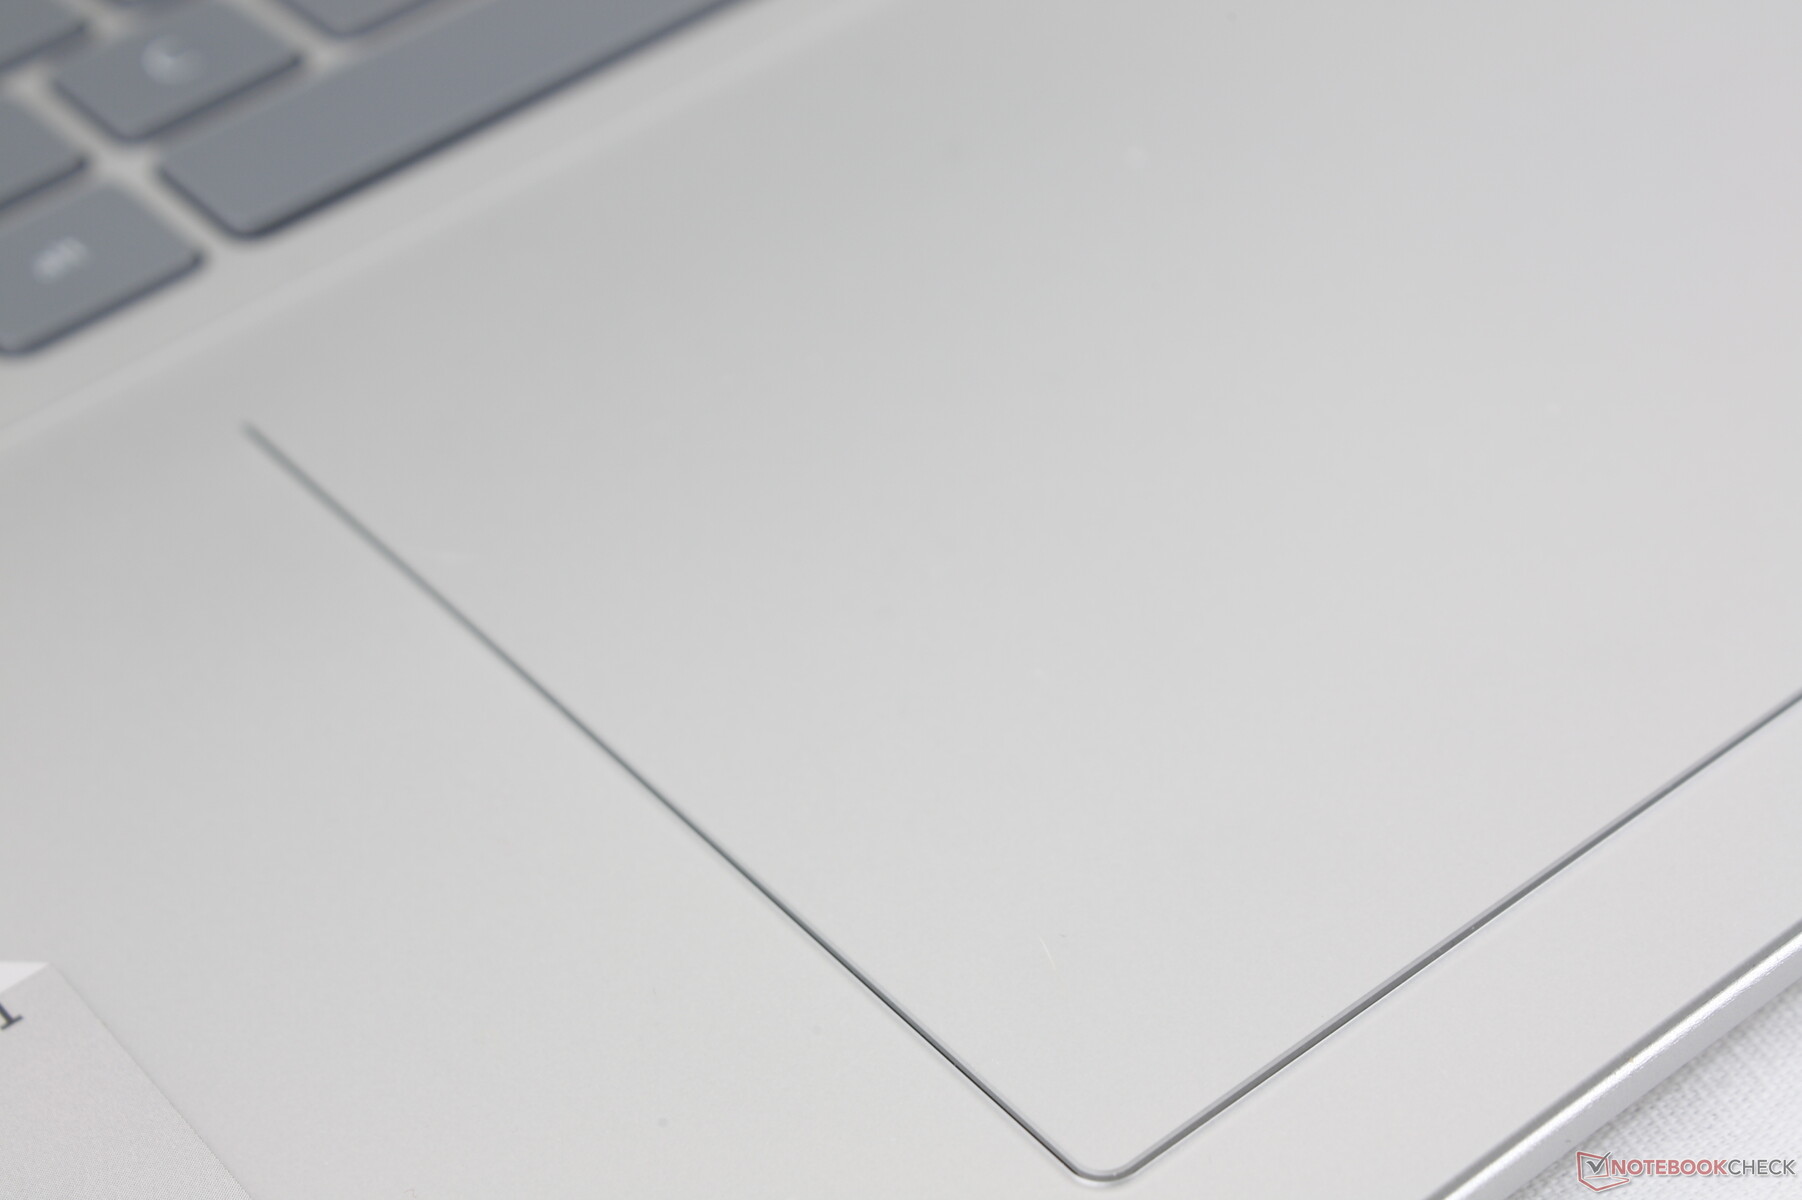
点击板比LG Gram 16二合一的点击板略大(约13.3 x 9厘米,13.2 x 8.3厘米)。由于铝制底座上面有独特的胶膜层,所以在中速到高速的滑行过程中很顺畅,而且比其他大多数笔记本电脑上的指纹积聚要少。相对于平均反馈和按下时的浅层行程,咔哒声比预期的要大。

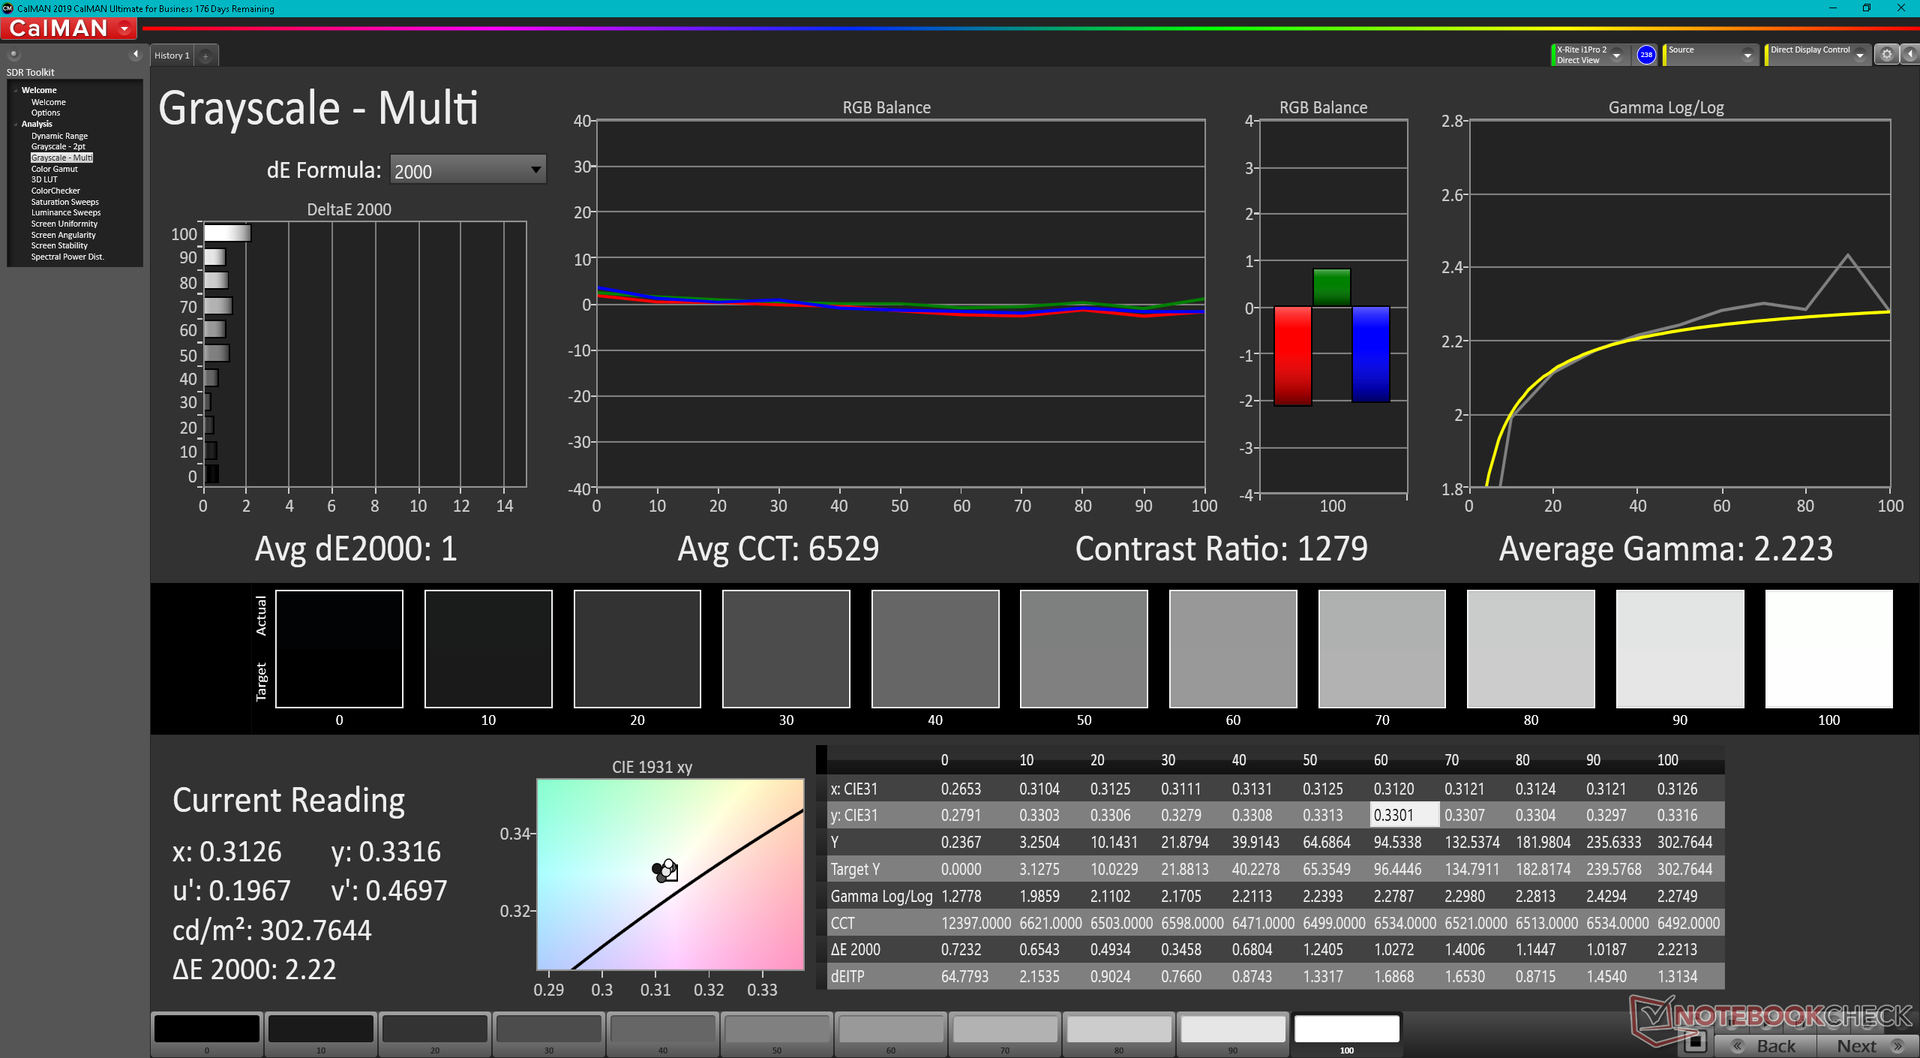
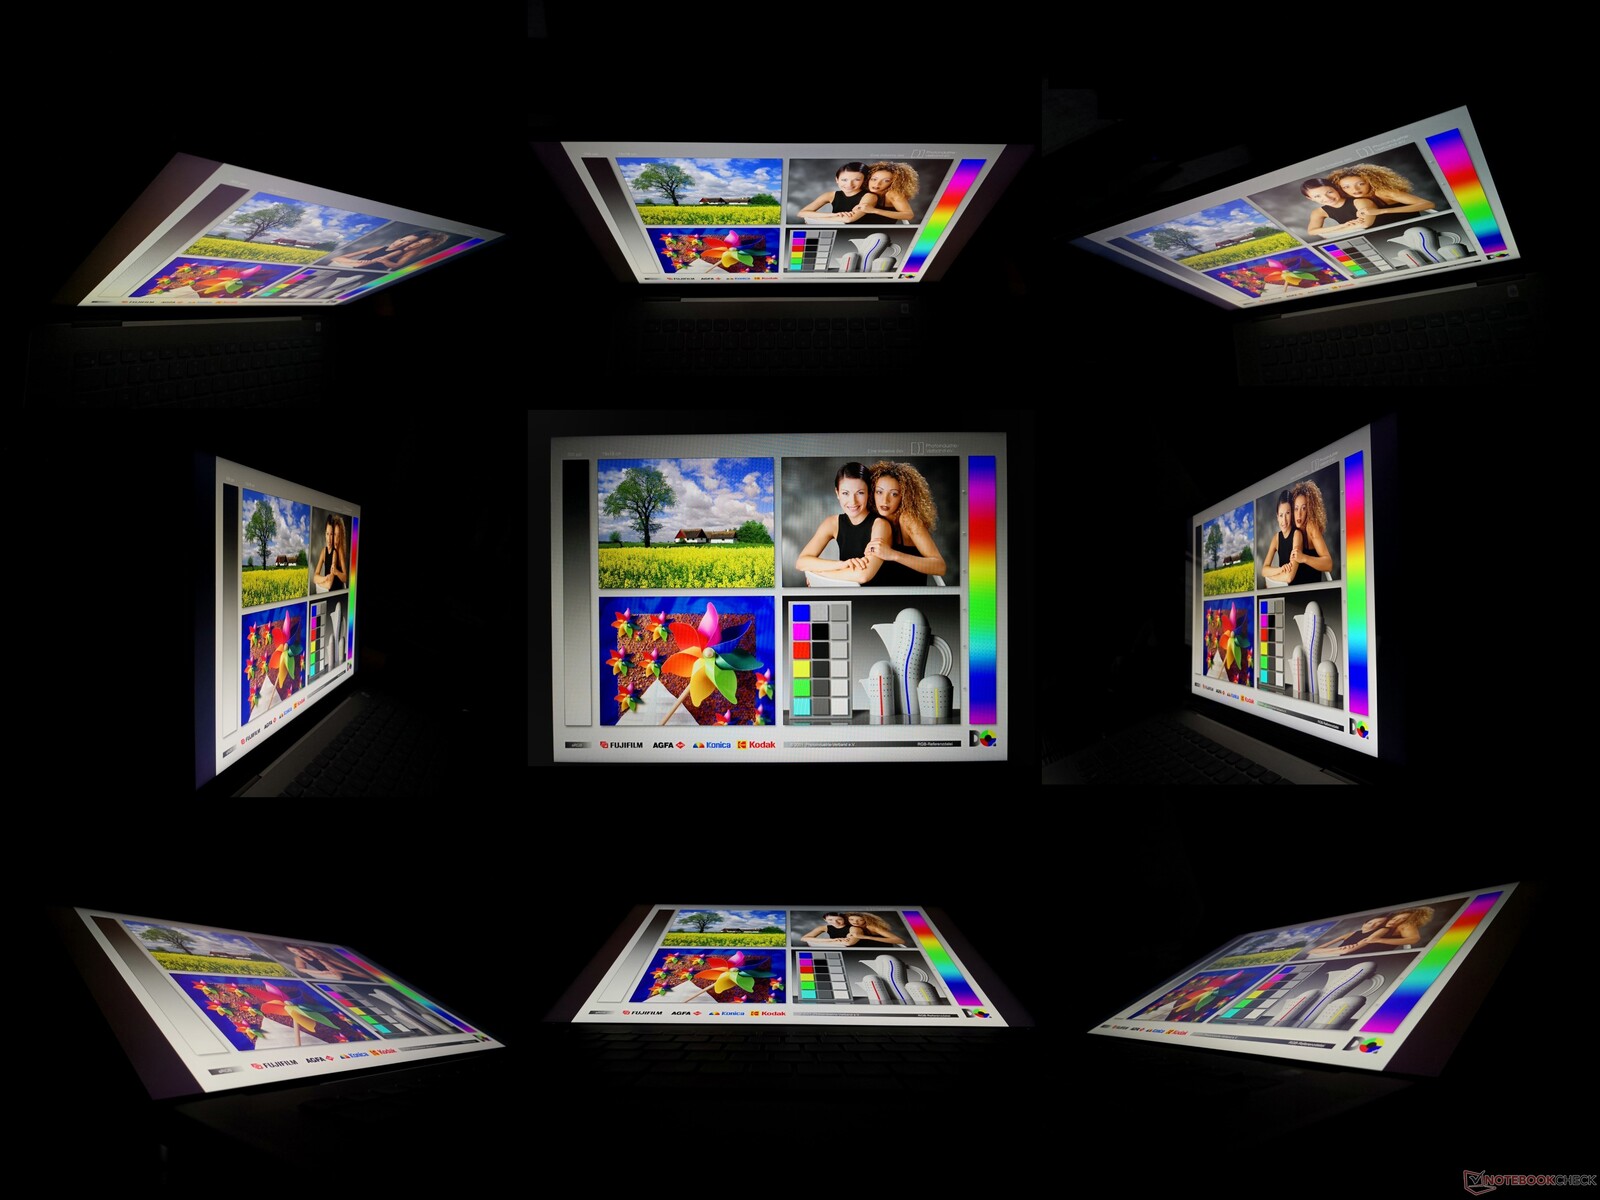
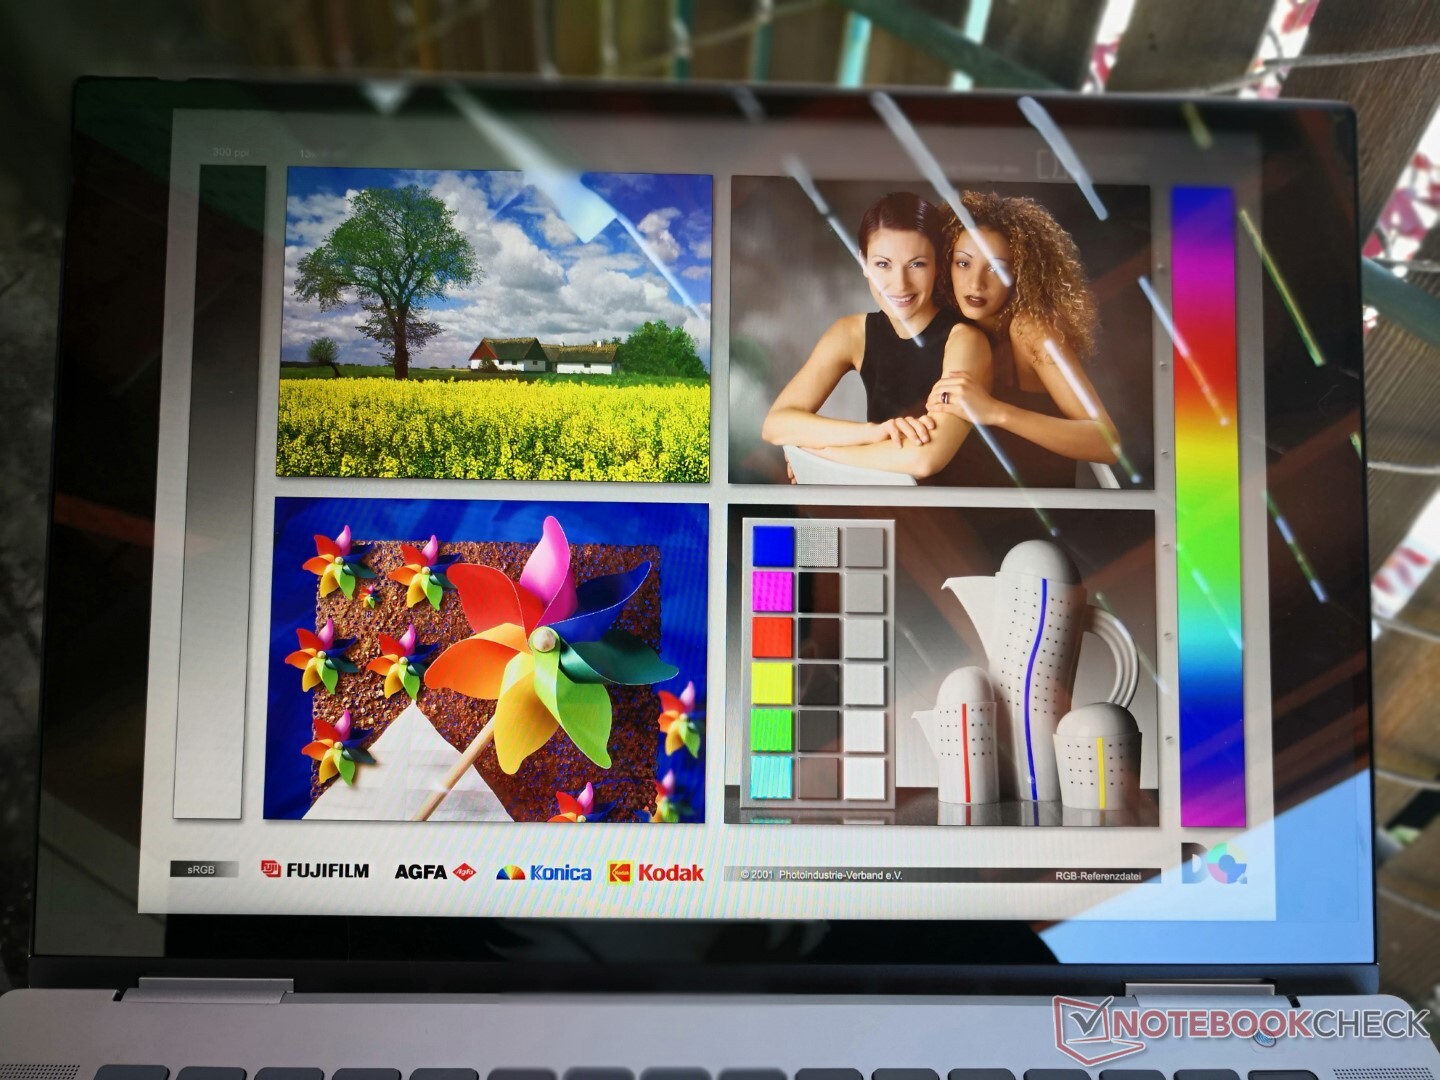
显示屏 - 不愧是XPS
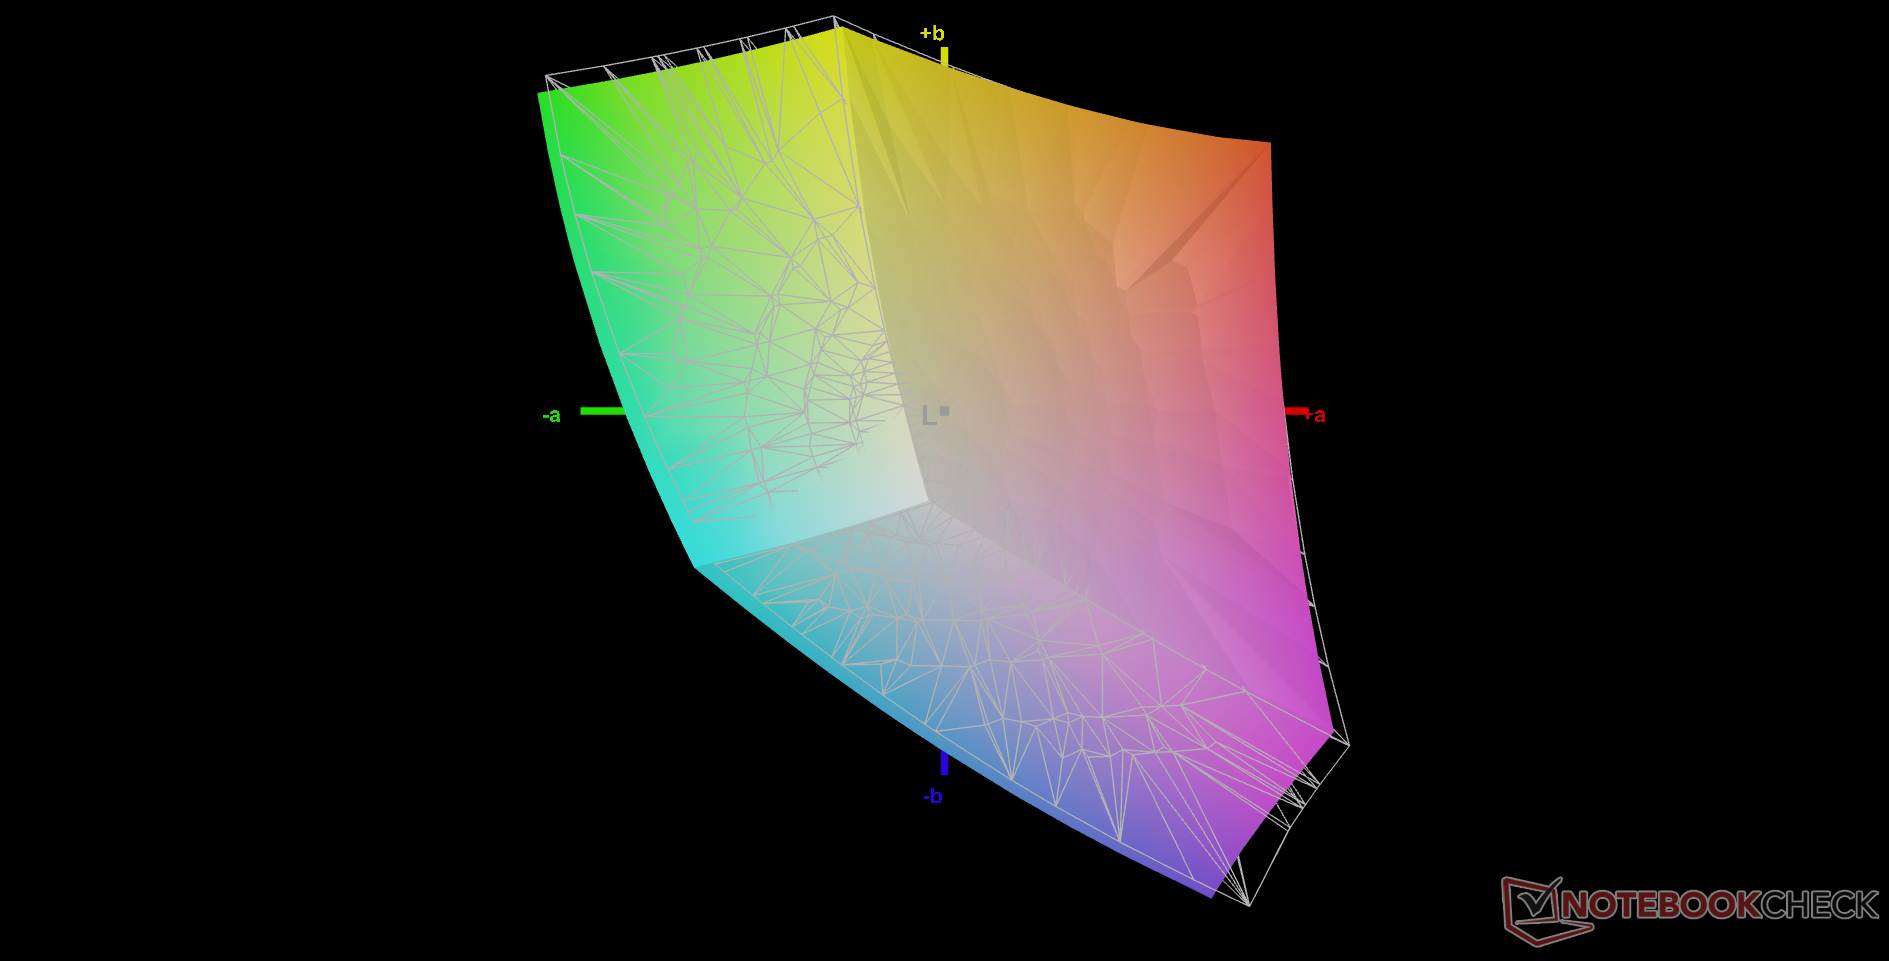
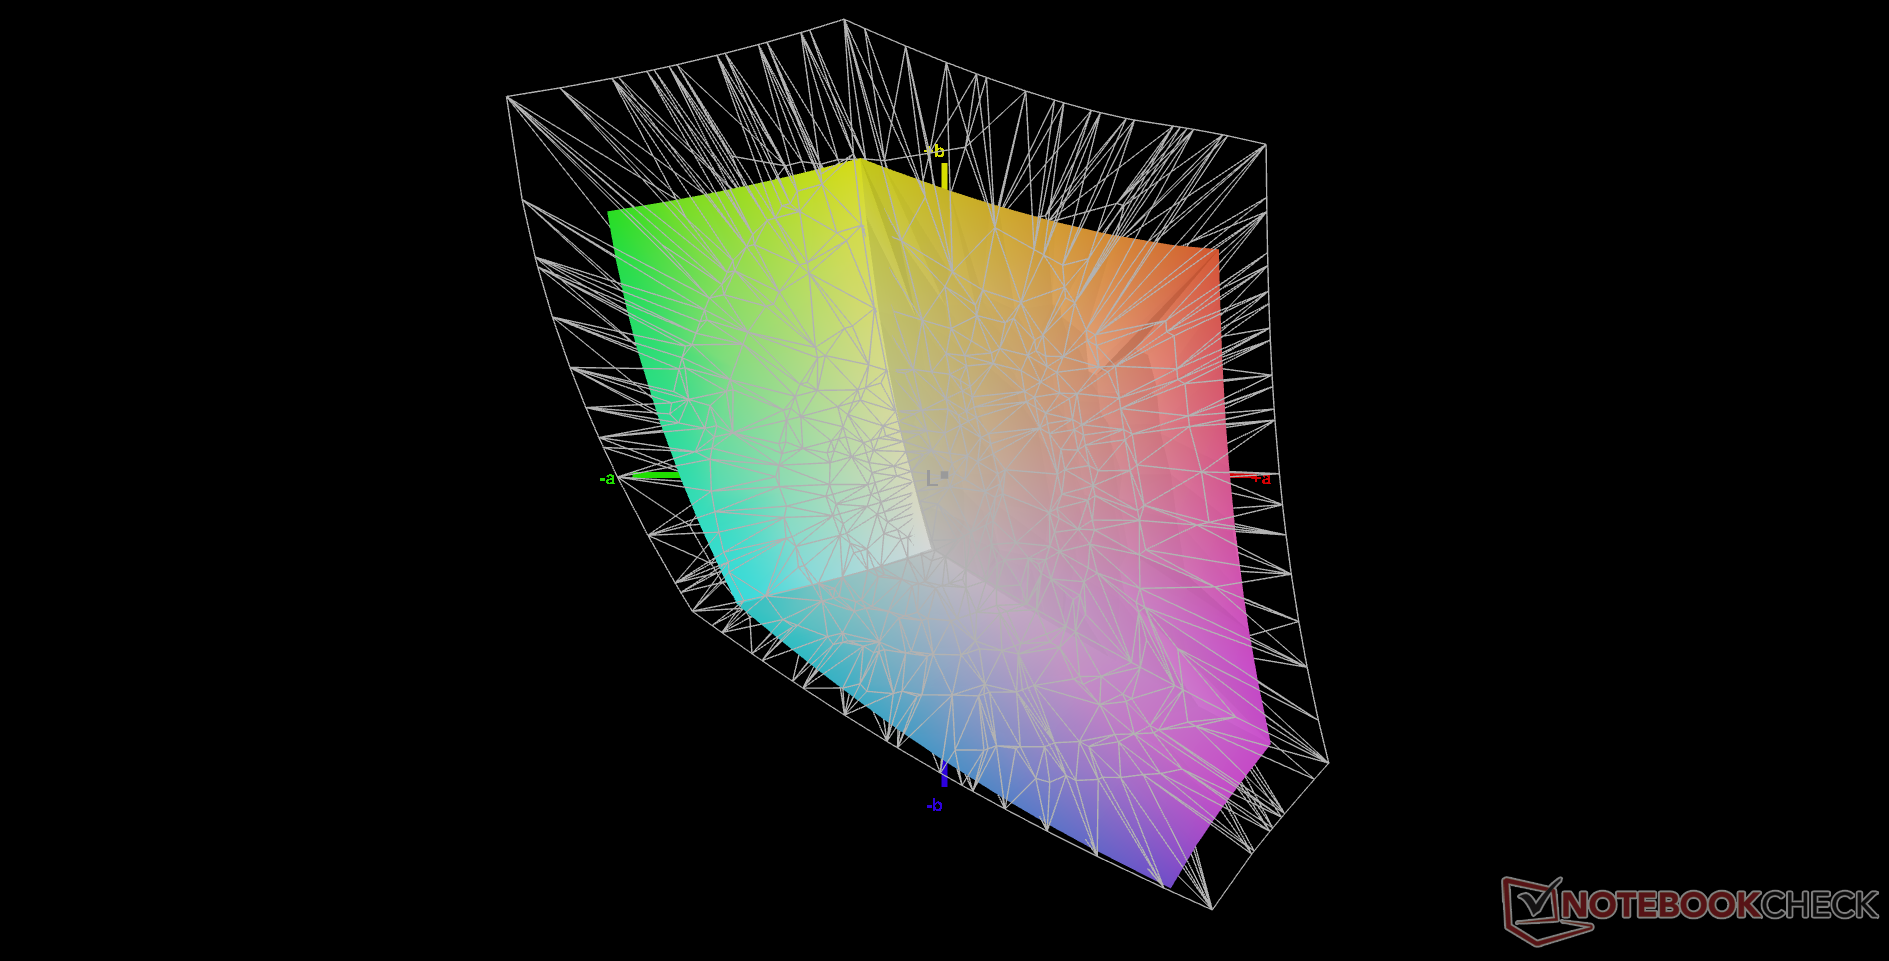
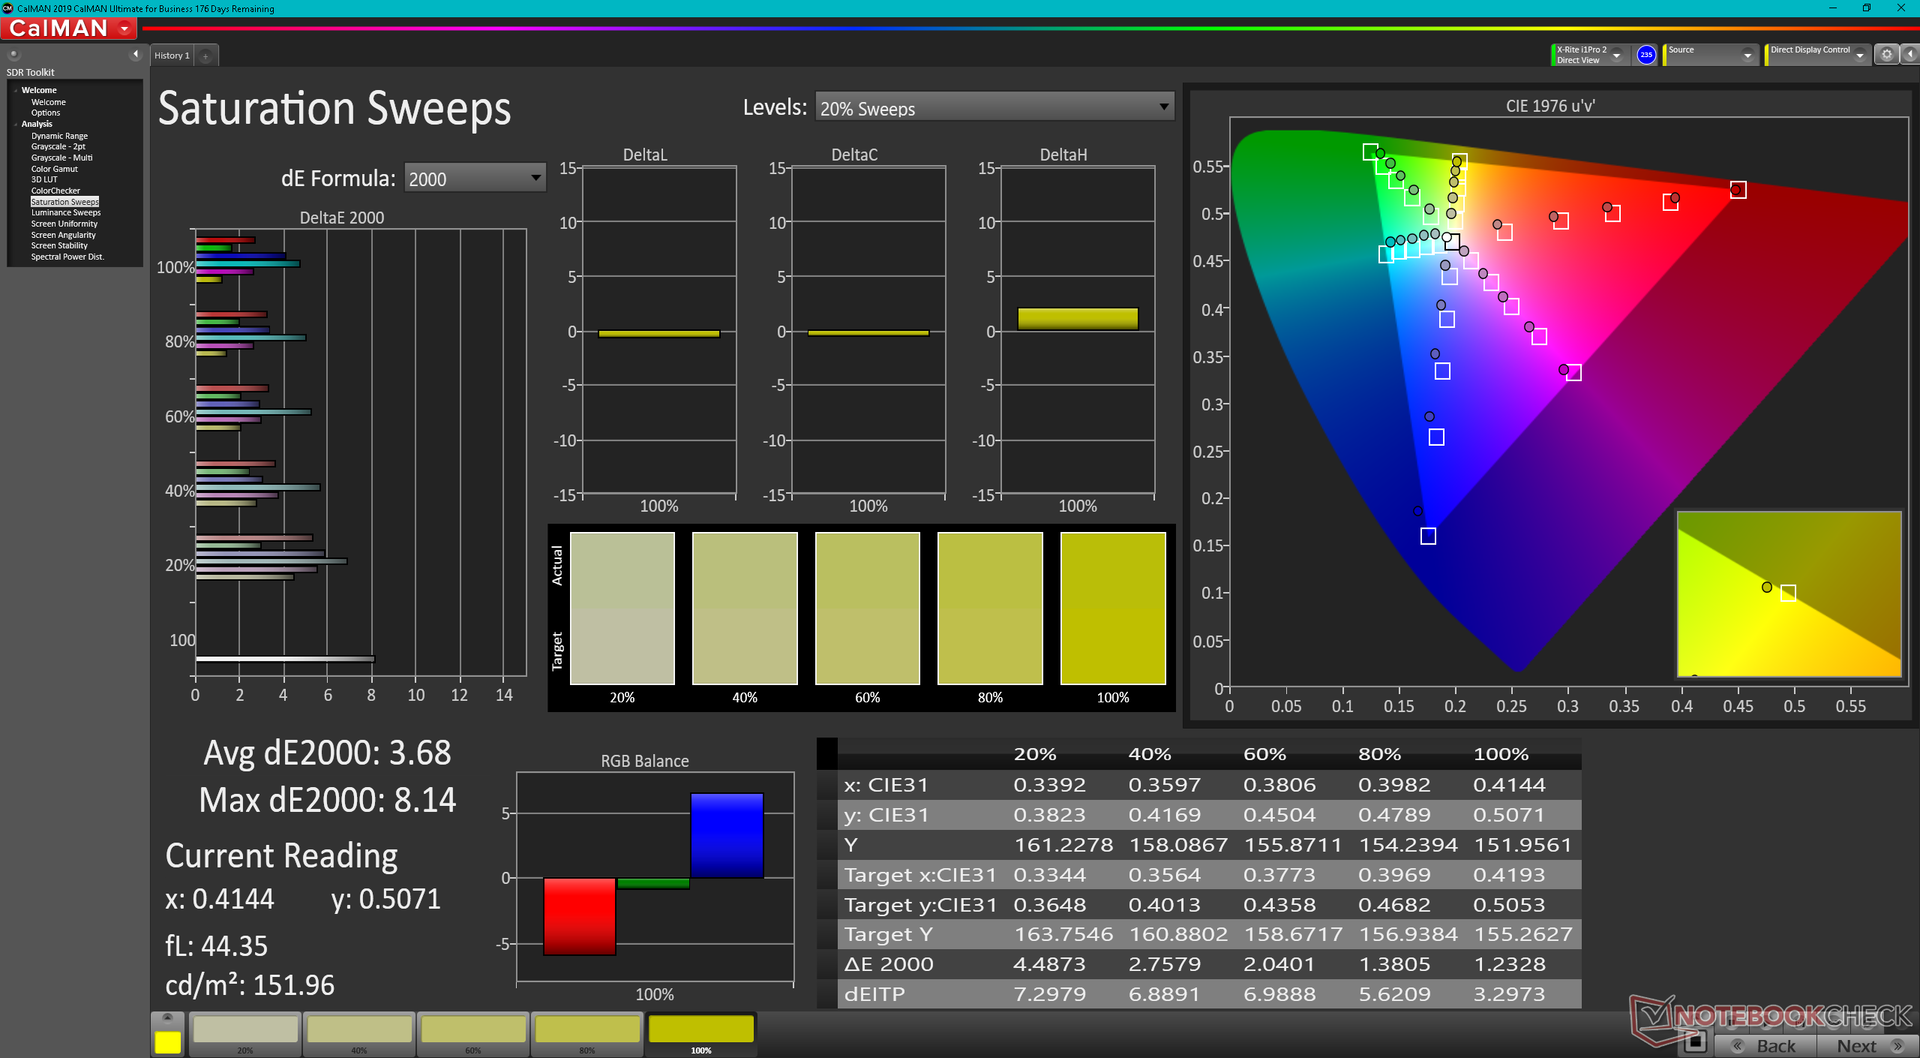
我们的Inspiron 16 7620二合一产品上的京东方NV16N45 IPS面板是第一个出现在我们数据库中的。去年的 Inspiron 16 Plus 7610例如,它的出货量是由友达光电的IPS面板代替的。与旧的友达面板相比,京东方面板提供了类似的色彩再现,但响应时间更快,减少了重影。不幸的是,这次的对比度没有那么深,只有不到1000:1。尽管如此,我们仍然很高兴看到Inspiron 16的标准配置是全sRGB覆盖,这比我们对Inspiron 15系列的评价要高。因此,显示质量可与许多更高端的可转换产品如Spectre X360 15或Zenbook Flip 15的IPS面板相媲美。
| |||||||||||||||||||||||||
Brightness Distribution: 90 %
Center on Battery: 320.7 cd/m²
Contrast: 891:1 (Black: 0.36 cd/m²)
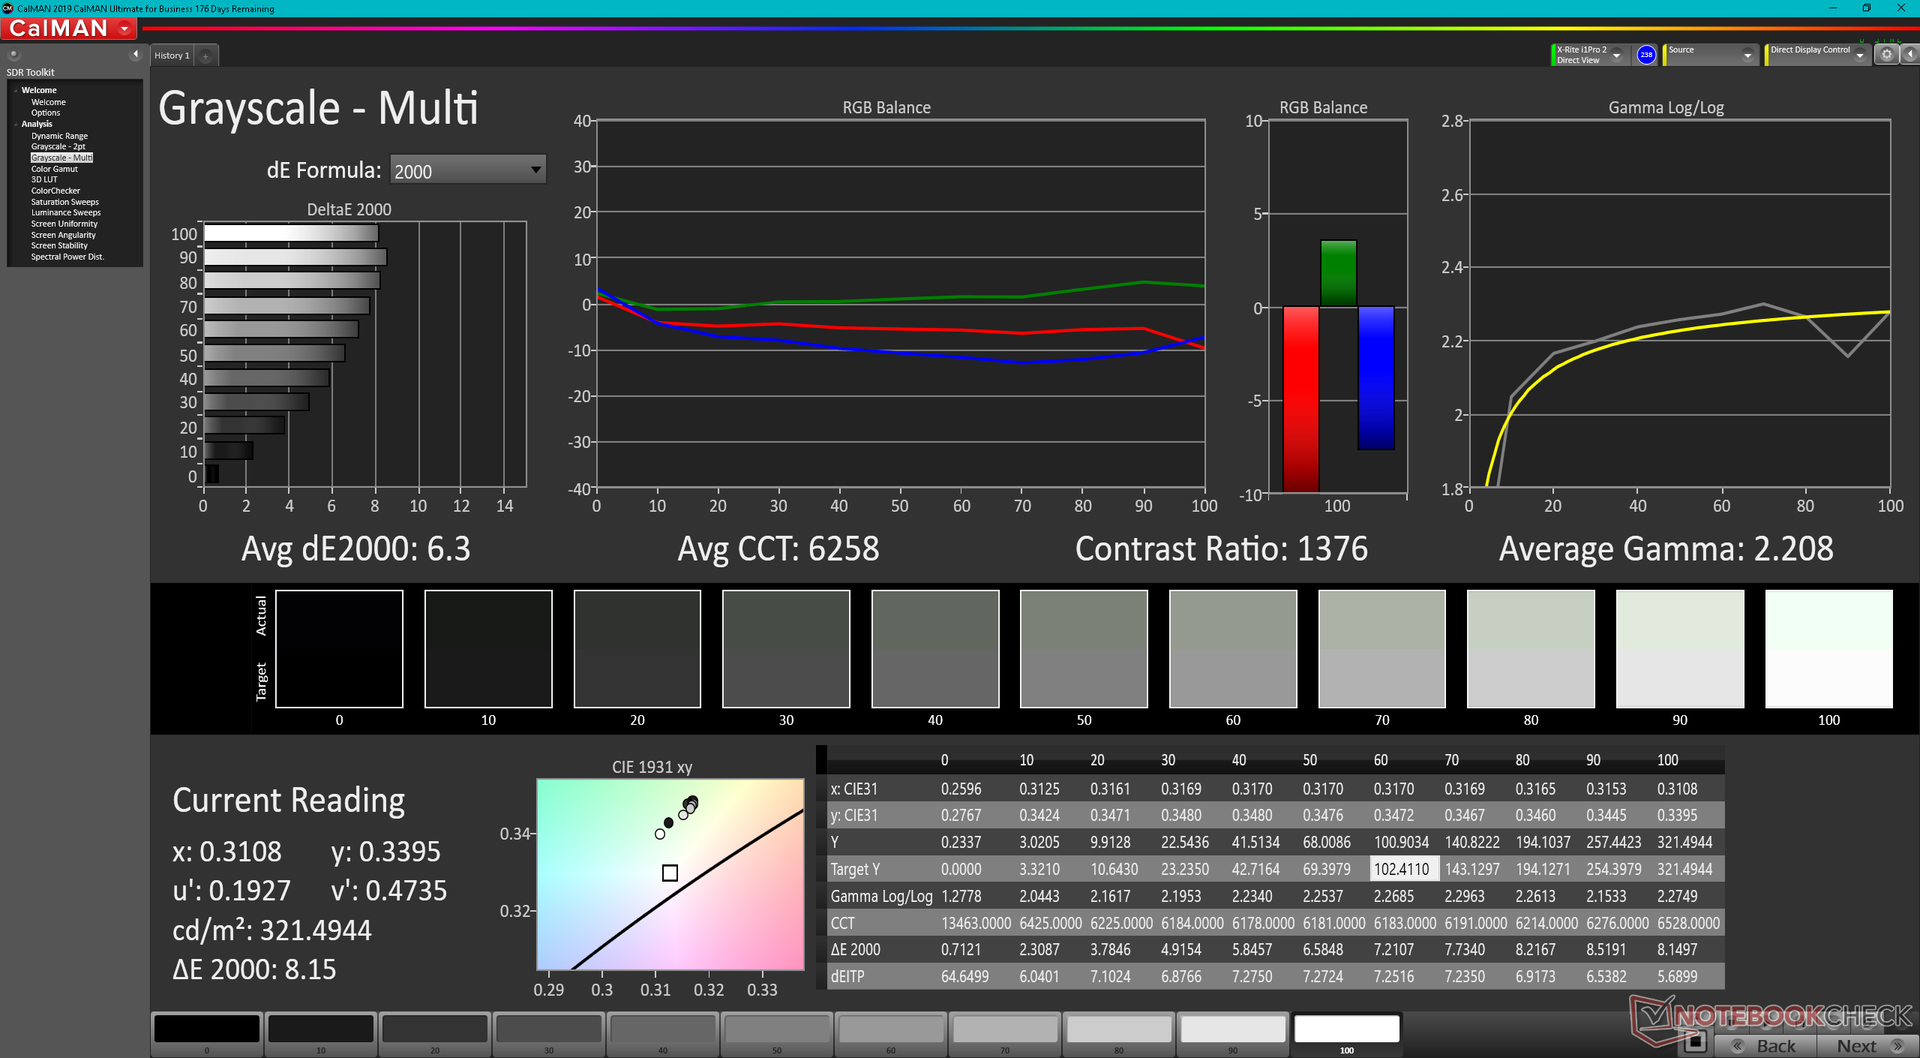
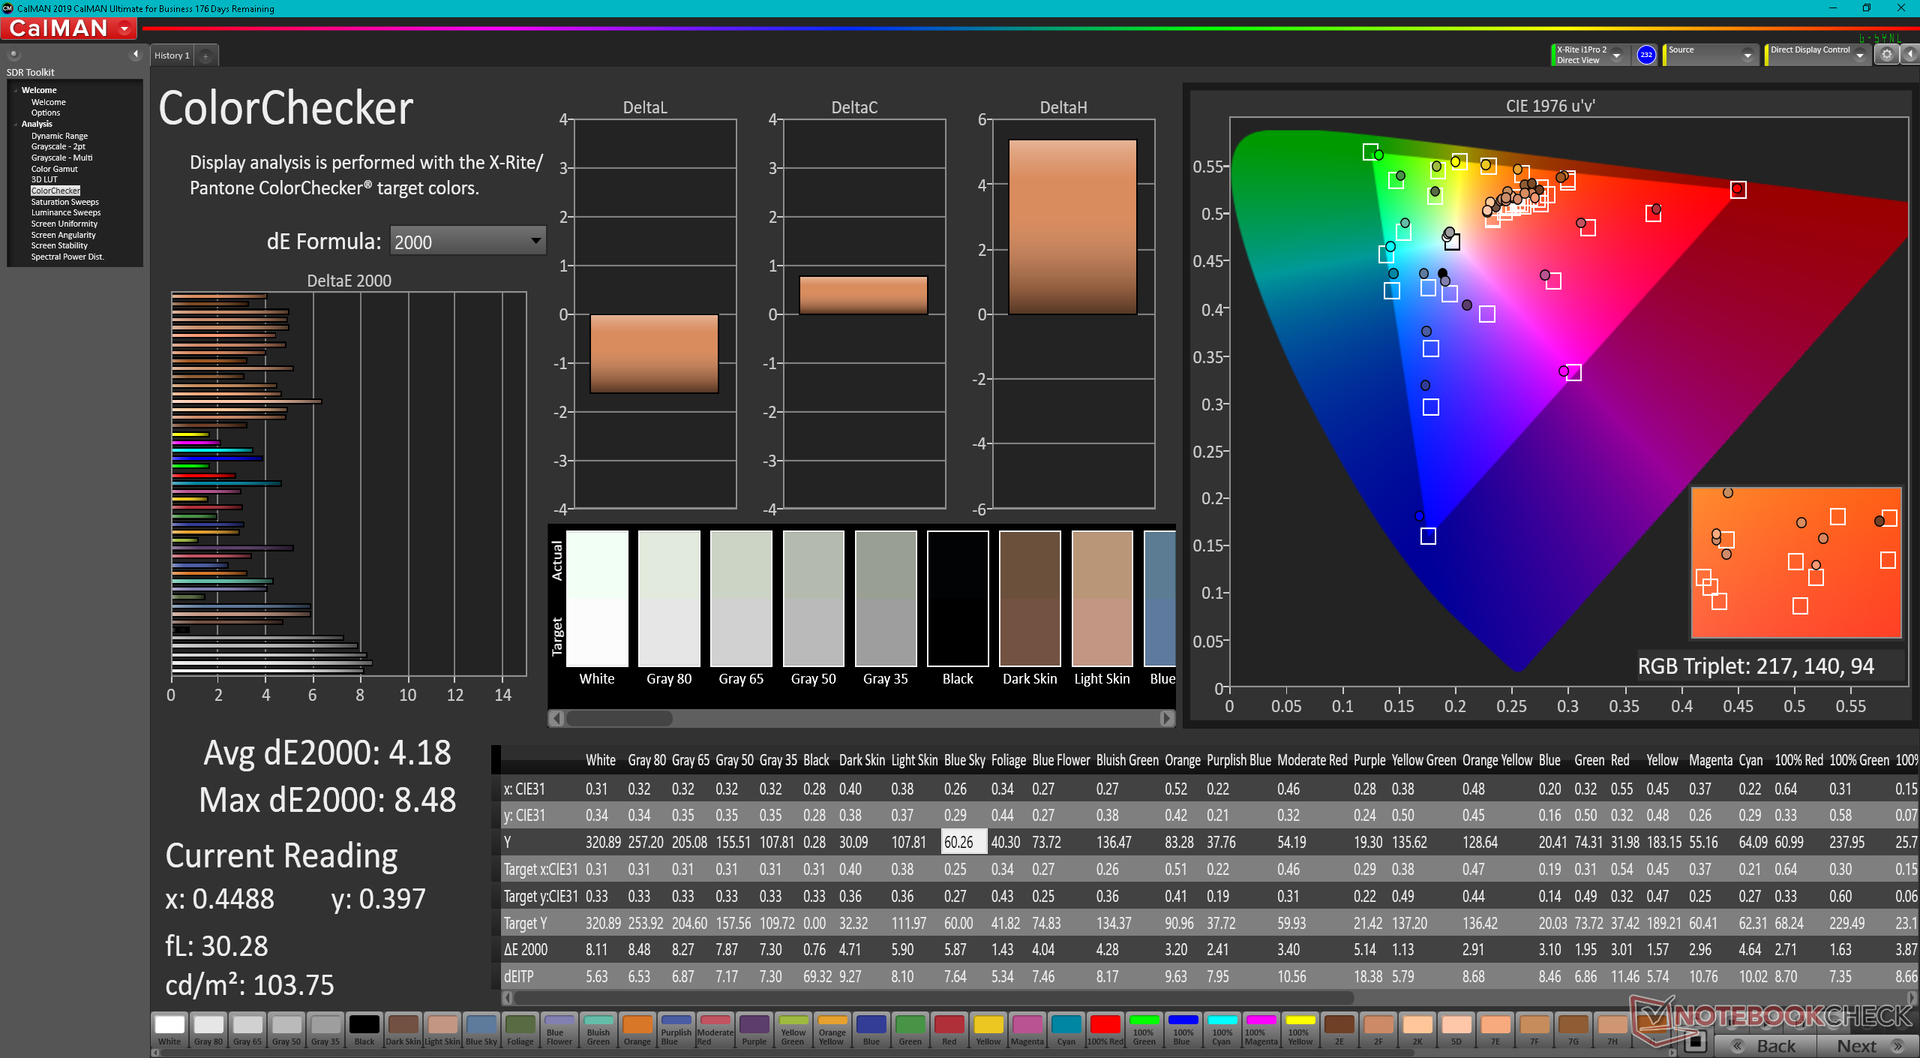
ΔE ColorChecker Calman: 4.18 | ∀{0.5-29.43 Ø4.72}
calibrated: 0.77
ΔE Greyscale Calman: 6.3 | ∀{0.09-98 Ø4.97}
69.3% AdobeRGB 1998 (Argyll 3D)
95.9% sRGB (Argyll 3D)
67% Display P3 (Argyll 3D)
Gamma: 2.21
CCT: 6258 K
| Dell Inspiron 16 7620 2-in-1 BOE NV16N45, IPS, 1920x1200, 16" | LG Gram 16 2-in-1 16T90P LG Philips LP160WQ1-SPA1, IPS, 2560x1600, 16" | Samsung Galaxy Book Pro 360 15 NP950QDB-KC3DE SDC4159, OLED, 1920x1080, 15.6" | Asus ZenBook Flip 15 UX563FD-A1027T BOE HF NE156QUM-N64, IPS, 3840x2160, 15.6" | Dell Inspiron 15 5579-9672 AUO, B156HW01, IPS, 1920x1080, 15.6" | HP Spectre X360 15-5ZV31AV AU Optronics AUO30EB, IPS, 3840x2160, 15.6" | |
|---|---|---|---|---|---|---|
| Display | 23% | 31% | -0% | -44% | -0% | |
| Display P3 Coverage (%) | 67 | 96.3 44% | 99.9 49% | 66.2 -1% | 37 -45% | 68.3 2% |
| sRGB Coverage (%) | 95.9 | 99.9 4% | 100 4% | 97.2 1% | 55.6 -42% | 94.3 -2% |
| AdobeRGB 1998 Coverage (%) | 69.3 | 84.7 22% | 97.6 41% | 68.3 -1% | 38.23 -45% | 68.4 -1% |
| Response Times | -22% | 92% | -78% | -34% | -87% | |
| Response Time Grey 50% / Grey 80% * (ms) | 32 ? | 36.4 ? -14% | 2 ? 94% | 60 ? -88% | 41 ? -28% | 56.8 ? -78% |
| Response Time Black / White * (ms) | 20.8 ? | 26.8 ? -29% | 2 ? 90% | 35 ? -68% | 29 ? -39% | 40.8 ? -96% |
| PWM Frequency (Hz) | 60 | |||||
| Screen | -36% | 64% | 31% | 5% | -17% | |
| Brightness middle (cd/m²) | 320.7 | 325.3 1% | 290 -10% | 351 9% | 251 -22% | 284.6 -11% |
| Brightness (cd/m²) | 309 | 311 1% | 290 -6% | 335 8% | 240 -22% | 285 -8% |
| Brightness Distribution (%) | 90 | 92 2% | 99 10% | 87 -3% | 84 -7% | 85 -6% |
| Black Level * (cd/m²) | 0.36 | 0.35 3% | 0.05 86% | 0.31 14% | 0.2 44% | 0.25 31% |
| Contrast (:1) | 891 | 929 4% | 5800 551% | 1132 27% | 1255 41% | 1138 28% |
| Colorchecker dE 2000 * | 4.18 | 4.91 -17% | 1.84 56% | 1.74 58% | 5.25 -26% | 3.52 16% |
| Colorchecker dE 2000 max. * | 8.48 | 10.96 -29% | 3.83 55% | 2.76 67% | 10.04 -18% | 5.56 34% |
| Colorchecker dE 2000 calibrated * | 0.77 | 2.83 -268% | 2.69 -249% | 3 -290% | ||
| Greyscale dE 2000 * | 6.3 | 7.7 -22% | 1.24 80% | 2.22 65% | 3.28 48% | 3.2 49% |
| Gamma | 2.21 100% | 2.12 104% | 2.2 100% | 2.35 94% | 2.15 102% | 2.28 96% |
| CCT | 6258 104% | 8272 79% | 6686 97% | 6667 97% | 6502 100% | 7070 92% |
| Color Space (Percent of AdobeRGB 1998) (%) | 75.8 | 62 | 35 | 61.1 | ||
| Color Space (Percent of sRGB) (%) | 99.8 | 97 | 55 | 93.8 | ||
| Total Average (Program / Settings) | -12% /
-21% | 62% /
61% | -16% /
7% | -24% /
-12% | -35% /
-24% |
* ... smaller is better
色彩空间覆盖了95%以上的sRGB,适合大多数业余的图形编辑任务。如果需要,更昂贵的OLED选项可以提供DCI-P3覆盖,以获得更深的色彩。
显示屏开箱后没有经过校准,这对于相对廉价的Inspiron系列来说是可以预期的。例如,色温比它需要的要高。一旦经过校准,平均灰度和彩色DeltaE值将分别从6.3到1.0和4.18到0.77得到明显改善。建议应用我们上面的校准过的ICM配置文件,或者自己校准显示器,以更好地利用面板的优秀sRGB覆盖率。
Display Response Times
| ↔ Response Time Black to White | ||
|---|---|---|
| 20.8 ms ... rise ↗ and fall ↘ combined | ↗ 11.6 ms rise | 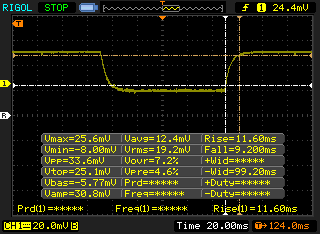 |
| ↘ 9.2 ms fall | ||
| The screen shows good response rates in our tests, but may be too slow for competitive gamers. In comparison, all tested devices range from 0.1 (minimum) to 240 (maximum) ms. » 46 % of all devices are better. This means that the measured response time is similar to the average of all tested devices (19.8 ms). | ||
| ↔ Response Time 50% Grey to 80% Grey | ||
| 32 ms ... rise ↗ and fall ↘ combined | ↗ 16 ms rise | 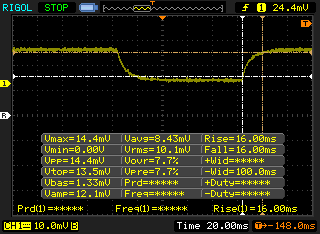 |
| ↘ 16 ms fall | ||
| The screen shows slow response rates in our tests and will be unsatisfactory for gamers. In comparison, all tested devices range from 0.165 (minimum) to 636 (maximum) ms. » 43 % of all devices are better. This means that the measured response time is similar to the average of all tested devices (31 ms). | ||
Screen Flickering / PWM (Pulse-Width Modulation)
| Screen flickering / PWM not detected | 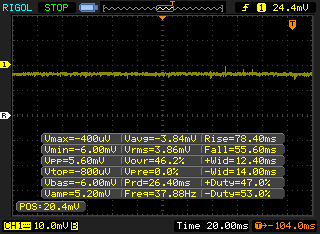 | ||
In comparison: 52 % of all tested devices do not use PWM to dim the display. If PWM was detected, an average of 7753 (minimum: 5 - maximum: 343500) Hz was measured. | |||
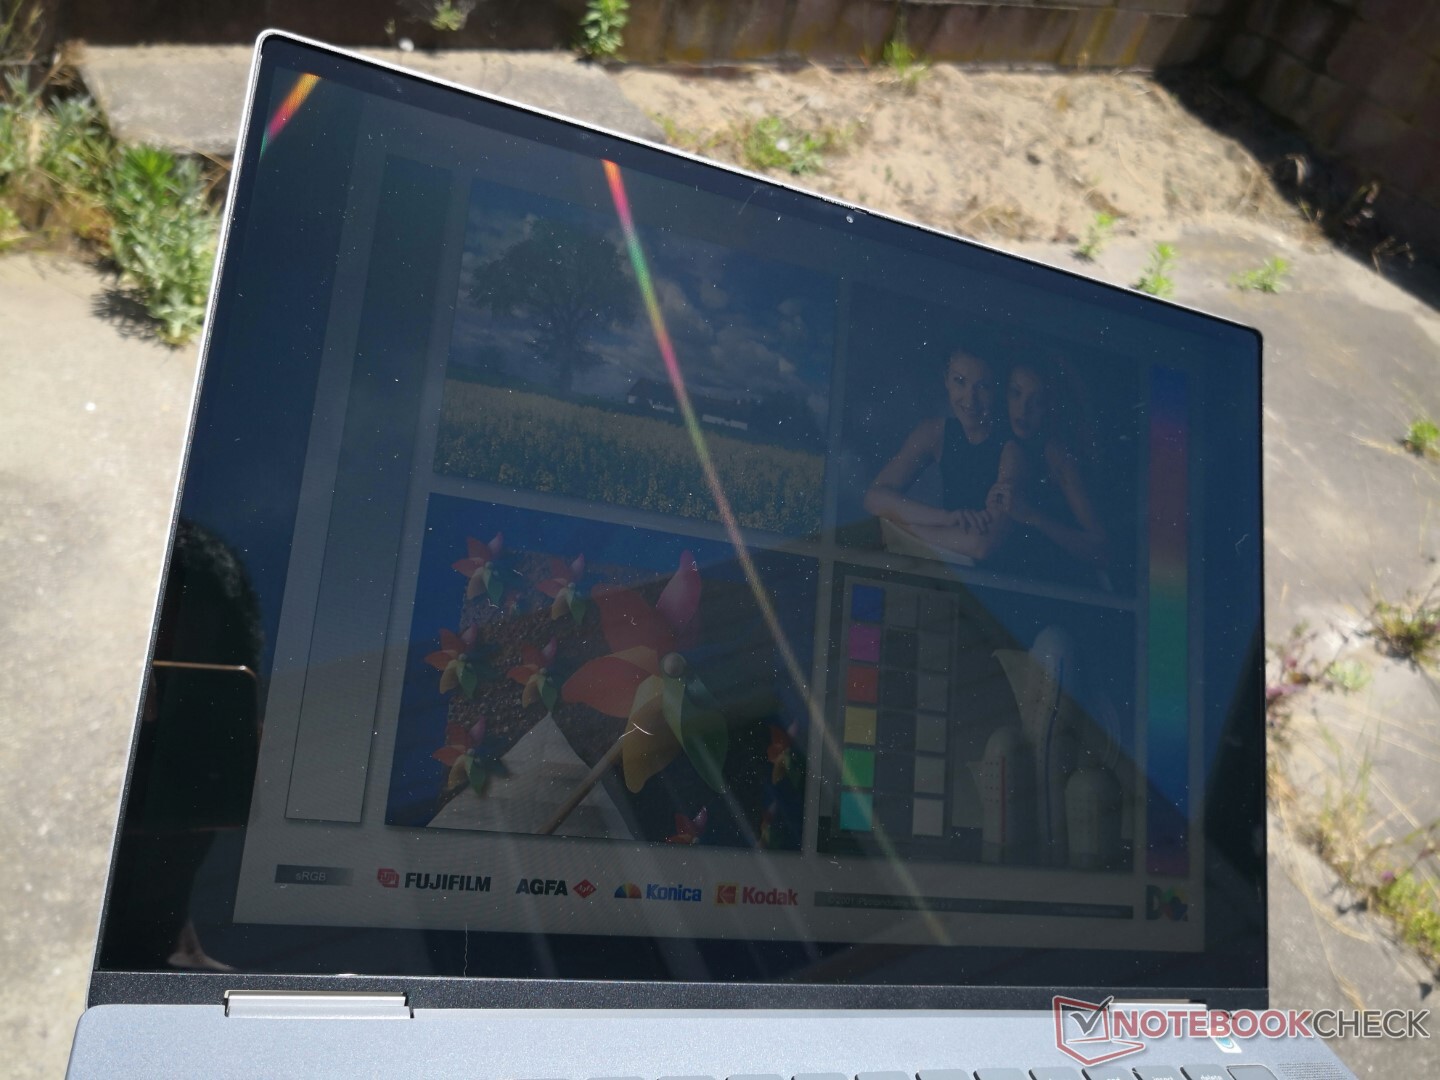
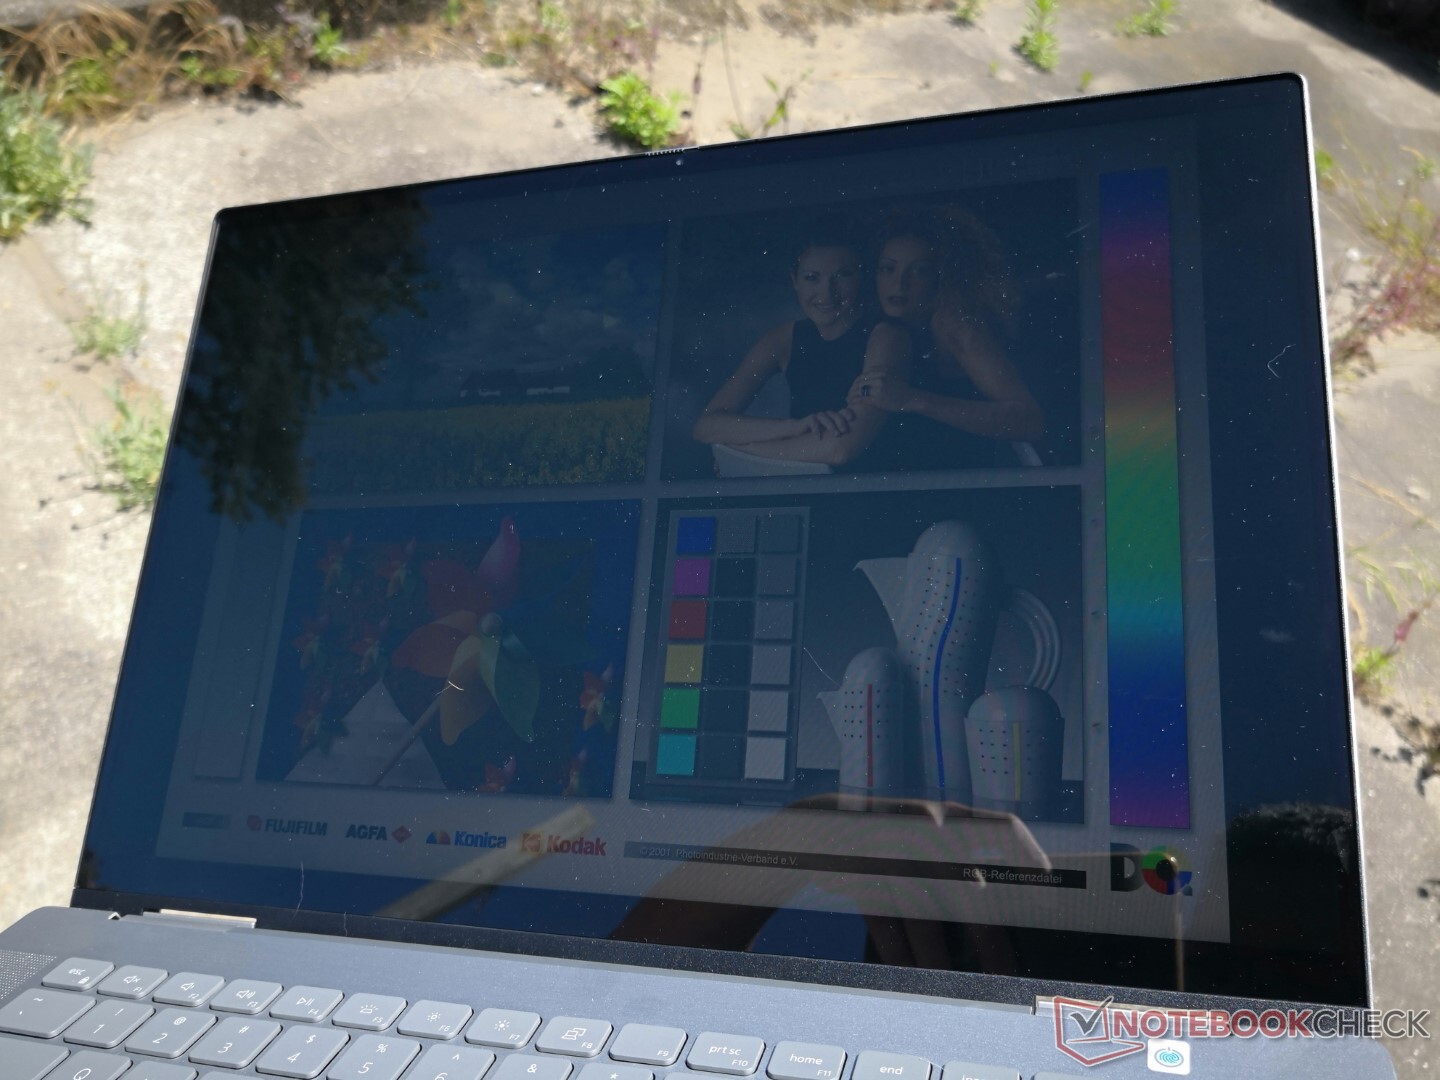
在最大320尼特左右,该显示器在其尺寸类别的亮度方面是平均水平。选择价格较高的OLED SKU会将亮度提高到400尼特,以获得更好的户外观看体验。
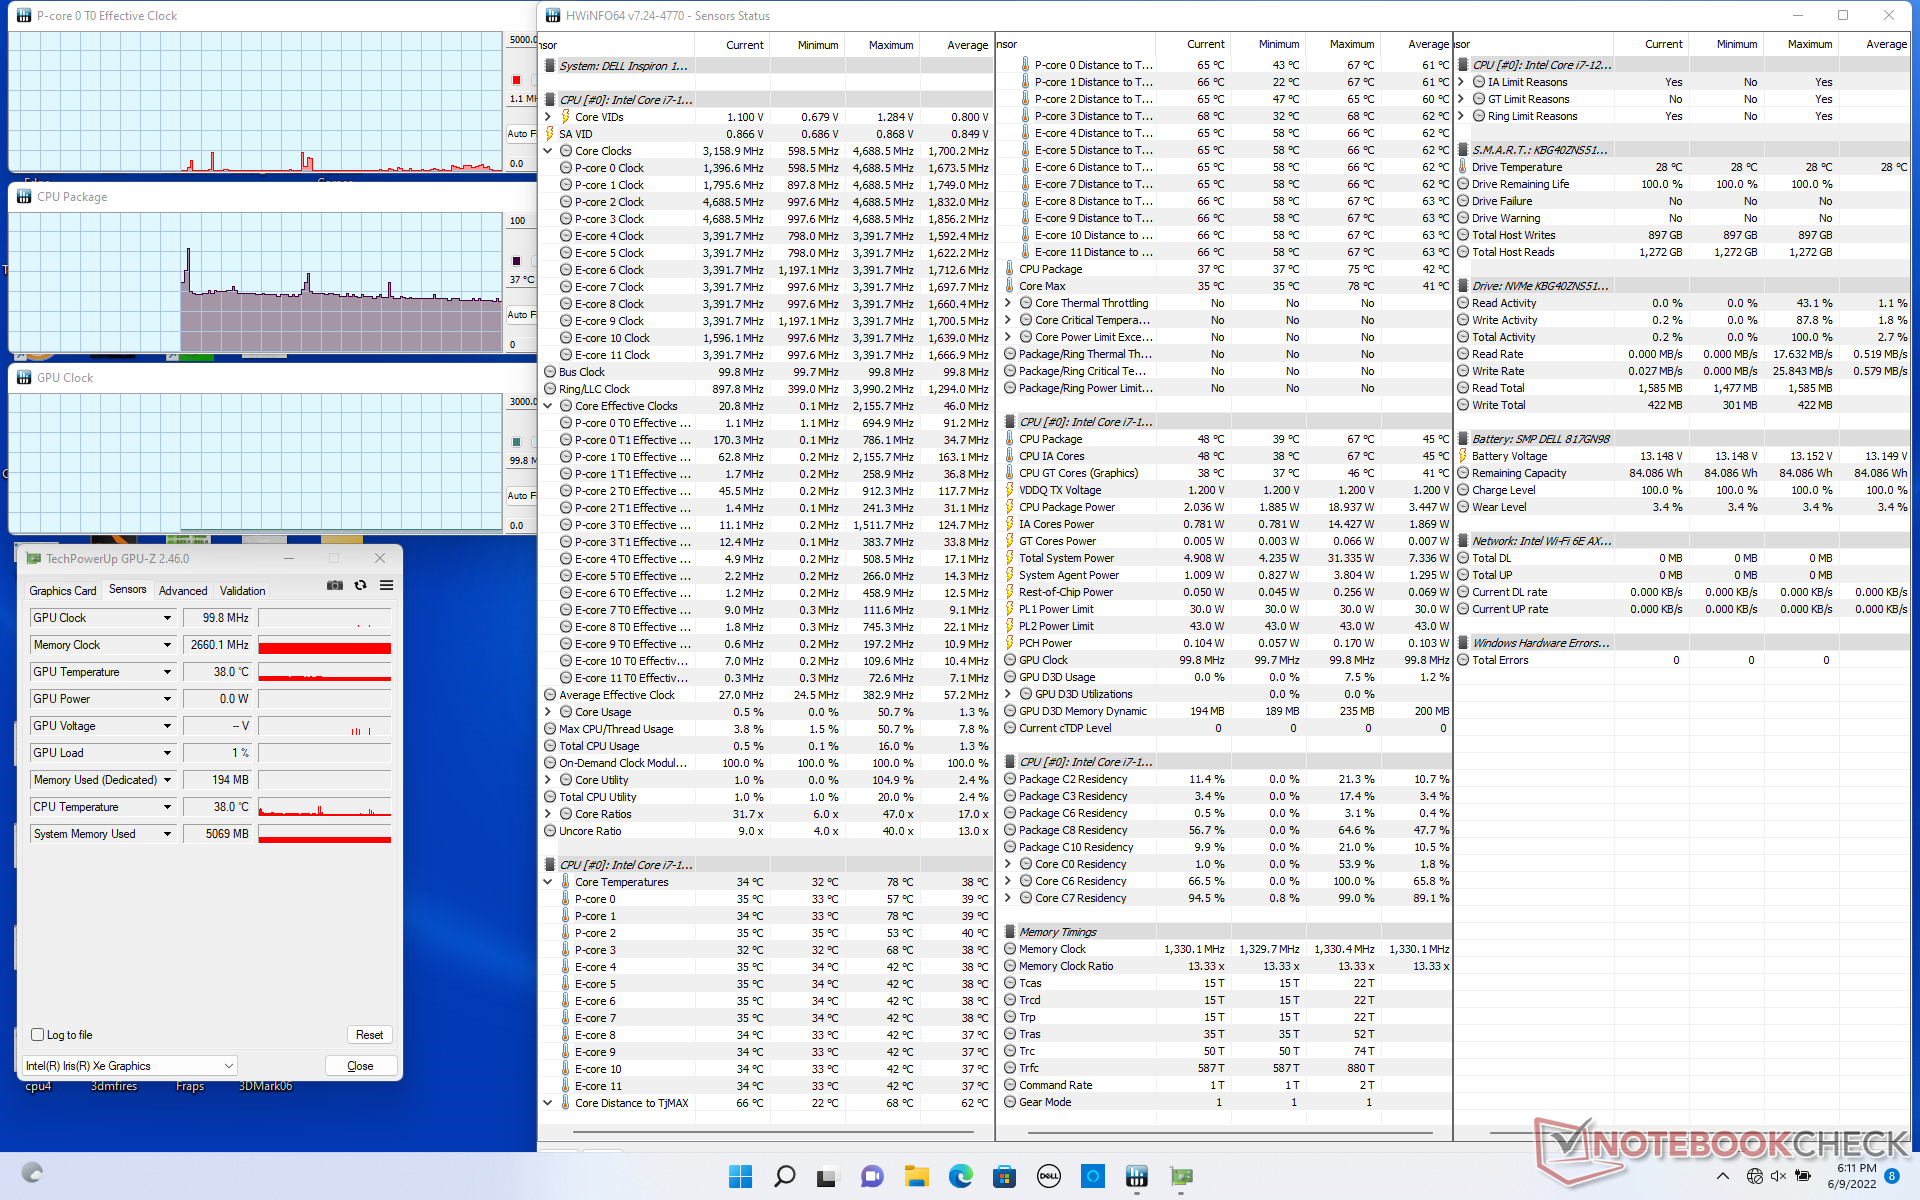
性能 - 快速的英特尔第12代选项
测试条件
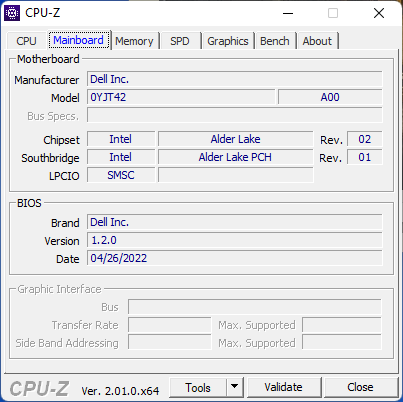
我们的设备通过Windows设置为性能模式,通过My Dell软件设置为超性能模式,以获得尽可能高的基准分数。建议熟悉 "我的戴尔 "软件,了解任何保修、支持、电池和性能细节。
处理器
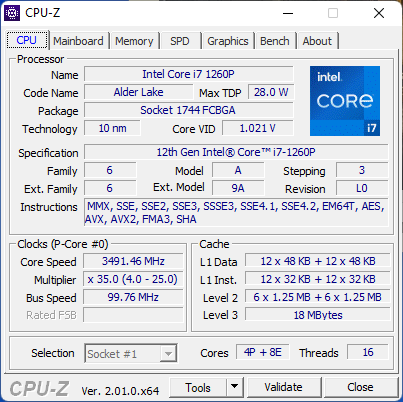
CPU性能非常好,多线程结果与H系列不相上下 Ryzen 6 5600H尽管英特尔CPU的功耗要求较低,但其单线程性能也快了20%。当与 酷睿i7-1255U相比,我们的 酷睿i7-1260P能够提供约25%的多线程性能。
与常见的第11代U系列相比,其性能提高了 酷睿i7-1165G7在多线程工作负载方面,我们的酷睿i7-1260P可以快50%到80%,即使考虑到任何性能节流。在循环运行CineBench R15 xT时,我们Inspiron的CPU性能将下降约15%。
Cinebench R15 Multi Loop
Cinebench R23: Multi Core | Single Core
Cinebench R15: CPU Multi 64Bit | CPU Single 64Bit
Blender: v2.79 BMW27 CPU
7-Zip 18.03: 7z b 4 | 7z b 4 -mmt1
Geekbench 5.5: Multi-Core | Single-Core
HWBOT x265 Benchmark v2.2: 4k Preset
LibreOffice : 20 Documents To PDF
R Benchmark 2.5: Overall mean
| Cinebench R20 / CPU (Multi Core) | |
| Asus ROG Zephyrus Duo 16 GX650RX | |
| Huawei MateBook 16 R7 5800H | |
| Dell Inspiron 16 Plus 7610-MHJ8F | |
| Honor MagicBook 16 2022 | |
| Dell Inspiron 16 7620 2-in-1 | |
| Average Intel Core i7-1260P (1234 - 4748, n=25) | |
| Asus VivoBook 15 OLED M513UA-L1282W | |
| HP Pavilion Aero 13 be0097nr | |
| Asus ZenBook 14X OLED UX5400EA-L7154W | |
| LG Gram 16 2-in-1 16T90P | |
| Samsung Galaxy Book Pro 360 15 NP950QDB-KC3DE | |
| Samsung Galaxy Book Flex 15-NP950 | |
| Cinebench R20 / CPU (Single Core) | |
| Average Intel Core i7-1260P (448 - 698, n=25) | |
| Dell Inspiron 16 7620 2-in-1 | |
| Asus ROG Zephyrus Duo 16 GX650RX | |
| Dell Inspiron 16 Plus 7610-MHJ8F | |
| Asus ZenBook 14X OLED UX5400EA-L7154W | |
| HP Pavilion Aero 13 be0097nr | |
| LG Gram 16 2-in-1 16T90P | |
| Honor MagicBook 16 2022 | |
| Huawei MateBook 16 R7 5800H | |
| Samsung Galaxy Book Pro 360 15 NP950QDB-KC3DE | |
| Asus VivoBook 15 OLED M513UA-L1282W | |
| Samsung Galaxy Book Flex 15-NP950 | |
| Cinebench R15 / CPU Multi 64Bit | |
| Asus ROG Zephyrus Duo 16 GX650RX | |
| Huawei MateBook 16 R7 5800H | |
| Dell Inspiron 16 Plus 7610-MHJ8F | |
| Dell Inspiron 16 7620 2-in-1 | |
| Honor MagicBook 16 2022 | |
| Average Intel Core i7-1260P (549 - 2034, n=29) | |
| Asus VivoBook 15 OLED M513UA-L1282W | |
| HP Pavilion Aero 13 be0097nr | |
| Asus ZenBook 14X OLED UX5400EA-L7154W | |
| Samsung Galaxy Book Pro 360 15 NP950QDB-KC3DE | |
| Samsung Galaxy Book Flex 15-NP950 | |
| LG Gram 16 2-in-1 16T90P | |
| Cinebench R15 / CPU Single 64Bit | |
| Asus ROG Zephyrus Duo 16 GX650RX | |
| Dell Inspiron 16 7620 2-in-1 | |
| Huawei MateBook 16 R7 5800H | |
| Average Intel Core i7-1260P (165.4 - 260, n=27) | |
| HP Pavilion Aero 13 be0097nr | |
| Dell Inspiron 16 Plus 7610-MHJ8F | |
| Honor MagicBook 16 2022 | |
| Asus ZenBook 14X OLED UX5400EA-L7154W | |
| LG Gram 16 2-in-1 16T90P | |
| Samsung Galaxy Book Pro 360 15 NP950QDB-KC3DE | |
| Asus VivoBook 15 OLED M513UA-L1282W | |
| Samsung Galaxy Book Flex 15-NP950 | |
| Blender / v2.79 BMW27 CPU | |
| Samsung Galaxy Book Flex 15-NP950 | |
| Samsung Galaxy Book Pro 360 15 NP950QDB-KC3DE | |
| LG Gram 16 2-in-1 16T90P | |
| Asus ZenBook 14X OLED UX5400EA-L7154W | |
| Average Intel Core i7-1260P (264 - 906, n=26) | |
| Asus VivoBook 15 OLED M513UA-L1282W | |
| Dell Inspiron 16 7620 2-in-1 | |
| HP Pavilion Aero 13 be0097nr | |
| Honor MagicBook 16 2022 | |
| Dell Inspiron 16 Plus 7610-MHJ8F | |
| Huawei MateBook 16 R7 5800H | |
| Asus ROG Zephyrus Duo 16 GX650RX | |
| 7-Zip 18.03 / 7z b 4 | |
| Asus ROG Zephyrus Duo 16 GX650RX | |
| Huawei MateBook 16 R7 5800H | |
| Dell Inspiron 16 Plus 7610-MHJ8F | |
| Honor MagicBook 16 2022 | |
| HP Pavilion Aero 13 be0097nr | |
| Asus VivoBook 15 OLED M513UA-L1282W | |
| Average Intel Core i7-1260P (16146 - 47064, n=25) | |
| Dell Inspiron 16 7620 2-in-1 | |
| Asus ZenBook 14X OLED UX5400EA-L7154W | |
| LG Gram 16 2-in-1 16T90P | |
| Samsung Galaxy Book Flex 15-NP950 | |
| Samsung Galaxy Book Pro 360 15 NP950QDB-KC3DE | |
| 7-Zip 18.03 / 7z b 4 -mmt1 | |
| Asus ROG Zephyrus Duo 16 GX650RX | |
| Huawei MateBook 16 R7 5800H | |
| Honor MagicBook 16 2022 | |
| HP Pavilion Aero 13 be0097nr | |
| Dell Inspiron 16 7620 2-in-1 | |
| Dell Inspiron 16 Plus 7610-MHJ8F | |
| Average Intel Core i7-1260P (4064 - 5791, n=25) | |
| LG Gram 16 2-in-1 16T90P | |
| Asus ZenBook 14X OLED UX5400EA-L7154W | |
| Samsung Galaxy Book Pro 360 15 NP950QDB-KC3DE | |
| Asus VivoBook 15 OLED M513UA-L1282W | |
| Samsung Galaxy Book Flex 15-NP950 | |
| HWBOT x265 Benchmark v2.2 / 4k Preset | |
| Asus ROG Zephyrus Duo 16 GX650RX | |
| Huawei MateBook 16 R7 5800H | |
| Honor MagicBook 16 2022 | |
| Dell Inspiron 16 Plus 7610-MHJ8F | |
| Dell Inspiron 16 7620 2-in-1 | |
| Average Intel Core i7-1260P (3.45 - 13.6, n=26) | |
| HP Pavilion Aero 13 be0097nr | |
| Asus VivoBook 15 OLED M513UA-L1282W | |
| Asus ZenBook 14X OLED UX5400EA-L7154W | |
| LG Gram 16 2-in-1 16T90P | |
| Samsung Galaxy Book Flex 15-NP950 | |
| Samsung Galaxy Book Pro 360 15 NP950QDB-KC3DE | |
| LibreOffice / 20 Documents To PDF | |
| Asus ZenBook 14X OLED UX5400EA-L7154W | |
| Asus VivoBook 15 OLED M513UA-L1282W | |
| Samsung Galaxy Book Flex 15-NP950 | |
| HP Pavilion Aero 13 be0097nr | |
| Honor MagicBook 16 2022 | |
| Samsung Galaxy Book Pro 360 15 NP950QDB-KC3DE | |
| LG Gram 16 2-in-1 16T90P | |
| Huawei MateBook 16 R7 5800H | |
| Dell Inspiron 16 7620 2-in-1 | |
| Average Intel Core i7-1260P (40.2 - 65.7, n=25) | |
| Dell Inspiron 16 Plus 7610-MHJ8F | |
| Asus ROG Zephyrus Duo 16 GX650RX | |
| R Benchmark 2.5 / Overall mean | |
| Samsung Galaxy Book Flex 15-NP950 | |
| Samsung Galaxy Book Pro 360 15 NP950QDB-KC3DE | |
| Asus ZenBook 14X OLED UX5400EA-L7154W | |
| LG Gram 16 2-in-1 16T90P | |
| Asus VivoBook 15 OLED M513UA-L1282W | |
| Dell Inspiron 16 Plus 7610-MHJ8F | |
| HP Pavilion Aero 13 be0097nr | |
| Honor MagicBook 16 2022 | |
| Huawei MateBook 16 R7 5800H | |
| Dell Inspiron 16 7620 2-in-1 | |
| Average Intel Core i7-1260P (0.4559 - 0.727, n=25) | |
| Asus ROG Zephyrus Duo 16 GX650RX | |
* ... smaller is better
AIDA64: FP32 Ray-Trace | FPU Julia | CPU SHA3 | CPU Queen | FPU SinJulia | FPU Mandel | CPU AES | CPU ZLib | FP64 Ray-Trace | CPU PhotoWorxx
| Performance rating | |
| Average Intel Core i7-1260P | |
| Samsung Galaxy Book Pro 360 15 NP950QDB-KC3DE | |
| LG Gram 16 2-in-1 16T90P | |
| Dell Inspiron 16 7620 2-in-1 | |
| AIDA64 / FP32 Ray-Trace | |
| Samsung Galaxy Book Pro 360 15 NP950QDB-KC3DE | |
| Average Intel Core i7-1260P (2176 - 10898, n=26) | |
| LG Gram 16 2-in-1 16T90P | |
| Dell Inspiron 16 7620 2-in-1 | |
| AIDA64 / FPU Julia | |
| Average Intel Core i7-1260P (11015 - 56906, n=26) | |
| Samsung Galaxy Book Pro 360 15 NP950QDB-KC3DE | |
| LG Gram 16 2-in-1 16T90P | |
| Dell Inspiron 16 7620 2-in-1 | |
| AIDA64 / CPU SHA3 | |
| Samsung Galaxy Book Pro 360 15 NP950QDB-KC3DE | |
| LG Gram 16 2-in-1 16T90P | |
| Average Intel Core i7-1260P (669 - 2709, n=26) | |
| Dell Inspiron 16 7620 2-in-1 | |
| AIDA64 / CPU Queen | |
| Dell Inspiron 16 7620 2-in-1 | |
| Average Intel Core i7-1260P (42571 - 82493, n=26) | |
| LG Gram 16 2-in-1 16T90P | |
| Samsung Galaxy Book Pro 360 15 NP950QDB-KC3DE | |
| AIDA64 / FPU SinJulia | |
| Dell Inspiron 16 7620 2-in-1 | |
| Average Intel Core i7-1260P (2901 - 6975, n=26) | |
| LG Gram 16 2-in-1 16T90P | |
| Samsung Galaxy Book Pro 360 15 NP950QDB-KC3DE | |
| AIDA64 / FPU Mandel | |
| Samsung Galaxy Book Pro 360 15 NP950QDB-KC3DE | |
| LG Gram 16 2-in-1 16T90P | |
| Average Intel Core i7-1260P (5950 - 26376, n=26) | |
| Dell Inspiron 16 7620 2-in-1 | |
| AIDA64 / CPU AES | |
| Samsung Galaxy Book Pro 360 15 NP950QDB-KC3DE | |
| LG Gram 16 2-in-1 16T90P | |
| Average Intel Core i7-1260P (16041 - 92356, n=26) | |
| Dell Inspiron 16 7620 2-in-1 | |
| AIDA64 / CPU ZLib | |
| Dell Inspiron 16 7620 2-in-1 | |
| Average Intel Core i7-1260P (259 - 771, n=26) | |
| Samsung Galaxy Book Pro 360 15 NP950QDB-KC3DE | |
| LG Gram 16 2-in-1 16T90P | |
| AIDA64 / FP64 Ray-Trace | |
| Samsung Galaxy Book Pro 360 15 NP950QDB-KC3DE | |
| Average Intel Core i7-1260P (1237 - 5858, n=26) | |
| LG Gram 16 2-in-1 16T90P | |
| Dell Inspiron 16 7620 2-in-1 | |
| AIDA64 / CPU PhotoWorxx | |
| LG Gram 16 2-in-1 16T90P | |
| Samsung Galaxy Book Pro 360 15 NP950QDB-KC3DE | |
| Average Intel Core i7-1260P (13261 - 43652, n=26) | |
| Dell Inspiron 16 7620 2-in-1 | |
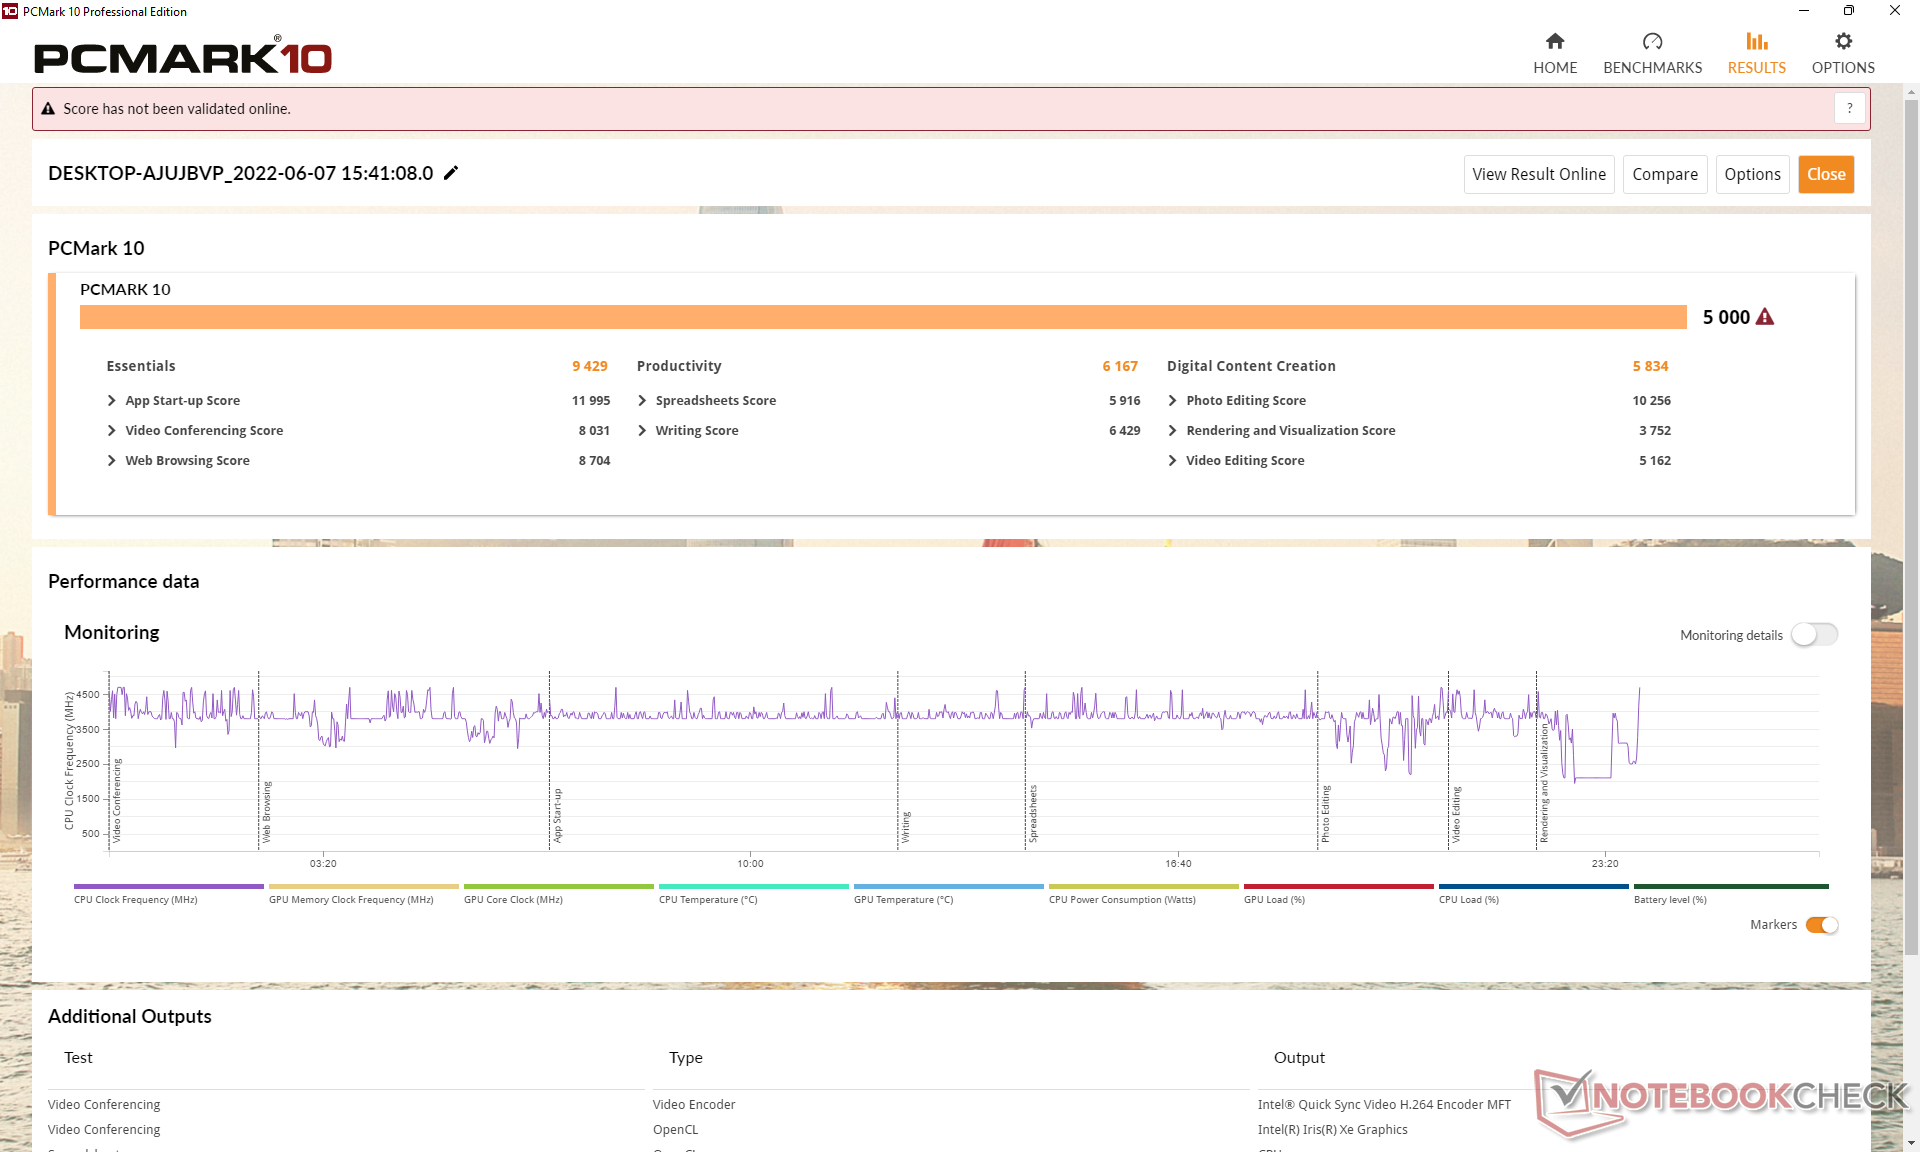
系统性能
PCMark 10的结果可与更高端和更昂贵的替代品相媲美,如LG Gram 16 2-in-1 16T90P或三星Galaxy Book Pro 360 15。特别是数字内容创作子得分比预期的要高。
CrossMark: Overall | Productivity | Creativity | Responsiveness
| PCMark 10 / Score | |
| Average Intel Core i7-1260P, Intel Iris Xe Graphics G7 96EUs (4796 - 6068, n=17) | |
| Dell Inspiron 16 7620 2-in-1 | |
| LG Gram 16 2-in-1 16T90P | |
| Samsung Galaxy Book Pro 360 15 NP950QDB-KC3DE | |
| Asus ZenBook Flip 15 UX563FD-A1027T | |
| HP Spectre X360 15-5ZV31AV | |
| Dell Inspiron 15 5579-9672 | |
| PCMark 10 / Essentials | |
| Average Intel Core i7-1260P, Intel Iris Xe Graphics G7 96EUs (9260 - 11251, n=17) | |
| LG Gram 16 2-in-1 16T90P | |
| Samsung Galaxy Book Pro 360 15 NP950QDB-KC3DE | |
| HP Spectre X360 15-5ZV31AV | |
| Dell Inspiron 16 7620 2-in-1 | |
| Asus ZenBook Flip 15 UX563FD-A1027T | |
| Dell Inspiron 15 5579-9672 | |
| PCMark 10 / Productivity | |
| Asus ZenBook Flip 15 UX563FD-A1027T | |
| Average Intel Core i7-1260P, Intel Iris Xe Graphics G7 96EUs (6167 - 8629, n=17) | |
| LG Gram 16 2-in-1 16T90P | |
| HP Spectre X360 15-5ZV31AV | |
| Samsung Galaxy Book Pro 360 15 NP950QDB-KC3DE | |
| Dell Inspiron 16 7620 2-in-1 | |
| Dell Inspiron 15 5579-9672 | |
| PCMark 10 / Digital Content Creation | |
| Average Intel Core i7-1260P, Intel Iris Xe Graphics G7 96EUs (5231 - 6908, n=17) | |
| Dell Inspiron 16 7620 2-in-1 | |
| Samsung Galaxy Book Pro 360 15 NP950QDB-KC3DE | |
| LG Gram 16 2-in-1 16T90P | |
| Asus ZenBook Flip 15 UX563FD-A1027T | |
| HP Spectre X360 15-5ZV31AV | |
| Dell Inspiron 15 5579-9672 | |
| CrossMark / Overall | |
| Average Intel Core i7-1260P, Intel Iris Xe Graphics G7 96EUs (1484 - 1811, n=16) | |
| Dell Inspiron 16 7620 2-in-1 | |
| CrossMark / Productivity | |
| Average Intel Core i7-1260P, Intel Iris Xe Graphics G7 96EUs (1486 - 1755, n=16) | |
| Dell Inspiron 16 7620 2-in-1 | |
| CrossMark / Creativity | |
| Average Intel Core i7-1260P, Intel Iris Xe Graphics G7 96EUs (1451 - 1872, n=16) | |
| Dell Inspiron 16 7620 2-in-1 | |
| CrossMark / Responsiveness | |
| Average Intel Core i7-1260P, Intel Iris Xe Graphics G7 96EUs (1253 - 1807, n=16) | |
| Dell Inspiron 16 7620 2-in-1 | |
| PCMark 10 Score | 5000 points | |
Help | ||
| AIDA64 / Memory Copy | |
| LG Gram 16 2-in-1 16T90P | |
| Samsung Galaxy Book Pro 360 15 NP950QDB-KC3DE | |
| Average Intel Core i7-1260P (25125 - 71544, n=25) | |
| Dell Inspiron 16 7620 2-in-1 | |
| AIDA64 / Memory Read | |
| LG Gram 16 2-in-1 16T90P | |
| Samsung Galaxy Book Pro 360 15 NP950QDB-KC3DE | |
| Average Intel Core i7-1260P (24983 - 72065, n=25) | |
| Dell Inspiron 16 7620 2-in-1 | |
| AIDA64 / Memory Write | |
| LG Gram 16 2-in-1 16T90P | |
| Samsung Galaxy Book Pro 360 15 NP950QDB-KC3DE | |
| Average Intel Core i7-1260P (23512 - 66799, n=25) | |
| Dell Inspiron 16 7620 2-in-1 | |
| AIDA64 / Memory Latency | |
| LG Gram 16 2-in-1 16T90P | |
| Samsung Galaxy Book Pro 360 15 NP950QDB-KC3DE | |
| Average Intel Core i7-1260P (77.9 - 118.4, n=21) | |
* ... smaller is better
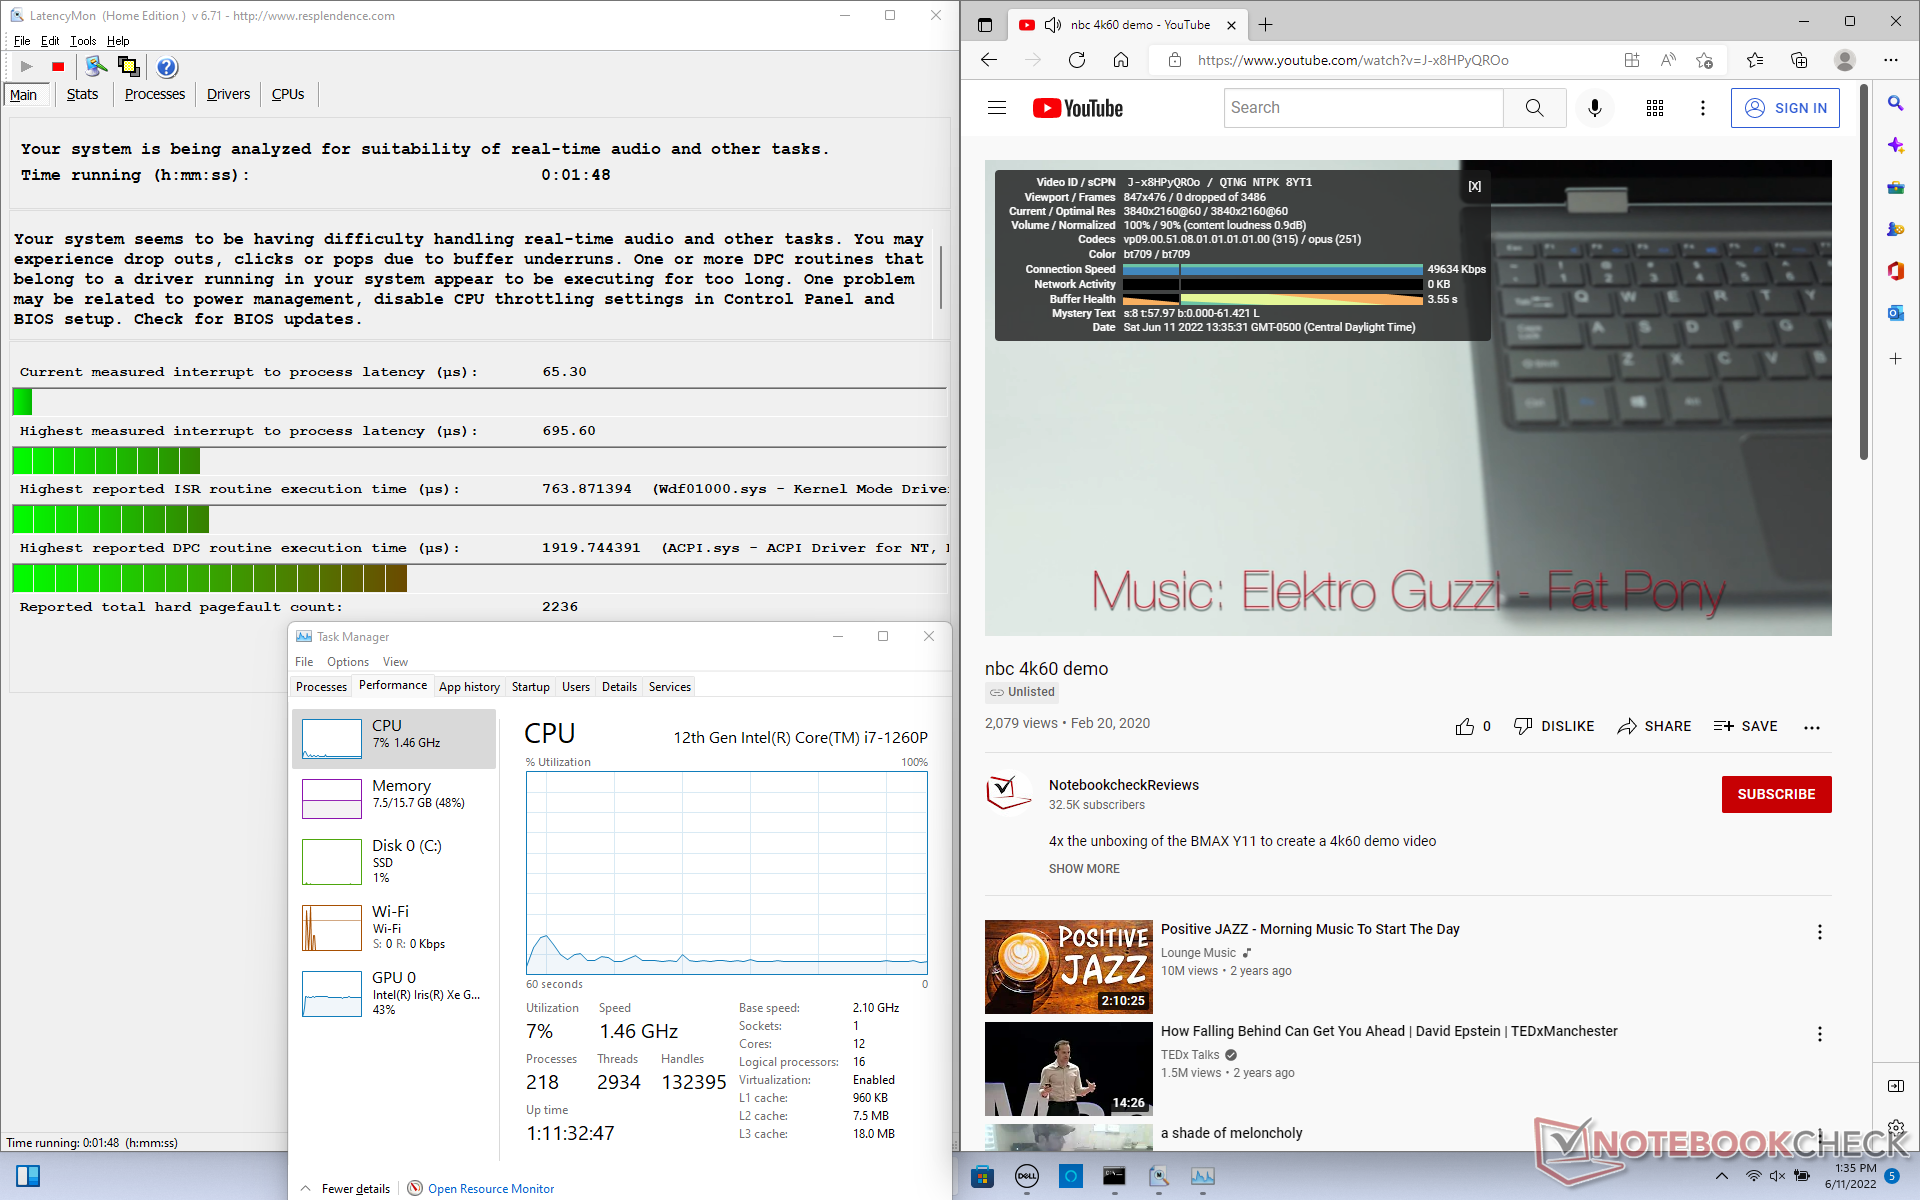
DPC延时
LatencyMon显示,在打开我们主页的多个浏览器标签时,存在轻微的DPC问题。在我们的测试中,以60 FPS播放4K视频是顺畅的,没有丢帧。
| DPC Latencies / LatencyMon - interrupt to process latency (max), Web, Youtube, Prime95 | |
| Samsung Galaxy Book Pro 360 15 NP950QDB-KC3DE | |
| LG Gram 16 2-in-1 16T90P | |
| Dell Inspiron 16 7620 2-in-1 | |
* ... smaller is better
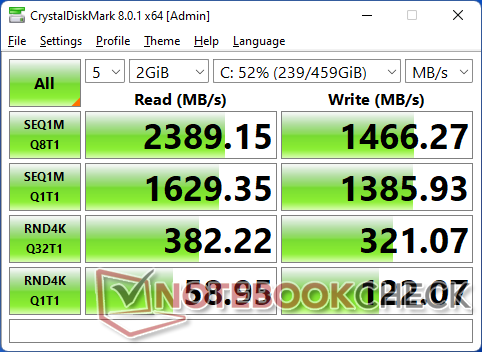
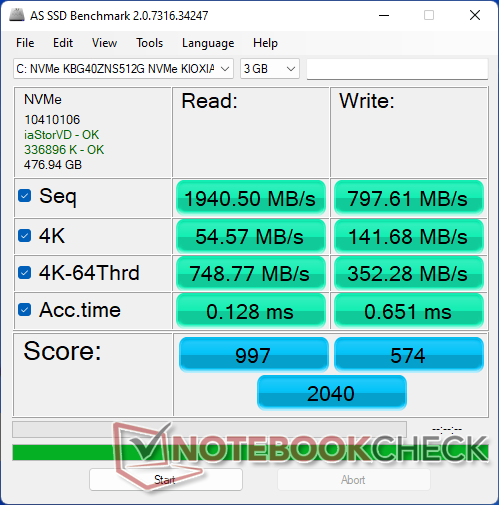
存储设备
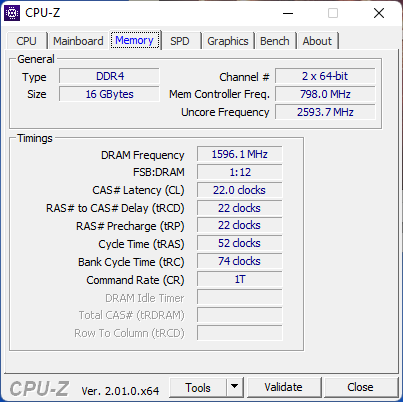
我们的测试设备配备了一个中档的 东芝KBG40ZNS512GM.2 PCIe3 NVMe固态硬盘,适合Inspiron这样的中端笔记本系列。最大传输率可以达到2400MB/s以上,但低效的冷却意味着性能在受压时可以下降到1200MB/s,正如我们下面的DiskSpd循环测试结果所示。尽管家庭或办公室用户的目标受众不会注意到这一点,但高性能用户可能会对这里的固态硬盘缺乏冷却功能感到失望。

| Drive Performance rating - Percent | |
| LG Gram 16 2-in-1 16T90P | |
| Asus ZenBook Flip 15 UX563FD-A1027T -8! | |
| Samsung Galaxy Book Pro 360 15 NP950QDB-KC3DE | |
| HP Spectre X360 15-5ZV31AV -8! | |
| Average Toshiba KBG40ZNS512G NVMe | |
| Dell Inspiron 16 7620 2-in-1 | |
| Dell Inspiron 15 5579-9672 -8! | |
* ... smaller is better
Disk Throttling: DiskSpd Read Loop, Queue Depth 8
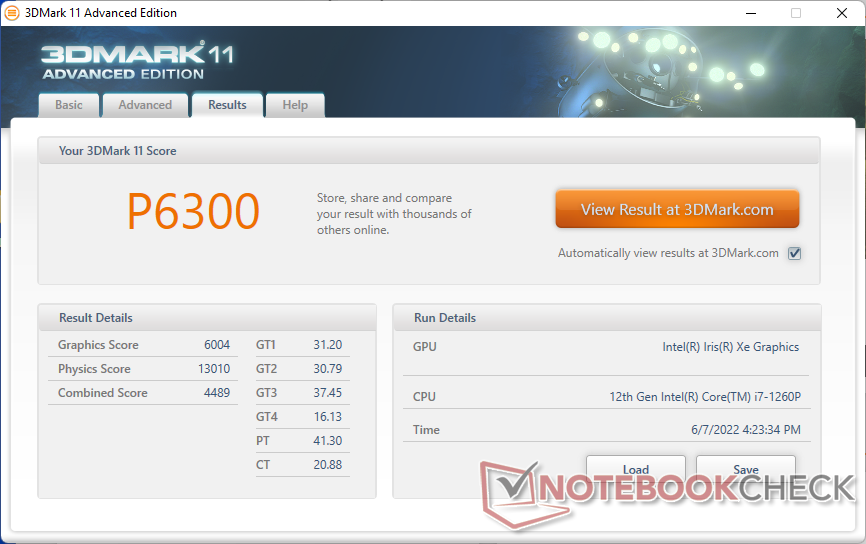
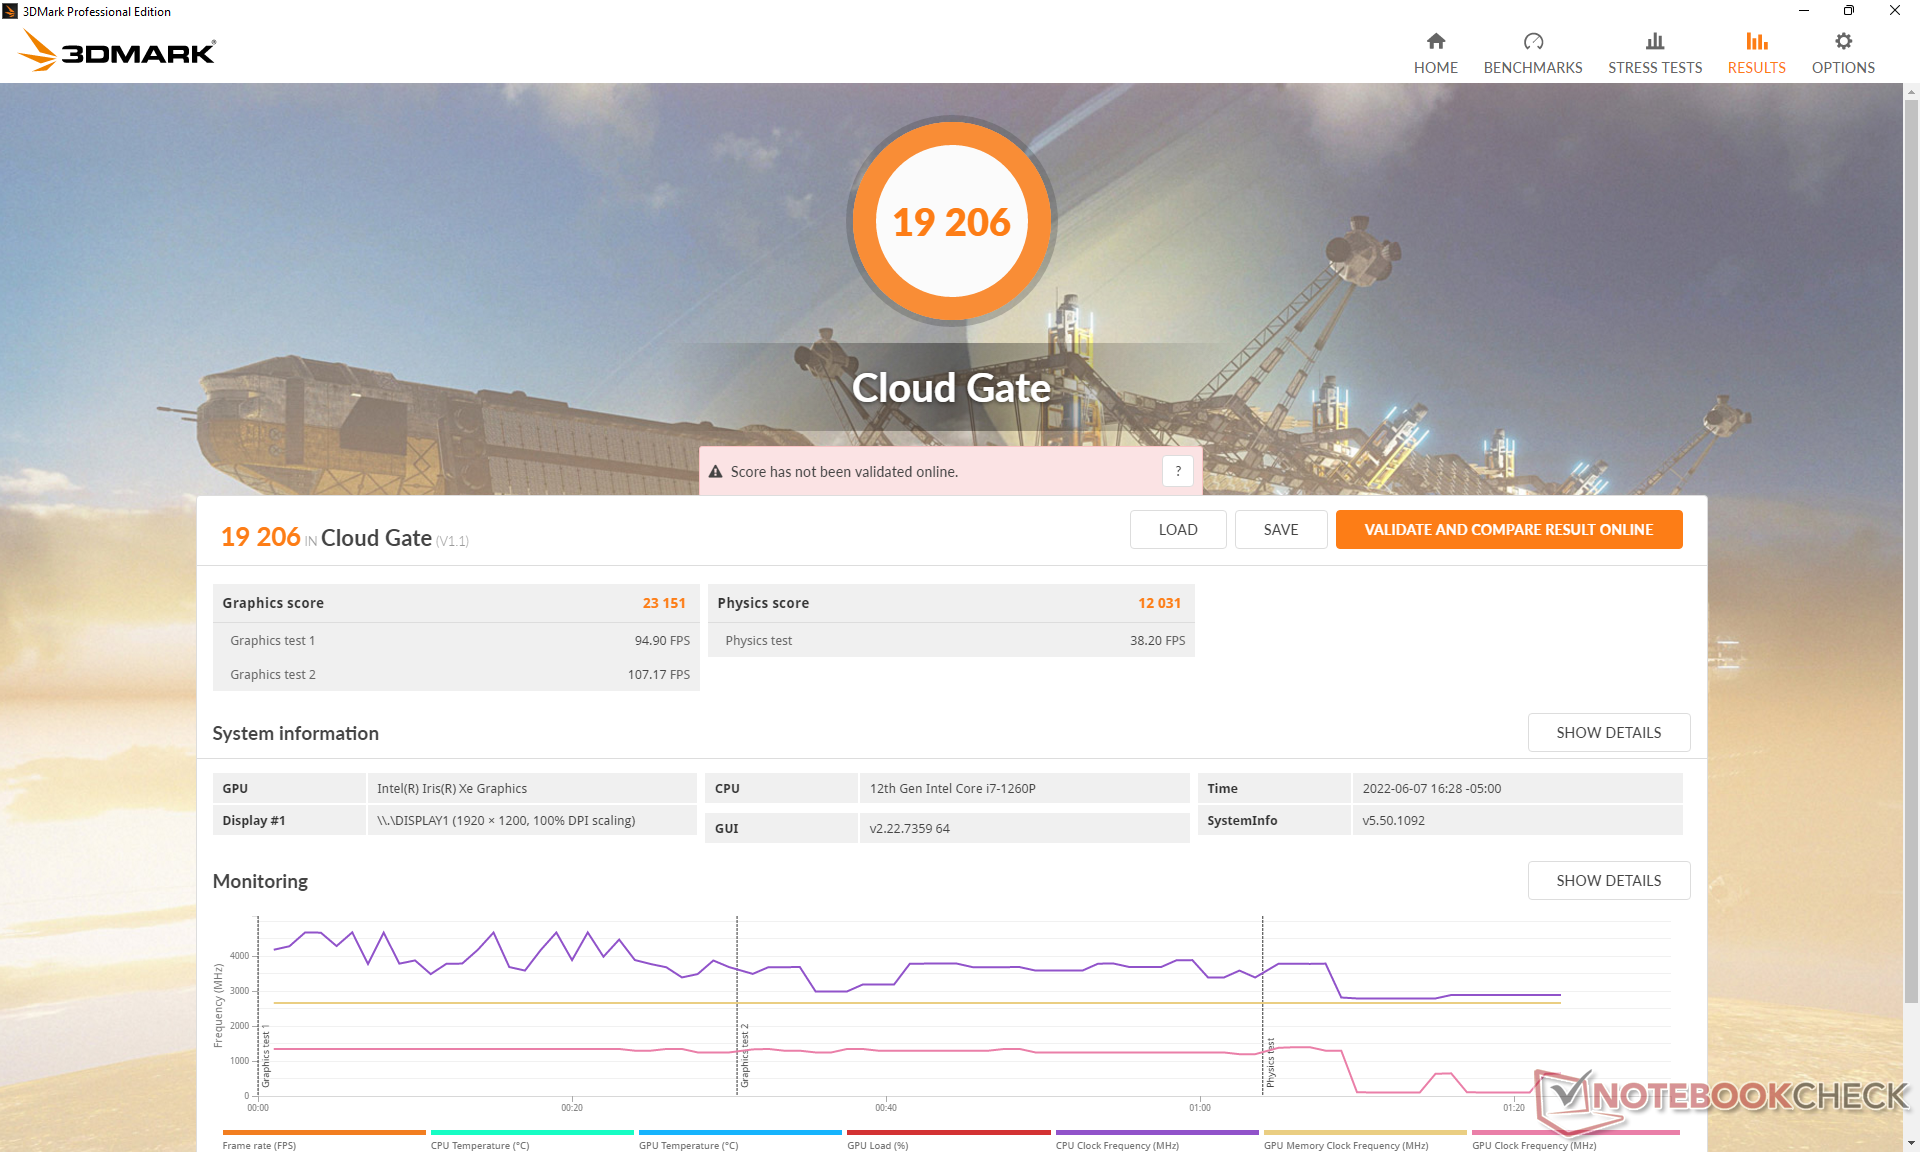
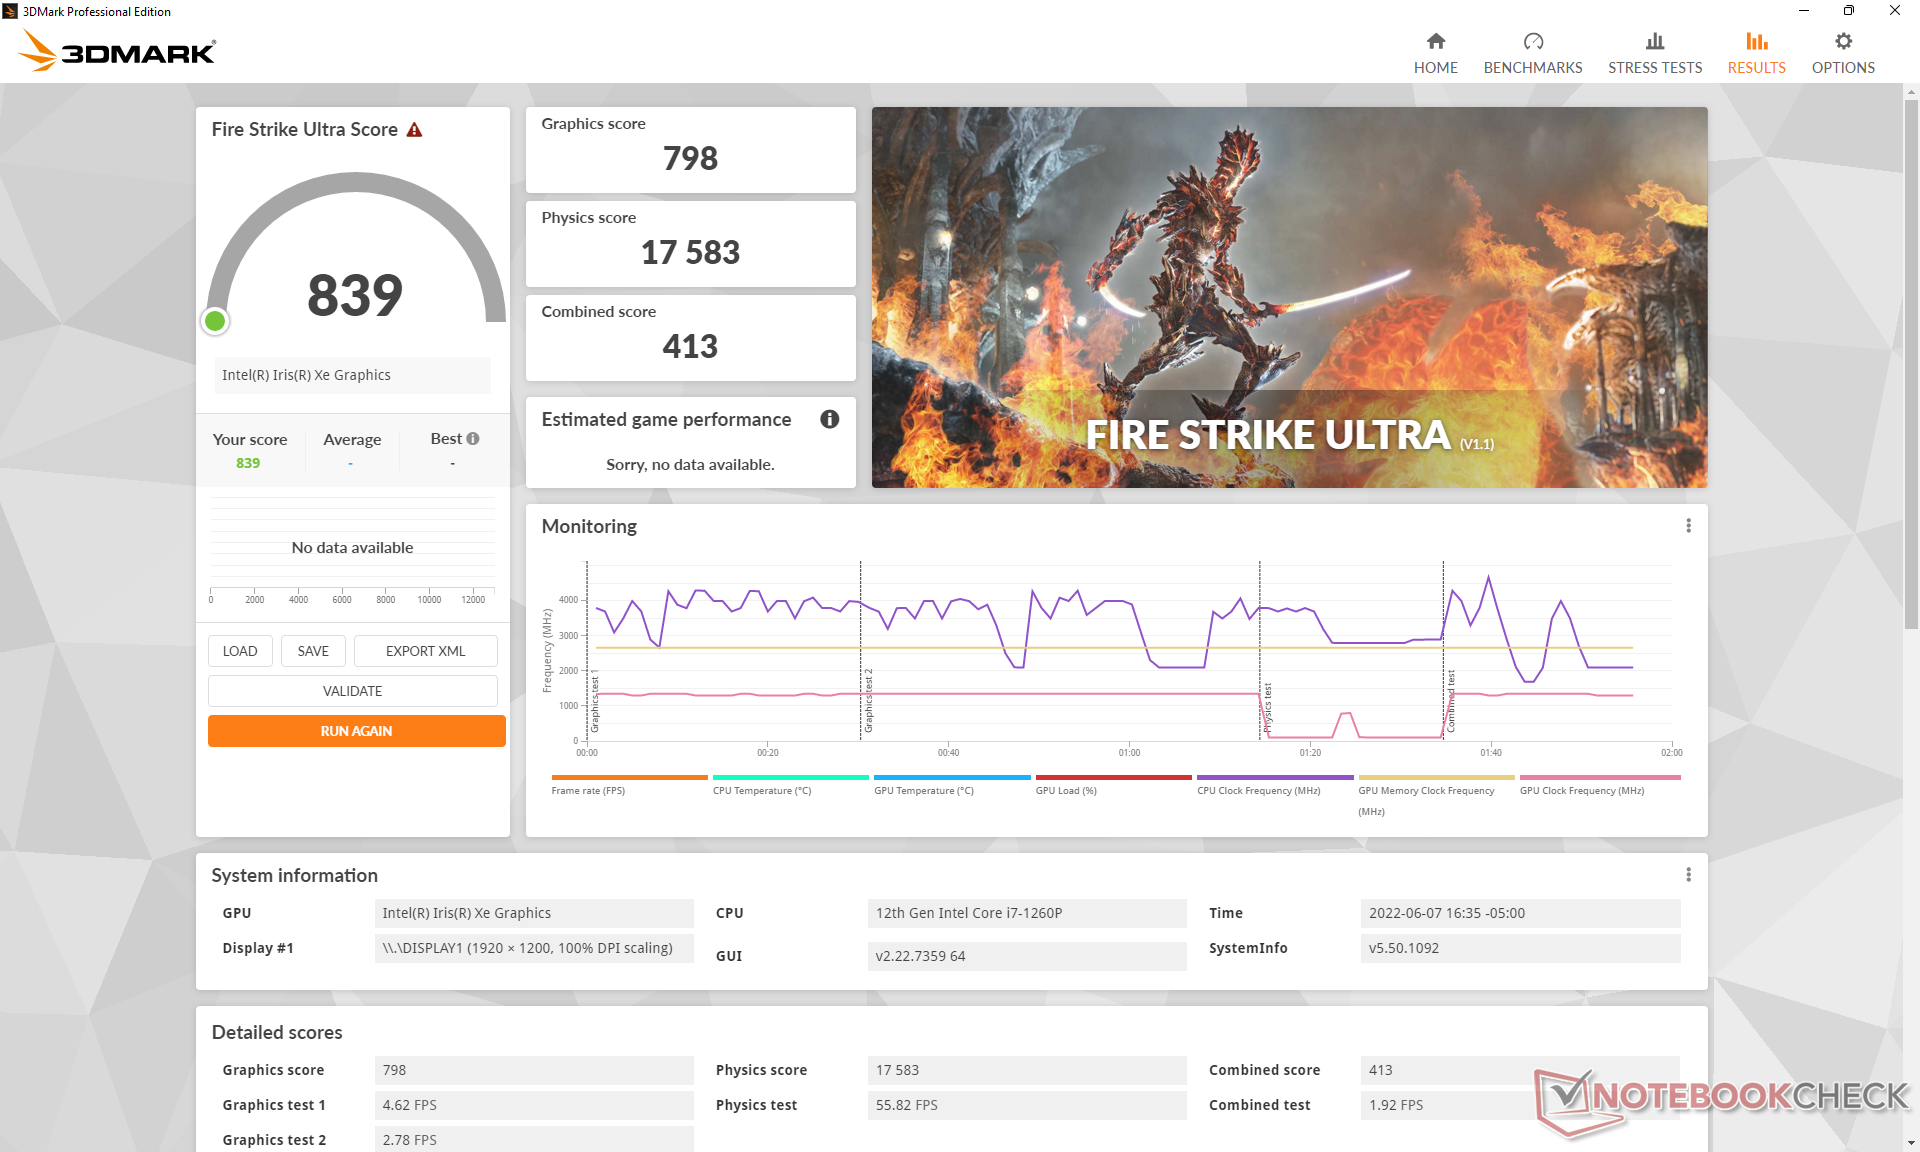
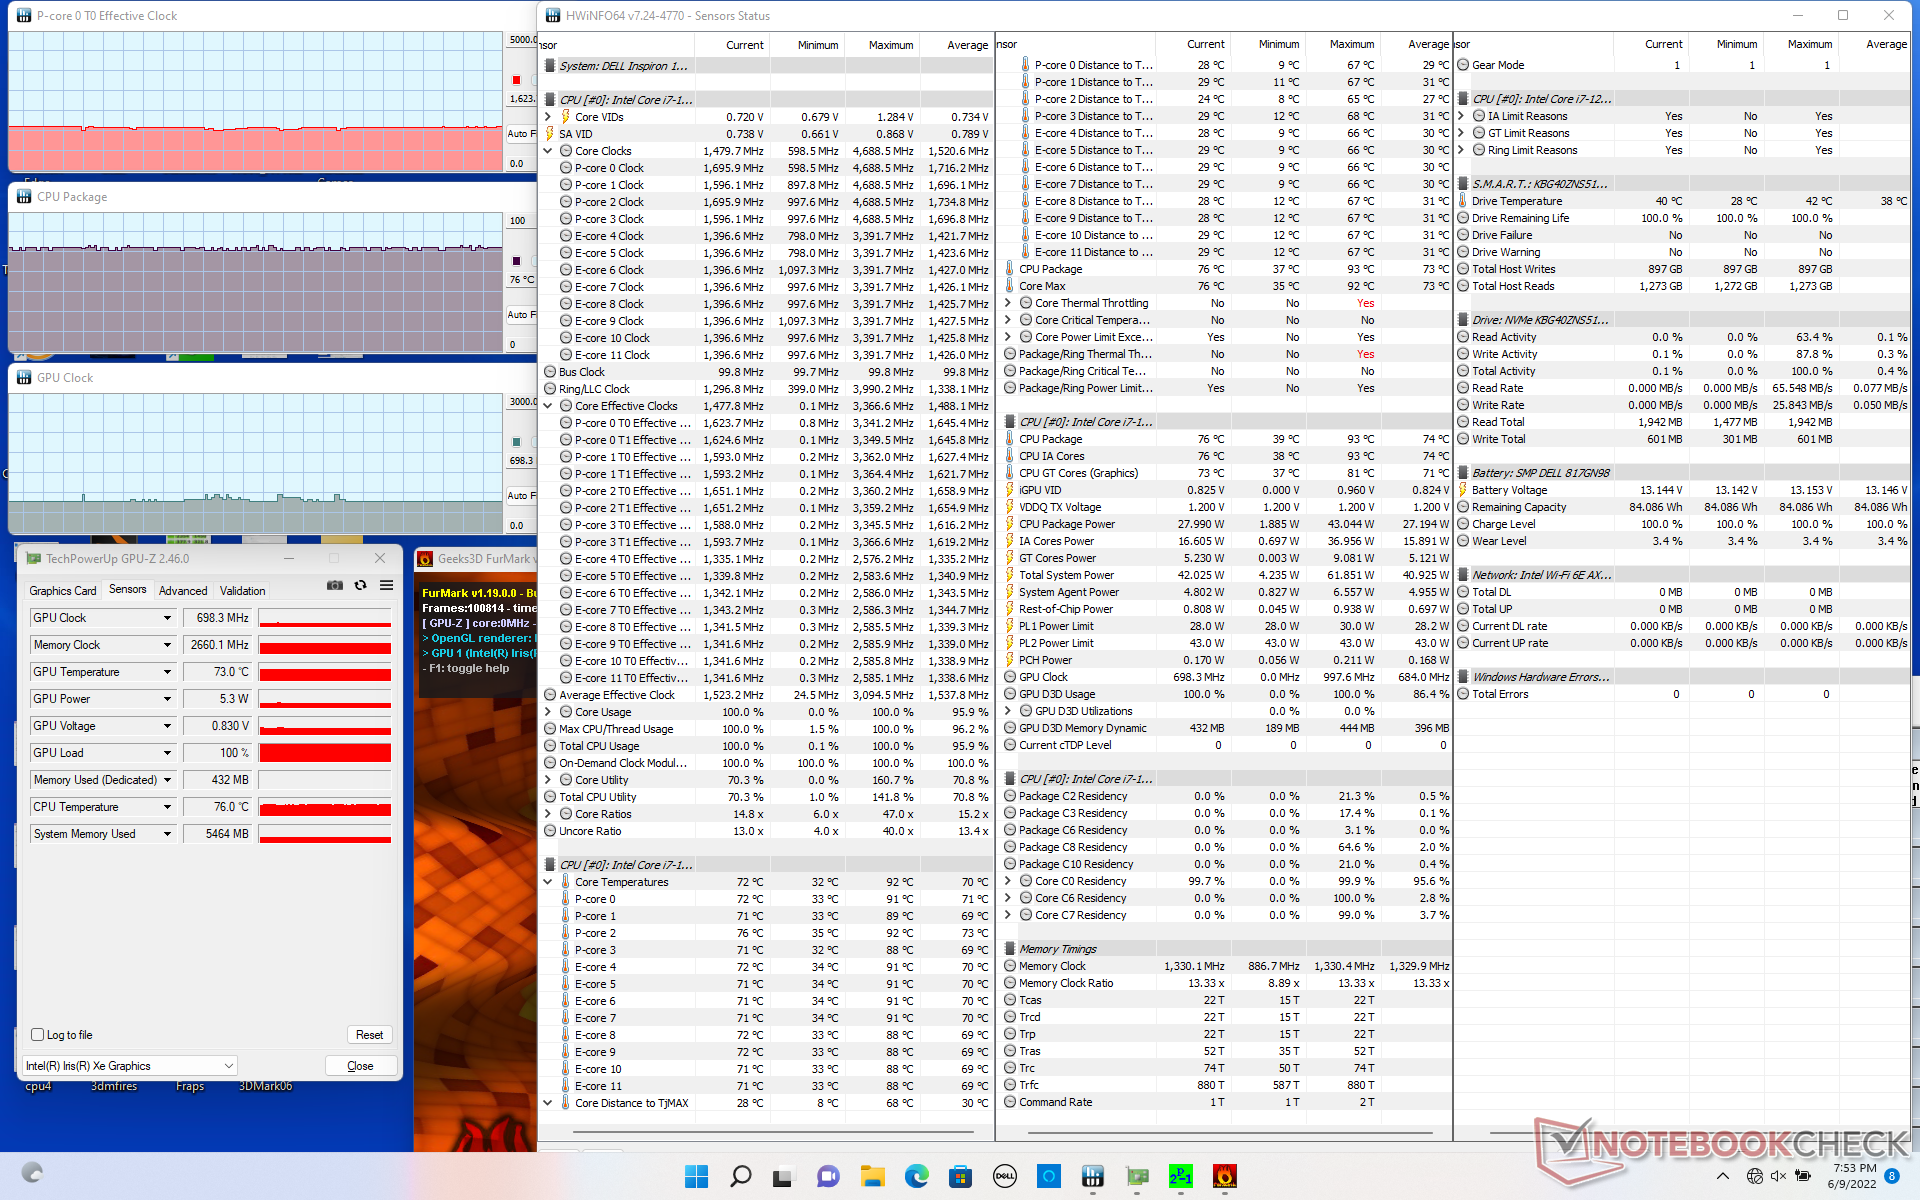
GPU性能--表现略差
图形性能比预期的要慢,比平均水平低5%到15%。 平均Iris Xe 96 EUs在我们的数据库中。的联想Yoga 9 14IAP7配备的CPU和GPU与我们的Inspiron完全相同,能够以30%或40%的速度运行游戏。总体性能仍然优于任何AMD移动Zen 3或更低的集成Radeon解决方案,足以在低1080p设置下运行大多数要求不高的游戏,如DOTA 2 Reborn。
| 3DMark 11 - 1280x720 Performance GPU | |
| Asus ZenBook 14X OLED UX5400EA-L7154W | |
| LG Gram 16 2-in-1 16T90P | |
| Average Intel Iris Xe Graphics G7 96EUs (2867 - 7676, n=209) | |
| Huawei MateBook 16 R7 5800H | |
| Dell Inspiron 16 7620 2-in-1 | |
| HP Pavilion Aero 13 be0097nr | |
| Asus VivoBook 15 OLED M513UA-L1282W | |
| Honor MagicBook 16 2022 | |
| Samsung Galaxy Book Flex 15-NP950 | |
| Dell Inspiron 16 Plus 7610-MHJ8F | |
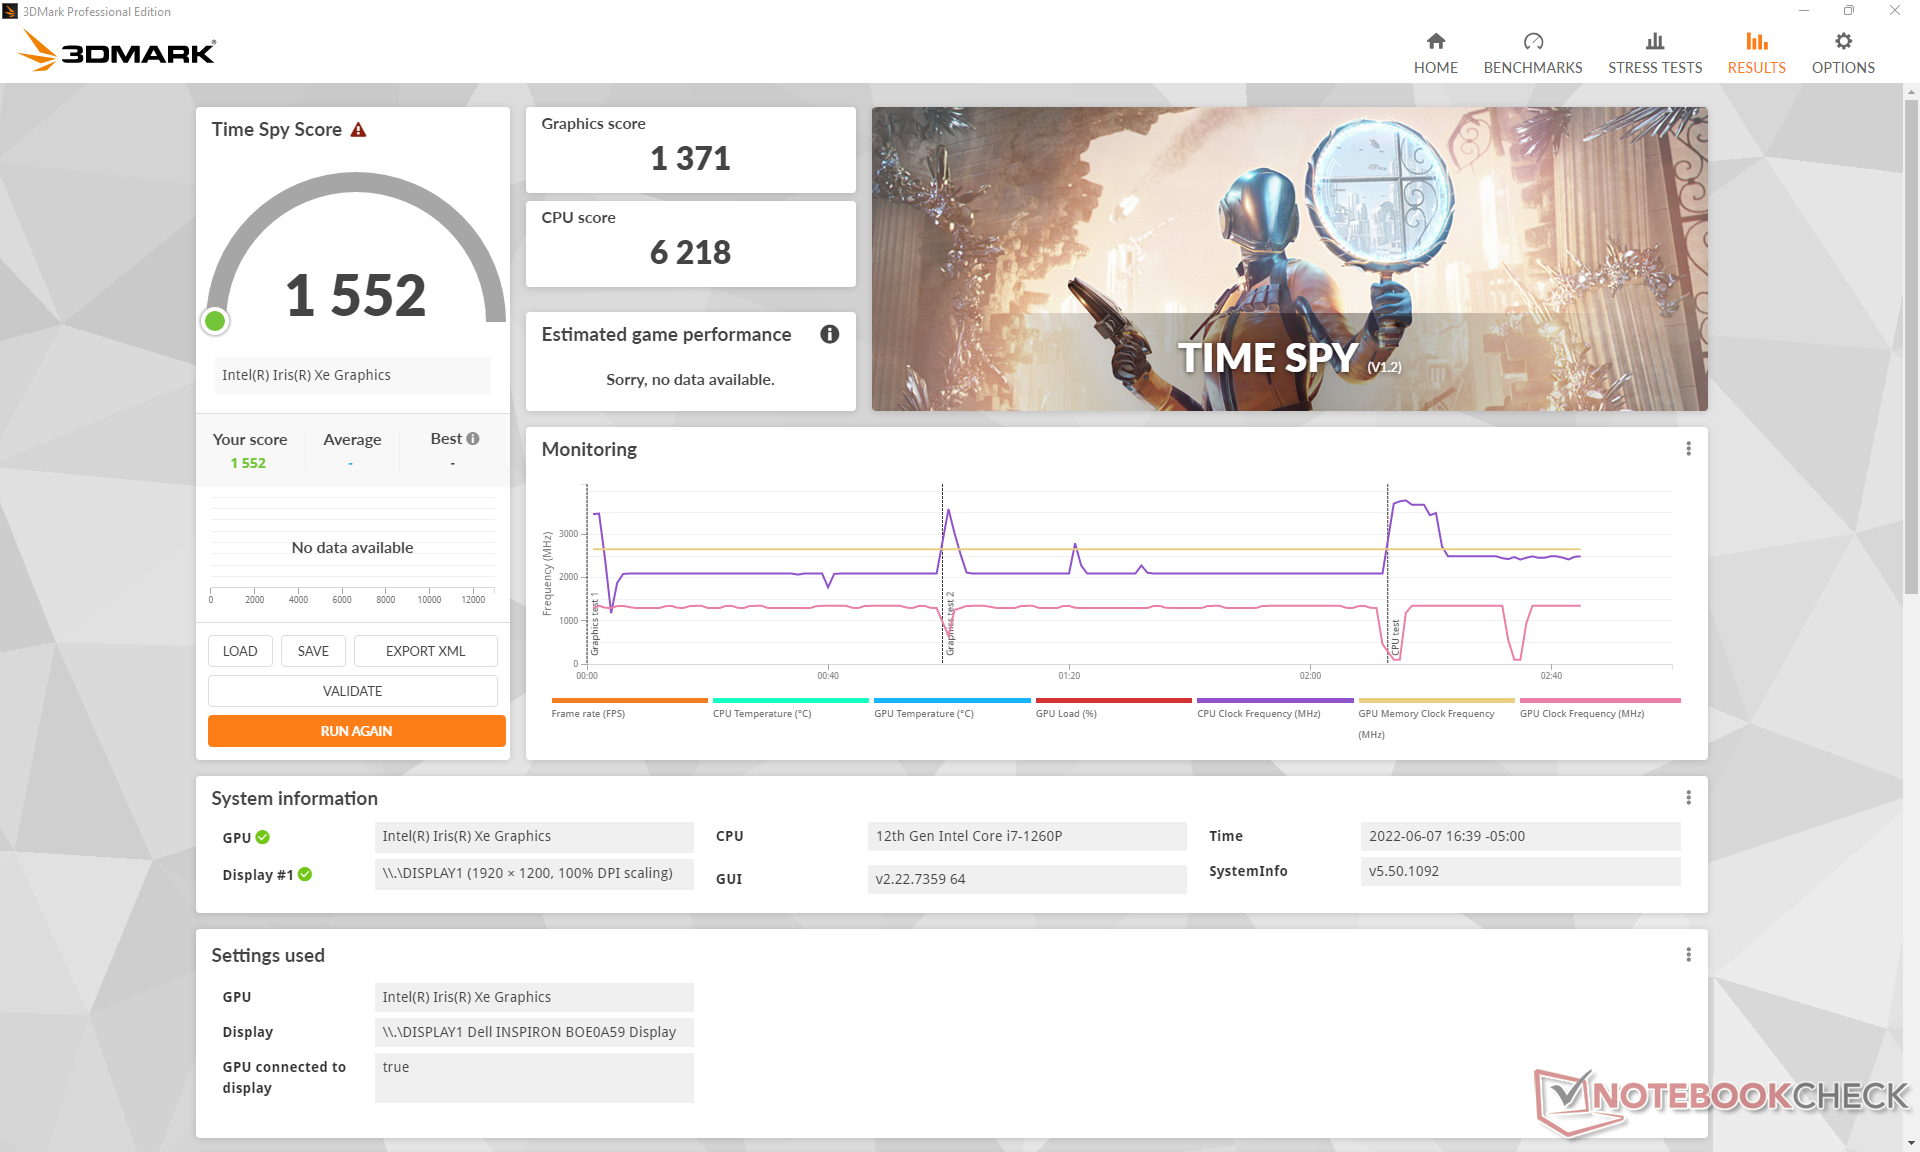
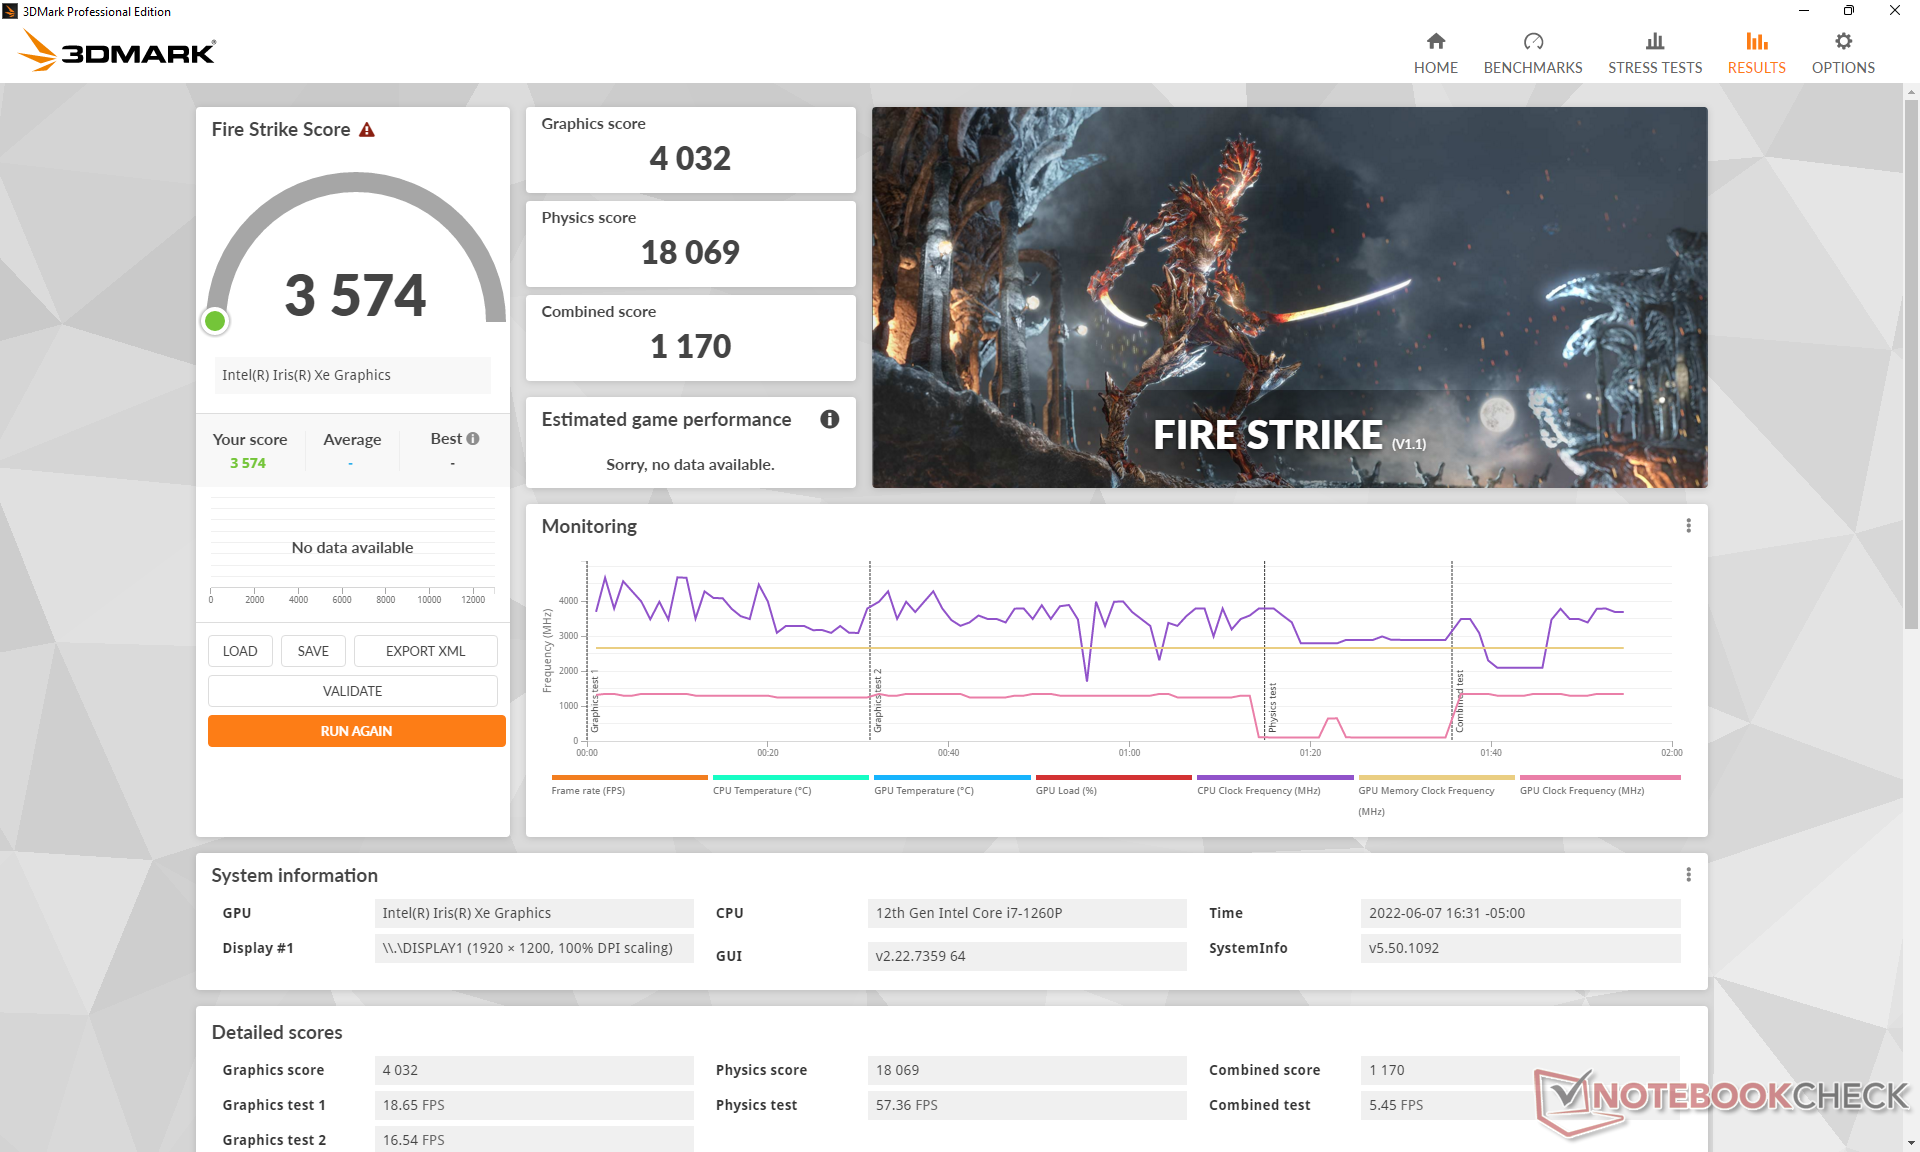
| 3DMark 11 Performance | 6300 points | |
| 3DMark Cloud Gate Standard Score | 19206 points | |
| 3DMark Fire Strike Score | 3574 points | |
| 3DMark Time Spy Score | 1552 points | |
Help | ||
Witcher 3 FPS Chart
| low | med. | high | ultra | |
|---|---|---|---|---|
| GTA V (2015) | 92.1 | 75.9 | 13.8 | 5.98 |
| The Witcher 3 (2015) | 79.2 | 47.7 | 24.2 | 11.8 |
| Dota 2 Reborn (2015) | 105.7 | 77.4 | 50.8 | 46.5 |
| Final Fantasy XV Benchmark (2018) | 34 | 18.1 | 13.3 | |
| X-Plane 11.11 (2018) | 48.7 | 39.6 | 35.3 | |
| Strange Brigade (2018) | 76.5 | 31.7 | 26.7 | 21.4 |
| Cyberpunk 2077 1.6 (2022) | 18.4 | 14.9 | 11 | 9 |
排放 - 大型系统,安静的风扇
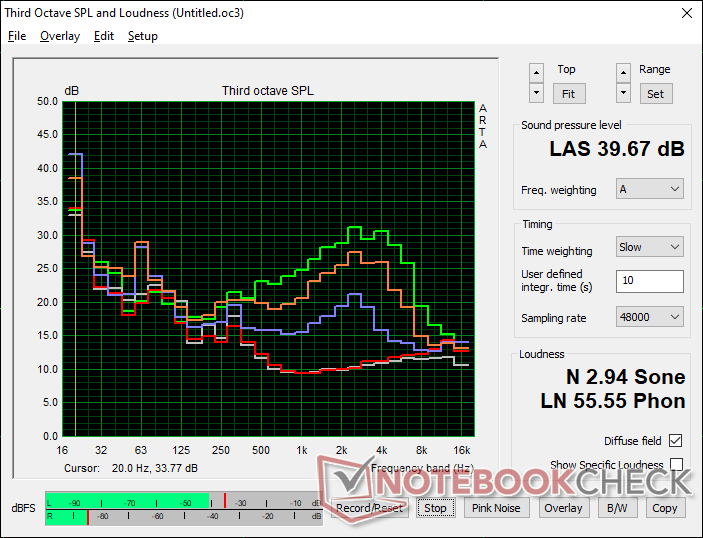
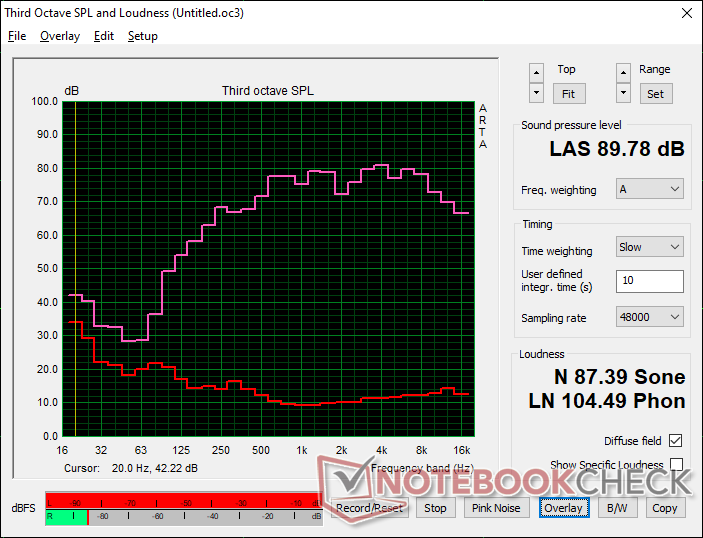
系统噪音
风扇噪音通常非常安静,其结果比其他可转换笔记本电脑略微安静一些。例如,运行3DMark 06的第一个基准场景时,只产生了29 dB(A)的风扇噪音,而LG Gram 16 2-in-1或Burton的风扇噪音为32-33 dB(A)。 Galaxy 图书360 15在类似的条件下。在最坏的情况下,当运行游戏或更高要求的负载时,我们能够记录到高达40分贝(A)的风扇噪音。
请记住,如果配置独立的GeForce MX550图形,冷却解决方案不会改变。因此,预计在运行典型的负载时,风扇会更频繁地跳动或更快地提高速度,否则在我们仅有iGPU的评测单元上可能几乎是无声的。
Noise level
| Idle |
| 23.5 / 23.5 / 23.5 dB(A) |
| Load |
| 29.4 / 39.7 dB(A) |
 | ||
30 dB silent 40 dB(A) audible 50 dB(A) loud |
||
min: | ||
| Dell Inspiron 16 7620 2-in-1 Iris Xe G7 96EUs, i7-1260P, Toshiba KBG40ZNS512G NVMe | LG Gram 16 2-in-1 16T90P Iris Xe G7 96EUs, i7-1165G7, SK Hynix PC401 512GB M.2 (HFS512GD9TNG) | Samsung Galaxy Book Pro 360 15 NP950QDB-KC3DE Iris Xe G7 80EUs, i5-1135G7, Samsung PM991 MZVLQ256HAJD | Asus ZenBook Flip 15 UX563FD-A1027T GeForce GTX 1050 Max-Q, i7-10510U, Samsung SSD PM981 MZVLB1T0HALR | Dell Inspiron 15 5579-9672 UHD Graphics 620, i5-8250U, SK hynix SC311 SATA | HP Spectre X360 15-5ZV31AV GeForce MX250, i7-10510U, Intel SSD 660p 2TB SSDPEKNW020T8 | |
|---|---|---|---|---|---|---|
| Noise | -4% | -7% | -19% | -18% | -19% | |
| off / environment * (dB) | 23.2 | 25.1 -8% | 25 -8% | 30.3 -31% | 30.4 -31% | 30.1 -30% |
| Idle Minimum * (dB) | 23.5 | 25.2 -7% | 25 -6% | 30.3 -29% | 30.4 -29% | 30.1 -28% |
| Idle Average * (dB) | 23.5 | 25.2 -7% | 25 -6% | 30.3 -29% | 30.4 -29% | 30.1 -28% |
| Idle Maximum * (dB) | 23.5 | 25.2 -7% | 25 -6% | 30.3 -29% | 31.2 -33% | 30.1 -28% |
| Load Average * (dB) | 29.4 | 32.1 -9% | 32.7 -11% | 33.7 -15% | 31.5 -7% | 30.1 -2% |
| Witcher 3 ultra * (dB) | 35.6 | 34.9 2% | 37.4 -5% | 39.7 -12% | ||
| Load Maximum * (dB) | 39.7 | 37.8 5% | 42 -6% | 38.9 2% | 31.5 21% | 42 -6% |
* ... smaller is better
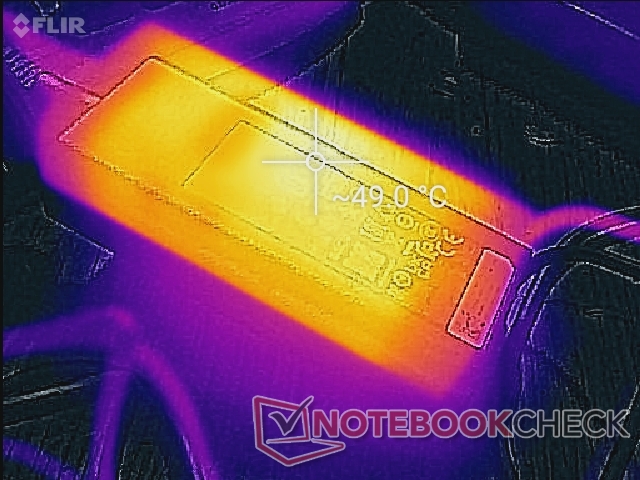
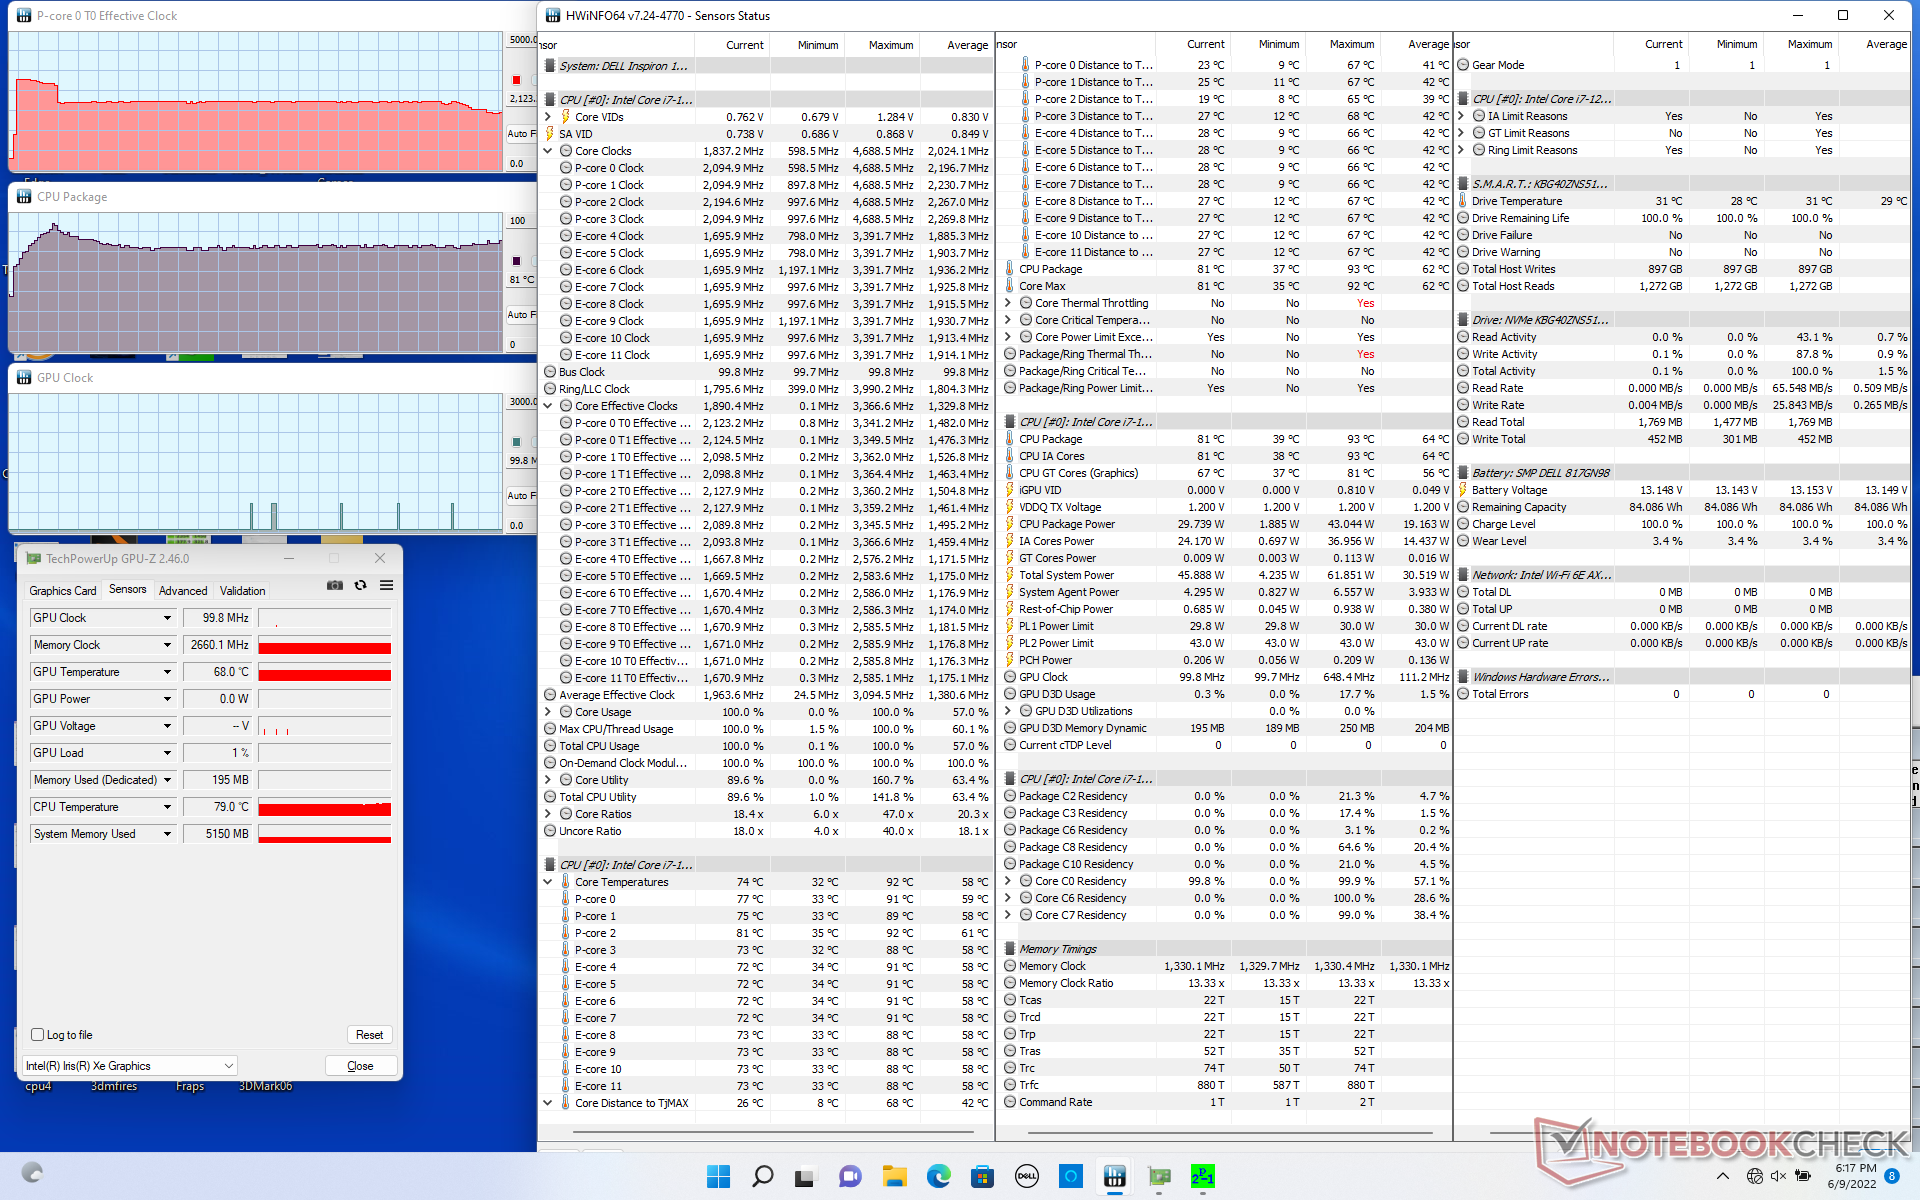
温度
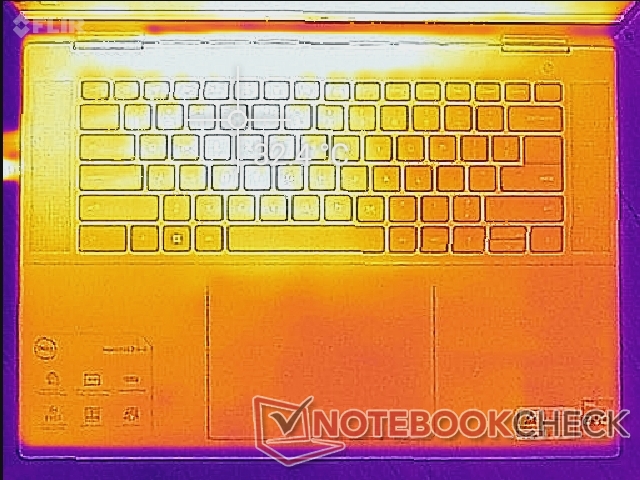
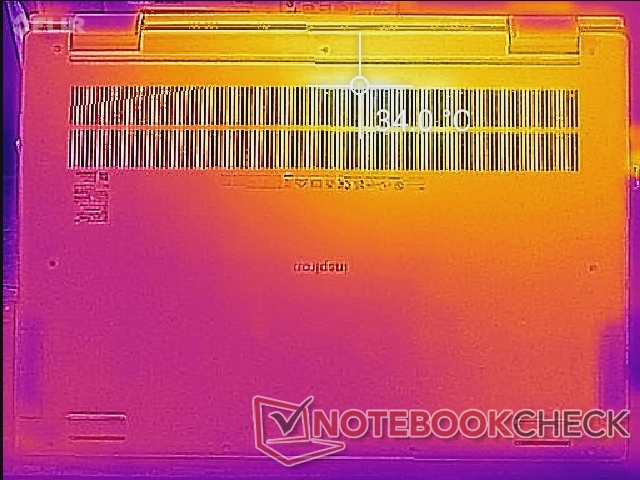
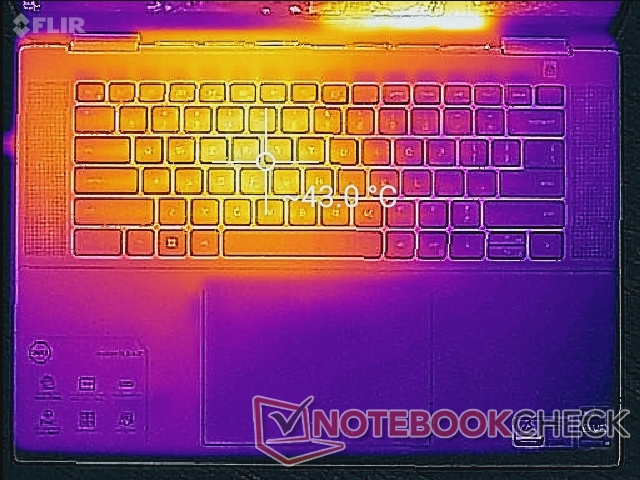
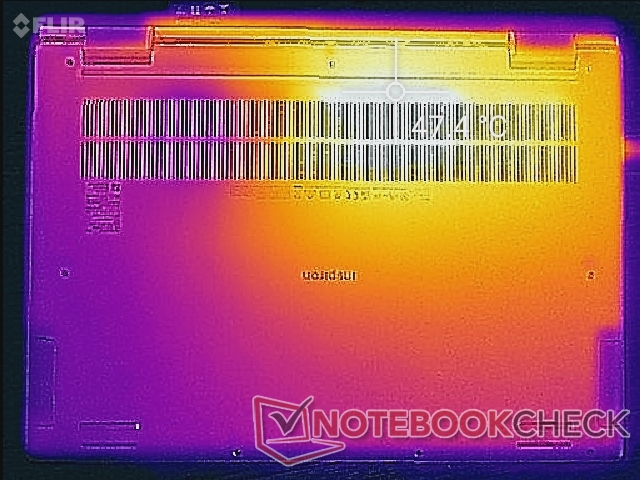
表面温度梯度与LG Gram 16二合一相似,因为Inspiron的主板、电池和冷却方案在内部的位置都差不多。键盘中心和底部表面的热点可以分别达到43摄氏度和48摄氏度,而LG Gram则是42摄氏度或46摄氏度。40摄氏度的高温度范围在包括惠普Spectre x360 15在内的许多可转换型号中很常见。
有趣的是,空转时的表面温度比预期的要高,为33摄氏度,而LG Gram或惠普Spectre的温度范围较低,为20摄氏度至25摄氏度。我们在去年的Inspiron 16 7610上记录了较高的空转表面温度。 Inspiron 16 7610也是如此。
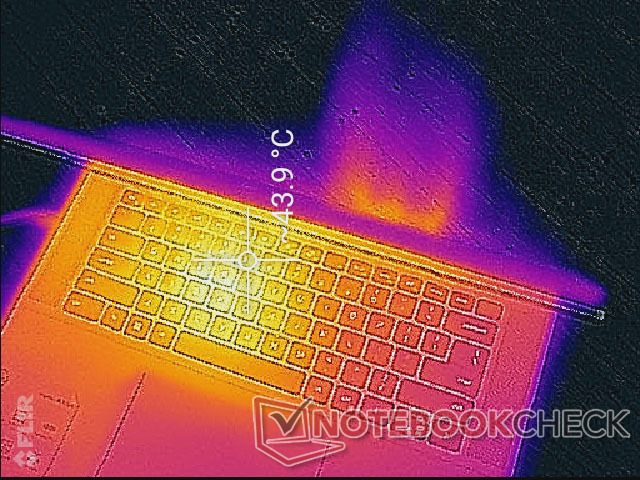
(±) The maximum temperature on the upper side is 42.2 °C / 108 F, compared to the average of 35.4 °C / 96 F, ranging from 19.6 to 60 °C for the class Convertible.
(-) The bottom heats up to a maximum of 47.4 °C / 117 F, compared to the average of 36.9 °C / 98 F
(+) In idle usage, the average temperature for the upper side is 30.3 °C / 87 F, compared to the device average of 30.3 °C / 87 F.
(+) The palmrests and touchpad are cooler than skin temperature with a maximum of 29.8 °C / 85.6 F and are therefore cool to the touch.
(±) The average temperature of the palmrest area of similar devices was 28 °C / 82.4 F (-1.8 °C / -3.2 F).
| Dell Inspiron 16 7620 2-in-1 Intel Core i7-1260P, Intel Iris Xe Graphics G7 96EUs | LG Gram 16 2-in-1 16T90P Intel Core i7-1165G7, Intel Iris Xe Graphics G7 96EUs | Samsung Galaxy Book Pro 360 15 NP950QDB-KC3DE Intel Core i5-1135G7, Intel Iris Xe Graphics G7 80EUs | Asus ZenBook Flip 15 UX563FD-A1027T Intel Core i7-10510U, NVIDIA GeForce GTX 1050 Max-Q | Dell Inspiron 15 5579-9672 Intel Core i5-8250U, Intel UHD Graphics 620 | HP Spectre X360 15-5ZV31AV Intel Core i7-10510U, NVIDIA GeForce MX250 | |
|---|---|---|---|---|---|---|
| Heat | 10% | 14% | 13% | 14% | 12% | |
| Maximum Upper Side * (°C) | 42.2 | 42.2 -0% | 42.6 -1% | 42.6 -1% | 41.6 1% | 47 -11% |
| Maximum Bottom * (°C) | 47.4 | 46.2 3% | 40.8 14% | 41.5 12% | 41.9 12% | 47.4 -0% |
| Idle Upper Side * (°C) | 32.2 | 26 19% | 25.9 20% | 26.4 18% | 26.1 19% | 22.8 29% |
| Idle Bottom * (°C) | 33.6 | 27.6 18% | 26.1 22% | 26.3 22% | 25.7 24% | 23.6 30% |
* ... smaller is better
压力测试
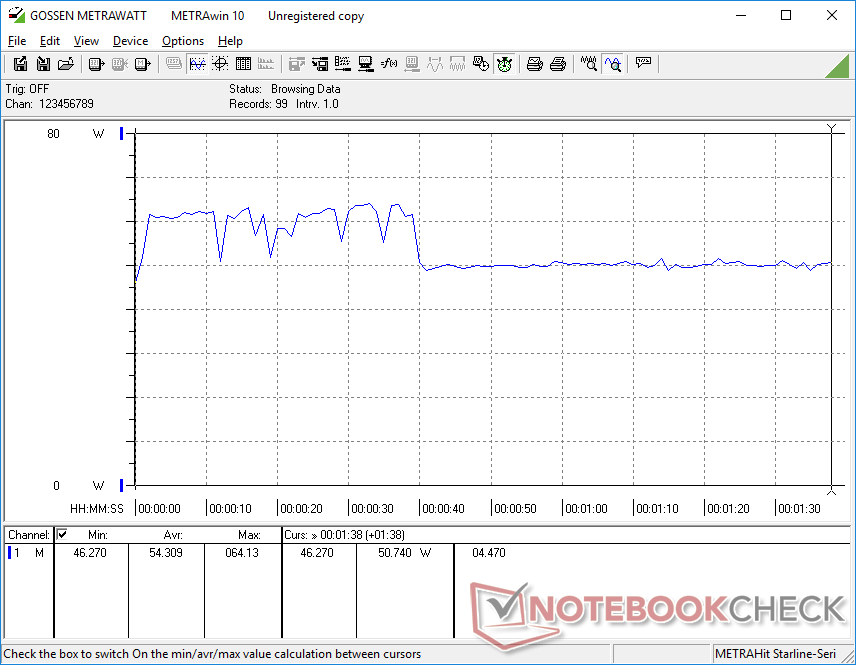
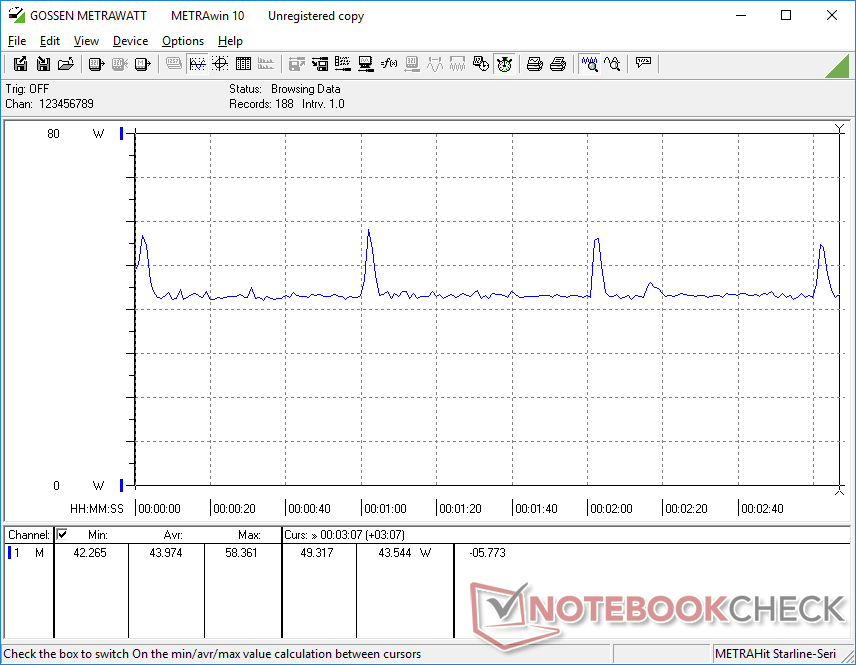
当运行Prime95对CPU施加压力时,在达到92摄氏度的核心温度之前的前10秒左右,时钟频率会提升到3.3GHz。随后,时钟频率会降到2.1GHz,核心温度为81摄氏度,更加合理。在测试开始时,CPU封装功率会高达43W,然后由于冷却解决方案的热限制而稳定在30W。在联想Yoga 9上运行同样的测试 联想Yoga 9在联想Yoga 9上进行同样的测试,使用同样的酷睿i7-1260P CPU,会产生类似的稳定时钟频率,尽管核心温度较低,为66℃。
GPU时钟速率和温度将分别稳定在1296兆赫和82摄氏度,而LG Gram 16二合一电脑采用较早的酷睿i7-1165G7,则为1200兆赫和73摄氏度。与上述的联想相比,Inspiron的内存时钟速率较慢,这是因为它的内存较慢(DDR4对LPDDR5),这可能是造成我们Inspiron的Iris Xe性能相对较慢的原因。
用电池供电运行限制了性能。在电池上进行的Fire Strike 测试,物理和图形分数分别为11924和3147分,而在主电源上则为18069和4032分。
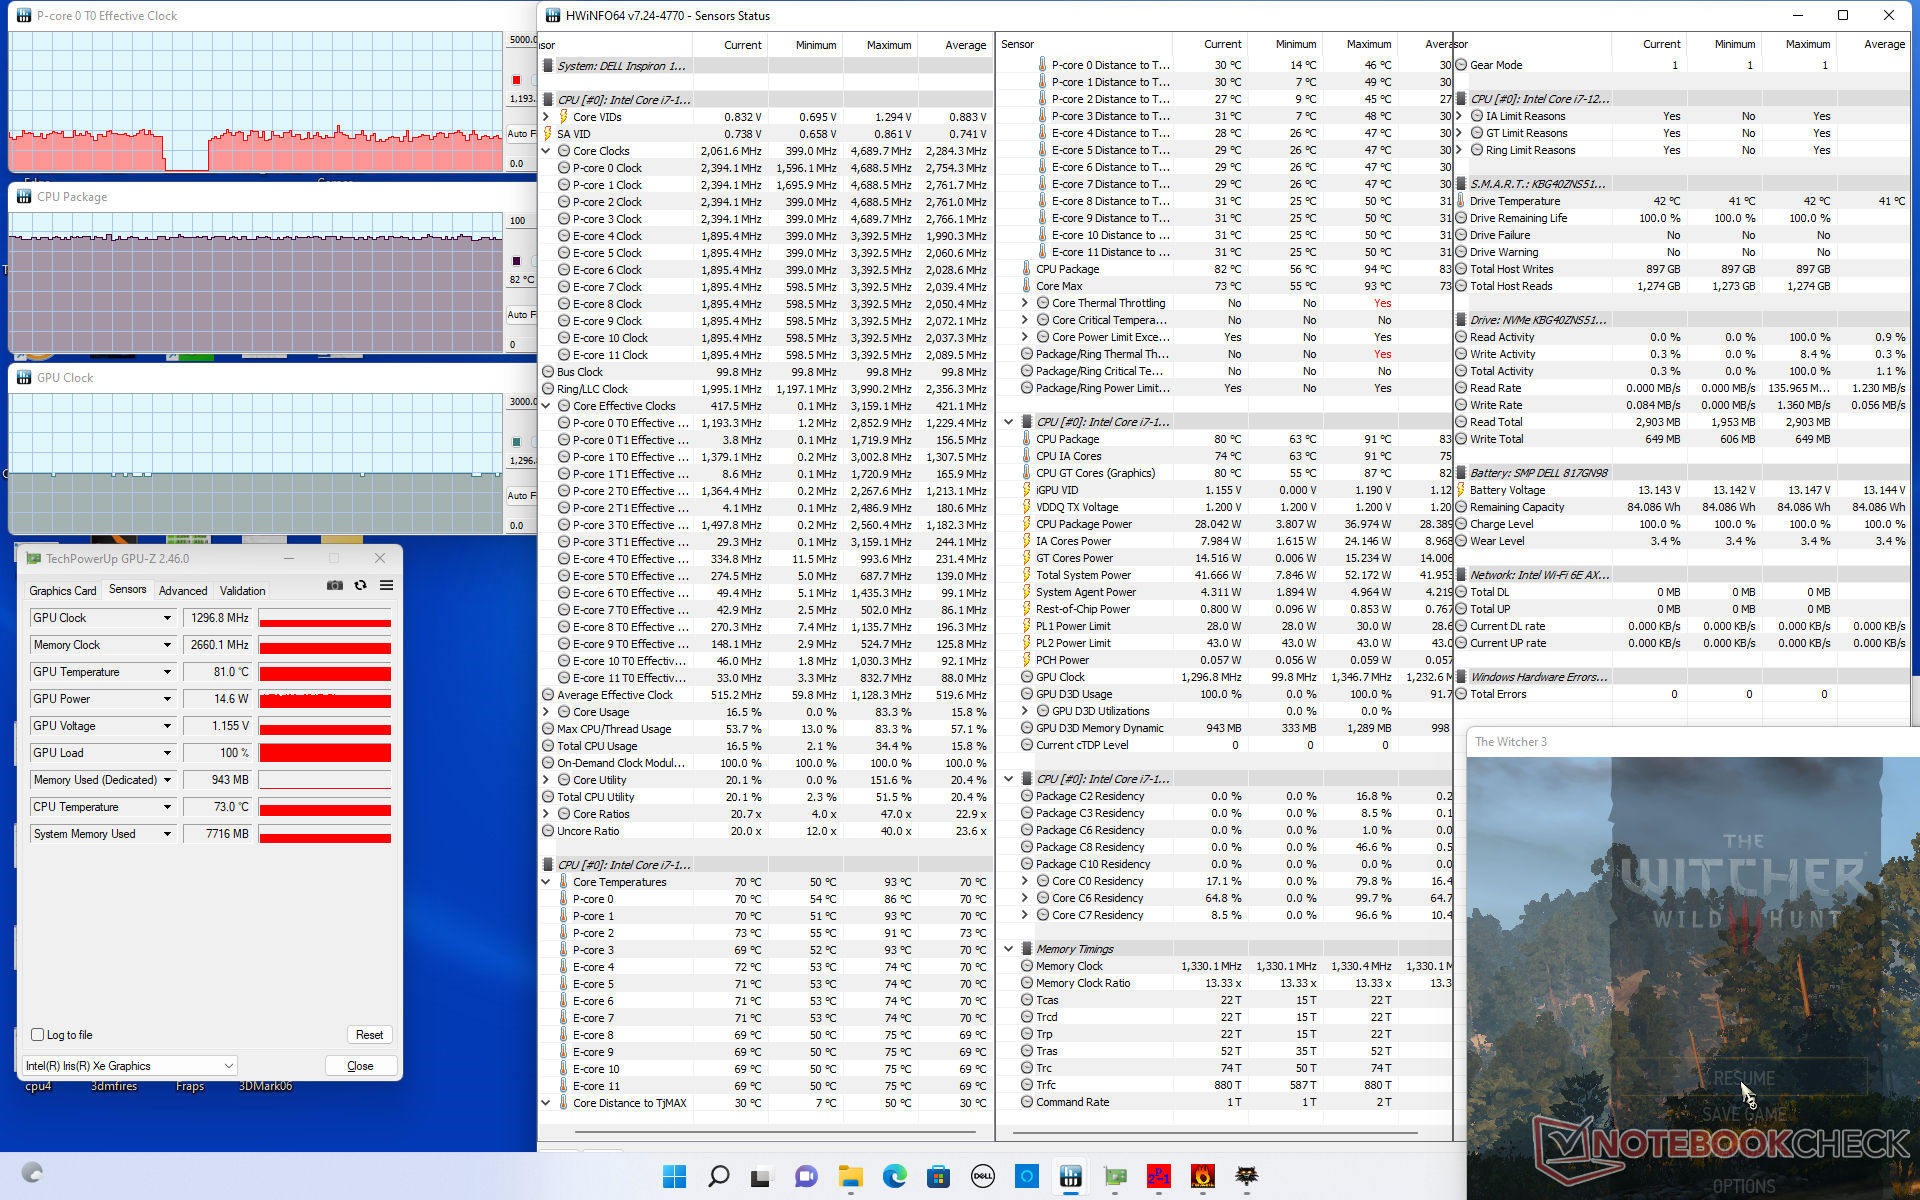
| CPU时钟(GHz) | GPU时钟(MHz) | CPU平均温度(°C) | |
| 系统空闲 | -- | -- | 37 |
| Prime95压力 | 2.1 | -- | 81 |
| Prime95 + FurMark压力 | 1.6 | 698 | 76 |
| Witcher 3 应力 | ~1.2 | 1296 | 82 |
发言人
Dell Inspiron 16 7620 2-in-1 audio analysis
(+) | speakers can play relatively loud (89.8 dB)
Bass 100 - 315 Hz
(-) | nearly no bass - on average 15.3% lower than median
(±) | linearity of bass is average (8.8% delta to prev. frequency)
Mids 400 - 2000 Hz
(+) | balanced mids - only 3.3% away from median
(+) | mids are linear (4.8% delta to prev. frequency)
Highs 2 - 16 kHz
(+) | balanced highs - only 3.2% away from median
(+) | highs are linear (5% delta to prev. frequency)
Overall 100 - 16.000 Hz
(+) | overall sound is linear (11.5% difference to median)
Compared to same class
» 9% of all tested devices in this class were better, 3% similar, 88% worse
» The best had a delta of 6%, average was 20%, worst was 57%
Compared to all devices tested
» 8% of all tested devices were better, 2% similar, 90% worse
» The best had a delta of 4%, average was 23%, worst was 134%
Apple MacBook Pro 16 2021 M1 Pro audio analysis
(+) | speakers can play relatively loud (84.7 dB)
Bass 100 - 315 Hz
(+) | good bass - only 3.8% away from median
(+) | bass is linear (5.2% delta to prev. frequency)
Mids 400 - 2000 Hz
(+) | balanced mids - only 1.3% away from median
(+) | mids are linear (2.1% delta to prev. frequency)
Highs 2 - 16 kHz
(+) | balanced highs - only 1.9% away from median
(+) | highs are linear (2.7% delta to prev. frequency)
Overall 100 - 16.000 Hz
(+) | overall sound is linear (4.6% difference to median)
Compared to same class
» 0% of all tested devices in this class were better, 0% similar, 100% worse
» The best had a delta of 5%, average was 17%, worst was 45%
Compared to all devices tested
» 0% of all tested devices were better, 0% similar, 100% worse
» The best had a delta of 4%, average was 23%, worst was 134%
能源管理
功耗--每瓦非常高的性能
在桌面上空转需要5瓦到10瓦,取决于电源配置文件和亮度设置。在类似条件下,运行更高的负载(如游戏)需要44瓦至54瓦,这明显高于采用第11代技术的LG Gram 16二合一产品,高出10%至20%。由于Inspiron 16 7620二合一电脑使用的是酷睿P系列CPU,而不是更常见的U系列,因此功耗较高是意料之中的事。我们发现功耗的增加是值得的,因为与LG的酷睿i7-1165G7相比,CPU的原始性能提高了很多,高达80%。
在运行Prime95压力时,我们能够从小型(约11.1 x 5.1 x 2.7厘米)的65瓦USB-C交流适配器测量到70瓦的临时最大功耗。这也是Inspiron 14 7420二合一产品所配备的相同适配器。
| Off / Standby | |
| Idle | |
| Load |
|
Key:
min: | |
| Dell Inspiron 16 7620 2-in-1 i7-1260P, Iris Xe G7 96EUs, Toshiba KBG40ZNS512G NVMe, IPS, 1920x1200, 16" | LG Gram 16 2-in-1 16T90P i7-1165G7, Iris Xe G7 96EUs, SK Hynix PC401 512GB M.2 (HFS512GD9TNG), IPS, 2560x1600, 16" | Samsung Galaxy Book Pro 360 15 NP950QDB-KC3DE i5-1135G7, Iris Xe G7 80EUs, Samsung PM991 MZVLQ256HAJD, OLED, 1920x1080, 15.6" | Asus ZenBook Flip 15 UX563FD-A1027T i7-10510U, GeForce GTX 1050 Max-Q, Samsung SSD PM981 MZVLB1T0HALR, IPS, 3840x2160, 15.6" | Dell Inspiron 15 5579-9672 i5-8250U, UHD Graphics 620, SK hynix SC311 SATA, IPS, 1920x1080, 15.6" | HP Spectre X360 15-5ZV31AV i7-10510U, GeForce MX250, Intel SSD 660p 2TB SSDPEKNW020T8, IPS, 3840x2160, 15.6" | |
|---|---|---|---|---|---|---|
| Power Consumption | 6% | 20% | -25% | 29% | -12% | |
| Idle Minimum * (Watt) | 5.3 | 4.4 17% | 4 25% | 2.3 57% | 3.9 26% | 5.2 2% |
| Idle Average * (Watt) | 8.3 | 9 -8% | 5.6 33% | 10.3 -24% | 6.6 20% | 8.5 -2% |
| Idle Maximum * (Watt) | 9.6 | 10.1 -5% | 10.1 -5% | 11 -15% | 9.3 3% | 8.7 9% |
| Load Average * (Watt) | 54.3 | 45.5 16% | 34.7 36% | 77 -42% | 30.2 44% | 65.6 -21% |
| Witcher 3 ultra * (Watt) | 43.9 | 39.6 10% | 34.7 21% | 68 -55% | 56.5 -29% | |
| Load Maximum * (Watt) | 70 | 67 4% | 63 10% | 118 -69% | 33.2 53% | 92.4 -32% |
* ... smaller is better
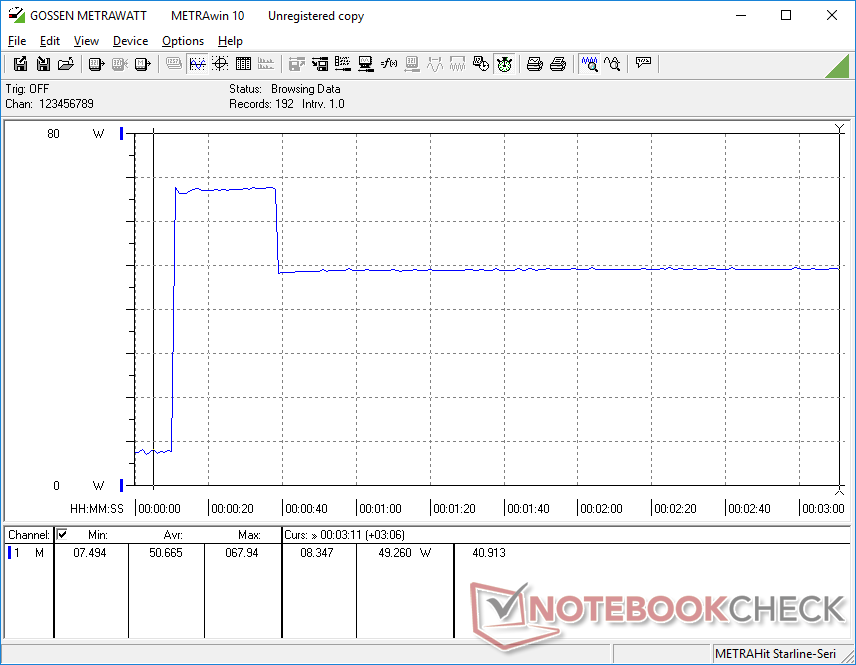
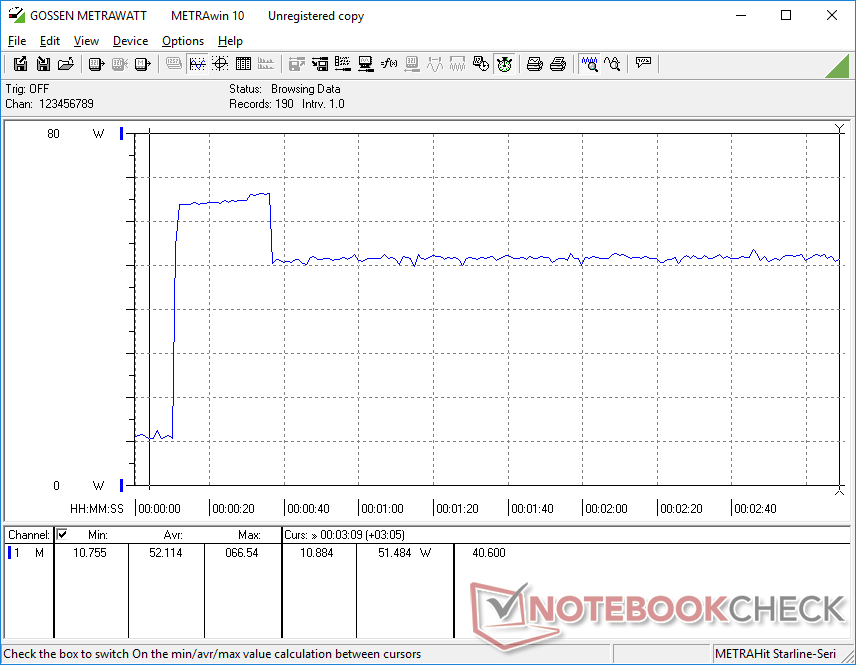
Power Consumption Witcher 3 / Stresstest
Power Consumption external Monitor
电池寿命
在平衡电源配置下,实际使用WLAN的时间非常长,超过14小时。像惠普Spectre X360 15或Galaxy Book Pro 360 15这样的15.6英寸可转换电脑在类似条件下持续时间较短。然而,请记住,有些SKU的电池容量较小,为64Wh,而我们的测试设备的电池容量为87Wh。较小的电池选项以容量换取更轻,因此更适合旅行的系统。
从空电到满电需要2小时15分钟,或比较小的Inspiron 14 7420二合一产品多出约半小时。
| Dell Inspiron 16 7620 2-in-1 i7-1260P, Iris Xe G7 96EUs, 87 Wh | LG Gram 16 2-in-1 16T90P i7-1165G7, Iris Xe G7 96EUs, 80 Wh | Samsung Galaxy Book Pro 360 15 NP950QDB-KC3DE i5-1135G7, Iris Xe G7 80EUs, 67 Wh | Asus ZenBook Flip 15 UX563FD-A1027T i7-10510U, GeForce GTX 1050 Max-Q, 71 Wh | Dell Inspiron 15 5579-9672 i5-8250U, UHD Graphics 620, 42 Wh | HP Spectre X360 15-5ZV31AV i7-10510U, GeForce MX250, 84 Wh | |
|---|---|---|---|---|---|---|
| Battery runtime | 21% | 2% | -14% | -43% | -1% | |
| Reader / Idle (h) | 17 | 29.6 74% | 27.6 62% | 19.5 15% | 11.2 -34% | 22.6 33% |
| WiFi v1.3 (h) | 14.6 | 15.7 8% | 11.3 -23% | 9.4 -36% | 7.3 -50% | 10.8 -26% |
| Load (h) | 3.2 | 2.6 -19% | 2.1 -34% | 2.5 -22% | 1.8 -44% | 2.9 -9% |
| H.264 (h) | 11.2 | 6.7 |
Pros
Cons
结论 - 与Inspiron 16 7610非常不同

Inspiron 16 7620二合一产品放弃了Core H系列CPU和GeForce RTX GPU的选择。 Inspiron 7610而改用酷睿U系列和酷睿P系列CPU以及GeForce MX图形。尽管性能猎手可能会感到失望,但考虑到多媒体用户和业余图形编辑的目标受众,我们认为这是一个可敬的变化。特别是显示屏根本没有受到冲击,因此,尽管CPU和GPU性能有所损失,但用户仍然可以获得完整的sRGB覆盖。
这并不是说Inspiron 16 7620 2-in-1很慢,因为它仍然是目前较快的16英寸可转换笔记本之一。其可选的GeForce MX550 GPU在可转换笔记本电脑中是不常见的,为那些需要的人提供了更高水平的图形性能。
多媒体用户会喜欢Inspiron 16 7620二合一的显示屏、强大的二合一外形、端口选项和精简的性能。然而,经常旅行的人可能想要更轻的东西。
该机型最大的缺点之一是其重量。虽然没有一个16英寸的笔记本电脑会很轻,但这里的Inspiron比LG Gram 16二合一笔记本要重得多。 LG Gram 16 2合1或三星Galaxy Book Pro 360 15.如果你不介意用一些性能和底盘硬度来换取一个更适合背包的型号,那么这些替代品可能值得考虑。
价格和可用性
戴尔Inspiron 16 7620二合一产品在大多数第三方零售商处尚未广泛销售。我们建议直接从戴尔订购https://www.dell.com/en-us/shop/dell-laptops/inspiron-16-2-in-1-laptop/spd/inspiron-16-7620-2-in-1-laptop/n27620fkvzs那里有多种配置,从配备FHD和无独立显卡的1250美元起,到配备4K OLED和专用GeForce MX550显卡的1550美元。
Dell Inspiron 16 7620 2-in-1
- 06/15/2022 v7 (old)
Allen Ngo
Price comparison

