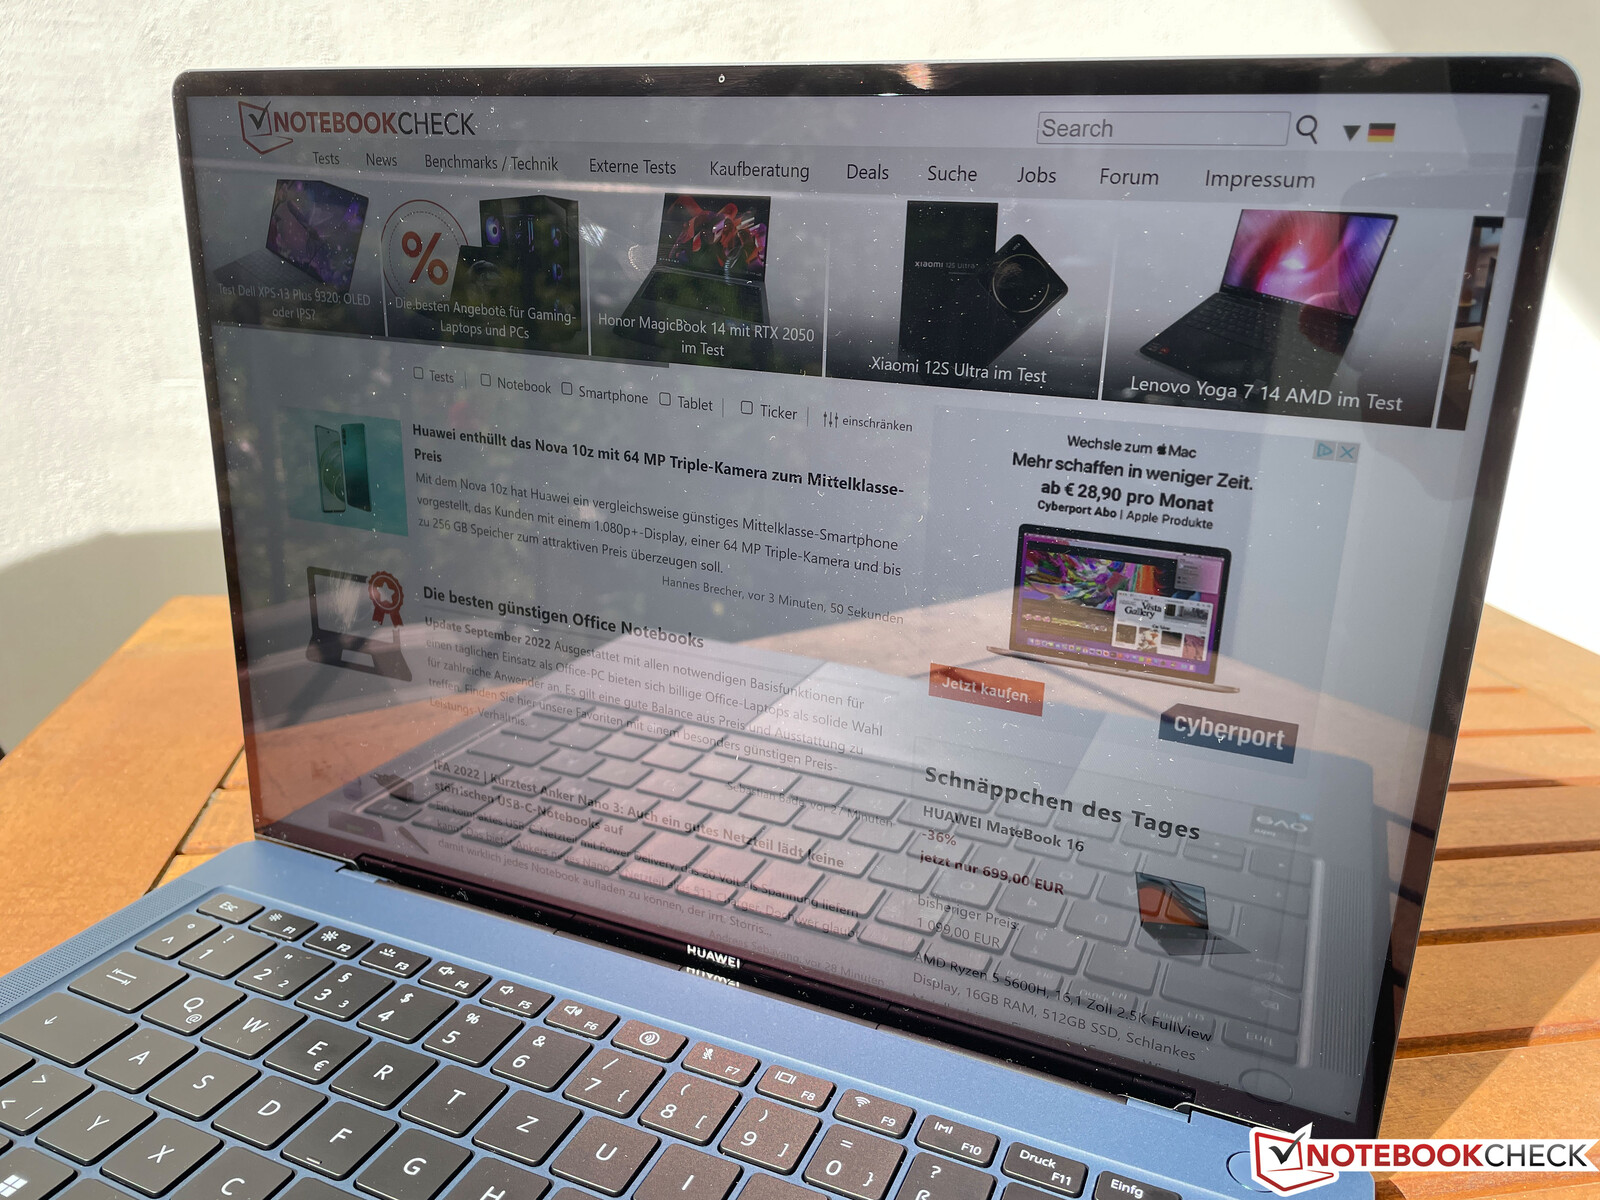
华为MateBook X Pro 2022笔记本电脑评测。MacBook Air的竞争者以顶级IPS显示屏得分
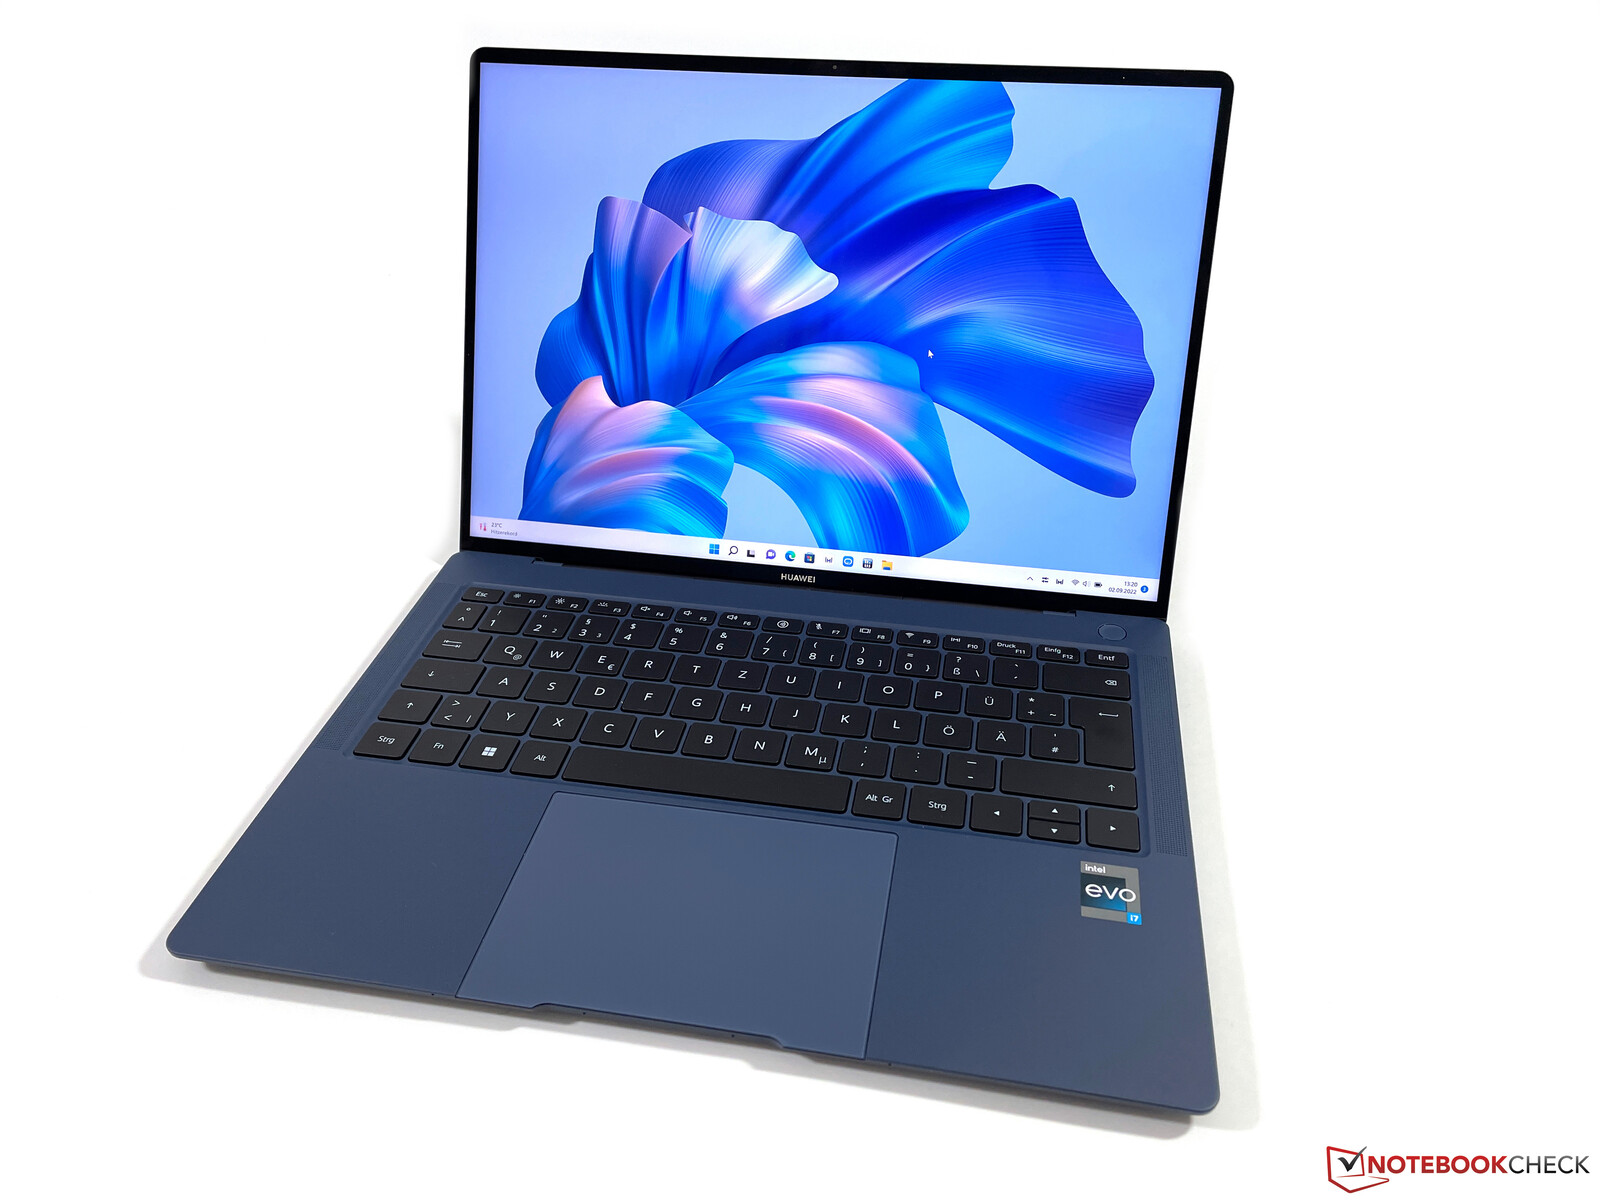
MateBook X Pro历来是华为的旗舰超极本,2022年的新机型忠实于这种说法。花费2199欧元(约合2199美元),你就能得到一个新的机箱,配备3:2格式的14.2英寸IPS显示屏、英特尔Alder Lake P处理器、大量的USB-C端口以及雷电4支持和现代Wi-Fi 6E模块。 用户还可以期待一个改进的键盘和一个具有额外功能的大型触摸板。
这足以争夺Windows超极本中的顶级地位吗?MateBook X Pro甚至对新的MacBook Air M2构成威胁吗?Apple MacBook Air M2?或者你应该选择 MateBook X Pro 2021它的 酷睿i7-1165G7这款产品目前在华为的报价为1099欧元(约1100美元),非常实惠?
潜在的竞争对手比较
Rating | Date | Model | Weight | Height | Size | Resolution | Price |
|---|---|---|---|---|---|---|---|
| 90.3 % v7 (old) | 09 / 2022 | Huawei MateBook X Pro 2022 i7-1260P, Iris Xe G7 96EUs | 1.3 kg | 15.6 mm | 14.20" | 3120x2080 | |
| 92 % v7 (old) | 08 / 2022 | Apple MacBook Air M2 10C GPU M2, M2 10-Core GPU | 1.2 kg | 11.3 mm | 13.60" | 2560x1664 | |
| 90.6 % v7 (old) | 05 / 2022 | Lenovo Yoga 9i 14 2022 i7-1260P i7-1260P, Iris Xe G7 96EUs | 1.4 kg | 15.25 mm | 14.00" | 3840x2400 | |
| 90.1 % v7 (old) | 07 / 2022 | Asus Zenbook S 13 OLED R7 6800U, Radeon 680M | 1.1 kg | 14.9 mm | 13.30" | 2880x1800 | |
| 86.9 % v7 (old) | 07 / 2022 | Dell XPS 13 Plus 9320 4K i7-1260P, Iris Xe G7 96EUs | 1.2 kg | 15.3 mm | 13.40" | 3840x2400 | |
| 87.8 % v7 (old) | 03 / 2021 | Huawei MateBook X Pro 2021 i7-1165G7, Iris Xe G7 96EUs | 1.3 kg | 14.6 mm | 13.90" | 3000x2000 |
案例--华为让镁元素发挥作用
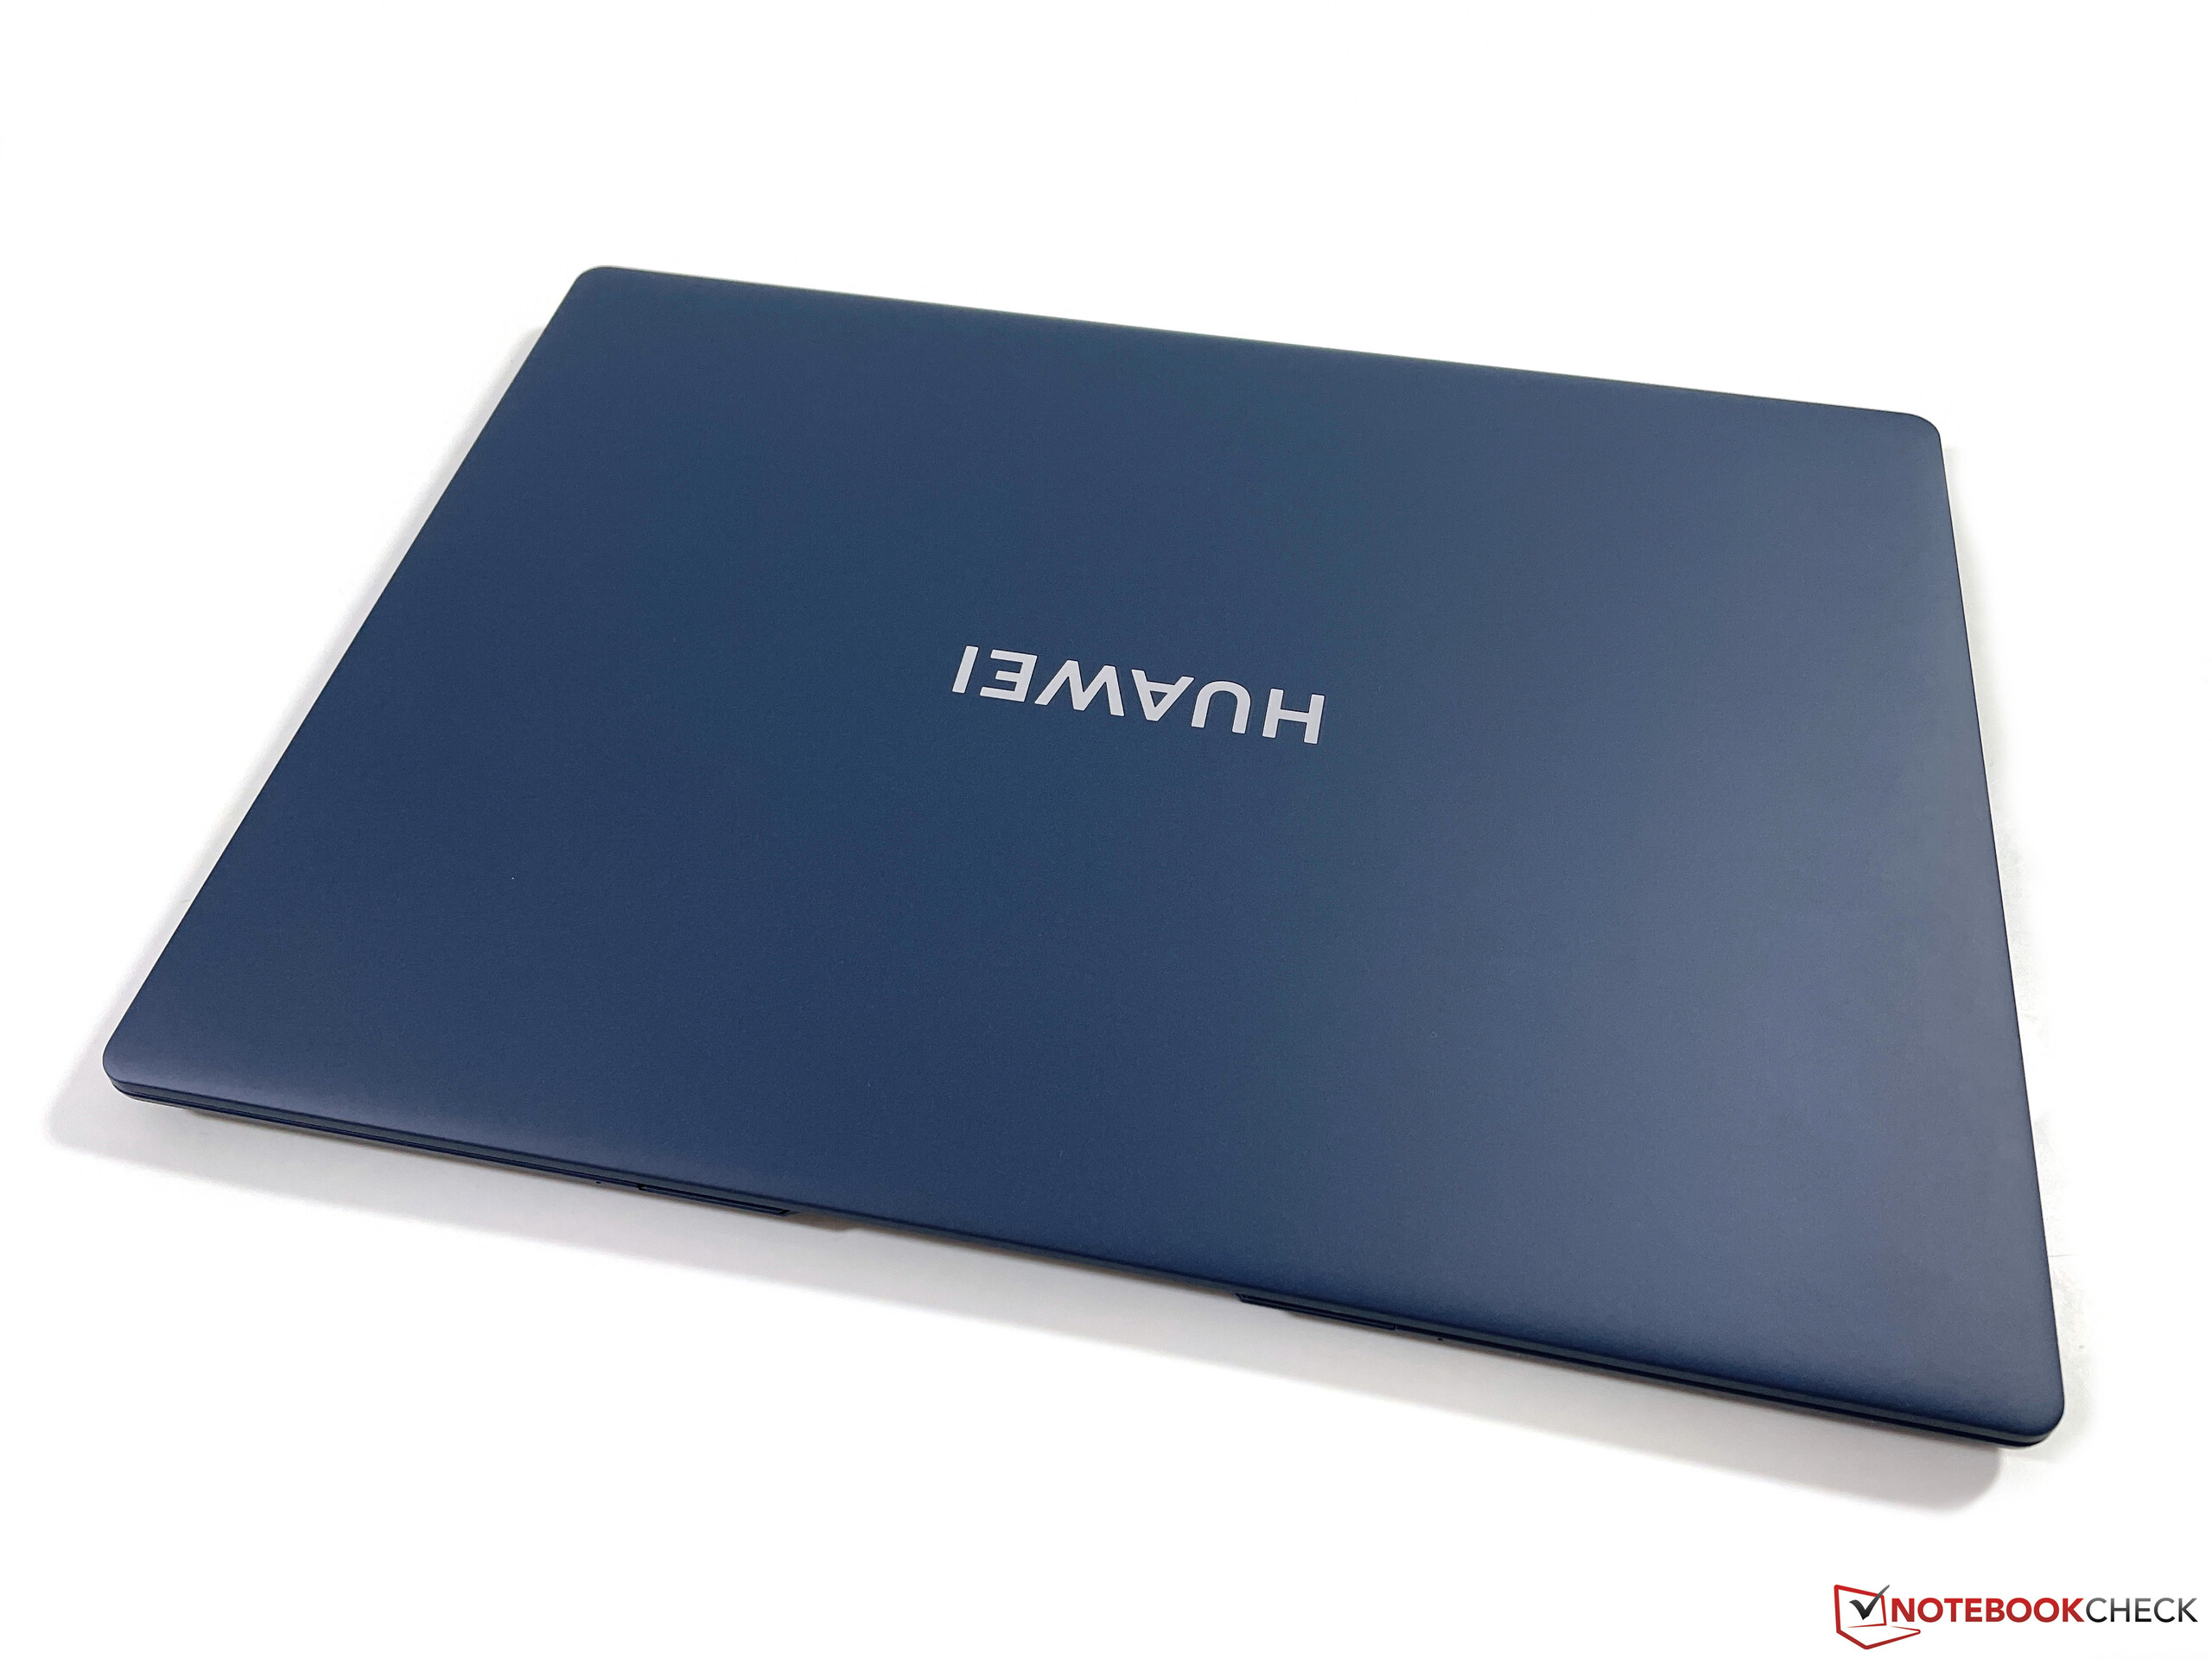
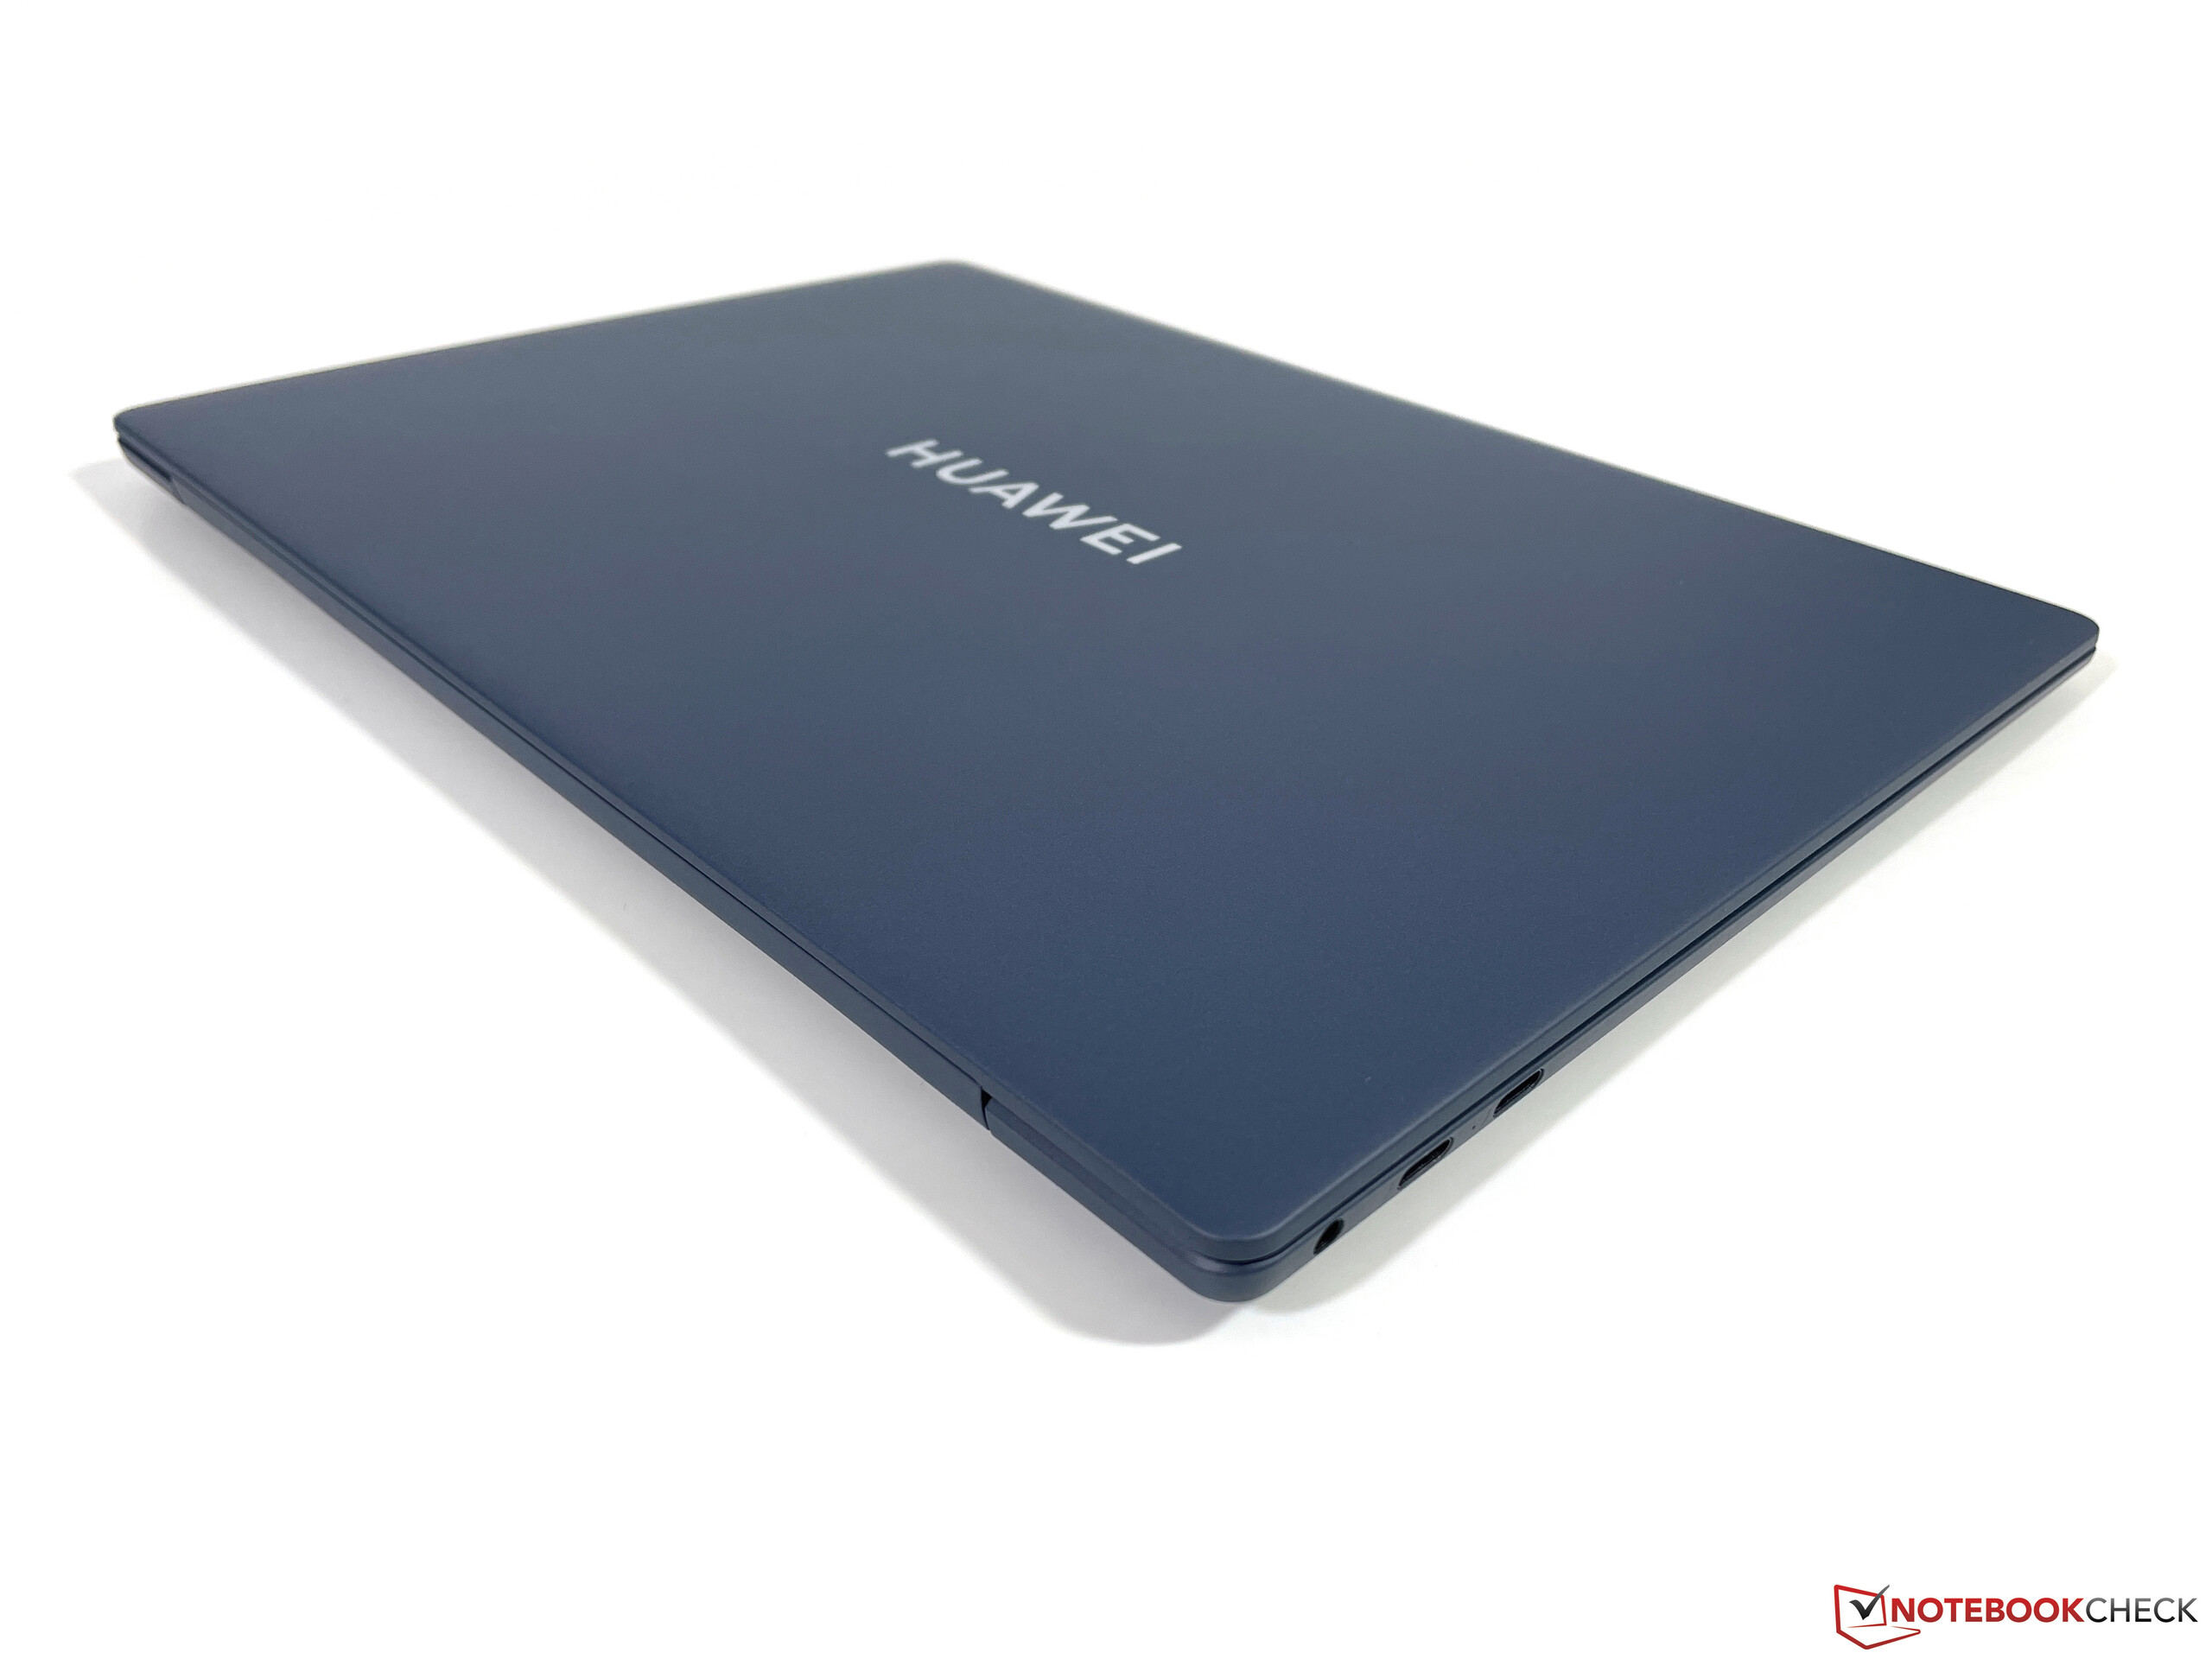
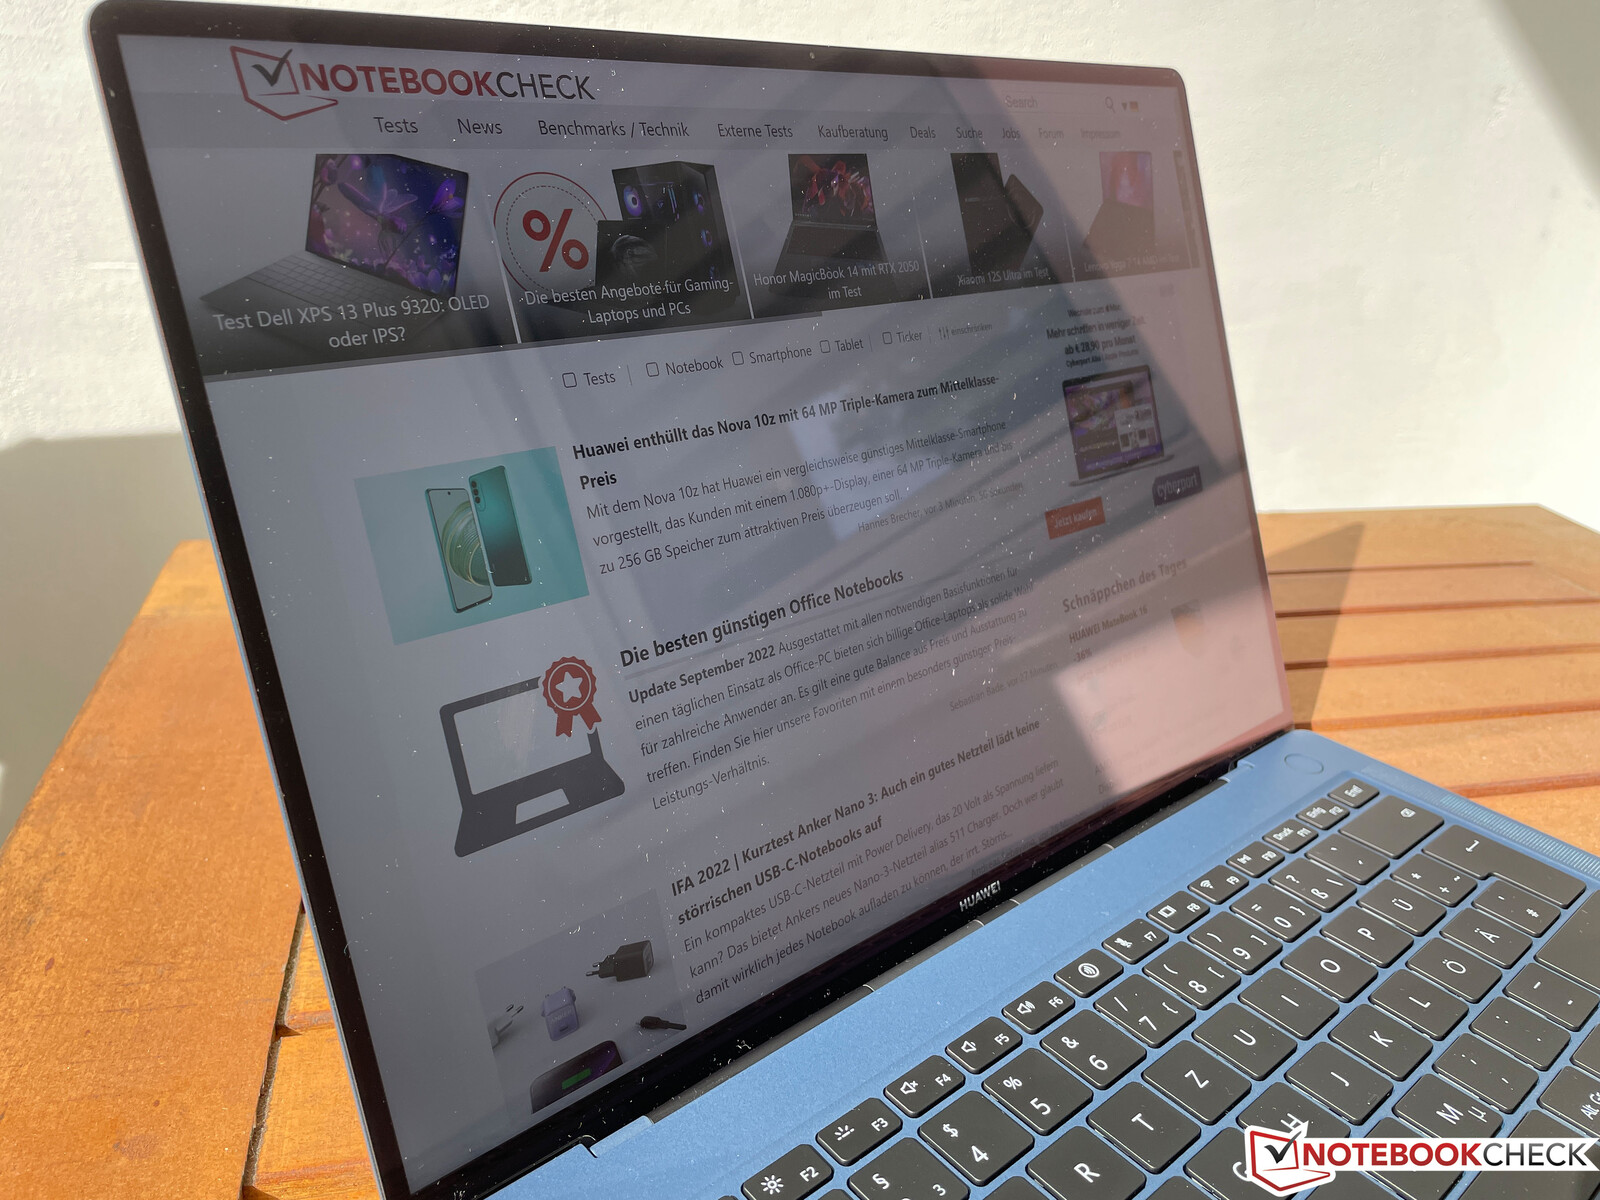
MateBook X Pro 2022有两个版本。根据规格表,我们的评测样本是高级版本,使用了新的 "软 "表面,结合了镁质底盘。除了深蓝色的变体(墨水蓝),还宣传了一个白色的模型,但这目前还无法获得。普通的太空灰版本在铝制外壳中提供了正常的光滑表面,而且重量也稍大一些。外壳是全新的;例如,在基本单元的顶部不再有抛光的边缘,就像旧的MateBook X Pro但该设备看起来仍然非常高质量,也能直接识别为MateBook。由于屏幕边缘较窄,这款笔记本看起来也非常现代。
当然,深蓝色让人联想到MacBook Air M2的新颜色变体。Apple MacBook Air M2,它的颜色更深一点。与MacBook Air相比,我们可以报告说,具有天鹅绒般柔软手感的表面,幸运的是对指纹不那么敏感,即使几天后我们也几乎看不到任何痕迹。整个外壳也给人以非常高质量和稳定的印象。基本单元只在键盘区域的上部中心有轻微的倾斜,但这在日常使用中并不令人感到困扰。显示屏的盖子也很稳定,没有产生吱吱作响的声音。我们只有在从后面有选择地施加大量压力的情况下才能够诱发图像伪影。屏幕铰链从根本上说调整得很好,而且用一只手打开盖子也没有问题。然而,屏幕的晃动是无法完全防止的。
与上一代相比,新的案例略有增长。前代产品,但显示屏更大,也是我们对比组中最大的显示屏之一。新的MateBook X Pro 2022的表面积也比新的 MacBook Air M2,但差别几乎不大。 Lenovos Yoga 9i 14敞篷车甚至略大。90瓦的电源适配器,包括USB-C电缆,重量为240克。
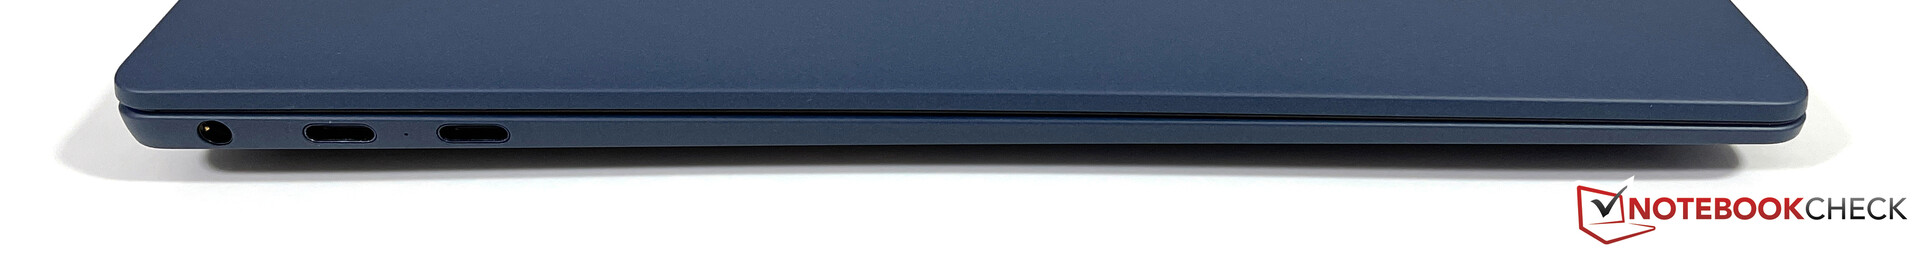
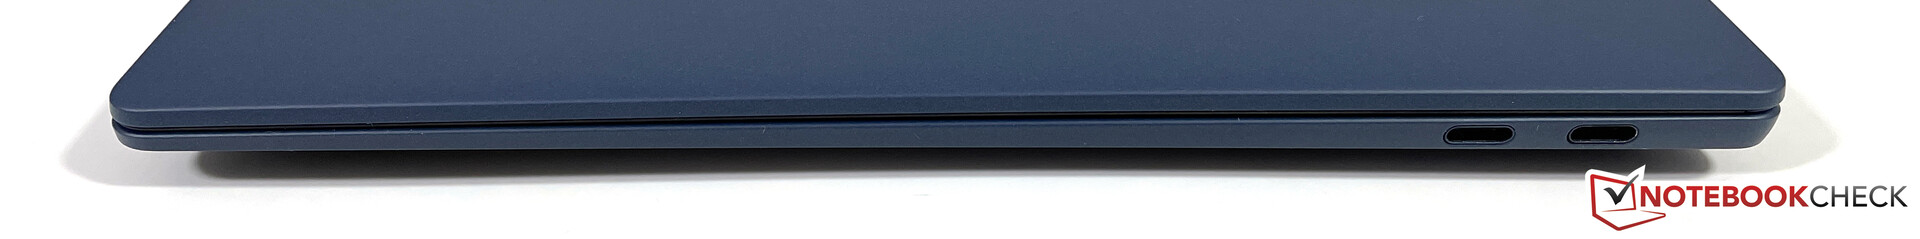
设备 - 华为终于将Thunderbolt 4带入设备中
雷电技术一直是旧款MateBook X Pro中缺少的功能。 旧的MateBook X Pro.现在,新的2022型号现在提供两个USB-C端口,左侧支持Thunderbolt 4。在右侧,有两个额外的USB-C端口,也可用于充电。交付范围还包括一条用于USB-A的短转换线。
那些同时使用其他华为设备(如平板电脑、智能手机、显示器)的人将从所谓的超级设备功能中受益。与Apple ,这使用户能够轻松地在同步设备之间分享或传输内容,或将屏幕扩展到平板电脑等。在笔记本电脑上使用多达三个智能手机应用程序也是可能的。
沟通
新的MateBook X Pro提供了英特尔最新的WLAN模块(AX211E),它支持6GHz网络(Wi-Fi 6E)以及蓝牙5.2。我们能够毫无问题地连接到华硕参考路由器的6GHz网络,而且传输率始终非常高,约为1.7GBit/s。
| Networking | |
| iperf3 transmit AXE11000 6GHz | |
| Huawei MateBook X Pro 2022 | |
| Lenovo Yoga 9i 14 2022 i7-1260P | |
| Average Intel Wi-Fi 6E AX211 (385 - 1851, n=226) | |
| iperf3 receive AXE11000 6GHz | |
| Huawei MateBook X Pro 2022 | |
| Average Intel Wi-Fi 6E AX211 (700 - 1857, n=226) | |
| Lenovo Yoga 9i 14 2022 i7-1260P | |
| iperf3 receive AXE11000 | |
| Dell XPS 13 Plus 9320 4K | |
| Asus Zenbook S 13 OLED | |
| Average Intel Wi-Fi 6E AX211 (582 - 1890, n=276) | |
| Apple MacBook Air M2 Entry | |
| iperf3 transmit AXE11000 | |
| Dell XPS 13 Plus 9320 4K | |
| Asus Zenbook S 13 OLED | |
| Average Intel Wi-Fi 6E AX211 (64 - 1921, n=276) | |
| Apple MacBook Air M2 Entry | |
网络摄像头
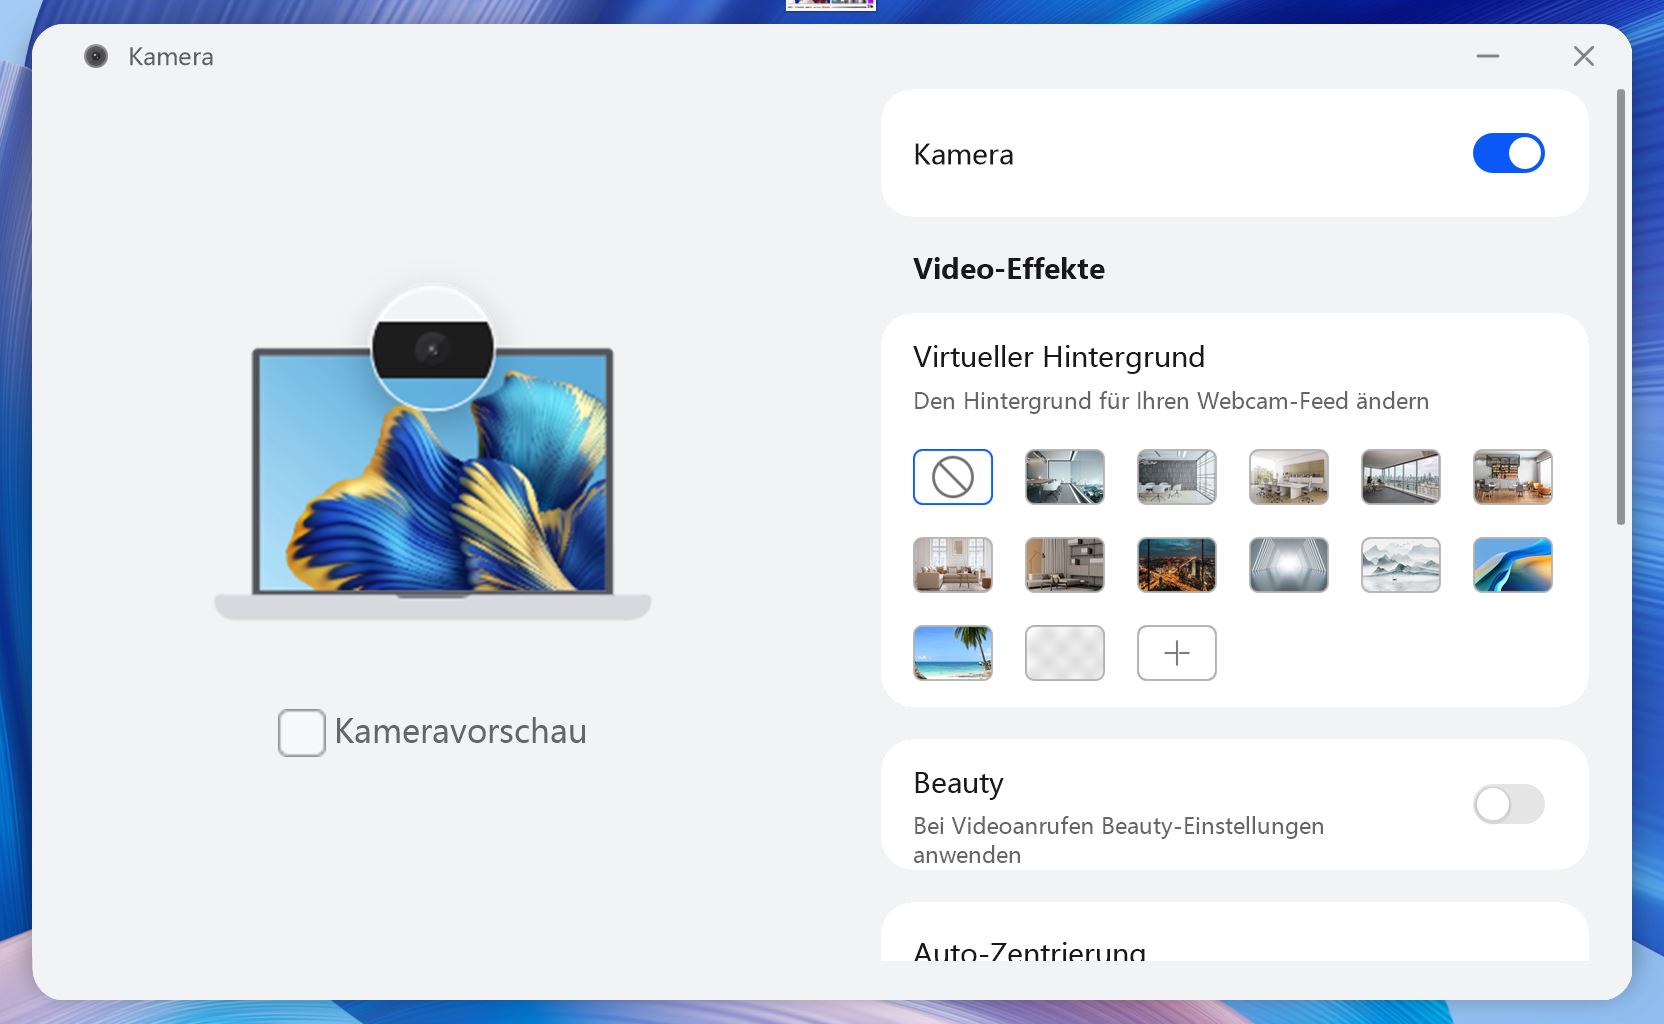
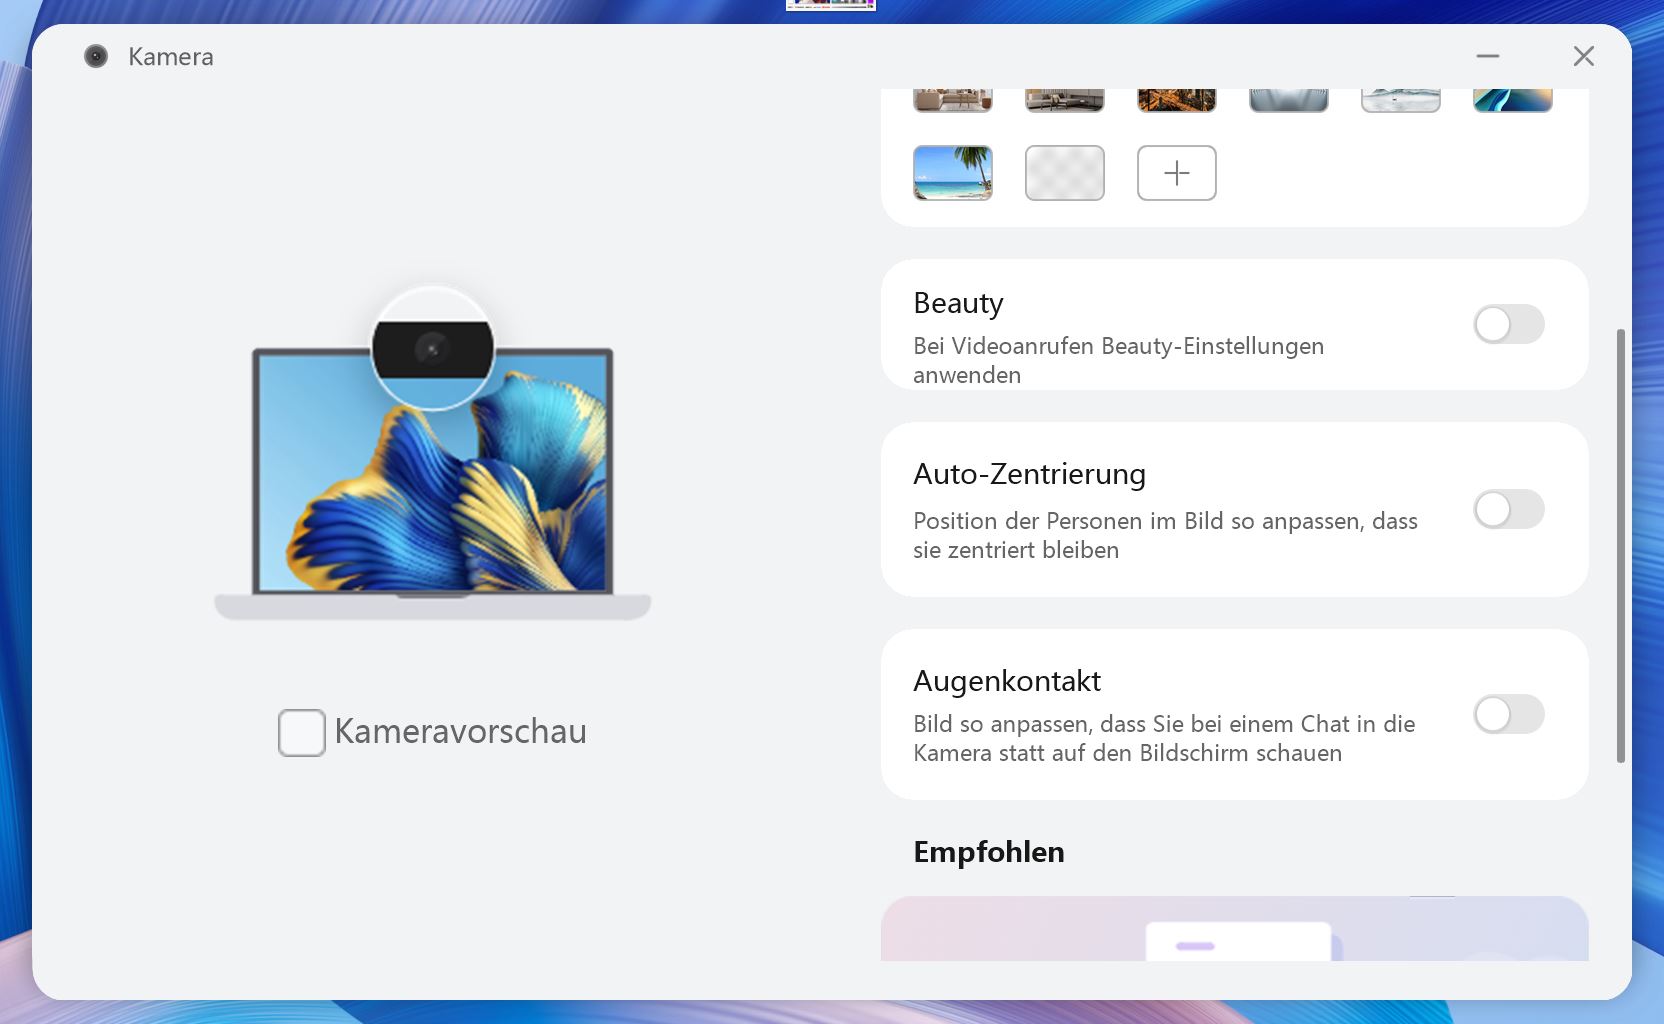
网络摄像头已经从键盘移到了屏幕上框,但只使用了一个720p的传感器,即使在良好的照明条件下也不能提供良好的图像质量。也没有机械快门或红外摄像头。
正如在 MateBook 16s。华为为网络摄像头提供了一些额外的AI功能。这些包括实用的功能,如虚拟背景(独立于软件),但也包括相当不必要的噱头,如美容模式。在MateBook 16s的1080p网络摄像头上,自动对焦的效果也更好一点。


维护
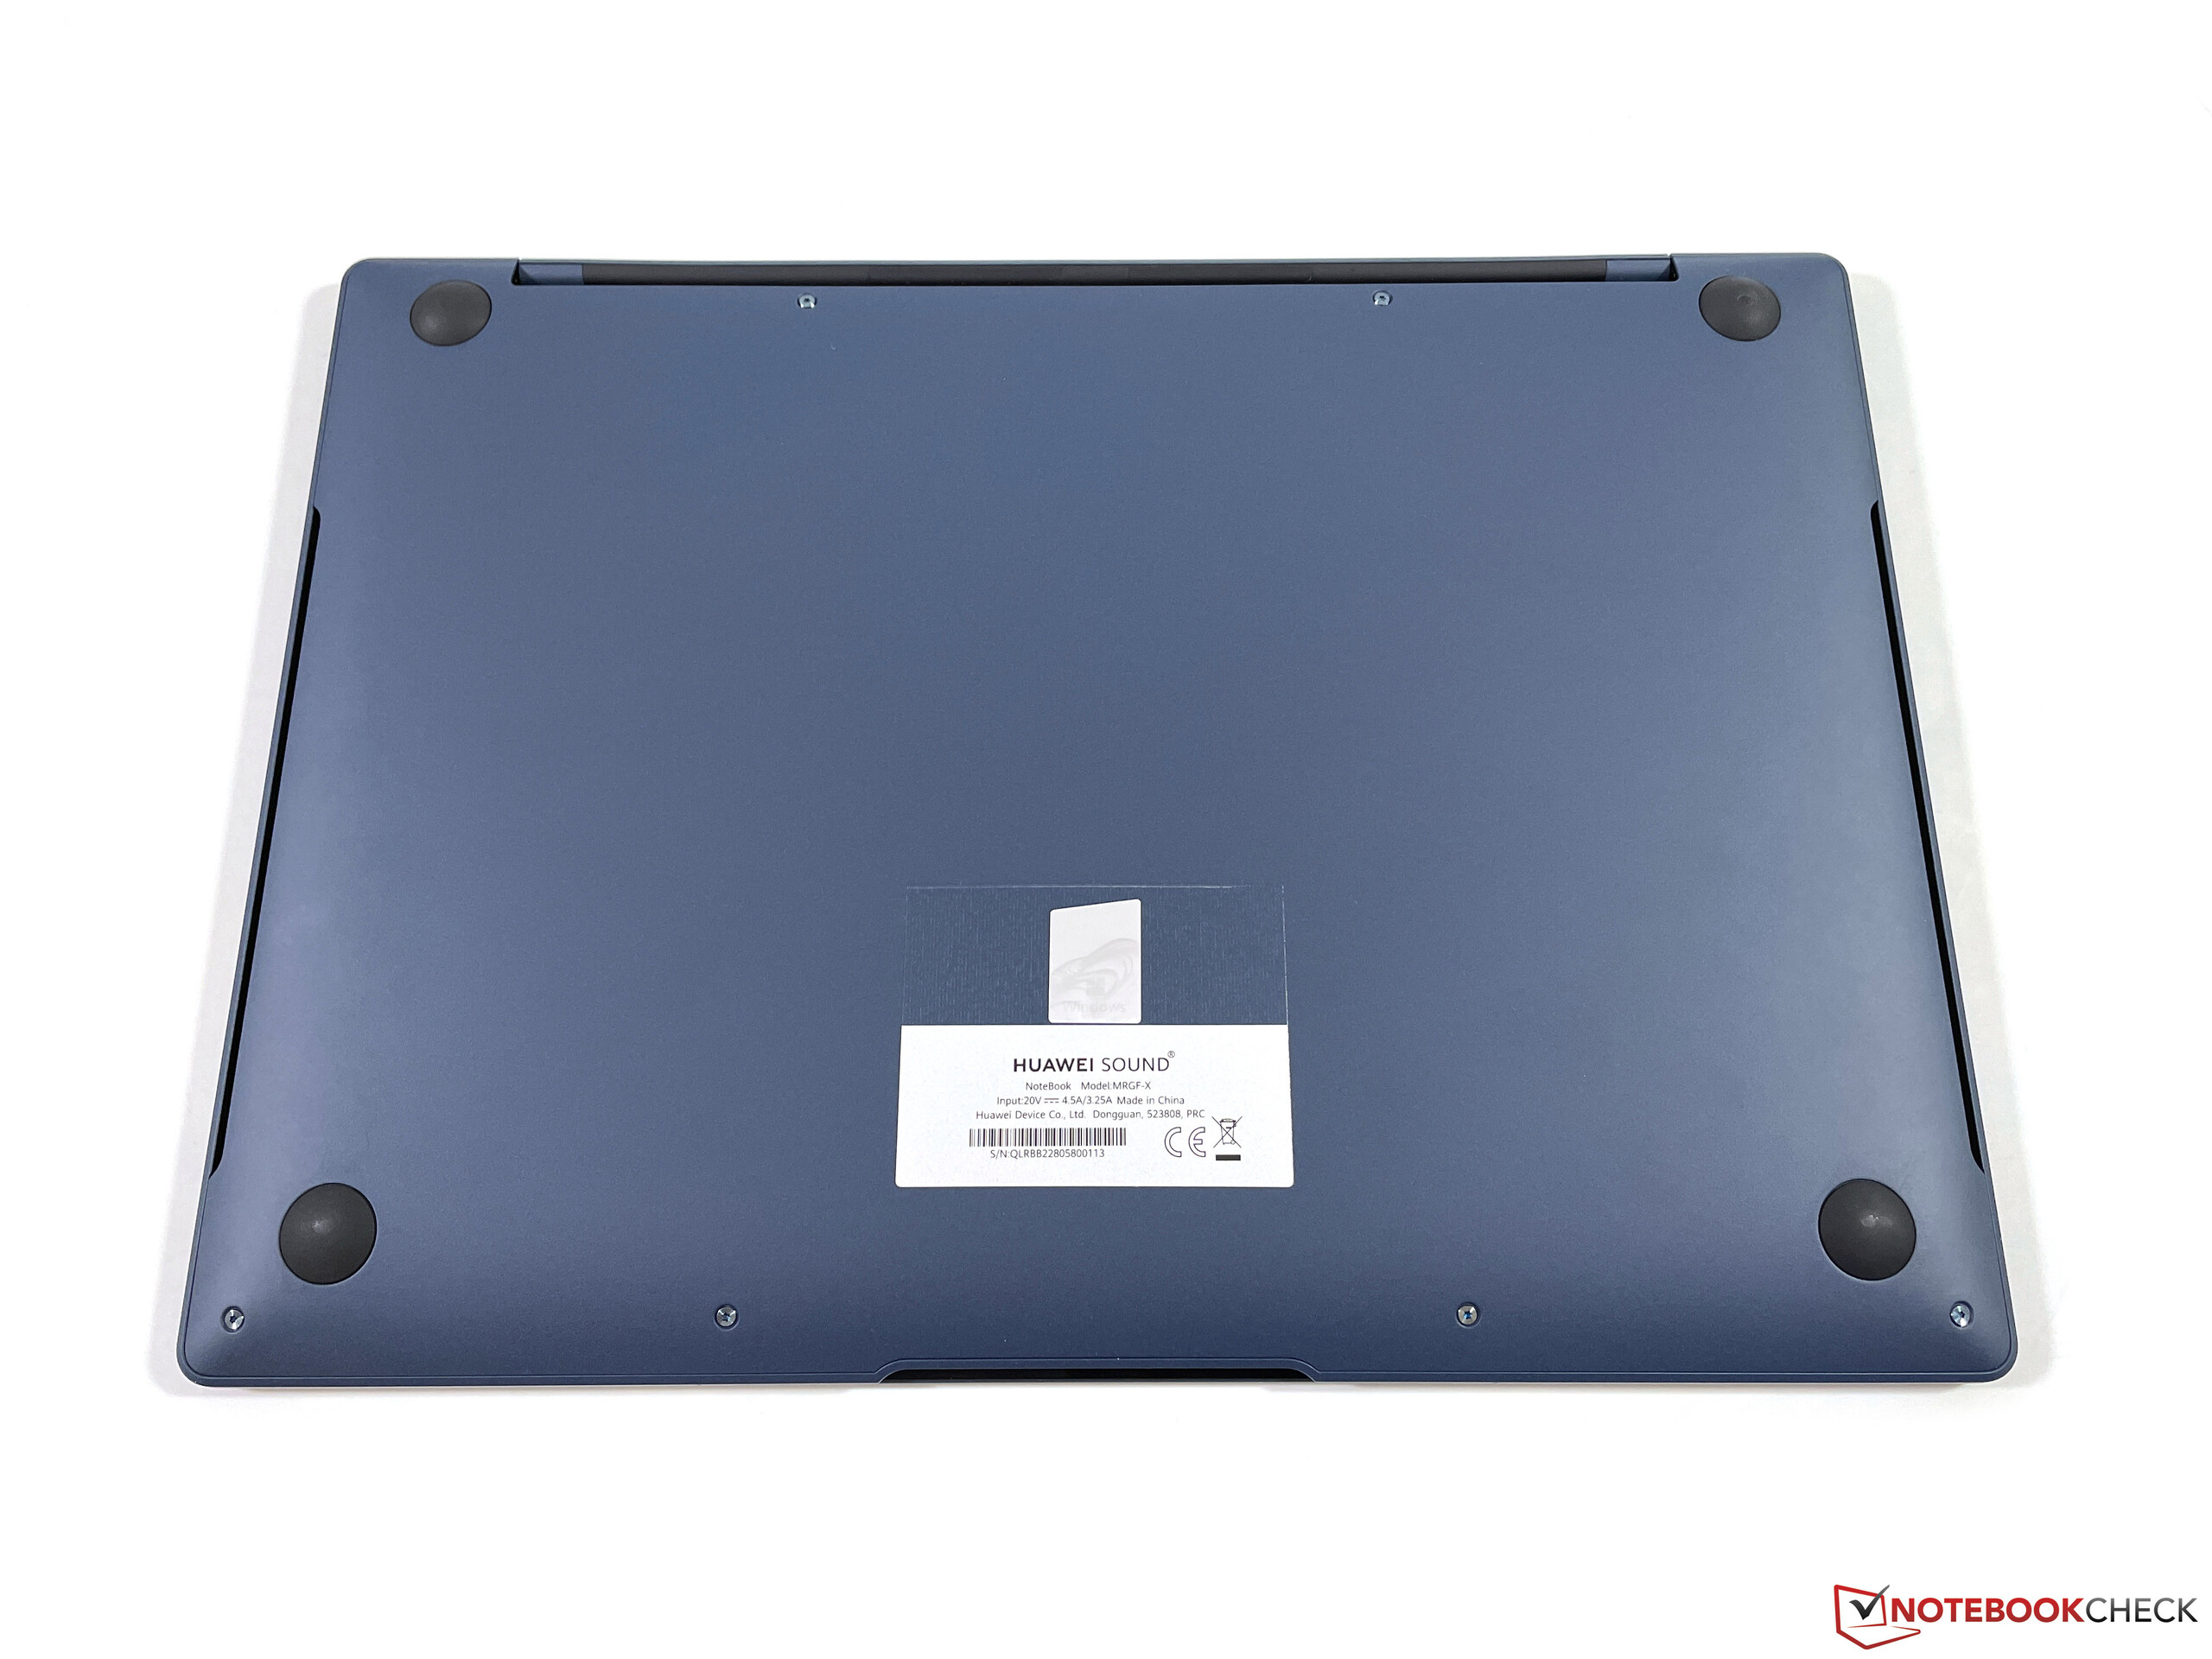
底部有六颗Torx螺丝(T5),这些螺丝可以轻易拧开,但我们仍然无法卸下底板。我们怀疑在后部橡胶脚下有更多隐藏的螺丝,这在华为的宣传视频中得到了证实。然而,橡胶脚是非常紧的,华为还要求我们不要拆除它们,也不要打开机箱,因为害怕损坏。因此,用户没有可能进行维护工作,我们认为这是一个不必要的限制。
输入设备 - 1.5毫米键程和FreeTouch
键盘
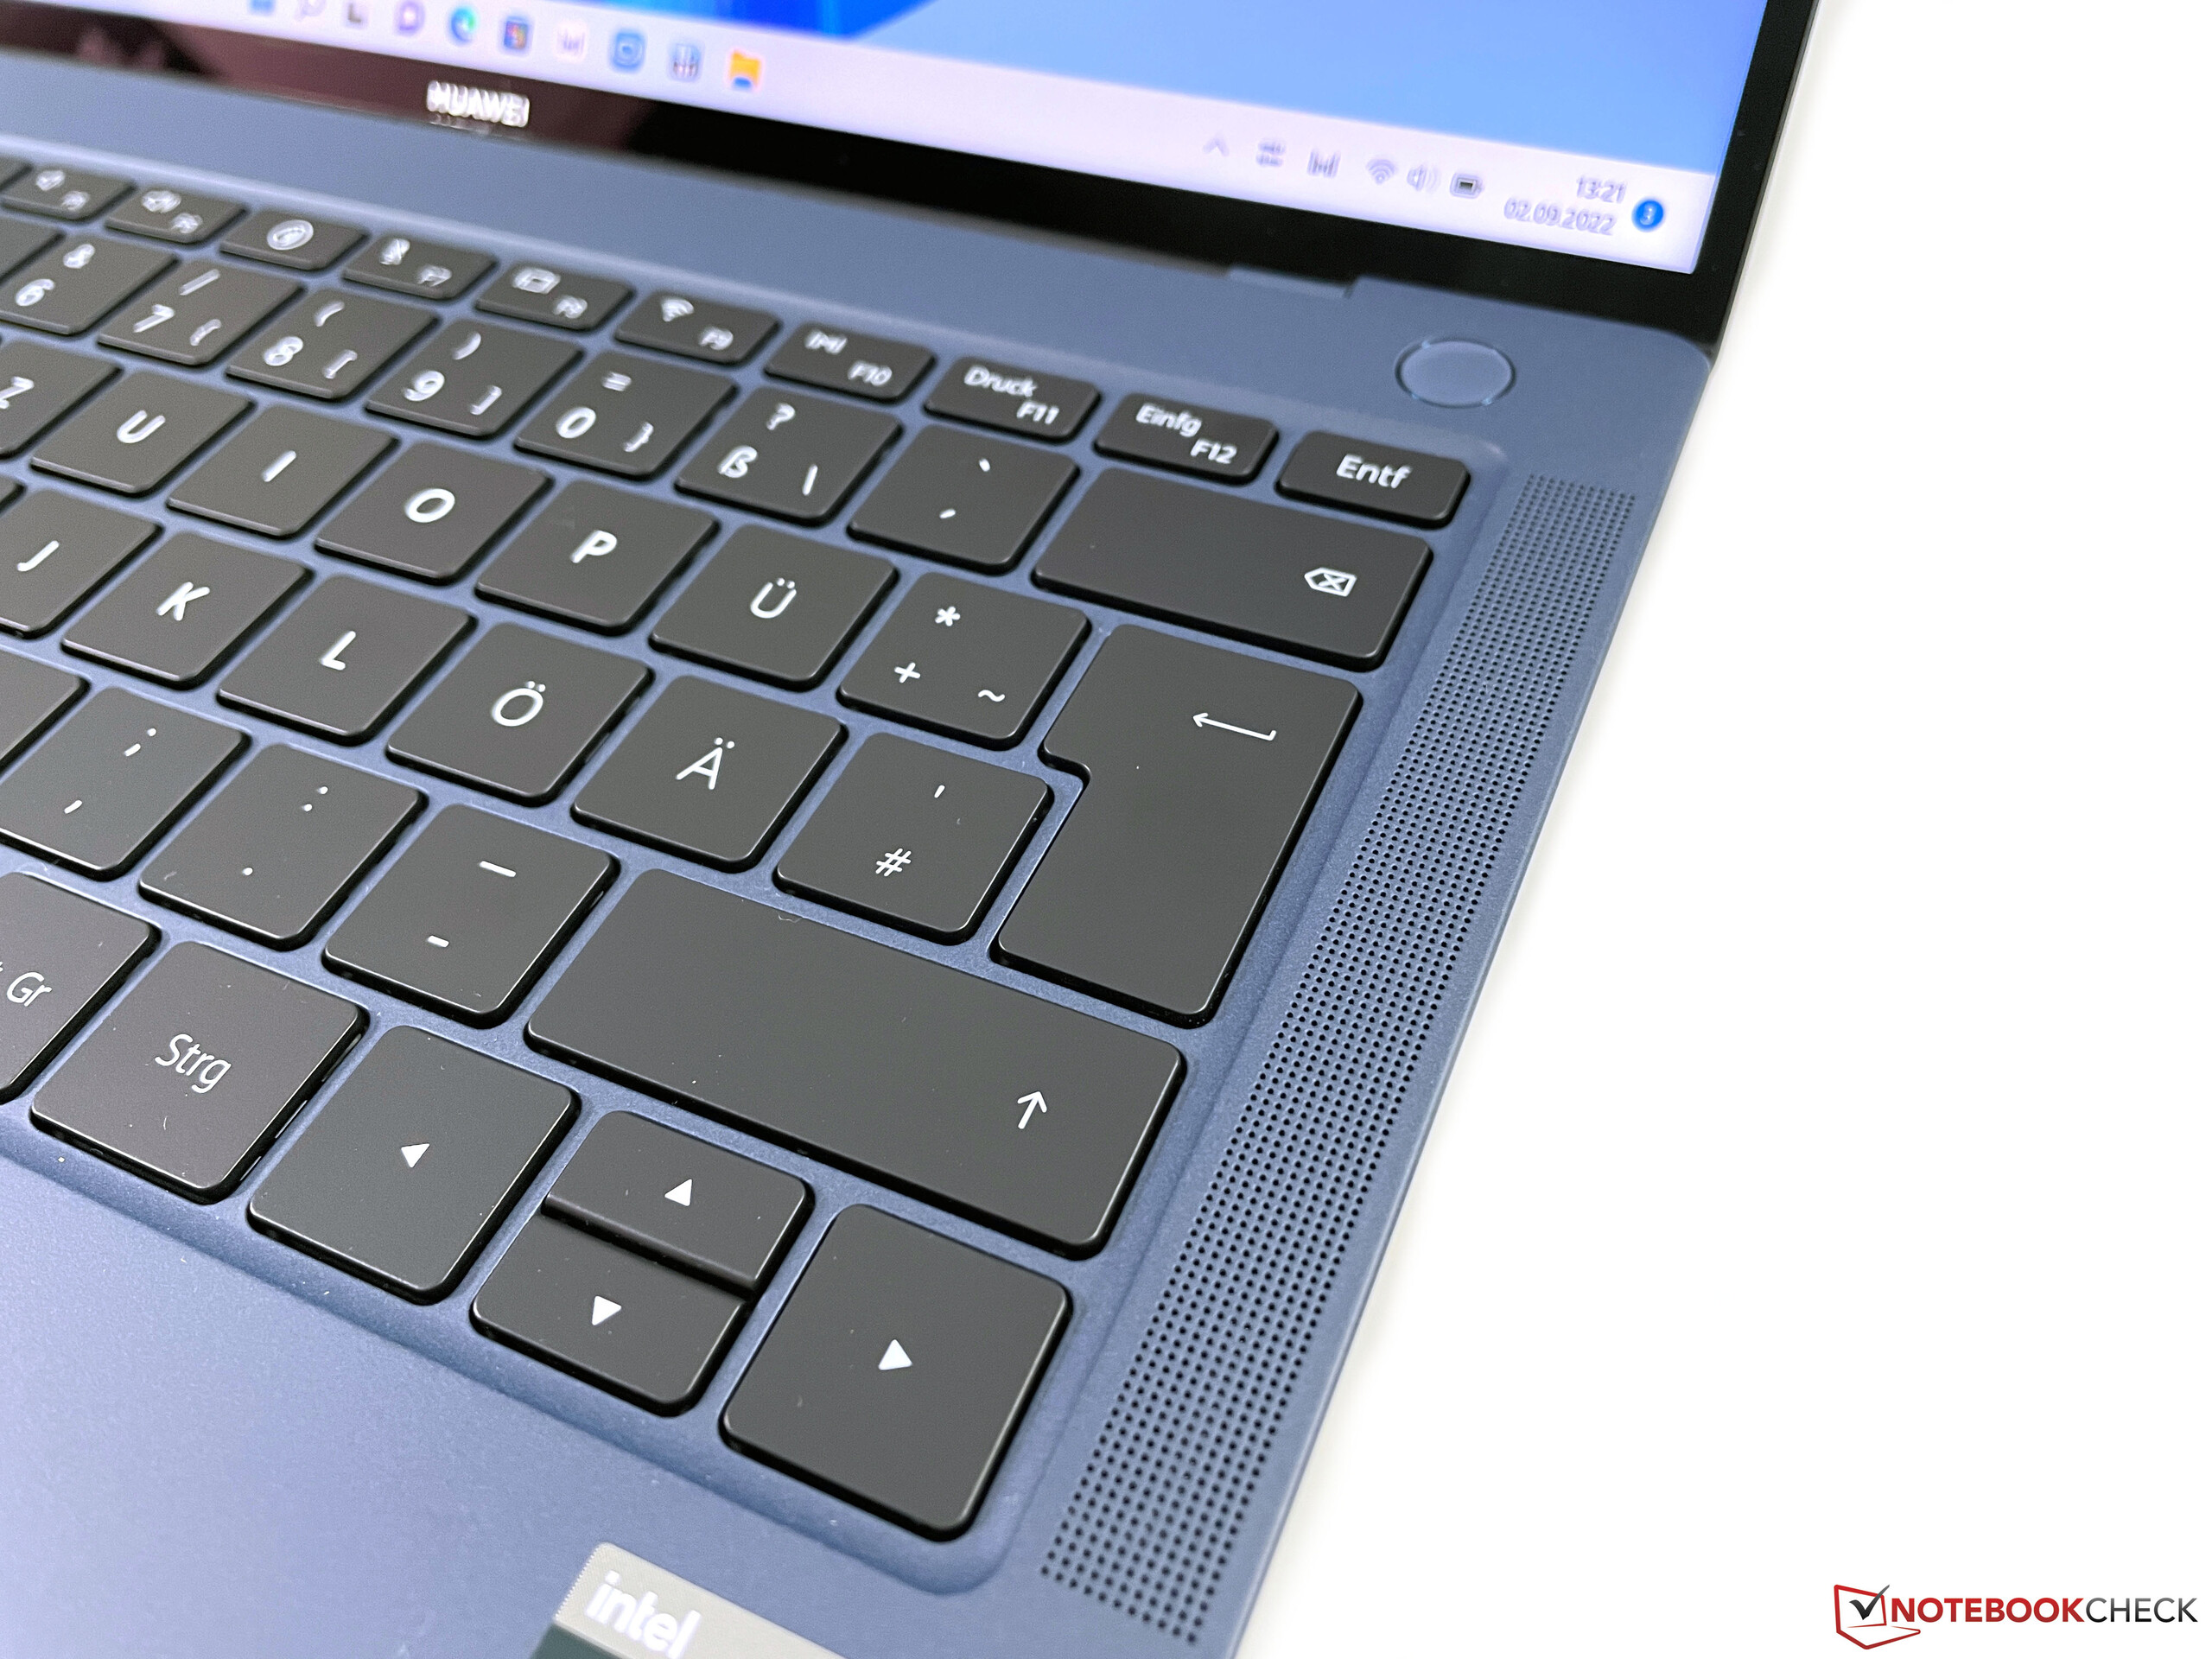
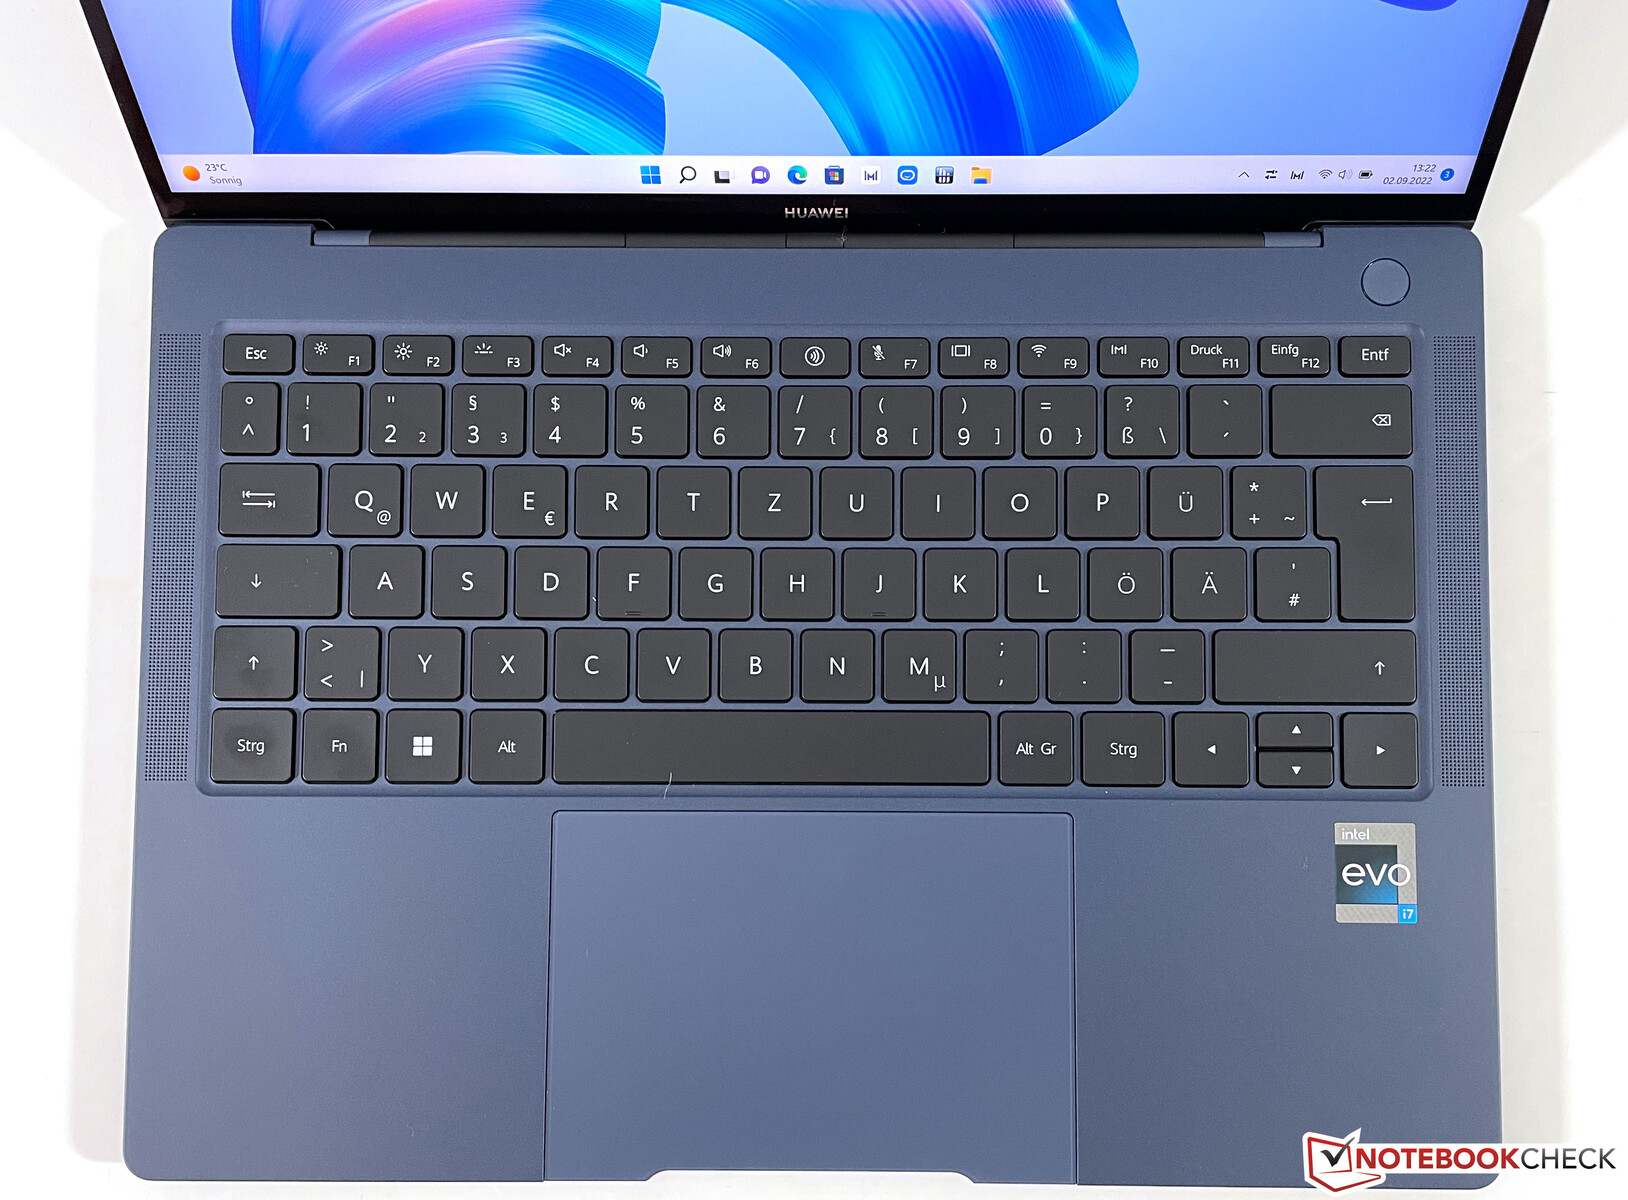
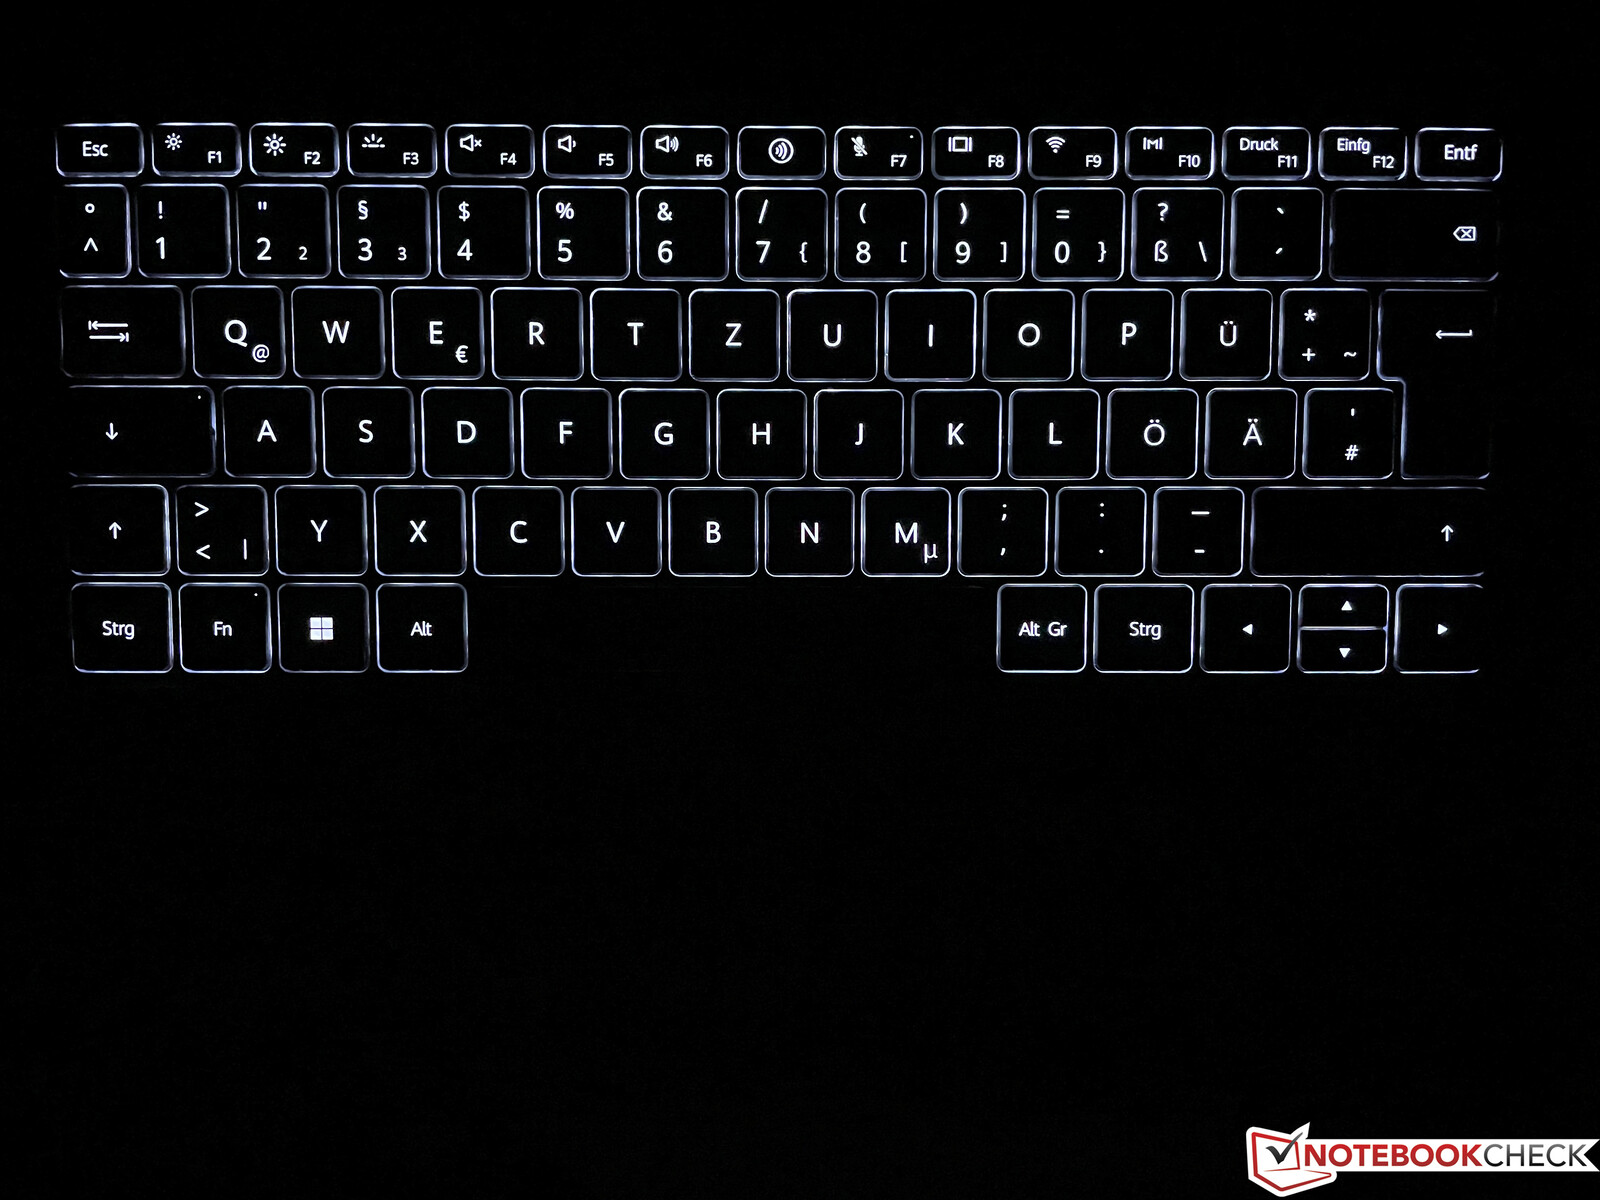
与之相比 旧型号,华为改进了键盘,将键位下降幅度增加到1.5毫米。打字的感觉是非常精确和愉快的,特别是对于这样一个紧凑的设备。打字的噪音一般,但除了空格键外,没有任何东西发出响声。总的来说,这是一个很好的键盘,用来写长篇文字没有任何问题。两段式白色背光有助于在黑暗环境中使用,但这必须手动激活。在PC管理器中,用户可以手动设置背光在不活动时自动关闭;15秒是默认设置。电源按钮位于键盘上方,不影响打字。它还包含指纹扫描仪,工作可靠。
触摸板
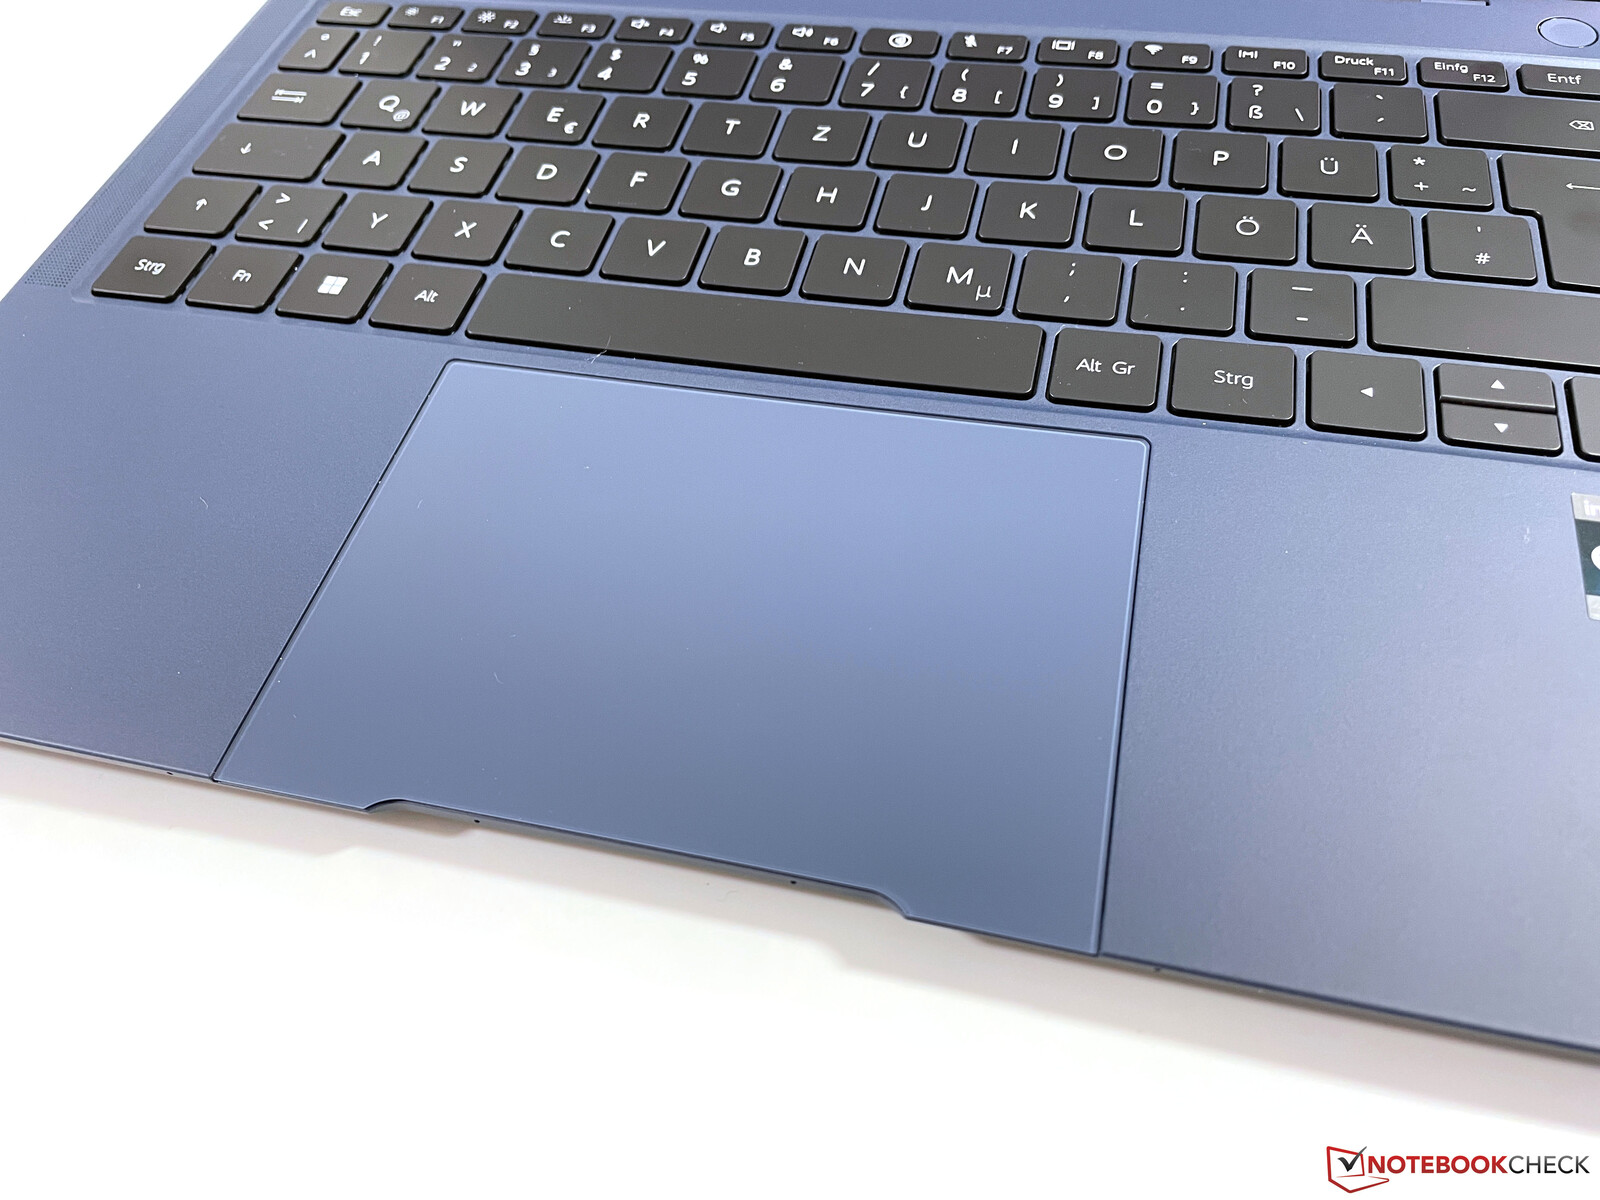
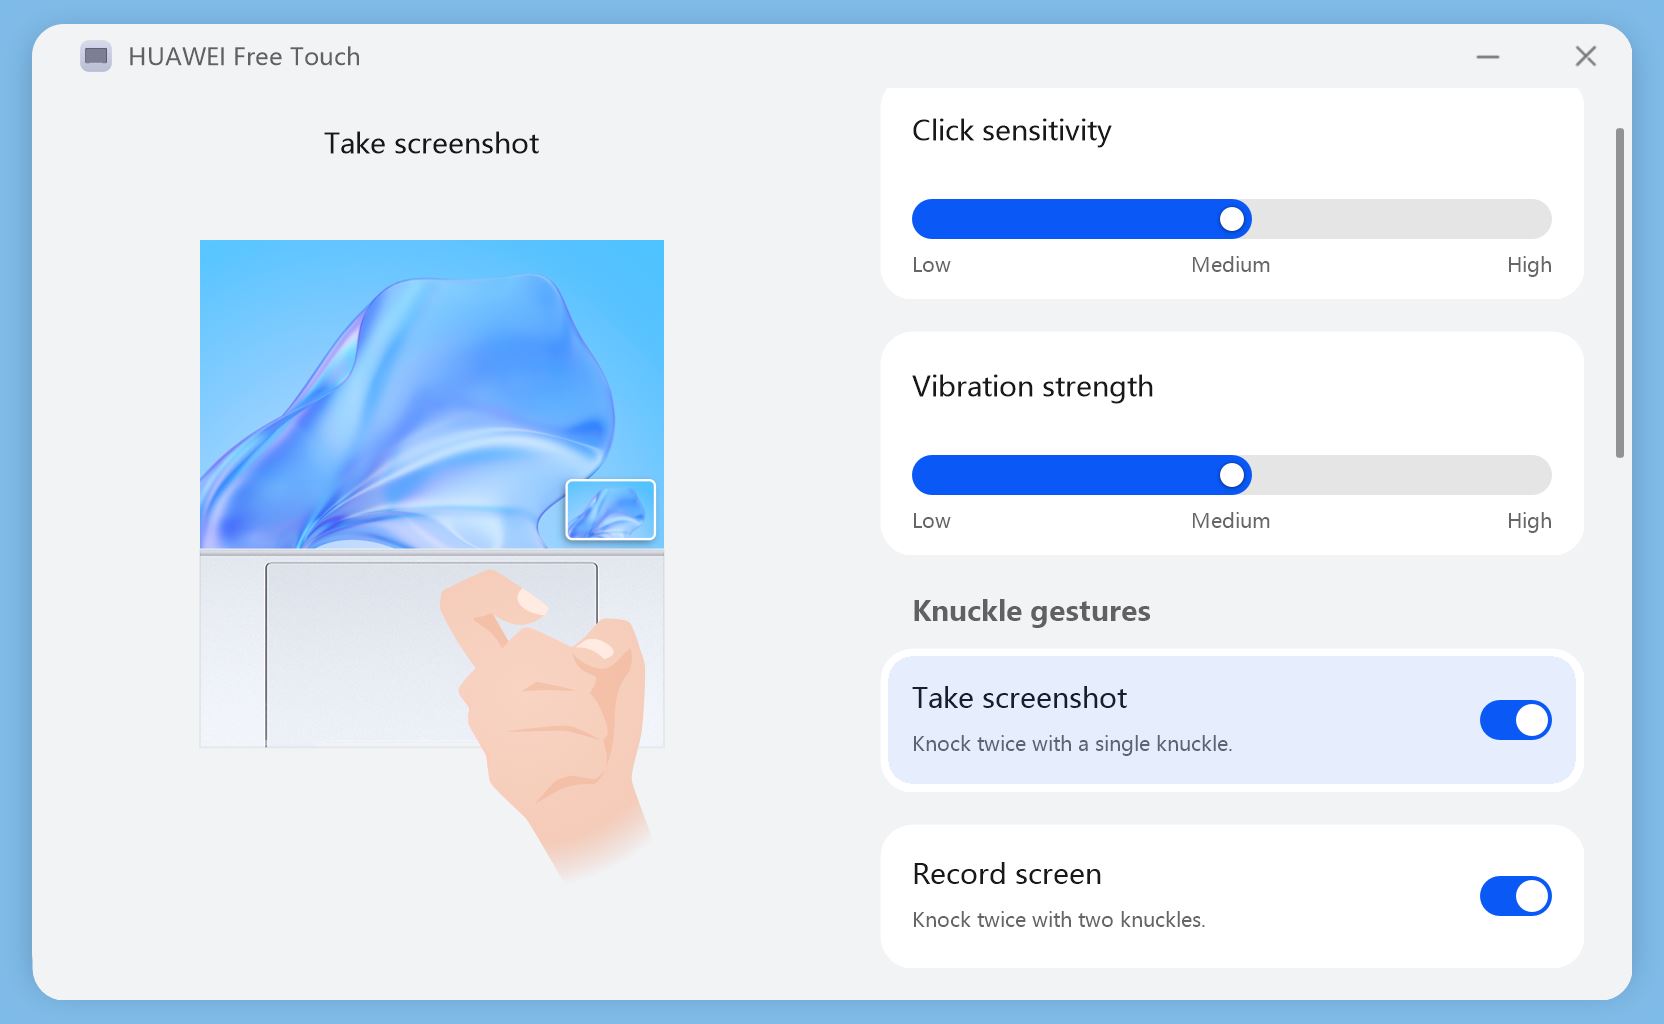
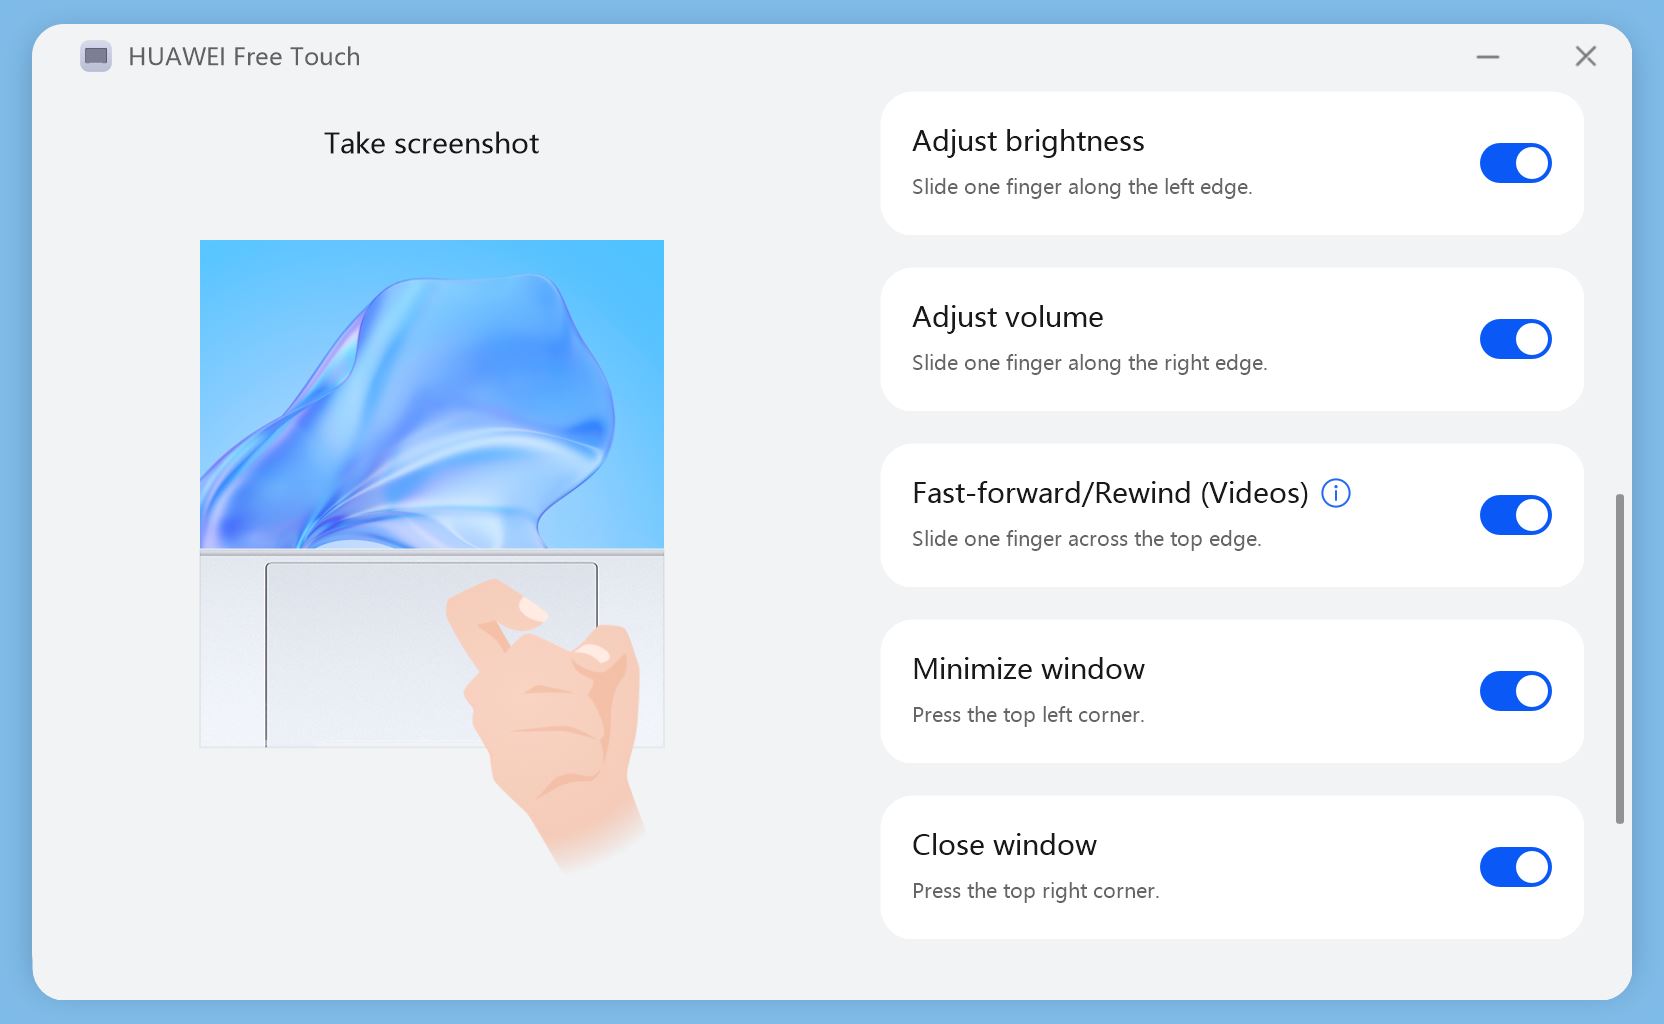
触摸板绝对是新款MateBook X Pro 2022的亮点之一。它不仅非常大,一直延伸到机箱的前缘(包括凹槽),而且还提供了很多额外的功能。华为将这些功能归为FreeTouch一词,其中涉及额外的手势。例如,你可以沿着两个垂直边缘滚动来改变屏幕亮度或音量,这也得到触觉网格效果的支持。你还可以通过沿上边缘滚动来浏览视频或音乐。其他手势也可以使用,如下图所示。
基本的指针控制也工作得很完美。滑动性能非常好,整个垫子可以清晰地向下点击。像Apple ,这一点被触觉反馈所证实,导致了非常均匀和令人愉快的安静的点击噪音。同时,该组件本身是完全稳固的。
显示器 - 90赫兹,IPS,无PWM
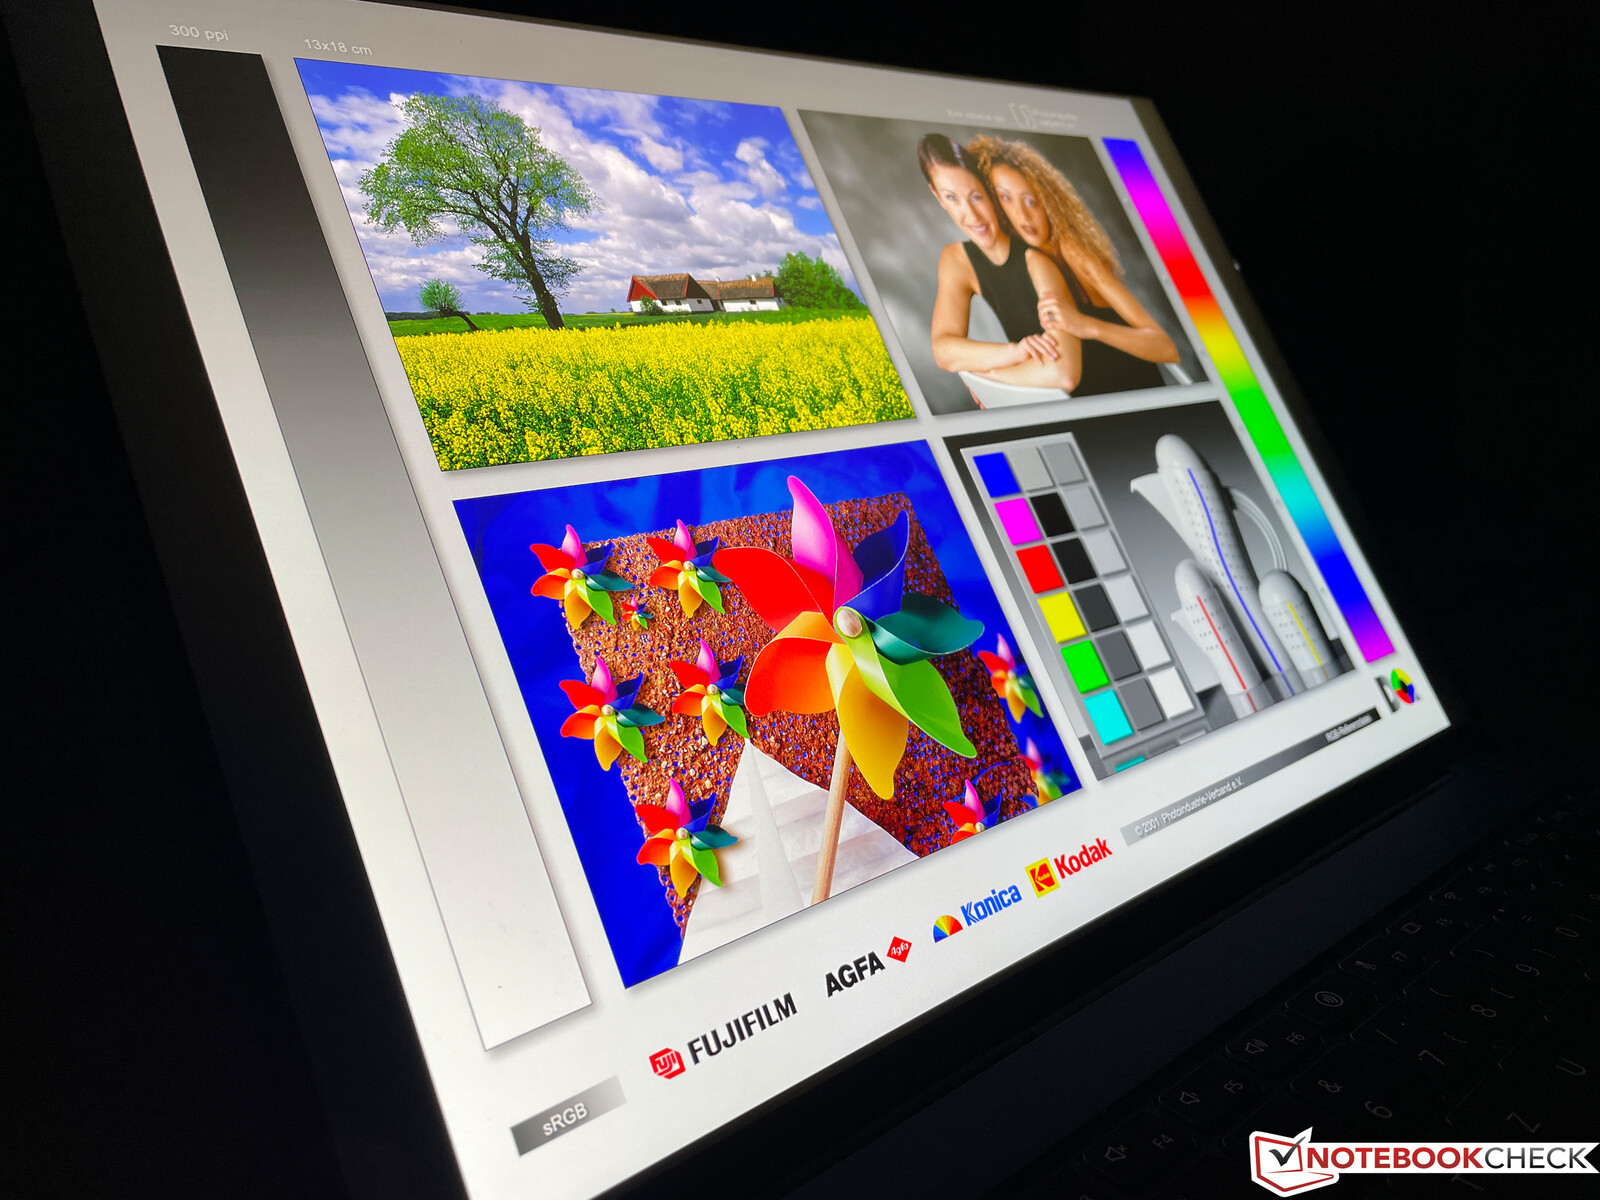
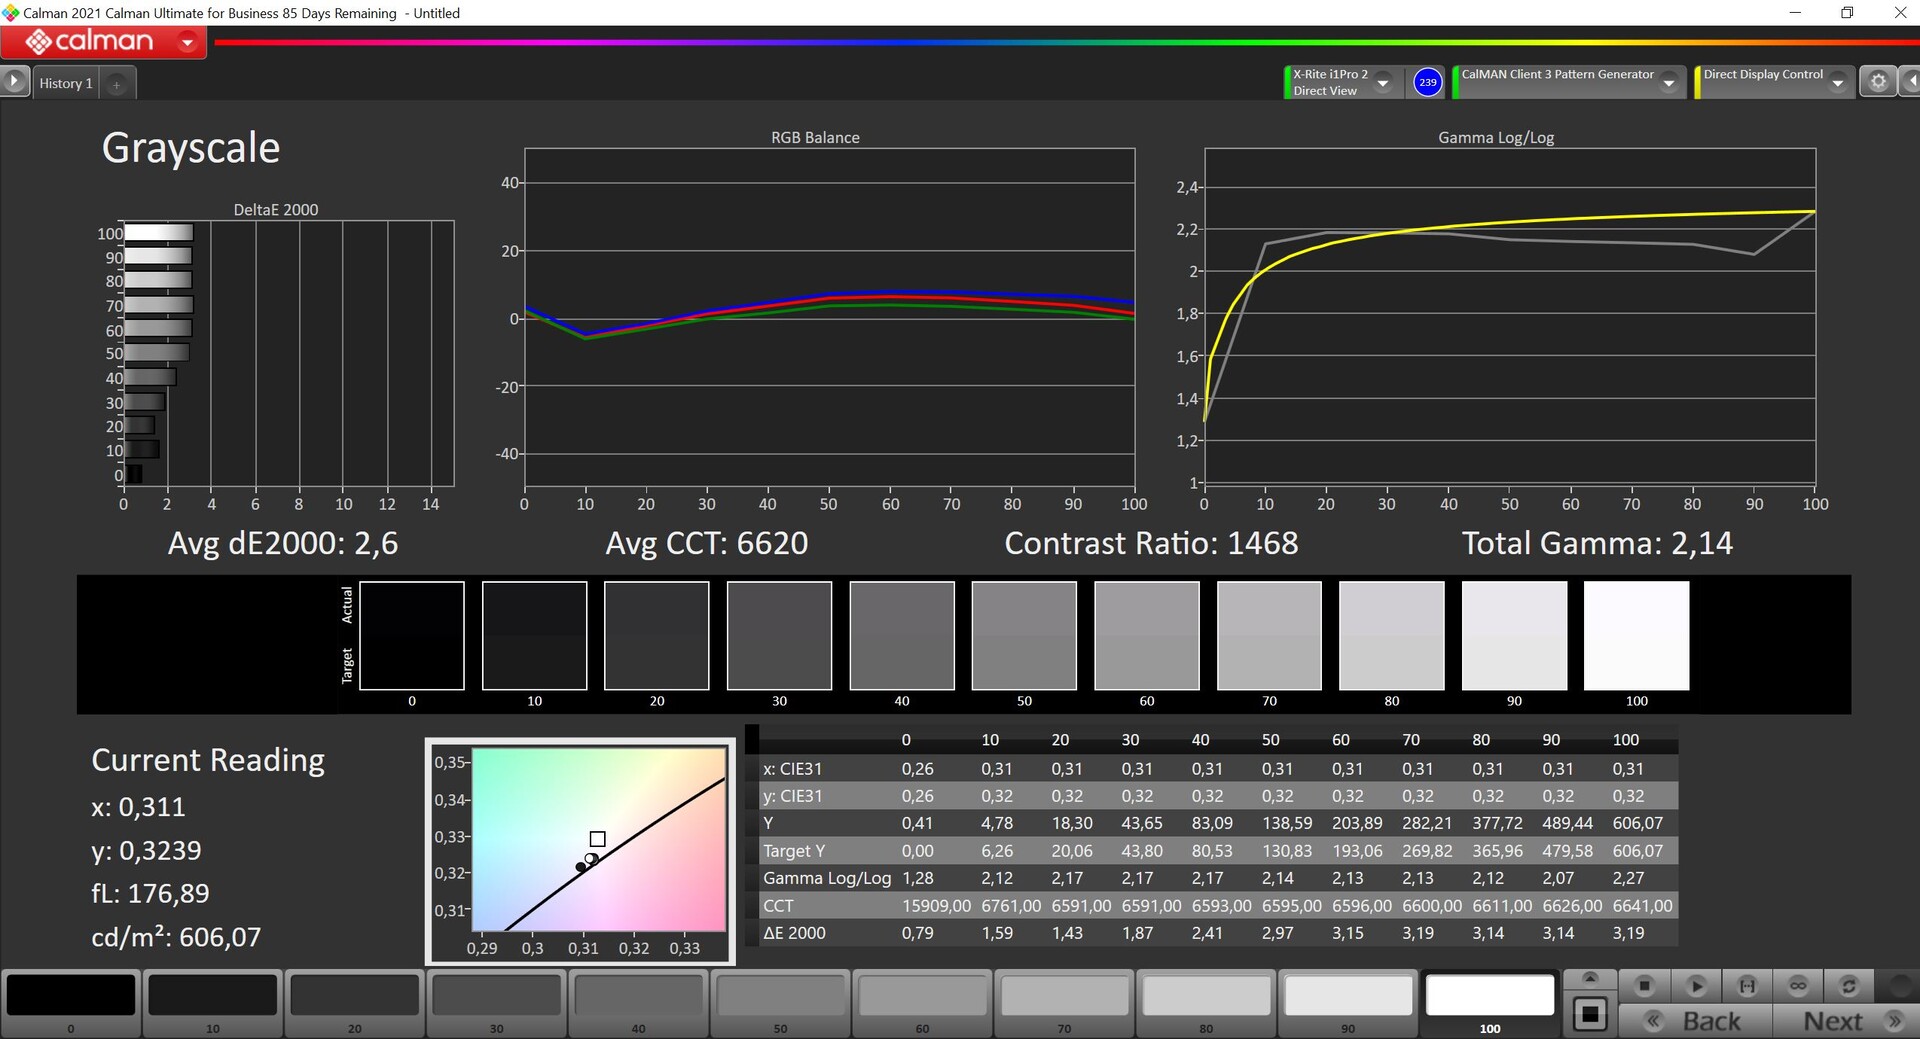
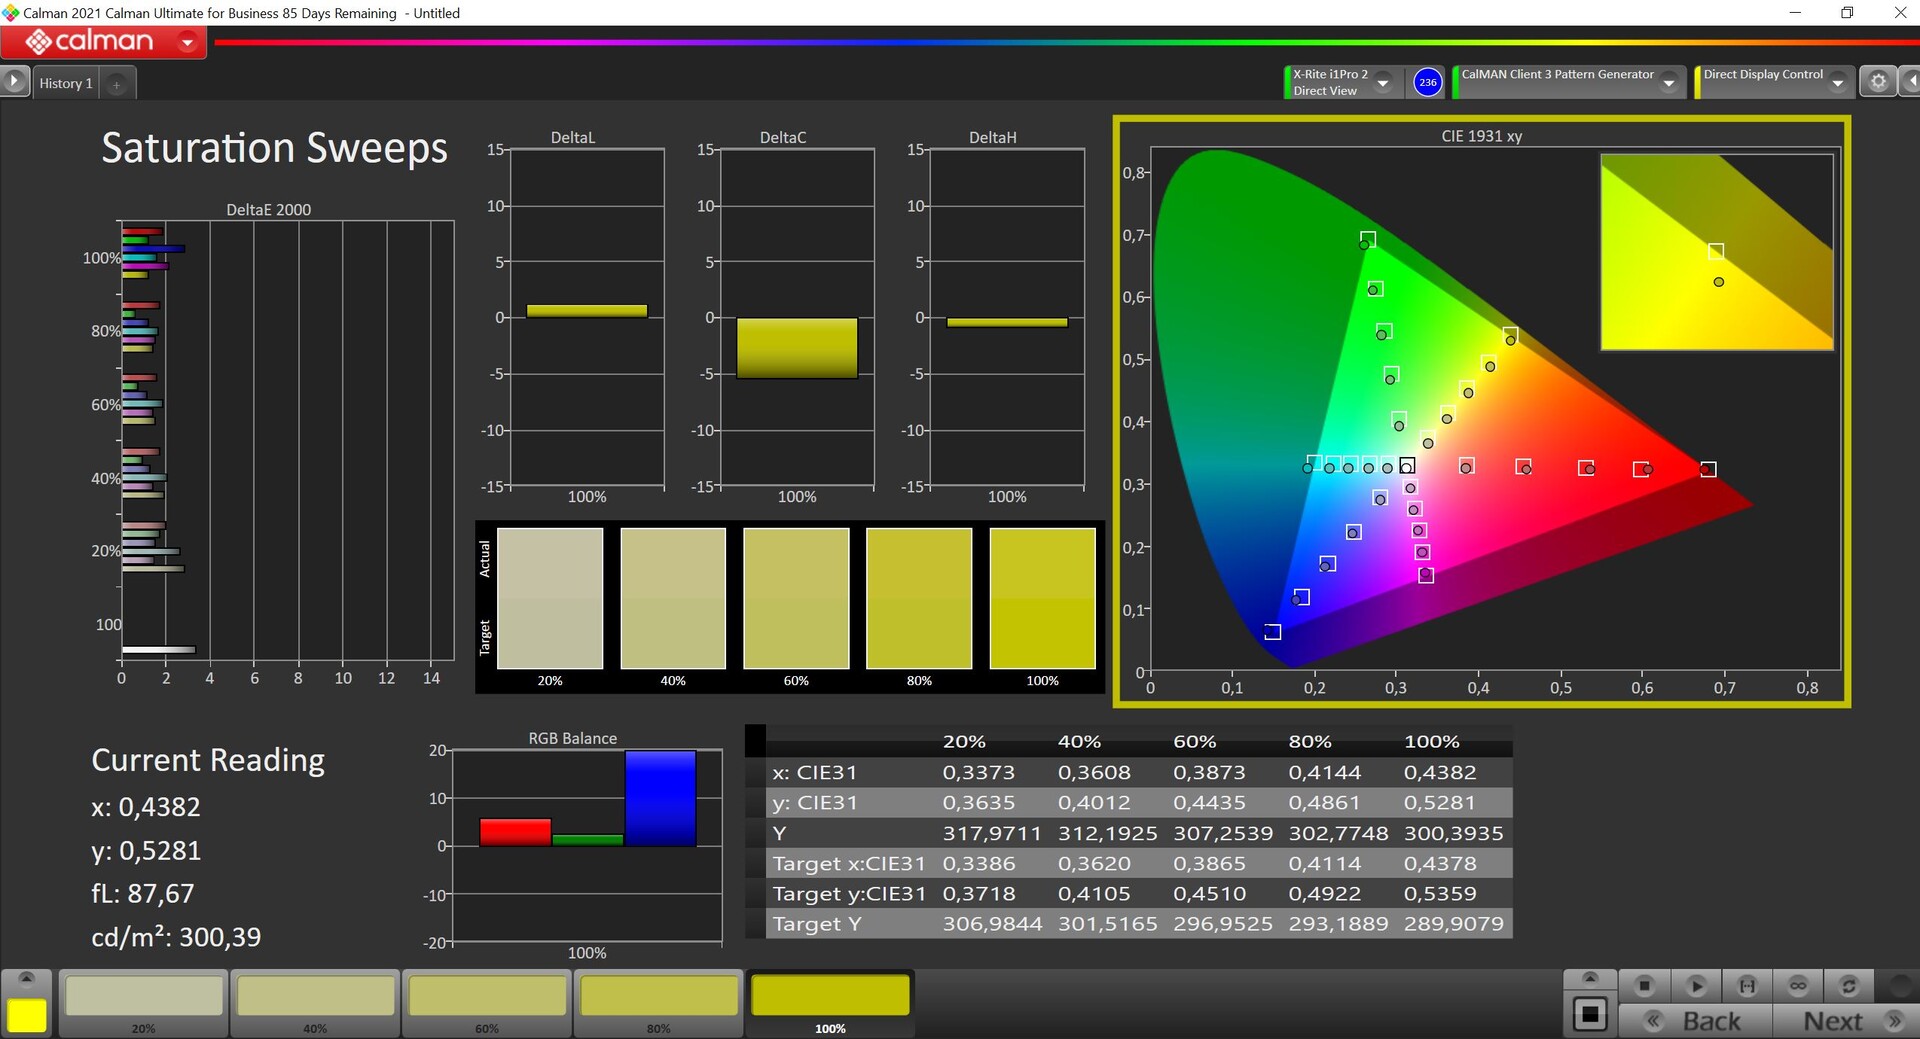
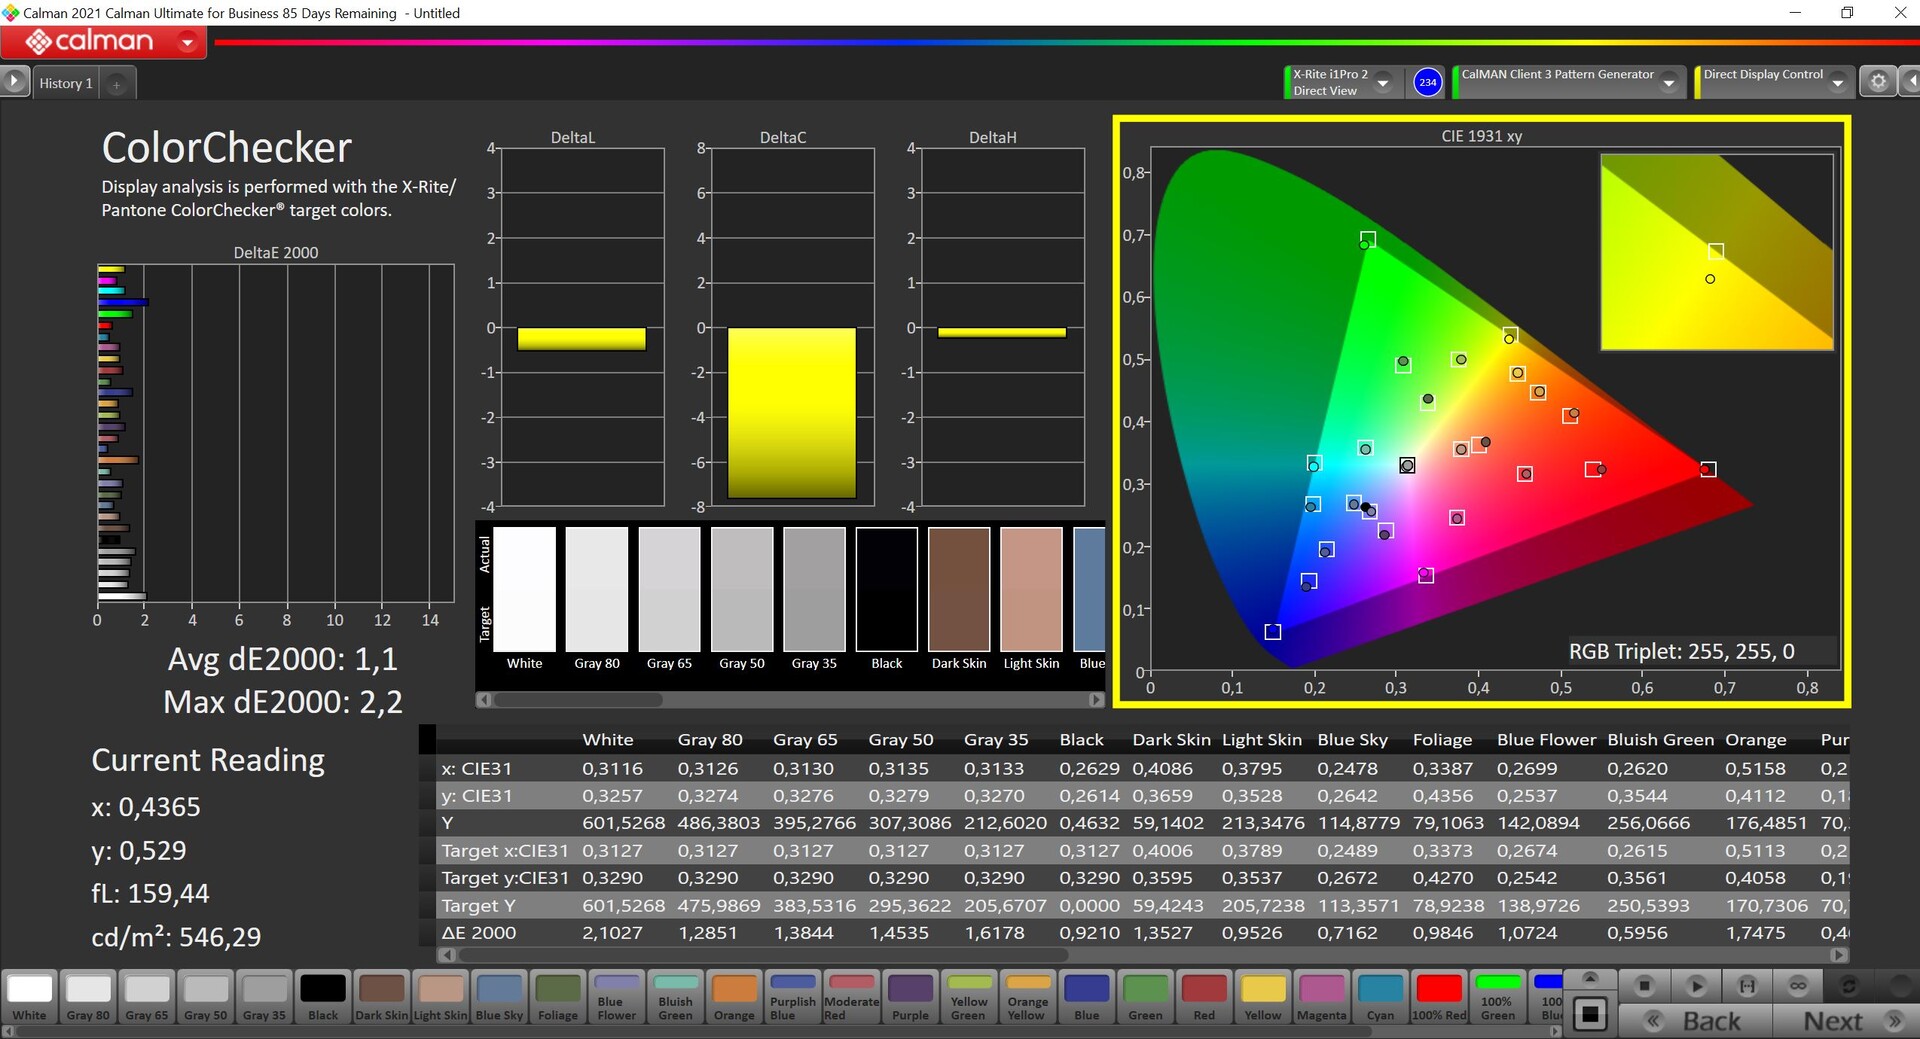
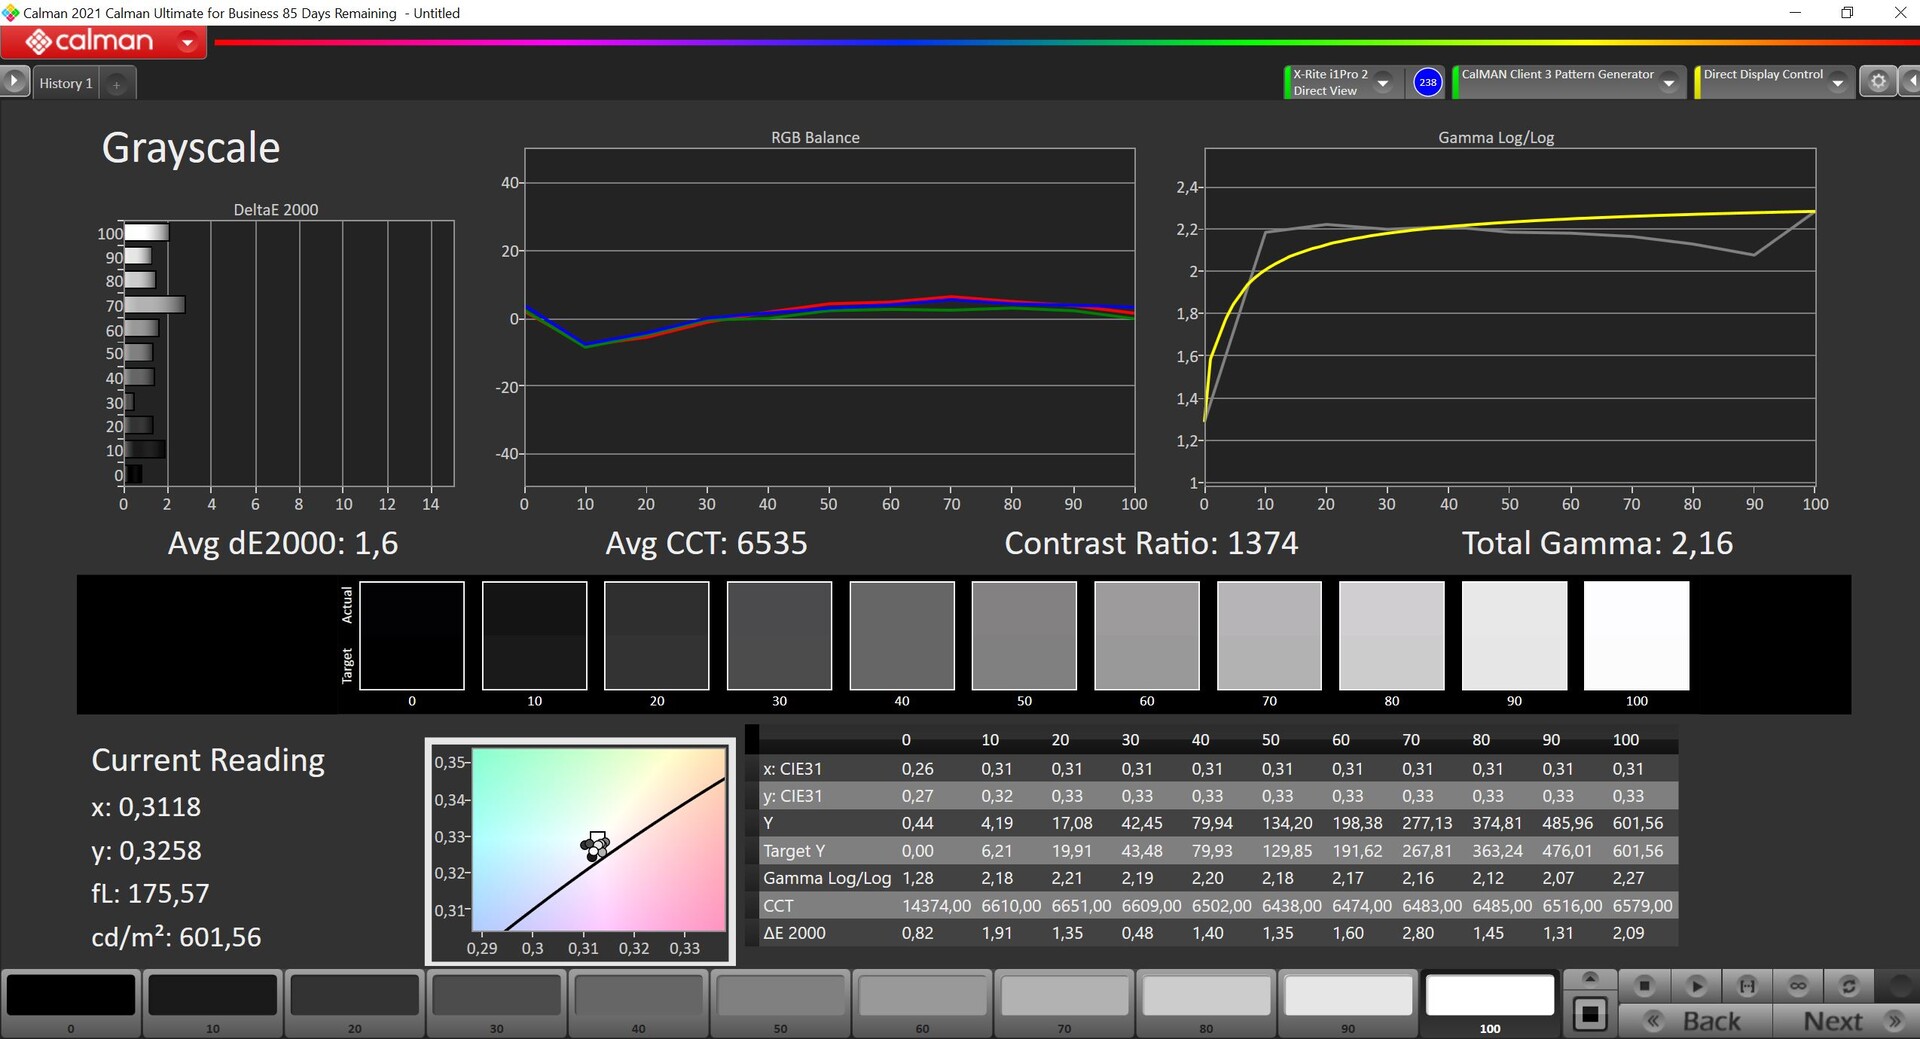
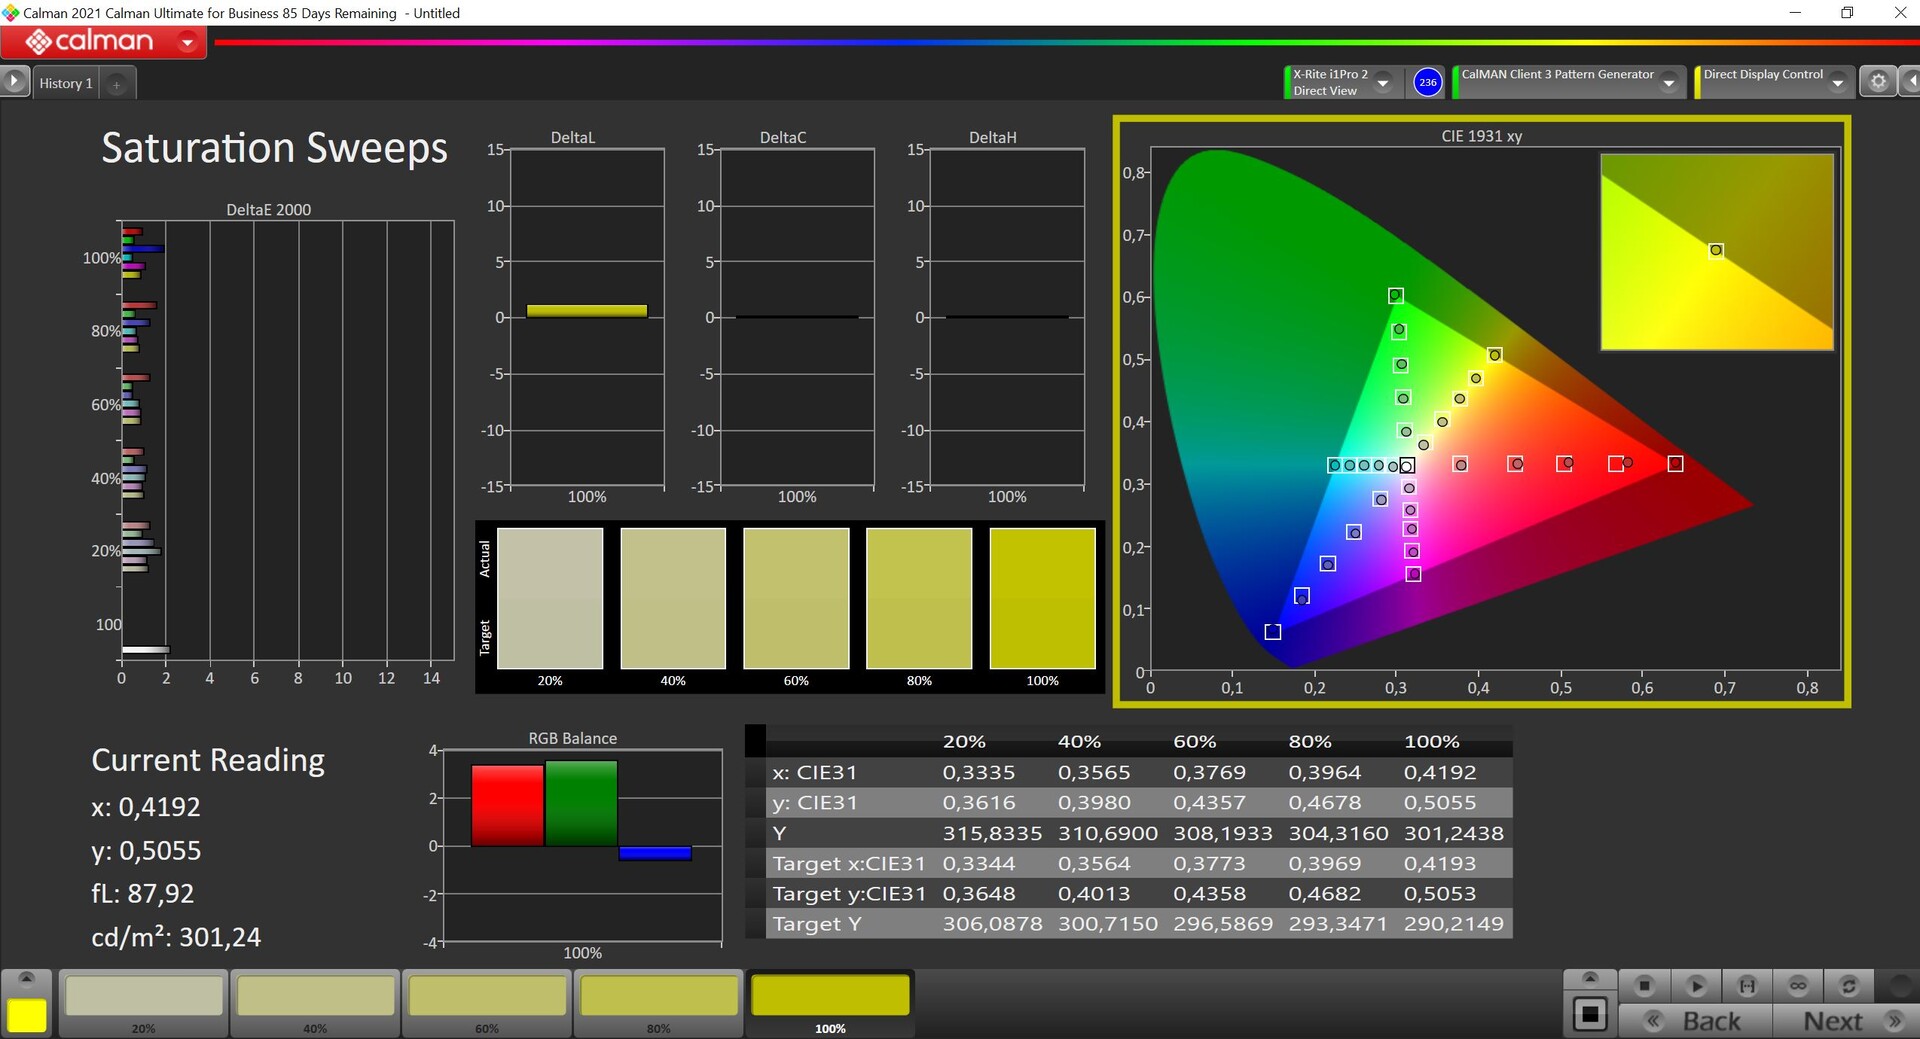
华为继续使用3:2的IPS显示屏,与前代产品一样。前辈,但将屏幕对角线从13.9英寸增加到14.2英寸。分辨率也是最小的,为3120x2080像素,导致264DPI的高像素密度。电容式触摸屏的主观画面印象非常好,因为色彩显得非常丰富,内容非常清晰。此外,该显示器提供了更高的刷新率,即90赫兹,这使得在视觉媒体播放过程中的画面印象更加流畅。然而,这必须首先在显示器设置中或通过Fn+R组合键手动激活。亮度可以通过传感器自动控制,色温也可以根据照明条件调整。
华为规定的亮度为500cd/m²,我们的评测样本很容易就超过了这个亮度,平均亮度接近590cd/m²。这使该面板比许多OLED屏幕更具优势,后者在正常SDR模式下通常只能达到400cd/m²。IPS面板的黑值(0.39)和对比度(>1,500:1)当然不如OLED,但性能仍然非常好。你只有在黑暗背景的最大亮度下才能真正看到光晕,这在实践中应该不会太经常发生。对于IPS面板来说,响应时间非常好,没有检测到PWM闪烁。
该面板还支持HDR内容,但这也必须先在Windows设置中激活。相应的HDR内容的播放工作正常,但主观上,HDR图像在OLED或迷你LED面板上看起来更好,这主要是由于更高的对比度。
| |||||||||||||||||||||||||
Brightness Distribution: 91 %
Center on Battery: 598 cd/m²
Contrast: 1546:1 (Black: 0.39 cd/m²)
ΔE ColorChecker Calman: 1.1 | ∀{0.5-29.43 Ø4.73}
calibrated: 1.2
ΔE Greyscale Calman: 1.5 | ∀{0.09-98 Ø4.97}
86.5% AdobeRGB 1998 (Argyll 3D)
99.5% sRGB (Argyll 3D)
94.6% Display P3 (Argyll 3D)
Gamma: 2.17
CCT: 6549 K
| Huawei MateBook X Pro 2022 TMX1422, IPS, 3120x2080, 14.2" | Apple MacBook Air M2 Entry IPS, 2560x1664, 13.6" | Lenovo Yoga 9i 14 2022 i7-1260P LEN140WQUXGA, OLED, 3840x2400, 14" | Asus Zenbook S 13 OLED SDC4172, OLED, 2880x1800, 13.3" | Dell XPS 13 Plus 9320 4K LQ134R1, IPS, 3840x2400, 13.4" | Huawei MateBook X Pro 2021 TIANMA XM, IPS, 3000x2000, 13.9" | |
|---|---|---|---|---|---|---|
| Display | 2% | 6% | 6% | -10% | -20% | |
| Display P3 Coverage (%) | 94.6 | 98.4 4% | 98.7 4% | 99.8 5% | 76.5 -19% | 64.9 -31% |
| sRGB Coverage (%) | 99.5 | 99.9 0% | 99.8 0% | 100 1% | 100 1% | 94.4 -5% |
| AdobeRGB 1998 Coverage (%) | 86.5 | 87.6 1% | 98.5 14% | 97.8 13% | 76 -12% | 66.3 -23% |
| Response Times | -38% | 87% | 91% | -41% | -51% | |
| Response Time Grey 50% / Grey 80% * (ms) | 25.4 ? | 32.9 ? -30% | 2.8 ? 89% | 2.1 ? 92% | 38.9 ? -53% | 37.6 ? -48% |
| Response Time Black / White * (ms) | 17.1 ? | 24.9 ? -46% | 2.8 ? 84% | 1.68 ? 90% | 21.9 ? -28% | 26.4 ? -54% |
| PWM Frequency (Hz) | 239.2 ? | 240.4 ? | ||||
| Screen | -8% | 2867% | 95% | -45% | -14% | |
| Brightness middle (cd/m²) | 603 | 526 -13% | 361 -40% | 336 -44% | 494 -18% | 502 -17% |
| Brightness (cd/m²) | 586 | 486 -17% | 362 -38% | 338 -42% | 474 -19% | 474 -19% |
| Brightness Distribution (%) | 91 | 87 -4% | 98 8% | 99 9% | 89 -2% | 89 -2% |
| Black Level * (cd/m²) | 0.39 | 0.38 3% | 0.001 100% | 0.02 95% | 0.28 28% | 0.33 15% |
| Contrast (:1) | 1546 | 1384 -10% | 361000 23251% | 16800 987% | 1764 14% | 1521 -2% |
| Colorchecker dE 2000 * | 1.1 | 1.3 -18% | 2.8 -155% | 1.8 -64% | 3.1 -182% | 1.35 -23% |
| Colorchecker dE 2000 max. * | 2.2 | 2.7 -23% | 5.8 -164% | 3.8 -73% | 4.2 -91% | 3.67 -67% |
| Colorchecker dE 2000 calibrated * | 1.2 | 0.7 42% | 1.8 -50% | 1.5 -25% | 1.2 -0% | |
| Greyscale dE 2000 * | 1.5 | 2 -33% | 1.9 -27% | 0.9 40% | 3.2 -113% | 1.7 -13% |
| Gamma | 2.17 101% | 2.25 98% | 2.16 102% | 2.22 99% | 2.41 91% | 2.24 98% |
| CCT | 6549 99% | 6858 95% | 6181 105% | 6580 99% | 6189 105% | 6440 101% |
| Color Space (Percent of AdobeRGB 1998) (%) | 61.1 | |||||
| Color Space (Percent of sRGB) (%) | 94.3 | |||||
| Total Average (Program / Settings) | -15% /
-10% | 987% /
1779% | 64% /
76% | -32% /
-37% | -28% /
-21% |
* ... smaller is better
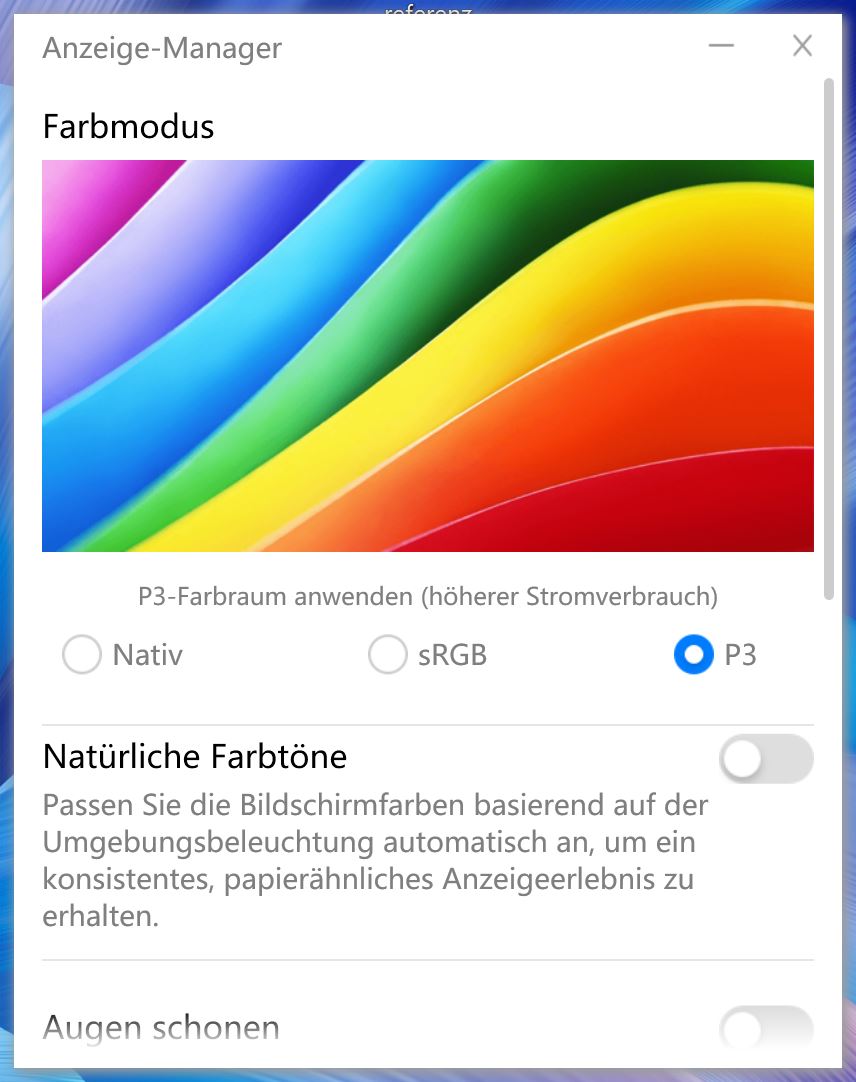
我们用专业的CalMAN软件和X-Rite i1 Pro 2分光光度计测量了显示屏。读者应该注意,华为在出厂时提供了三种不同的配置文件。本地(P3)、sRGB和P3。在决定使用P3配置文件之前,我们测量了所有这三种配置文件。尽管原生配置文件也将P3作为目标色彩空间,但它显示出更高的偏差,而且主观上产生的色彩更丰富。另一方面,使用P3配置文件,颜色开箱就非常准确,再加上几乎完整的P3覆盖,用户可以进行图片/视频编辑,因为所有的值都已经低于DeltaE-2000的重要偏差3。
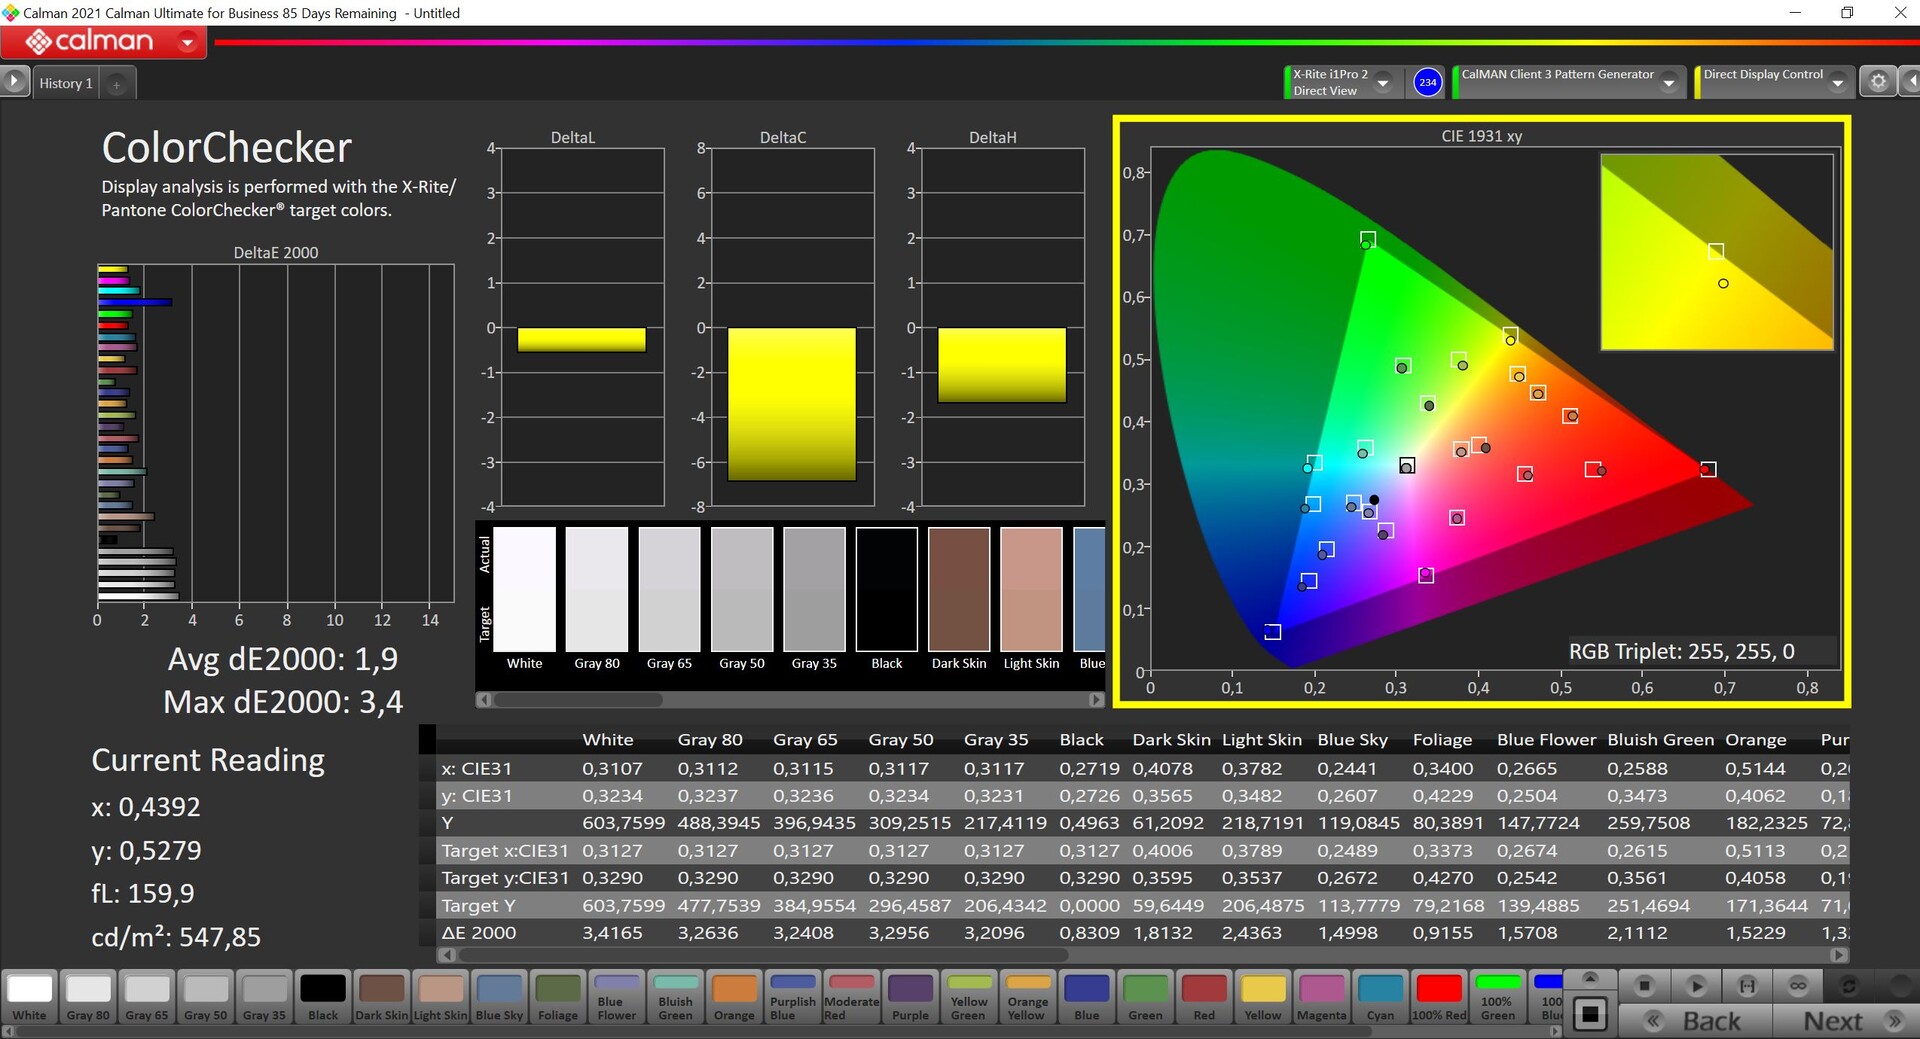


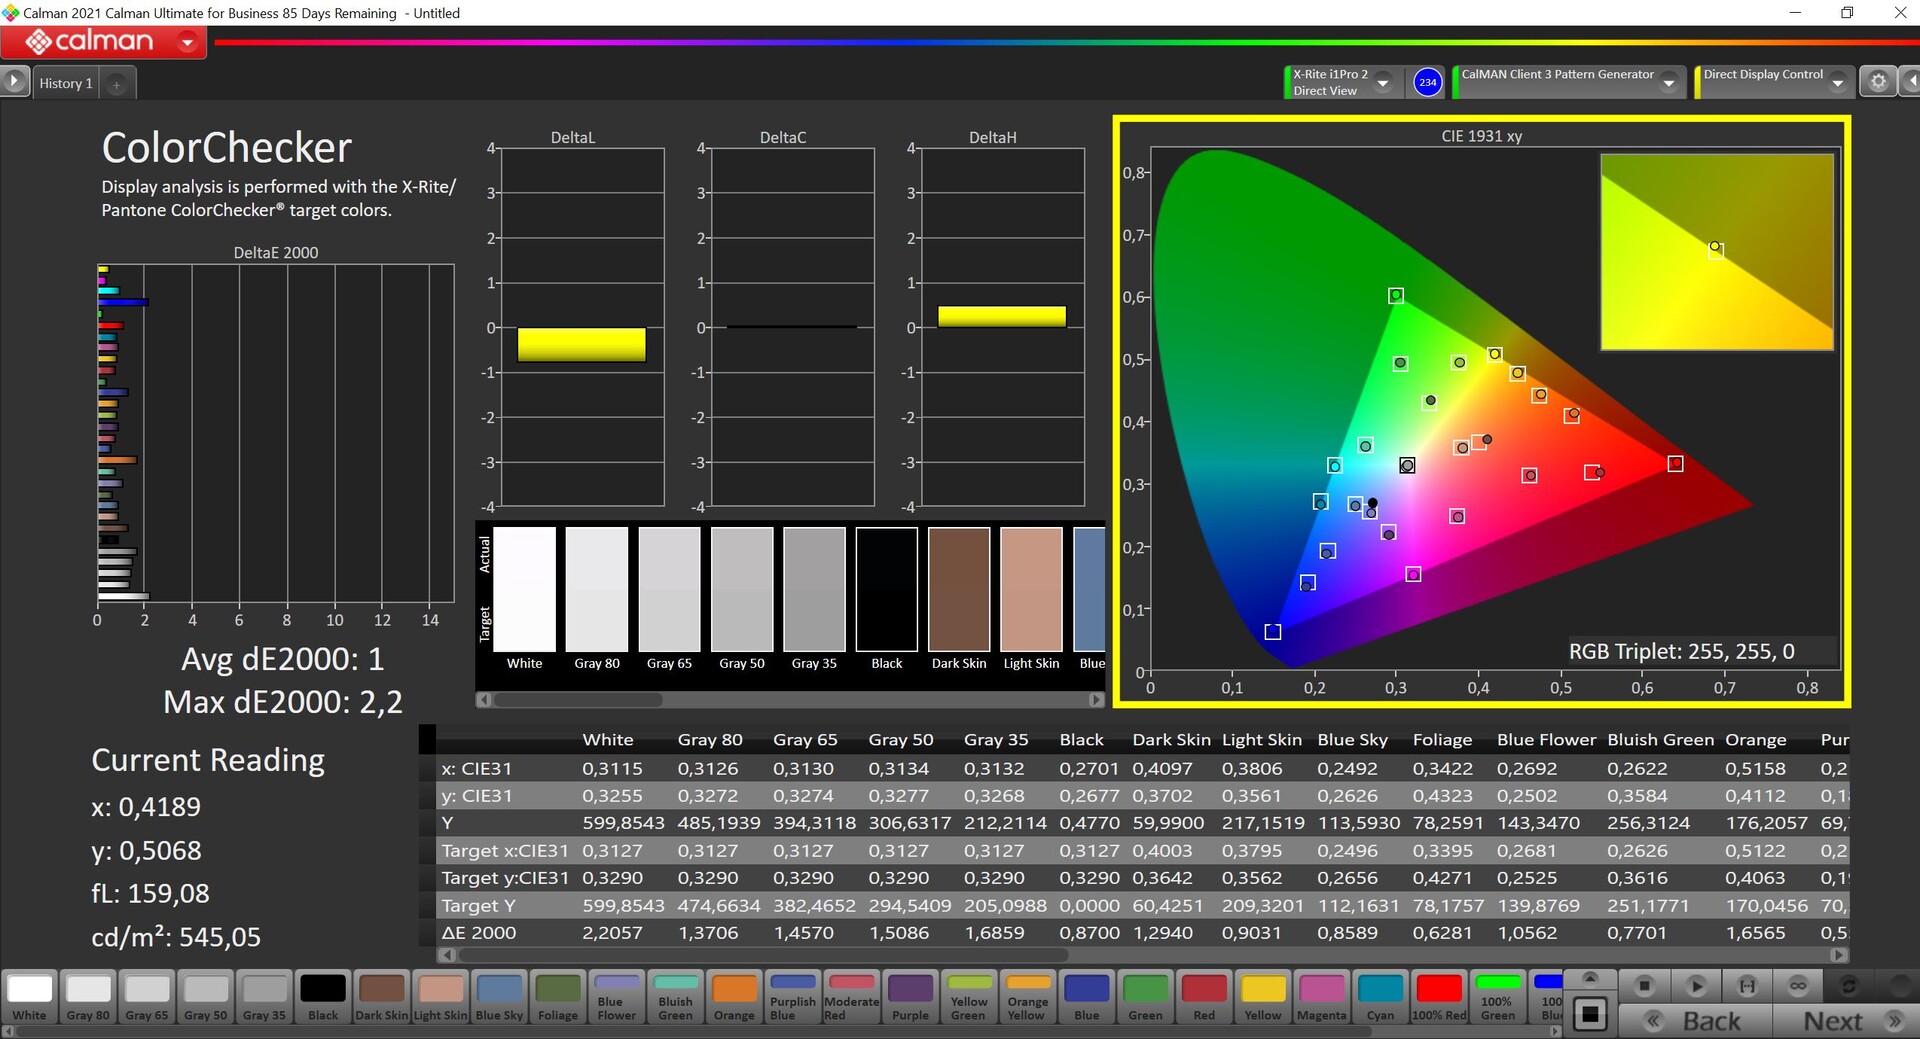


sRGB模式也非常准确,并真正将色彩空间限制在sRGB光谱上。与市场上几乎所有其他消费类笔记本相比,这是一个明显的优势。由于我们自己的校准工作只导致了显示值的下降,所以我们在此不提供相应的配置文件。
Display Response Times
| ↔ Response Time Black to White | ||
|---|---|---|
| 17.1 ms ... rise ↗ and fall ↘ combined | ↗ 8.6 ms rise | 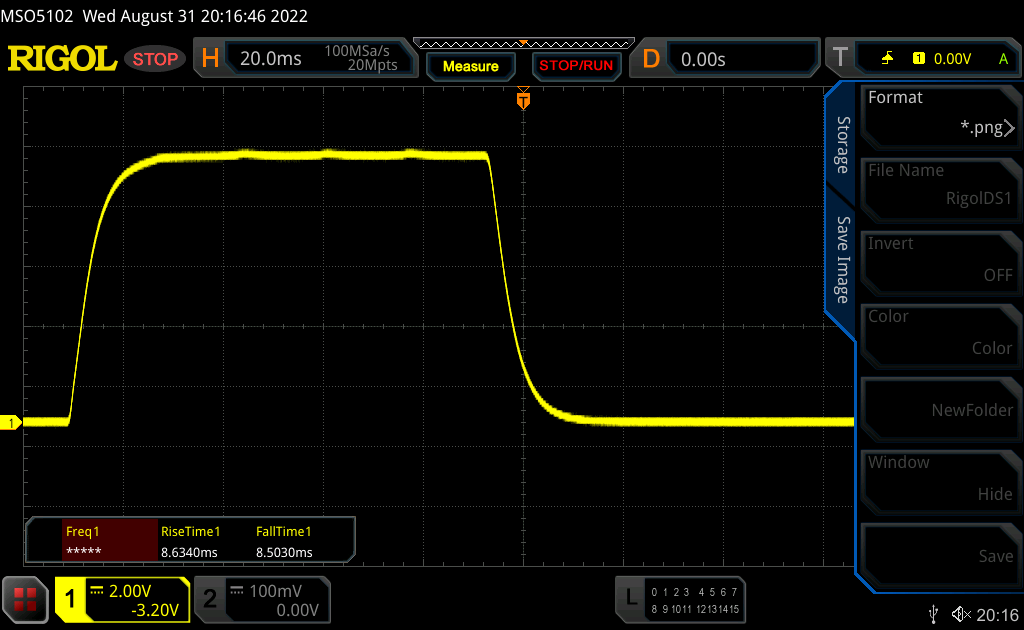 |
| ↘ 8.51 ms fall | ||
| The screen shows good response rates in our tests, but may be too slow for competitive gamers. In comparison, all tested devices range from 0.1 (minimum) to 240 (maximum) ms. » 39 % of all devices are better. This means that the measured response time is better than the average of all tested devices (19.9 ms). | ||
| ↔ Response Time 50% Grey to 80% Grey | ||
| 25.4 ms ... rise ↗ and fall ↘ combined | ↗ 11.7 ms rise | 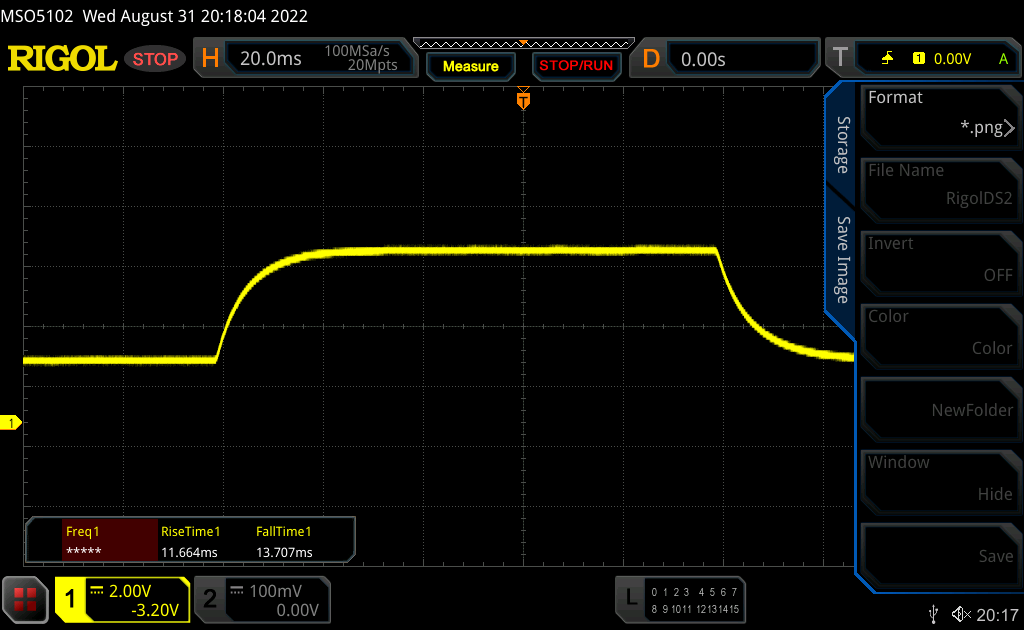 |
| ↘ 13.7 ms fall | ||
| The screen shows relatively slow response rates in our tests and may be too slow for gamers. In comparison, all tested devices range from 0.165 (minimum) to 636 (maximum) ms. » 36 % of all devices are better. This means that the measured response time is better than the average of all tested devices (31.1 ms). | ||
Screen Flickering / PWM (Pulse-Width Modulation)
| Screen flickering / PWM not detected | 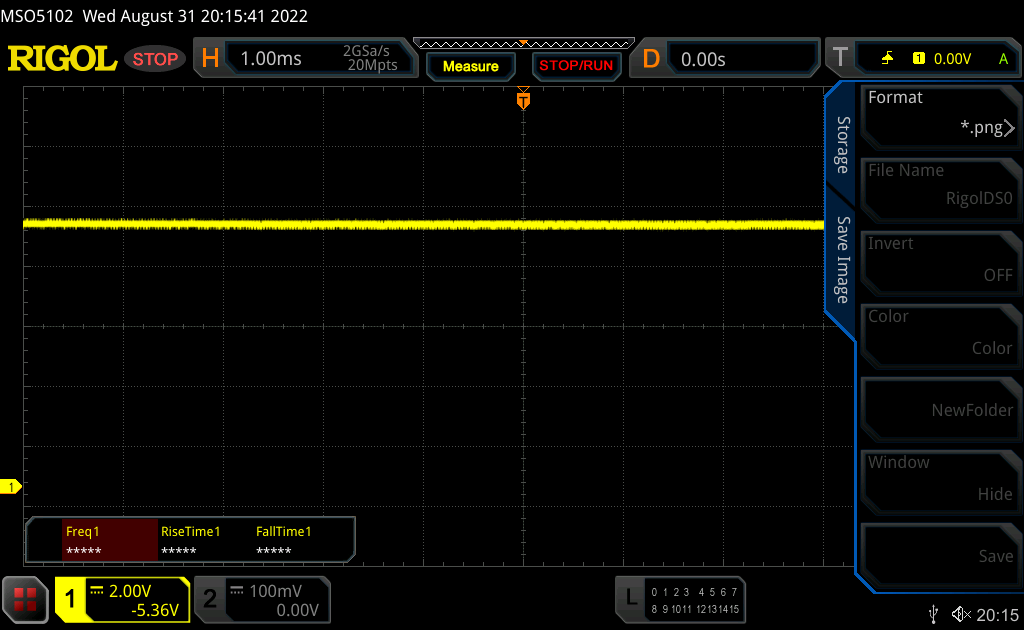 | ||
In comparison: 52 % of all tested devices do not use PWM to dim the display. If PWM was detected, an average of 7794 (minimum: 5 - maximum: 343500) Hz was measured. | |||
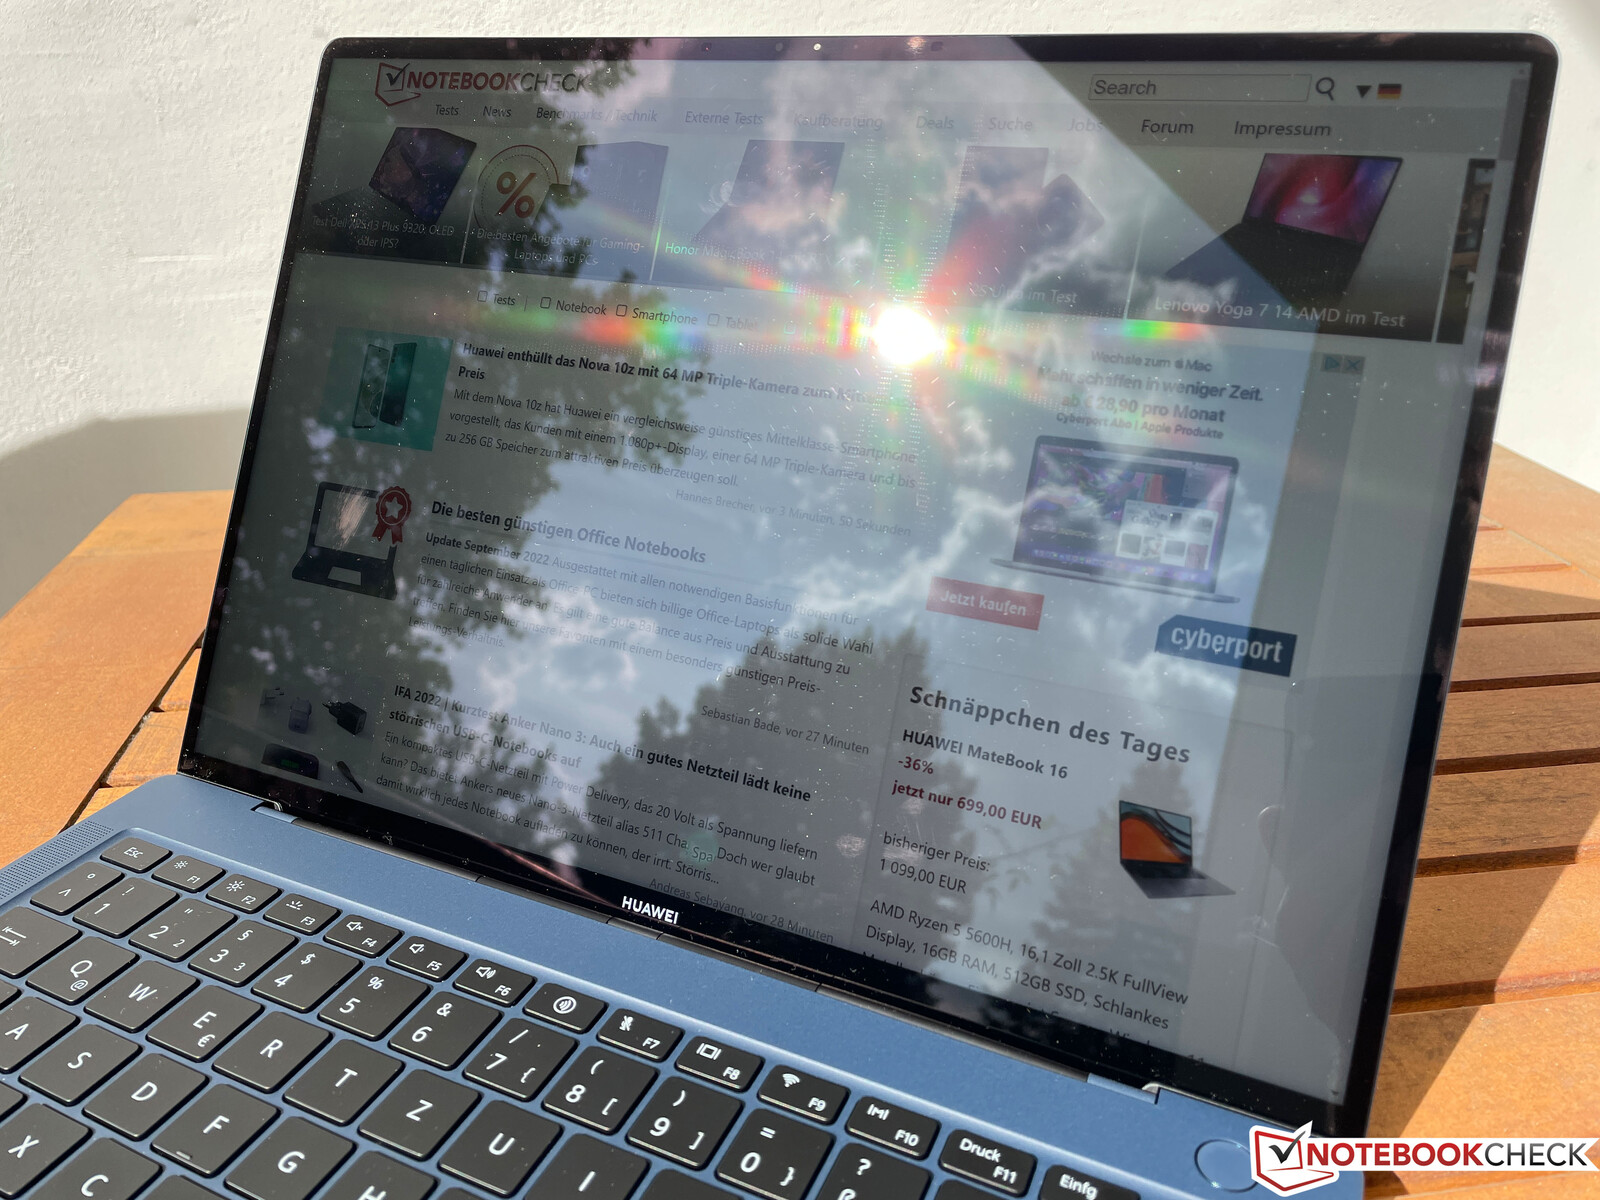
光滑的触摸屏在户外自然会遇到反光的问题,但面板的反光性并不像最近评测的那样,例如 Honor 魔法书14.此外,屏幕的高亮度也有助于补偿可能的反射。即使在明亮的日子里,你也应该能够找到可以合理观看内容的位置。另一方面,阴天也不会造成任何问题。
性能 - Alder Lake-P,但没有PCIe 4.0
测试条件
像往常一样,预装的PC管理器提供两种性能模式,默认情况下,平衡 模式被激活。性能 模式可作为可选的替代方案,但仅在主电源运行时可用。我们在下面的表格中列出了处理器的TDP值。基准测试和测量是在性能 模式下进行的,但你当然可以使用平衡 模式,以便安心,并受益于更安静的风扇,特别是在日常使用中。
| 模式 | CPU负载 | 最大风扇噪音 |
|---|---|---|
| 平衡 | 64瓦 -> 25瓦 | 33,4 dB(A) |
| 性能 | 64瓦 -> 30瓦 | 40,6 -> 38,2 dB(A) |
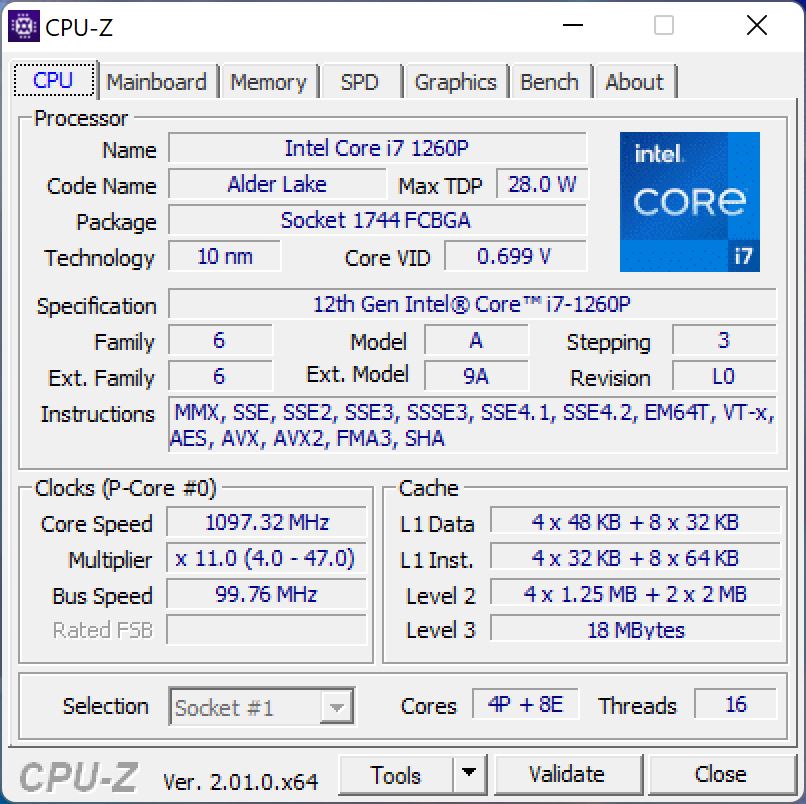
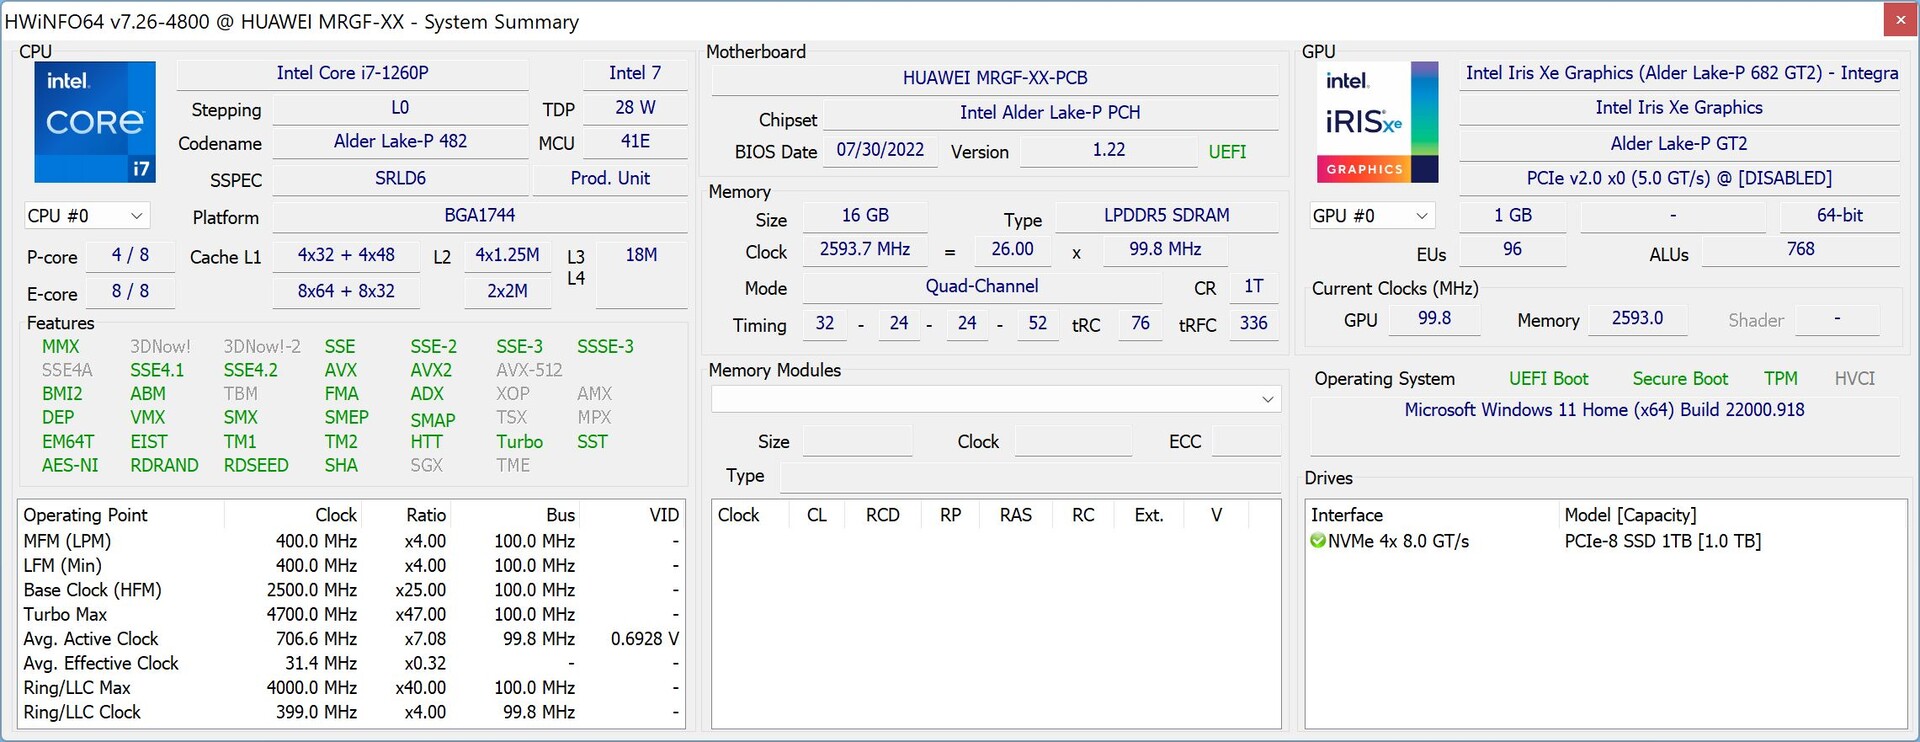
处理器 - 酷睿i7-1260P
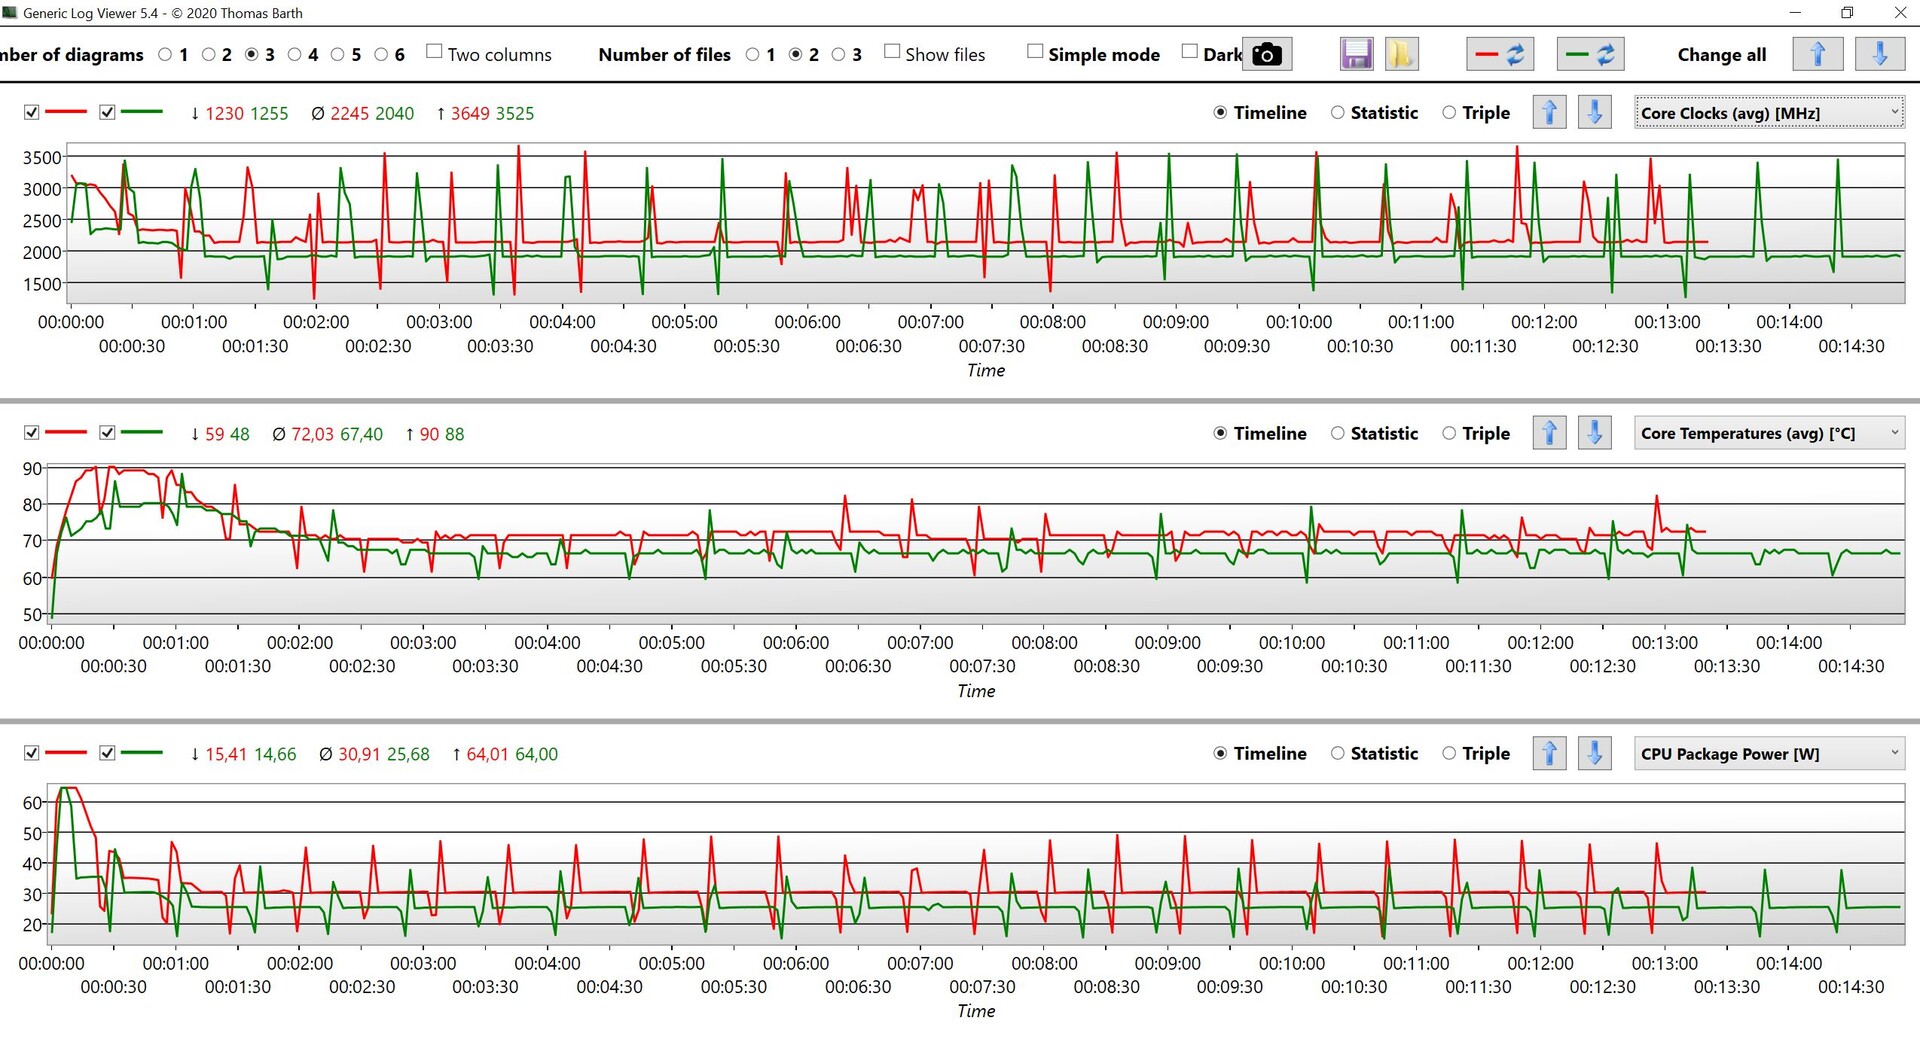
芯片 酷睿i7-1260P是英特尔桤木湖P系列中第二快的处理器,仅次于 酷睿i7-1280P并提供一个由4个快速性能核心和8个效率核心组成的混合架构。如前所述,最大短期消耗为64瓦,这也是英特尔桤木湖-P芯片的最大极限。然而,这对于所有核心的最大时钟来说仍然是不够的。
几秒钟后,根据所选择的电源模式,消耗量平息在30或25瓦,然后稳定在这个水平。因此,MateBook X Pro不是恒定负载下最快的设备之一,但它在日常使用和短期基准测试中自然会受益于高功率限制和新性能核心的高单核性能。 前代产品 前辈。搭配其 Tiger Lake 酷睿i7-1165G7迅速节流到18瓦,并提供明显较低的多核性能。
在电池模式下,该处理器能够消耗最大40瓦,然后稳定在25瓦,这相当于主电源操作中的平衡 模式水平。进一步的CPU基准测试可在我们的技术部分.
Cinebench R15 Multi Sustained Load
Cinebench R23: Multi Core | Single Core
Cinebench R20: CPU (Multi Core) | CPU (Single Core)
Cinebench R15: CPU Multi 64Bit | CPU Single 64Bit
Blender: v2.79 BMW27 CPU
7-Zip 18.03: 7z b 4 | 7z b 4 -mmt1
Geekbench 5.5: Multi-Core | Single-Core
HWBOT x265 Benchmark v2.2: 4k Preset
LibreOffice : 20 Documents To PDF
R Benchmark 2.5: Overall mean
| CPU Performance rating | |
| Average of class Subnotebook | |
| Lenovo Yoga 9i 14 2022 i7-1260P | |
| Huawei MateBook X Pro 2022 | |
| Dell XPS 13 Plus 9320 4K | |
| Asus Zenbook S 13 OLED | |
| Average Intel Core i7-1260P | |
| Apple MacBook Air M2 10C GPU -5! | |
| Huawei MateBook X Pro 2021 | |
| Cinebench R23 / Multi Core | |
| Average of class Subnotebook (1555 - 21812, n=60, last 2 years) | |
| Lenovo Yoga 9i 14 2022 i7-1260P | |
| Asus Zenbook S 13 OLED | |
| Dell XPS 13 Plus 9320 4K | |
| Average Intel Core i7-1260P (3173 - 12150, n=27) | |
| Huawei MateBook X Pro 2022 | |
| Apple MacBook Air M2 10C GPU | |
| Huawei MateBook X Pro 2021 | |
| Cinebench R23 / Single Core | |
| Lenovo Yoga 9i 14 2022 i7-1260P | |
| Average of class Subnotebook (358 - 2213, n=61, last 2 years) | |
| Dell XPS 13 Plus 9320 4K | |
| Average Intel Core i7-1260P (1155 - 1812, n=25) | |
| Huawei MateBook X Pro 2022 | |
| Apple MacBook Air M2 10C GPU | |
| Asus Zenbook S 13 OLED | |
| Huawei MateBook X Pro 2021 | |
| Cinebench R20 / CPU (Multi Core) | |
| Average of class Subnotebook (579 - 8541, n=57, last 2 years) | |
| Asus Zenbook S 13 OLED | |
| Lenovo Yoga 9i 14 2022 i7-1260P | |
| Dell XPS 13 Plus 9320 4K | |
| Huawei MateBook X Pro 2022 | |
| Average Intel Core i7-1260P (1234 - 4748, n=25) | |
| Apple MacBook Air M2 10C GPU | |
| Huawei MateBook X Pro 2021 | |
| Cinebench R20 / CPU (Single Core) | |
| Huawei MateBook X Pro 2022 | |
| Lenovo Yoga 9i 14 2022 i7-1260P | |
| Average of class Subnotebook (128 - 832, n=57, last 2 years) | |
| Dell XPS 13 Plus 9320 4K | |
| Average Intel Core i7-1260P (448 - 698, n=25) | |
| Asus Zenbook S 13 OLED | |
| Huawei MateBook X Pro 2021 | |
| Apple MacBook Air M2 10C GPU | |
| Cinebench R15 / CPU Multi 64Bit | |
| Average of class Subnotebook (327 - 3345, n=57, last 2 years) | |
| Huawei MateBook X Pro 2022 | |
| Huawei MateBook X Pro 2022 | |
| Lenovo Yoga 9i 14 2022 i7-1260P | |
| Asus Zenbook S 13 OLED | |
| Dell XPS 13 Plus 9320 4K | |
| Dell XPS 13 Plus 9320 4K | |
| Average Intel Core i7-1260P (549 - 2034, n=29) | |
| Apple MacBook Air M2 10C GPU | |
| Huawei MateBook X Pro 2021 | |
| Cinebench R15 / CPU Single 64Bit | |
| Average of class Subnotebook (72.4 - 322, n=57, last 2 years) | |
| Huawei MateBook X Pro 2022 | |
| Lenovo Yoga 9i 14 2022 i7-1260P | |
| Dell XPS 13 Plus 9320 4K | |
| Asus Zenbook S 13 OLED | |
| Average Intel Core i7-1260P (165.4 - 260, n=27) | |
| Apple MacBook Air M2 10C GPU | |
| Huawei MateBook X Pro 2021 | |
| Blender / v2.79 BMW27 CPU | |
| Huawei MateBook X Pro 2021 | |
| Apple MacBook Air M2 10C GPU | |
| Average of class Subnotebook (159 - 2271, n=58, last 2 years) | |
| Average Intel Core i7-1260P (264 - 906, n=26) | |
| Huawei MateBook X Pro 2022 | |
| Dell XPS 13 Plus 9320 4K | |
| Asus Zenbook S 13 OLED | |
| Lenovo Yoga 9i 14 2022 i7-1260P | |
| 7-Zip 18.03 / 7z b 4 | |
| Asus Zenbook S 13 OLED | |
| Lenovo Yoga 9i 14 2022 i7-1260P | |
| Average of class Subnotebook (11668 - 77867, n=57, last 2 years) | |
| Dell XPS 13 Plus 9320 4K | |
| Huawei MateBook X Pro 2022 | |
| Average Intel Core i7-1260P (16146 - 47064, n=25) | |
| Huawei MateBook X Pro 2021 | |
| 7-Zip 18.03 / 7z b 4 -mmt1 | |
| Average of class Subnotebook (2643 - 6699, n=59, last 2 years) | |
| Asus Zenbook S 13 OLED | |
| Huawei MateBook X Pro 2022 | |
| Dell XPS 13 Plus 9320 4K | |
| Average Intel Core i7-1260P (4064 - 5791, n=25) | |
| Lenovo Yoga 9i 14 2022 i7-1260P | |
| Huawei MateBook X Pro 2021 | |
| Geekbench 5.5 / Multi-Core | |
| Average of class Subnotebook (2557 - 17218, n=48, last 2 years) | |
| Lenovo Yoga 9i 14 2022 i7-1260P | |
| Huawei MateBook X Pro 2022 | |
| Dell XPS 13 Plus 9320 4K | |
| Apple MacBook Air M2 10C GPU | |
| Average Intel Core i7-1260P (3866 - 10570, n=25) | |
| Asus Zenbook S 13 OLED | |
| Huawei MateBook X Pro 2021 | |
| Geekbench 5.5 / Single-Core | |
| Apple MacBook Air M2 10C GPU | |
| Average of class Subnotebook (726 - 2224, n=48, last 2 years) | |
| Lenovo Yoga 9i 14 2022 i7-1260P | |
| Huawei MateBook X Pro 2022 | |
| Dell XPS 13 Plus 9320 4K | |
| Average Intel Core i7-1260P (1436 - 1786, n=25) | |
| Asus Zenbook S 13 OLED | |
| Huawei MateBook X Pro 2021 | |
| HWBOT x265 Benchmark v2.2 / 4k Preset | |
| Average of class Subnotebook (0.97 - 25.1, n=57, last 2 years) | |
| Asus Zenbook S 13 OLED | |
| Lenovo Yoga 9i 14 2022 i7-1260P | |
| Dell XPS 13 Plus 9320 4K | |
| Huawei MateBook X Pro 2022 | |
| Average Intel Core i7-1260P (3.45 - 13.6, n=26) | |
| Huawei MateBook X Pro 2021 | |
| LibreOffice / 20 Documents To PDF | |
| Average of class Subnotebook (39.9 - 220, n=56, last 2 years) | |
| Asus Zenbook S 13 OLED | |
| Average Intel Core i7-1260P (40.2 - 65.7, n=25) | |
| Lenovo Yoga 9i 14 2022 i7-1260P | |
| Huawei MateBook X Pro 2021 | |
| Dell XPS 13 Plus 9320 4K | |
| Huawei MateBook X Pro 2022 | |
| R Benchmark 2.5 / Overall mean | |
| Huawei MateBook X Pro 2021 | |
| Average of class Subnotebook (0.4024 - 1.456, n=58, last 2 years) | |
| Asus Zenbook S 13 OLED | |
| Average Intel Core i7-1260P (0.4559 - 0.727, n=25) | |
| Lenovo Yoga 9i 14 2022 i7-1260P | |
| Dell XPS 13 Plus 9320 4K | |
| Huawei MateBook X Pro 2022 | |
* ... smaller is better
AIDA64: FP32 Ray-Trace | FPU Julia | CPU SHA3 | CPU Queen | FPU SinJulia | FPU Mandel | CPU AES | CPU ZLib | FP64 Ray-Trace | CPU PhotoWorxx
| Performance rating | |
| Asus Zenbook S 13 OLED | |
| Average of class Subnotebook | |
| Average Intel Core i7-1260P | |
| Huawei MateBook X Pro 2022 | |
| Dell XPS 13 Plus 9320 4K | |
| Huawei MateBook X Pro 2021 | |
| Lenovo Yoga 9i 14 2022 i7-1260P | |
| AIDA64 / FP32 Ray-Trace | |
| Average of class Subnotebook (1135 - 32888, n=58, last 2 years) | |
| Asus Zenbook S 13 OLED | |
| Average Intel Core i7-1260P (2176 - 10898, n=26) | |
| Dell XPS 13 Plus 9320 4K | |
| Lenovo Yoga 9i 14 2022 i7-1260P | |
| Huawei MateBook X Pro 2021 | |
| Huawei MateBook X Pro 2022 | |
| AIDA64 / FPU Julia | |
| Asus Zenbook S 13 OLED | |
| Average of class Subnotebook (5218 - 123315, n=58, last 2 years) | |
| Average Intel Core i7-1260P (11015 - 56906, n=26) | |
| Dell XPS 13 Plus 9320 4K | |
| Huawei MateBook X Pro 2022 | |
| Lenovo Yoga 9i 14 2022 i7-1260P | |
| Huawei MateBook X Pro 2021 | |
| AIDA64 / CPU SHA3 | |
| Average of class Subnotebook (444 - 5287, n=58, last 2 years) | |
| Asus Zenbook S 13 OLED | |
| Lenovo Yoga 9i 14 2022 i7-1260P | |
| Average Intel Core i7-1260P (669 - 2709, n=26) | |
| Dell XPS 13 Plus 9320 4K | |
| Huawei MateBook X Pro 2022 | |
| Huawei MateBook X Pro 2021 | |
| AIDA64 / CPU Queen | |
| Asus Zenbook S 13 OLED | |
| Huawei MateBook X Pro 2022 | |
| Dell XPS 13 Plus 9320 4K | |
| Average Intel Core i7-1260P (42571 - 82493, n=26) | |
| Average of class Subnotebook (10579 - 95002, n=51, last 2 years) | |
| Huawei MateBook X Pro 2021 | |
| Lenovo Yoga 9i 14 2022 i7-1260P | |
| AIDA64 / FPU SinJulia | |
| Asus Zenbook S 13 OLED | |
| Average of class Subnotebook (744 - 18418, n=58, last 2 years) | |
| Huawei MateBook X Pro 2022 | |
| Dell XPS 13 Plus 9320 4K | |
| Average Intel Core i7-1260P (2901 - 6975, n=26) | |
| Lenovo Yoga 9i 14 2022 i7-1260P | |
| Huawei MateBook X Pro 2021 | |
| AIDA64 / FPU Mandel | |
| Asus Zenbook S 13 OLED | |
| Average of class Subnotebook (3341 - 65433, n=58, last 2 years) | |
| Average Intel Core i7-1260P (5950 - 26376, n=26) | |
| Dell XPS 13 Plus 9320 4K | |
| Huawei MateBook X Pro 2022 | |
| Huawei MateBook X Pro 2021 | |
| Lenovo Yoga 9i 14 2022 i7-1260P | |
| AIDA64 / CPU AES | |
| Asus Zenbook S 13 OLED | |
| Huawei MateBook X Pro 2022 | |
| Average of class Subnotebook (638 - 96917, n=58, last 2 years) | |
| Huawei MateBook X Pro 2021 | |
| Average Intel Core i7-1260P (16041 - 92356, n=26) | |
| Dell XPS 13 Plus 9320 4K | |
| Lenovo Yoga 9i 14 2022 i7-1260P | |
| AIDA64 / CPU ZLib | |
| Average of class Subnotebook (164.9 - 1379, n=58, last 2 years) | |
| Lenovo Yoga 9i 14 2022 i7-1260P | |
| Dell XPS 13 Plus 9320 4K | |
| Huawei MateBook X Pro 2022 | |
| Asus Zenbook S 13 OLED | |
| Average Intel Core i7-1260P (259 - 771, n=26) | |
| Huawei MateBook X Pro 2021 | |
| AIDA64 / FP64 Ray-Trace | |
| Average of class Subnotebook (610 - 17495, n=58, last 2 years) | |
| Asus Zenbook S 13 OLED | |
| Average Intel Core i7-1260P (1237 - 5858, n=26) | |
| Dell XPS 13 Plus 9320 4K | |
| Lenovo Yoga 9i 14 2022 i7-1260P | |
| Huawei MateBook X Pro 2022 | |
| Huawei MateBook X Pro 2021 | |
| AIDA64 / CPU PhotoWorxx | |
| Average of class Subnotebook (6569 - 85600, n=58, last 2 years) | |
| Huawei MateBook X Pro 2021 | |
| Dell XPS 13 Plus 9320 4K | |
| Huawei MateBook X Pro 2022 | |
| Average Intel Core i7-1260P (13261 - 43652, n=26) | |
| Asus Zenbook S 13 OLED | |
| Lenovo Yoga 9i 14 2022 i7-1260P | |
系统性能
新MateBook X Pro的主观性能印象非常好,并被良好的基准测试结果所证实。然而,这里还应该指出,在实践中,最新设备之间几乎没有差异。
CrossMark: Overall | Productivity | Creativity | Responsiveness
| PCMark 10 / Score | |
| Average of class Subnotebook (4920 - 9939, n=44, last 2 years) | |
| Asus Zenbook S 13 OLED | |
| Huawei MateBook X Pro 2022 | |
| Lenovo Yoga 9i 14 2022 i7-1260P | |
| Dell XPS 13 Plus 9320 4K | |
| Average Intel Core i7-1260P, Intel Iris Xe Graphics G7 96EUs (4796 - 6068, n=17) | |
| Huawei MateBook X Pro 2021 | |
| PCMark 10 / Essentials | |
| Lenovo Yoga 9i 14 2022 i7-1260P | |
| Huawei MateBook X Pro 2022 | |
| Asus Zenbook S 13 OLED | |
| Dell XPS 13 Plus 9320 4K | |
| Average of class Subnotebook (8552 - 11646, n=44, last 2 years) | |
| Average Intel Core i7-1260P, Intel Iris Xe Graphics G7 96EUs (9260 - 11251, n=17) | |
| Huawei MateBook X Pro 2021 | |
| PCMark 10 / Productivity | |
| Average of class Subnotebook (5435 - 16606, n=44, last 2 years) | |
| Asus Zenbook S 13 OLED | |
| Huawei MateBook X Pro 2022 | |
| Lenovo Yoga 9i 14 2022 i7-1260P | |
| Average Intel Core i7-1260P, Intel Iris Xe Graphics G7 96EUs (6167 - 8629, n=17) | |
| Dell XPS 13 Plus 9320 4K | |
| Huawei MateBook X Pro 2021 | |
| PCMark 10 / Digital Content Creation | |
| Average of class Subnotebook (5722 - 13779, n=44, last 2 years) | |
| Asus Zenbook S 13 OLED | |
| Lenovo Yoga 9i 14 2022 i7-1260P | |
| Huawei MateBook X Pro 2022 | |
| Dell XPS 13 Plus 9320 4K | |
| Average Intel Core i7-1260P, Intel Iris Xe Graphics G7 96EUs (5231 - 6908, n=17) | |
| Huawei MateBook X Pro 2021 | |
| CrossMark / Overall | |
| Huawei MateBook X Pro 2022 | |
| Lenovo Yoga 9i 14 2022 i7-1260P | |
| Dell XPS 13 Plus 9320 4K | |
| Average of class Subnotebook (365 - 2356, n=60, last 2 years) | |
| Average Intel Core i7-1260P, Intel Iris Xe Graphics G7 96EUs (1484 - 1811, n=16) | |
| Apple MacBook Air M2 10C GPU | |
| Asus Zenbook S 13 OLED | |
| CrossMark / Productivity | |
| Huawei MateBook X Pro 2022 | |
| Lenovo Yoga 9i 14 2022 i7-1260P | |
| Average Intel Core i7-1260P, Intel Iris Xe Graphics G7 96EUs (1486 - 1755, n=16) | |
| Dell XPS 13 Plus 9320 4K | |
| Average of class Subnotebook (364 - 2277, n=60, last 2 years) | |
| Asus Zenbook S 13 OLED | |
| Apple MacBook Air M2 10C GPU | |
| CrossMark / Creativity | |
| Huawei MateBook X Pro 2022 | |
| Dell XPS 13 Plus 9320 4K | |
| Average of class Subnotebook (372 - 2743, n=60, last 2 years) | |
| Lenovo Yoga 9i 14 2022 i7-1260P | |
| Apple MacBook Air M2 10C GPU | |
| Average Intel Core i7-1260P, Intel Iris Xe Graphics G7 96EUs (1451 - 1872, n=16) | |
| Asus Zenbook S 13 OLED | |
| CrossMark / Responsiveness | |
| Huawei MateBook X Pro 2022 | |
| Lenovo Yoga 9i 14 2022 i7-1260P | |
| Average Intel Core i7-1260P, Intel Iris Xe Graphics G7 96EUs (1253 - 1807, n=16) | |
| Dell XPS 13 Plus 9320 4K | |
| Average of class Subnotebook (312 - 1854, n=60, last 2 years) | |
| Asus Zenbook S 13 OLED | |
| Apple MacBook Air M2 10C GPU | |
| PCMark 10 Score | 6068 points | |
Help | ||
| AIDA64 / Memory Copy | |
| Average of class Subnotebook (14554 - 131023, n=58, last 2 years) | |
| Dell XPS 13 Plus 9320 4K | |
| Huawei MateBook X Pro 2021 | |
| Huawei MateBook X Pro 2022 | |
| Average Intel Core i7-1260P (25125 - 71544, n=25) | |
| Asus Zenbook S 13 OLED | |
| AIDA64 / Memory Read | |
| Average of class Subnotebook (15948 - 127174, n=58, last 2 years) | |
| Huawei MateBook X Pro 2022 | |
| Huawei MateBook X Pro 2021 | |
| Dell XPS 13 Plus 9320 4K | |
| Average Intel Core i7-1260P (24983 - 72065, n=25) | |
| Asus Zenbook S 13 OLED | |
| AIDA64 / Memory Write | |
| Average of class Subnotebook (15709 - 135141, n=58, last 2 years) | |
| Huawei MateBook X Pro 2021 | |
| Dell XPS 13 Plus 9320 4K | |
| Huawei MateBook X Pro 2022 | |
| Average Intel Core i7-1260P (23512 - 66799, n=25) | |
| Asus Zenbook S 13 OLED | |
| AIDA64 / Memory Latency | |
| Asus Zenbook S 13 OLED | |
| Huawei MateBook X Pro 2022 | |
| Average of class Subnotebook (6.1 - 159.9, n=56, last 2 years) | |
| Huawei MateBook X Pro 2021 | |
| Average Intel Core i7-1260P (77.9 - 118.4, n=21) | |
* ... smaller is better
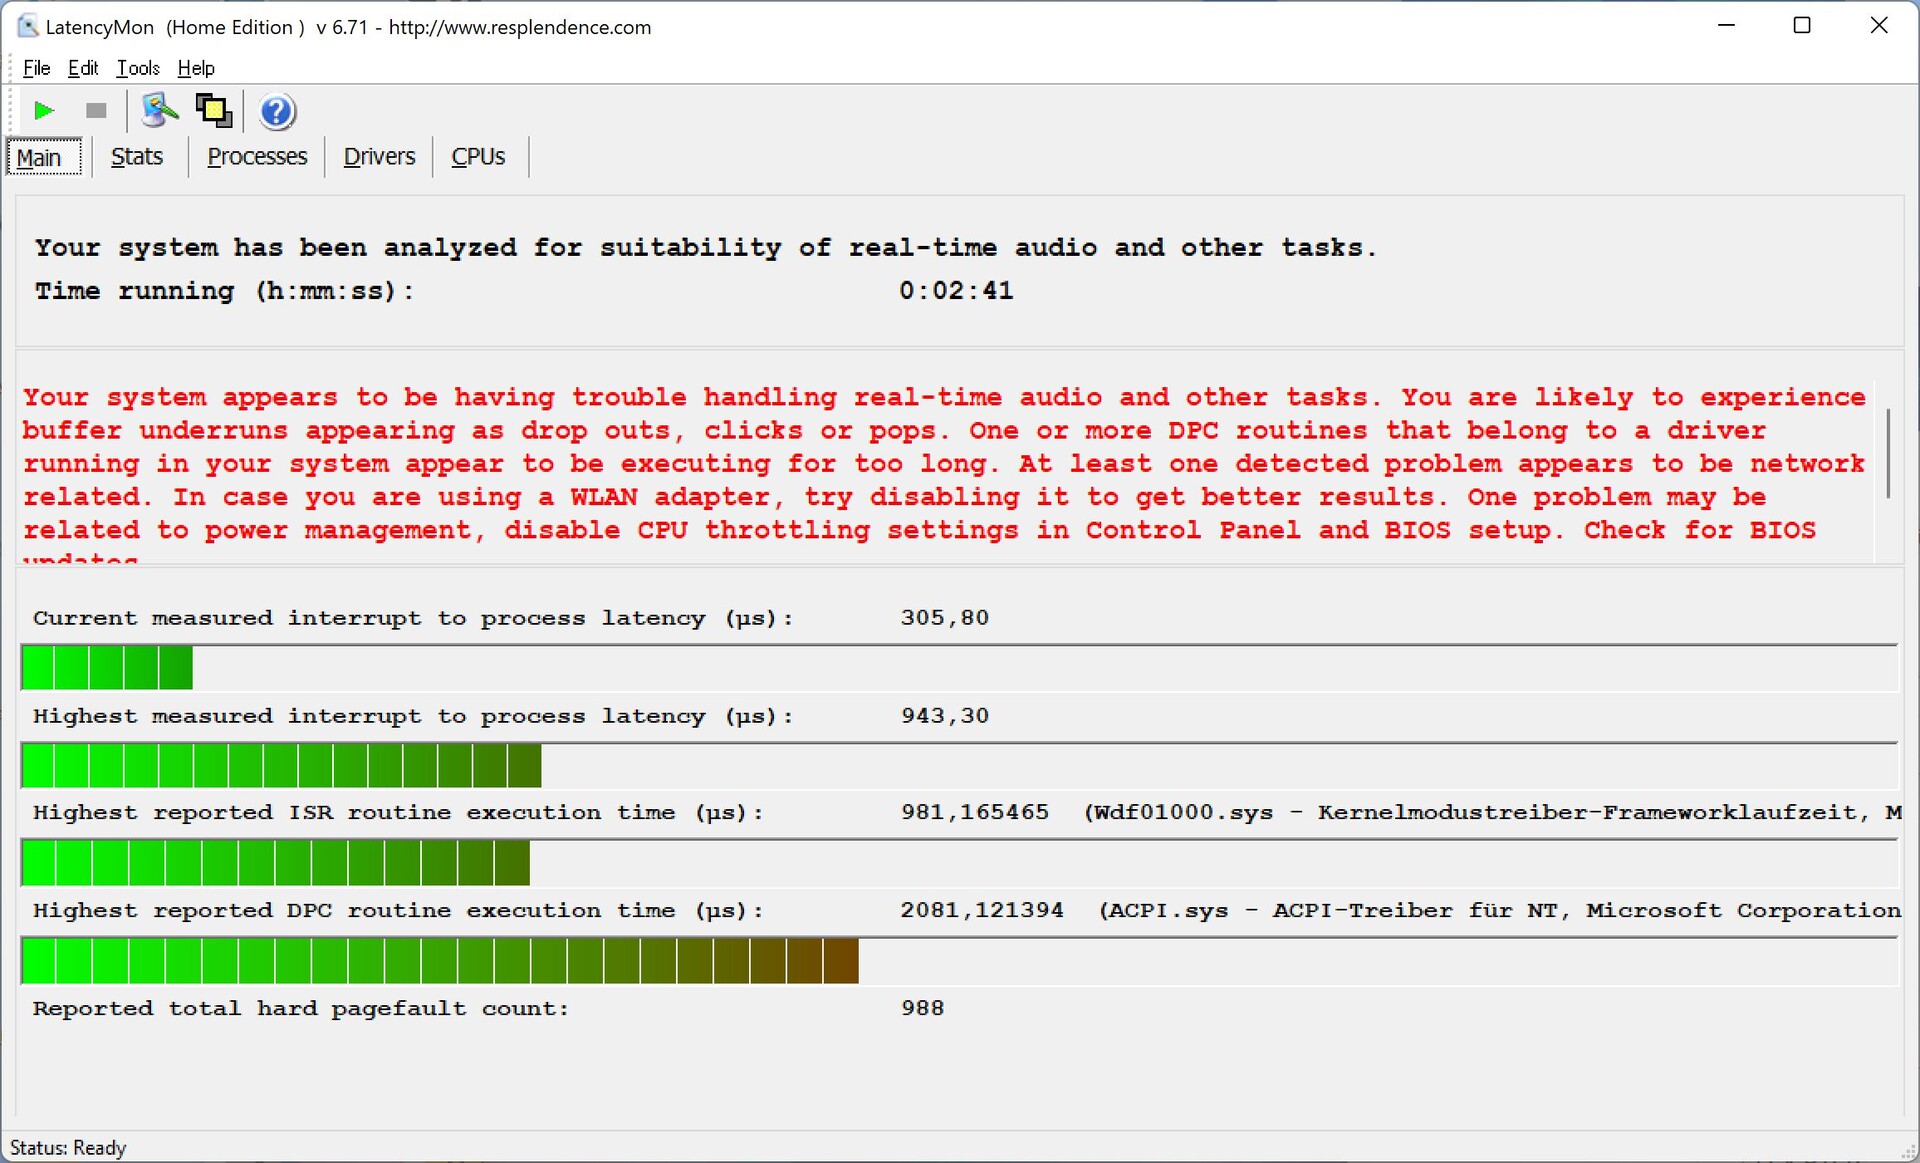
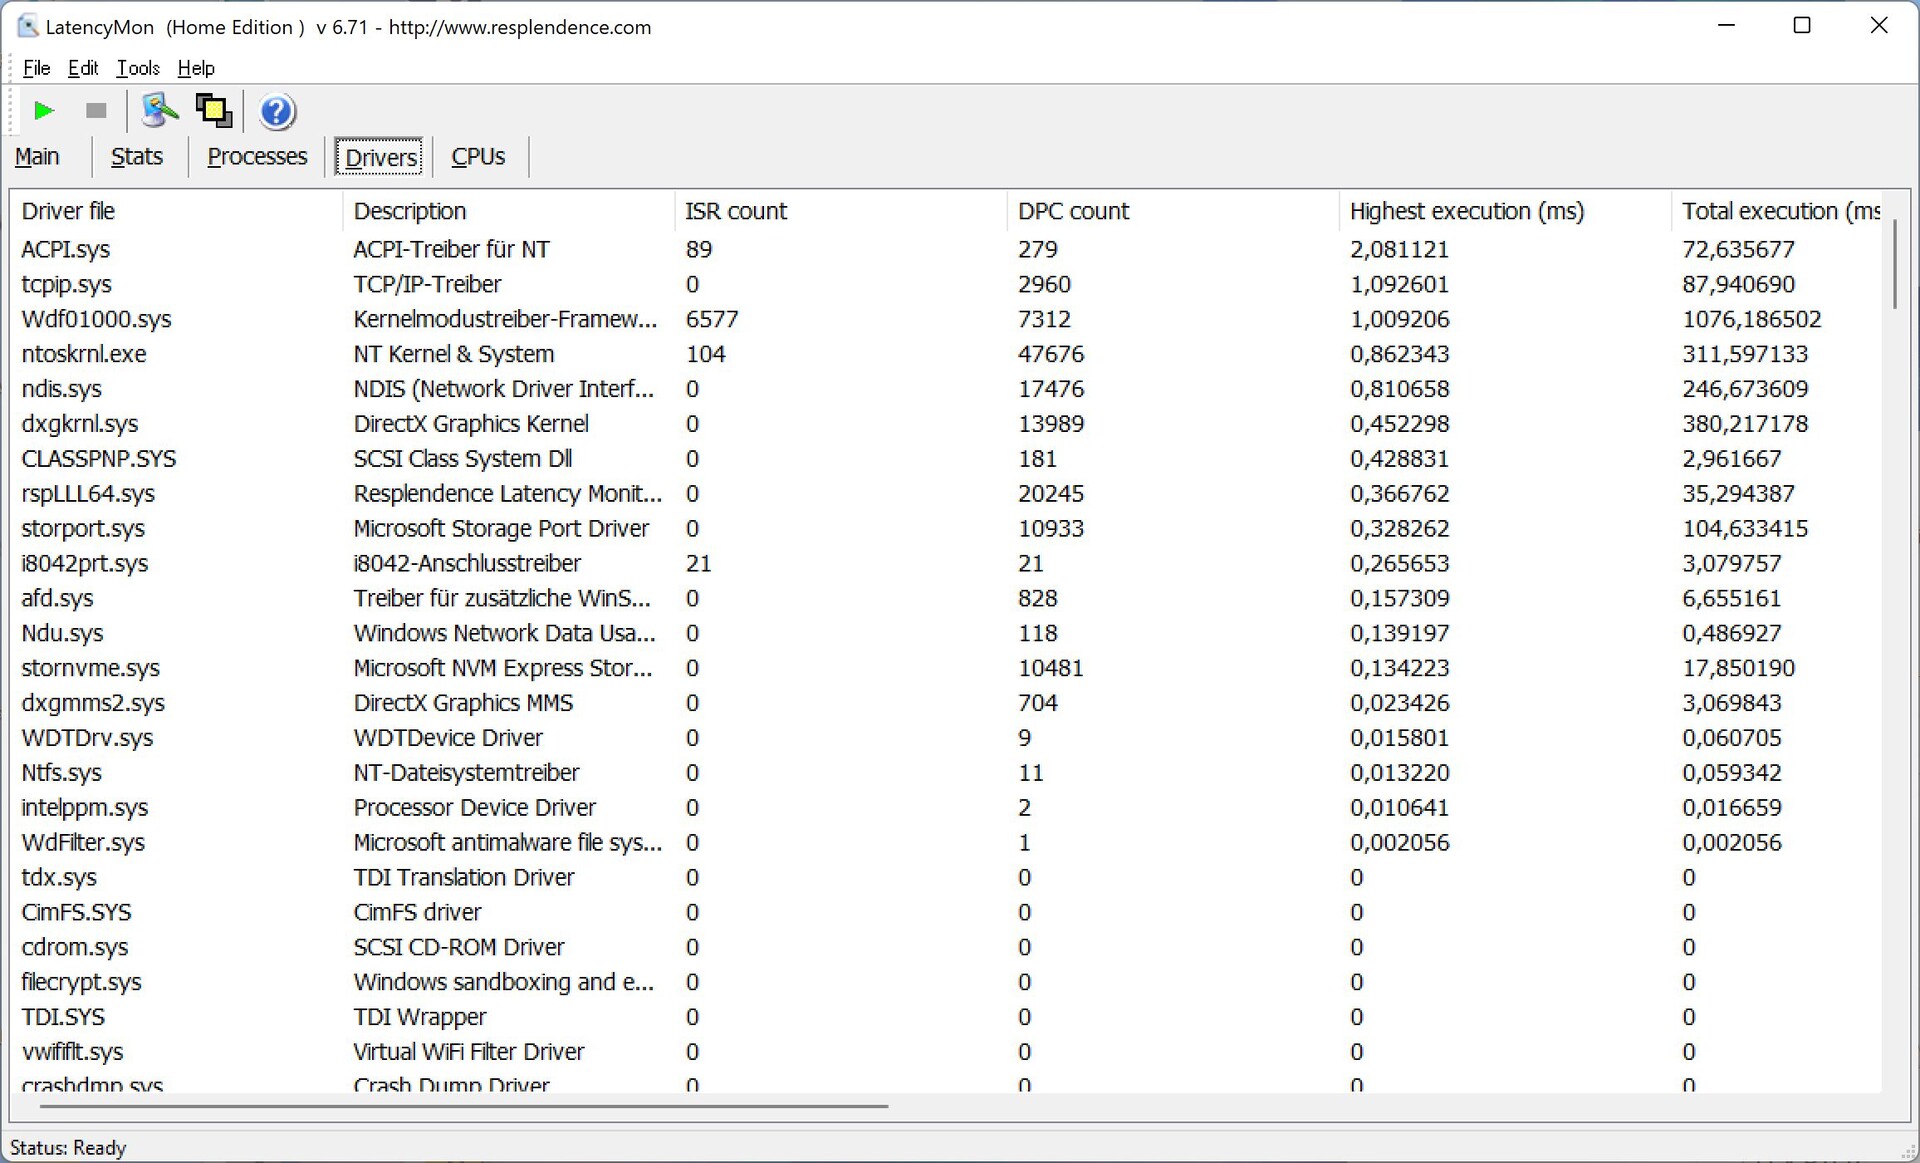
DPC延时
在我们的标准化延迟测试中(网页浏览、4K YouTube播放、CPU负载),我们的评测设备在目前的BIOS版本下显示出轻微的限制,因此只是有条件地适合使用实时音频应用程序。
| DPC Latencies / LatencyMon - interrupt to process latency (max), Web, Youtube, Prime95 | |
| Huawei MateBook X Pro 2021 | |
| Lenovo Yoga 9i 14 2022 i7-1260P | |
| Huawei MateBook X Pro 2022 | |
| Dell XPS 13 Plus 9320 4K | |
| Asus Zenbook S 13 OLED | |
* ... smaller is better
存储设备
华为使用PCIe 3.0 x4固态硬盘,存储容量为1TB,其中约885GB在第一次启动后仍然可用。然而,与所有其他华为笔记本电脑一样,固态硬盘在出厂前被分区,系统驱动器非常小,约120GB。减去Windows占用的空间后,只剩下不到70GB,这可能很快导致容量问题。剩余的814GB可以在D盘使用。
速度方面也有限制。基本上,3GB/s左右的传输率是完全够用的(即使人们应该合理地期望在这个价格上有更高的传输率的PCIe 4.0硬盘),但是该硬盘在持续负载下有温度问题(根据WiNFO的数据为74℃),所以性能会定期崩溃。看一下散热情况就会发现,该硬盘直接位于CPU散热器上。另一方面,这些影响在日常使用中可以忽略不计,我们在正常的测试程序中没有发现任何限制。更多的SSD基准测试可在这里.

* ... smaller is better
Sustained Read Performance: DiskSpd Read Loop, Queue Depth 8
图形卡
关于显卡,我们可以说得很简单,因为著名的Iris Xe Graphics G7iGPU是英特尔在这里使用的较快版本,有96个EUs。这为正常的日常使用提供了足够的性能,也可以毫无问题地处理高分辨率的视频。在合成基准测试中,它得益于工作内存的双通道配置,并达到了预期水平,尽管这明显低于 Radeon 680M iGPU和Apple M2 GPU (有8个或 10个核心与前代产品(采用相同的iGPU)相比,图形性能仅有小幅提高。
因此,MateBook X Pro仅部分适用于游戏,即使在简单的游戏中,用户也经常被限制在低或中等的细节上。至少在较长的游戏过程中性能保持稳定,正如我们的Witcher 3 循环所证明的那样。
在电池电量方面,性能有些受限,你应该预期会有~13%的亏损。更多的GPU基准测试可在这里.
| 3DMark 11 Performance | 7512 points | |
| 3DMark Cloud Gate Standard Score | 21739 points | |
| 3DMark Fire Strike Score | 5021 points | |
| 3DMark Time Spy Score | 1964 points | |
Help | ||
Witcher 3 FPS Chart
| low | med. | high | ultra | QHD | |
|---|---|---|---|---|---|
| GTA V (2015) | 115.4 | 102.4 | 23.9 | 10.2 | |
| The Witcher 3 (2015) | 95 | 60 | 33 | 14.2 | |
| Dota 2 Reborn (2015) | 113 | 87.5 | 65.3 | 59.1 | |
| Final Fantasy XV Benchmark (2018) | 44.7 | 25.1 | 18.5 | 13 | |
| X-Plane 11.11 (2018) | 32.8 | 31.1 | 29.8 | ||
| Far Cry 5 (2018) | 56 | 30 | 28 | 26 | 17 |
| Strange Brigade (2018) | 91.6 | 43.9 | 35.3 | 28.6 | |
| F1 2021 (2021) | 102.9 | 49.8 | 39.5 | 27.8 | |
| Farming Simulator 22 (2021) | 96 | 45 | 33 | 31 | 25 |
排放--拥有出色扬声器的MateBook
噪声
从根本上说,带有两个风扇和一个蒸汽室的冷却系统提供了良好的被动冷却,因为在负载情况下至少需要20秒才能使风扇启动。在风扇噪音方面,两种性能概况之间存在明显的差异,尽管这里的消耗差异只有5瓦。在压力测试中测得的40.6 dB(A)的最大水平,在功耗稳定在30瓦时很快就降到了38.2 dB(A)。风扇的噪音绝不是令人不快或高亢的,在平衡模式下只达到最大的33.4 dB(A),这就大大地降低了噪音。因此,我们建议在日常使用中使用平衡模式。
没有发现其他电子噪音,如线圈啸叫。
| 模式 | 3DMark 06 | Witcher 3 Ultra | 压力测试 |
|---|---|---|---|
| 平衡 | 31.5 dB(A) | 31.5 dB(A) | 33.4 dB(A) |
| 性能 | 33,8 dB(A) | 35,4 dB(A) | 40,6 -> 38,2 dB(A) |
Noise level
| Idle |
| 23.5 / 23.5 / 25.9 dB(A) |
| Load |
| 33.8 / 40.6 dB(A) |
 | ||
30 dB silent 40 dB(A) audible 50 dB(A) loud |
||
min: | ||
| Huawei MateBook X Pro 2022 Iris Xe G7 96EUs, i7-1260P, Silicon Motion PCIe-8 SSD 1TB | Lenovo Yoga 9i 14 2022 i7-1260P Iris Xe G7 96EUs, i7-1260P, Samsung PM9A1 MZVL21T0HCLR | Asus Zenbook S 13 OLED Radeon 680M, R7 6800U, Samsung PM9A1 MZVL21T0HCLR | Dell XPS 13 Plus 9320 4K Iris Xe G7 96EUs, i7-1260P, Samsung PM9A1 MZVL21T0HCLR | Huawei MateBook X Pro 2021 Iris Xe G7 96EUs, i7-1165G7, Samsung PM981a MZVLB1T0HBLR | |
|---|---|---|---|---|---|
| Noise | -7% | -2% | -10% | 1% | |
| off / environment * (dB) | 23.5 | 24.1 -3% | 24 -2% | 24.4 -4% | 25.4 -8% |
| Idle Minimum * (dB) | 23.5 | 24.1 -3% | 24 -2% | 24.4 -4% | 25.6 -9% |
| Idle Average * (dB) | 23.5 | 24.1 -3% | 24 -2% | 24.4 -4% | 25.6 -9% |
| Idle Maximum * (dB) | 25.9 | 30 -16% | 24 7% | 25.5 2% | 25.6 1% |
| Load Average * (dB) | 33.8 | 39.4 -17% | 33.1 2% | 40.4 -20% | 28.7 15% |
| Witcher 3 ultra * (dB) | 35.4 | 39.4 -11% | 40.2 -14% | 45.5 -29% | 32 10% |
| Load Maximum * (dB) | 40.6 | 39.4 3% | 41.7 -3% | 45.5 -12% | 38.2 6% |
* ... smaller is better
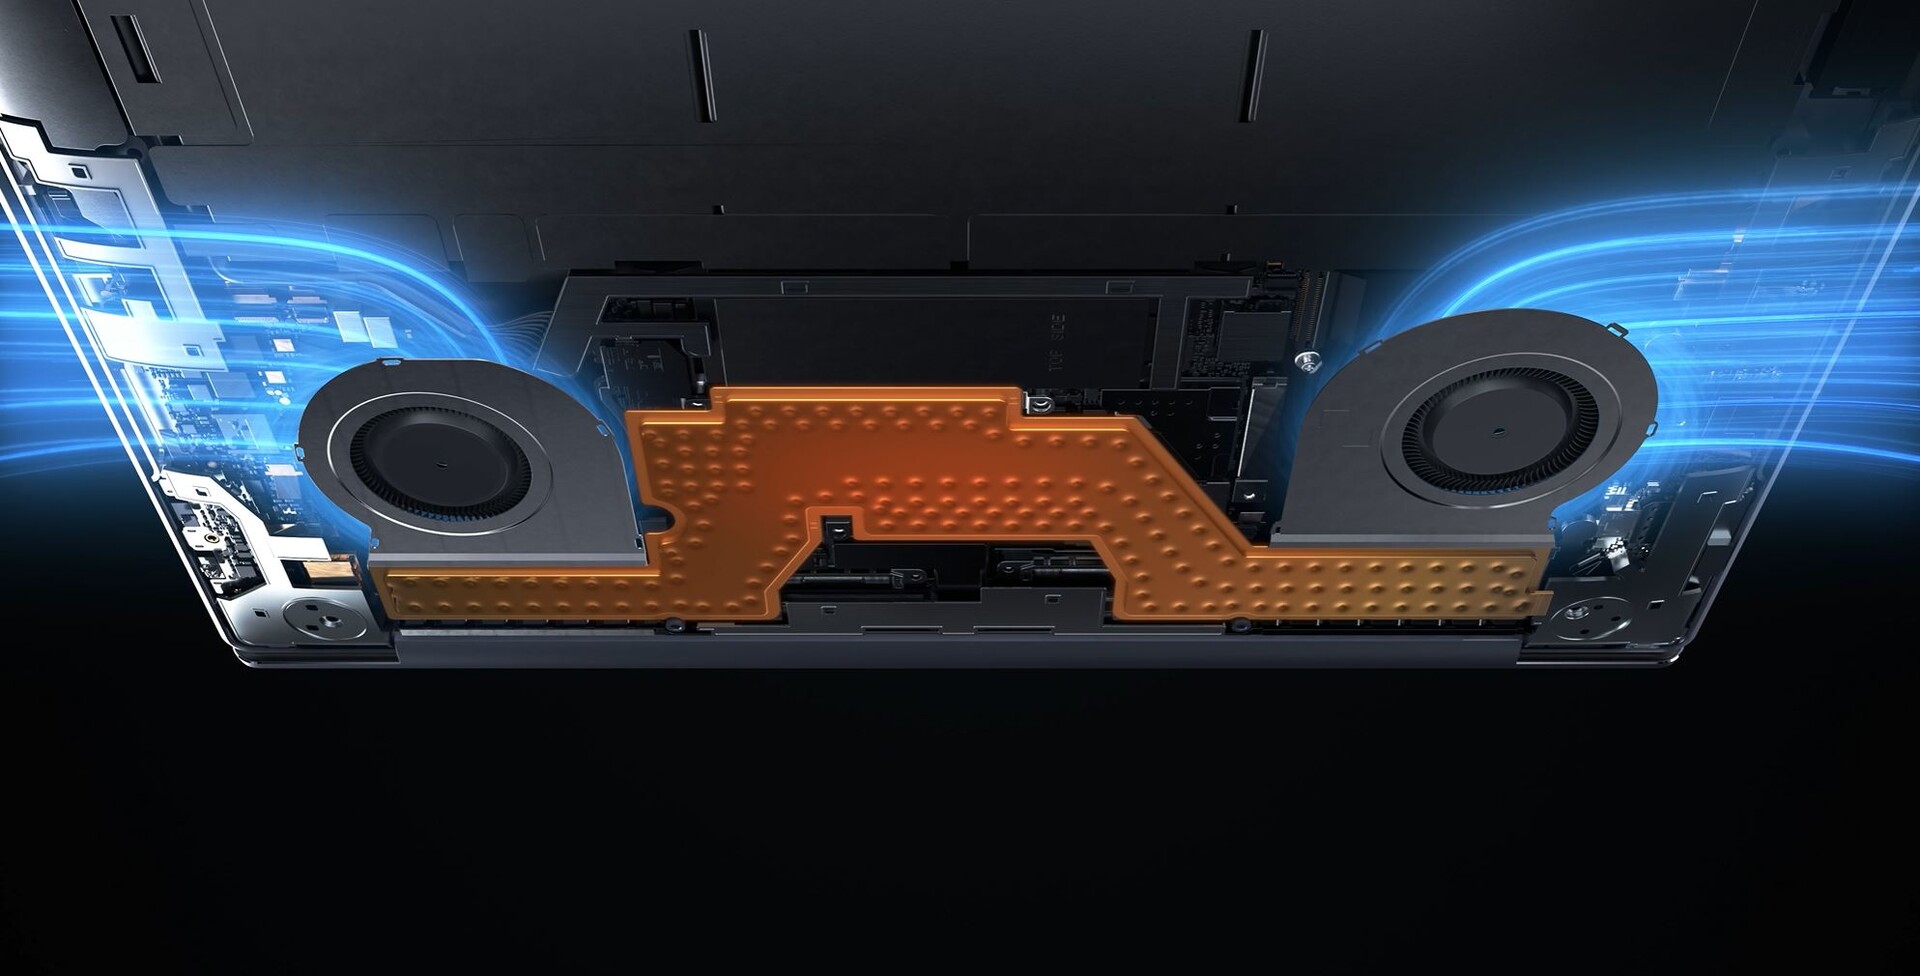
温度
华为将表面温度控制得很好。在空闲和轻度任务时,机箱确实比平时热了几度,但这并不构成问题。在负载情况下,你可以在红外图像中清楚地看到冷却系统和风扇的位置,因为这些区域(尤其是中间)会变热。键盘的上侧甚至比下侧更热一些,这在打字时也很明显,但这并不证明是限制性的。另一方面,即使在压力测试中,掌托仍然保持令人愉快的凉爽。在底部的最高温度为42℃时,你可以毫不犹豫地将MateBook X Pro放在腿上,即使在负载情况下。
在压力测试中,我们观察到与纯CPU负载相同的行为。在64瓦的短暂消耗高峰之后,消耗量迅速稳定在30瓦。在测试过程中,CPU/iGPU的时钟有轻微的变化,但总体上一切都保持相当稳定。
(±) The maximum temperature on the upper side is 43.1 °C / 110 F, compared to the average of 35.9 °C / 97 F, ranging from 21.4 to 59 °C for the class Subnotebook.
(±) The bottom heats up to a maximum of 42 °C / 108 F, compared to the average of 39.2 °C / 103 F
(+) In idle usage, the average temperature for the upper side is 27 °C / 81 F, compared to the device average of 30.8 °C / 87 F.
(±) Playing The Witcher 3, the average temperature for the upper side is 36.2 °C / 97 F, compared to the device average of 30.8 °C / 87 F.
(+) The palmrests and touchpad are cooler than skin temperature with a maximum of 28.6 °C / 83.5 F and are therefore cool to the touch.
(±) The average temperature of the palmrest area of similar devices was 28.2 °C / 82.8 F (-0.4 °C / -0.7 F).
| Huawei MateBook X Pro 2022 Intel Core i7-1260P, Intel Iris Xe Graphics G7 96EUs | Apple MacBook Air M2 10C GPU Apple M2, Apple M2 10-Core GPU | Lenovo Yoga 9i 14 2022 i7-1260P Intel Core i7-1260P, Intel Iris Xe Graphics G7 96EUs | Asus Zenbook S 13 OLED AMD Ryzen 7 6800U, AMD Radeon 680M | Dell XPS 13 Plus 9320 4K Intel Core i7-1260P, Intel Iris Xe Graphics G7 96EUs | Huawei MateBook X Pro 2021 Intel Core i7-1165G7, Intel Iris Xe Graphics G7 96EUs | |
|---|---|---|---|---|---|---|
| Heat | 5% | -6% | -7% | -2% | -3% | |
| Maximum Upper Side * (°C) | 43.1 | 44.7 -4% | 47.5 -10% | 47.9 -11% | 41.1 5% | 42.2 2% |
| Maximum Bottom * (°C) | 42 | 44.6 -6% | 52.2 -24% | 56.1 -34% | 48.8 -16% | 40.4 4% |
| Idle Upper Side * (°C) | 29.4 | 25.1 15% | 27.1 8% | 26.8 9% | 28 5% | 31.2 -6% |
| Idle Bottom * (°C) | 29.4 | 25.3 14% | 28.5 3% | 27.3 7% | 29.3 -0% | 32.2 -10% |
* ... smaller is better
发言人
MateBook X Pro提供了一个带有6个扬声器的音响系统,其性能非常好。声音非常宽广,有力,非常响亮。此外,华为的声音软件提供了一些改进,包括对扬声器、连接的耳机和麦克风的改进。除了我们的主观印象外,测试结果也非常好,MateBook X Pro也正好领先于目前的MacBook Air M2而只是非常轻微地落后于 MacBook Pro 14,后者提供的低音更多一点。在大多数情况下,外部扬声器是没有必要的。
Huawei MateBook X Pro 2022 audio analysis
(+) | speakers can play relatively loud (85.5 dB)
Bass 100 - 315 Hz
(±) | reduced bass - on average 5% lower than median
(+) | bass is linear (5.3% delta to prev. frequency)
Mids 400 - 2000 Hz
(+) | balanced mids - only 1.5% away from median
(+) | mids are linear (2.5% delta to prev. frequency)
Highs 2 - 16 kHz
(+) | balanced highs - only 2.1% away from median
(+) | highs are linear (5.3% delta to prev. frequency)
Overall 100 - 16.000 Hz
(+) | overall sound is linear (5% difference to median)
Compared to same class
» 0% of all tested devices in this class were better, 0% similar, 100% worse
» The best had a delta of 5%, average was 18%, worst was 53%
Compared to all devices tested
» 0% of all tested devices were better, 0% similar, 100% worse
» The best had a delta of 4%, average was 24%, worst was 134%
Lenovo Yoga 9i 14 2022 i7-1260P audio analysis
(+) | speakers can play relatively loud (84 dB)
Bass 100 - 315 Hz
(±) | reduced bass - on average 7.4% lower than median
(±) | linearity of bass is average (7.2% delta to prev. frequency)
Mids 400 - 2000 Hz
(+) | balanced mids - only 1.1% away from median
(+) | mids are linear (3.4% delta to prev. frequency)
Highs 2 - 16 kHz
(+) | balanced highs - only 2.1% away from median
(+) | highs are linear (3.2% delta to prev. frequency)
Overall 100 - 16.000 Hz
(+) | overall sound is linear (6% difference to median)
Compared to same class
» 0% of all tested devices in this class were better, 0% similar, 100% worse
» The best had a delta of 6%, average was 20%, worst was 57%
Compared to all devices tested
» 0% of all tested devices were better, 0% similar, 100% worse
» The best had a delta of 4%, average was 24%, worst was 134%
Apple MacBook Pro 14 2021 M1 Pro Entry audio analysis
(+) | speakers can play relatively loud (84.9 dB)
Bass 100 - 315 Hz
(+) | good bass - only 4.3% away from median
(+) | bass is linear (5.9% delta to prev. frequency)
Mids 400 - 2000 Hz
(+) | balanced mids - only 1.1% away from median
(+) | mids are linear (1.9% delta to prev. frequency)
Highs 2 - 16 kHz
(+) | balanced highs - only 2.9% away from median
(+) | highs are linear (3% delta to prev. frequency)
Overall 100 - 16.000 Hz
(+) | overall sound is linear (5.6% difference to median)
Compared to same class
» 2% of all tested devices in this class were better, 1% similar, 97% worse
» The best had a delta of 5%, average was 17%, worst was 45%
Compared to all devices tested
» 0% of all tested devices were better, 0% similar, 100% worse
» The best had a delta of 4%, average was 24%, worst was 134%
Apple MacBook Air M2 Entry audio analysis
(+) | speakers can play relatively loud (82.7 dB)
Bass 100 - 315 Hz
(±) | reduced bass - on average 12.2% lower than median
(±) | linearity of bass is average (12.6% delta to prev. frequency)
Mids 400 - 2000 Hz
(+) | balanced mids - only 1.1% away from median
(+) | mids are linear (3.1% delta to prev. frequency)
Highs 2 - 16 kHz
(+) | balanced highs - only 2.4% away from median
(+) | highs are linear (1.9% delta to prev. frequency)
Overall 100 - 16.000 Hz
(+) | overall sound is linear (9.5% difference to median)
Compared to same class
» 5% of all tested devices in this class were better, 2% similar, 93% worse
» The best had a delta of 5%, average was 18%, worst was 53%
Compared to all devices tested
» 4% of all tested devices were better, 1% similar, 95% worse
» The best had a delta of 4%, average was 24%, worst was 134%
能源管理 - 明亮的显示屏会消耗电池寿命
消耗功率
新的MateBook X Pro不是一个特别经济的笔记本,这主要是由于非常明亮,而且也是大的显示屏。我们在空闲模式下测得的功率高达14瓦。在负载情况下,由于处理器的高功率限制,功耗跃升至91瓦,但随后平缓下来,略低于56瓦。我们还用一个更强的电源检查了90瓦的电源是否限制了笔记本电脑的最大功耗,但情况并非如此。总的来说,90瓦的电源是足够的。
| Off / Standby | |
| Idle | |
| Load |
|
Key:
min: | |
| Huawei MateBook X Pro 2022 i7-1260P, Iris Xe G7 96EUs, Silicon Motion PCIe-8 SSD 1TB, IPS, 3120x2080, 14.2" | Apple MacBook Air M2 10C GPU M2, M2 10-Core GPU, Apple SSD AP1024Z, IPS, 2560x1664, 13.6" | Lenovo Yoga 9i 14 2022 i7-1260P i7-1260P, Iris Xe G7 96EUs, Samsung PM9A1 MZVL21T0HCLR, OLED, 3840x2400, 14" | Asus Zenbook S 13 OLED R7 6800U, Radeon 680M, Samsung PM9A1 MZVL21T0HCLR, OLED, 2880x1800, 13.3" | Dell XPS 13 Plus 9320 4K i7-1260P, Iris Xe G7 96EUs, Samsung PM9A1 MZVL21T0HCLR, IPS, 3840x2400, 13.4" | Huawei MateBook X Pro 2021 i7-1165G7, Iris Xe G7 96EUs, Samsung PM981a MZVLB1T0HBLR, IPS, 3000x2000, 13.9" | Average Intel Iris Xe Graphics G7 96EUs | Average of class Subnotebook | |
|---|---|---|---|---|---|---|---|---|
| Power Consumption | 49% | 9% | 32% | 14% | 28% | 26% | 40% | |
| Idle Minimum * (Watt) | 6.5 | 1.9 71% | 7.1 -9% | 4.8 26% | 7 -8% | 6.7 -3% | 5.51 ? 15% | 3.82 ? 41% |
| Idle Average * (Watt) | 13.7 | 9.6 30% | 10 27% | 8.7 36% | 11 20% | 10 27% | 8.66 ? 37% | 6.61 ? 52% |
| Idle Maximum * (Watt) | 14.4 | 9.7 33% | 10.8 25% | 10.1 30% | 11.4 21% | 10.3 28% | 10.9 ? 24% | 7.99 ? 45% |
| Load Average * (Watt) | 64.6 | 32.4 50% | 64 1% | 45.6 29% | 59.7 8% | 35.7 45% | 45.6 ? 29% | 41.9 ? 35% |
| Witcher 3 ultra * (Watt) | 57.2 | 30.8 46% | 47.7 17% | 42.4 26% | 49.4 14% | 32.7 43% | ||
| Load Maximum * (Watt) | 90.9 | 35.7 61% | 97 -7% | 49.5 46% | 63 31% | 67.6 26% | 67.8 ? 25% | 64.1 ? 29% |
* ... smaller is better
Power consumption Witcher 3 / Stress test
Power consumption with an external monitor
电池寿命
60Wh的电池和高消耗率的组合不允许特别长的电池运行时间。显示屏是个耗电大户,即使在150cd/m²的亮度下(相当于我们评测设备最大亮度的56%),我们在视频和WLAN测试中都只用了大约7.5小时。WLAN测试甚至在全屏亮度下不到5小时就停止了。竞争对手只是提供了更多的耐力;MateBook X Pro不太可能在没有电源插座的情况下工作一整天。
至少该设备的充电速度相对较快,因为完全充电(在笔记本电脑打开的情况下)需要大约80分钟,而在34分钟后可以达到50%,52分钟后达到80%。
| Huawei MateBook X Pro 2022 i7-1260P, Iris Xe G7 96EUs, 60 Wh | Apple MacBook Air M2 10C GPU M2, M2 10-Core GPU, 52.6 Wh | Lenovo Yoga 9i 14 2022 i7-1260P i7-1260P, Iris Xe G7 96EUs, 75 Wh | Asus Zenbook S 13 OLED R7 6800U, Radeon 680M, 67 Wh | Dell XPS 13 Plus 9320 4K i7-1260P, Iris Xe G7 96EUs, 55 Wh | Huawei MateBook X Pro 2021 i7-1165G7, Iris Xe G7 96EUs, 56 Wh | Average of class Subnotebook | |
|---|---|---|---|---|---|---|---|
| Battery runtime | 102% | 25% | 55% | 4% | 58% | 69% | |
| H.264 (h) | 7.6 | 15.8 108% | 12.6 66% | 15.2 100% | 11 45% | 15.6 ? 105% | |
| WiFi v1.3 (h) | 7.5 | 14.7 96% | 8.6 15% | 9.2 23% | 6.9 -8% | 10.5 40% | 14 ? 87% |
| Load (h) | 1.7 | 1.6 -6% | 2.4 41% | 1.3 -24% | 3 76% | 1.946 ? 14% |
Pros
Cons
结论。MateBook X Pro只有几个弱点
华为的目标是通过其2022年的新MateBook X Pro成为超极本中的佼佼者,这也反映在2199欧元的自信价格上。在结束审查过程时,我们的印象是非常积极的。对于一个高昂的价格,用户得到了一个整体上非常微调的包,只有几个弱点。720p的摄像头当然是其中之一,但至少它已经被几个新的软件功能所加强。缺乏维护选项和难以接触到组件也是批评的要点。最后,我们对起伏不定的固态硬盘性能和相对较短的电池运行时间不是很满意。
作为回报,你得到了一个紧凑而高质量的14.2英寸设备,它有一个非常好的IPS显示屏,提供近600cd/m²的亮度水平。此外,色彩准确性非常好,你可以通过软件在P3和sRGB色彩空间之间切换,这一点没有多少工作站能够做到。没有PWM,3:2的外形尺寸很适合工作。
桤木湖的 酷睿i7-1260P和合理的功率水平可以实现出色的系统性能,但在纯粹的CPU性能方面还有更快的竞争对手。在实践中,平衡模式是完全足够的,特别是由于你受益于更安静的风扇;在平衡模式下最大约33 dB(A),MateBook X Pro是最安静的模型之一。只有被动冷却的 MacBook Air M2在这里有优势。华为在固态硬盘方面浪费了一些潜力,因为没有PCIe 4.0驱动器,而且在散热器上的定位导致一段时间后性能下降。尽管如此,对于日常生活中的绝大多数用户来说,这不应该是一个问题。
高品质的外壳,非常好的系统性能,出色的扬声器和顶级显示屏。新的华为MateBook X Pro 2022整体上是一个非常好的包装。如果你能忍受缺乏维护选项和平庸的电池运行时间,你将拥有最好的Windows超极本,也是目前Apple's MacBook Air的最佳替代品。
华为已经升级了设备,现在首次提供了两个成熟的Thunderbolt 4端口。还有一个来自英特尔的现代Wi-Fi 6E模块,其他华为设备(如智能手机或平板电脑)的所有者可以对单个设备之间的高效联网感到高兴。华为还升级了输入设备。键盘现在提供了更多的键程,因此打字更舒适,但大型触摸板也通过额外的手势提供了真正的附加值。扬声器也没有被放过,因为我们的评测样品可以轻松地与目前的MacBook Air M2竞争。
说到 MacBook Air M2。 它无疑是MateBook X Pro的最大对手之一。它的M2芯片的效率要高得多,而且由于被动冷却,总是很安静。然而,MacBook Air M2确实有它的缺点,特别是在功能方面,因为你必须没有快速的Wi-Fi 6E(或160MHz的Wi-Fi 6)以及Thunderbolt 4。笔记本电脑 联想瑜伽9i 14也是一个非常好的设备,如果你能利用可转换的格式,也是一个有趣的选择。华硕 华硕ZenBook S 13另一方面,它的13.3英寸显示屏更加紧凑,但由于采用了AMD处理器,特别是快速的iGPU,它的性能更强。戴尔 戴尔XPS 13 Plus 9320也以其紧凑的外壳给人留下深刻印象,但总体上没有提供如此好的包装。
价格和可用性
Huawei MateBook X Pro 2022
- 09/08/2022 v7 (old)
Andreas Osthoff
Price comparison

