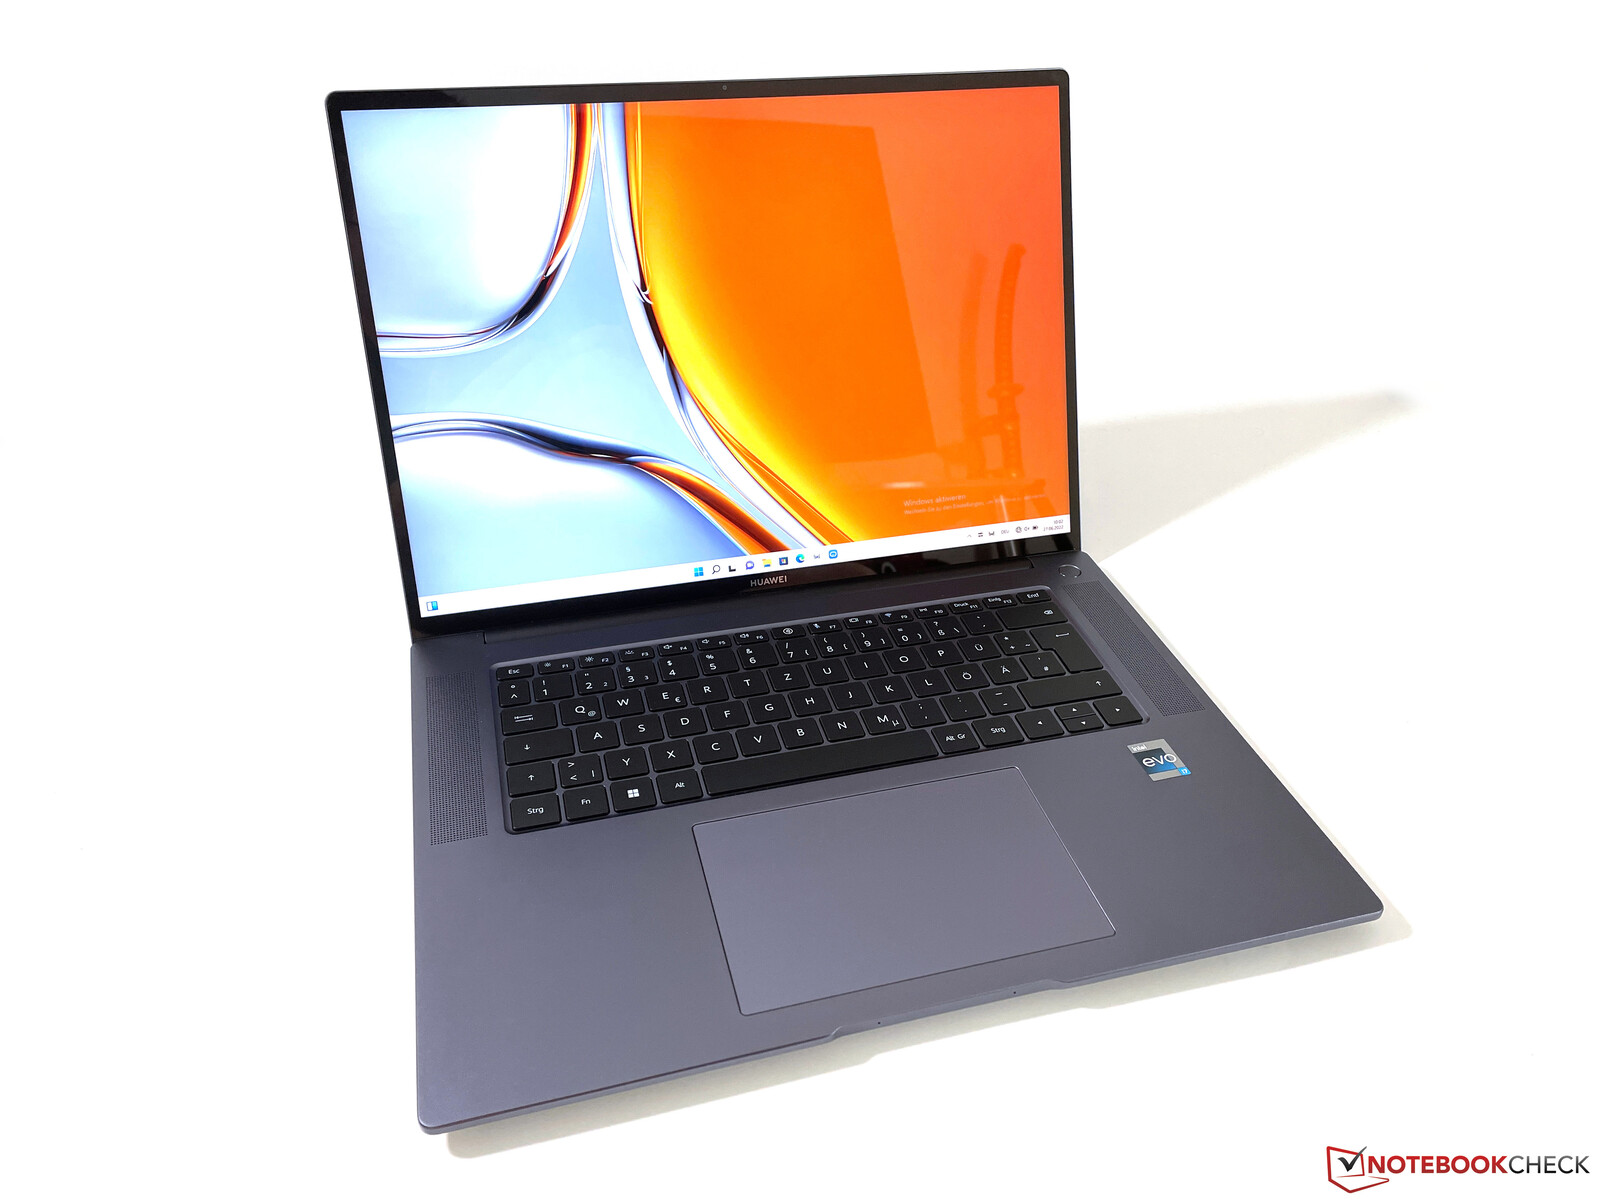
华为MateBook 16s评测--配备桤木湖i7的大型多媒体笔记本电脑
随着 MateBook 16,华为在其产品系列中拥有一个大型多媒体笔记本。到目前为止,它的AMD Ryzen处理器已经令人信服地提供了良好的性价比。然而,该制造商现在已经为新的MateBook 16s改用英特尔Alder Lake处理器(Core i7或Core i9)。有一些小的调整,新的处理器也提供了略微改善的性能,但立即可以注意到的是价格明显提高。我们的测试设备配备了Core i7-12700H,16GB内存和1TB PCIe SSD,价格为1699欧元(1730美元)。这比配备Ryzen 7 5800H的几乎相同的前代产品高出500欧元(510美元)。配备Core i9-12900H的机型也可以选择,价格为1899欧元(1940美元)。后者配备了16GB内存和1TB固态硬盘。
在这个价格类别中,确实没有很多直接的竞争对手,至少没有一个没有专用显卡的。高端产品中唯一的例外是戴尔XPS 15,鉴于其价格的上涨,MateBook 16s现在也被放在了高端产品中,该产品也可以不配置专用显卡。
潜在的竞争对手比较
Rating | Date | Model | Weight | Height | Size | Resolution | Price |
|---|---|---|---|---|---|---|---|
| 86.4 % v7 (old) | 07 / 2022 | Huawei MateBook 16s i7 i7-12700H, Iris Xe G7 96EUs | 2 kg | 17.8 mm | 16.00" | 2520x1680 | |
| 86.5 % v7 (old) | 10 / 2021 | Huawei MateBook 16 R7 5800H R7 5800H, Vega 8 | 2 kg | 17.8 mm | 16.00" | 2520x1680 | |
| 85.7 % v7 (old) | 06 / 2022 | Dell Inspiron 16 7620 2-in-1 i7-1260P, Iris Xe G7 96EUs | 2.1 kg | 18.41 mm | 16.00" | 1920x1200 | |
| 84.2 % v7 (old) | 10 / 2021 | Dell XPS 15 9510 i5 11400H FHD i5-11400H, UHD Graphics Xe 16EUs | 1.8 kg | 18 mm | 15.60" | 1920x1200 | |
| 86.3 % v7 (old) | 09 / 2021 | LG Gram 16 (2021) i7-1165G7, Iris Xe G7 96EUs | 1.2 kg | 16.8 mm | 16.00" | 2560x1600 |
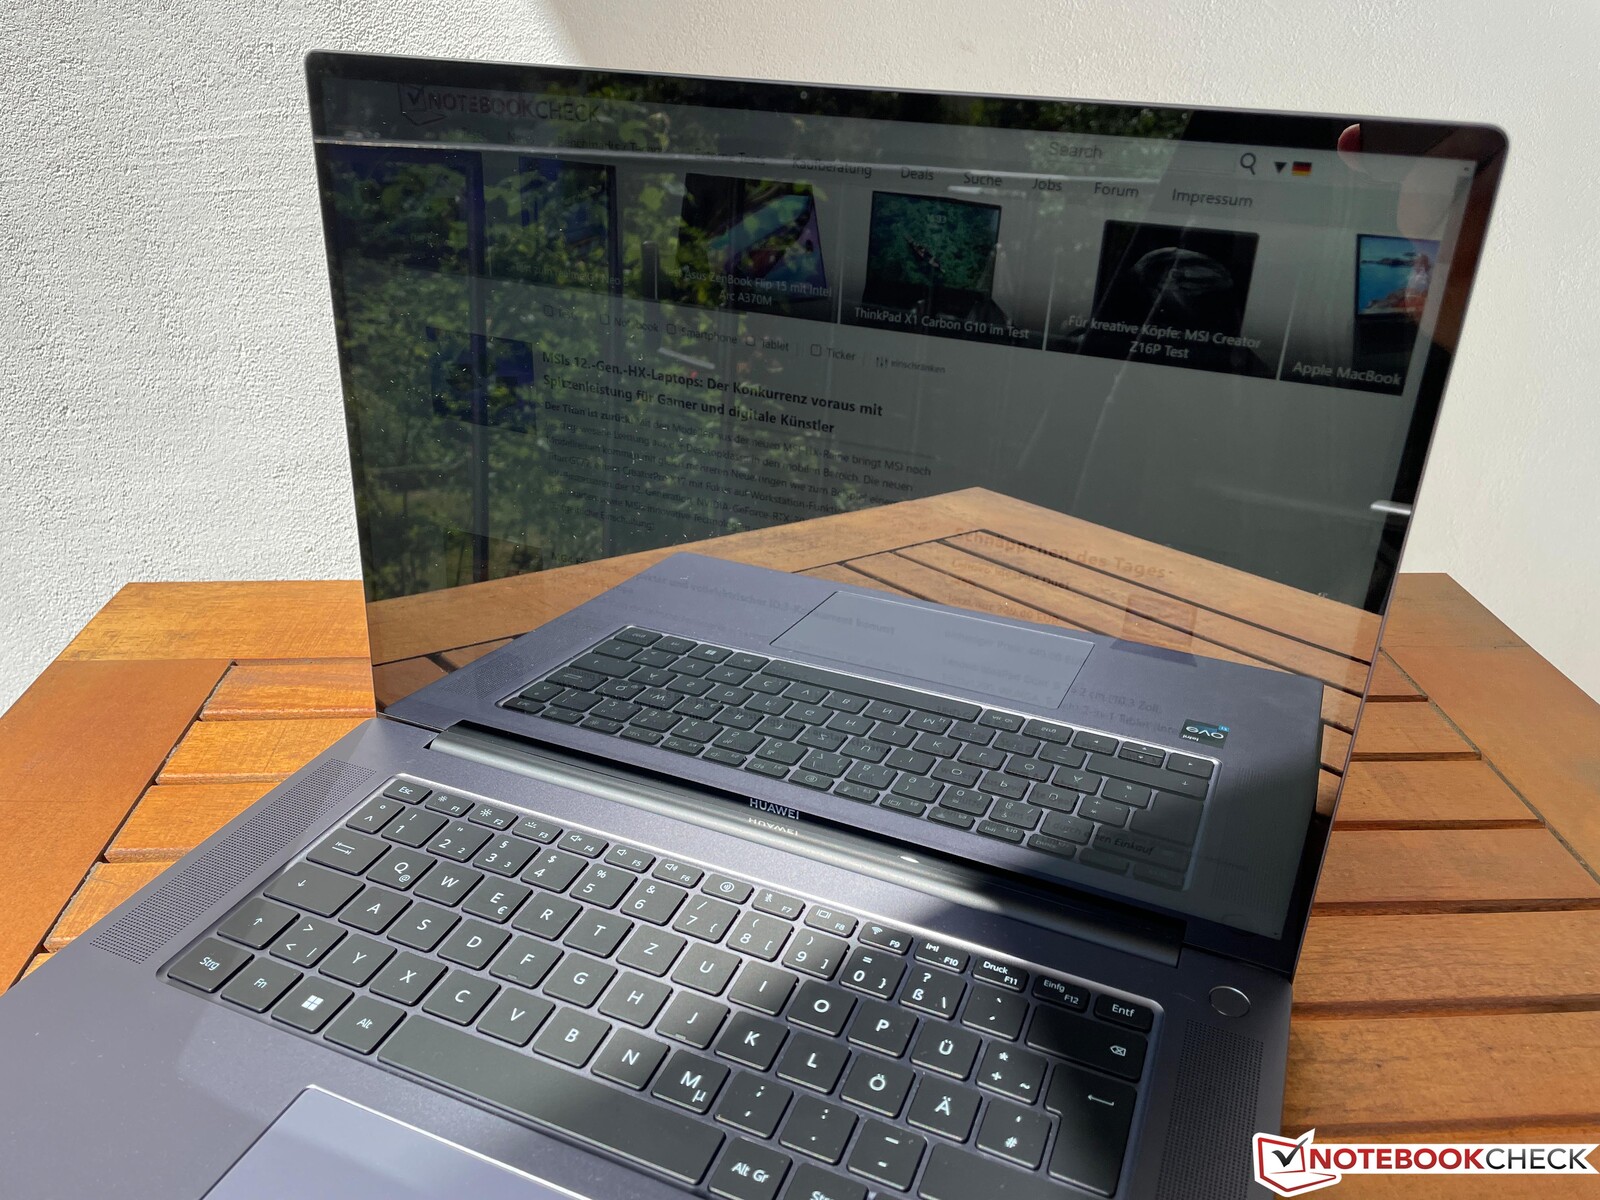
外壳 - 金属外壳,略作修改
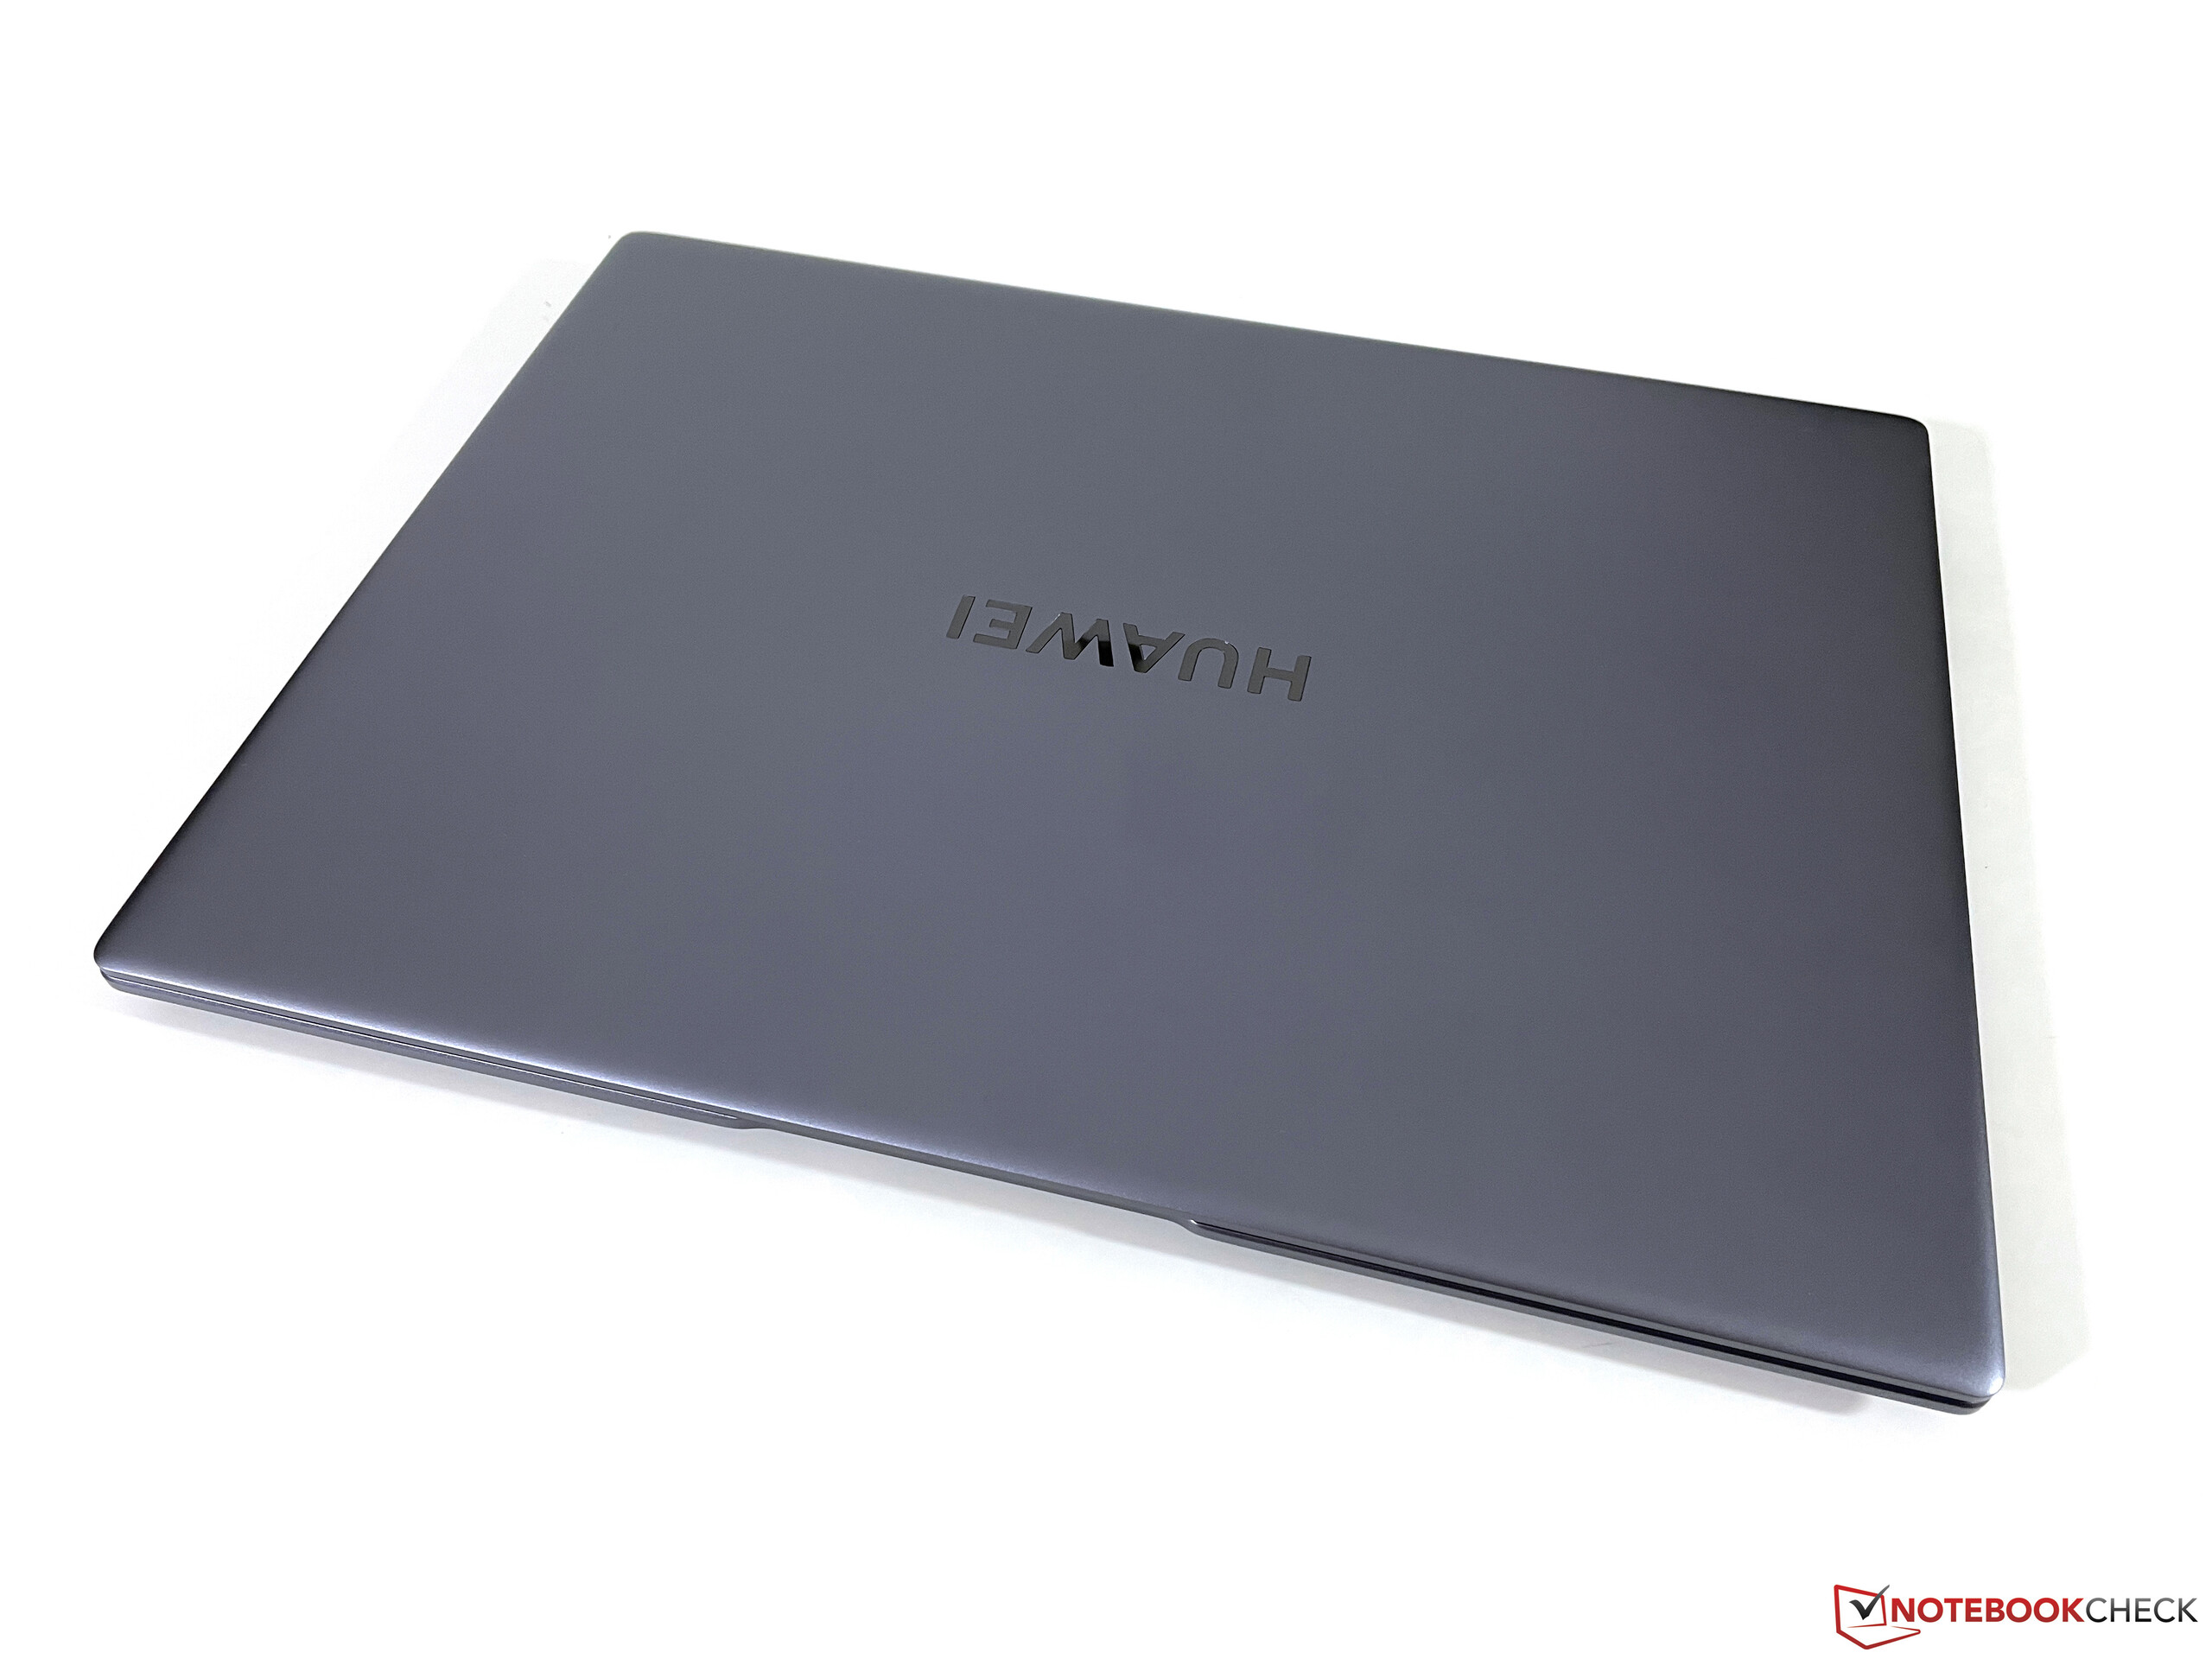
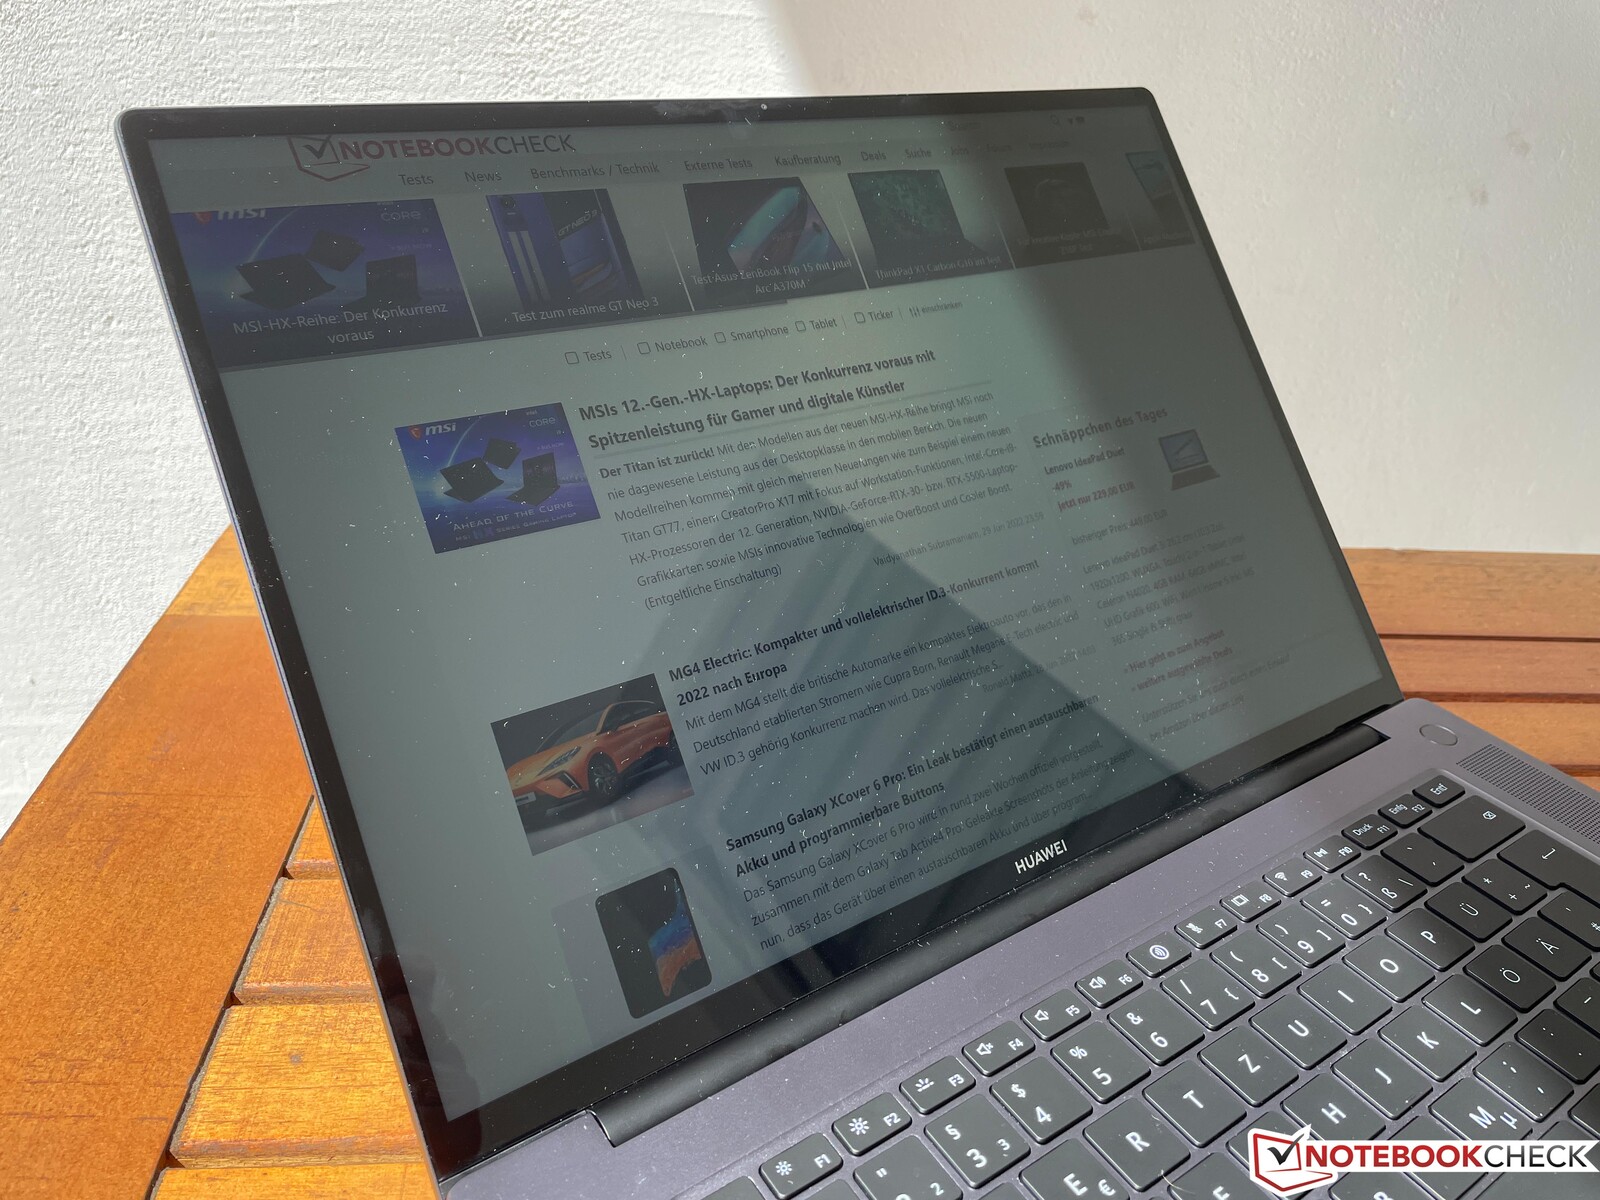
MateBook 16s的基本外壳设计基本上没有变化。只是有非常小的修改。太空灰的金属外壳(不过,它确实有熟悉的蓝色/紫色光泽)仍然具有非常高的质量和坚固性。MateBook看起来非常适中,很好地融入了专业环境。唯一的两种颜色点缀是键盘和黑色的屏幕框架。哑光的表面不是特别容易收集灰尘。
一打开盖子,与之前的机型相比,一个小小的变化就变得很明显。屏幕的上边缘稍微厚一些,以容纳改进的1080p网络摄像头。底座和盖子都有一种牢固的感觉,但铰链并不能完全防止大盖子的轻微晃动。最大的打开角度仍然是145度左右。
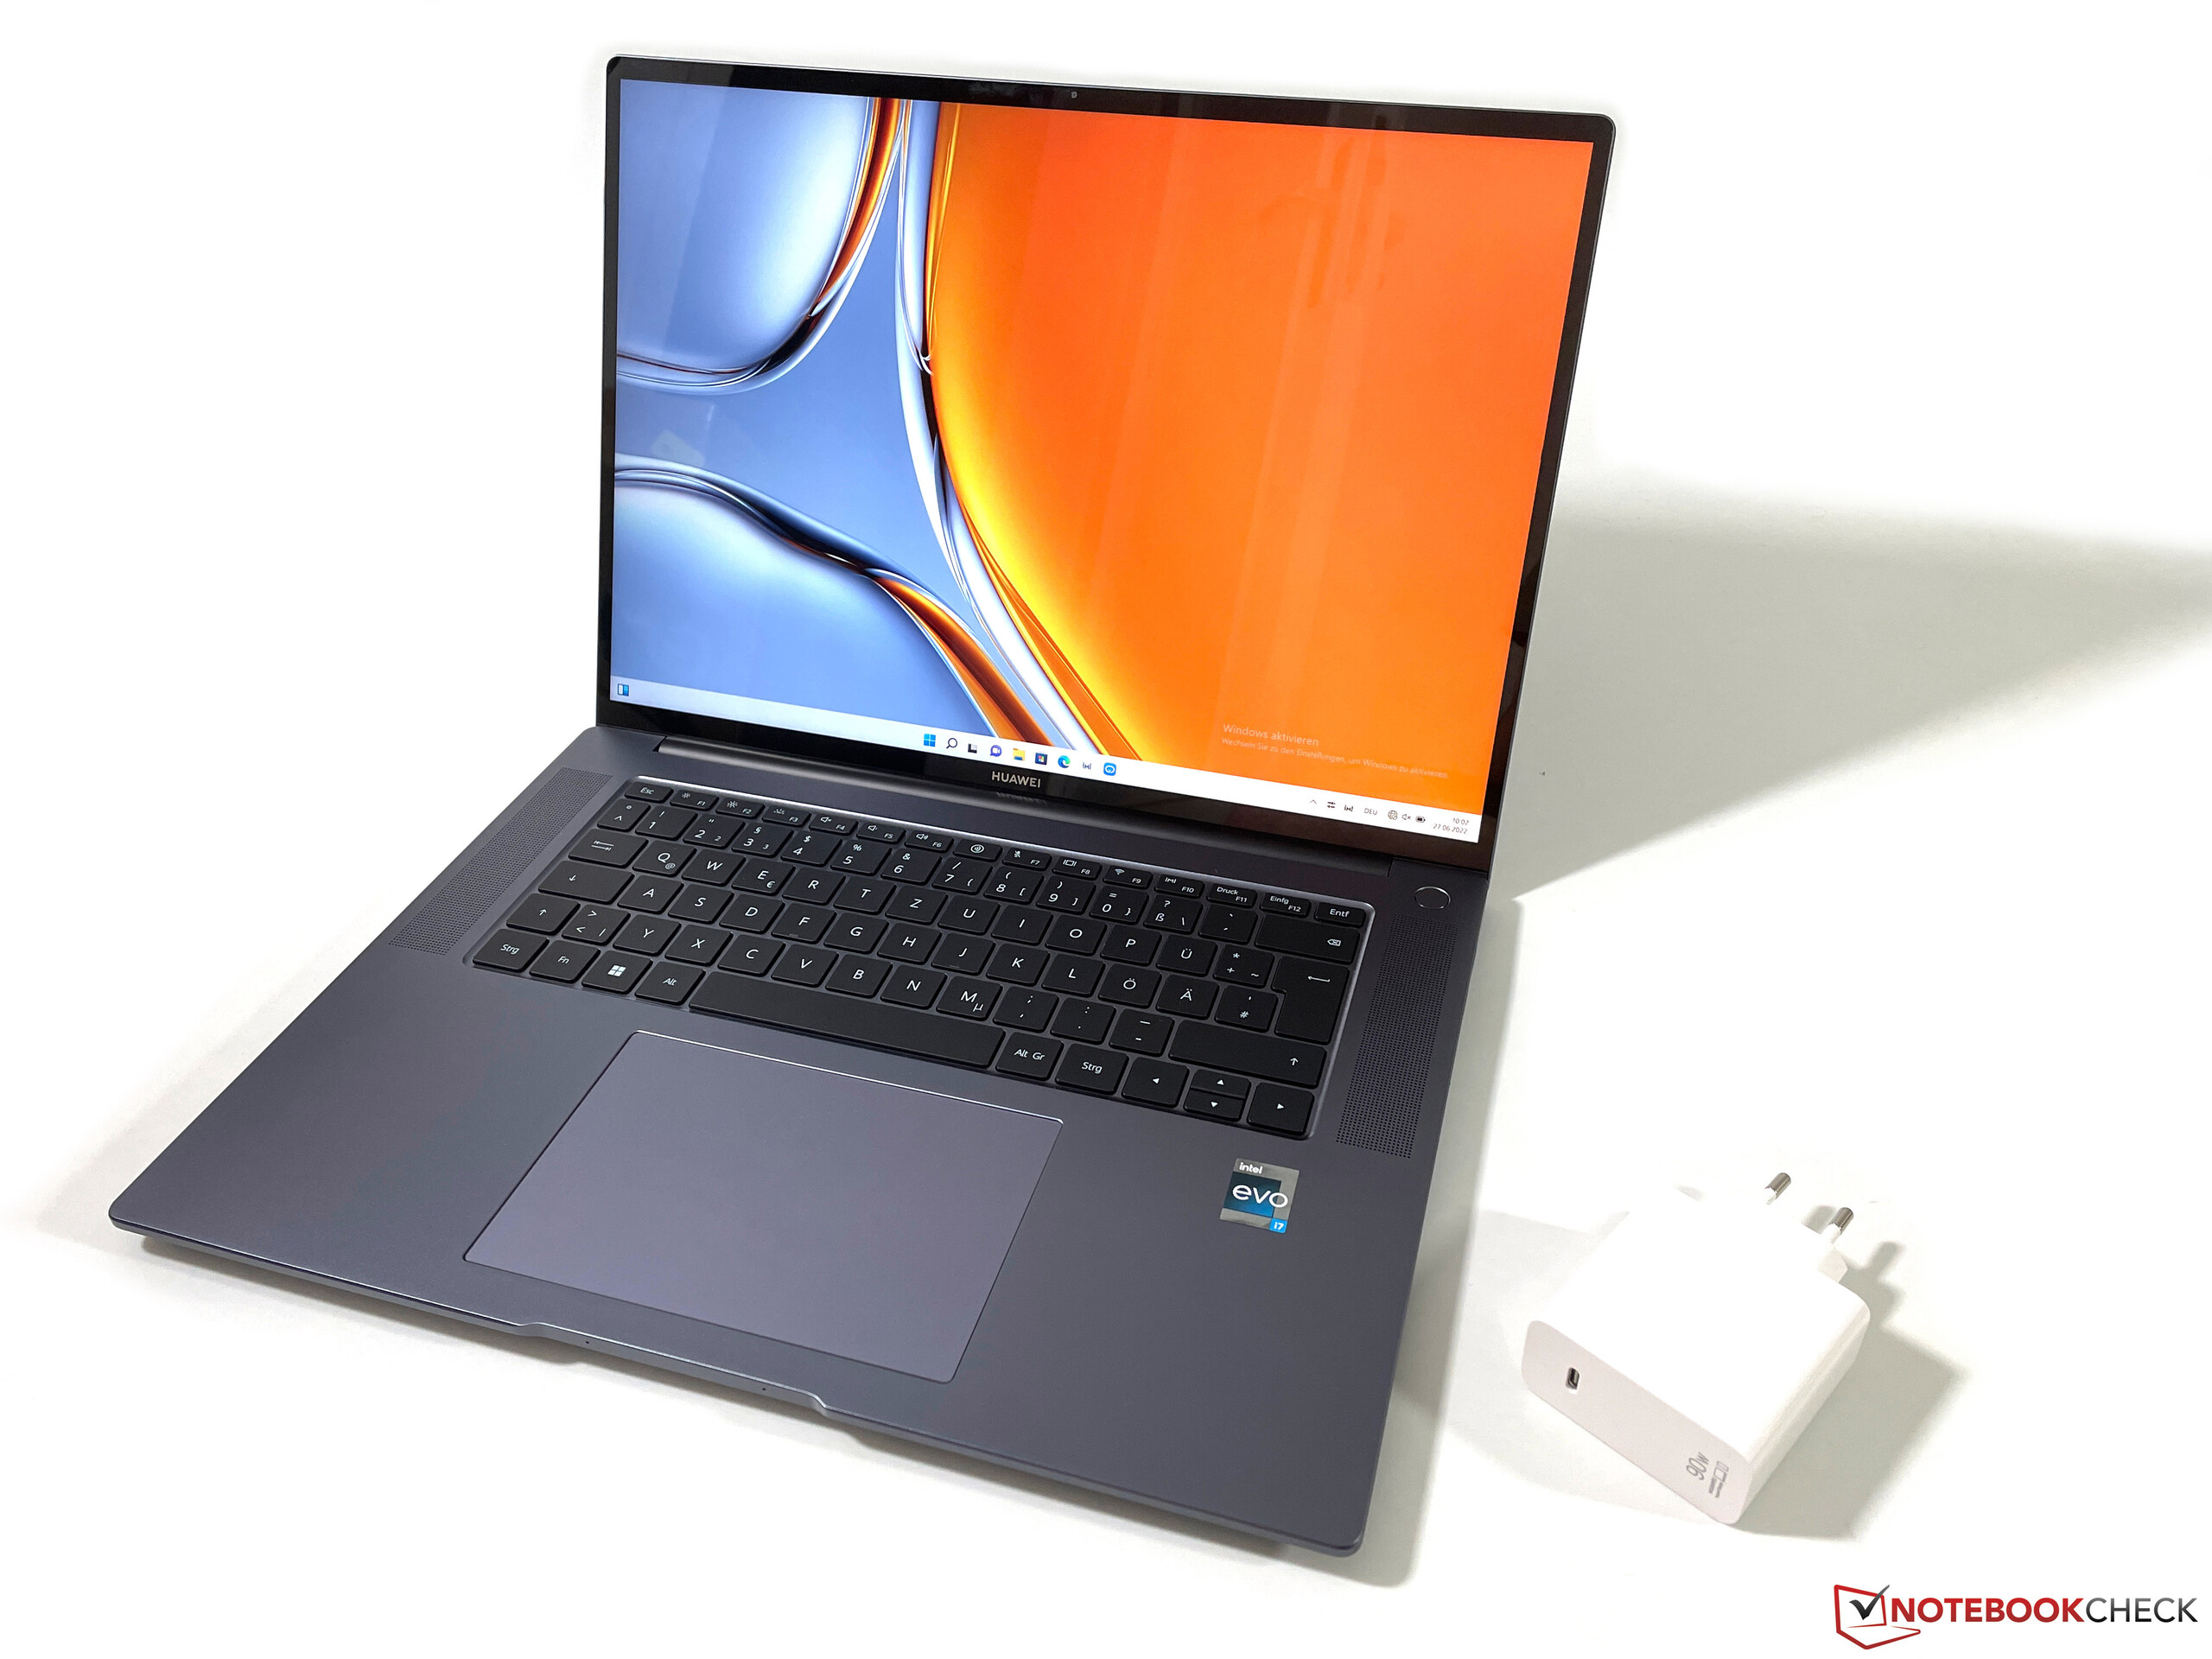
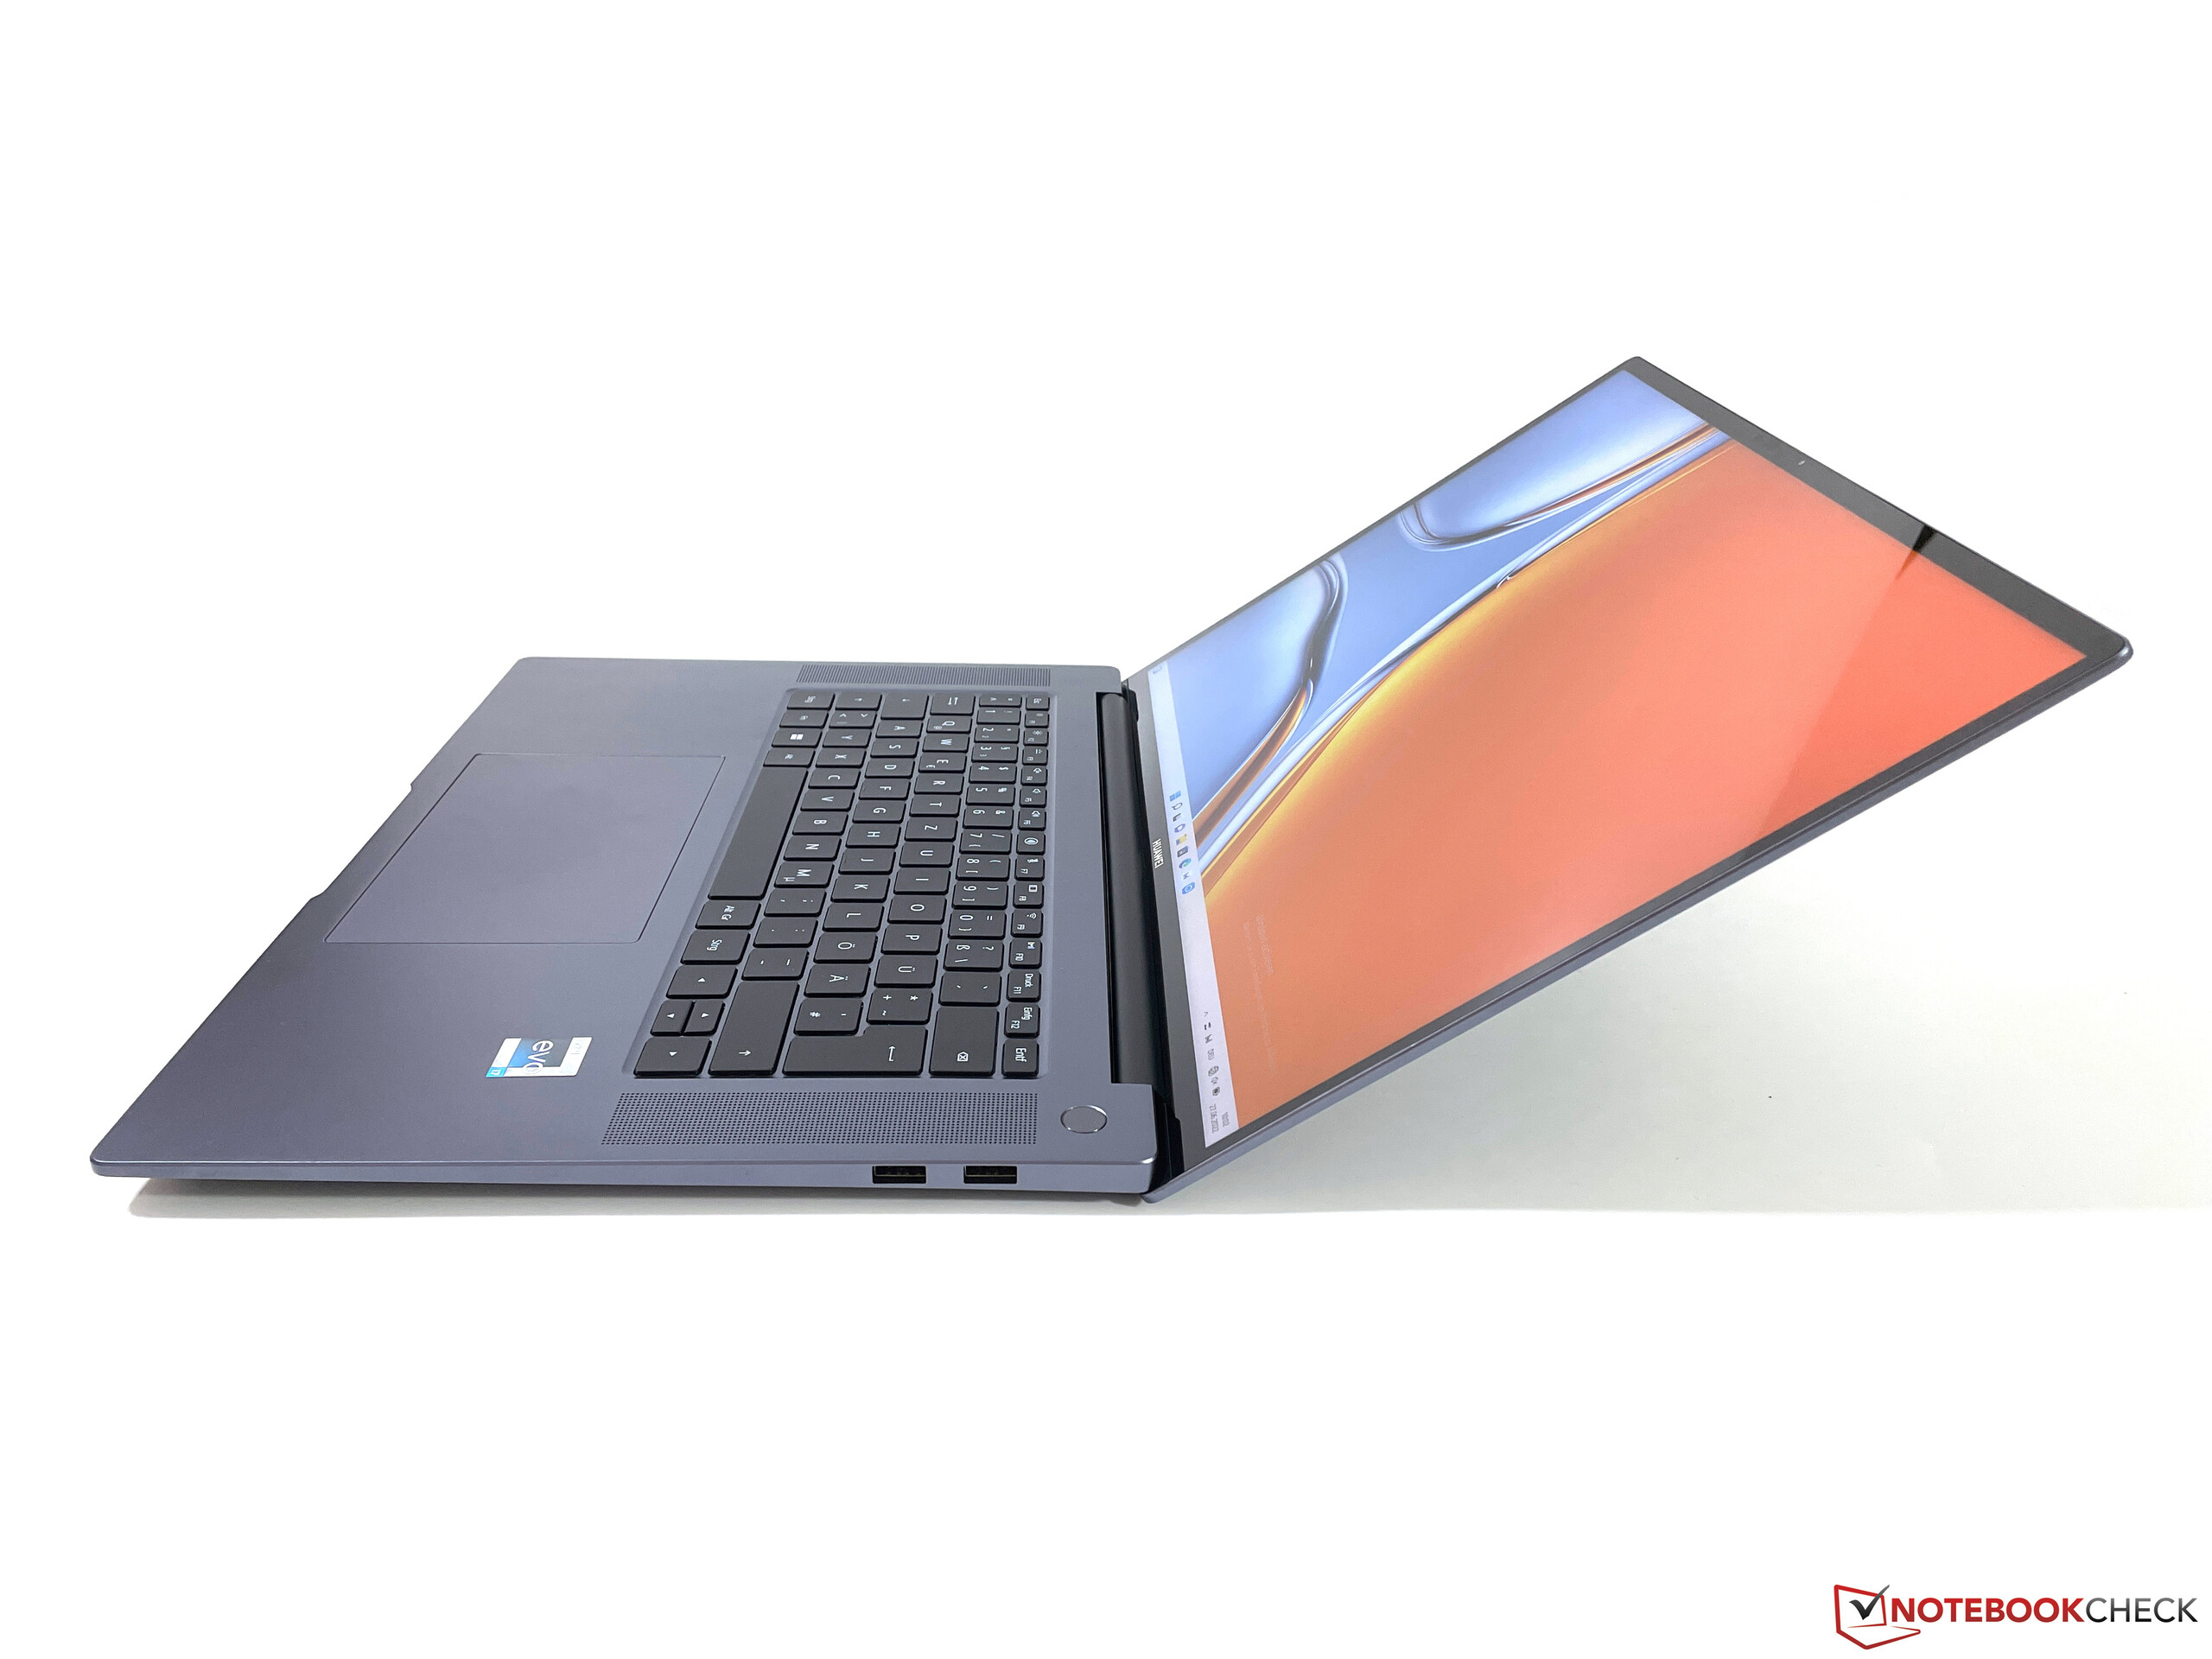
老款MateBook 16的深度增加了1.9毫米,但占地面积本身并没有改变。由于屏幕的3:2纵横比,MateBook 16s的厚度是合理的,但其他16英寸的对比设备并没有更紧凑。它的重量约为2公斤,你可以为90瓦的电源适配器和USB-C电缆再增加240克。
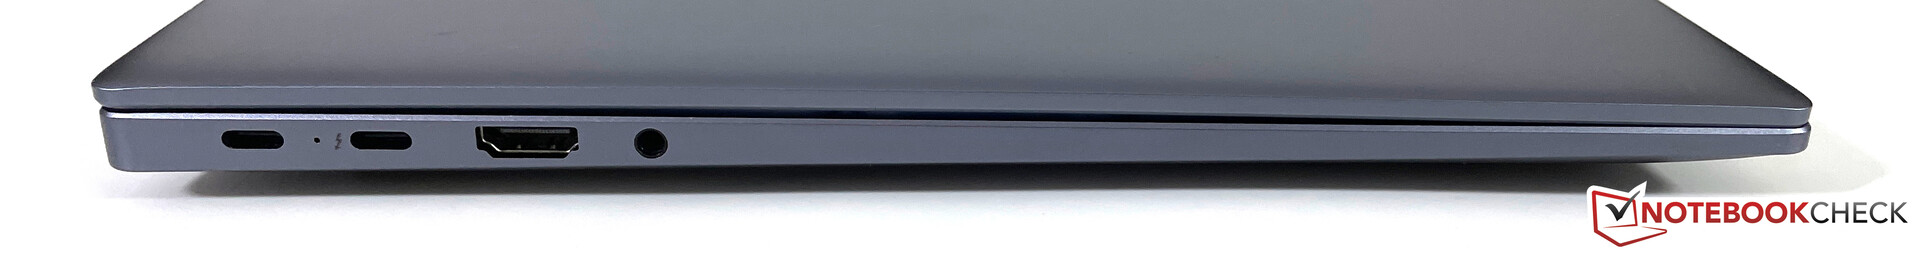
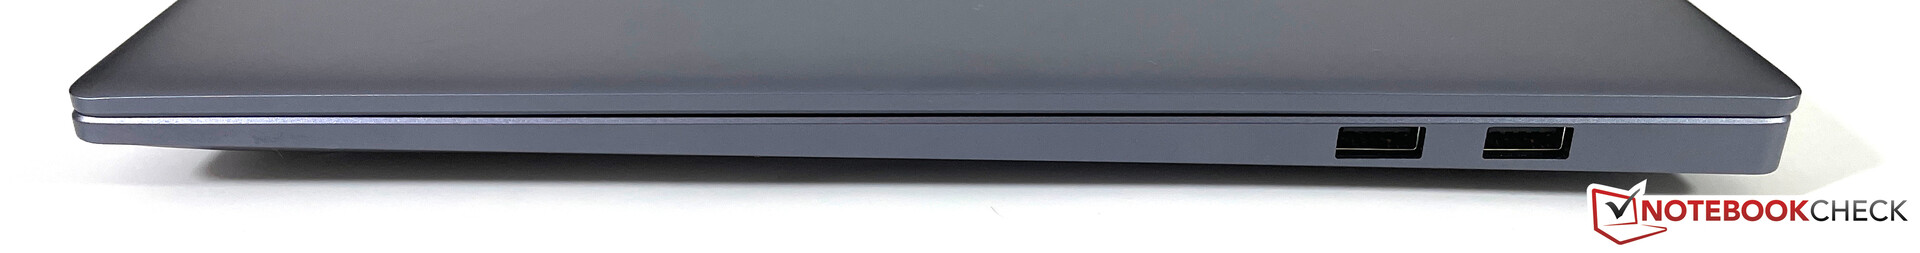
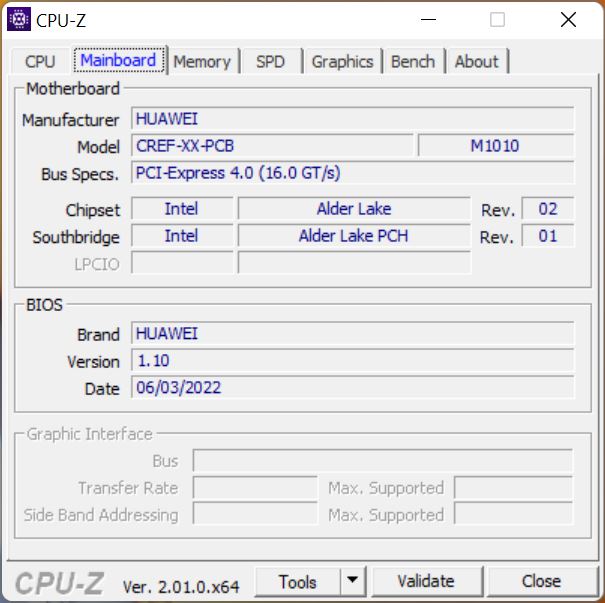
连接性 - 支持Thunderbolt
就端口布局而言,与之相比基本上没有变化。 MateBook 16 AMD.仍然有两个USB-C端口和两个普通的USB-A插座。其中一个USB-C端口现在还支持最先进的Thunderbolt 4协议(40 GBit/s)。实际上,我们只是错过了一个读卡器,为它提供了大量的空间。
沟通
对于WLAN模块,华为也使用了英特尔组件,它已经支持当前的Wi-Fi 6E标准和蓝牙5.2。在我们的测试中,AX211E很容易连接到我们的华硕参考路由器的6GHz网络,并实现了非常高的、最重要的、稳定的传输速率。不同于其 前代产品芯片,WLAN模块不能再被替换。
网络摄像头
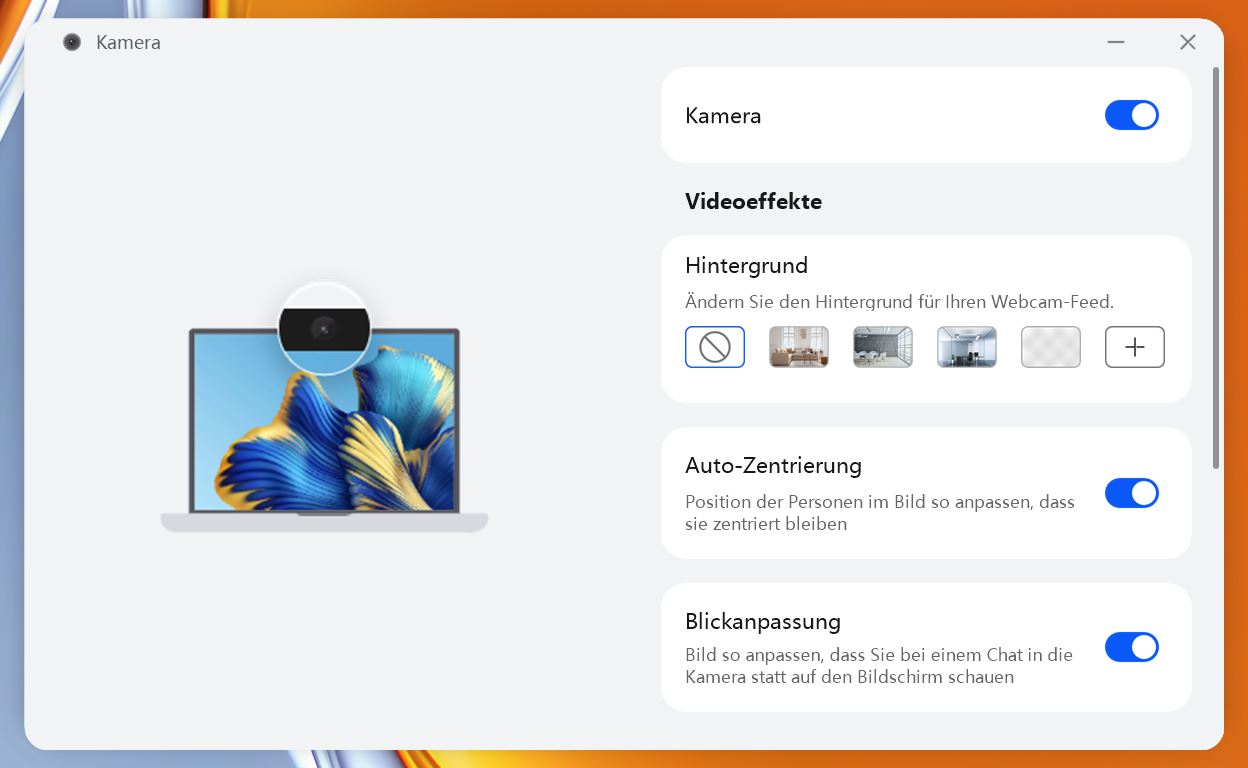
网络摄像头也进行了升级。1080p的传感器取代了720p的模块,并提供稍好的图像质量。华为推出的AI功能也很有趣。与Apple 设备一样,而且这在实践中效果很好,摄像头可以跟随用户,使其看起来像用户的眼睛直接盯着摄像头。还可以使用背景过滤器(与所使用的应用程序无关),但不能与用户跟踪相结合。当使用网络摄像头的高级功能时,我们注意到,视频录制明显地更颠簸。显然,这里还有一些工作要做。


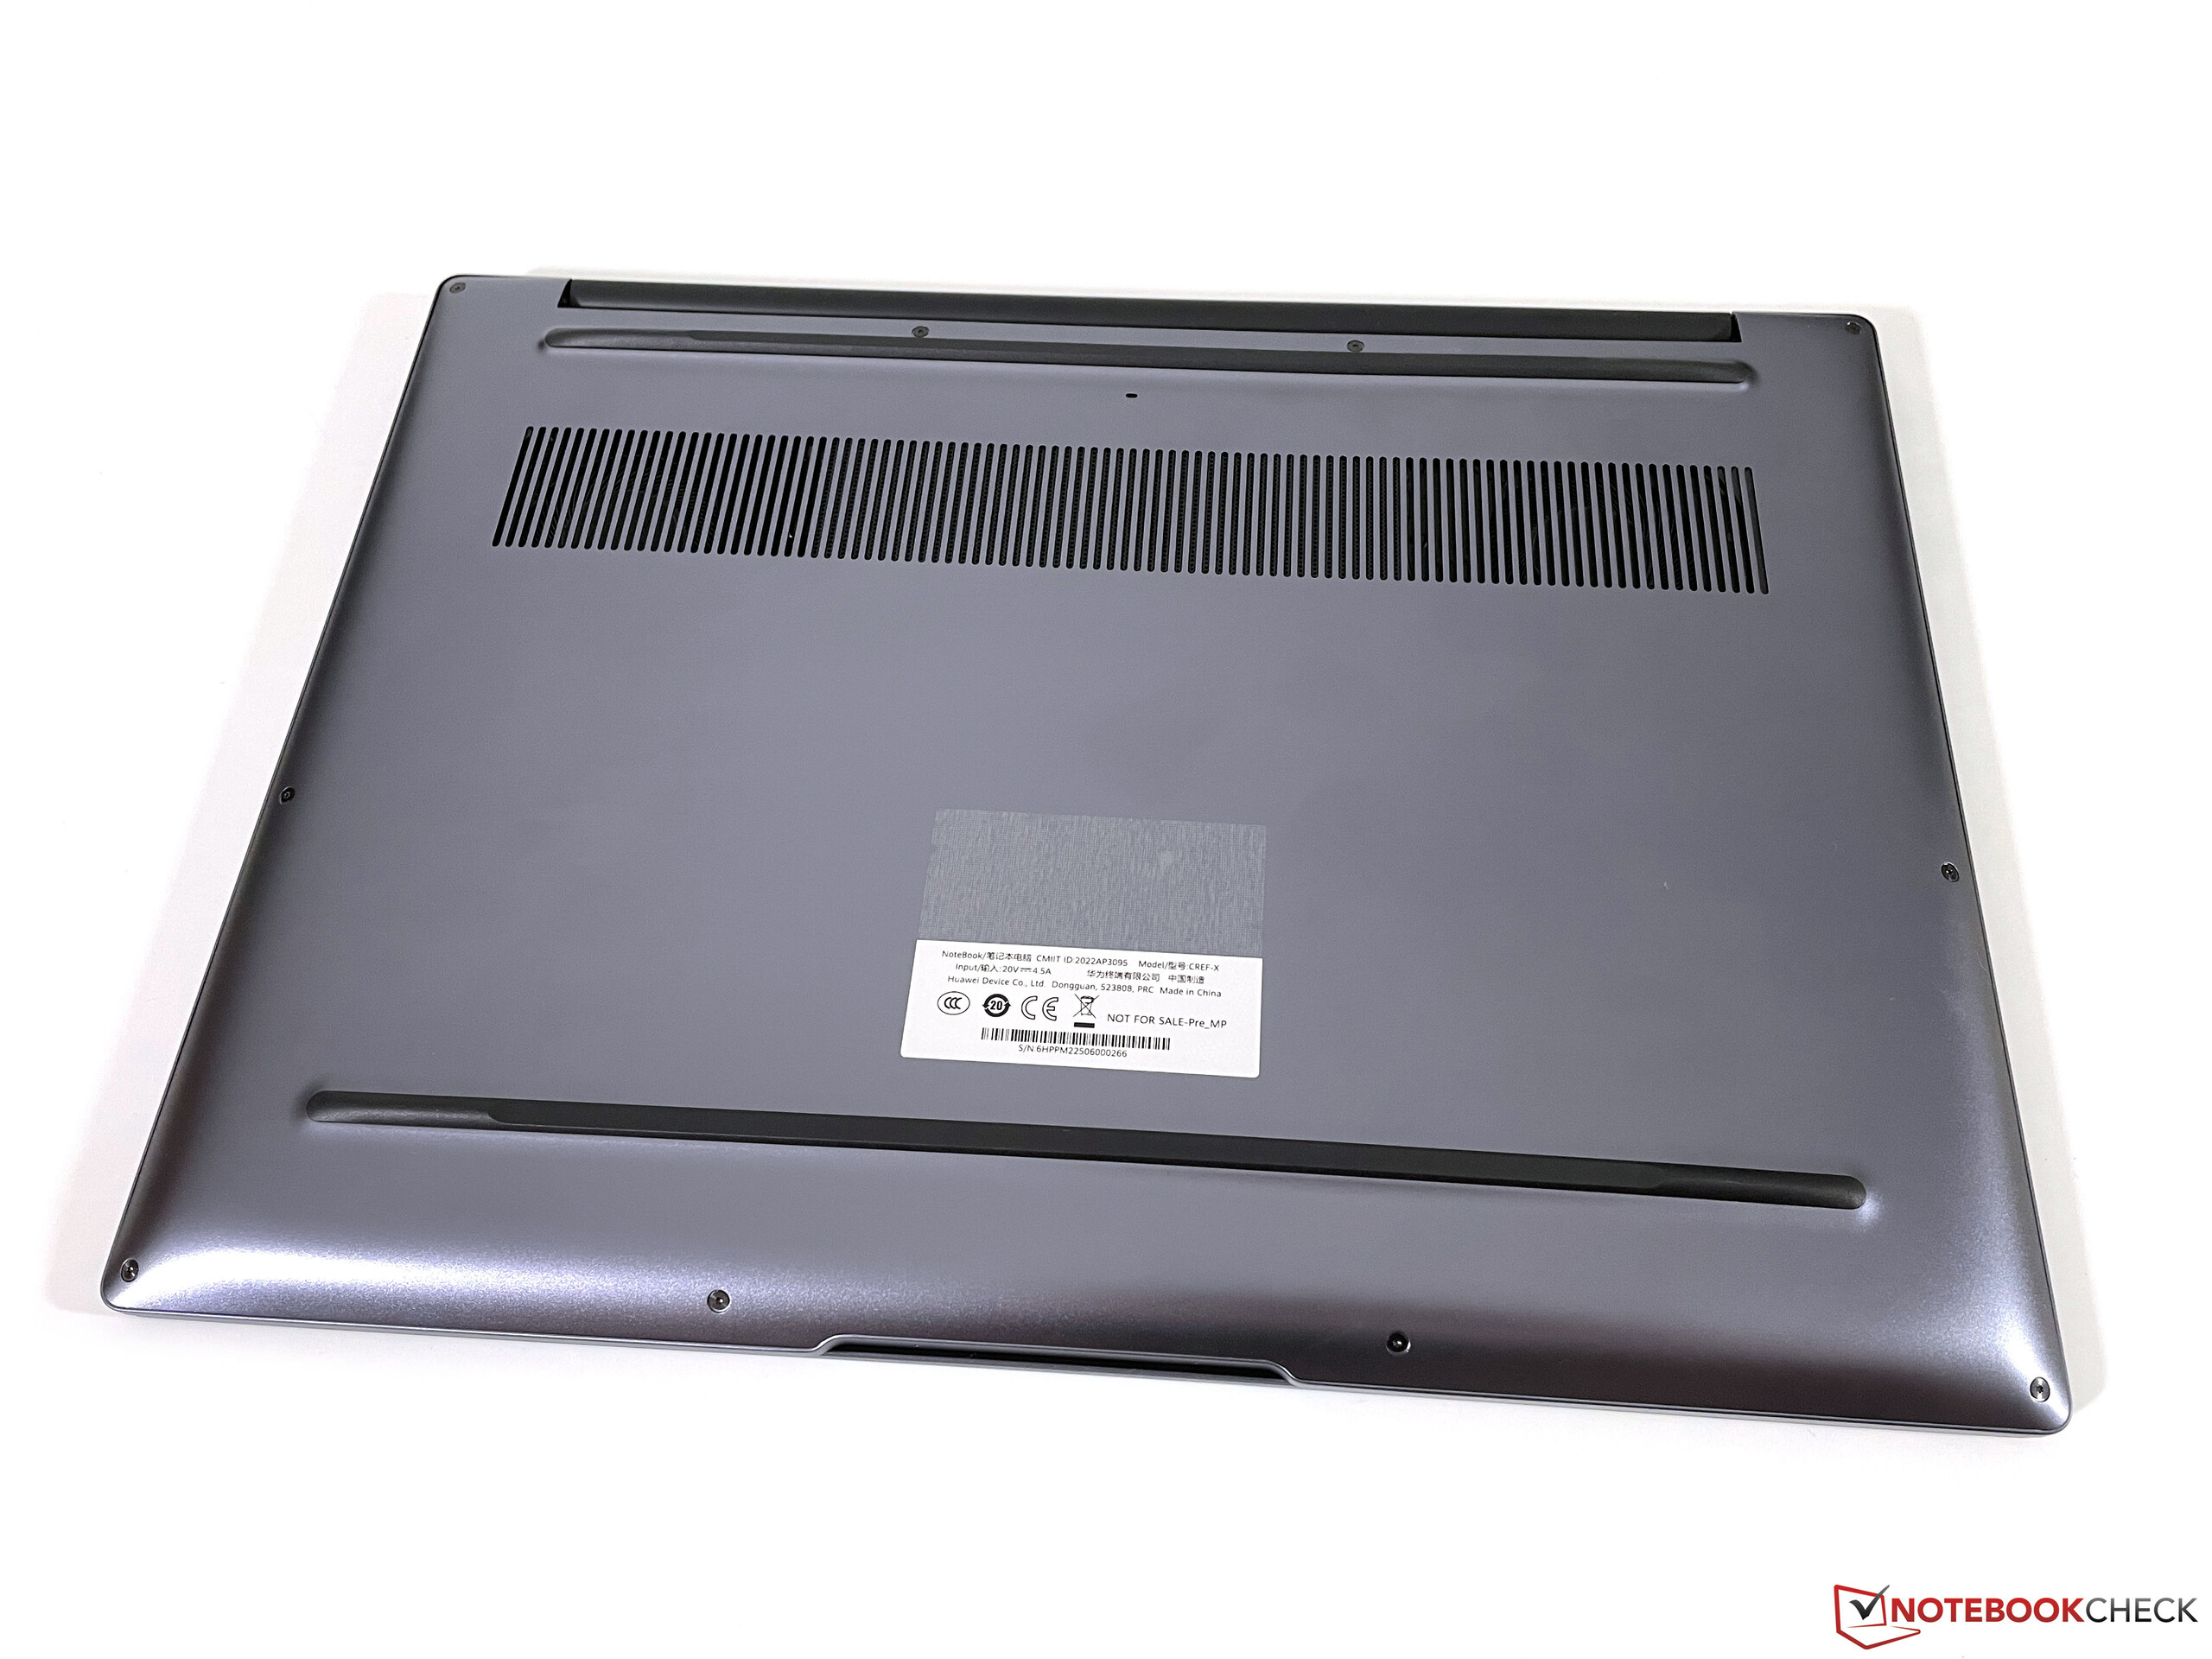
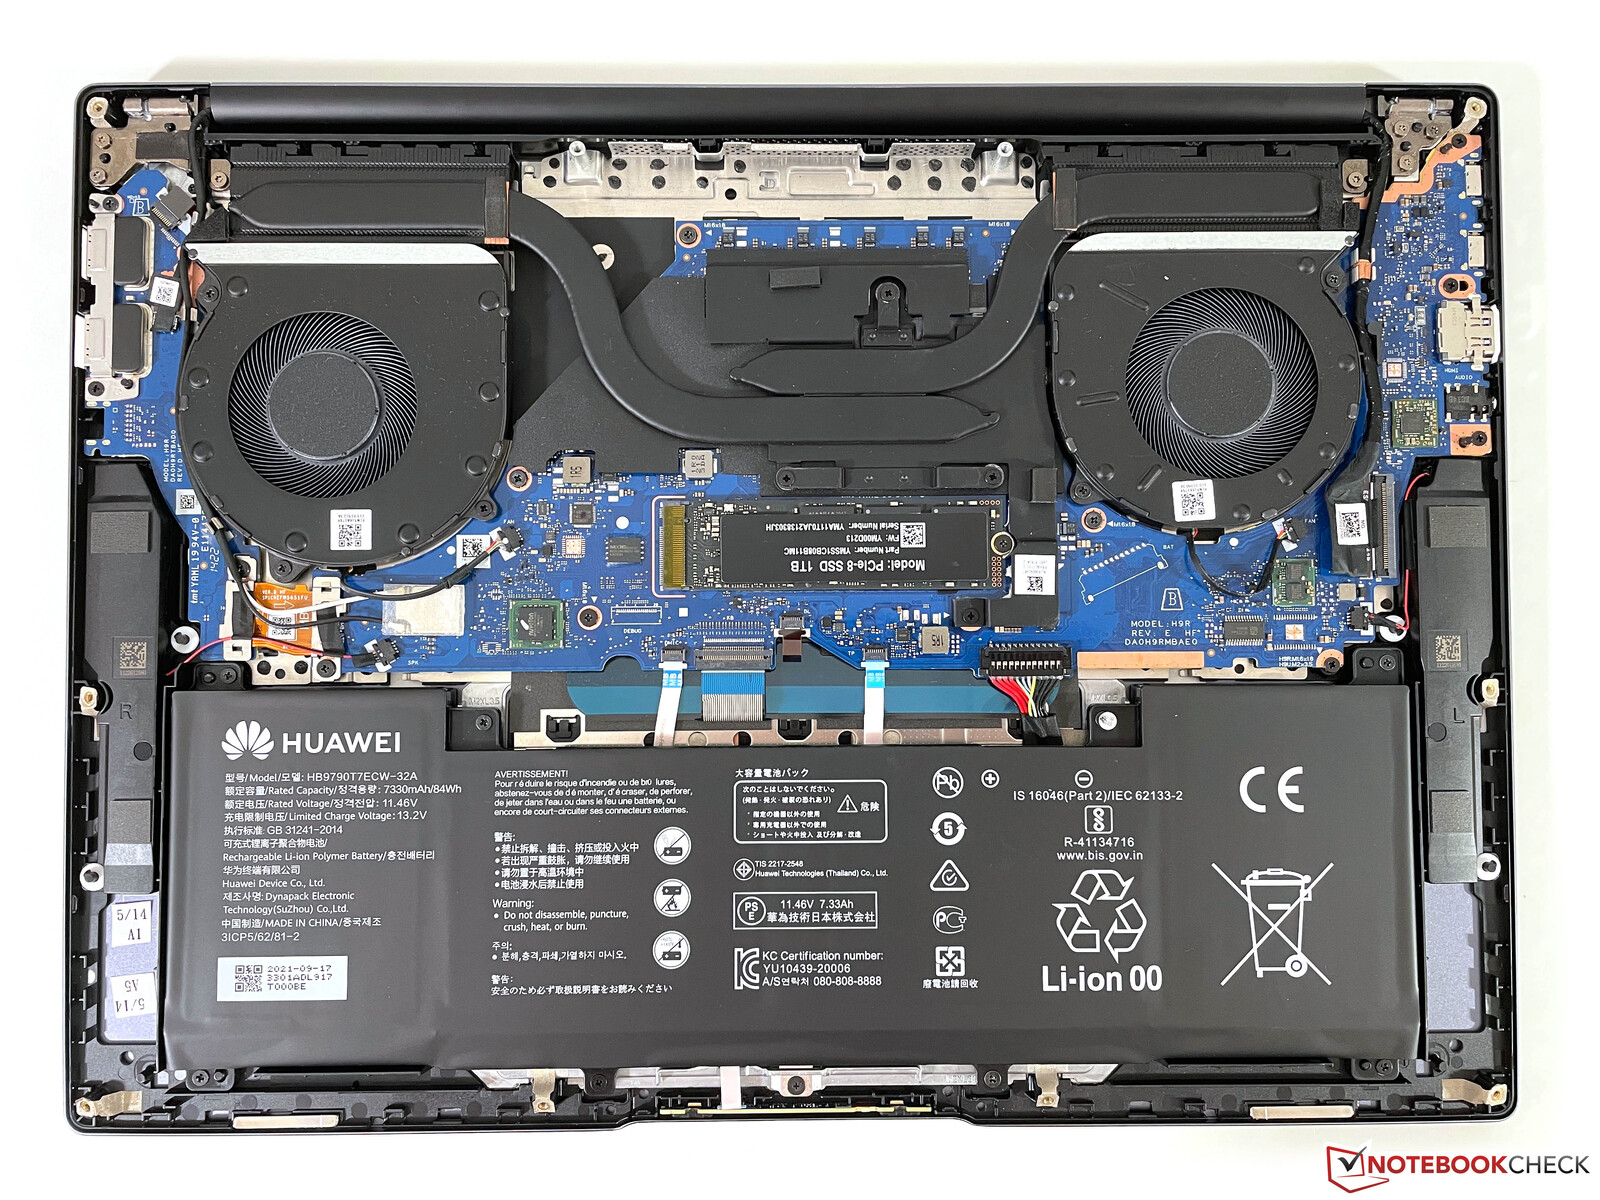
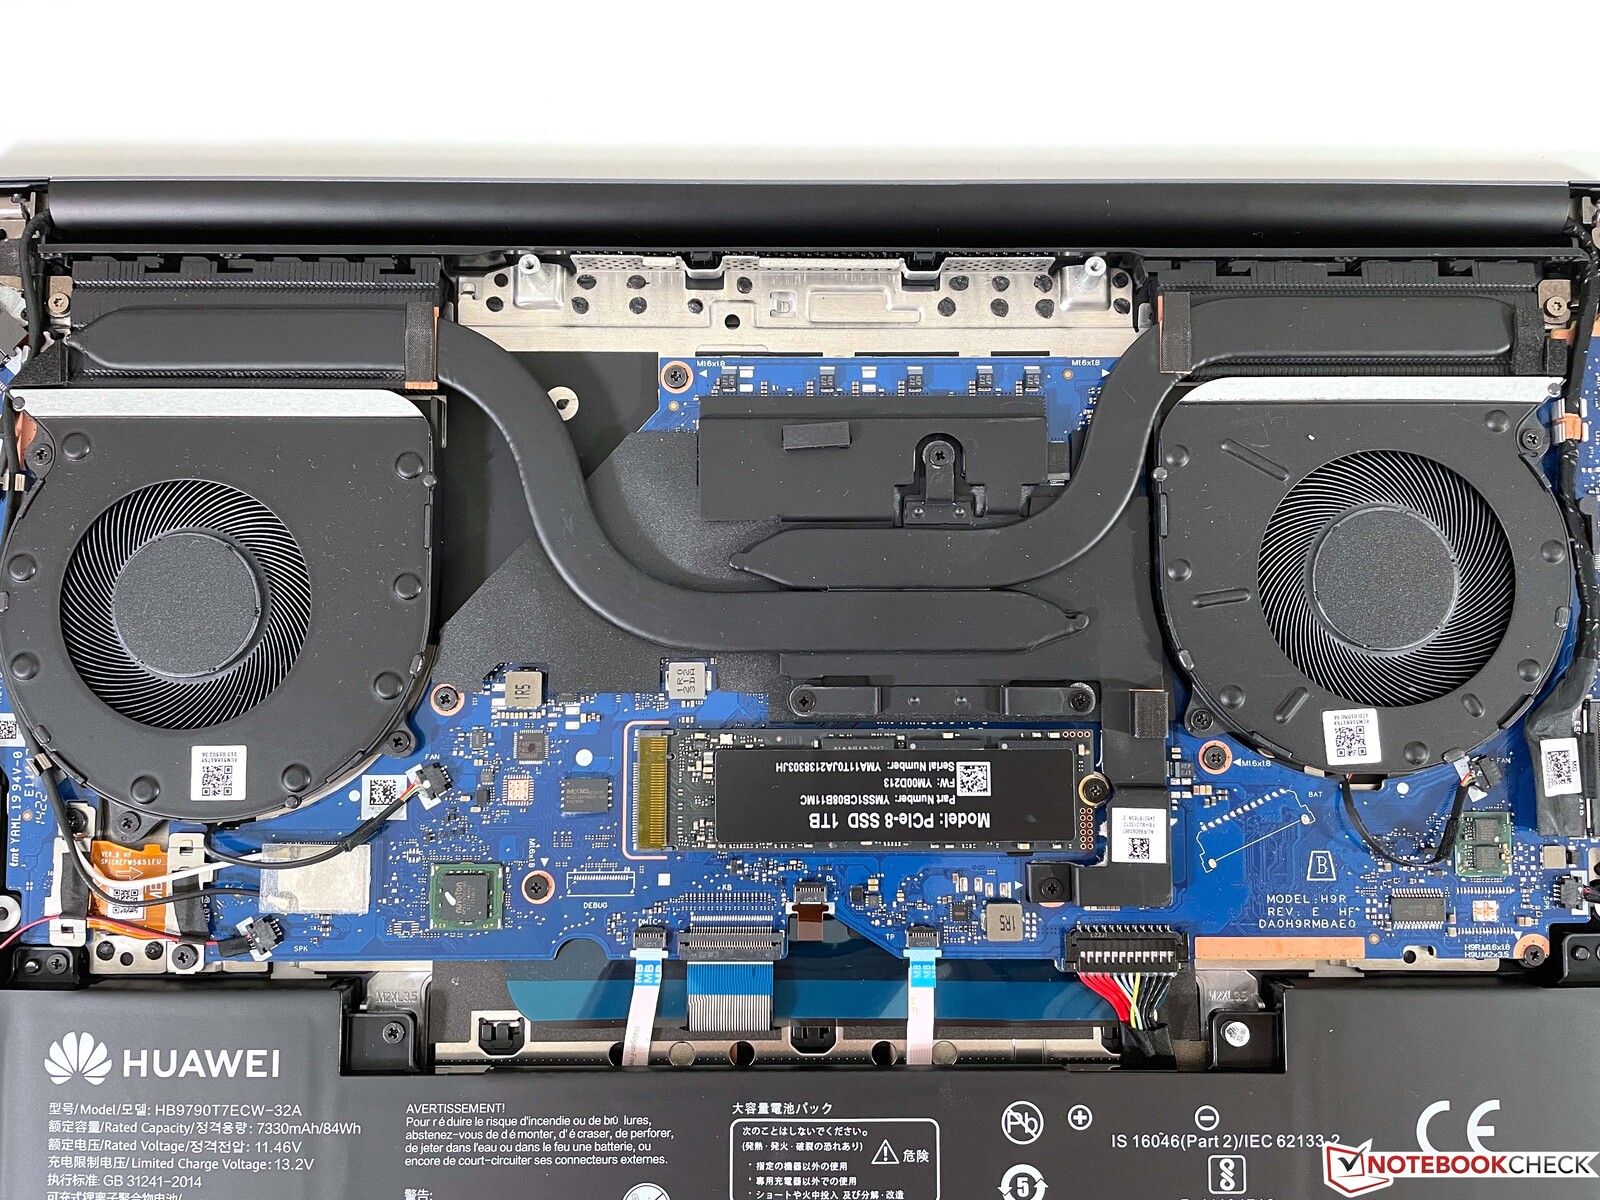
维护
底部面板用Torx螺丝(T5)固定,很容易拆卸。现在,WLAN模块被焊接在主板上,所以维护选项仅限于M.2-2280固态硬盘和风扇清洁。
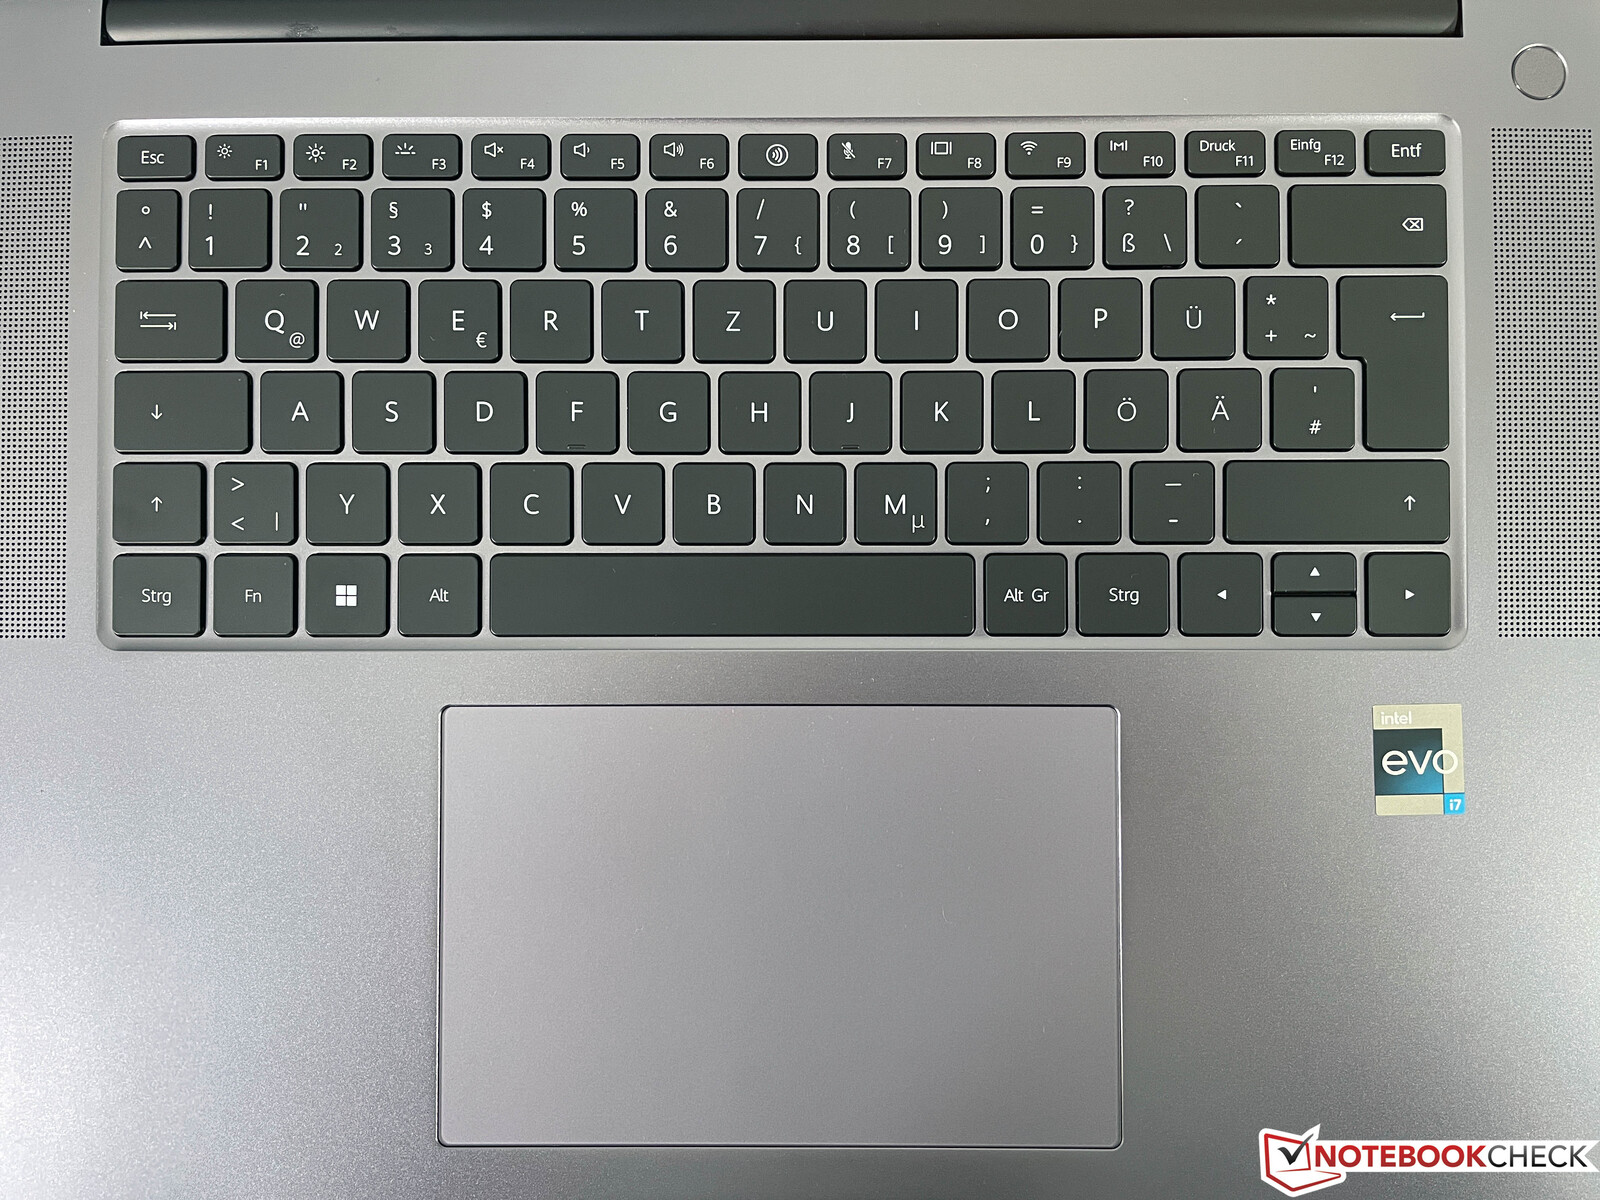
输入设备 - 华为现在有1.5毫米的键程
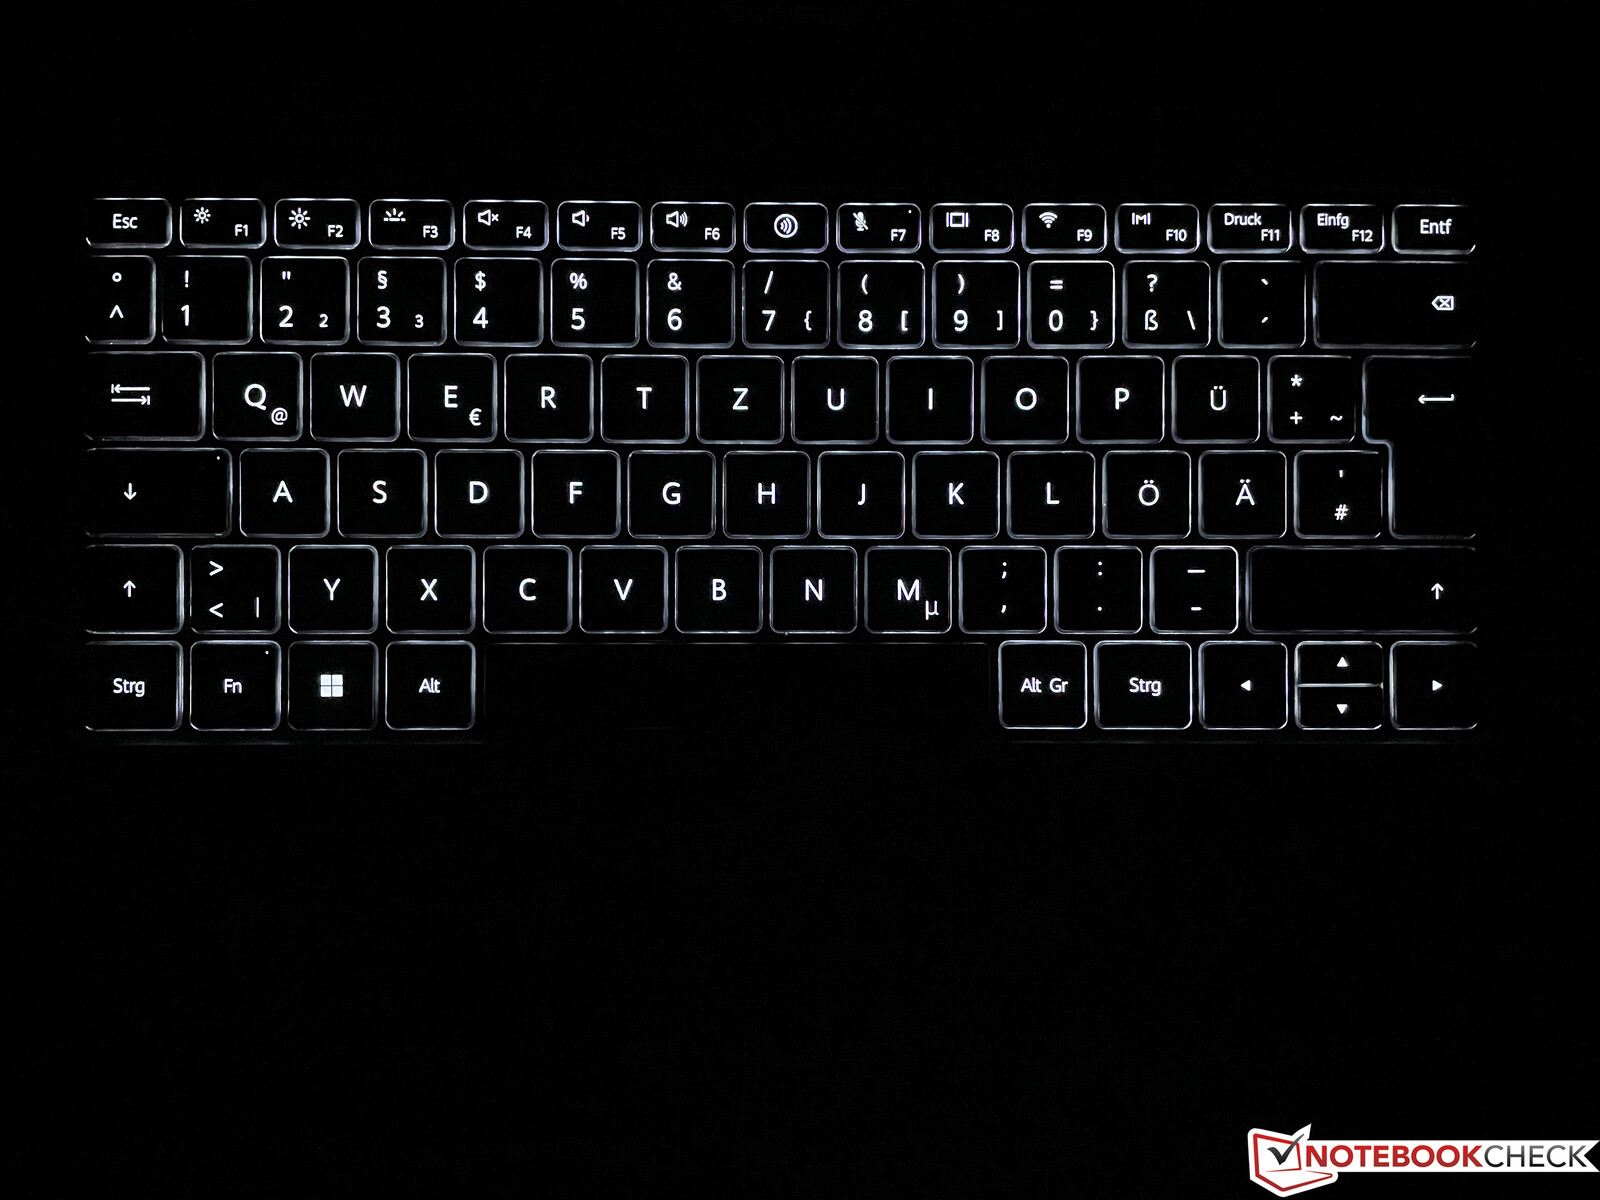
虽然更便宜的MateBook D16有一个完整的数字键盘,但华为仍然忠实于MateBook 16熟悉的布局,并坚持将扬声器放在键盘旁边的做法。然而,有一个值得欢迎的变化是,按键行程从1.3毫米增加到1.5毫米。经主观测量,触感也非常好。但是,与前代产品一样,一些按键往往会有一些响声,这在一定程度上降低了感知质量。两级白色键盘背光不能自动打开。电源按钮放在键盘的正上方,同时也是一个指纹扫描仪,效果不错。
大型ClickPad仍能顺利工作,但点击的声音仍然相当大。因此,我们的建议是,在输入时只需轻轻触碰该板。电容式触摸屏也没有出现问题。
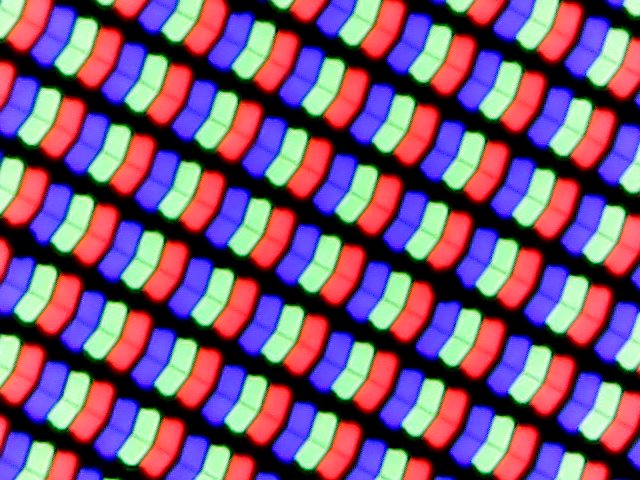
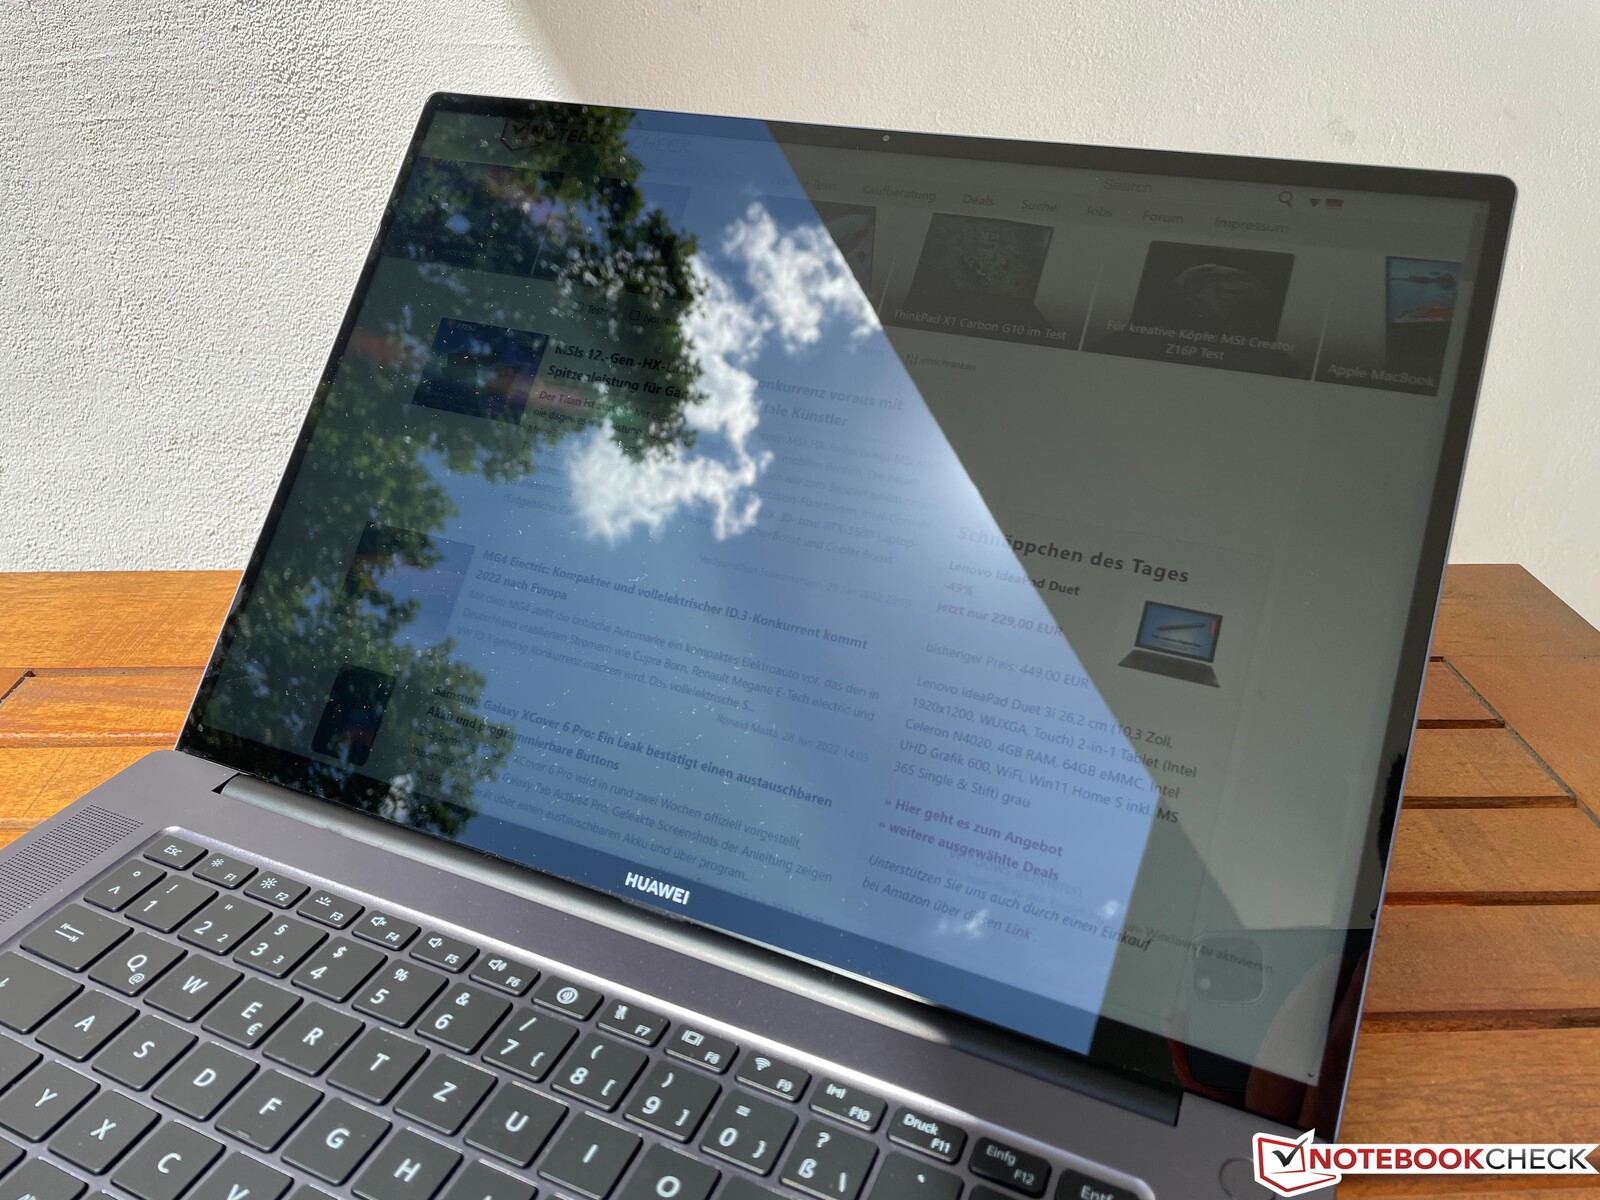
显示屏 - 3:2 IPS面板保持不变
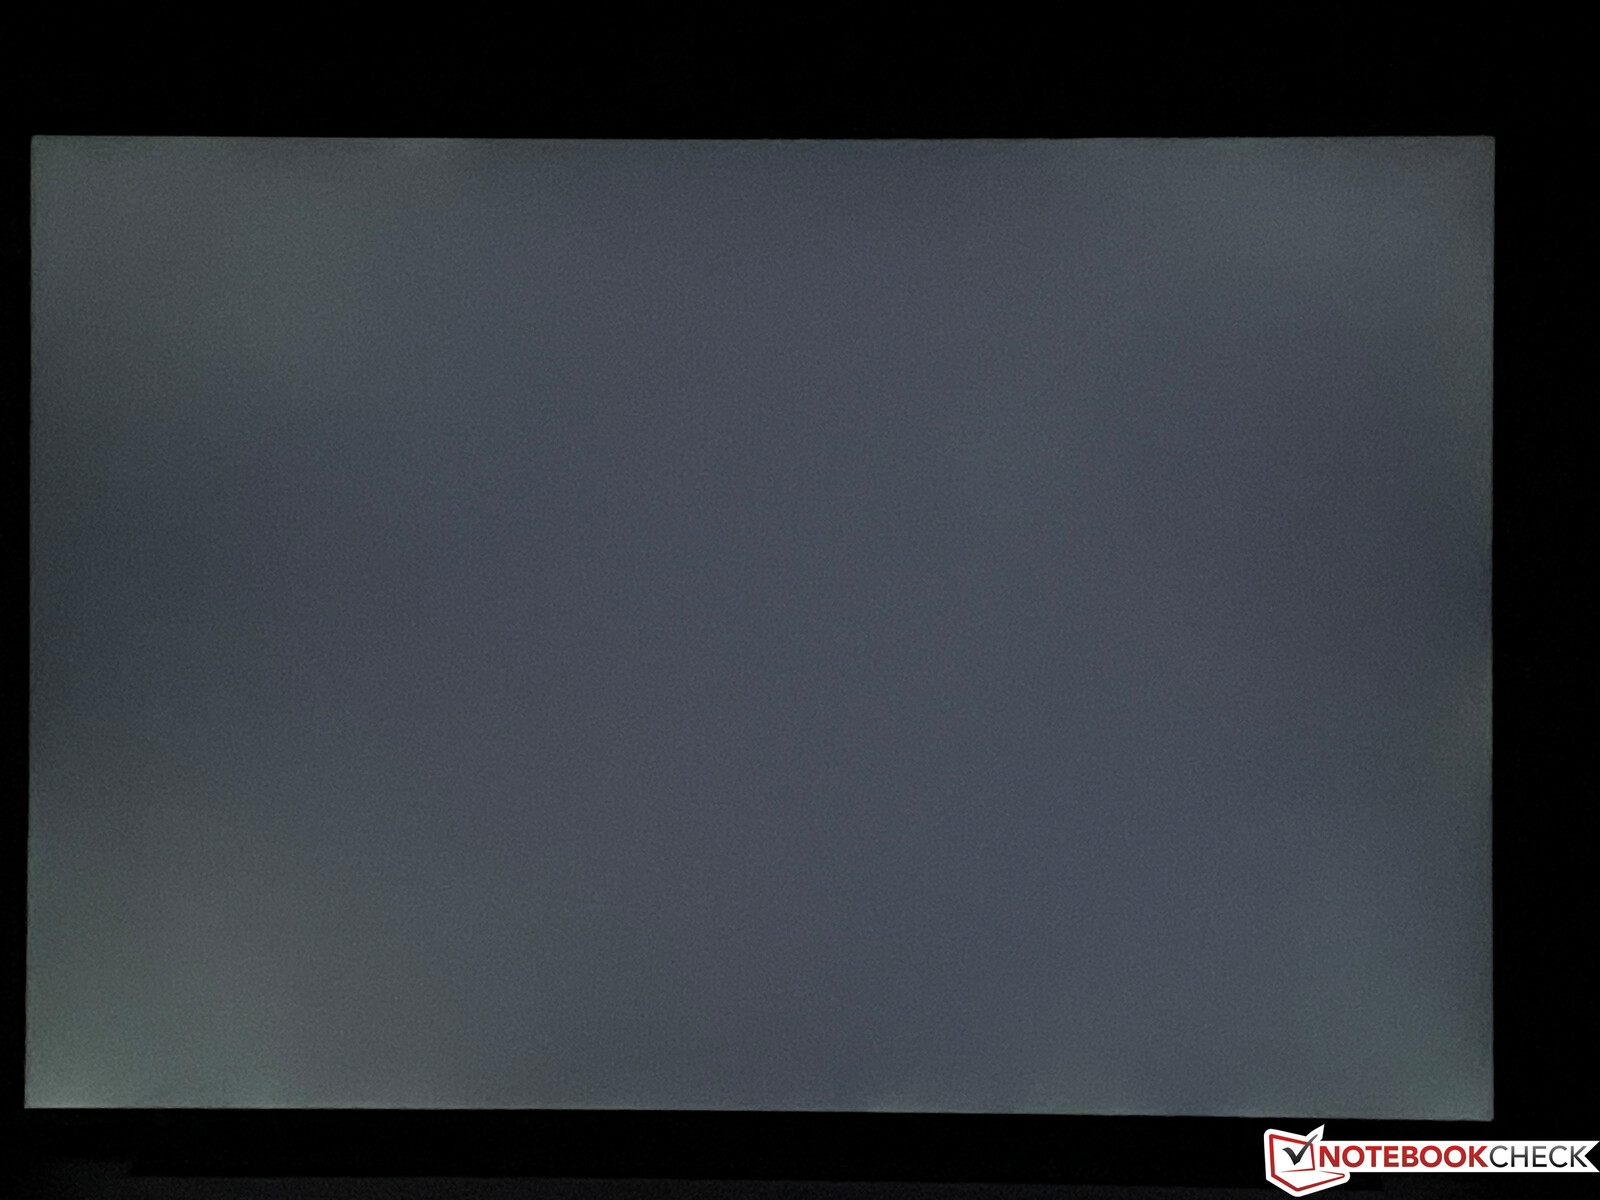
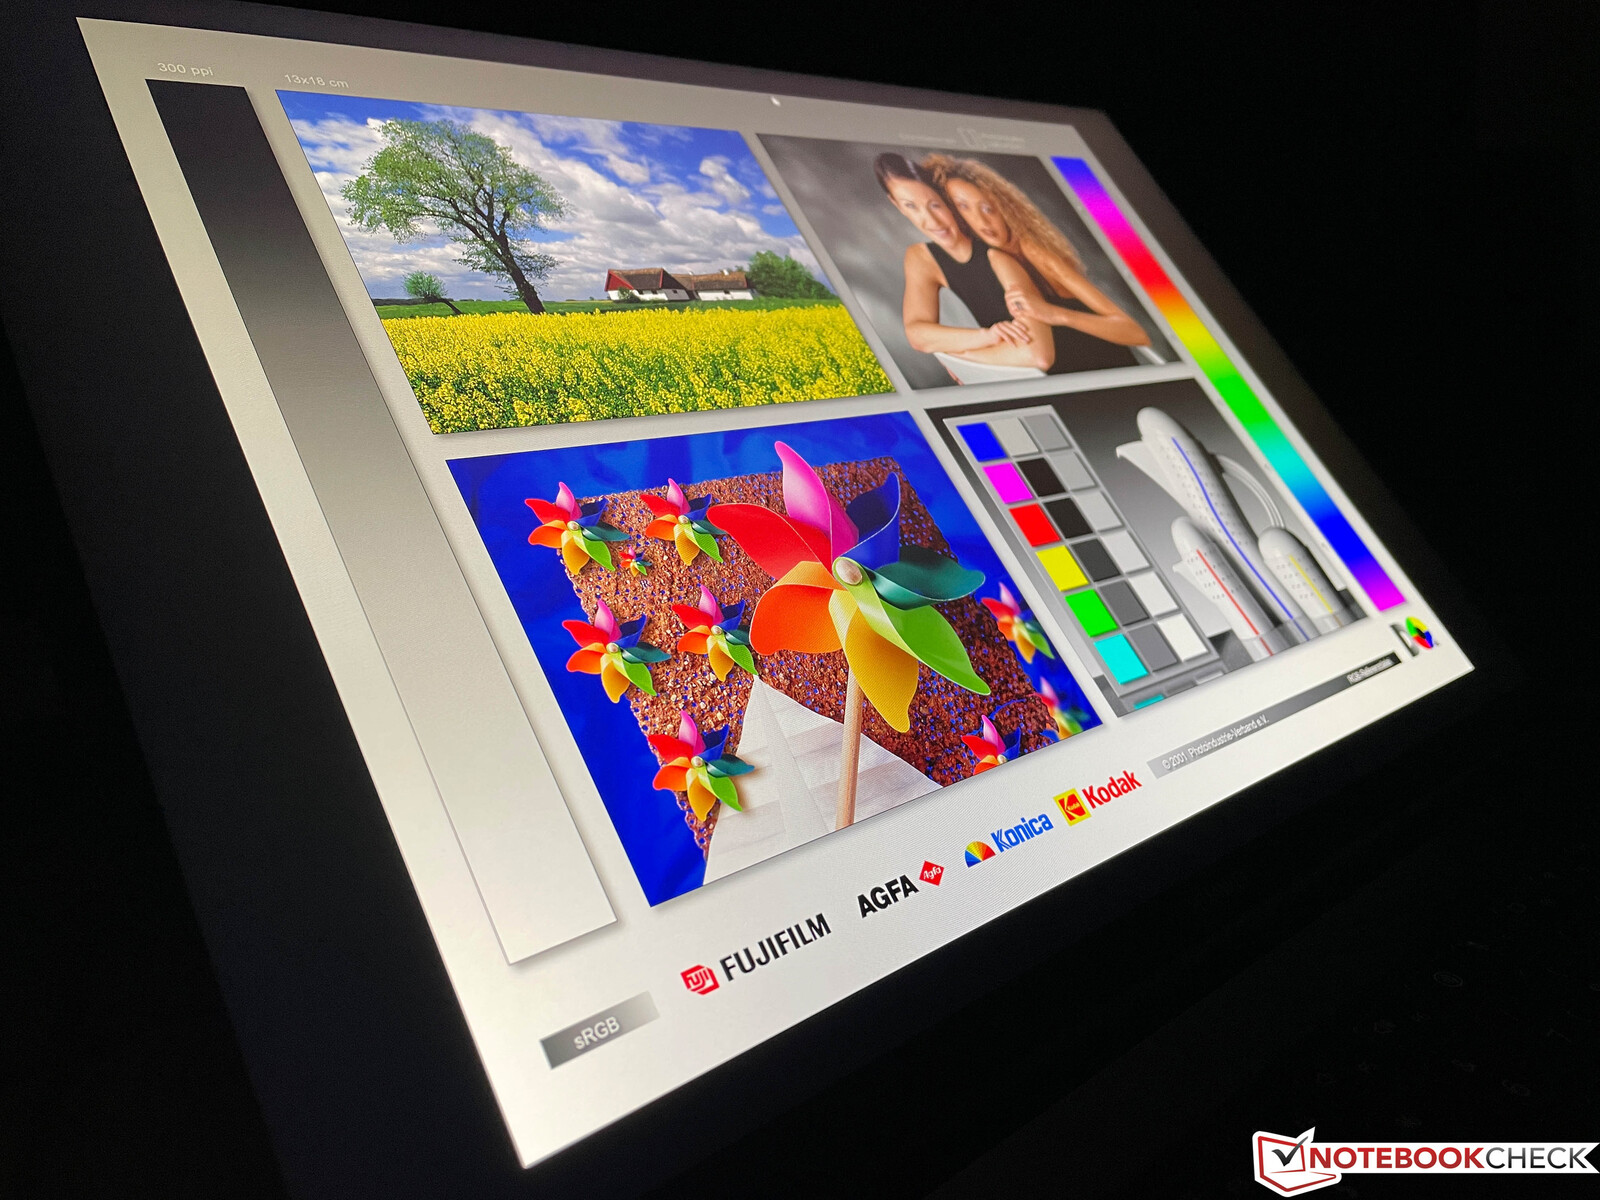
说到显示屏,我们可以保持简短的分析。我们已经熟悉了MateBook 16的3:2 16英寸IPS面板。事实上,使用的是相同的显示屏幕。主观上,图像印象再次非常好,但我们的测试设备这次不那么明亮(但仍然高于宣传的300cd/m²)。黑度也是令人愉快的低,并确保了高对比度。响应时间很好,背光出血不是一个问题,我们也检测不到任何PWM。IPS面板的可视角度稳定性也非常好。
然而,鉴于现在较高的价格,我们对该显示面板仍有不满。特别是考虑到高反射率的表面,其亮度水平应该更高。更重要的是,没有用于自动亮度控制的亮度传感器,也没有更高的90或120 Hz刷新率。
| |||||||||||||||||||||||||
Brightness Distribution: 91 %
Center on Battery: 309 cd/m²
Contrast: 1829:1 (Black: 0.17 cd/m²)
ΔE ColorChecker Calman: 1 | ∀{0.5-29.43 Ø4.71}
calibrated: 0.8
ΔE Greyscale Calman: 1.5 | ∀{0.09-98 Ø4.96}
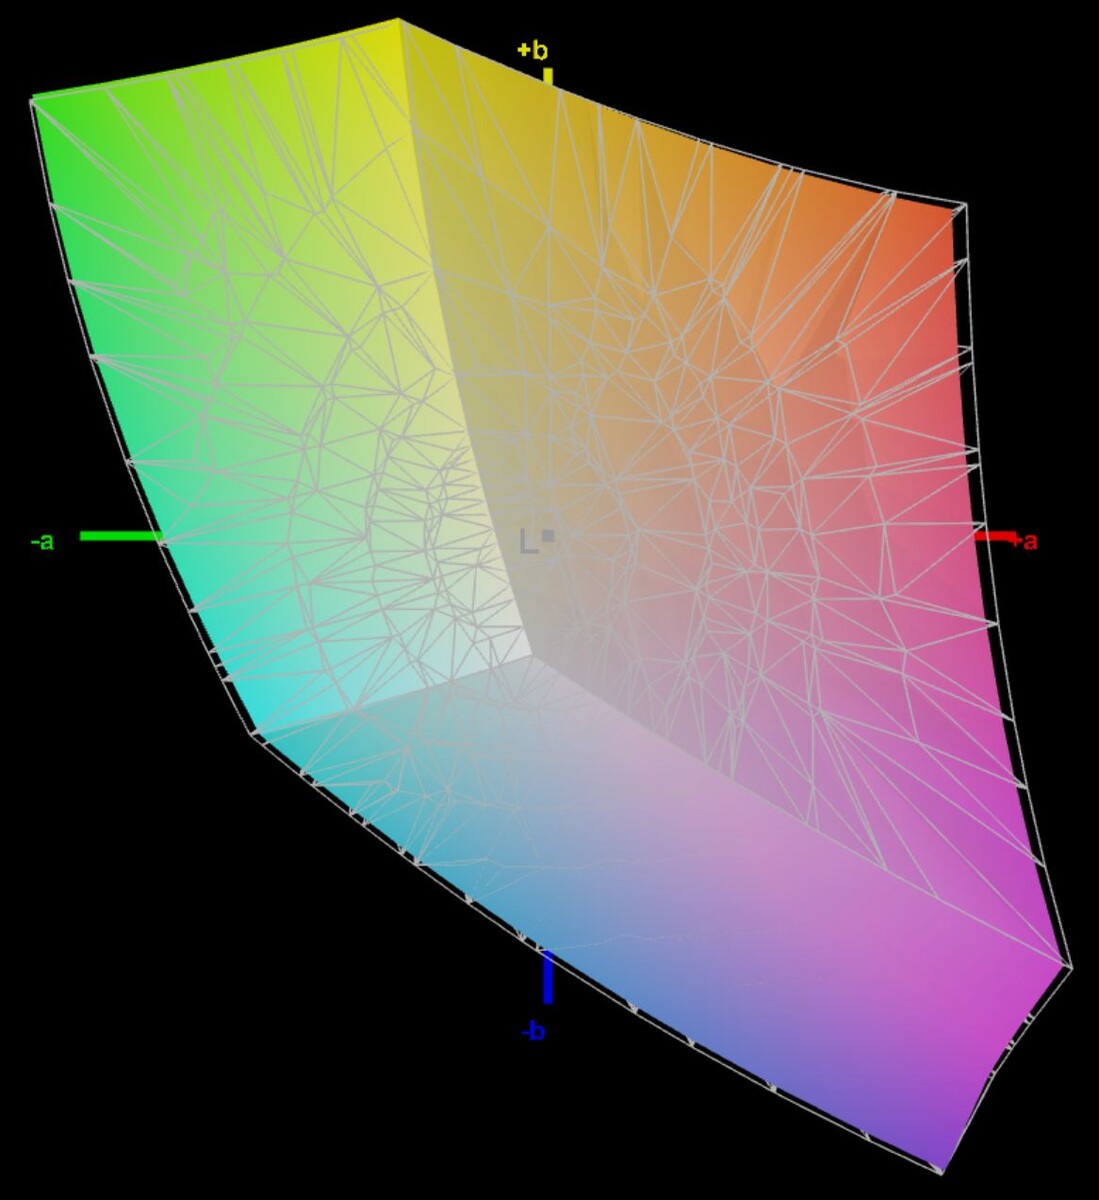
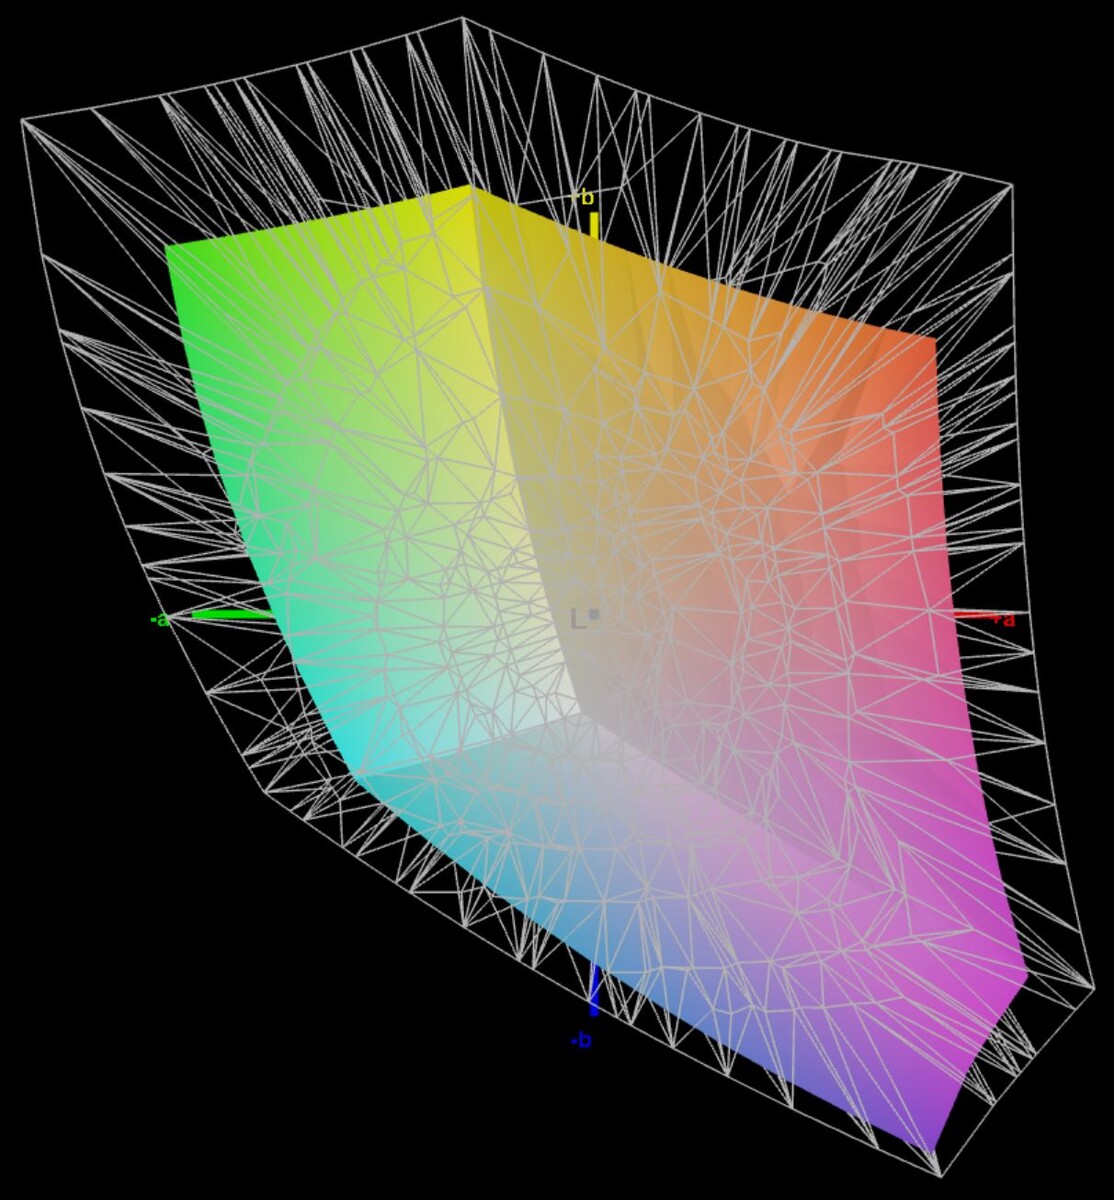
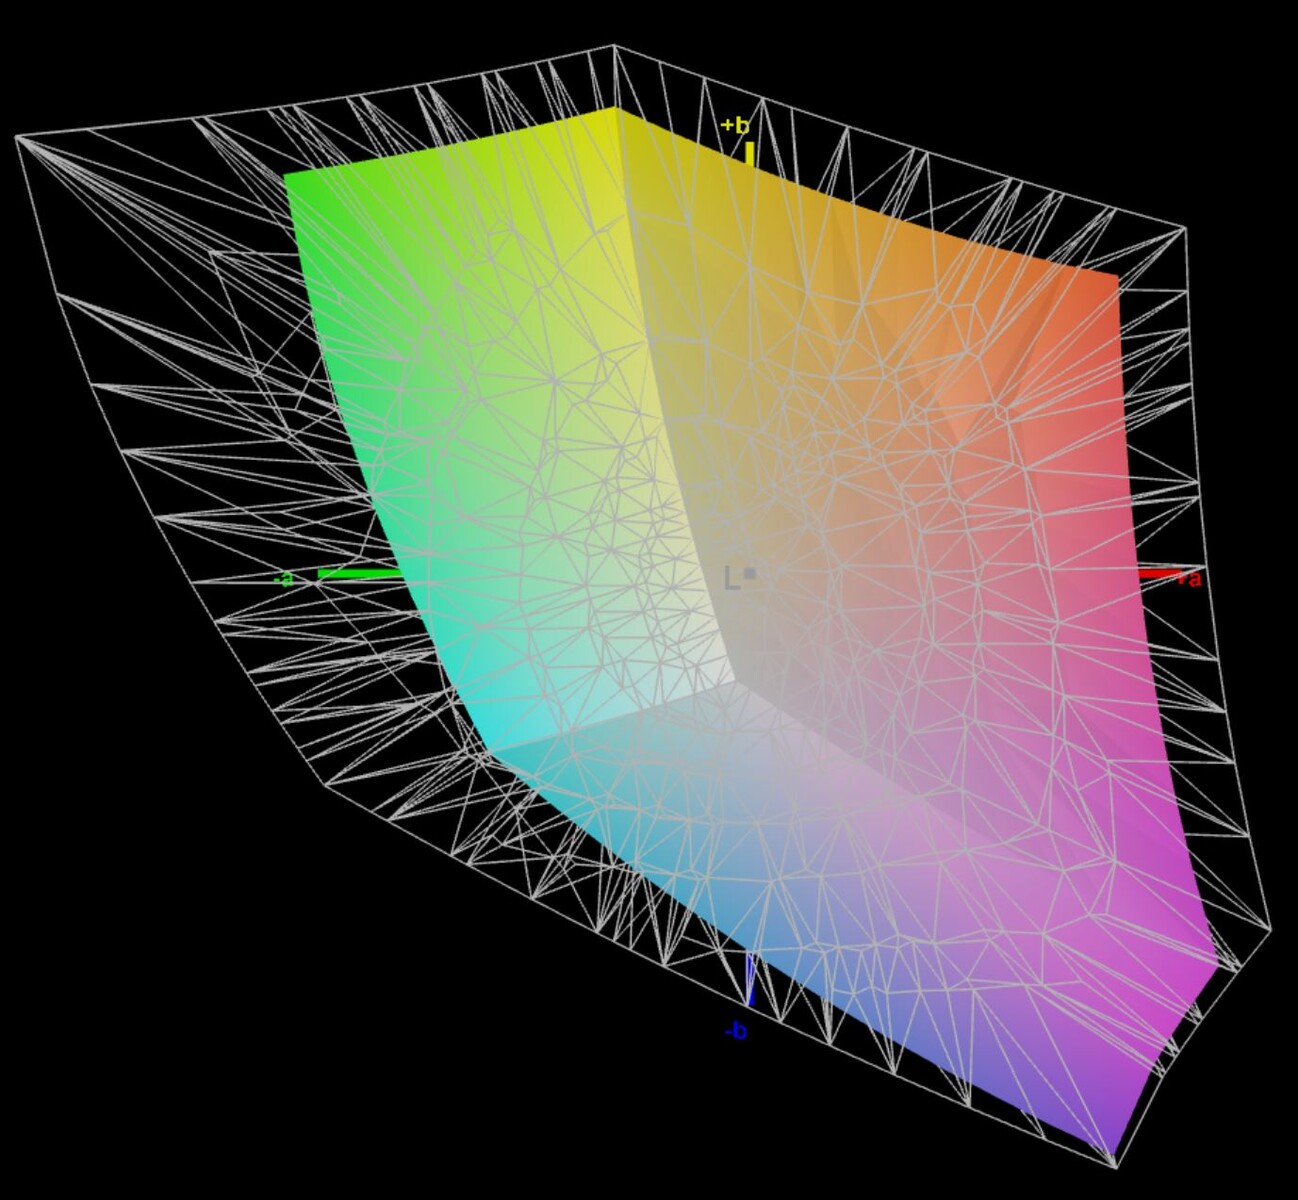
66.6% AdobeRGB 1998 (Argyll 3D)
96.7% sRGB (Argyll 3D)
64.5% Display P3 (Argyll 3D)
Gamma: 2.15
CCT: 6432 K
| Huawei MateBook 16s i7 BOE XS TV160DKT-NH0, IPS, 2520x1680, 16" | Huawei MateBook 16 R7 5800H BOE TV160DKT-NH0, , 2520x1680, 16" | Dell Inspiron 16 7620 2-in-1 BOE NV16N45, IPS, 1920x1200, 16" | Dell XPS 15 9510 i5 11400H FHD Sharp LQ156N1, IPS, 1920x1200, 15.6" | LG Gram 16 (2021) LG Philips LP160WQ1-SPA1, IPS, 2560x1600, 16" | |
|---|---|---|---|---|---|
| Display | -2% | 2% | 16% | 26% | |
| Display P3 Coverage (%) | 64.5 | 63.1 -2% | 67 4% | 80.9 25% | 95.8 49% |
| sRGB Coverage (%) | 96.7 | 94.9 -2% | 95.9 -1% | 100 3% | 99.8 3% |
| AdobeRGB 1998 Coverage (%) | 66.6 | 65.1 -2% | 69.3 4% | 79.1 19% | 83.8 26% |
| Response Times | -15% | 10% | -71% | -5% | |
| Response Time Grey 50% / Grey 80% * (ms) | 35.7 ? | 41.2 ? -15% | 32 ? 10% | 62.4 ? -75% | 44 ? -23% |
| Response Time Black / White * (ms) | 23.2 ? | 26.4 ? -14% | 20.8 ? 10% | 38.8 ? -67% | 20 ? 14% |
| PWM Frequency (Hz) | |||||
| Screen | -25% | -133% | -85% | -172% | |
| Brightness middle (cd/m²) | 311 | 357 15% | 320.7 3% | 632 103% | 331 6% |
| Brightness (cd/m²) | 319 | 349 9% | 309 -3% | 606 90% | 309 -3% |
| Brightness Distribution (%) | 91 | 93 2% | 90 -1% | 91 0% | 88 -3% |
| Black Level * (cd/m²) | 0.17 | 0.21 -24% | 0.36 -112% | 0.29 -71% | 0.22 -29% |
| Contrast (:1) | 1829 | 1700 -7% | 891 -51% | 2179 19% | 1505 -18% |
| Colorchecker dE 2000 * | 1 | 1.6 -60% | 4.18 -318% | 3.5 -250% | 4.64 -364% |
| Colorchecker dE 2000 max. * | 1.7 | 3.9 -129% | 8.48 -399% | 6.4 -276% | 9.82 -478% |
| Colorchecker dE 2000 calibrated * | 0.8 | 0.6 25% | 0.77 4% | 2 -150% | 3.16 -295% |
| Greyscale dE 2000 * | 1.5 | 2.4 -60% | 6.3 -320% | 5 -233% | 6.9 -360% |
| Gamma | 2.15 102% | 2.14 103% | 2.21 100% | 2.26 97% | 2.34 94% |
| CCT | 6432 101% | 6728 97% | 6258 104% | 7033 92% | 7904 82% |
| Color Space (Percent of AdobeRGB 1998) (%) | 75.1 | ||||
| Color Space (Percent of sRGB) (%) | 100 | ||||
| Total Average (Program / Settings) | -14% /
-19% | -40% /
-84% | -47% /
-62% | -50% /
-105% |
* ... smaller is better
根据华为的说法,所有显示面板都在工厂进行了校准,我们可以证实这一点。我们使用专业的CalMAN软件(X-Rite i1 Pro 2)进行的分析显示,在出厂时只有非常小的偏差;无论是颜色还是灰度。也没有色温或偏色的问题。
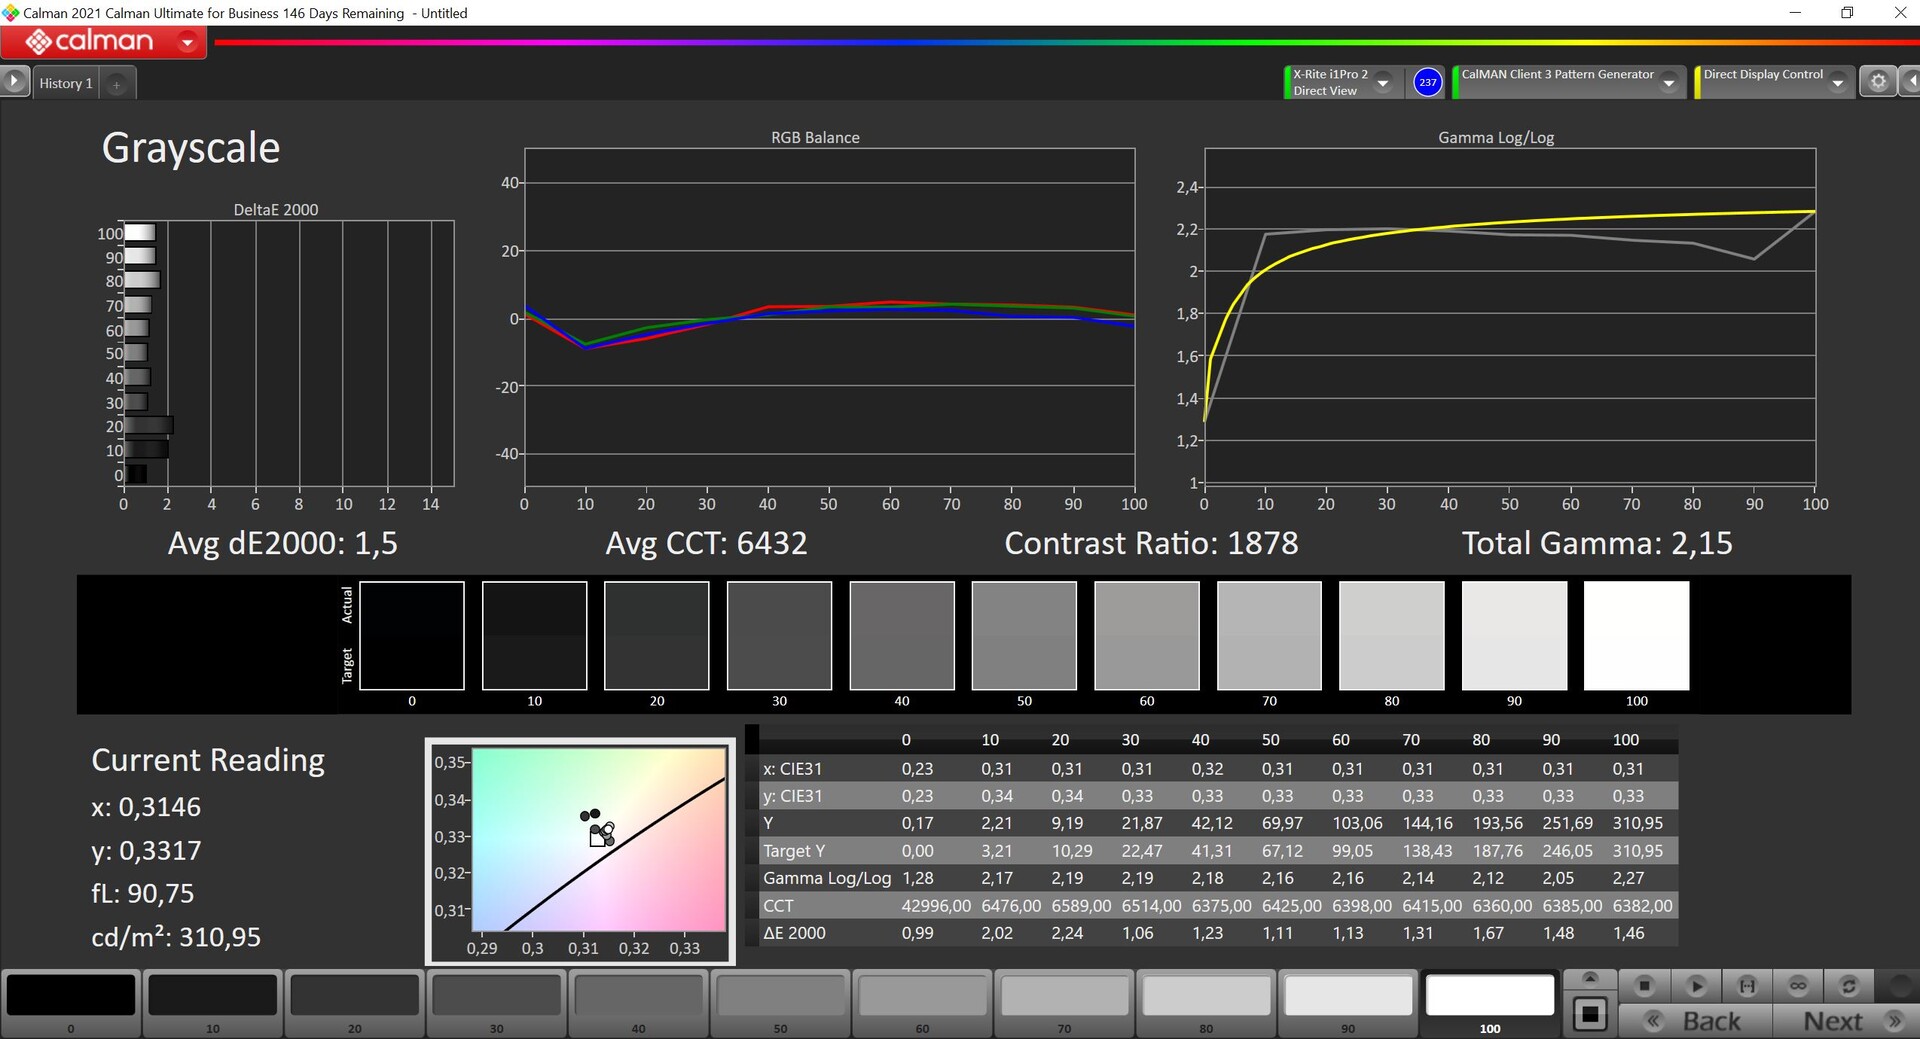
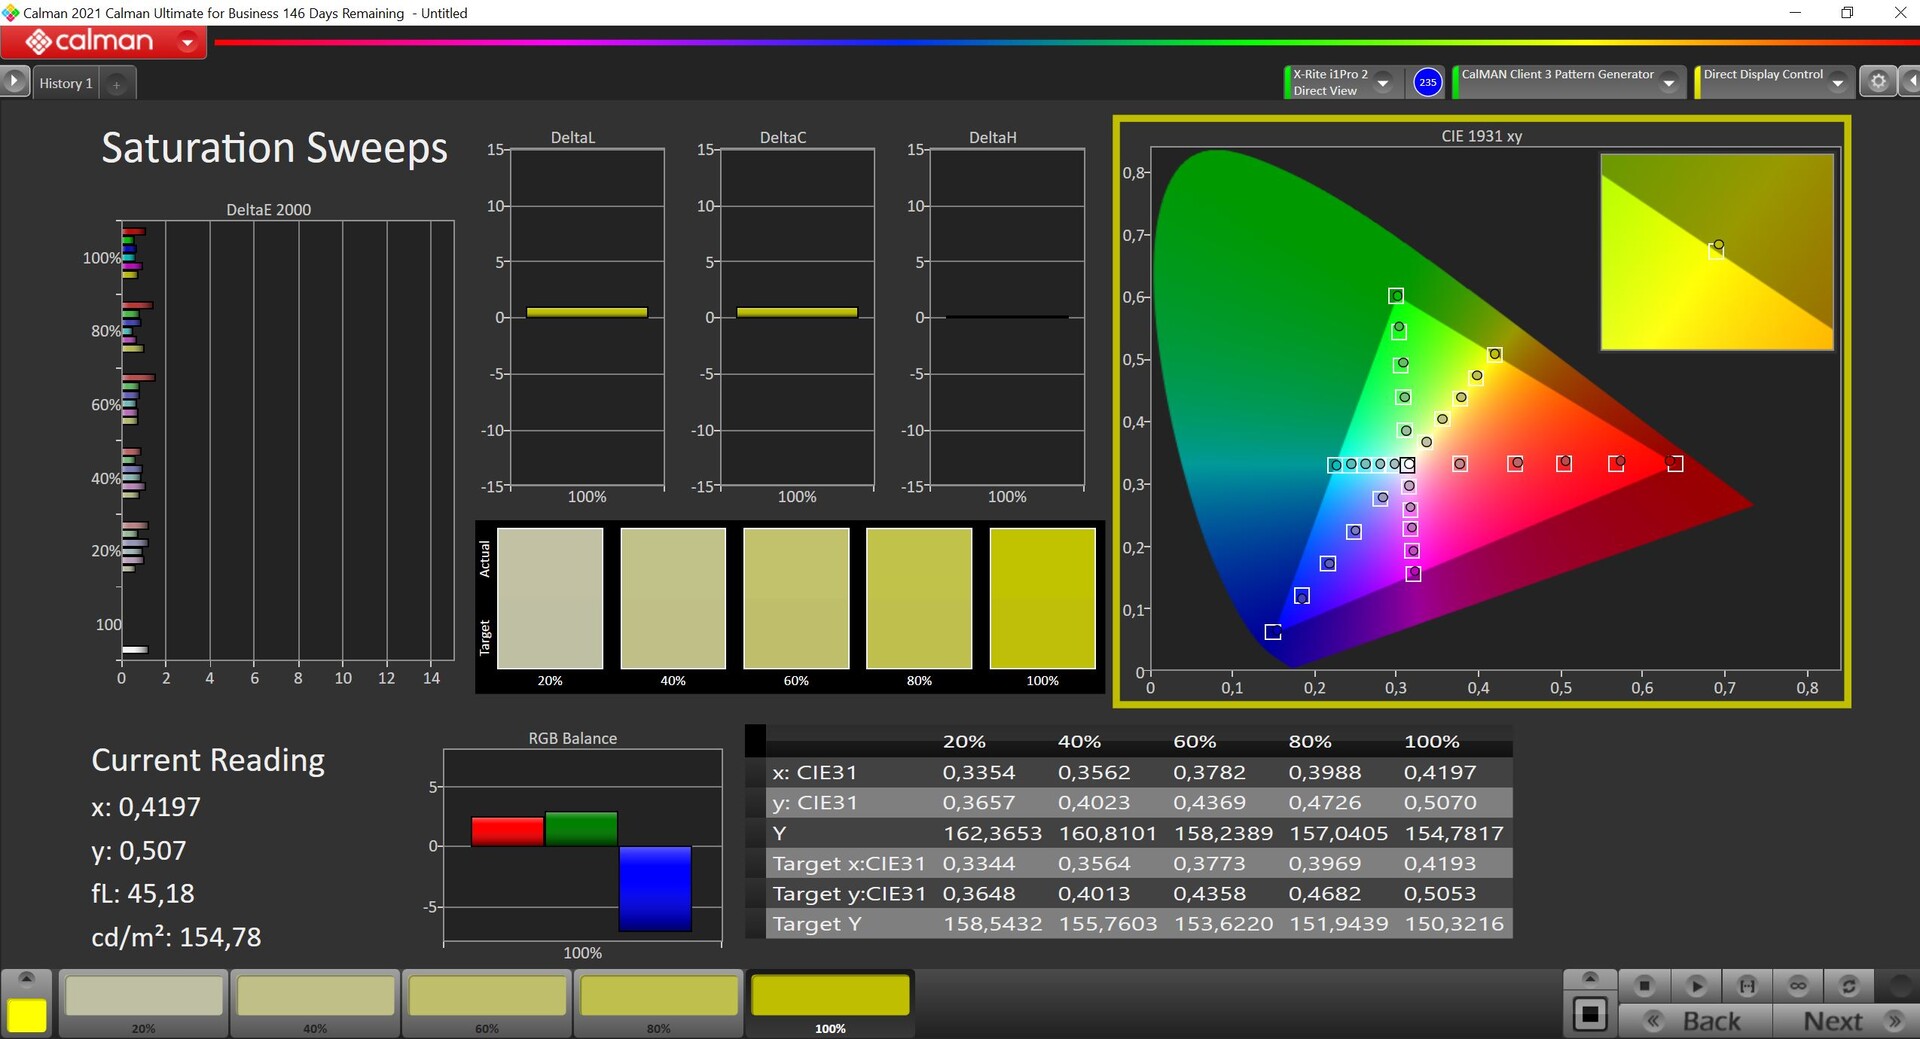
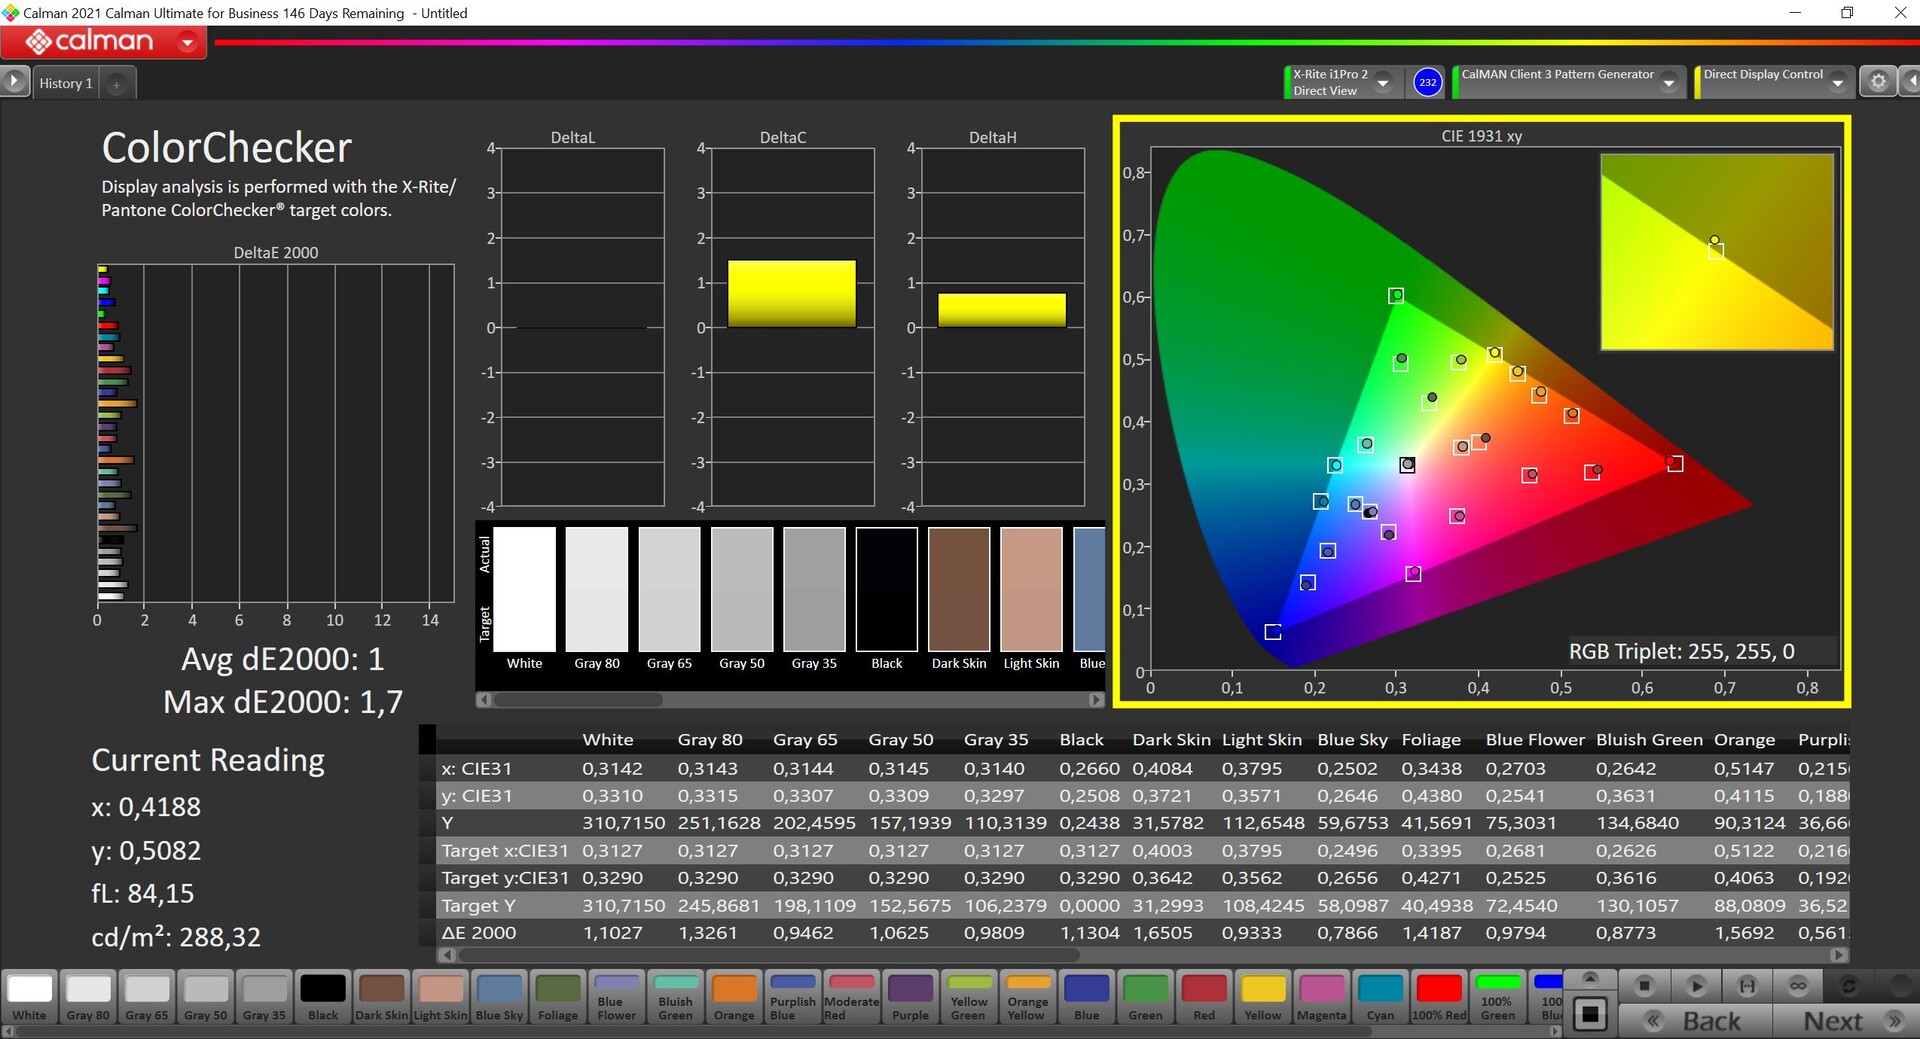
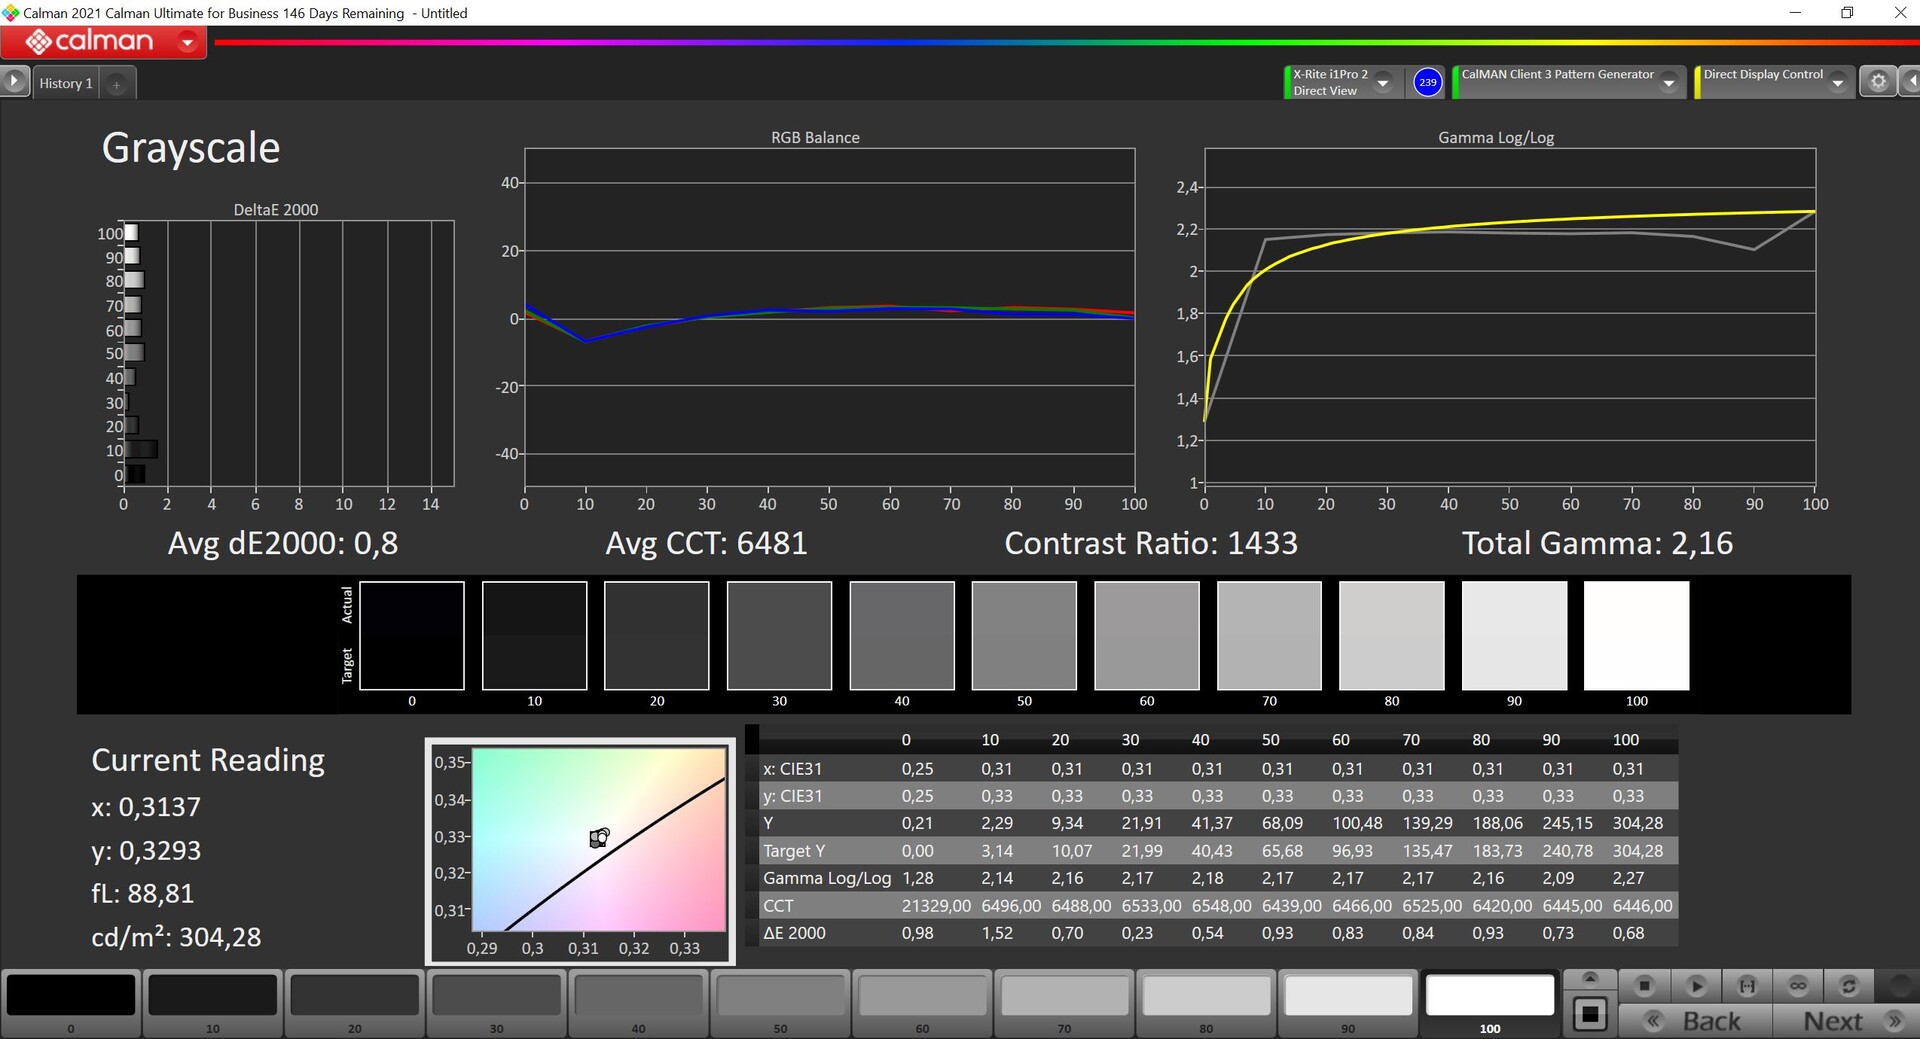
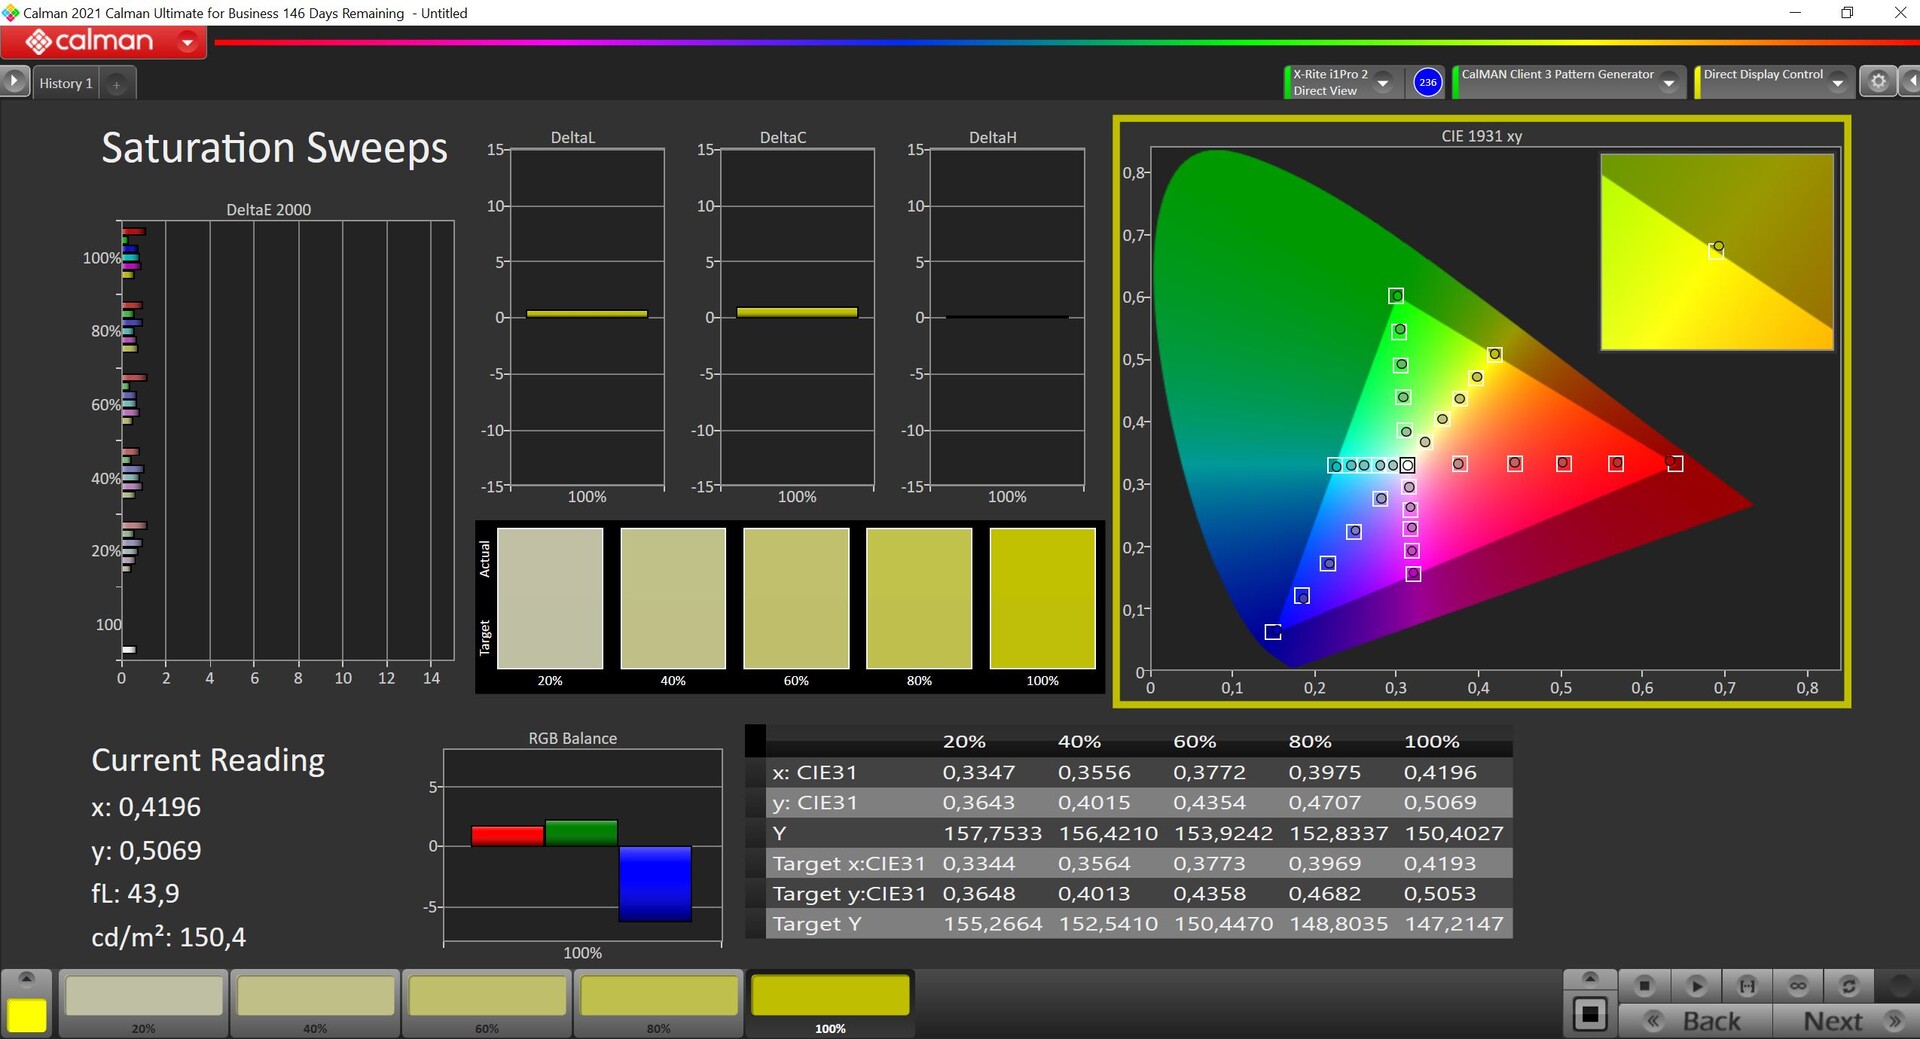
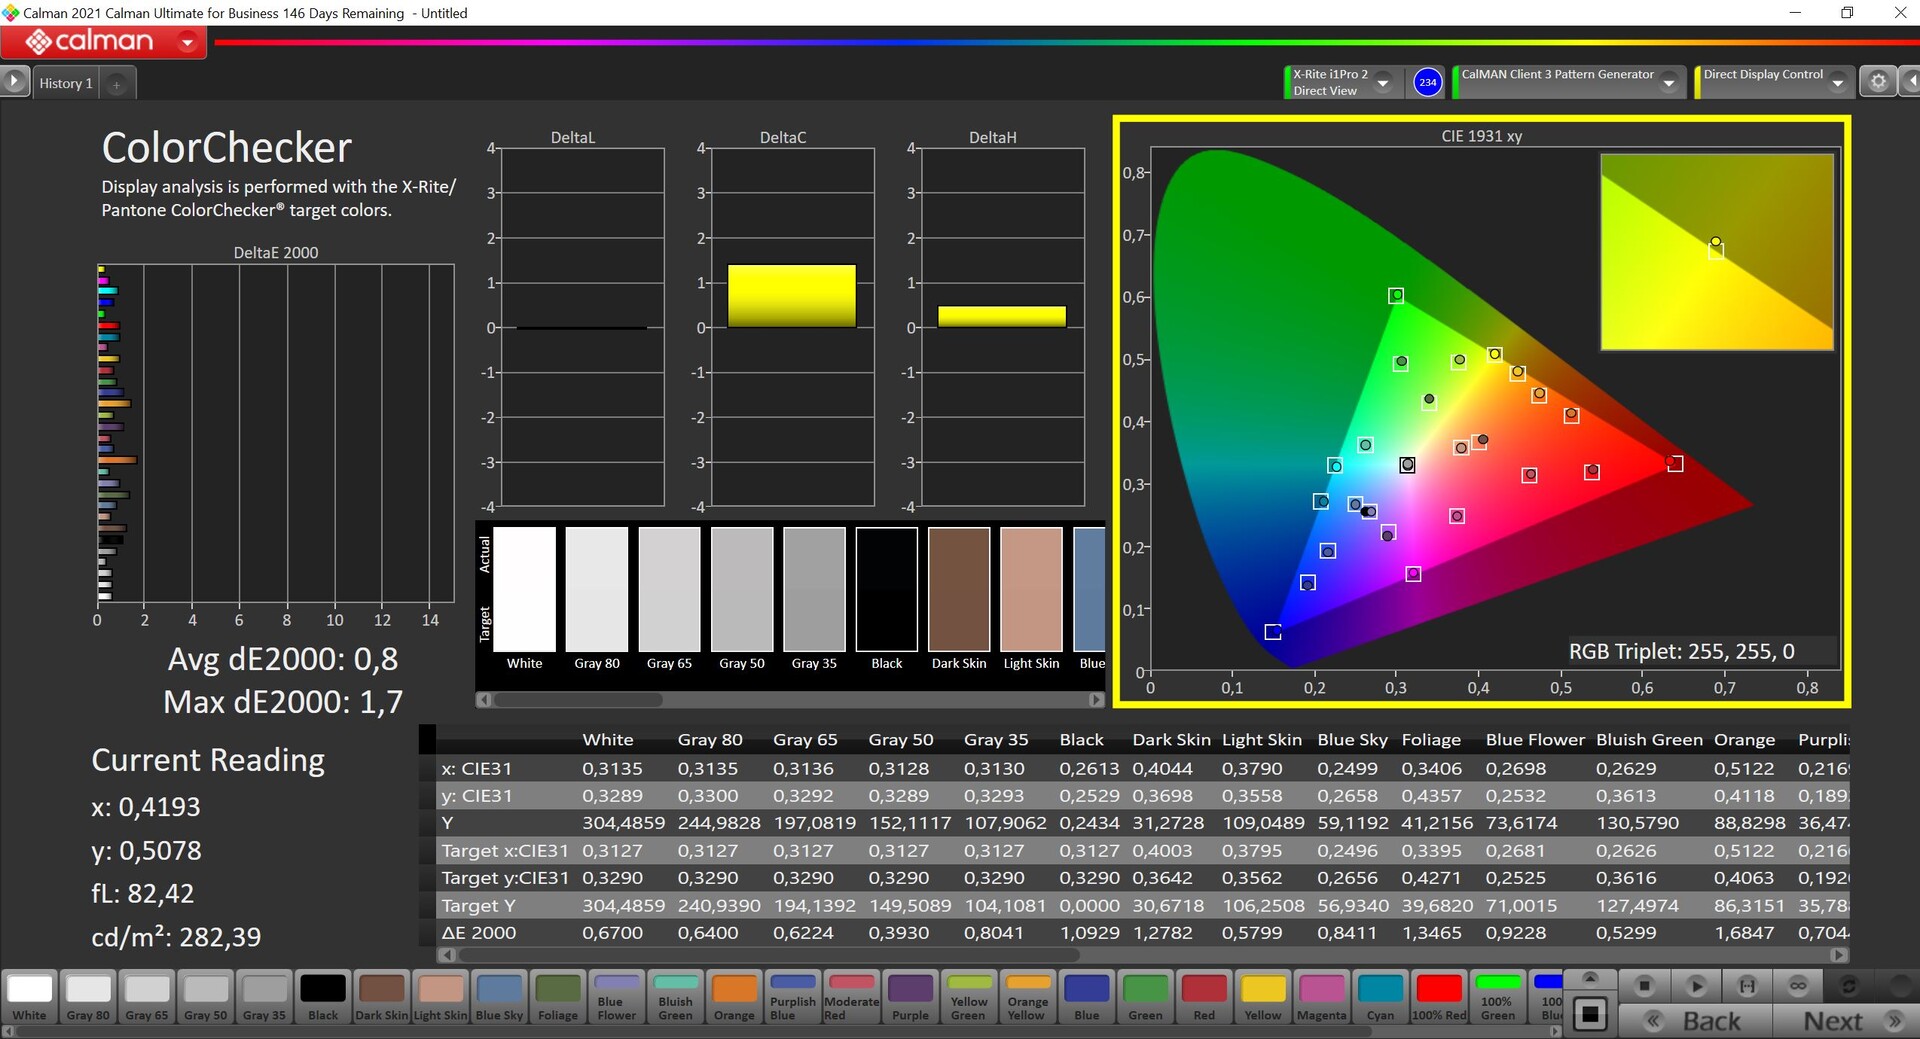
使用我们自己的校准软件(我们的配置文件可在上面免费下载),我们只能非常轻微地提高渲染力。任何差异对肉眼来说都是难以察觉的。然而,这个显示面板再次只提供较小的sRGB色彩空间。
Display Response Times
| ↔ Response Time Black to White | ||
|---|---|---|
| 23.2 ms ... rise ↗ and fall ↘ combined | ↗ 12.6 ms rise | 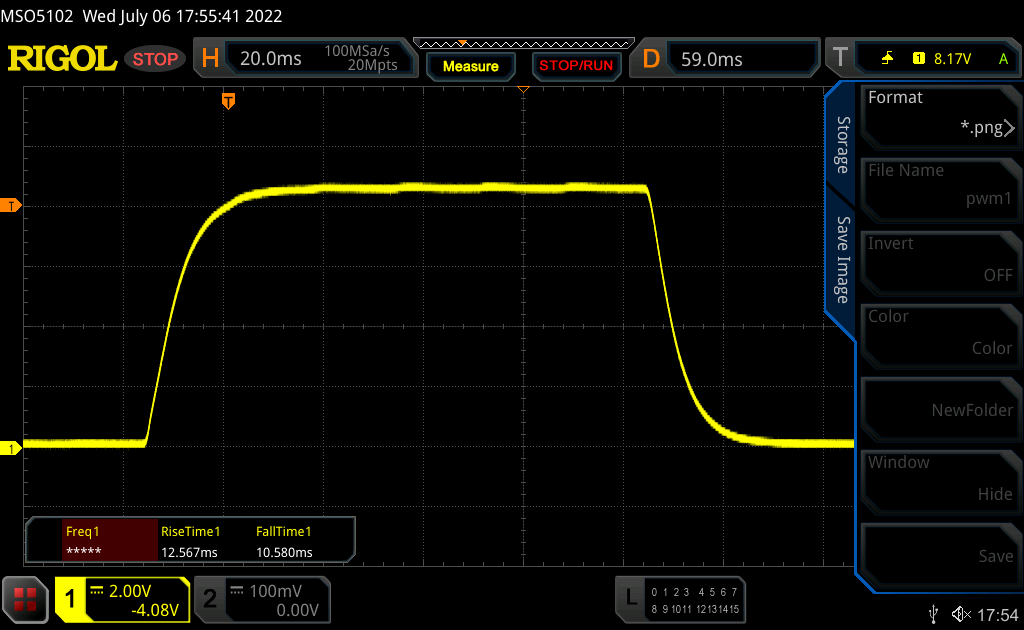 |
| ↘ 10.6 ms fall | ||
| The screen shows good response rates in our tests, but may be too slow for competitive gamers. In comparison, all tested devices range from 0.1 (minimum) to 240 (maximum) ms. » 53 % of all devices are better. This means that the measured response time is worse than the average of all tested devices (19.8 ms). | ||
| ↔ Response Time 50% Grey to 80% Grey | ||
| 35.7 ms ... rise ↗ and fall ↘ combined | ↗ 16.8 ms rise | 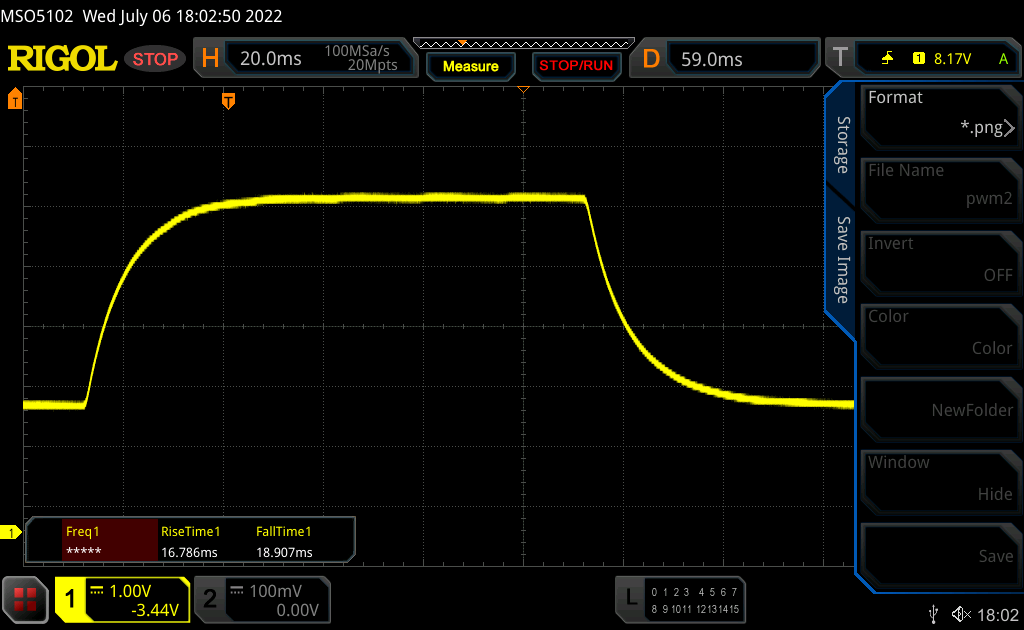 |
| ↘ 18.9 ms fall | ||
| The screen shows slow response rates in our tests and will be unsatisfactory for gamers. In comparison, all tested devices range from 0.165 (minimum) to 636 (maximum) ms. » 50 % of all devices are better. This means that the measured response time is worse than the average of all tested devices (31 ms). | ||
Screen Flickering / PWM (Pulse-Width Modulation)
| Screen flickering / PWM not detected | 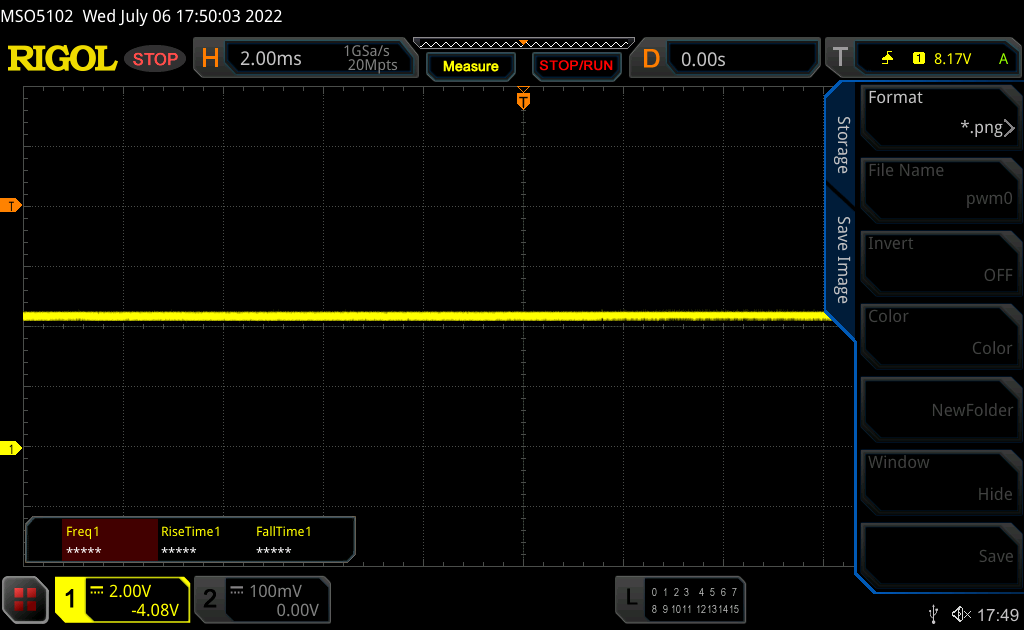 | ||
In comparison: 52 % of all tested devices do not use PWM to dim the display. If PWM was detected, an average of 7757 (minimum: 5 - maximum: 343500) Hz was measured. | |||
MateBook 16s在户外感觉不是很自信。屏幕具有高度的反射性,而且仅有300多cd/m²的亮度,实在不够高。即使在没有直接光源的情况下,也很难避免反射,并在任何合理的程度上识别内容。
性能 - 配备英特尔Alder Lake的MateBook
测试条件
预装的PC管理器有一个可选的电源模式,也可以通过键盘快捷键Fn+P激活。在电源模式下,PL1值(代表永久负载)从45瓦增加到54瓦。然而,由于处理器在正常模式下也可以消耗高达96瓦的功率,在日常使用中的差异并不特别明显。即使只是在CPU负载下,其优势也可以忽略不计,这一点我们将在下面证明。原则上,我们在正常模式下进行了以下基准测试和测量。
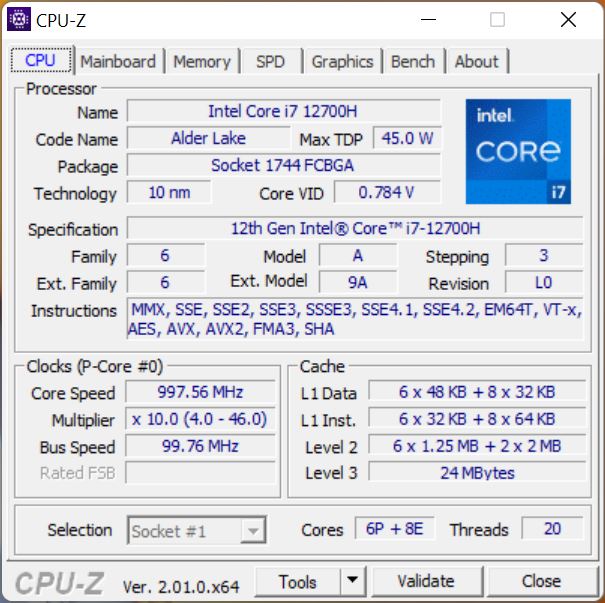
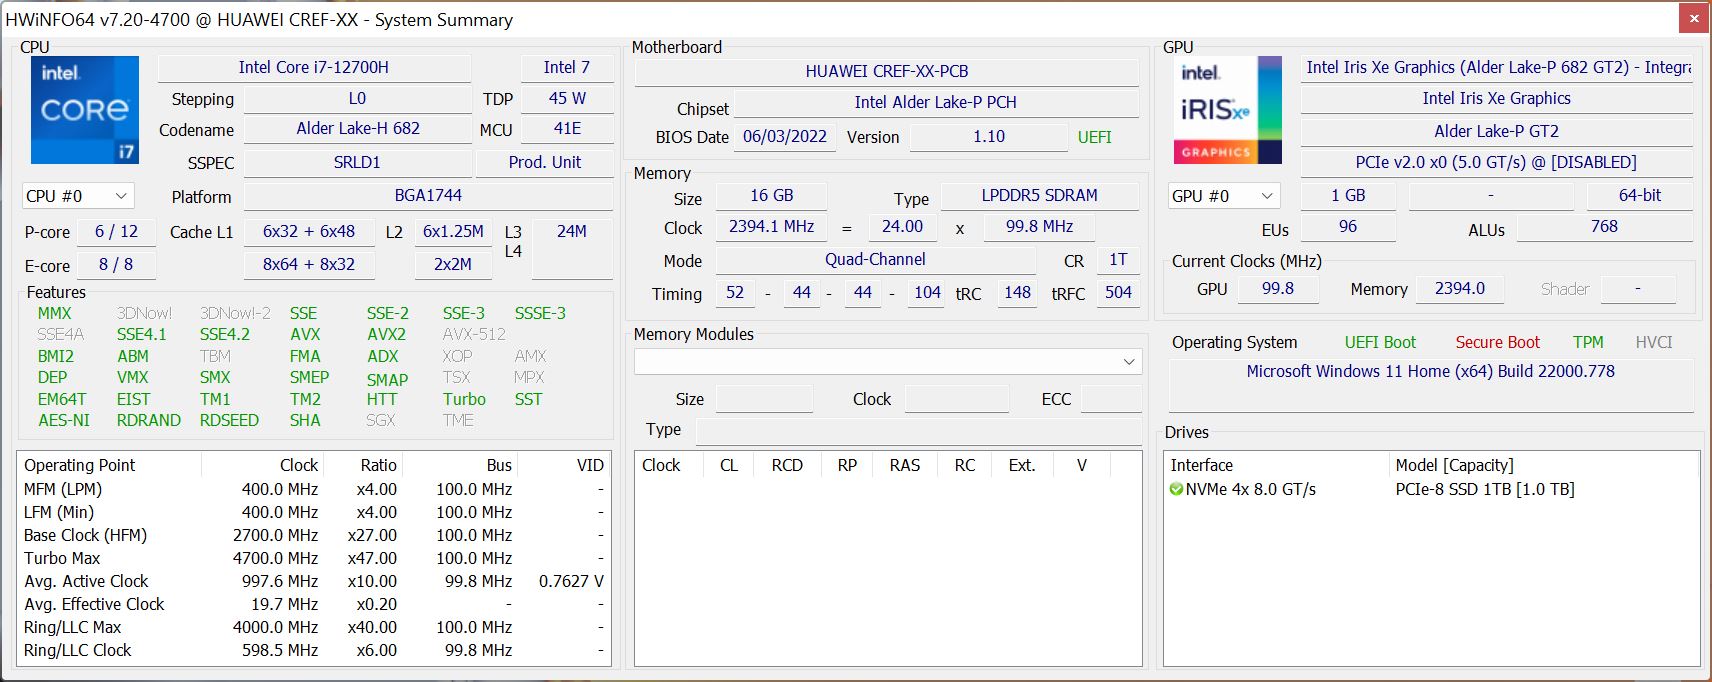
处理器 - 酷睿i7 12700H
的 英特尔酷睿i7-12700H属于目前的第12代(桤木湖),提供了一个使用性能和效率核心的混合架构。我们已经对这款处理器进行了多次测试,所有进一步的技术信息都可以在这里找到。酷睿i7的最大消耗量为96瓦,然后稳定在54瓦。
在Cinebench循环中,相当明显的是,在运行几次后,性能明显下降,与旧的MateBook 16 与Ryzen 7 5800H ,几乎没有任何性能差异。更重要的是,启用性能模式后的差异非常小,在我们看来,这并不能证明较高的风扇噪音是合理的。
Cinebench R15 score
在基准测试中,MateBook 16s自然得益于高功率限制,可以取得良好的结果。新性能核心的单核性能也非常好,但这是以更高的功耗为代价的,几乎是30瓦(单核)。
在电池模式下,处理器的功耗降低到40瓦,这只影响到多核性能(-25%)。更多CPU基准测试可在我们的 技术部分.
Cinebench R23: Multi Core | Single Core
Cinebench R20: CPU (Multi Core) | CPU (Single Core)
Cinebench R15: CPU Multi 64Bit | CPU Single 64Bit
Blender: v2.79 BMW27 CPU
7-Zip 18.03: 7z b 4 | 7z b 4 -mmt1
Geekbench 5.5: Multi-Core | Single-Core
HWBOT x265 Benchmark v2.2: 4k Preset
LibreOffice : 20 Documents To PDF
R Benchmark 2.5: Overall mean
| CPU Performance rating | |
| Average of class Multimedia | |
| Huawei MateBook 16s i7 | |
| Average Intel Core i7-12700H | |
| Huawei MateBook 16 R7 5800H | |
| Dell Inspiron 16 7620 2-in-1 | |
| Dell XPS 15 9510 i5 11400H FHD | |
| LG Gram 16 (2021) | |
| Cinebench R23 / Multi Core | |
| Average of class Multimedia (4861 - 33362, n=74, last 2 years) | |
| Average Intel Core i7-12700H (4032 - 19330, n=64) | |
| Huawei MateBook 16s i7 | |
| Huawei MateBook 16 R7 5800H | |
| Dell Inspiron 16 7620 2-in-1 | |
| Dell XPS 15 9510 i5 11400H FHD | |
| LG Gram 16 (2021) | |
| Cinebench R23 / Single Core | |
| Average of class Multimedia (1128 - 2459, n=66, last 2 years) | |
| Huawei MateBook 16s i7 | |
| Average Intel Core i7-12700H (778 - 1826, n=63) | |
| Dell Inspiron 16 7620 2-in-1 | |
| Dell XPS 15 9510 i5 11400H FHD | |
| Huawei MateBook 16 R7 5800H | |
| LG Gram 16 (2021) | |
| Cinebench R20 / CPU (Multi Core) | |
| Average of class Multimedia (1887 - 12912, n=57, last 2 years) | |
| Average Intel Core i7-12700H (1576 - 7407, n=64) | |
| Huawei MateBook 16s i7 | |
| Huawei MateBook 16 R7 5800H | |
| Dell Inspiron 16 7620 2-in-1 | |
| Dell XPS 15 9510 i5 11400H FHD | |
| LG Gram 16 (2021) | |
| Cinebench R20 / CPU (Single Core) | |
| Average of class Multimedia (425 - 853, n=57, last 2 years) | |
| Huawei MateBook 16s i7 | |
| Average Intel Core i7-12700H (300 - 704, n=64) | |
| Dell Inspiron 16 7620 2-in-1 | |
| Dell XPS 15 9510 i5 11400H FHD | |
| LG Gram 16 (2021) | |
| Huawei MateBook 16 R7 5800H | |
| Cinebench R15 / CPU Multi 64Bit | |
| Average of class Multimedia (856 - 5224, n=61, last 2 years) | |
| Huawei MateBook 16s i7 | |
| Huawei MateBook 16s i7 | |
| Average Intel Core i7-12700H (1379 - 2916, n=70) | |
| Huawei MateBook 16 R7 5800H | |
| Dell Inspiron 16 7620 2-in-1 | |
| Dell XPS 15 9510 i5 11400H FHD | |
| Dell XPS 15 9510 i5 11400H FHD | |
| LG Gram 16 (2021) | |
| Cinebench R15 / CPU Single 64Bit | |
| Average of class Multimedia (184.8 - 326, n=59, last 2 years) | |
| Huawei MateBook 16s i7 | |
| Average Intel Core i7-12700H (113 - 263, n=65) | |
| Dell Inspiron 16 7620 2-in-1 | |
| Huawei MateBook 16 R7 5800H | |
| Dell XPS 15 9510 i5 11400H FHD | |
| LG Gram 16 (2021) | |
| Blender / v2.79 BMW27 CPU | |
| LG Gram 16 (2021) | |
| Dell XPS 15 9510 i5 11400H FHD | |
| Dell Inspiron 16 7620 2-in-1 | |
| Huawei MateBook 16 R7 5800H | |
| Average of class Multimedia (100 - 557, n=58, last 2 years) | |
| Huawei MateBook 16s i7 | |
| Average Intel Core i7-12700H (168 - 732, n=63) | |
| 7-Zip 18.03 / 7z b 4 | |
| Average Intel Core i7-12700H (22844 - 73067, n=63) | |
| Average of class Multimedia (26062 - 130368, n=55, last 2 years) | |
| Huawei MateBook 16s i7 | |
| Huawei MateBook 16 R7 5800H | |
| Dell Inspiron 16 7620 2-in-1 | |
| Dell XPS 15 9510 i5 11400H FHD | |
| LG Gram 16 (2021) | |
| 7-Zip 18.03 / 7z b 4 -mmt1 | |
| Average of class Multimedia (3666 - 7545, n=56, last 2 years) | |
| Huawei MateBook 16s i7 | |
| Average Intel Core i7-12700H (2743 - 5972, n=63) | |
| Huawei MateBook 16 R7 5800H | |
| Dell Inspiron 16 7620 2-in-1 | |
| LG Gram 16 (2021) | |
| Dell XPS 15 9510 i5 11400H FHD | |
| Geekbench 5.5 / Multi-Core | |
| Average of class Multimedia (4652 - 20422, n=56, last 2 years) | |
| Huawei MateBook 16s i7 | |
| Average Intel Core i7-12700H (5144 - 13745, n=64) | |
| Huawei MateBook 16 R7 5800H | |
| Dell Inspiron 16 7620 2-in-1 | |
| Dell XPS 15 9510 i5 11400H FHD | |
| LG Gram 16 (2021) | |
| Geekbench 5.5 / Single-Core | |
| Average of class Multimedia (805 - 2974, n=56, last 2 years) | |
| Huawei MateBook 16s i7 | |
| Average Intel Core i7-12700H (803 - 1851, n=64) | |
| Dell Inspiron 16 7620 2-in-1 | |
| LG Gram 16 (2021) | |
| Dell XPS 15 9510 i5 11400H FHD | |
| Huawei MateBook 16 R7 5800H | |
| HWBOT x265 Benchmark v2.2 / 4k Preset | |
| Average of class Multimedia (5.26 - 36.1, n=56, last 2 years) | |
| Average Intel Core i7-12700H (4.67 - 21.8, n=64) | |
| Huawei MateBook 16s i7 | |
| Huawei MateBook 16 R7 5800H | |
| Dell Inspiron 16 7620 2-in-1 | |
| Dell XPS 15 9510 i5 11400H FHD | |
| LG Gram 16 (2021) | |
| LibreOffice / 20 Documents To PDF | |
| Average of class Multimedia (23.9 - 146.7, n=57, last 2 years) | |
| Huawei MateBook 16 R7 5800H | |
| Dell Inspiron 16 7620 2-in-1 | |
| Dell XPS 15 9510 i5 11400H FHD | |
| Average Intel Core i7-12700H (34.2 - 95.3, n=63) | |
| LG Gram 16 (2021) | |
| Huawei MateBook 16s i7 | |
| R Benchmark 2.5 / Overall mean | |
| LG Gram 16 (2021) | |
| Dell XPS 15 9510 i5 11400H FHD | |
| Huawei MateBook 16 R7 5800H | |
| Dell Inspiron 16 7620 2-in-1 | |
| Average Intel Core i7-12700H (0.4441 - 1.052, n=63) | |
| Average of class Multimedia (0.3604 - 0.947, n=56, last 2 years) | |
| Huawei MateBook 16s i7 | |
* ... smaller is better
AIDA64: FP32 Ray-Trace | FPU Julia | CPU SHA3 | CPU Queen | FPU SinJulia | FPU Mandel | CPU AES | CPU ZLib | FP64 Ray-Trace | CPU PhotoWorxx
| Performance rating | |
| Average of class Multimedia | |
| Huawei MateBook 16 R7 5800H | |
| Average Intel Core i7-12700H | |
| Huawei MateBook 16s i7 | |
| Dell Inspiron 16 7620 2-in-1 | |
| LG Gram 16 (2021) | |
| Dell XPS 15 9510 i5 11400H FHD -9! | |
| AIDA64 / FP32 Ray-Trace | |
| Average of class Multimedia (2214 - 50388, n=53, last 2 years) | |
| Huawei MateBook 16 R7 5800H | |
| Average Intel Core i7-12700H (2585 - 17957, n=64) | |
| Huawei MateBook 16s i7 | |
| Dell Inspiron 16 7620 2-in-1 | |
| LG Gram 16 (2021) | |
| AIDA64 / FPU Julia | |
| Huawei MateBook 16 R7 5800H | |
| Average of class Multimedia (12867 - 201874, n=54, last 2 years) | |
| Average Intel Core i7-12700H (12439 - 90760, n=64) | |
| Huawei MateBook 16s i7 | |
| Dell Inspiron 16 7620 2-in-1 | |
| LG Gram 16 (2021) | |
| AIDA64 / CPU SHA3 | |
| Average of class Multimedia (626 - 8623, n=54, last 2 years) | |
| Average Intel Core i7-12700H (833 - 4242, n=64) | |
| Huawei MateBook 16 R7 5800H | |
| Huawei MateBook 16s i7 | |
| Dell Inspiron 16 7620 2-in-1 | |
| LG Gram 16 (2021) | |
| AIDA64 / CPU Queen | |
| Average Intel Core i7-12700H (57923 - 103202, n=63) | |
| Huawei MateBook 16 R7 5800H | |
| Huawei MateBook 16s i7 | |
| Average of class Multimedia (13483 - 181505, n=41, last 2 years) | |
| Dell Inspiron 16 7620 2-in-1 | |
| LG Gram 16 (2021) | |
| AIDA64 / FPU SinJulia | |
| Huawei MateBook 16 R7 5800H | |
| Average Intel Core i7-12700H (3249 - 9939, n=64) | |
| Average of class Multimedia (886 - 28794, n=54, last 2 years) | |
| Huawei MateBook 16s i7 | |
| Dell Inspiron 16 7620 2-in-1 | |
| LG Gram 16 (2021) | |
| AIDA64 / FPU Mandel | |
| Huawei MateBook 16 R7 5800H | |
| Average of class Multimedia (6395 - 105740, n=53, last 2 years) | |
| Average Intel Core i7-12700H (7135 - 44760, n=64) | |
| Huawei MateBook 16s i7 | |
| Dell Inspiron 16 7620 2-in-1 | |
| LG Gram 16 (2021) | |
| AIDA64 / CPU AES | |
| Huawei MateBook 16 R7 5800H | |
| Average Intel Core i7-12700H (31839 - 144360, n=64) | |
| Huawei MateBook 16s i7 | |
| Average of class Multimedia (8171 - 126790, n=54, last 2 years) | |
| LG Gram 16 (2021) | |
| Dell Inspiron 16 7620 2-in-1 | |
| AIDA64 / CPU ZLib | |
| Average of class Multimedia (143.8 - 2022, n=54, last 2 years) | |
| Average Intel Core i7-12700H (305 - 1171, n=64) | |
| Huawei MateBook 16 R7 5800H | |
| Huawei MateBook 16s i7 | |
| Dell Inspiron 16 7620 2-in-1 | |
| LG Gram 16 (2021) | |
| Dell XPS 15 9510 i5 11400H FHD | |
| AIDA64 / FP64 Ray-Trace | |
| Average of class Multimedia (1014 - 26875, n=54, last 2 years) | |
| Huawei MateBook 16 R7 5800H | |
| Average Intel Core i7-12700H (1437 - 9692, n=64) | |
| Huawei MateBook 16s i7 | |
| Dell Inspiron 16 7620 2-in-1 | |
| LG Gram 16 (2021) | |
| AIDA64 / CPU PhotoWorxx | |
| Average of class Multimedia (8187 - 88154, n=54, last 2 years) | |
| LG Gram 16 (2021) | |
| Huawei MateBook 16s i7 | |
| Average Intel Core i7-12700H (12863 - 52207, n=64) | |
| Dell Inspiron 16 7620 2-in-1 | |
| Huawei MateBook 16 R7 5800H | |
系统性能
在日常使用中,MateBook 16s是一个反应灵敏的系统,但主观上与旧的MateBook 16没有区别,在合成的PCMark 10中,新的MateBook 16s的表现超过了它的AMD前辈(即使差异非常小)。
同样,正如Apple ,在其产品范围内促进连接,MateBook 16s连接了不同的华为设备。例如,在笔记本电脑和该品牌的平板电脑或智能手机之间移动文件是非常容易的。华为还提供了在MateBook上使用华为相册中的移动应用程序的选项。
CrossMark: Overall | Productivity | Creativity | Responsiveness
| PCMark 10 / Score | |
| Average of class Multimedia (4325 - 10386, n=52, last 2 years) | |
| Huawei MateBook 16 R7 5800H | |
| Huawei MateBook 16s i7 | |
| Average Intel Core i7-12700H, Intel Iris Xe Graphics G7 96EUs (5541 - 6281, n=8) | |
| Dell Inspiron 16 7620 2-in-1 | |
| LG Gram 16 (2021) | |
| Dell XPS 15 9510 i5 11400H FHD | |
| PCMark 10 / Essentials | |
| Huawei MateBook 16s i7 | |
| Average Intel Core i7-12700H, Intel Iris Xe Graphics G7 96EUs (9991 - 11699, n=8) | |
| Huawei MateBook 16 R7 5800H | |
| Average of class Multimedia (8025 - 11664, n=51, last 2 years) | |
| LG Gram 16 (2021) | |
| Dell XPS 15 9510 i5 11400H FHD | |
| Dell Inspiron 16 7620 2-in-1 | |
| PCMark 10 / Productivity | |
| Average of class Multimedia (7323 - 18233, n=51, last 2 years) | |
| Huawei MateBook 16 R7 5800H | |
| Huawei MateBook 16s i7 | |
| Average Intel Core i7-12700H, Intel Iris Xe Graphics G7 96EUs (6690 - 8038, n=8) | |
| LG Gram 16 (2021) | |
| Dell XPS 15 9510 i5 11400H FHD | |
| Dell Inspiron 16 7620 2-in-1 | |
| PCMark 10 / Digital Content Creation | |
| Average of class Multimedia (3651 - 16240, n=51, last 2 years) | |
| Huawei MateBook 16s i7 | |
| Average Intel Core i7-12700H, Intel Iris Xe Graphics G7 96EUs (6207 - 7401, n=8) | |
| Huawei MateBook 16 R7 5800H | |
| Dell Inspiron 16 7620 2-in-1 | |
| LG Gram 16 (2021) | |
| Dell XPS 15 9510 i5 11400H FHD | |
| CrossMark / Overall | |
| Huawei MateBook 16s i7 | |
| Average of class Multimedia (866 - 2728, n=60, last 2 years) | |
| Average Intel Core i7-12700H, Intel Iris Xe Graphics G7 96EUs (1492 - 1907, n=8) | |
| Dell Inspiron 16 7620 2-in-1 | |
| CrossMark / Productivity | |
| Huawei MateBook 16s i7 | |
| Average of class Multimedia (931 - 2489, n=60, last 2 years) | |
| Average Intel Core i7-12700H, Intel Iris Xe Graphics G7 96EUs (1499 - 1832, n=8) | |
| Dell Inspiron 16 7620 2-in-1 | |
| CrossMark / Creativity | |
| Average of class Multimedia (907 - 3465, n=60, last 2 years) | |
| Huawei MateBook 16s i7 | |
| Average Intel Core i7-12700H, Intel Iris Xe Graphics G7 96EUs (1507 - 2016, n=8) | |
| Dell Inspiron 16 7620 2-in-1 | |
| CrossMark / Responsiveness | |
| Huawei MateBook 16s i7 | |
| Average Intel Core i7-12700H, Intel Iris Xe Graphics G7 96EUs (1384 - 1831, n=8) | |
| Average of class Multimedia (605 - 2024, n=60, last 2 years) | |
| Dell Inspiron 16 7620 2-in-1 | |
| PCMark 10 Score | 6281 points | |
Help | ||
| AIDA64 / Memory Copy | |
| Average of class Multimedia (11299 - 132135, n=54, last 2 years) | |
| Huawei MateBook 16s i7 | |
| LG Gram 16 (2021) | |
| Average Intel Core i7-12700H (25615 - 80511, n=64) | |
| Dell Inspiron 16 7620 2-in-1 | |
| Huawei MateBook 16 R7 5800H | |
| AIDA64 / Memory Read | |
| Average of class Multimedia (11624 - 174586, n=54, last 2 years) | |
| Huawei MateBook 16s i7 | |
| LG Gram 16 (2021) | |
| Average Intel Core i7-12700H (25586 - 79442, n=64) | |
| Huawei MateBook 16 R7 5800H | |
| Dell Inspiron 16 7620 2-in-1 | |
| AIDA64 / Memory Write | |
| Average of class Multimedia (11755 - 134998, n=54, last 2 years) | |
| LG Gram 16 (2021) | |
| Huawei MateBook 16s i7 | |
| Average Intel Core i7-12700H (23679 - 88660, n=64) | |
| Dell Inspiron 16 7620 2-in-1 | |
| Huawei MateBook 16 R7 5800H | |
| AIDA64 / Memory Latency | |
| Average of class Multimedia (7 - 535, n=53, last 2 years) | |
| Huawei MateBook 16s i7 | |
| LG Gram 16 (2021) | |
| Huawei MateBook 16 R7 5800H | |
| Average Intel Core i7-12700H (76.2 - 133.9, n=62) | |
| Dell XPS 15 9510 i5 11400H FHD | |
* ... smaller is better
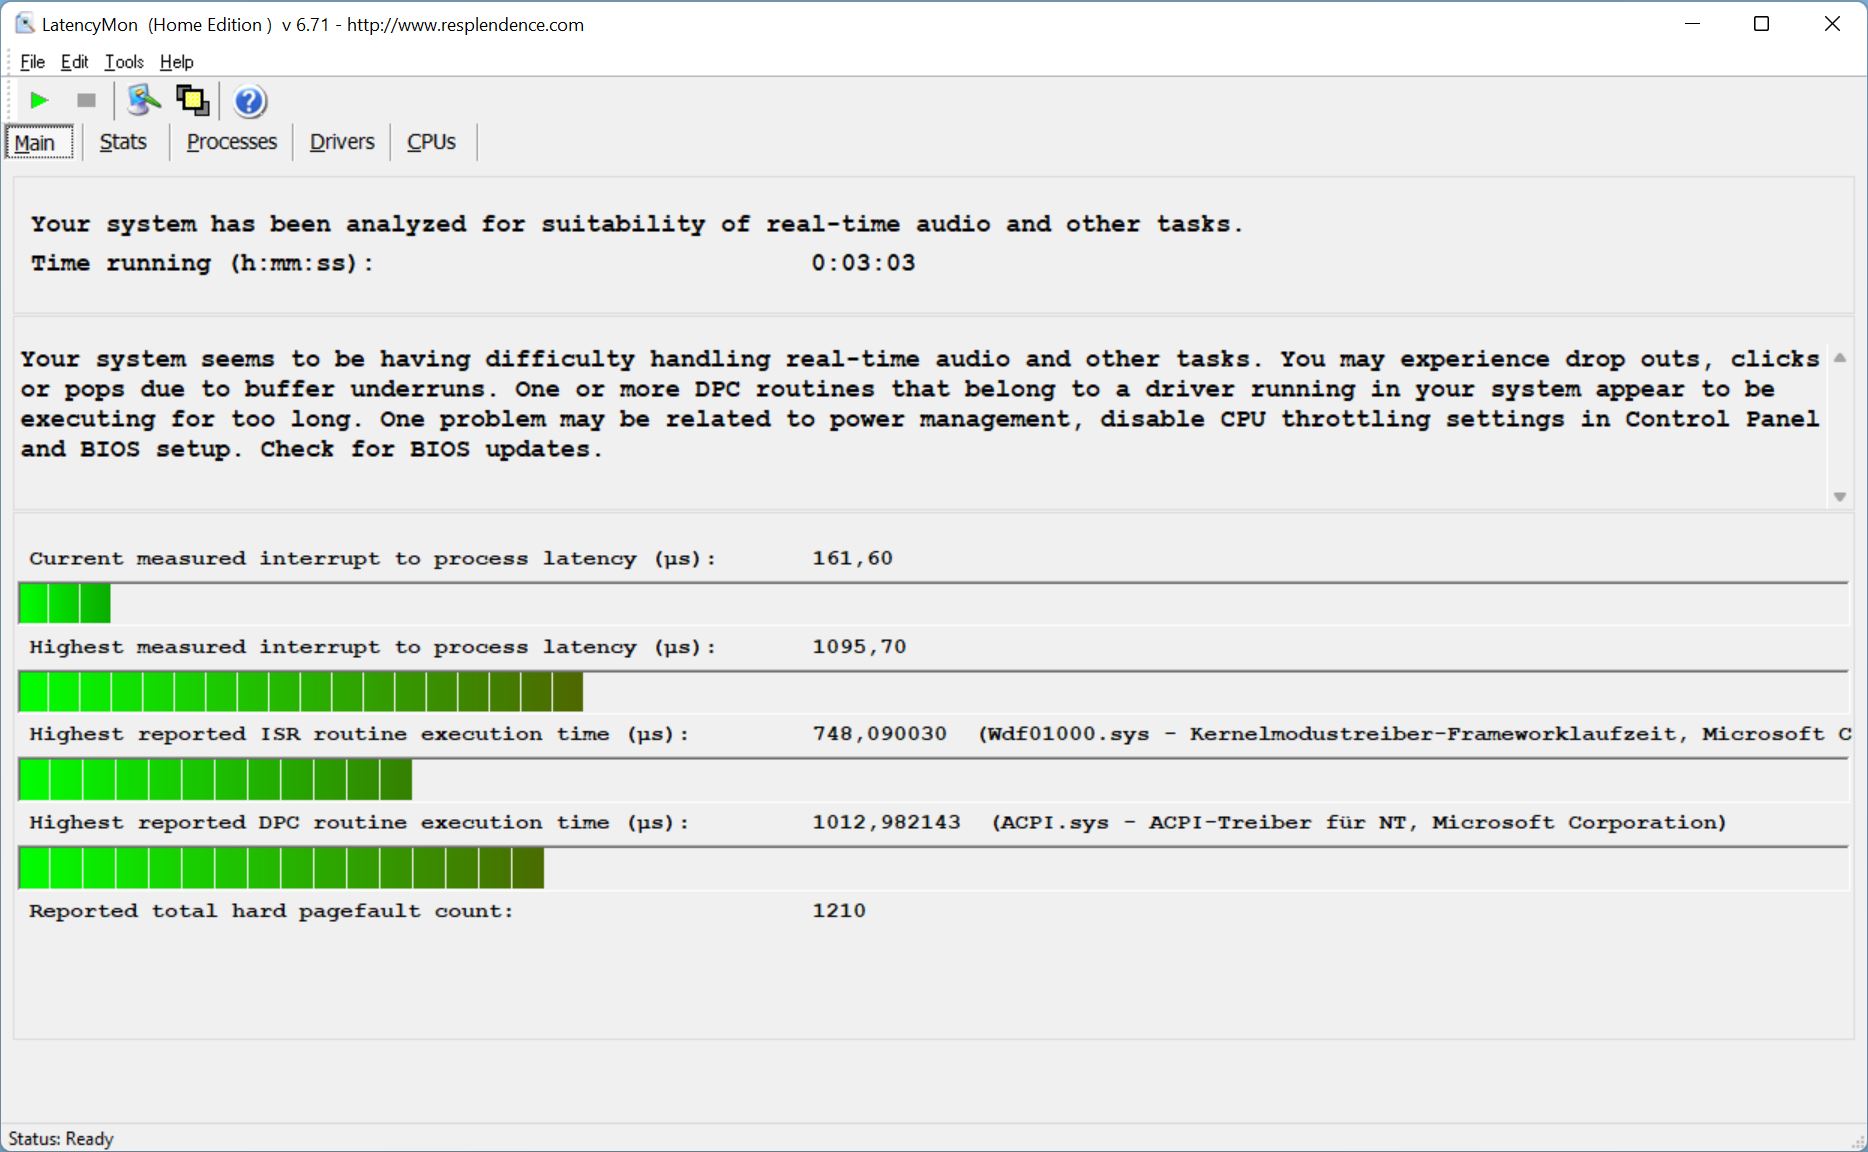
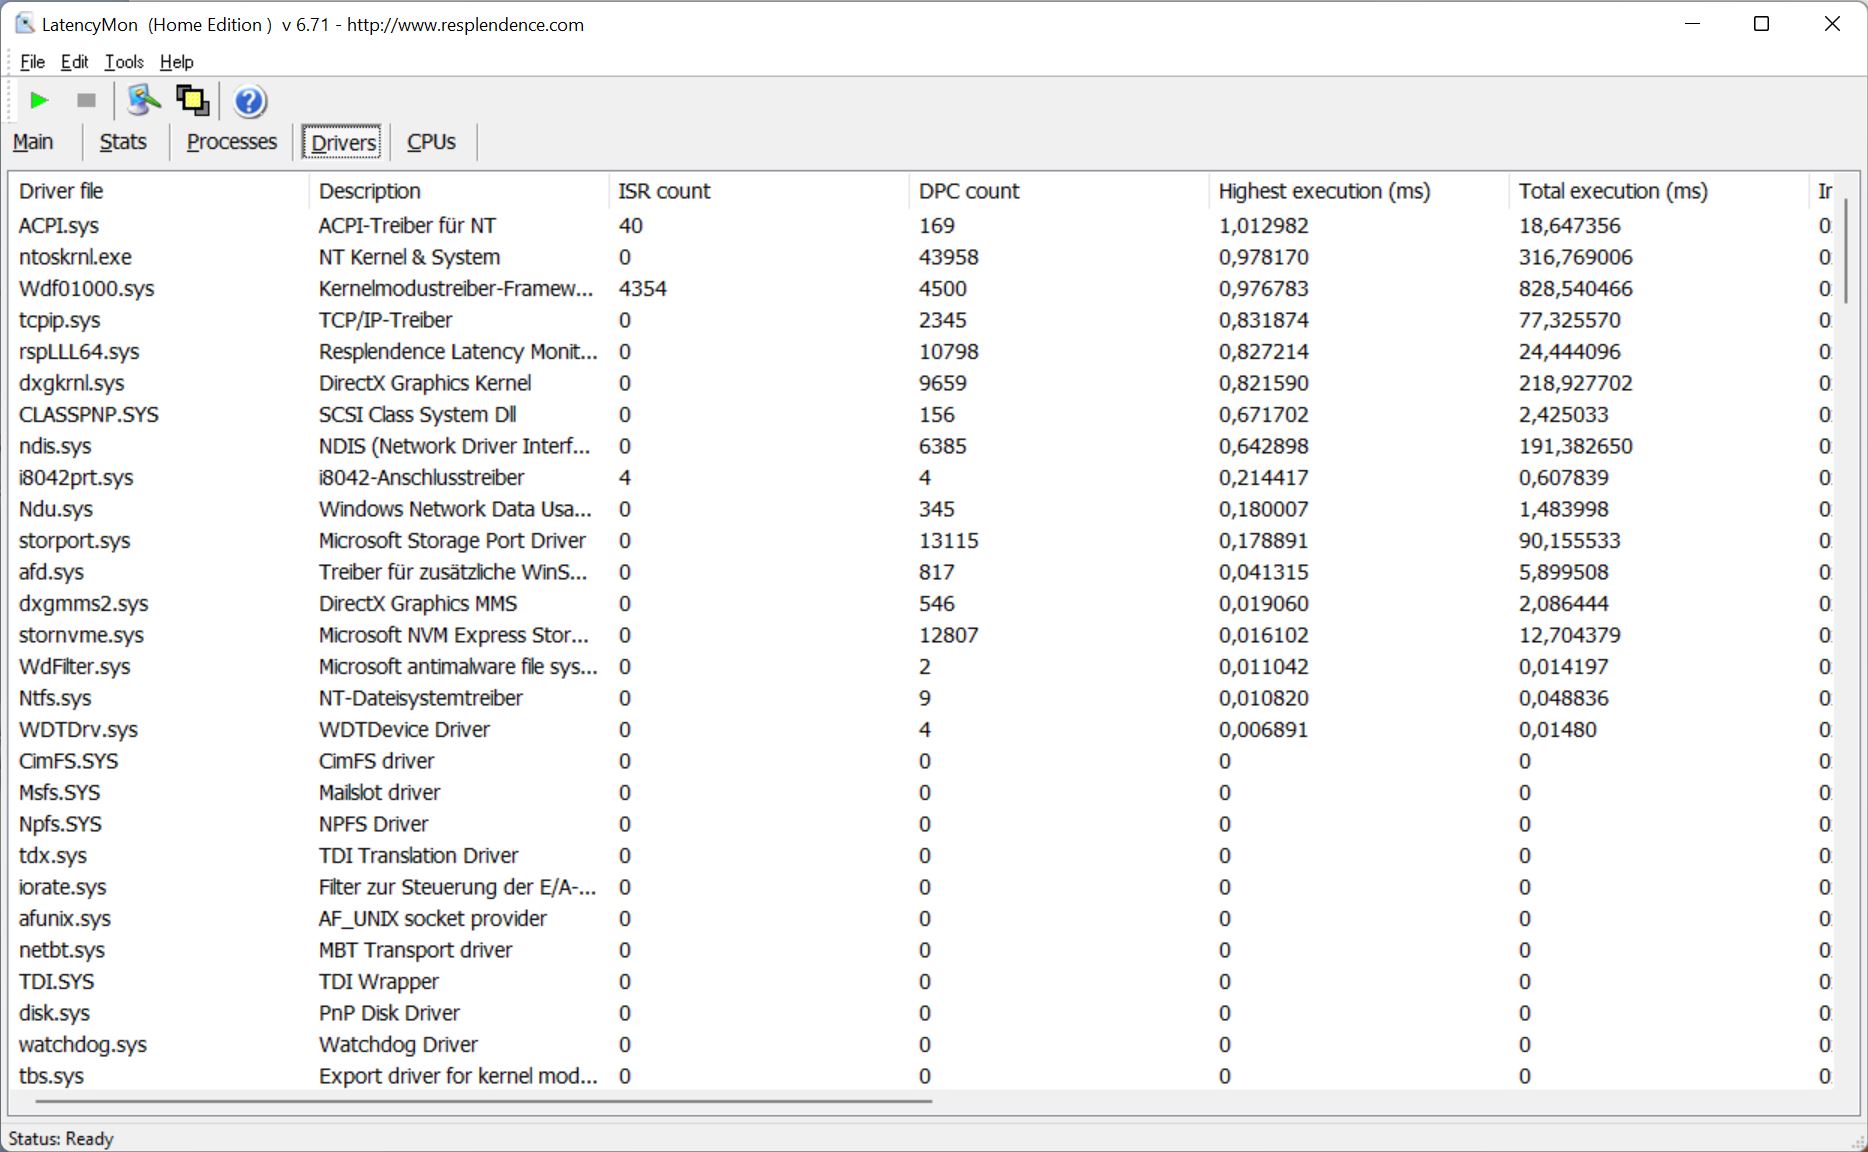
DPC延迟
在我们的标准化延迟测试中(上网、4K YouTube播放、CPU负载),MateBook 16s使用目前的BIOS版本显示了一些小的限制。因此,它不太适合使用实时音频软件。
| DPC Latencies / LatencyMon - interrupt to process latency (max), Web, Youtube, Prime95 | |
| Dell XPS 15 9510 i5 11400H FHD | |
| Dell Inspiron 16 7620 2-in-1 | |
| Huawei MateBook 16 R7 5800H | |
| LG Gram 16 (2021) | |
* ... smaller is better
储存
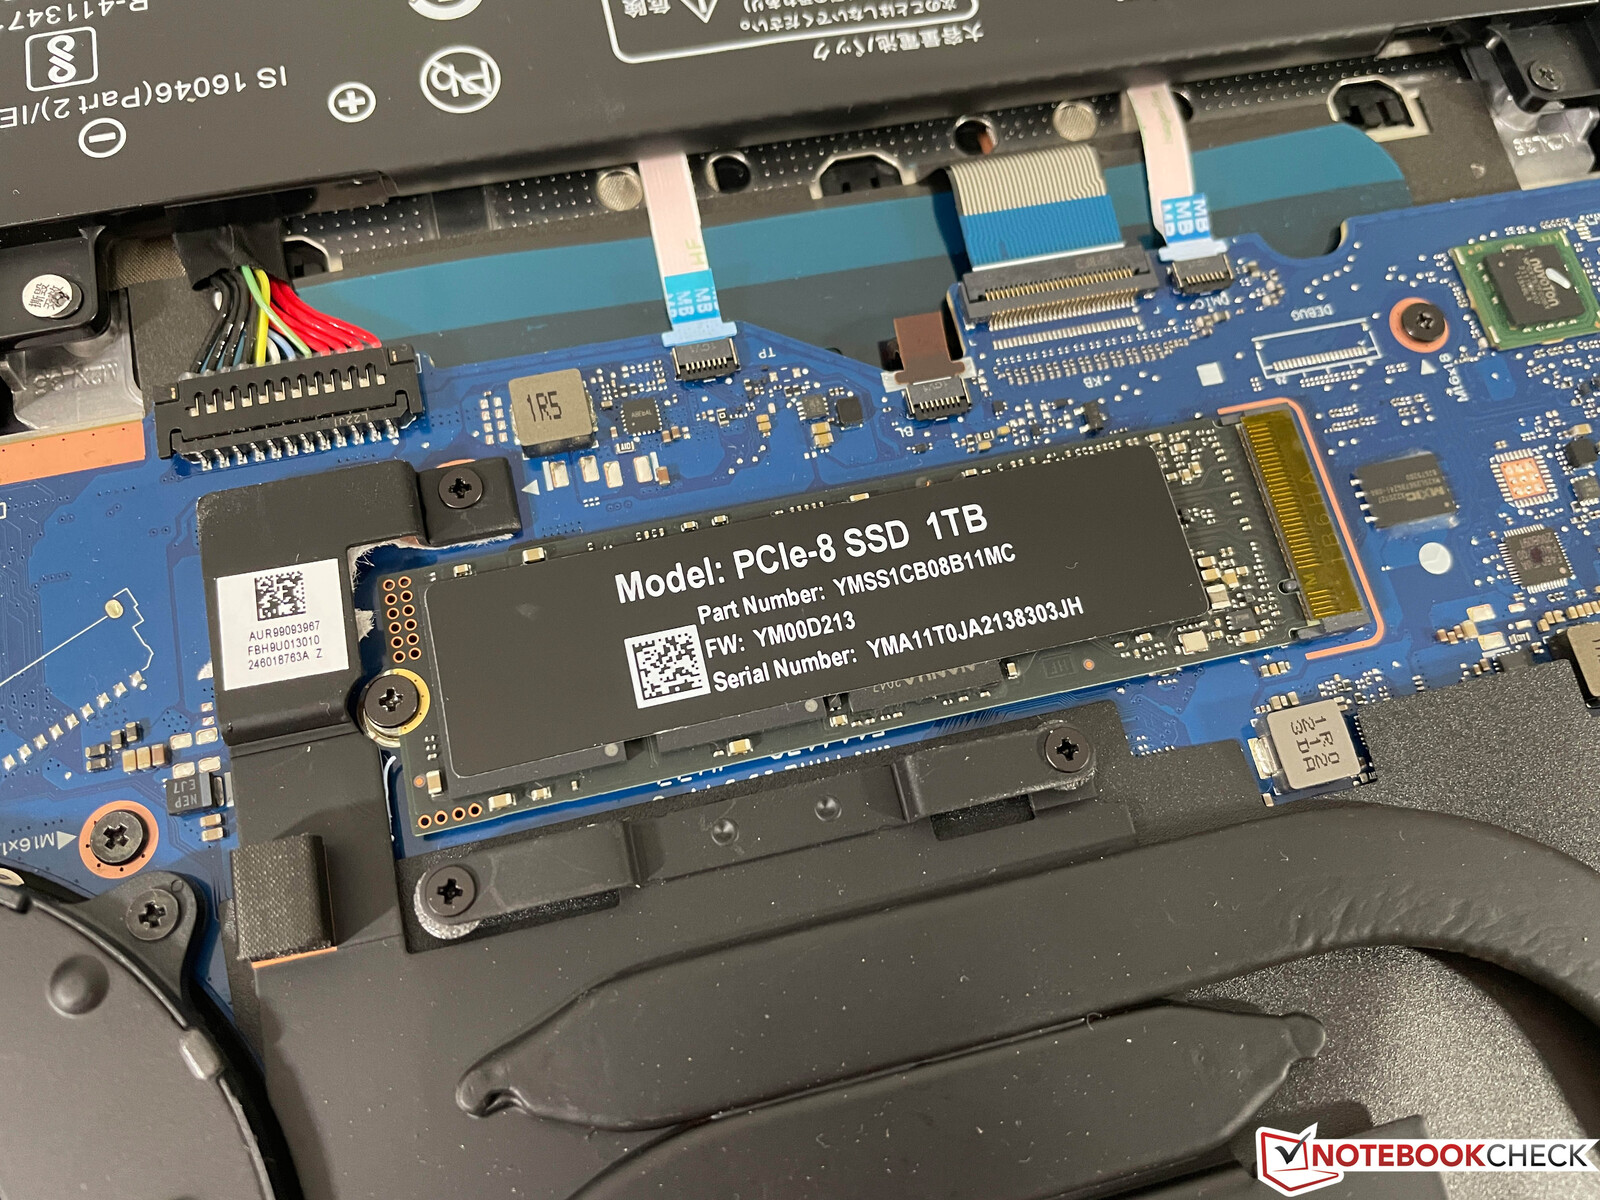
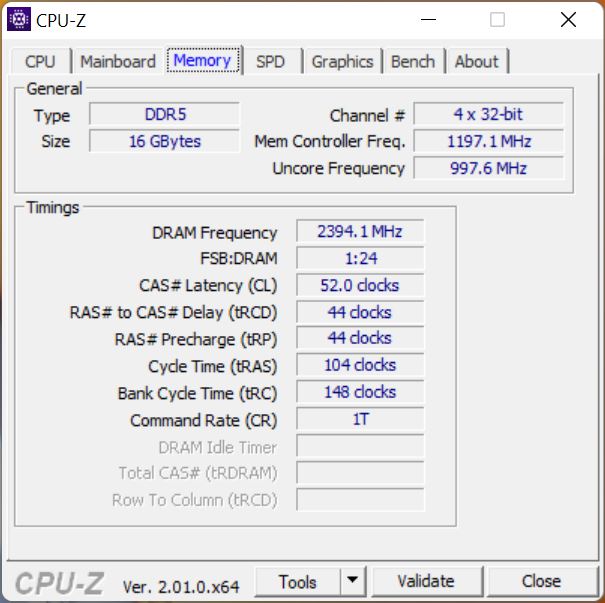
我们的测试设备配备了一个M.2固态硬盘,存储容量为1TB,但与华为以前的笔记本电脑一样,固态硬盘再次被分区。这里特别令人不安的是,系统驱动器的分区非常小,只为用户提供了大约70GB。如果你不注意安装和下载,你很快就会出现容量问题。
在速度方面,也有很大的改进余地。华为只使用了PCIe 3.0 x4固态硬盘,制造商无法告诉我们该端口是否支持更快的PCIe 4.0标准。超过3GB/s的传输率绝不是坏事,但考虑到价格,这里可能会有更高的速度。进一步的SSD基准测试可在这里Laptop SSD & HDD Benchmarks 。

* ... smaller is better
Disk Throttling: DiskSpd Read Loop, Queue Depth 8
图形卡
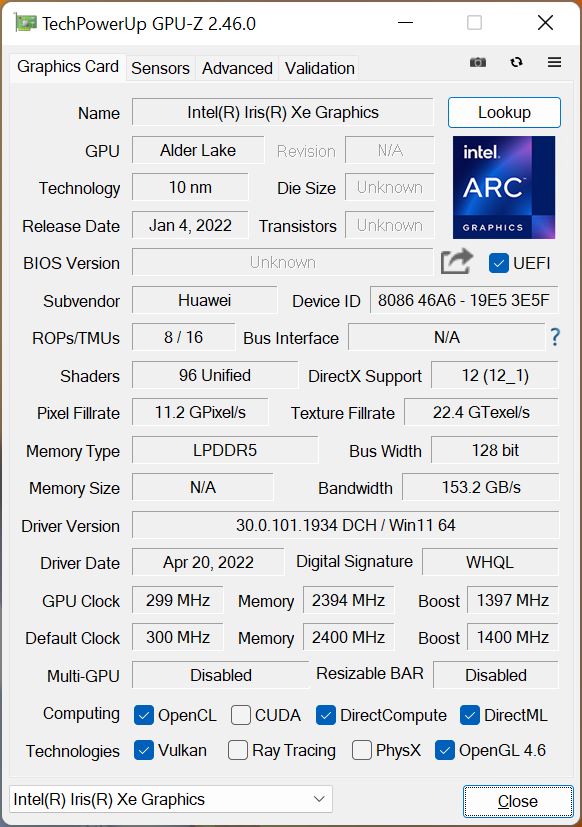
华为没有专用显卡,所有的图形计算都由集成的 Xe Graphics G7(96 EUs)管理。,这一点我们已经从旧的Tiger Lake 移动处理器中了解到。iGPU完全可以满足日常使用,包括播放高分辨率的视频,但新的 Radeon 680M的Ryzen 6000 CPU提供了明显更多的功率,也有更有效的视频解码器。至少在图形性能方面,与RX Vega 8相比,已经提高了约40-50%。 RX Vega 8相比,至少图形性能提高了40-50%。
因此,游戏的野心不应该太深远,因为人们将不得不把自己限制在旧的或要求不高的游戏中,如Dota 2。例如,《F1 2021》等热门游戏仍然可以在中/高分辨率下流畅运行。图形性能在持续负载和电池供电的情况下保持稳定,更多的GPU基准测试可以在这里找到 这里.
| 3DMark 11 Performance | 7527 points | |
| 3DMark Cloud Gate Standard Score | 23270 points | |
| 3DMark Fire Strike Score | 5320 points | |
| 3DMark Time Spy Score | 1928 points | |
Help | ||
Witcher 3 FPS Chart
| low | med. | high | ultra | |
|---|---|---|---|---|
| GTA V (2015) | 105.3 | 94.5 | 27.6 | 11.5 |
| The Witcher 3 (2015) | 102 | 66 | 33 | 14.2 |
| Dota 2 Reborn (2015) | 133.9 | 95.1 | 74.7 | 67.8 |
| Final Fantasy XV Benchmark (2018) | 48.9 | 26.8 | 18.9 | |
| X-Plane 11.11 (2018) | 57.9 | 38.4 | 36.1 | |
| Far Cry 5 (2018) | 63 | 34 | 31 | 29 |
| Strange Brigade (2018) | 95.7 | 47.2 | 36.9 | 30 |
| F1 2021 (2021) | 119.4 | 56 | 44.7 | 30.1 |
| Farming Simulator 22 (2021) | 110 | 51 | 37 | 33 |
排放--华为继续依靠两个风扇
系统噪音
在日常使用中,MateBook 16s通常是一个非常安静的伴侣,但似乎这两个风扇经常以较慢的速度运行,因为噪音往往很难察觉。只要你保持在正常模式下,满载时的音量在39 dB(A)还是可以的(或游戏时~35)。只有在性能模式下,它才会变得非常响亮,最高可达48.4 dB(A)。相对而言,这太吵了。
与MateBook 16相比,基本的系统噪音特性也略有变化。在日常使用中,风扇似乎启动得更早一些。其他电子噪音,如线圈啸叫,没有被发现。
Noise level
| Idle |
| 24 / 25.2 / 27.2 dB(A) |
| Load |
| 34.8 / 39 dB(A) |
 | ||
30 dB silent 40 dB(A) audible 50 dB(A) loud |
||
min: | ||
| Huawei MateBook 16s i7 Iris Xe G7 96EUs, i7-12700H, Silicon Motion PCIe-8 SSD | Huawei MateBook 16 R7 5800H Vega 8, R7 5800H, Lite-On CA5-8D512 | Dell Inspiron 16 7620 2-in-1 Iris Xe G7 96EUs, i7-1260P, Toshiba KBG40ZNS512G NVMe | Dell XPS 15 9510 i5 11400H FHD UHD Graphics Xe 16EUs, i5-11400H, Micron 2300 512GB MTFDHBA512TDV | LG Gram 16 (2021) Iris Xe G7 96EUs, i7-1165G7, SK Hynix PC601 1TB HFS001TD9TNG | |
|---|---|---|---|---|---|
| Noise | 1% | 5% | 6% | 3% | |
| off / environment * (dB) | 24 | 24.8 -3% | 23.2 3% | 24.4 -2% | 26 -8% |
| Idle Minimum * (dB) | 24 | 24.8 -3% | 23.5 2% | 24.4 -2% | 26 -8% |
| Idle Average * (dB) | 25.2 | 24.8 2% | 23.5 7% | 24.4 3% | 26 -3% |
| Idle Maximum * (dB) | 27.2 | 26.7 2% | 23.5 14% | 24.4 10% | 26 4% |
| Load Average * (dB) | 34.8 | 32 8% | 29.4 16% | 26.1 25% | 30.8 11% |
| Witcher 3 ultra * (dB) | 34.8 | 32 8% | 35.6 -2% | 33.2 5% | |
| Load Maximum * (dB) | 39 | 42.4 -9% | 39.7 -2% | 37.7 3% | 31.1 20% |
* ... smaller is better
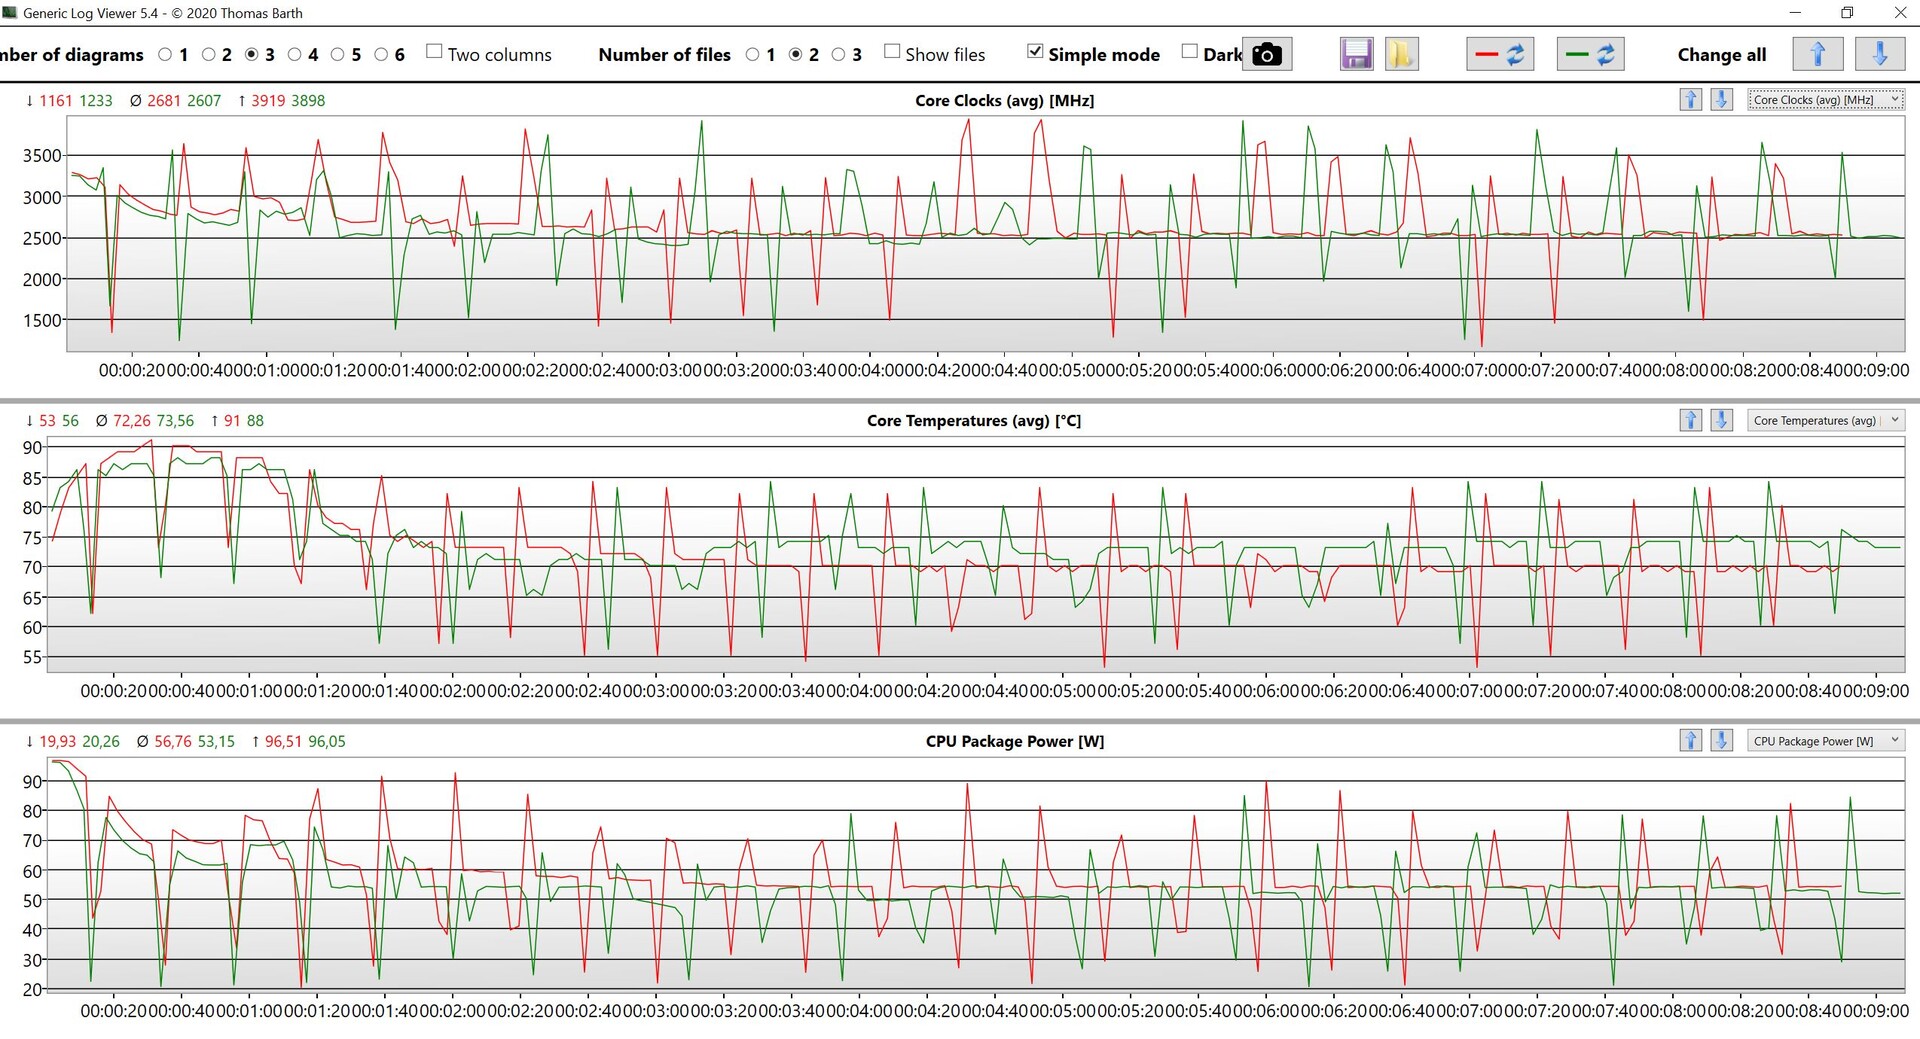
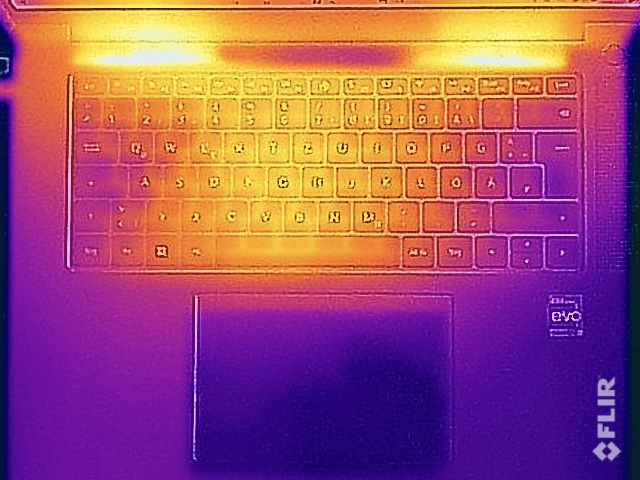
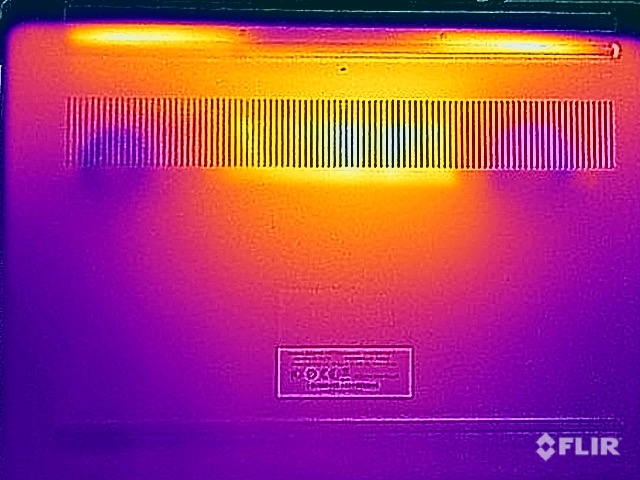
温度
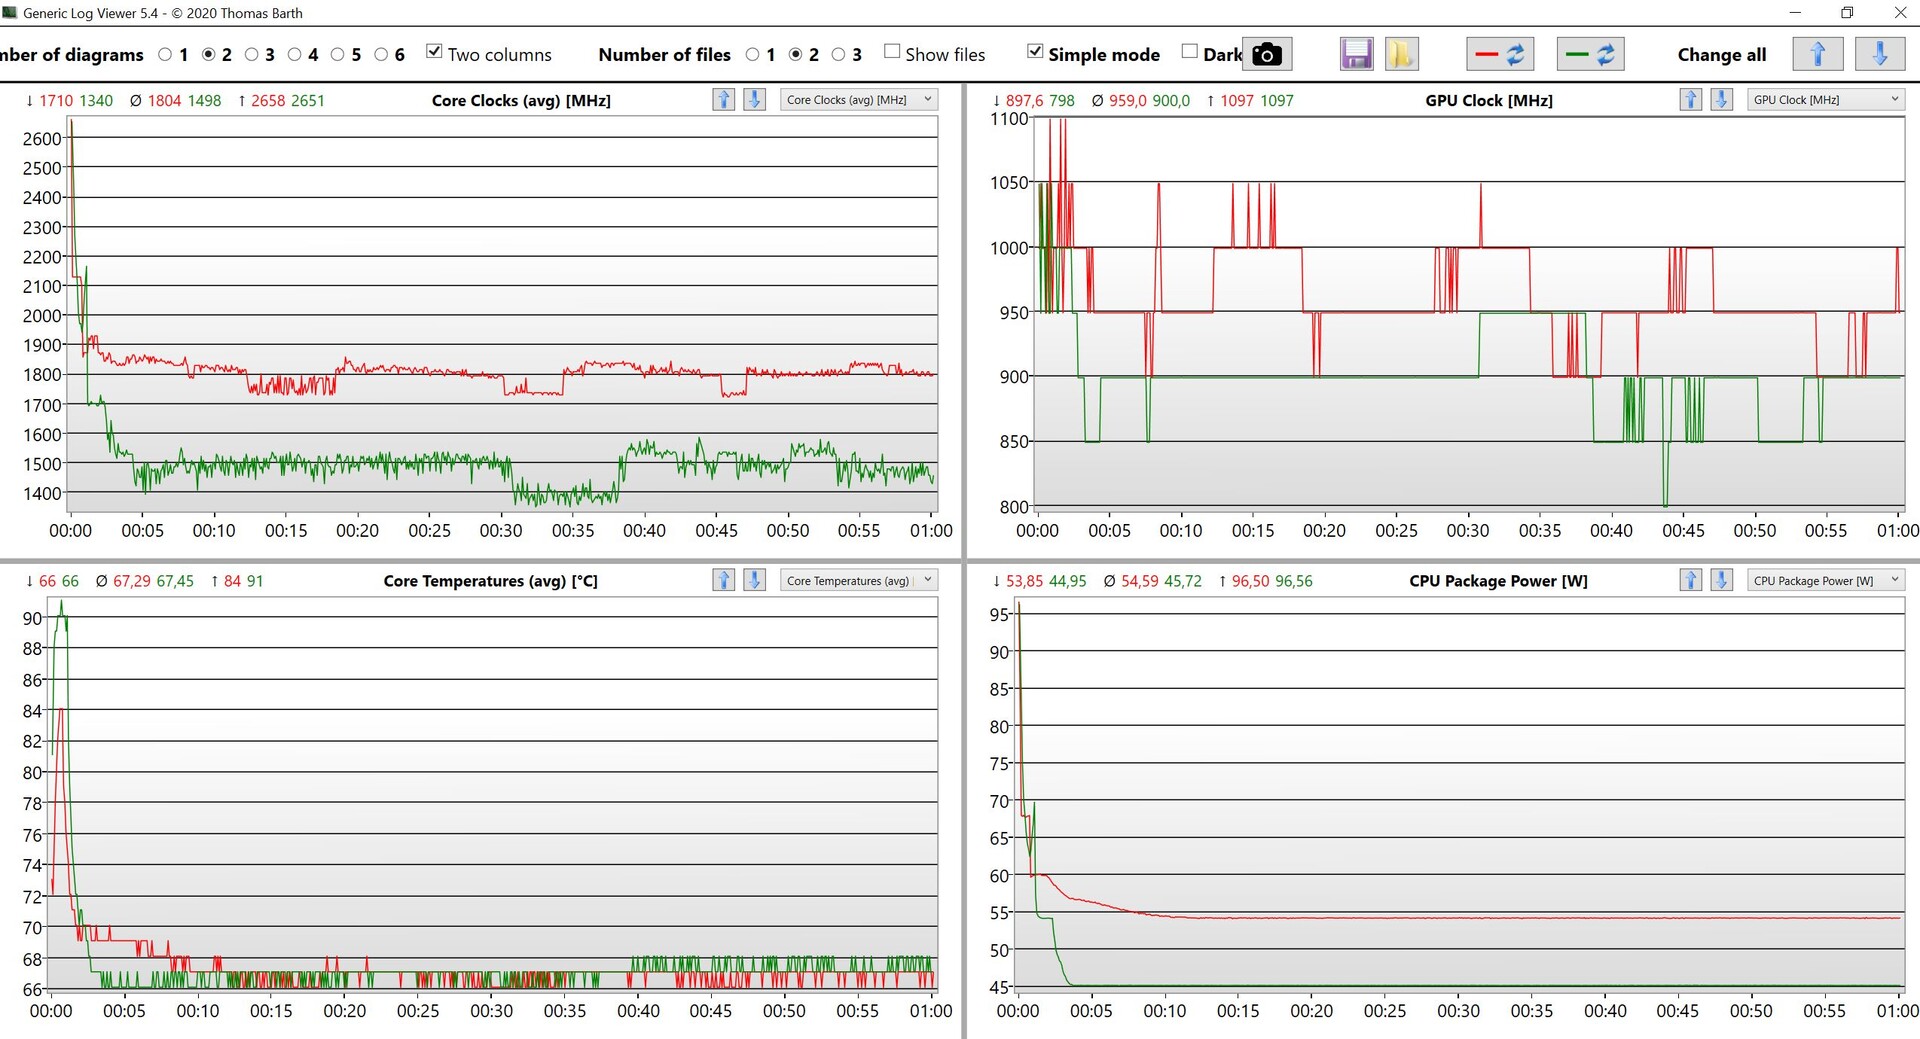
总体而言,表面温度没有任何问题。在日常使用中没有明显的问题,即使在极端负荷下,也只有底部面板上有一个小的热点。我们在一小时的压力测试后测得48℃。这方面的问题更多在于电源。华为能够使90瓦的电源更加紧凑,但是它变得非常热(~65℃)。
在压力测试中,相当明显的是,处理器的功耗迅速达到45瓦,在电源模式下达到54瓦,然后稳定在这些数值。
(±) The maximum temperature on the upper side is 40.9 °C / 106 F, compared to the average of 36.8 °C / 98 F, ranging from 21 to 71 °C for the class Multimedia.
(-) The bottom heats up to a maximum of 48.3 °C / 119 F, compared to the average of 39.1 °C / 102 F
(+) In idle usage, the average temperature for the upper side is 27.4 °C / 81 F, compared to the device average of 31.3 °C / 88 F.
(±) Playing The Witcher 3, the average temperature for the upper side is 34.6 °C / 94 F, compared to the device average of 31.3 °C / 88 F.
(+) The palmrests and touchpad are cooler than skin temperature with a maximum of 27.9 °C / 82.2 F and are therefore cool to the touch.
(±) The average temperature of the palmrest area of similar devices was 28.7 °C / 83.7 F (+0.8 °C / 1.5 F).
| Huawei MateBook 16s i7 Intel Core i7-12700H, Intel Iris Xe Graphics G7 96EUs | Huawei MateBook 16 R7 5800H AMD Ryzen 7 5800H, AMD Radeon RX Vega 8 (Ryzen 4000/5000) | Dell Inspiron 16 7620 2-in-1 Intel Core i7-1260P, Intel Iris Xe Graphics G7 96EUs | Dell XPS 15 9510 i5 11400H FHD Intel Core i5-11400H, Intel UHD Graphics Xe 16EUs | LG Gram 16 (2021) Intel Core i7-1165G7, Intel Iris Xe Graphics G7 96EUs | |
|---|---|---|---|---|---|
| Heat | 6% | -6% | 9% | 6% | |
| Maximum Upper Side * (°C) | 40.9 | 40.2 2% | 42.2 -3% | 42.8 -5% | 46.9 -15% |
| Maximum Bottom * (°C) | 48.3 | 49.7 -3% | 47.4 2% | 41.2 15% | 45.1 7% |
| Idle Upper Side * (°C) | 29.2 | 26.4 10% | 32.2 -10% | 25.8 12% | 26.4 10% |
| Idle Bottom * (°C) | 30.4 | 26.4 13% | 33.6 -11% | 26.2 14% | 24.1 21% |
* ... smaller is better
发言人
键盘旁边的两个立体声扬声器没有变化,我们的测量结果几乎完全相同。华为可能在软件上做了小的调整。它们可以变得非常响亮,占用很多空间,而且轻微的立体声效果也相当明显。再多一点低音就好了,但对于正常的背景音乐播放或偶尔的视频,内置的音响系统绝对够用。
Huawei MateBook 16s i7 audio analysis
(+) | speakers can play relatively loud (87.3 dB)
Bass 100 - 315 Hz
(±) | reduced bass - on average 8% lower than median
(+) | bass is linear (6.2% delta to prev. frequency)
Mids 400 - 2000 Hz
(±) | higher mids - on average 6.3% higher than median
(+) | mids are linear (4.2% delta to prev. frequency)
Highs 2 - 16 kHz
(+) | balanced highs - only 3.7% away from median
(+) | highs are linear (3.3% delta to prev. frequency)
Overall 100 - 16.000 Hz
(+) | overall sound is linear (11.1% difference to median)
Compared to same class
» 16% of all tested devices in this class were better, 3% similar, 81% worse
» The best had a delta of 5%, average was 17%, worst was 45%
Compared to all devices tested
» 7% of all tested devices were better, 2% similar, 91% worse
» The best had a delta of 4%, average was 23%, worst was 134%
Dell XPS 15 9510 i5 11400H FHD audio analysis
(+) | speakers can play relatively loud (88.8 dB)
Bass 100 - 315 Hz
(±) | reduced bass - on average 5.6% lower than median
(+) | bass is linear (4.3% delta to prev. frequency)
Mids 400 - 2000 Hz
(+) | balanced mids - only 3.9% away from median
(+) | mids are linear (4.1% delta to prev. frequency)
Highs 2 - 16 kHz
(+) | balanced highs - only 2.4% away from median
(+) | highs are linear (4.9% delta to prev. frequency)
Overall 100 - 16.000 Hz
(+) | overall sound is linear (8.4% difference to median)
Compared to same class
» 9% of all tested devices in this class were better, 2% similar, 89% worse
» The best had a delta of 5%, average was 17%, worst was 45%
Compared to all devices tested
» 2% of all tested devices were better, 1% similar, 97% worse
» The best had a delta of 4%, average was 23%, worst was 134%
能源管理--英特尔MateBook需要更多电量
消耗功率
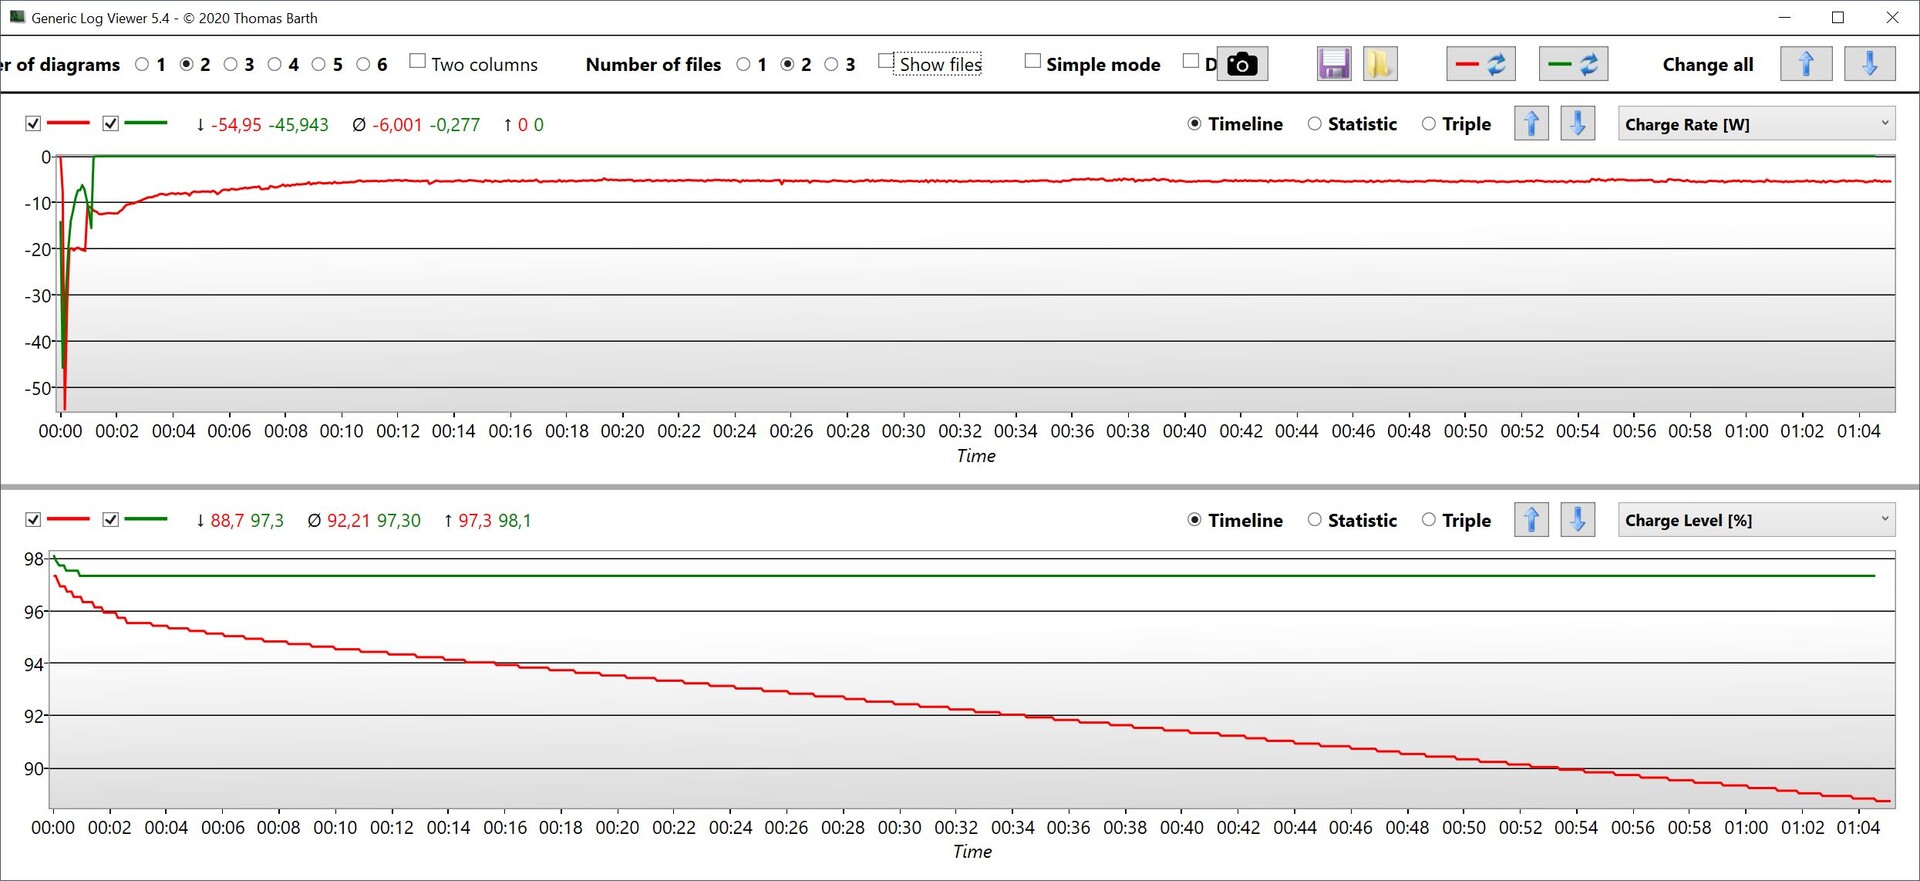
虽然这绝不是不可避免的,但功耗是MateBook 16s的最大问题之一。它的 前身有Ryzen 7 5800H,并有一个135瓦的标准电源。现在只有酷睿i9版本是这种情况。相比之下,MateBook 16s的酷睿i7型号只得到一个90瓦的适配器,尽管其功率限制已经提高。如果仅处理器就消耗近100瓦,人们会问自己,一个90瓦的电源怎么可能够用。整个系统的最大功耗几乎达到135瓦,这意味着在CPU负载过程开始时可能需要从电池中提取45瓦(见下图的充电率)。这对电池来说是不健康的。
然而,这不仅是在压力测试条件下的情况,也是在使用所有内核的任何CPU负载中的情况。我们无法理解为什么在价格大幅上涨的情况下还能节省电源费用。尽管显示屏颜色稍暗,但空闲功耗率也略有增加。这只能归因于英特尔处理器在其他方面的类似配置。
| Off / Standby | |
| Idle | |
| Load |
|
Key:
min: | |
| Huawei MateBook 16s i7 i7-12700H, Iris Xe G7 96EUs, Silicon Motion PCIe-8 SSD, IPS, 2520x1680, 16" | Huawei MateBook 16 R7 5800H R7 5800H, Vega 8, Lite-On CA5-8D512, , 2520x1680, 16" | Dell Inspiron 16 7620 2-in-1 i7-1260P, Iris Xe G7 96EUs, Toshiba KBG40ZNS512G NVMe, IPS, 1920x1200, 16" | Dell XPS 15 9510 i5 11400H FHD i5-11400H, UHD Graphics Xe 16EUs, Micron 2300 512GB MTFDHBA512TDV, IPS, 1920x1200, 15.6" | LG Gram 16 (2021) i7-1165G7, Iris Xe G7 96EUs, SK Hynix PC601 1TB HFS001TD9TNG, IPS, 2560x1600, 16" | Average Intel Iris Xe Graphics G7 96EUs | Average of class Multimedia | |
|---|---|---|---|---|---|---|---|
| Power Consumption | 13% | 27% | 34% | 40% | 28% | 7% | |
| Idle Minimum * (Watt) | 6.8 | 4.6 32% | 5.3 22% | 5.3 22% | 3.8 44% | 5.51 ? 19% | 5.66 ? 17% |
| Idle Average * (Watt) | 13.2 | 10.5 20% | 8.3 37% | 9 32% | 9 32% | 8.66 ? 34% | 10.2 ? 23% |
| Idle Maximum * (Watt) | 13.8 | 11.2 19% | 9.6 30% | 9.7 30% | 11.3 18% | 10.9 ? 21% | 12.5 ? 9% |
| Load Average * (Watt) | 75.2 | 59.1 21% | 54.3 28% | 30.3 60% | 35.2 53% | 45.6 ? 39% | 65.2 ? 13% |
| Witcher 3 ultra * (Watt) | 56.1 | 58.6 -4% | 43.9 22% | 30.6 45% | |||
| Load Maximum * (Watt) | 90.6 | 98.3 -8% | 70 23% | 76.2 16% | 43.5 52% | 67.8 ? 25% | 113.5 ? -25% |
* ... smaller is better
Power Consumption Witcher 3 / Stresstest
Power Consumption external Monitor
电池寿命
能源消耗的增加和相同的电池容量意味着新MateBook 16s的电池寿命比配备AMD处理器的MateBook 16更差。在150cd/m²(最大亮度的51%)的WLAN测试中,我们现在只达到8小时的运行时间。这当然也是由于新的性能核心的更高的功耗造成的。在全亮度下,只有不到6小时,而在视频播放上,只有9小时多一点。老款MateBook 16在每个类别中都能轻松多用2小时。在设备开启的情况下,整个充电过程大约需要两个小时。
| Huawei MateBook 16s i7 i7-12700H, Iris Xe G7 96EUs, 84 Wh | Huawei MateBook 16 R7 5800H R7 5800H, Vega 8, 84 Wh | Dell Inspiron 16 7620 2-in-1 i7-1260P, Iris Xe G7 96EUs, 87 Wh | Dell XPS 15 9510 i5 11400H FHD i5-11400H, UHD Graphics Xe 16EUs, 56 Wh | LG Gram 16 (2021) i7-1165G7, Iris Xe G7 96EUs, 80 Wh | Average of class Multimedia | |
|---|---|---|---|---|---|---|
| Battery runtime | 16% | 74% | -9% | 112% | 41% | |
| H.264 (h) | 9.3 | 10.9 17% | 20.1 116% | 17.1 ? 84% | ||
| WiFi v1.3 (h) | 8.1 | 12.8 58% | 14.6 80% | 7.4 -9% | 15.7 94% | 12.2 ? 51% |
| Load (h) | 1.9 | 1.4 -26% | 3.2 68% | 4.3 126% | 1.664 ? -12% |
Pros
Cons
结论 - 转向英特尔也有一些不利因素
新的MateBook 16s接替的是 MateBook 16并有许多相似之处,但改用英特尔处理器后,以前的良好性价比已经所剩无几。Alder Lake一代的新英特尔酷睿i7的性能只比旧的AMD芯片稍好,而Wi-Fi 6E或额外的按键行程等改进当然也可以用AMD处理器。真正有说服力的英特尔处理器的论据是不存在的,除此之外,电池寿命也更短。尽管如此,价格还是上涨了500欧元(510美元)。
这引起了更多的问题,因为考虑到该机的高价格,人们会对显示器有更多的期待。图像质量非常好,但亮度仅略高于300cd/m²。更重要的是,sRGB覆盖率,没有亮度传感器,以及只有60赫兹,都不符合这个价格的期望。英特尔处理器的iGPU也只是无法与小型的专用显卡竞争。如果你要省去专用显卡,配备新的Radeon 680M的AMD处理器将是一个明显更好的选择。
使用新的英特尔处理器,与旧的MateBook 16 AMD相比,性能只略有提高,但电池寿命也更短。总而言之,新MateBook 16s有些令人失望,尤其是考虑到它的性价比。如果采用目前规格的AMD处理器,整体包装可能会更有吸引力。
电源也是一个重要问题,因为老款MateBook 16标配135瓦的适配器,而现在买家将不得不使用MateBook 16s的i7版本所配的90瓦电源。这在高负荷下的功率根本不够,而且设备也会变得非常热。在这种情况下,新电源更紧凑、更轻的事实没有什么好处,而且很明显,这是试图在错误的地方进行节约。
总而言之,MateBook 16s是一款不错的多媒体笔记本,但我们很难在这个价格上推荐它。如果你可以不使用1080p网络摄像头或稍长的按键行程等新功能,你最好看看旧的MateBook 16,它仍然可用,配备Ryzen 7 5800H,价格已经降到1000欧元(1020美元)以下。
价格和可用性
在市场发布会上,华为将MateBook 16s定价为1,699欧元(1,730美元)。这个价格包括外部显示器MateView GT 27和一个背包。带有显示器和背包的MateBook 16s Core i9-12900H将于7月14日上市,价格为1899欧元(1940美元)。
Huawei MateBook 16s i7
- 07/08/2022 v7 (old)
Andreas Osthoff
Price comparison

