BMAX B7 Power 评测:搭载英特尔酷睿 i7 处理器、售价 400 美元的节俭型迷你 PC
MaxMini B7 Power 并不是我们测试的第一款 BMAX 设备。BMAX MaxBook Y11 H1M6 Convertible在我们的测试中获得了 75 个百分点。我们还测试了 B7 Power 的前身BMAX B5 Pro。但未对其进行评分。2022 年底,配备英特尔 Gen8 处理器的 B5 仍是其顶级机型,但现在,B7 Power 配备了英特尔 Gen11 处理器。这可能不会让它成为最先进的机型,但反过来却能保持低廉的价格。目前,它的售价略低于 400 美元。BMAX 还提供一款 B7 Pro,配备了英特尔酷睿 i5-1145G7而不是英特尔酷睿 i7-11390H.
B7 Power 必须与其他迷你 PC 竞争。B7 PowerGeekom Mini IT11是采用相同 GPU 的候选产品之一,但我们也将分析其与更新一代 GPU(如英特尔 NUC 13 Pro 套件.在这两者之间,您可以找到英特尔 NUC 12 Pro 套件与英特尔 Gen12。更多比较设备包括Beelink SEi11和 B7 Power 的前身,即B5 Pro.
潜在的竞争对手比较
Rating | Date | Model | Weight | Height | Size | Resolution | Price |
|---|---|---|---|---|---|---|---|
| 78.4 % v7 (old) | 09 / 2023 | BMAX B7 Power G7A2 i7-11390H, Iris Xe G7 96EUs | 363 g | 44 mm | x | ||
| 80.6 % v7 (old) | 07 / 2023 | Geekom Mini IT11, i7-11390H i7-11390H, Iris Xe G7 96EUs | 536 g | 48 mm | x | ||
| 80.8 % v7 (old) | 04 / 2023 | Intel NUC 13 Pro Kit NUC13ANK i7-1360P, Iris Xe G7 96EUs | 538 g | 37 mm | x | ||
v (old) | 03 / 2023 | Intel NUC 12 Pro Kit NUC12WSBi5 i5-1240P, Iris Xe G7 80EUs | 549 g | 45.6 mm | x | ||
v (old) | 09 / 2022 | Beelink SEi11 Pro i5-11320H, Iris Xe G7 96EUs | 440 g | 40 mm | x | ||
v (old) | 11 / 2022 | BMAX B5 Pro G7H8 i5-8260U, UHD Graphics 620 | 369 g | 43.2 mm | x |
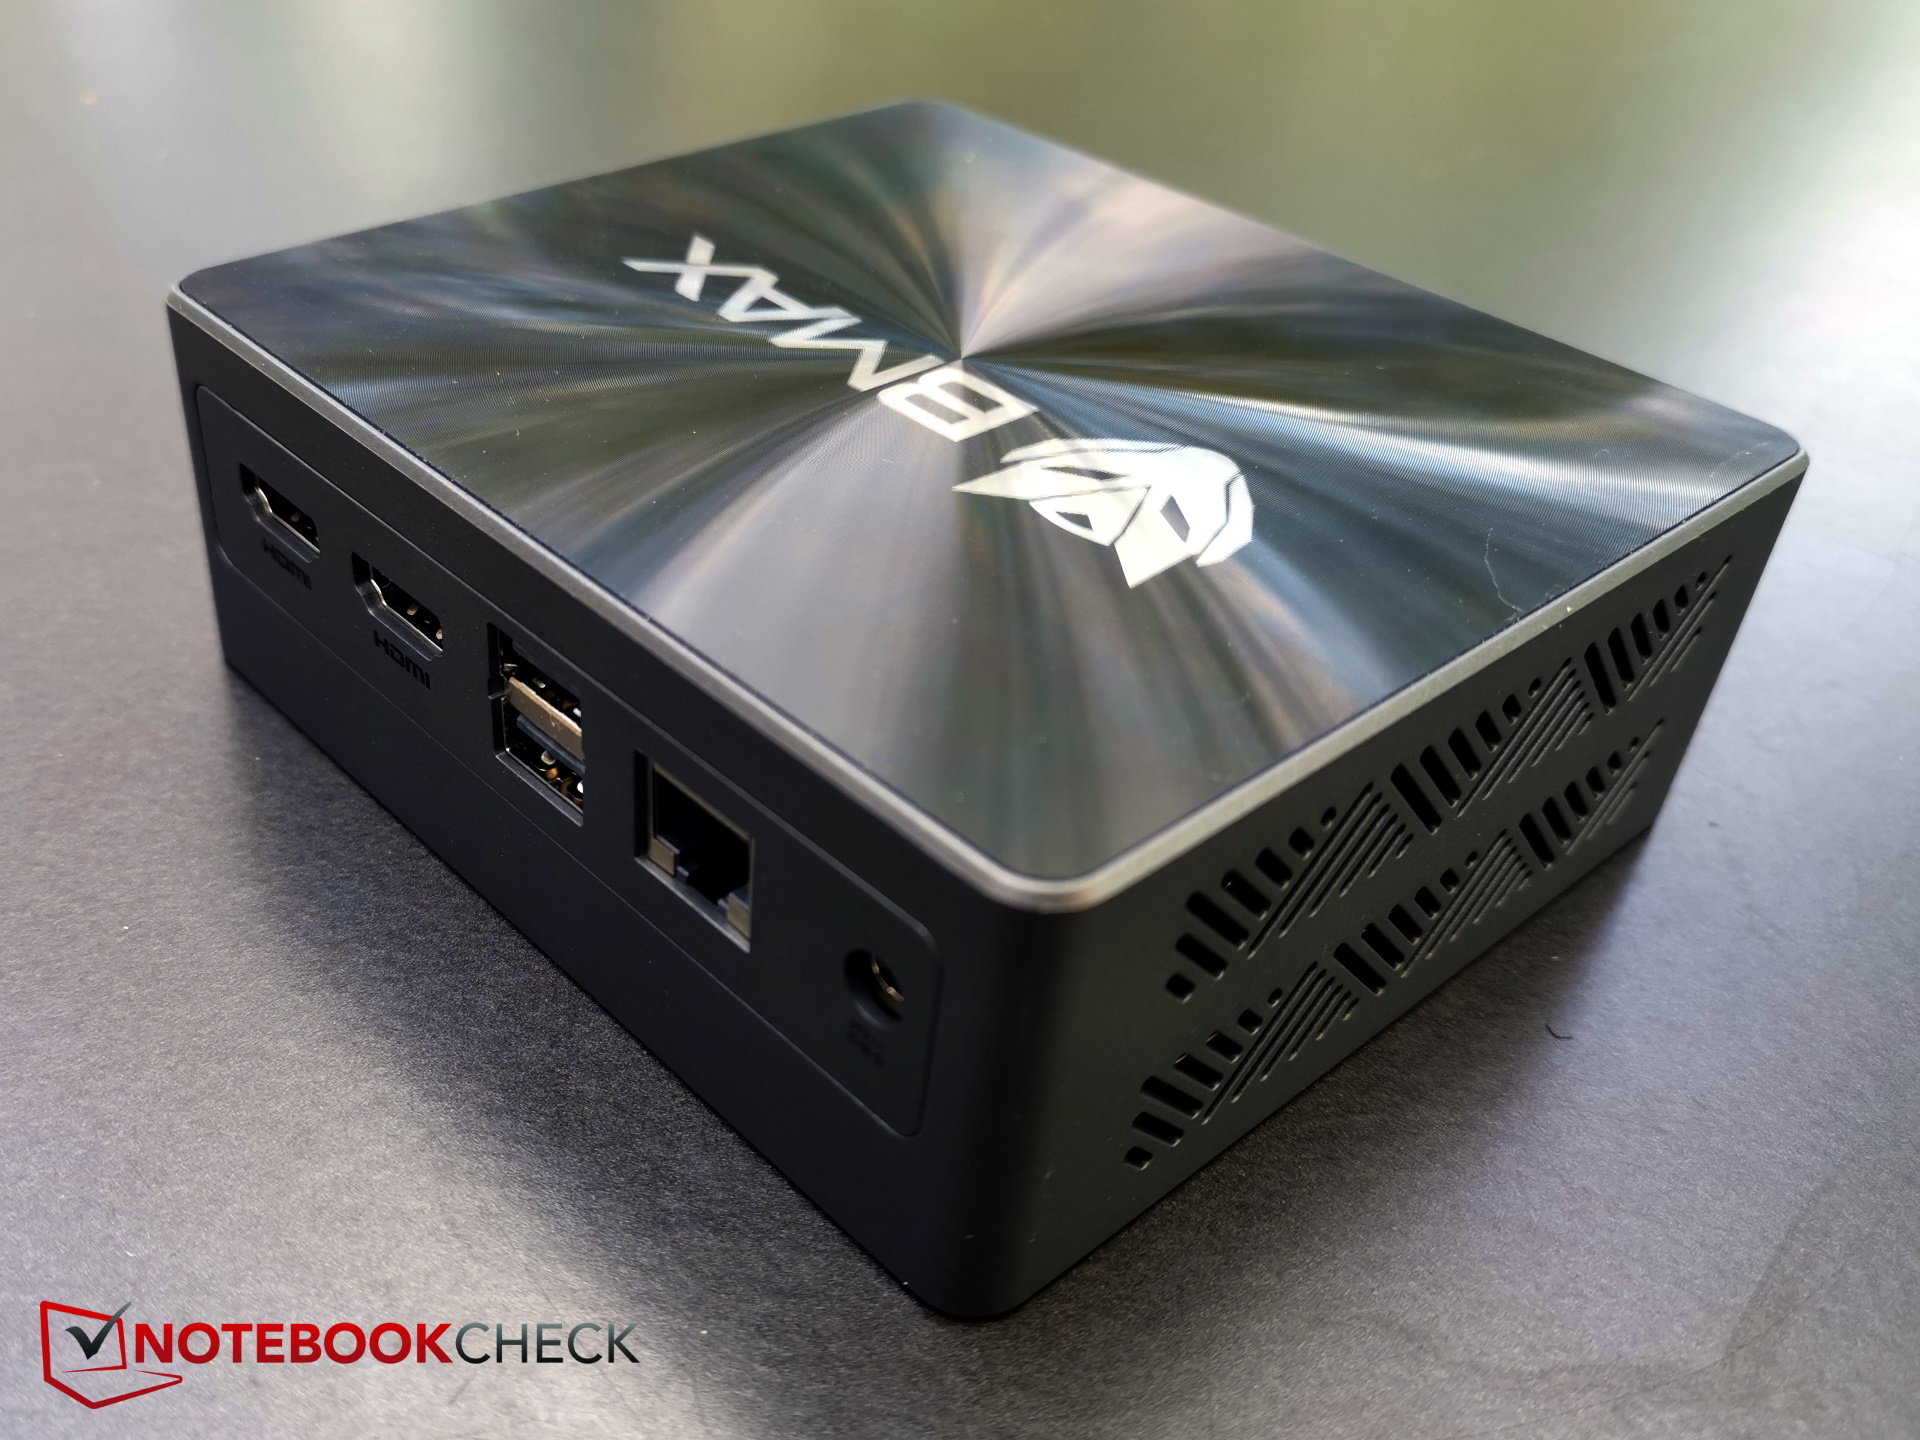
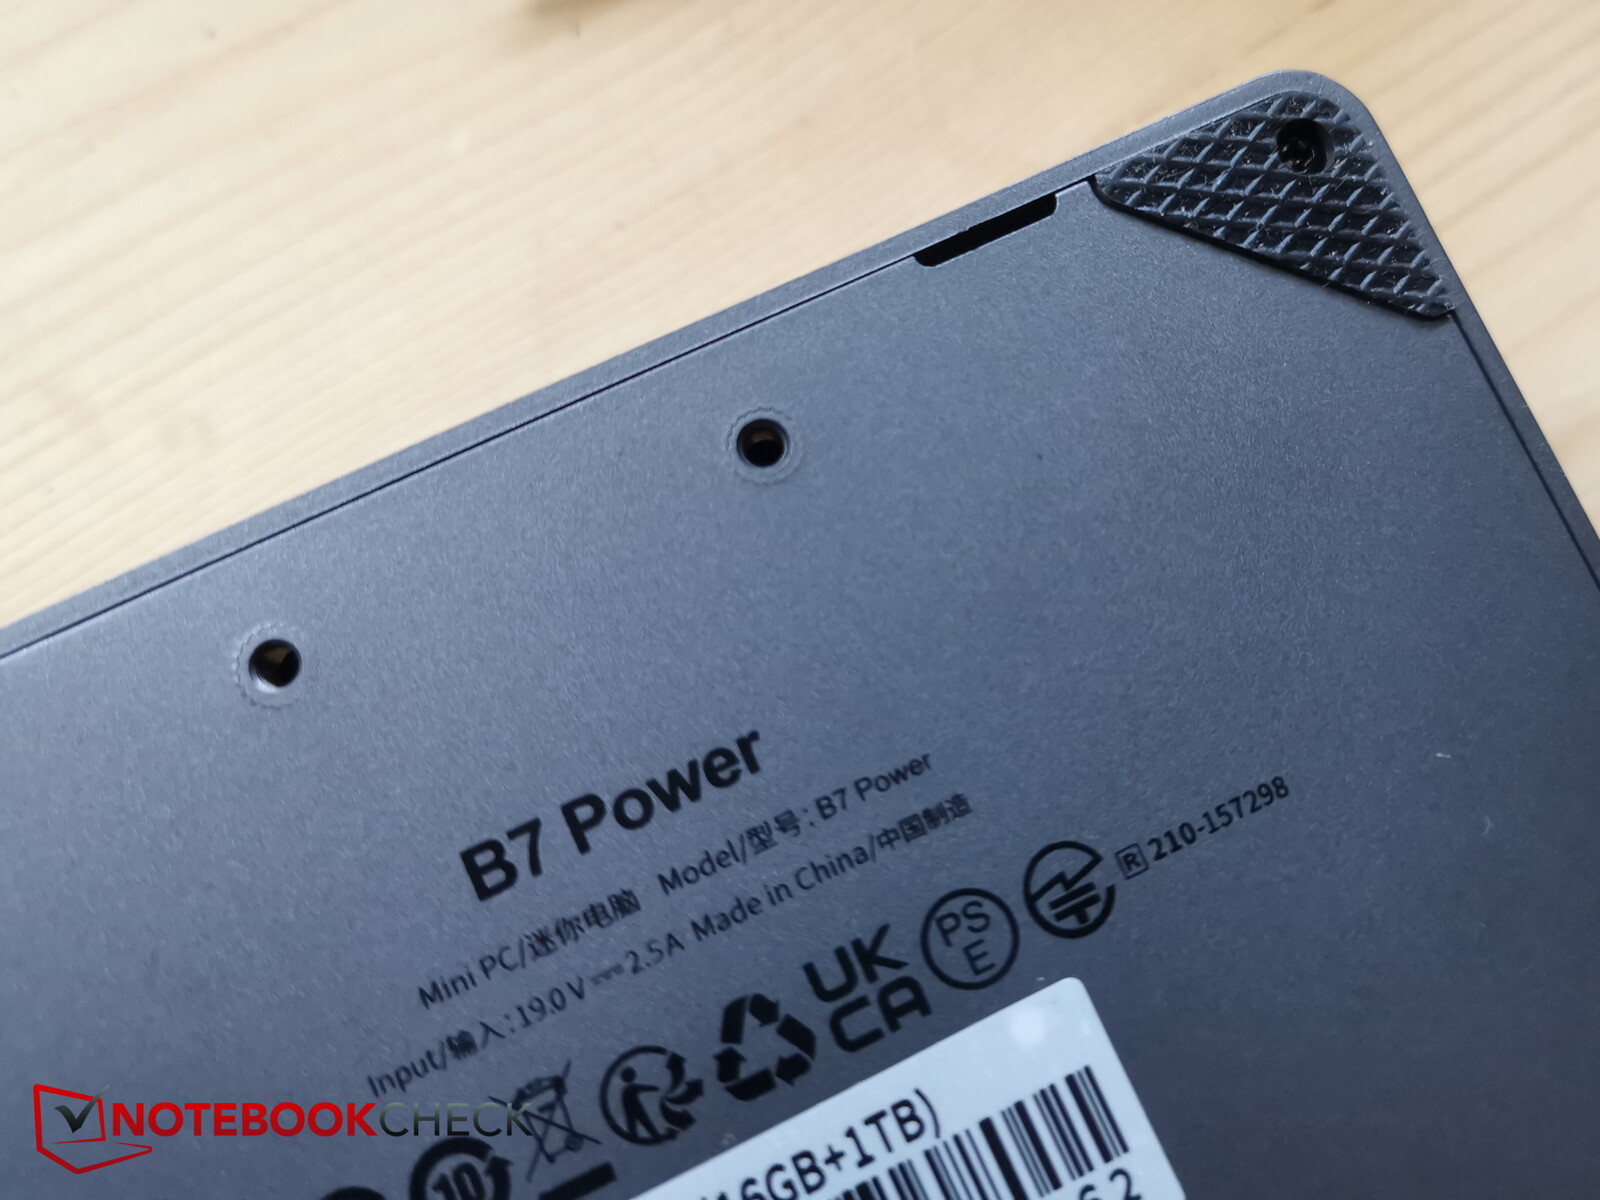
外壳 - B7 Power 由塑料制成
电脑的外壳基本上完全由深灰色至黑色塑料制成。由于其紧凑的矩形形状,它仍然相当坚固。不过,你不应该试图过度弯曲它,因为你很快就会听到塑料发出的吱吱声。同时,塑料材质也为该设备带来了仅 363 克的低重量。
B7 Power 的顶部有点抢眼,因为在 BMAX 徽标上方有一种菲涅尔透镜结构的印花,这使得上侧在不同的视角下闪烁着不同的光芒。
B7 Power 也是本次对比中最轻的迷你 PC。它的重量仅为 363 克,大大低于英特尔 NUC 机型(至少 538 克)。其次最轻的竞争对手是 迷你电脑但 440 克的重量已经比它重了不少。
另一方面,一些竞争对手(如英特尔 NUC)的机身略小--前端短了约 8 毫米。Beelink 也有类似的尺寸。
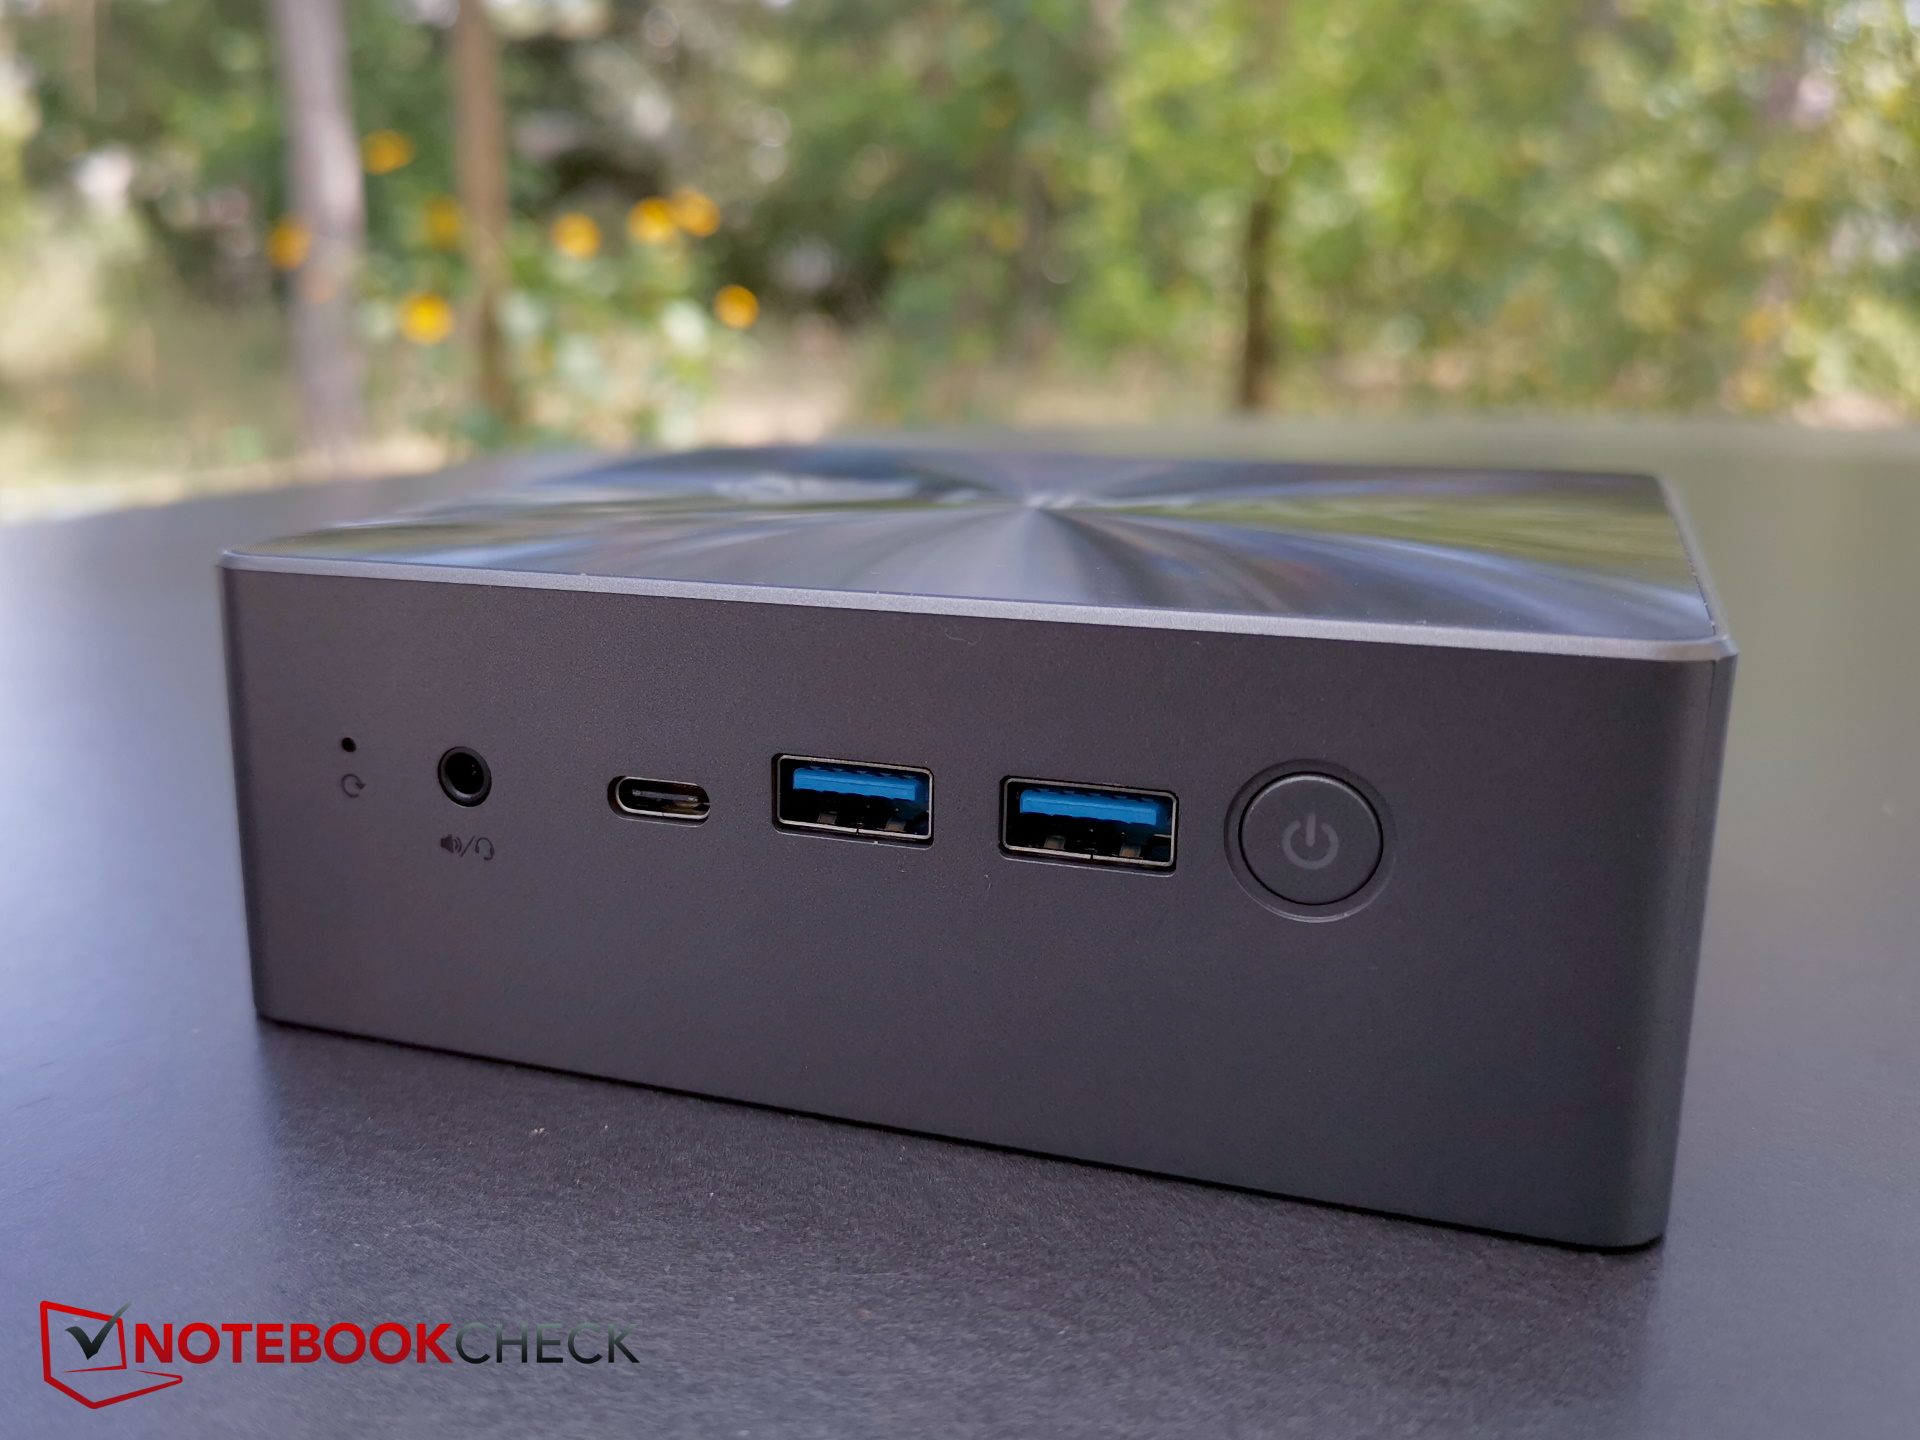
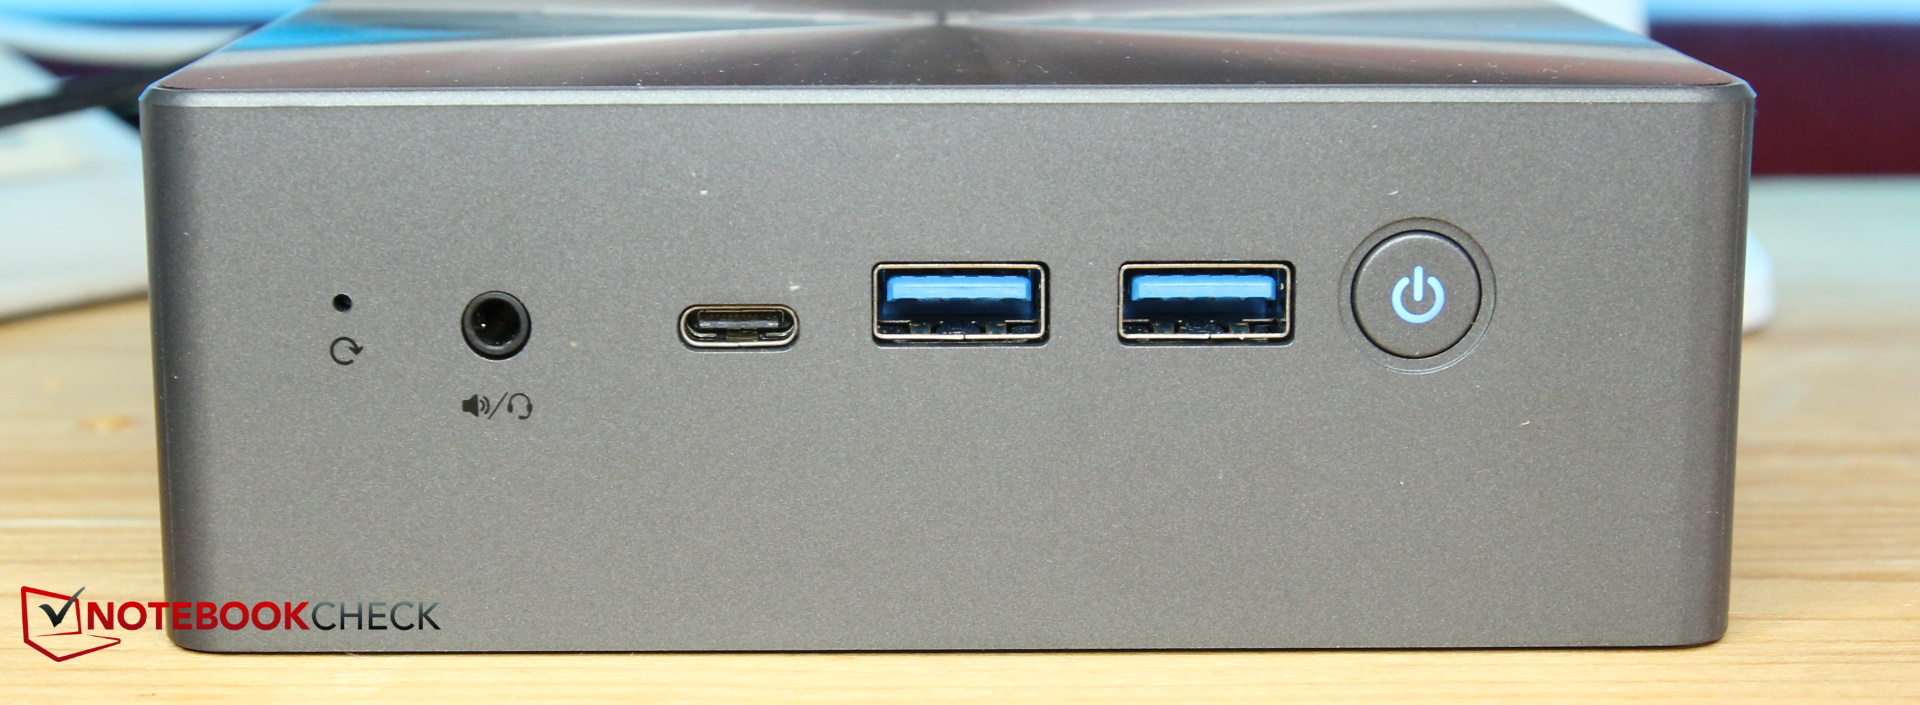
连接性 - USB-C,不带 Thunderbolt,但带 PD
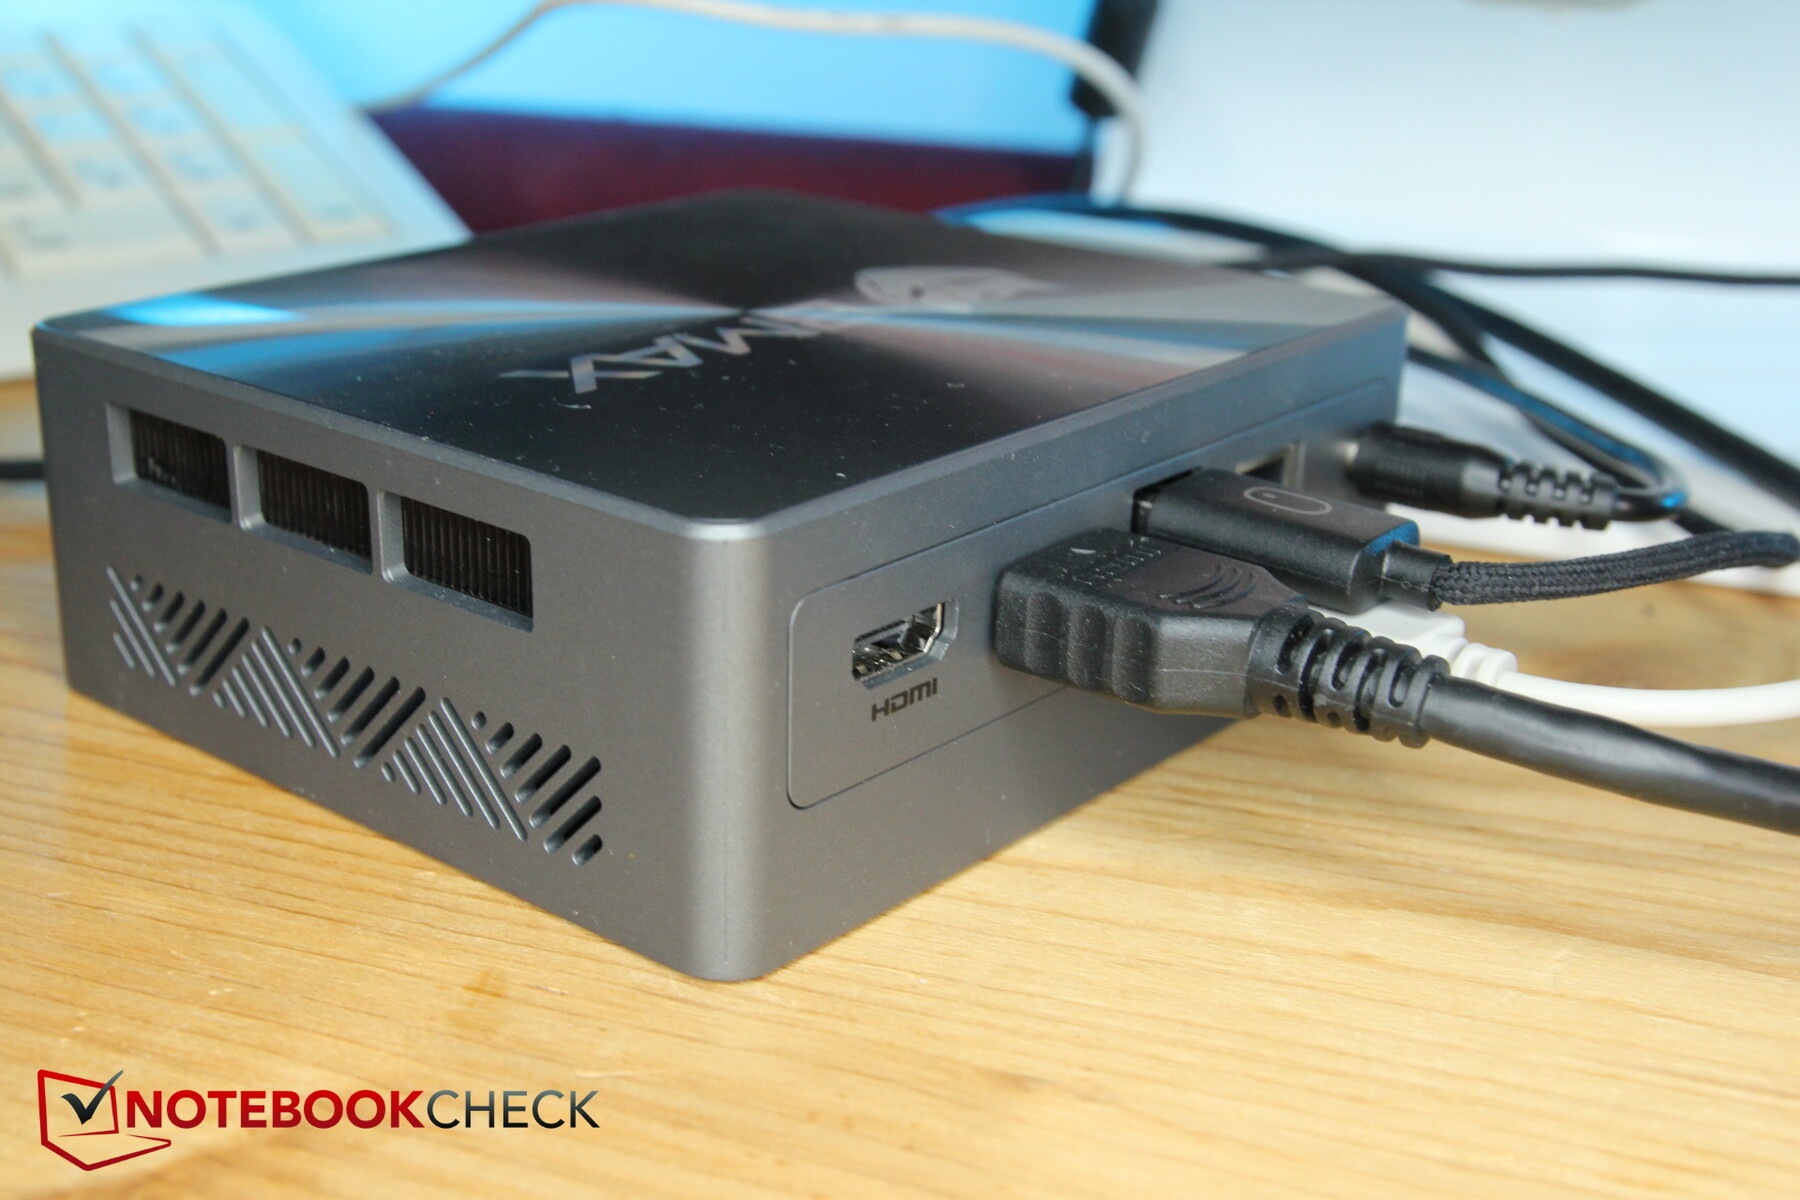
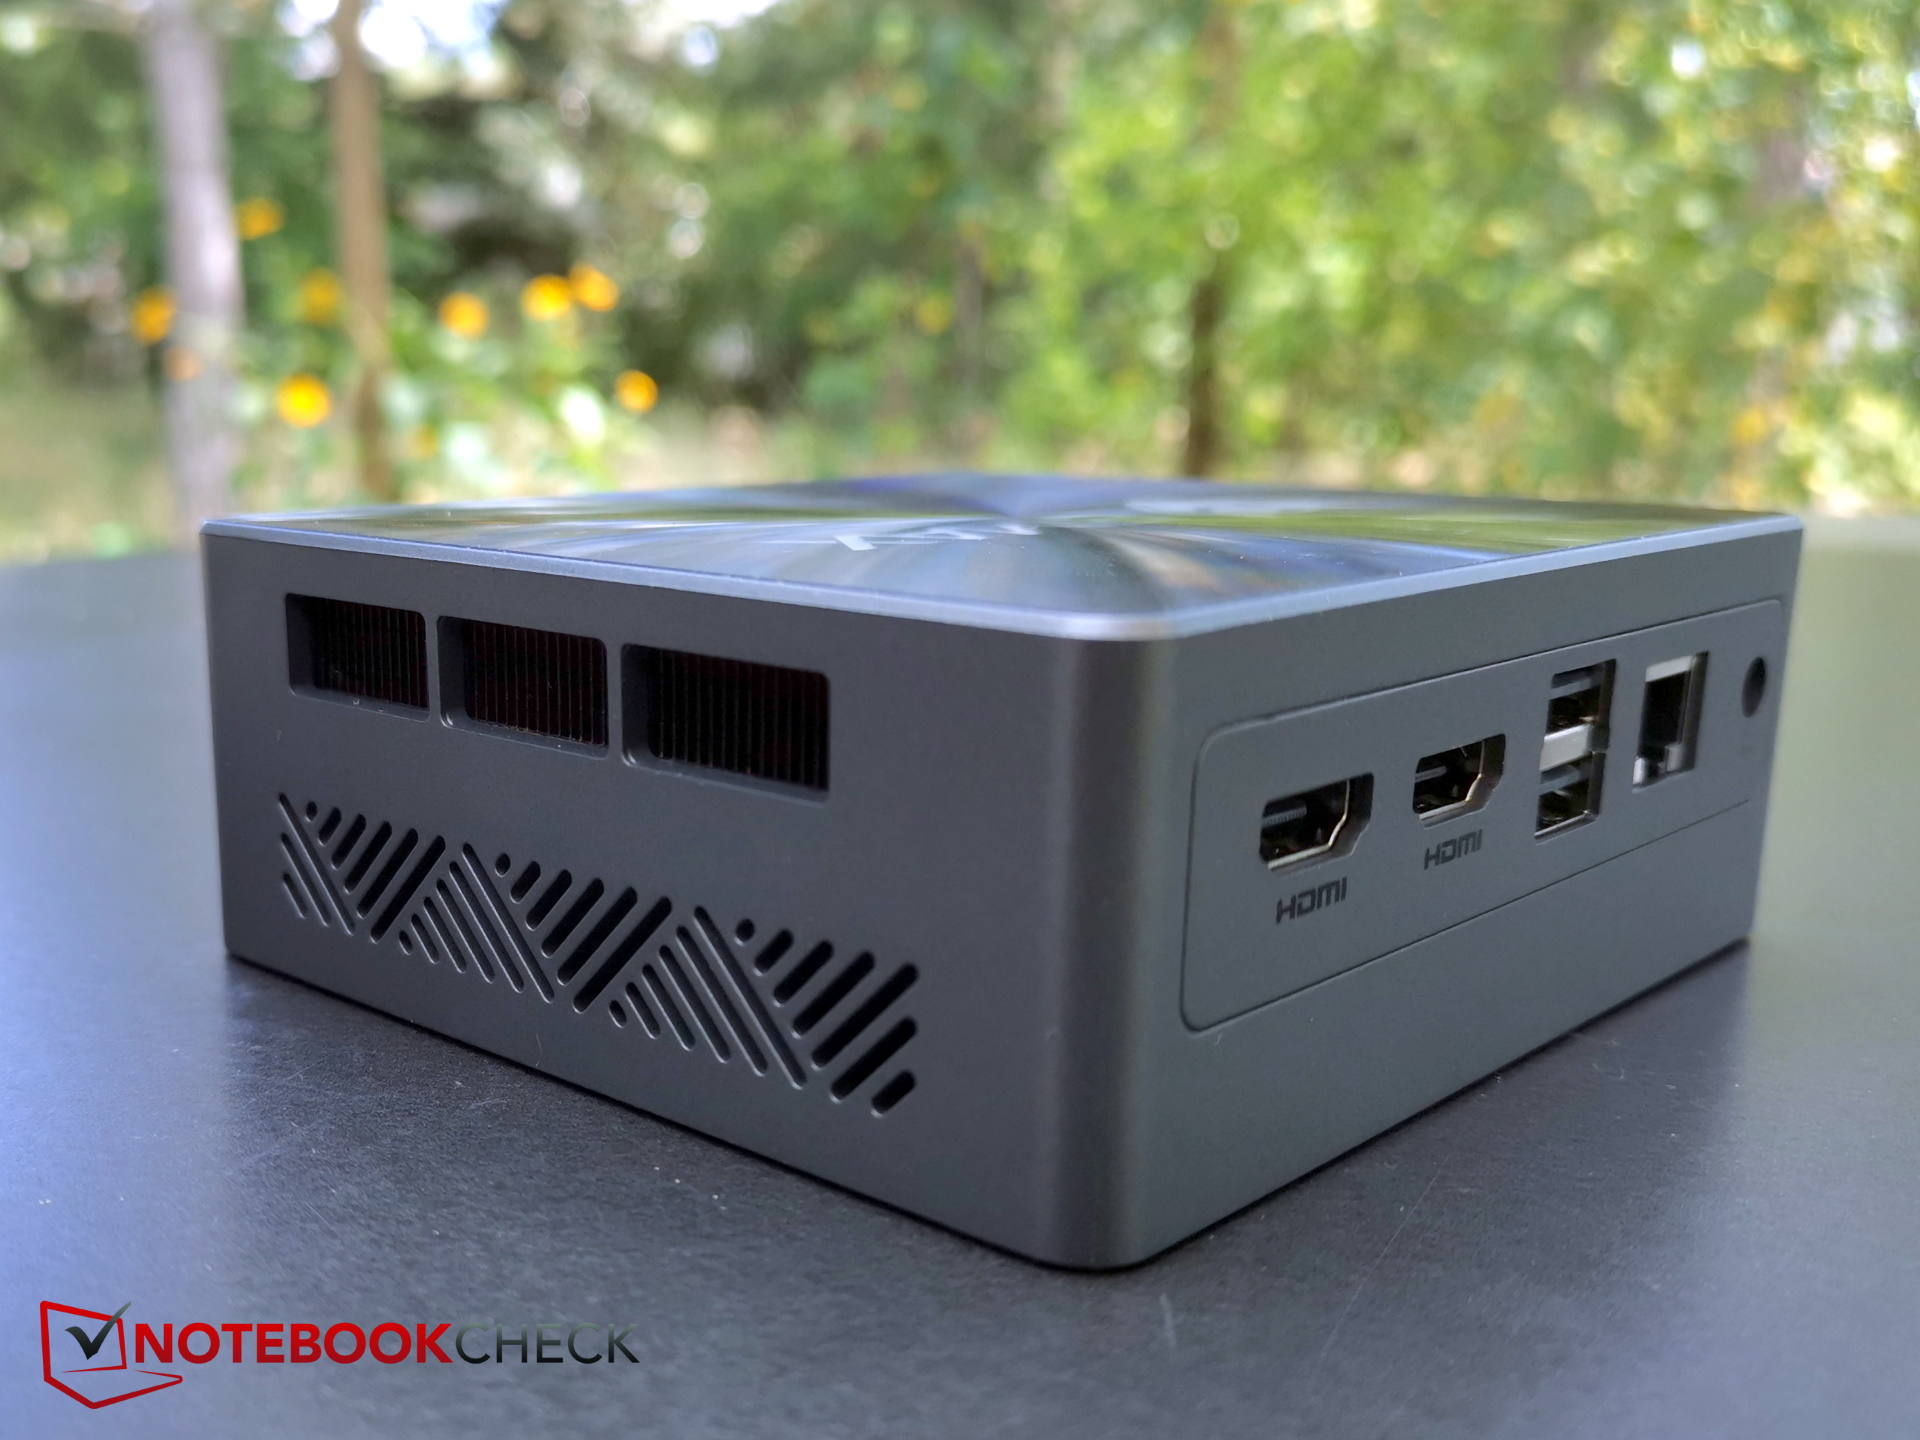
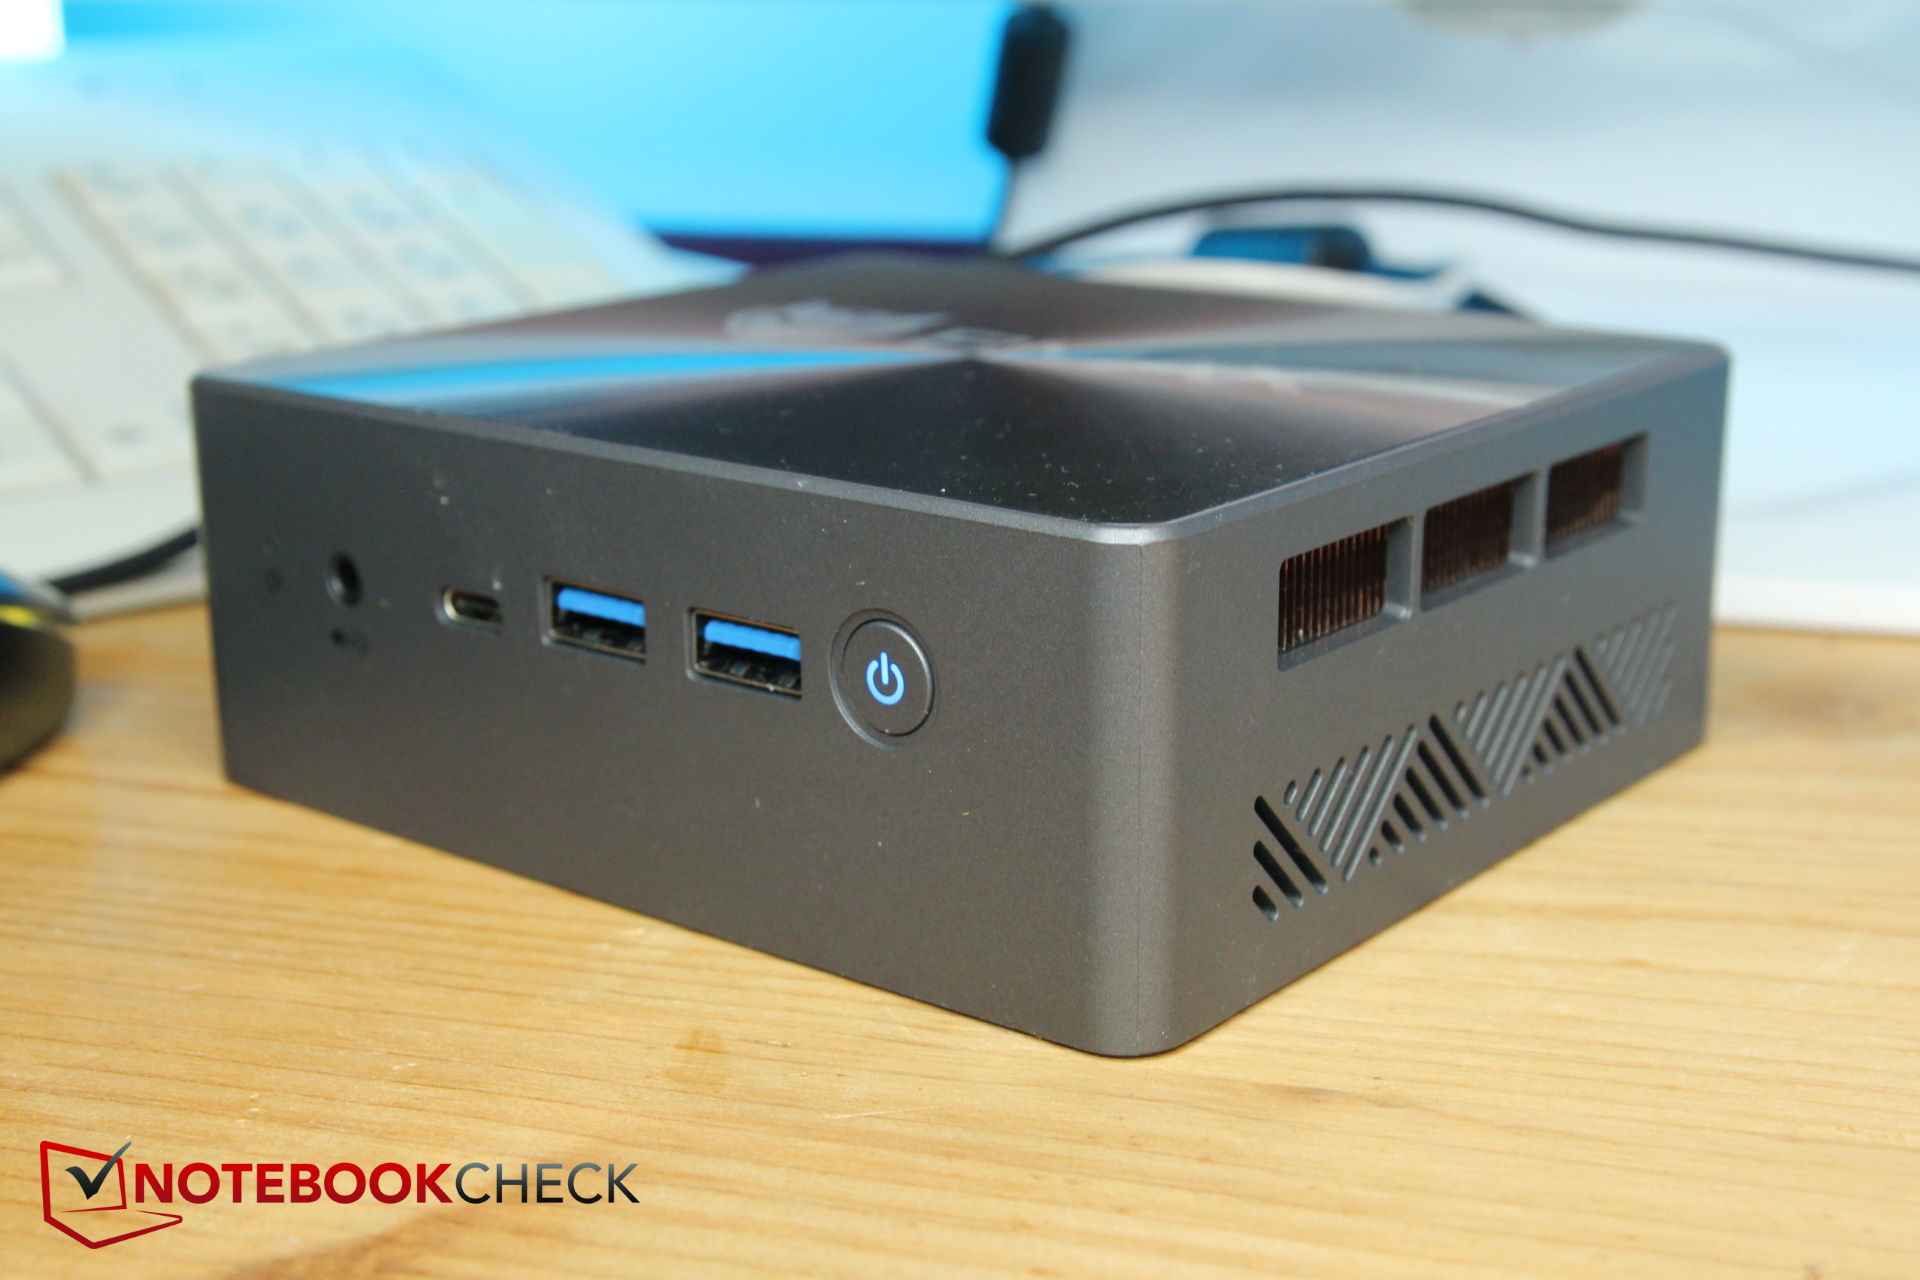
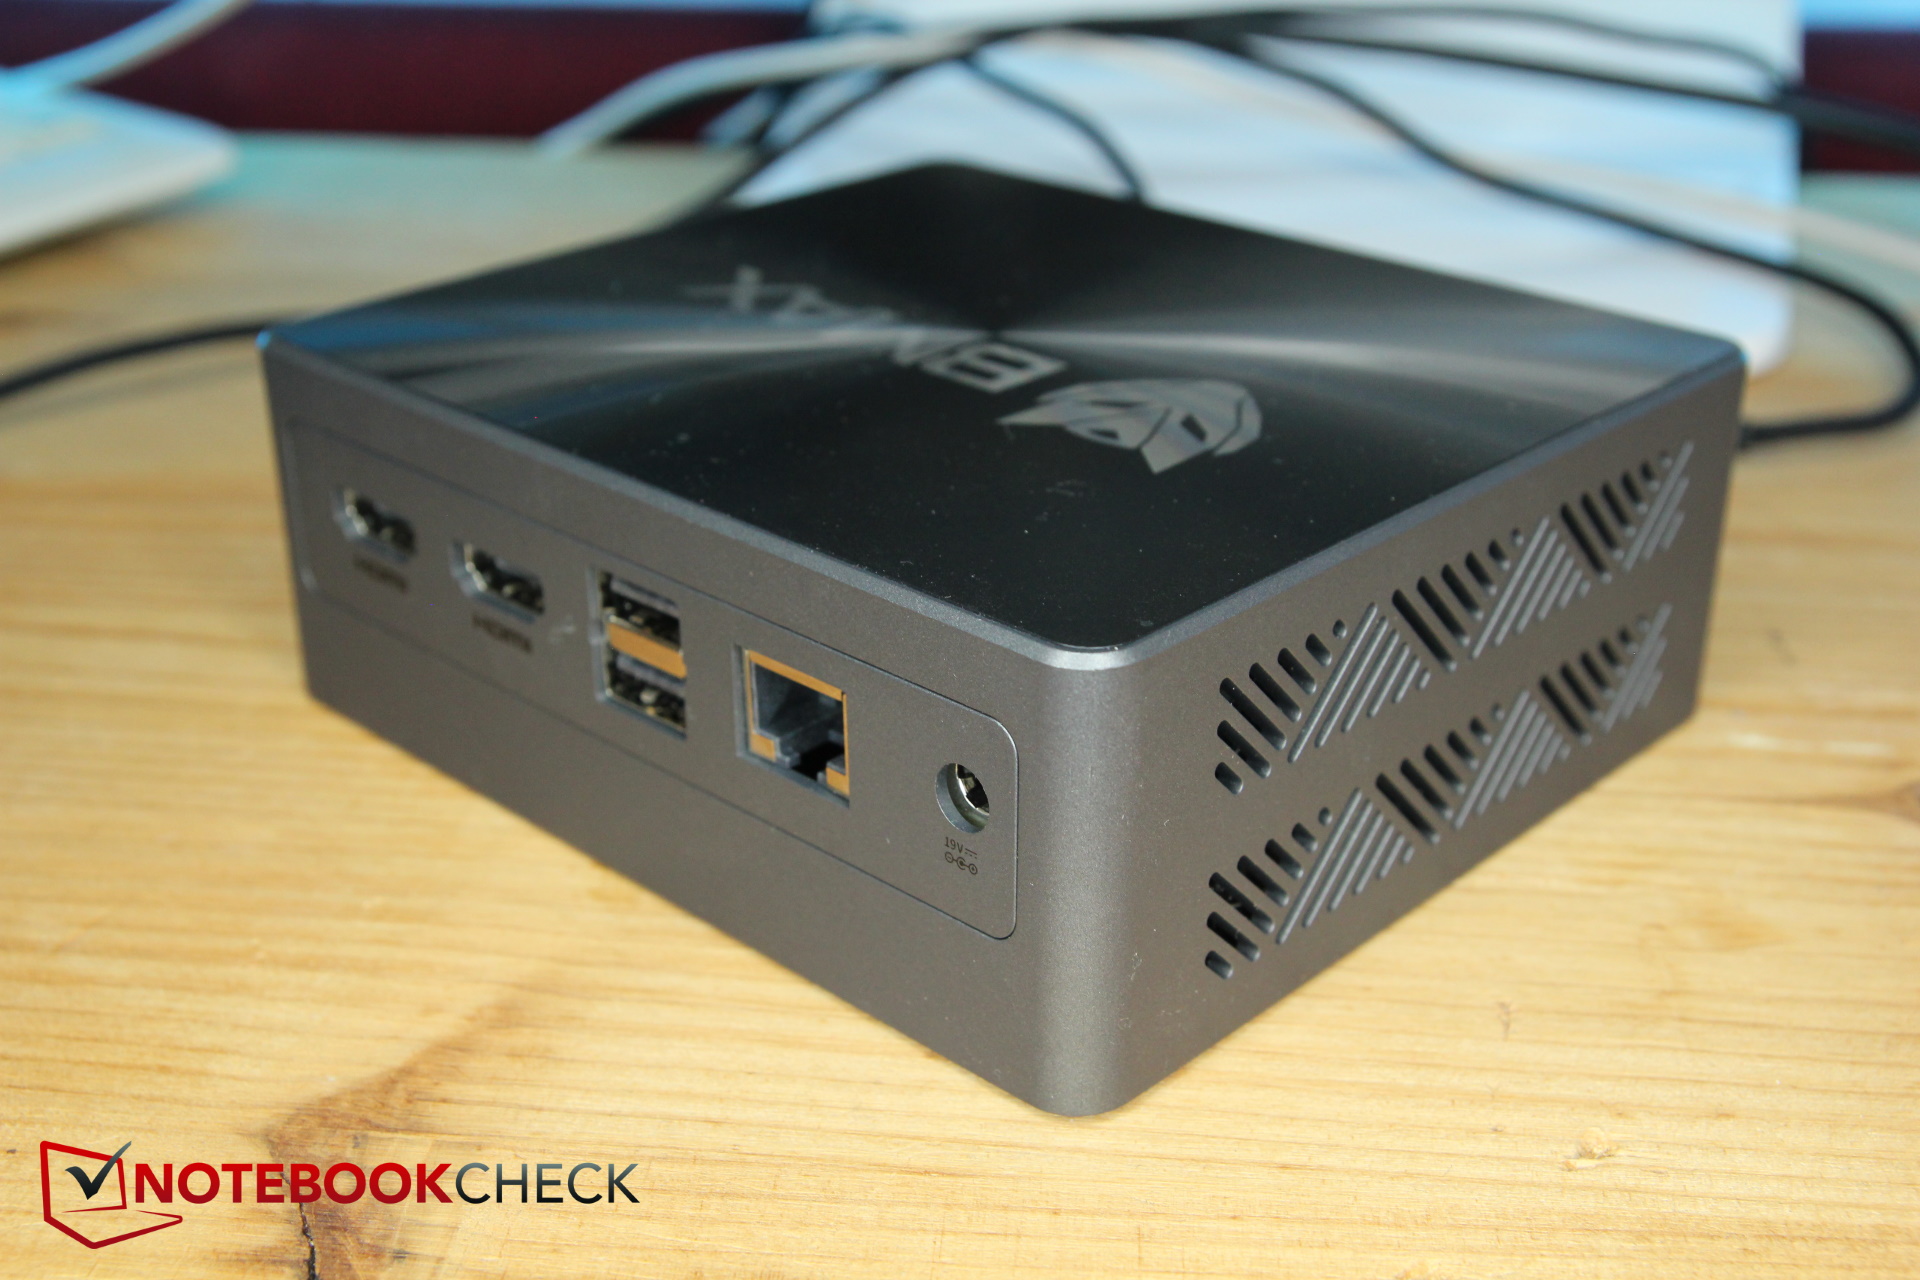
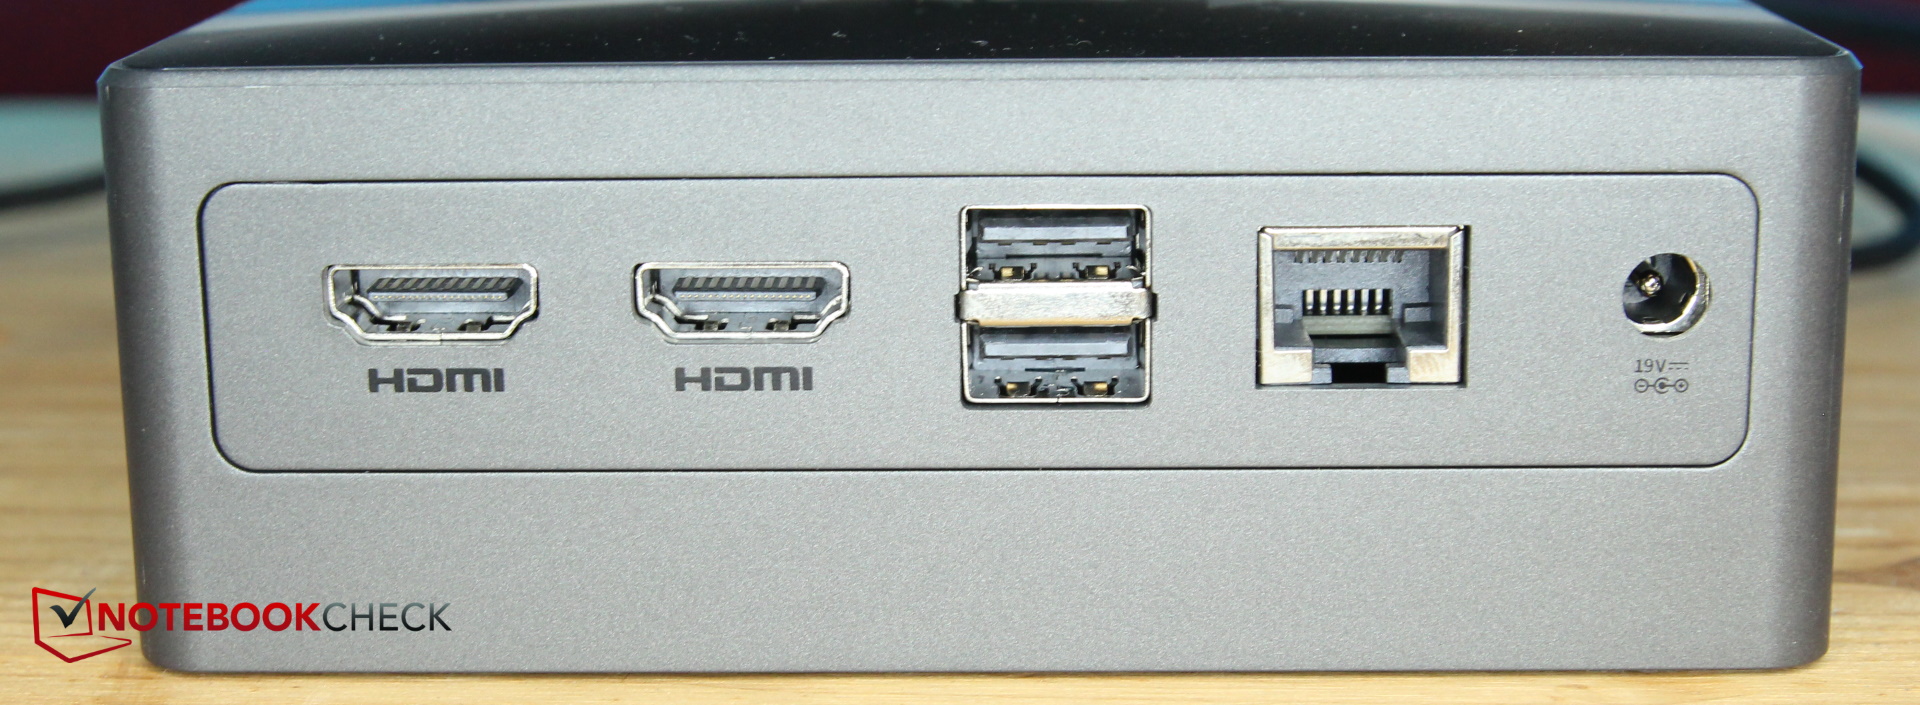
电脑背面是所有用于永久连接的必要端口,包括两个用于连接鼠标和键盘的 USB-A 端口、两个用于连接两台显示器的 HDMI 2.0 端口,以及一个 LAN 端口和电源接口。
机身正面还有用于连接外置 USB 设备或耳机的端口。这里还有一个 USB-C 端口。BMAX 表示该产品 "功能齐全"。很明显,它不支持 Thunderbolt,但支持 DisplayPort,这意味着 B7 Power 可以同时连接三台显示器。
该端口还支持 Power Delivery,我们使用两个 USB-C 充电器进行的测试证实了这一点。MacBook Air 的 30 瓦充电器无法工作,但 45 瓦充电器可以。官方规定,B7 需要 19 V 和 2.5 A(47.5 W)的电压。
B7 没有 SD 读卡器。设备底部有一些螺丝孔,您可以使用附带的 VESA 支架将迷你 PC 连接到显示器背面。
交流
除了千兆局域网连接外,B7 Power 还可以通过 WiFi 连接。为此,制造商安装了 Realtek 芯片,据称该芯片也支持 WiFi 6。这意味着您可以连接到 5 GHz 网络,但不能连接到 6 GHz 网络。
这款迷你电脑的 5 GHz 频率相当快。然而,使用 "常规 "的 2.4 GHz 会给我们完全不同的印象。在我们的测试环境中(出租屋,附近有多个重叠网络),电脑的传输速率非常糟糕--我们测得的传输速率只有 100 到 150 MB/s。
安全
当然,由于采用了英特尔芯片,B7 Power 还支持 TPM,但除此之外,B7 Power 甚至没有提供 Kensington 锁。不过,相信没有多少人会在迷你 PC 上错过这一点。
交货和保修范围
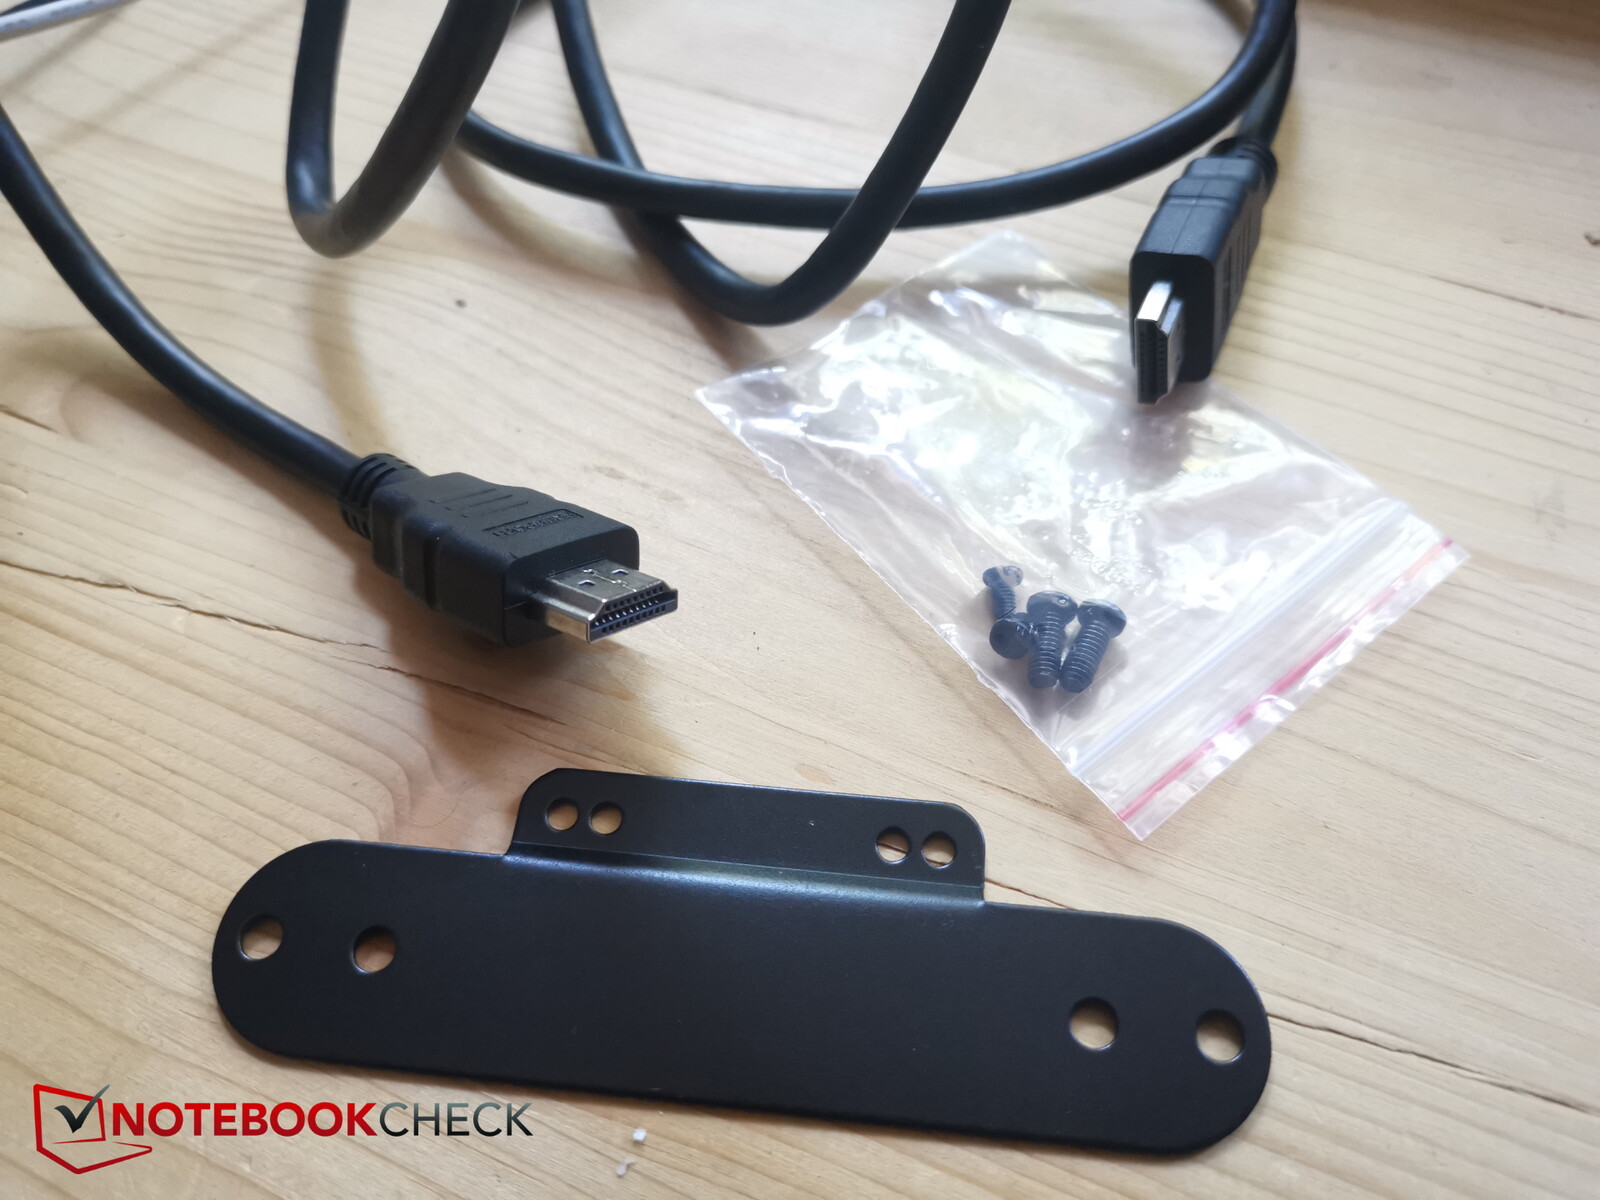
除了迷你电脑本身,制造商还提供了一个专有电源、一条 HDMI 电缆和一个 VESA 支架(包括所需的螺丝)。
制造商目前对该电脑是否提供保修未置可否。您当地的相关保修法律应涵盖这一点。
维护
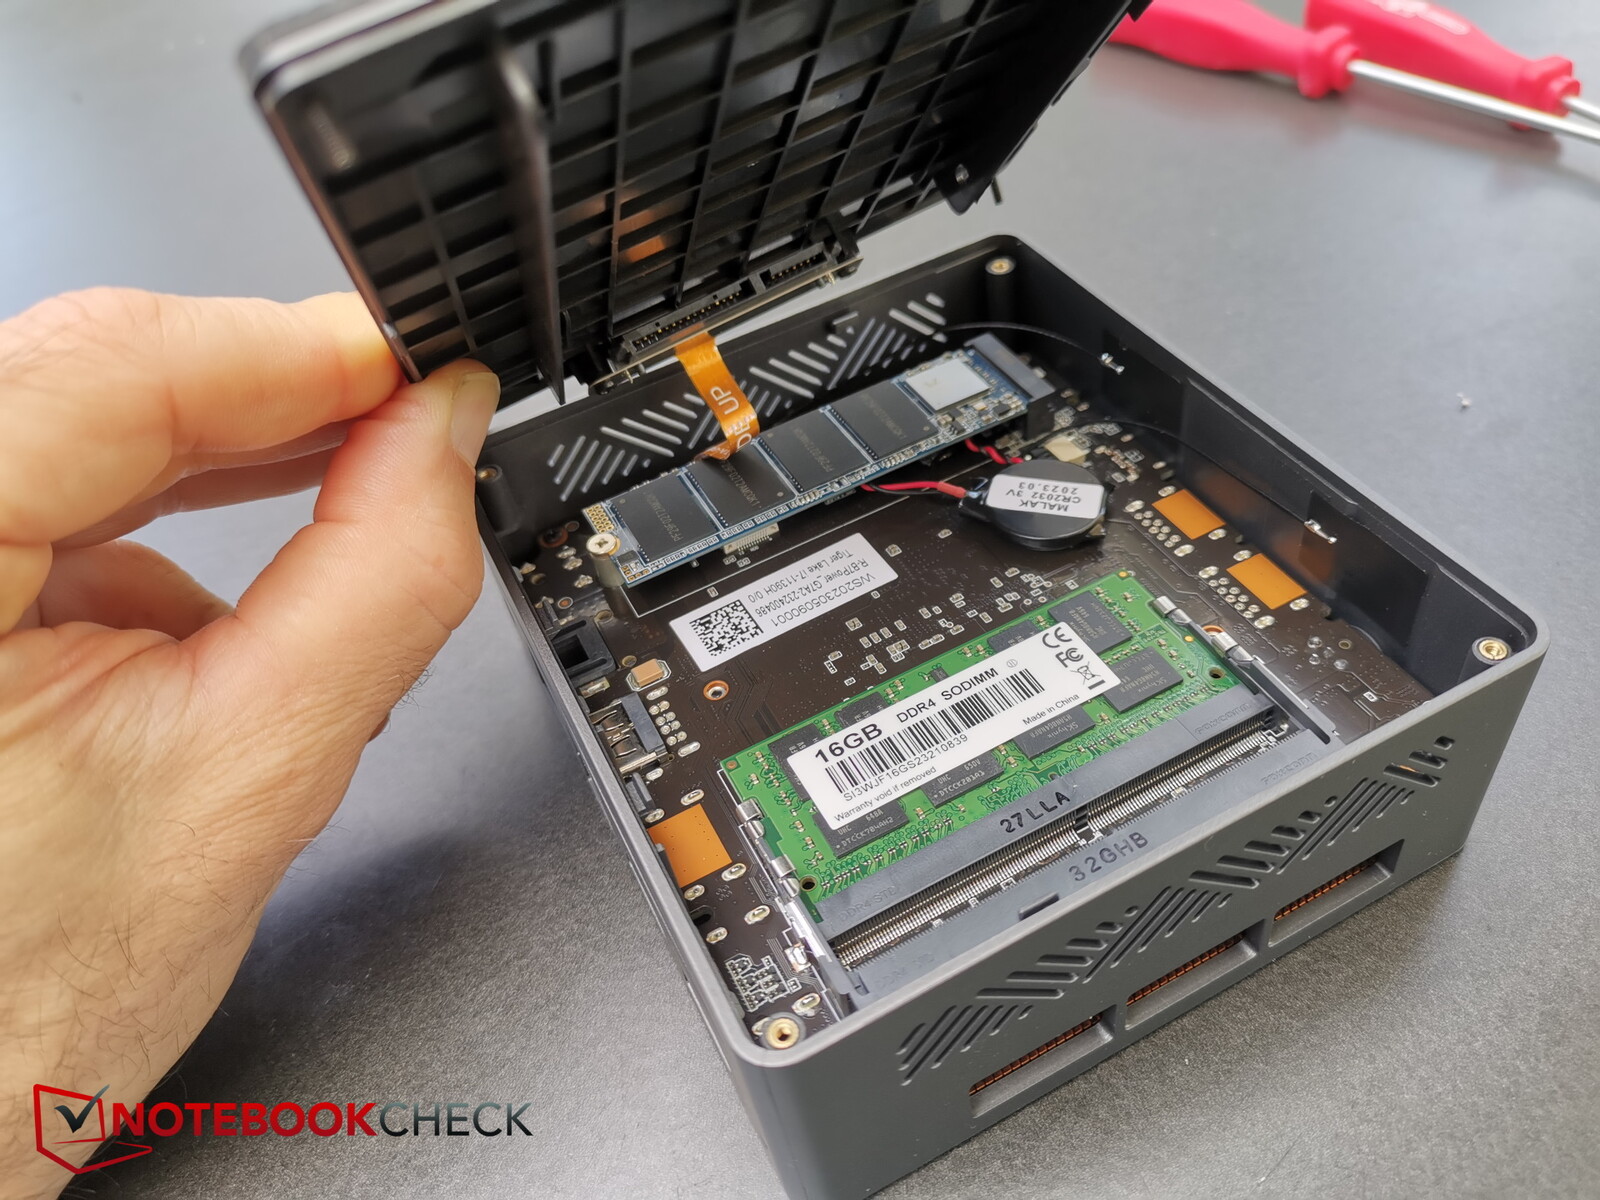
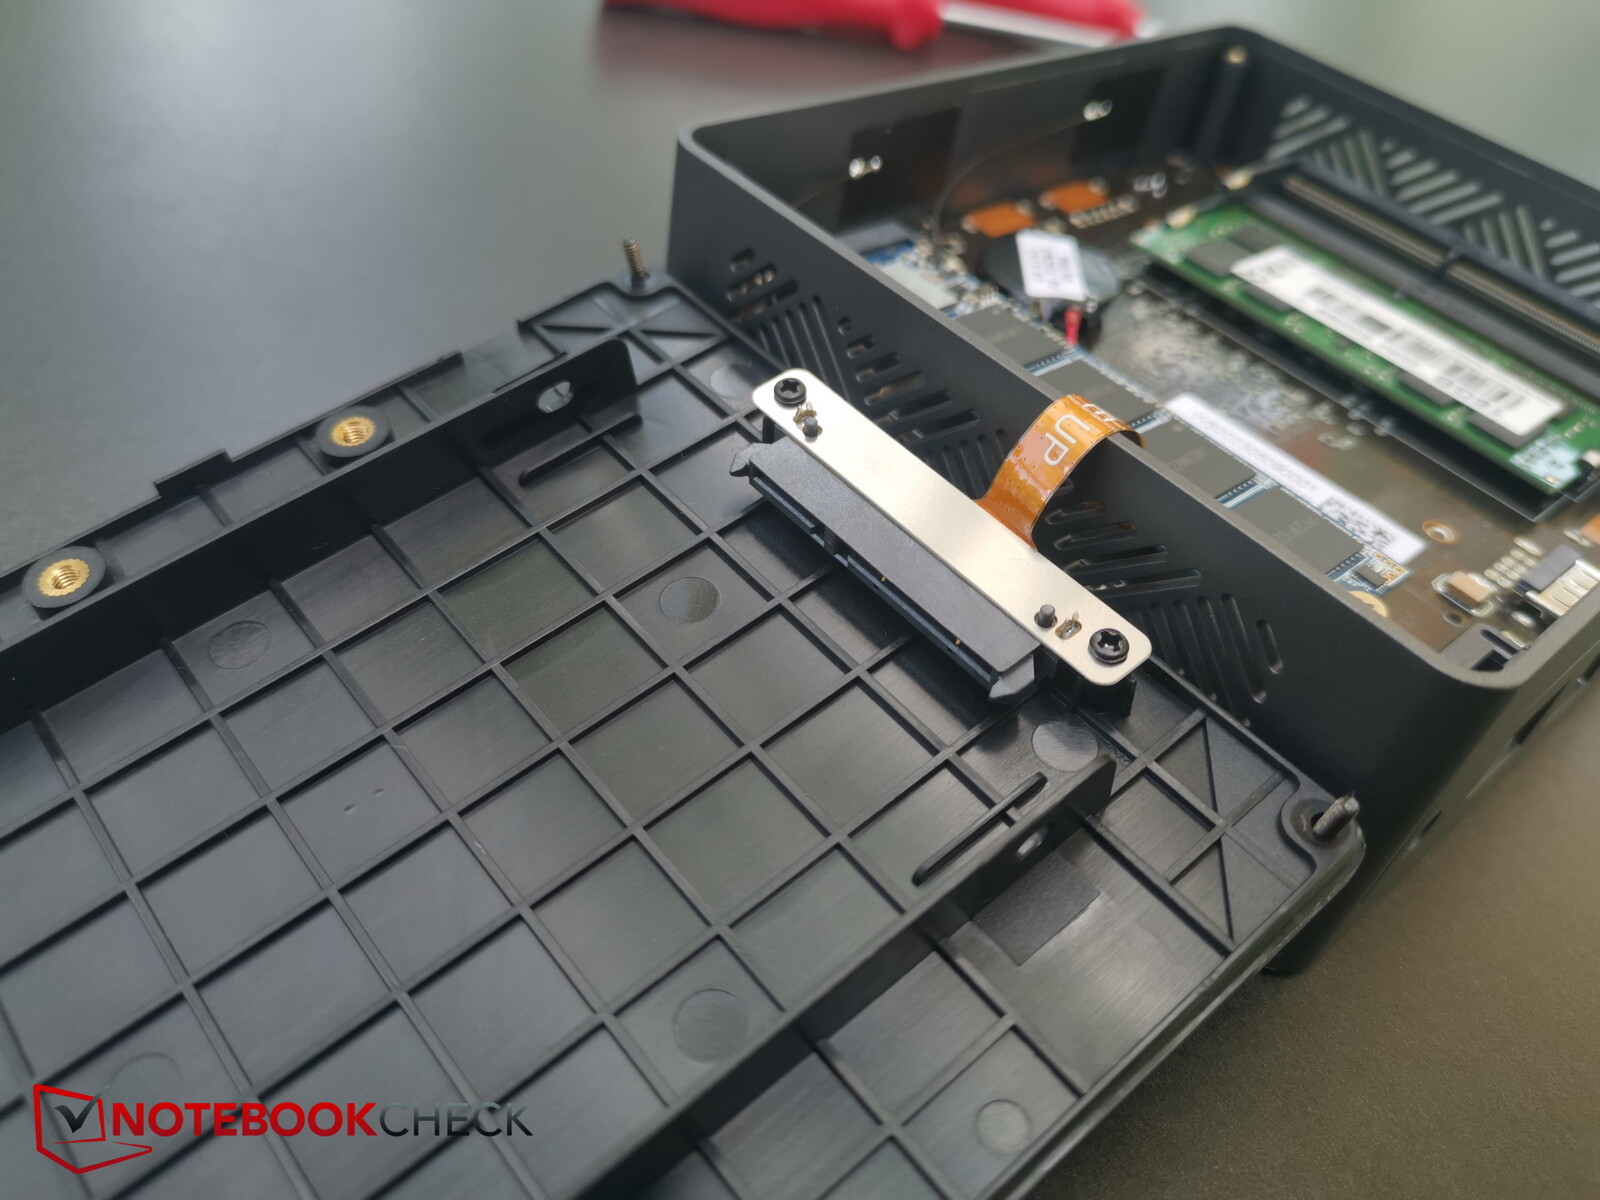
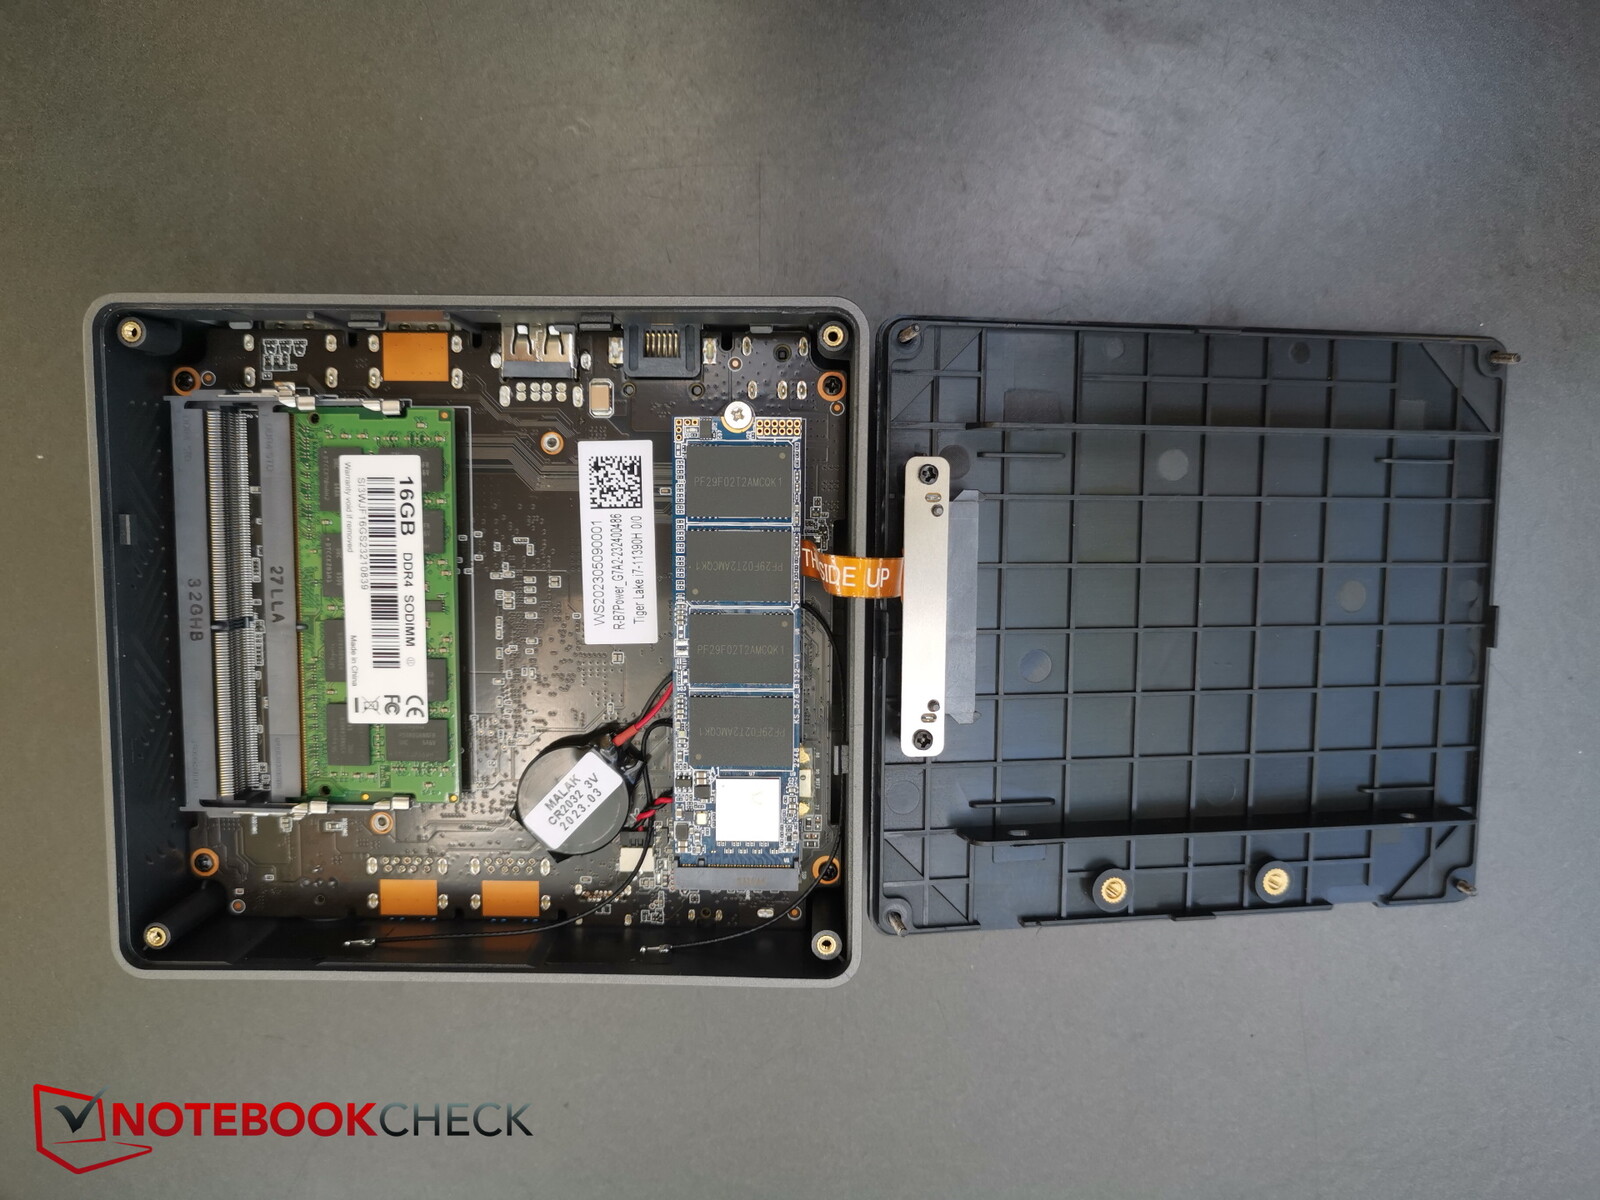
对设备进行维护非常简单方便。只有 4 个十字螺丝将底板固定到位。取下螺丝后,可以小心地将底板翻转到侧面(从正面和上方看为左侧)。这两个部分之间有一条连接线,将内底板上的 SATA 端口与主板连接起来。
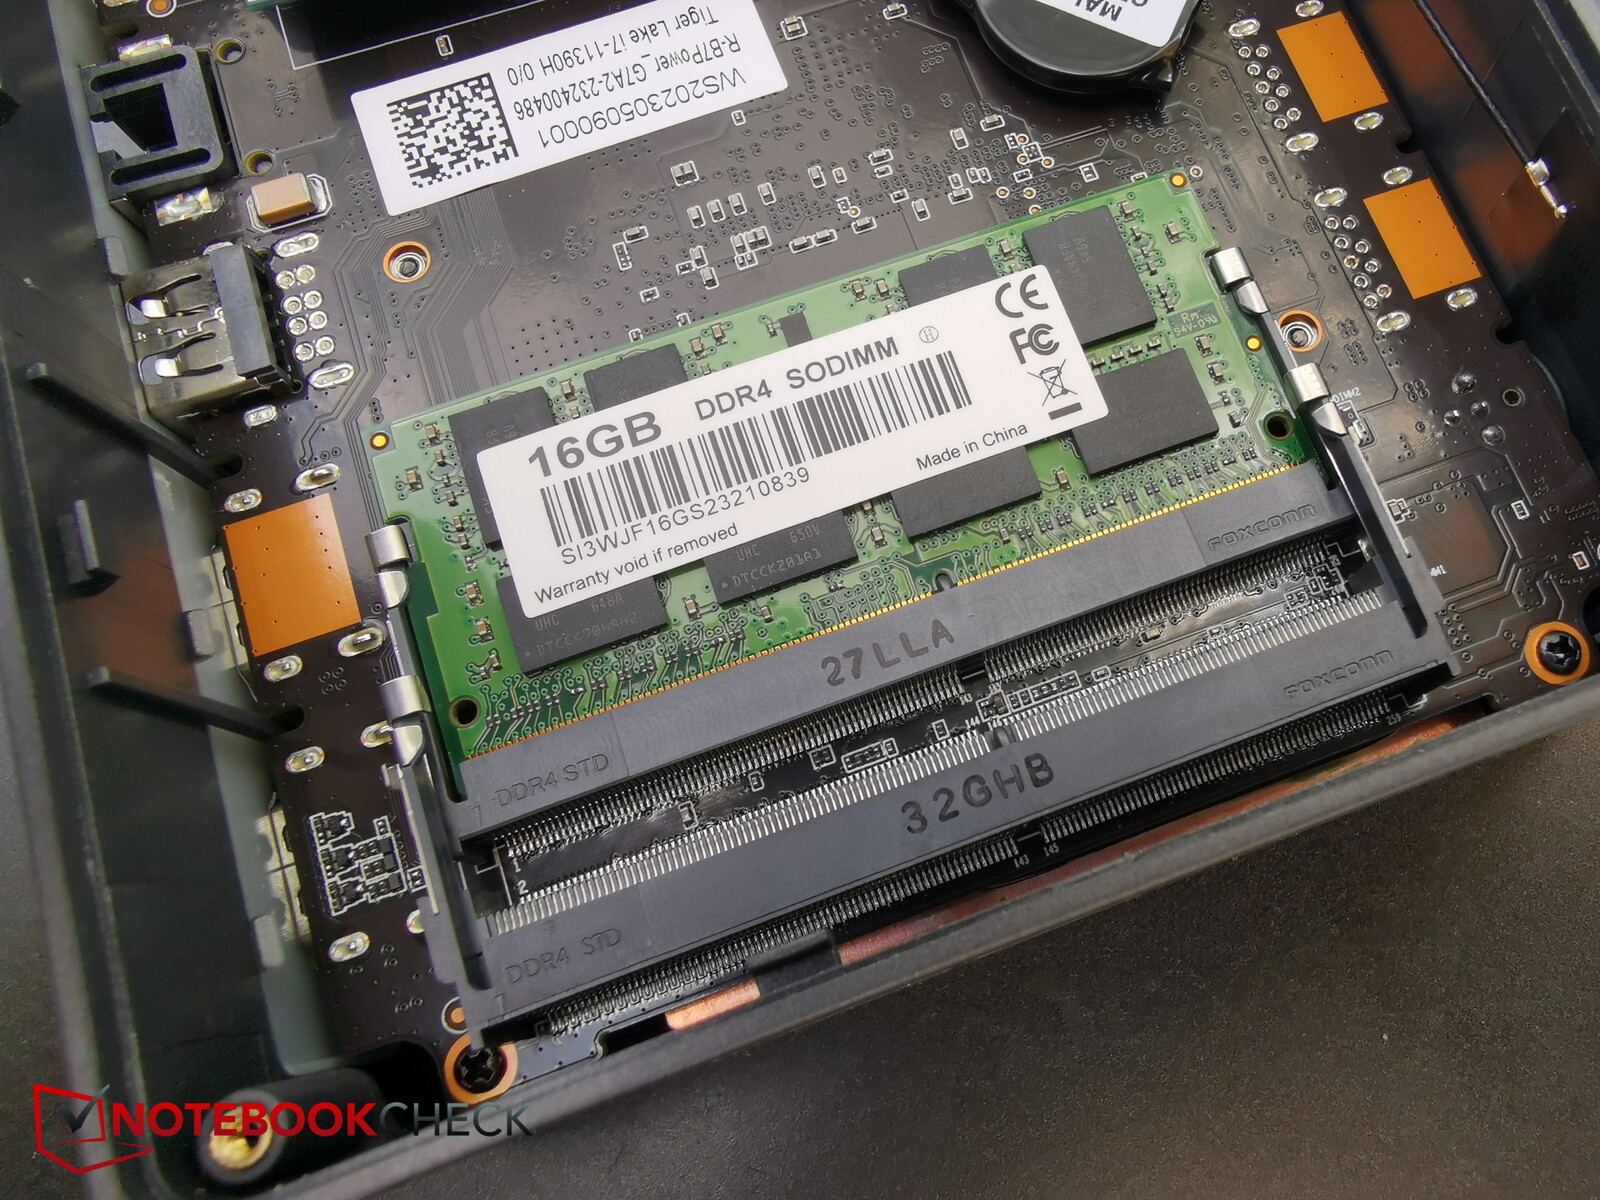
随后,您可以访问两个内存插槽、NVMe 固态硬盘以及前面提到的用于 2.5 英寸硬盘或固态硬盘的 SATA 端口。要访问风扇,必须进一步拆开设备。
性能 - 即使是第 11 代也很慢
英特尔第 11 代处理器,特别是英特尔酷睿 i7-11390H英特尔第 11 代处理器,特别是英特尔酷睿 i7-11390H,总体上是一款不错的 CPU - 但它比当前的英特尔第 13 代技术晚了几年。英特尔 NUC 13 Pro 套件.16 GB 内存(可选择升级)和 1 TB 的无名固态硬盘完成了设置。该电脑没有配备专用显卡,但集成在 CPU 中的 XE Graphics 显卡可满载运行 96 个 EU。这款电脑主要适合日常办公使用,也可用作复古游戏机。
BMAX 网站还提供一系列其他迷你电脑,包括配备了i5-1145G7.不过,B7 Power 已经是该制造商目前的顶级机型。
测试条件
B7 Power 没有安装任何臃肿的软件或制造商自己的软件(如控制中心),给人一种宽敞舒适的感觉。为了获得最佳基准测试结果,我们测试了 Windows 模式下的最佳性能。
在第一次启动时,我们的屏幕仍然是黑的。按下 Windows + P 组合键即可解决这一问题。
处理器
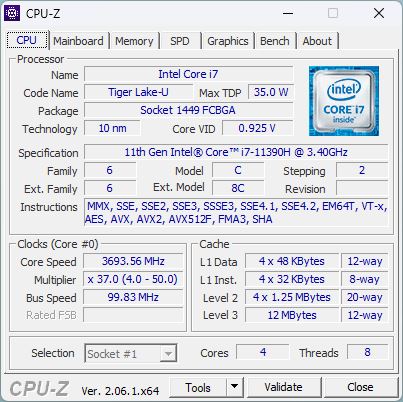
英特尔英特尔酷睿 i7-11390H仍属于Tiger Lake 系列--其 4 个内核中的两个内核单个时钟频率最高可达 5 GHz。所有 4 个内核都支持超线程技术,这意味着可以同时处理 8 个线程。
该芯片的 TDP(功耗)从 28 瓦到 35 瓦不等,具体取决于所保证的基本时钟,从 2.9(28 瓦)到 3.4 GHz(35 瓦)不等。TDP 较低的一端似乎更适合 B7 Power。在我们的 Cinebench R15 循环中,第一次运行时电脑的功耗约为 30 瓦。从第二次运行开始,B7 的功耗仅达到 25 瓦,而且只是在很短的时间内;在每次运行的其余大部分时间里,迷你 PC 的功耗仅略低于 20 瓦。
第一次运行 Cinebench R15 之后,该设备的性能下降了约 10%,之后保持稳定。不过,总体而言,这一性能还是相当令人失望的。当然,NUC 12 和 13 明显领先,但即使是Geekom Mini在所有 CPU 测试中,采用相同 CPU 的 NUC Mini 也比 NUC 12 快了整整 17%。与我们数据库中 i7-11390H 的平均成绩相比,B7 Power 的 CPU 性能要弱 13%。这说明,CPU 的潜力还没有完全发挥出来。在 Cinebench 测试中,即使是配备英特尔 Gen8 处理器的 B5 Power 也只能勉强胜出。在 CPU 总分上,两款设备的差距高达 87%,但在 Cinebench 循环测试中,它们的差距只有 18%。
Cinebench R15 Multi continuous test
Cinebench R23: Multi Core | Single Core
Cinebench R20: CPU (Multi Core) | CPU (Single Core)
Cinebench R15: CPU Multi 64Bit | CPU Single 64Bit
Blender: v2.79 BMW27 CPU
7-Zip 18.03: 7z b 4 | 7z b 4 -mmt1
Geekbench 5.5: Multi-Core | Single-Core
HWBOT x265 Benchmark v2.2: 4k Preset
LibreOffice : 20 Documents To PDF
R Benchmark 2.5: Overall mean
| CPU Performance rating | |
| Average of class Mini PC | |
| Intel NUC 13 Pro Kit NUC13ANK | |
| Intel NUC 12 Pro Kit NUC12WSBi5 -2! | |
| Geekom Mini IT11, i7-11390H | |
| Average Intel Core i7-11390H | |
| Beelink SEi11 Pro | |
| BMAX B7 Power G7A2 | |
| BMAX B5 Pro G7H8 | |
| Cinebench R23 / Multi Core | |
| Average of class Mini PC (1571 - 39416, n=98, last 2 years) | |
| Intel NUC 13 Pro Kit NUC13ANK | |
| Intel NUC 12 Pro Kit NUC12WSBi5 | |
| Intel NUC 12 Pro Kit NUC12WSBi5 | |
| Intel NUC 12 Pro Kit NUC12WSBi5 | |
| Geekom Mini IT11, i7-11390H | |
| Beelink SEi11 Pro | |
| Average Intel Core i7-11390H (4570 - 6379, n=3) | |
| BMAX B7 Power G7A2 | |
| BMAX B5 Pro G7H8 | |
| Cinebench R23 / Single Core | |
| Intel NUC 13 Pro Kit NUC13ANK | |
| Average of class Mini PC (455 - 2303, n=98, last 2 years) | |
| Intel NUC 12 Pro Kit NUC12WSBi5 | |
| Geekom Mini IT11, i7-11390H | |
| Average Intel Core i7-11390H (1407 - 1602, n=3) | |
| Beelink SEi11 Pro | |
| BMAX B7 Power G7A2 | |
| BMAX B5 Pro G7H8 | |
| Cinebench R20 / CPU (Multi Core) | |
| Average of class Mini PC (555 - 15041, n=98, last 2 years) | |
| Intel NUC 13 Pro Kit NUC13ANK | |
| Intel NUC 12 Pro Kit NUC12WSBi5 | |
| Geekom Mini IT11, i7-11390H | |
| Beelink SEi11 Pro | |
| Average Intel Core i7-11390H (1767 - 2362, n=3) | |
| BMAX B7 Power G7A2 | |
| BMAX B5 Pro G7H8 | |
| Cinebench R20 / CPU (Single Core) | |
| Intel NUC 13 Pro Kit NUC13ANK | |
| Average of class Mini PC (173.6 - 884, n=98, last 2 years) | |
| Intel NUC 12 Pro Kit NUC12WSBi5 | |
| Geekom Mini IT11, i7-11390H | |
| Average Intel Core i7-11390H (550 - 620, n=3) | |
| Beelink SEi11 Pro | |
| BMAX B7 Power G7A2 | |
| BMAX B5 Pro G7H8 | |
| Cinebench R15 / CPU Multi 64Bit | |
| Average of class Mini PC (254 - 5881, n=98, last 2 years) | |
| Intel NUC 13 Pro Kit NUC13ANK | |
| Intel NUC 12 Pro Kit NUC12WSBi5 | |
| Intel NUC 12 Pro Kit NUC12WSBi5 | |
| Geekom Mini IT11, i7-11390H | |
| Average Intel Core i7-11390H (775 - 1041, n=3) | |
| Beelink SEi11 Pro | |
| BMAX B7 Power G7A2 | |
| BMAX B5 Pro G7H8 | |
| Cinebench R15 / CPU Single 64Bit | |
| Intel NUC 13 Pro Kit NUC13ANK | |
| Average of class Mini PC (78.3 - 340, n=98, last 2 years) | |
| Intel NUC 12 Pro Kit NUC12WSBi5 | |
| Intel NUC 12 Pro Kit NUC12WSBi5 | |
| Geekom Mini IT11, i7-11390H | |
| Average Intel Core i7-11390H (209 - 239, n=3) | |
| Beelink SEi11 Pro | |
| BMAX B7 Power G7A2 | |
| BMAX B5 Pro G7H8 | |
| Blender / v2.79 BMW27 CPU | |
| BMAX B5 Pro G7H8 | |
| BMAX B7 Power G7A2 | |
| Average Intel Core i7-11390H (495 - 665, n=3) | |
| Beelink SEi11 Pro | |
| Geekom Mini IT11, i7-11390H | |
| Average of class Mini PC (86 - 2330, n=94, last 2 years) | |
| Intel NUC 12 Pro Kit NUC12WSBi5 | |
| Intel NUC 13 Pro Kit NUC13ANK | |
| 7-Zip 18.03 / 7z b 4 | |
| Average of class Mini PC (8146 - 136872, n=93, last 2 years) | |
| Intel NUC 13 Pro Kit NUC13ANK | |
| Intel NUC 12 Pro Kit NUC12WSBi5 | |
| Geekom Mini IT11, i7-11390H | |
| Average Intel Core i7-11390H (20822 - 28173, n=3) | |
| Beelink SEi11 Pro | |
| BMAX B7 Power G7A2 | |
| BMAX B5 Pro G7H8 | |
| 7-Zip 18.03 / 7z b 4 -mmt1 | |
| Intel NUC 13 Pro Kit NUC13ANK | |
| Geekom Mini IT11, i7-11390H | |
| Average of class Mini PC (2454 - 7609, n=94, last 2 years) | |
| Average Intel Core i7-11390H (5539 - 5895, n=3) | |
| BMAX B7 Power G7A2 | |
| Intel NUC 12 Pro Kit NUC12WSBi5 | |
| Beelink SEi11 Pro | |
| BMAX B5 Pro G7H8 | |
| Geekbench 5.5 / Multi-Core | |
| Average of class Mini PC (1638 - 24593, n=97, last 2 years) | |
| Intel NUC 13 Pro Kit NUC13ANK | |
| Average Intel Core i7-11390H (4457 - 6297, n=4) | |
| Geekom Mini IT11, i7-11390H | |
| Beelink SEi11 Pro | |
| BMAX B7 Power G7A2 | |
| BMAX B5 Pro G7H8 | |
| Geekbench 5.5 / Single-Core | |
| Intel NUC 13 Pro Kit NUC13ANK | |
| Average of class Mini PC (466 - 2395, n=97, last 2 years) | |
| Geekom Mini IT11, i7-11390H | |
| Average Intel Core i7-11390H (1486 - 1677, n=4) | |
| Beelink SEi11 Pro | |
| BMAX B7 Power G7A2 | |
| BMAX B5 Pro G7H8 | |
| HWBOT x265 Benchmark v2.2 / 4k Preset | |
| Average of class Mini PC (1.5 - 40.3, n=94, last 2 years) | |
| Intel NUC 13 Pro Kit NUC13ANK | |
| Intel NUC 12 Pro Kit NUC12WSBi5 | |
| Geekom Mini IT11, i7-11390H | |
| Beelink SEi11 Pro | |
| Average Intel Core i7-11390H (5.84 - 7.86, n=3) | |
| BMAX B7 Power G7A2 | |
| BMAX B5 Pro G7H8 | |
| LibreOffice / 20 Documents To PDF | |
| BMAX B5 Pro G7H8 | |
| Average of class Mini PC (33.1 - 132.6, n=94, last 2 years) | |
| BMAX B7 Power G7A2 | |
| Beelink SEi11 Pro | |
| Intel NUC 12 Pro Kit NUC12WSBi5 | |
| Average Intel Core i7-11390H (43.2 - 52.6, n=3) | |
| Geekom Mini IT11, i7-11390H | |
| Intel NUC 13 Pro Kit NUC13ANK | |
| R Benchmark 2.5 / Overall mean | |
| BMAX B5 Pro G7H8 | |
| Beelink SEi11 Pro | |
| BMAX B7 Power G7A2 | |
| Average Intel Core i7-11390H (0.537 - 0.571, n=3) | |
| Geekom Mini IT11, i7-11390H | |
| Intel NUC 12 Pro Kit NUC12WSBi5 | |
| Average of class Mini PC (0.3517 - 1.56, n=95, last 2 years) | |
| Intel NUC 13 Pro Kit NUC13ANK | |
* ... smaller is better
AIDA64: FP32 Ray-Trace | FPU Julia | CPU SHA3 | CPU Queen | FPU SinJulia | FPU Mandel | CPU AES | CPU ZLib | FP64 Ray-Trace | CPU PhotoWorxx
| Performance rating | |
| Average of class Mini PC | |
| Intel NUC 13 Pro Kit NUC13ANK | |
| Intel NUC 12 Pro Kit NUC12WSBi5 | |
| Beelink SEi11 Pro | |
| Average Intel Core i7-11390H | |
| Geekom Mini IT11, i7-11390H | |
| BMAX B7 Power G7A2 | |
| BMAX B5 Pro G7H8 | |
| AIDA64 / FP32 Ray-Trace | |
| Average of class Mini PC (974 - 82725, n=105, last 2 years) | |
| Intel NUC 13 Pro Kit NUC13ANK | |
| Beelink SEi11 Pro | |
| Average Intel Core i7-11390H (5904 - 7741, n=4) | |
| Geekom Mini IT11, i7-11390H | |
| Intel NUC 12 Pro Kit NUC12WSBi5 | |
| BMAX B7 Power G7A2 | |
| BMAX B5 Pro G7H8 | |
| AIDA64 / FPU Julia | |
| Average of class Mini PC (6115 - 363782, n=105, last 2 years) | |
| Intel NUC 13 Pro Kit NUC13ANK | |
| Beelink SEi11 Pro | |
| Average Intel Core i7-11390H (25054 - 32624, n=4) | |
| Intel NUC 12 Pro Kit NUC12WSBi5 | |
| Geekom Mini IT11, i7-11390H | |
| BMAX B7 Power G7A2 | |
| BMAX B5 Pro G7H8 | |
| AIDA64 / CPU SHA3 | |
| Average of class Mini PC (385 - 9475, n=105, last 2 years) | |
| Intel NUC 13 Pro Kit NUC13ANK | |
| Intel NUC 12 Pro Kit NUC12WSBi5 | |
| Beelink SEi11 Pro | |
| Average Intel Core i7-11390H (1747 - 2168, n=4) | |
| Geekom Mini IT11, i7-11390H | |
| BMAX B7 Power G7A2 | |
| BMAX B5 Pro G7H8 | |
| AIDA64 / CPU Queen | |
| Average of class Mini PC (20501 - 184747, n=89, last 2 years) | |
| Intel NUC 13 Pro Kit NUC13ANK | |
| Intel NUC 12 Pro Kit NUC12WSBi5 | |
| Average Intel Core i7-11390H (47355 - 58761, n=4) | |
| Geekom Mini IT11, i7-11390H | |
| BMAX B7 Power G7A2 | |
| Beelink SEi11 Pro | |
| BMAX B5 Pro G7H8 | |
| AIDA64 / FPU SinJulia | |
| Average of class Mini PC (1019 - 31931, n=105, last 2 years) | |
| Intel NUC 13 Pro Kit NUC13ANK | |
| Intel NUC 12 Pro Kit NUC12WSBi5 | |
| Beelink SEi11 Pro | |
| Average Intel Core i7-11390H (4106 - 5412, n=4) | |
| Geekom Mini IT11, i7-11390H | |
| BMAX B5 Pro G7H8 | |
| BMAX B7 Power G7A2 | |
| AIDA64 / FPU Mandel | |
| Average of class Mini PC (3322 - 192994, n=105, last 2 years) | |
| Intel NUC 13 Pro Kit NUC13ANK | |
| Beelink SEi11 Pro | |
| Average Intel Core i7-11390H (15441 - 19348, n=4) | |
| Geekom Mini IT11, i7-11390H | |
| Intel NUC 12 Pro Kit NUC12WSBi5 | |
| BMAX B7 Power G7A2 | |
| BMAX B5 Pro G7H8 | |
| AIDA64 / CPU AES | |
| Intel NUC 13 Pro Kit NUC13ANK | |
| Average of class Mini PC (9214 - 325960, n=104, last 2 years) | |
| Beelink SEi11 Pro | |
| Intel NUC 12 Pro Kit NUC12WSBi5 | |
| Average Intel Core i7-11390H (57644 - 77817, n=4) | |
| BMAX B7 Power G7A2 | |
| Geekom Mini IT11, i7-11390H | |
| BMAX B5 Pro G7H8 | |
| AIDA64 / CPU ZLib | |
| Average of class Mini PC (127.2 - 2431, n=105, last 2 years) | |
| Intel NUC 12 Pro Kit NUC12WSBi5 | |
| Intel NUC 13 Pro Kit NUC13ANK | |
| Average Intel Core i7-11390H (362 - 424, n=4) | |
| Geekom Mini IT11, i7-11390H | |
| Beelink SEi11 Pro | |
| BMAX B7 Power G7A2 | |
| BMAX B5 Pro G7H8 | |
| AIDA64 / FP64 Ray-Trace | |
| Average of class Mini PC (537 - 43587, n=105, last 2 years) | |
| Intel NUC 13 Pro Kit NUC13ANK | |
| Beelink SEi11 Pro | |
| Geekom Mini IT11, i7-11390H | |
| Average Intel Core i7-11390H (3138 - 4197, n=4) | |
| Intel NUC 12 Pro Kit NUC12WSBi5 | |
| BMAX B7 Power G7A2 | |
| BMAX B5 Pro G7H8 | |
| AIDA64 / CPU PhotoWorxx | |
| Average of class Mini PC (8069 - 96843, n=105, last 2 years) | |
| Intel NUC 13 Pro Kit NUC13ANK | |
| Intel NUC 12 Pro Kit NUC12WSBi5 | |
| Beelink SEi11 Pro | |
| Geekom Mini IT11, i7-11390H | |
| Average Intel Core i7-11390H (11409 - 39871, n=4) | |
| BMAX B5 Pro G7H8 | |
| BMAX B7 Power G7A2 | |
系统性能
其性能也落后于典型的 i7-11390H在 PCMark 中的性能落后 9%。在 CrossMark 中,它仅落后 6%。
主观而言,该电脑在日常浏览网页和完成办公任务时仍然表现出色。
CrossMark: Overall | Productivity | Creativity | Responsiveness
| PCMark 10 / Score | |
| Average of class Mini PC (2191 - 9326, n=104, last 2 years) | |
| Intel NUC 13 Pro Kit NUC13ANK | |
| Intel NUC 12 Pro Kit NUC12WSBi5 | |
| Beelink SEi11 Pro | |
| Average Intel Core i7-11390H, Intel Iris Xe Graphics G7 96EUs (4598 - 5475, n=3) | |
| Geekom Mini IT11, i7-11390H | |
| BMAX B7 Power G7A2 | |
| BMAX B5 Pro G7H8 | |
| PCMark 10 / Essentials | |
| Intel NUC 13 Pro Kit NUC13ANK | |
| Intel NUC 12 Pro Kit NUC12WSBi5 | |
| Beelink SEi11 Pro | |
| Average of class Mini PC (5031 - 11997, n=103, last 2 years) | |
| Average Intel Core i7-11390H, Intel Iris Xe Graphics G7 96EUs (9188 - 10451, n=3) | |
| Geekom Mini IT11, i7-11390H | |
| BMAX B7 Power G7A2 | |
| BMAX B5 Pro G7H8 | |
| PCMark 10 / Productivity | |
| Average of class Mini PC (3646 - 17739, n=103, last 2 years) | |
| Intel NUC 13 Pro Kit NUC13ANK | |
| Intel NUC 12 Pro Kit NUC12WSBi5 | |
| Beelink SEi11 Pro | |
| Average Intel Core i7-11390H, Intel Iris Xe Graphics G7 96EUs (6442 - 7197, n=3) | |
| Geekom Mini IT11, i7-11390H | |
| BMAX B7 Power G7A2 | |
| BMAX B5 Pro G7H8 | |
| PCMark 10 / Digital Content Creation | |
| Average of class Mini PC (1558 - 17556, n=103, last 2 years) | |
| Intel NUC 13 Pro Kit NUC13ANK | |
| Intel NUC 12 Pro Kit NUC12WSBi5 | |
| Average Intel Core i7-11390H, Intel Iris Xe Graphics G7 96EUs (4459 - 5920, n=3) | |
| Beelink SEi11 Pro | |
| Geekom Mini IT11, i7-11390H | |
| BMAX B7 Power G7A2 | |
| BMAX B5 Pro G7H8 | |
| CrossMark / Overall | |
| Intel NUC 13 Pro Kit NUC13ANK | |
| Average of class Mini PC (385 - 2244, n=96, last 2 years) | |
| Geekom Mini IT11, i7-11390H | |
| Average Intel Core i7-11390H, Intel Iris Xe Graphics G7 96EUs (1274 - 1438, n=2) | |
| Beelink SEi11 Pro | |
| BMAX B7 Power G7A2 | |
| BMAX B5 Pro G7H8 | |
| CrossMark / Productivity | |
| Intel NUC 13 Pro Kit NUC13ANK | |
| Average of class Mini PC (446 - 2790, n=96, last 2 years) | |
| Geekom Mini IT11, i7-11390H | |
| Average Intel Core i7-11390H, Intel Iris Xe Graphics G7 96EUs (1399 - 1523, n=2) | |
| Beelink SEi11 Pro | |
| BMAX B7 Power G7A2 | |
| BMAX B5 Pro G7H8 | |
| CrossMark / Creativity | |
| Intel NUC 13 Pro Kit NUC13ANK | |
| Average of class Mini PC (340 - 2879, n=96, last 2 years) | |
| Geekom Mini IT11, i7-11390H | |
| Average Intel Core i7-11390H, Intel Iris Xe Graphics G7 96EUs (1198 - 1359, n=2) | |
| Beelink SEi11 Pro | |
| BMAX B7 Power G7A2 | |
| BMAX B5 Pro G7H8 | |
| CrossMark / Responsiveness | |
| Intel NUC 13 Pro Kit NUC13ANK | |
| Average of class Mini PC (363 - 2191, n=96, last 2 years) | |
| Geekom Mini IT11, i7-11390H | |
| Beelink SEi11 Pro | |
| Average Intel Core i7-11390H, Intel Iris Xe Graphics G7 96EUs (1159 - 1434, n=2) | |
| BMAX B7 Power G7A2 | |
| BMAX B5 Pro G7H8 | |
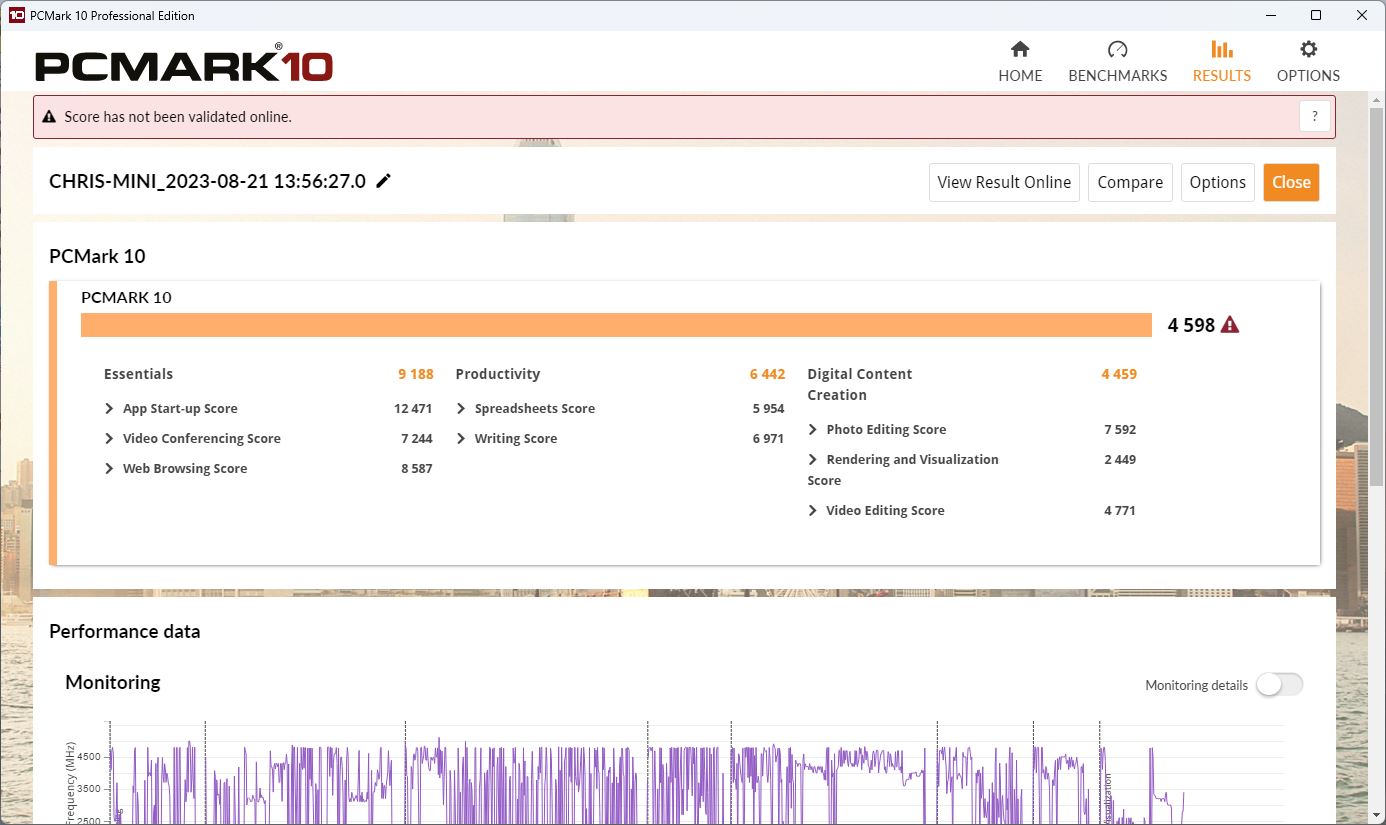
| PCMark 10 Score | 4598 points | |
Help | ||
| AIDA64 / Memory Copy | |
| Average of class Mini PC (15933 - 163031, n=105, last 2 years) | |
| Intel NUC 13 Pro Kit NUC13ANK | |
| Intel NUC 12 Pro Kit NUC12WSBi5 | |
| Geekom Mini IT11, i7-11390H | |
| Average Intel Core i7-11390H (19409 - 64750, n=4) | |
| Beelink SEi11 Pro | |
| BMAX B5 Pro G7H8 | |
| BMAX B7 Power G7A2 | |
| AIDA64 / Memory Read | |
| Average of class Mini PC (14143 - 123769, n=105, last 2 years) | |
| Intel NUC 12 Pro Kit NUC12WSBi5 | |
| Geekom Mini IT11, i7-11390H | |
| Beelink SEi11 Pro | |
| Intel NUC 13 Pro Kit NUC13ANK | |
| Average Intel Core i7-11390H (21253 - 59793, n=4) | |
| BMAX B5 Pro G7H8 | |
| BMAX B7 Power G7A2 | |
| AIDA64 / Memory Write | |
| Average of class Mini PC (10630 - 216693, n=105, last 2 years) | |
| Geekom Mini IT11, i7-11390H | |
| Intel NUC 12 Pro Kit NUC12WSBi5 | |
| Beelink SEi11 Pro | |
| Intel NUC 13 Pro Kit NUC13ANK | |
| Average Intel Core i7-11390H (19684 - 66881, n=4) | |
| BMAX B5 Pro G7H8 | |
| BMAX B7 Power G7A2 | |
| AIDA64 / Memory Latency | |
| Average of class Mini PC (88.1 - 184.8, n=106, last 2 years) | |
| Intel NUC 13 Pro Kit NUC13ANK | |
| BMAX B5 Pro G7H8 | |
| Intel NUC 12 Pro Kit NUC12WSBi5 | |
| Beelink SEi11 Pro | |
| Average Intel Core i7-11390H (66.3 - 95.3, n=4) | |
| Geekom Mini IT11, i7-11390H | |
| BMAX B7 Power G7A2 | |
* ... smaller is better
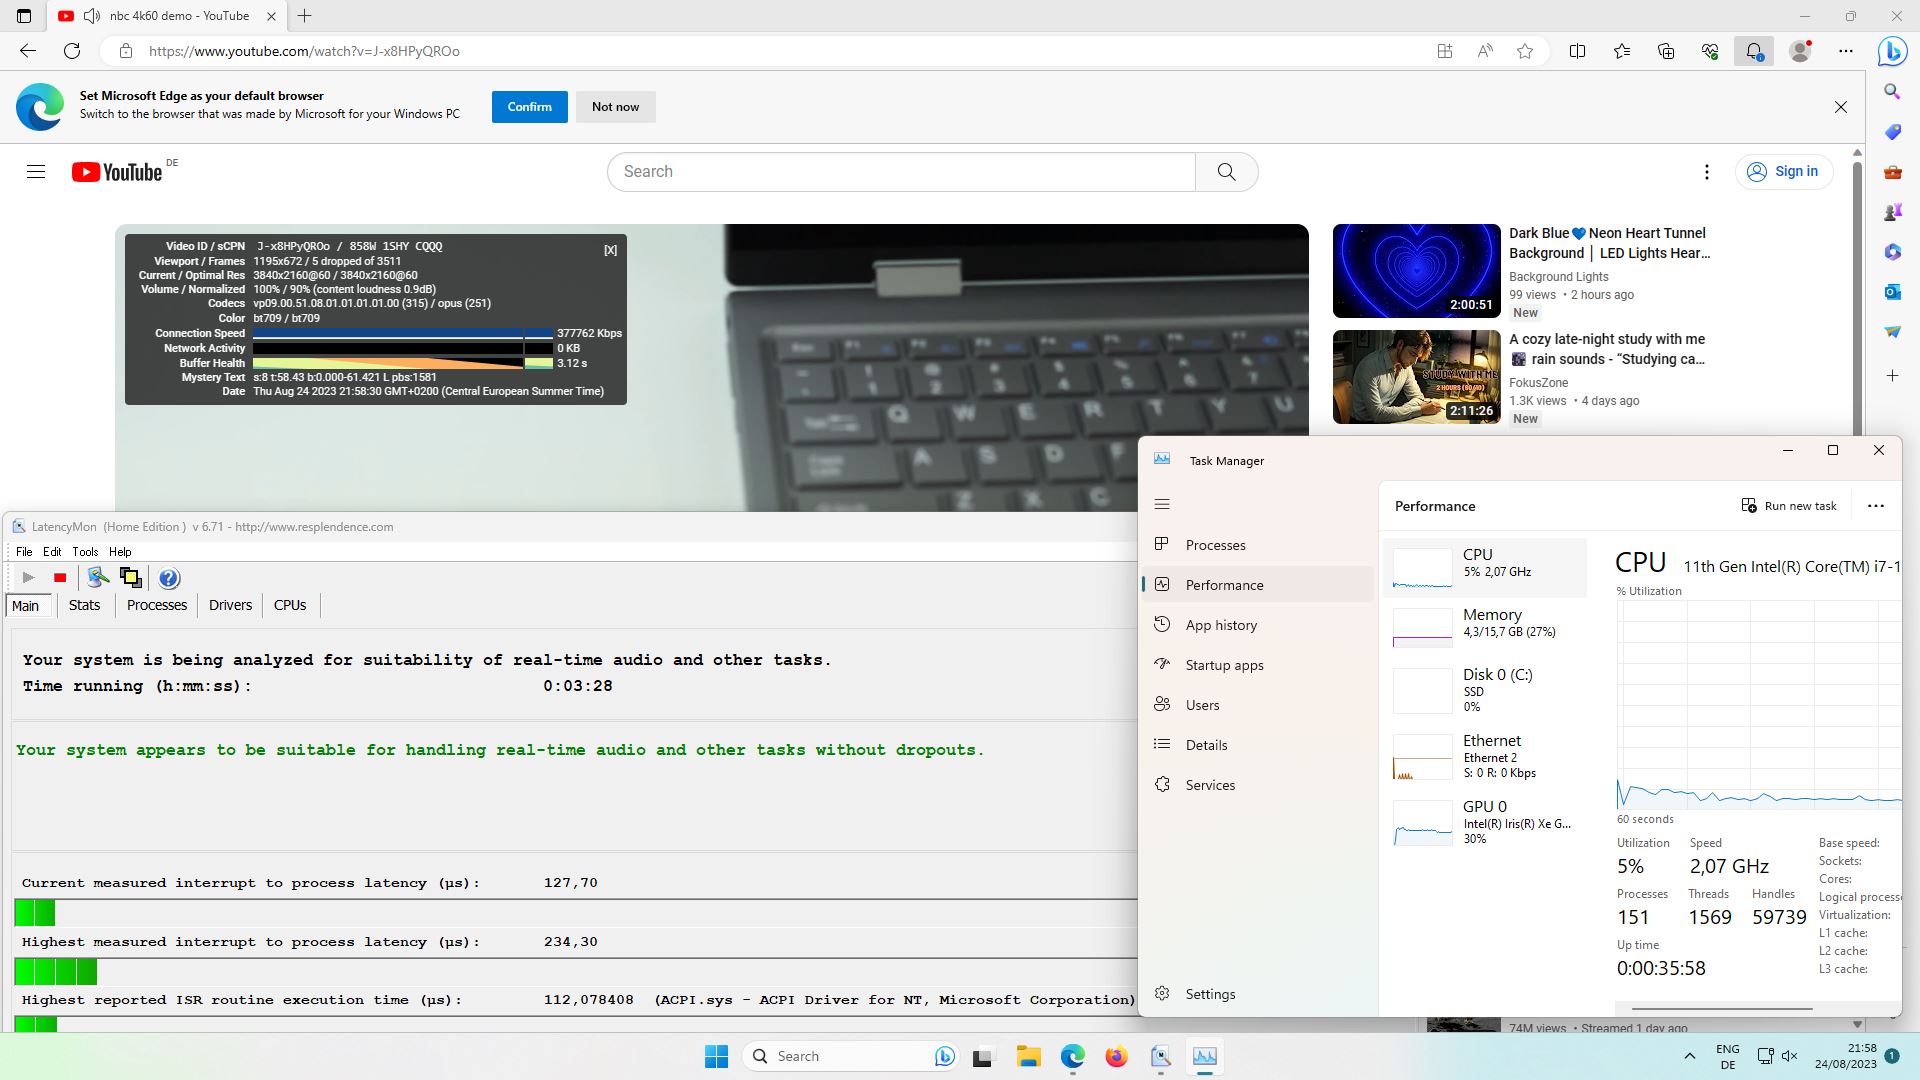
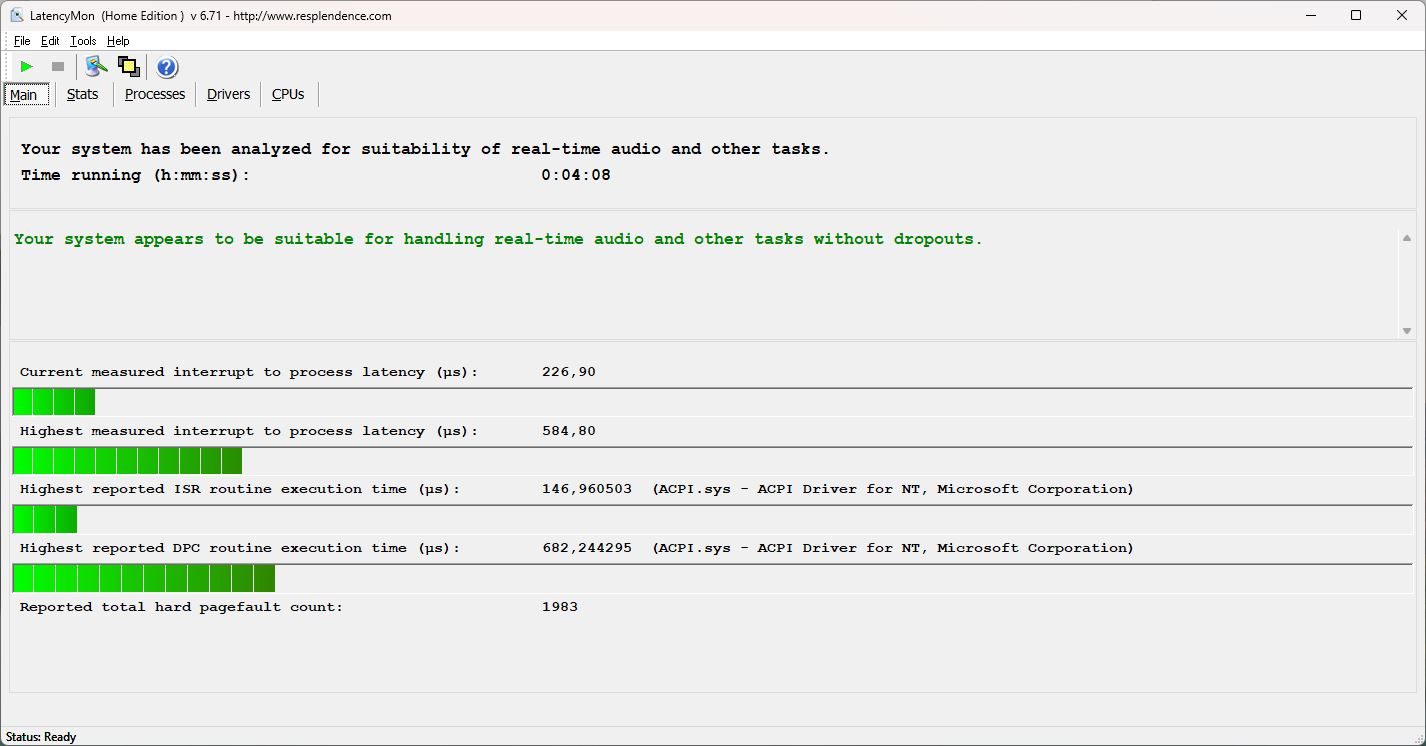
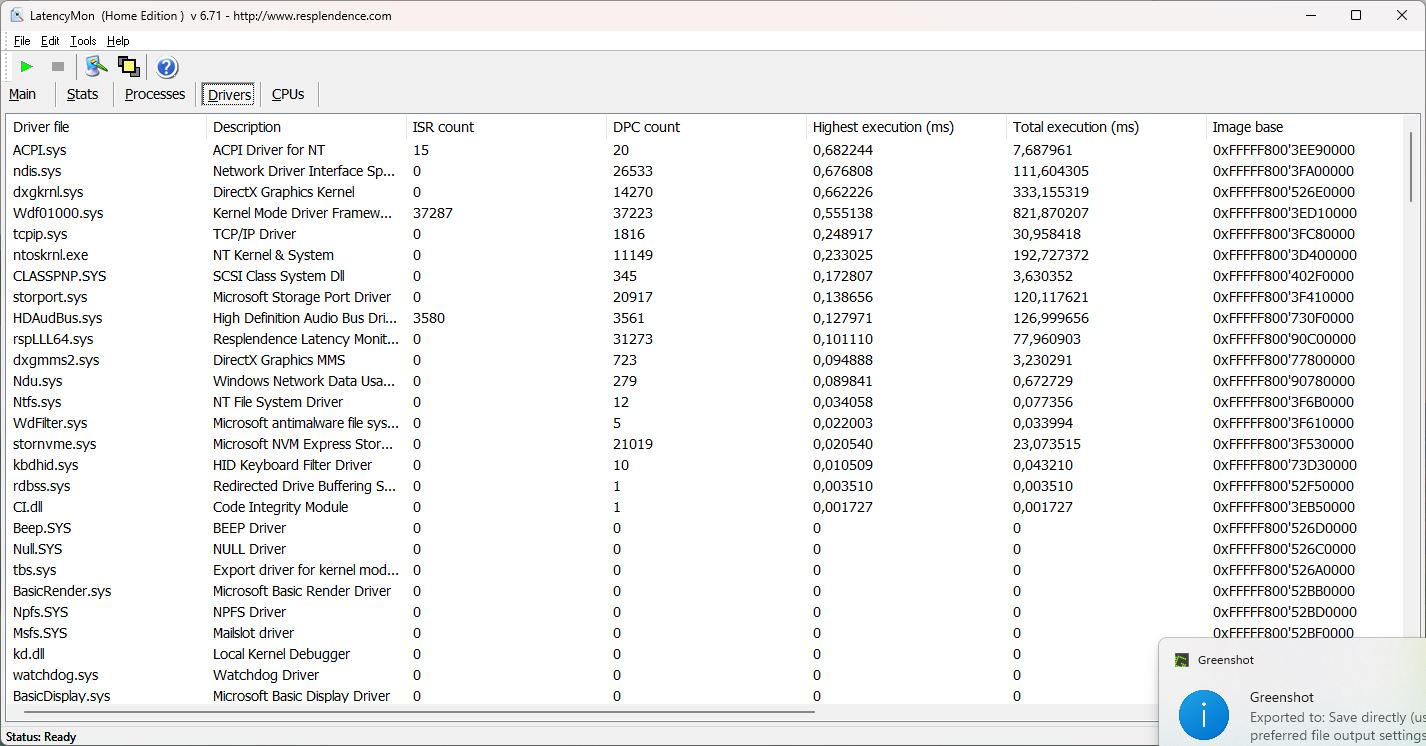
DPC 延迟
事实证明,加载网站对立方体电脑来说不成问题。它甚至能在我们的网站上轻松打开多个标签页,这与目前大多数游戏笔记本电脑形成了鲜明对比。
在播放 4K/60 fps 视频时,B7 的表现也不尽如人意,我们发现有三处掉帧现象,但除此之外,B7 的运行还是相当流畅的。这使得 B7 适合实时音频播放和其他应用。
相比之下,英特尔 NUC 的延迟较高,但来自 Geekom 和 Beelink 的上一代迷你 PC 表现稍好。
| DPC Latencies / LatencyMon - interrupt to process latency (max), Web, Youtube, Prime95 | |
| Intel NUC 13 Pro Kit NUC13ANK | |
| Intel NUC 12 Pro Kit NUC12WSBi5 | |
| BMAX B7 Power G7A2 | |
| Geekom Mini IT11, i7-11390H | |
| BMAX B5 Pro G7H8 | |
| Beelink SEi11 Pro | |
* ... smaller is better
存储设备
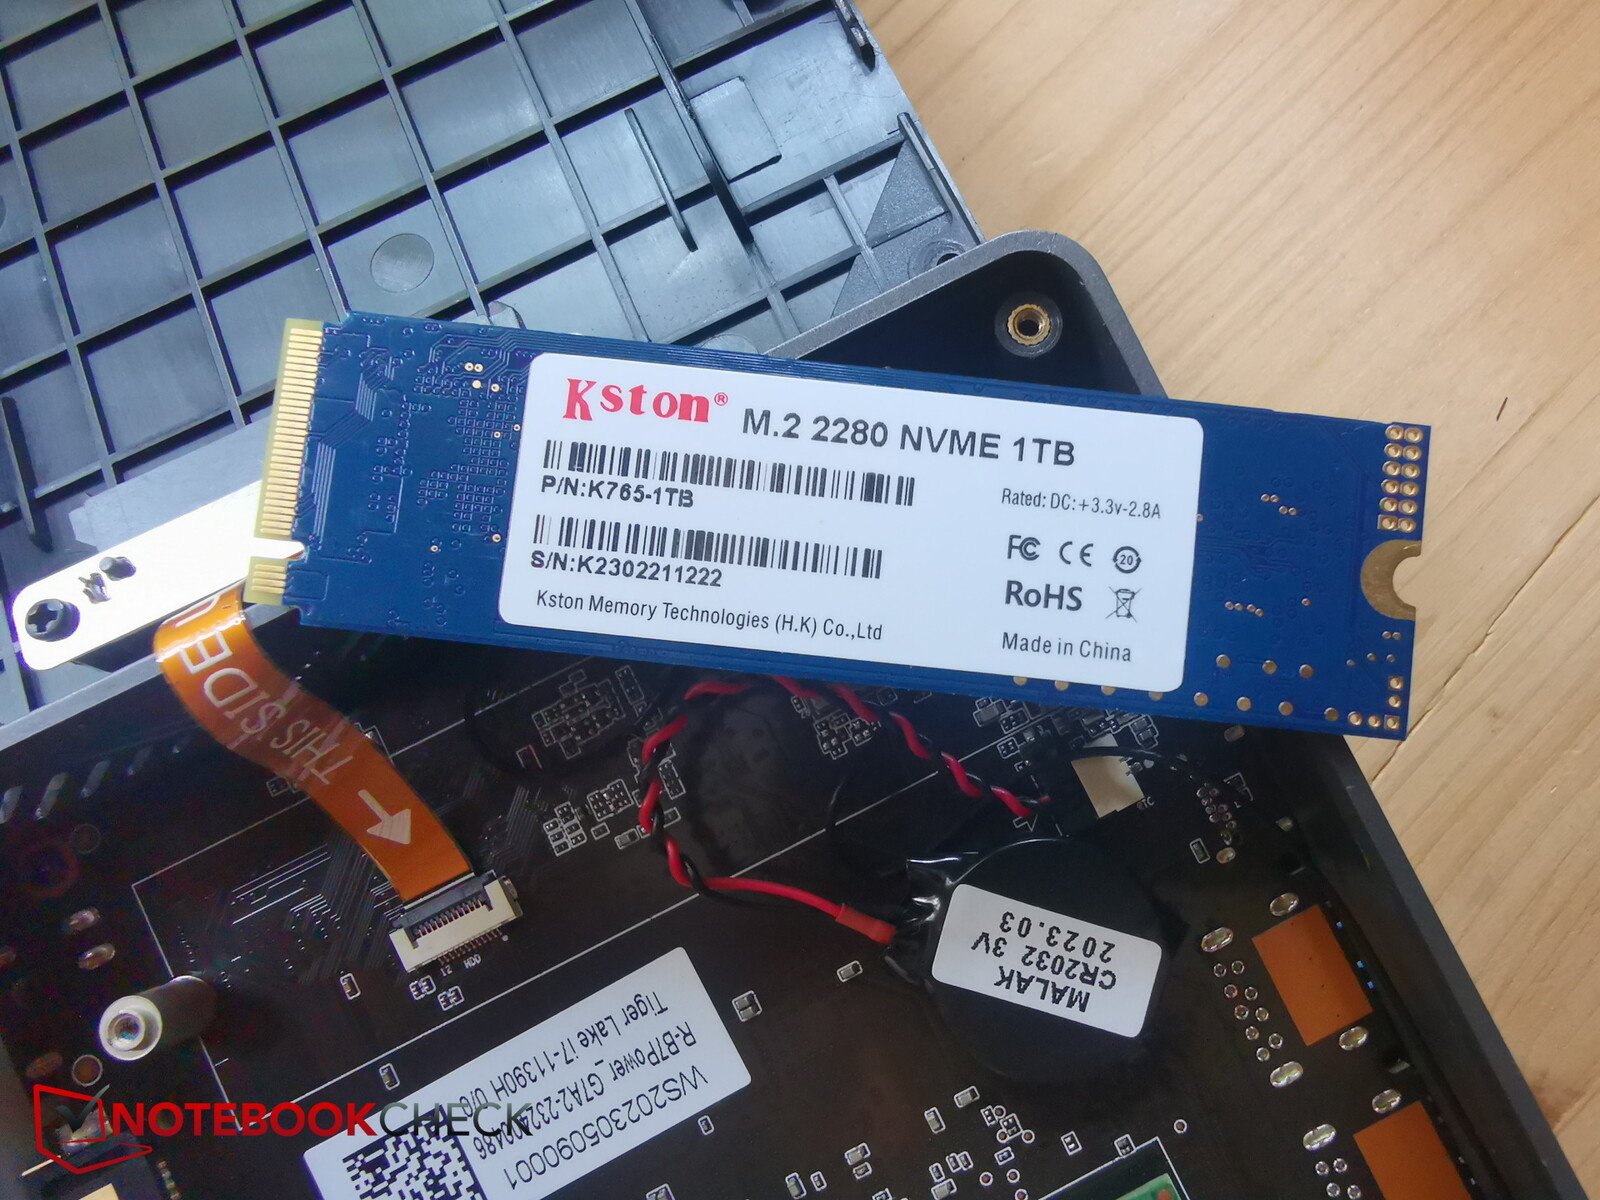
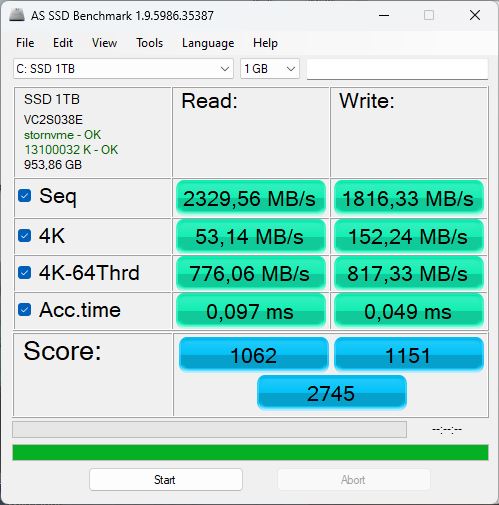
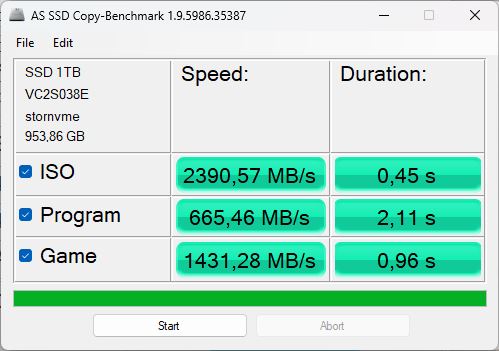
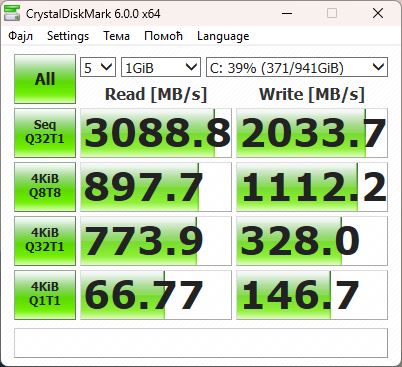
BMAX在设备中安装了一个1 TB的固态硬盘--这也是Windows上所有地方甚至是BIOS中的标注。到处都写着 "SSD 1 TB"。为了确定安装的型号及其制造商,你必须打开B7 Power,取出固态硬盘。背面有一个标签。Kston K765-1TB "在这里并不是很出名。它确实不应该有任何隐藏的理由--相比之下,这款机型的传输速率还是很不错的。只有三星固态硬盘在NUC 13在所有测试中的表现要好得多。
遗憾的是,由于热限制,在负载较长期间,其性能略有下降。虽然没有安装冷却装置,但建议安装。

* ... smaller is better
Reading continuous performance: DiskSpd Read Loop, Queue Depth 8
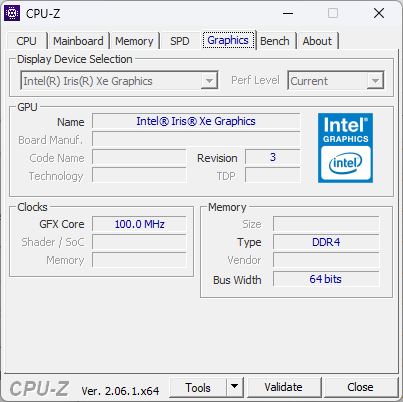
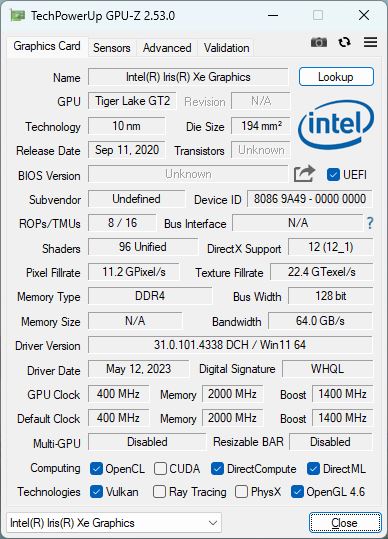
图形卡
Intel Iris Xe Graphics G7 96EUs集成在处理器中,充当 PC 的显卡。根据处理器和功耗的不同,其性能差异很大。
即使在 3D 基准测试中,其性能也远低于平均水平。在我们的数据库中,拥有 96 个 EU 的 Xe Graphics G7 的平均性能要高出 51%!即便如此,B7 Power 仍比配备 IntelUHD Graphics 620 的 B5 好 118%。它的性能仍然太弱,而且所安装的硬件严重受限。而采用相同 iGPU 的竞争对手则更接近平均值,因此远远领先于 B7。不足为奇的是NUC 13 Pro是这一领域的卫冕冠军。
| 3DMark 11 Performance | 4743 points | |
| 3DMark Cloud Gate Standard Score | 13442 points | |
| 3DMark Fire Strike Score | 2546 points | |
| 3DMark Time Spy Score | 1103 points | |
Help | ||
* ... smaller is better
游戏性能
尽管 B7 的名字中包含 "动力 "一词,但它确实不是为游戏而生的。它更适合作为日常办公设备使用。
在运行 Witcher 3 Ultra 时, 该电脑平均只能达到 8 至 9 帧/秒。Geekom Mini IT11的速度快 30%。Beelink SEi11 Pro- 尽管 CPU 性能稍弱,但仍领先于其他两款产品。
在最低分辨率和最低细节设置下,玩《Witcher 3 》时平均每秒可达到 48 帧。在 720p 和中等细节设置下,每秒可达到 30 帧。
在最低设置下(1280 x 720,低分辨率,约 29 帧/秒),《Far Cry 5》也能勉强运行。您只能使用较旧或要求较低的游戏,而且往往只能在降低设置的情况下玩这些游戏。另一方面,我们建议将这款电脑作为复古游戏机使用,例如与 RetroArch.
| Performance rating - Percent | |
| Average of class Mini PC | |
| Intel NUC 13 Pro Kit NUC13ANK -3! | |
| Beelink SEi11 Pro -1! | |
| Intel NUC 12 Pro Kit NUC12WSBi5 -5! | |
| Geekom Mini IT11, i7-11390H -2! | |
| BMAX B7 Power G7A2 | |
| BMAX B5 Pro G7H8 -5! | |
| The Witcher 3 - 1920x1080 Ultra Graphics & Postprocessing (HBAO+) | |
| Average of class Mini PC (11.9 - 271, n=54, last 2 years) | |
| Intel NUC 13 Pro Kit NUC13ANK | |
| Beelink SEi11 Pro | |
| Geekom Mini IT11, i7-11390H | |
| BMAX B7 Power G7A2 | |
| GTA V - 1920x1080 Highest AA:4xMSAA + FX AF:16x | |
| Average of class Mini PC (2.71 - 124.7, n=78, last 2 years) | |
| Geekom Mini IT11, i7-11390H | |
| Geekom Mini IT11, i7-11390H | |
| BMAX B7 Power G7A2 | |
| Final Fantasy XV Benchmark - 1920x1080 High Quality | |
| Average of class Mini PC (5.3 - 209, n=95, last 2 years) | |
| Beelink SEi11 Pro | |
| BMAX B7 Power G7A2 | |
| Strange Brigade - 1920x1080 ultra AA:ultra AF:16 | |
| Average of class Mini PC (17 - 245, n=48, last 2 years) | |
| Intel NUC 13 Pro Kit NUC13ANK | |
| Beelink SEi11 Pro | |
| Geekom Mini IT11, i7-11390H | |
| BMAX B7 Power G7A2 | |
| Dota 2 Reborn - 1920x1080 ultra (3/3) best looking | |
| Average of class Mini PC (8.2 - 213, n=103, last 2 years) | |
| Intel NUC 13 Pro Kit NUC13ANK | |
| Beelink SEi11 Pro | |
| Geekom Mini IT11, i7-11390H | |
| Intel NUC 12 Pro Kit NUC12WSBi5 | |
| BMAX B7 Power G7A2 | |
| BMAX B5 Pro G7H8 | |
| X-Plane 11.11 - 1920x1080 high (fps_test=3) | |
| Average of class Mini PC (4.77 - 147.9, n=87, last 2 years) | |
| Beelink SEi11 Pro | |
| BMAX B7 Power G7A2 | |
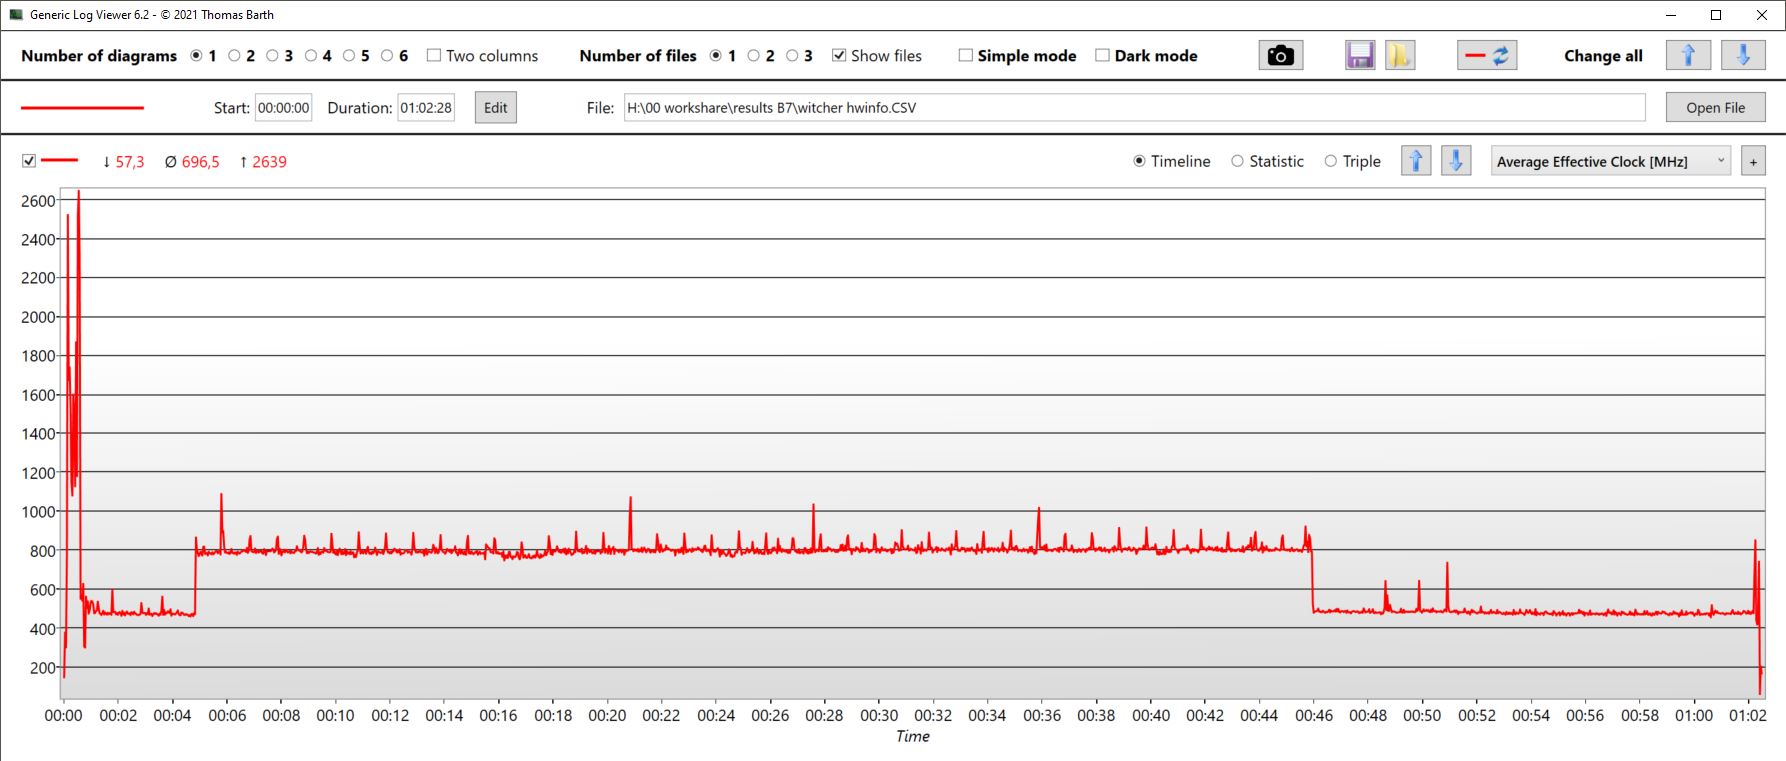
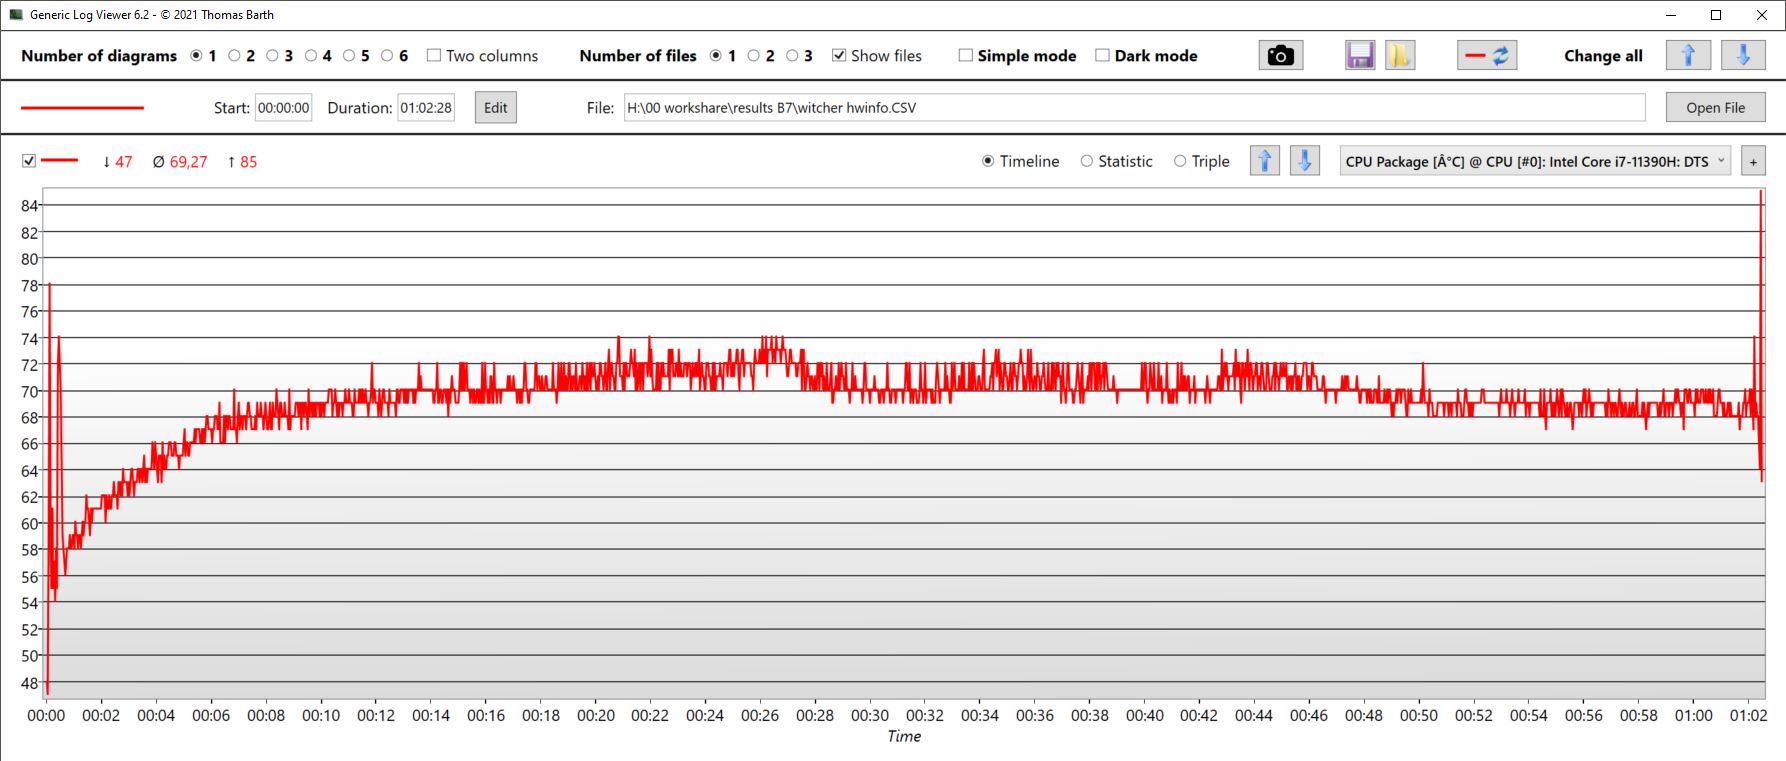
在一个小时的时间里,当播放《Witcher 3 》时,它的性能波动很大,这表明存在热节流现象。至少,CapframeX 工具测得的数值在 7 到 20 fps 之间波动。后者仅在短时间内达到--平均帧数为 8.8。
Witcher 3 FPS diagram
| low | med. | high | ultra | |
|---|---|---|---|---|
| GTA V (2015) | 56.4 | 44.8 | 4.13 | |
| The Witcher 3 (2015) | 48.4 | 31.3 | 8.8 | |
| Dota 2 Reborn (2015) | 92.3 | 64.9 | 32.9 | 29.6 |
| Final Fantasy XV Benchmark (2018) | 22.1 | 10.5 | 8.15 | |
| X-Plane 11.11 (2018) | 38 | 30 | 27.9 | |
| Far Cry 5 (2018) | 29 | |||
| Strange Brigade (2018) | 49 | 18.2 | 15.4 | 13.2 |
| Diablo 4 (2023) | 16.3 |
排放 - 静谧的 B7 动力
噪音排放
好吧--它的性能不尽如人意,但 B7 Power 至少能在排放形式上挽回颓势,并显示出自己是一台安静、节俭的微型电脑吗?
B7 Power 只有一个风扇。即使在空闲模式下,它也会在很短的时间后启动。不过,你必须把耳朵贴近机箱才能听到这 25 分贝的声音。即使在最大负载情况下,风扇也不会发出太大噪音--我们测得的噪音为 27 分贝。
功能更强大的 NUC13 噪音更大,超过了 40 分贝。在这次比较中,B7 Power 是迄今为止最安静的微型电脑。
Noise level
| Idle |
| 23 / 25.12 / 25.12 dB(A) |
| Load |
| 27.15 / 27.15 dB(A) |
 | ||
30 dB silent 40 dB(A) audible 50 dB(A) loud |
||
min: | ||
| BMAX B7 Power G7A2 Iris Xe G7 96EUs, i7-11390H, Kston K765-1TB | Geekom Mini IT11, i7-11390H Iris Xe G7 96EUs, i7-11390H, Lexar 1024GB LNM6A1X001T-HNNNG | Intel NUC 13 Pro Kit NUC13ANK Iris Xe G7 96EUs, i7-1360P, Samsung PM9A1 MZVL2512HCJQ | Beelink SEi11 Pro Iris Xe G7 96EUs, i5-11320H, Kingston NV1 SNVS/500GCN | BMAX B5 Pro G7H8 UHD Graphics 620, i5-8260U | |
|---|---|---|---|---|---|
| Noise | -23% | -35% | -13% | -7% | |
| off / environment * (dB) | 23 | 29.7 -29% | 29.8 -30% | 22.8 1% | 23 -0% |
| Idle Minimum * (dB) | 23 | 30.2 -31% | 30.2 -31% | 24.7 -7% | 25.1 -9% |
| Idle Average * (dB) | 25.12 | 30.2 -20% | 31.1 -24% | 24.7 2% | 25.1 -0% |
| Idle Maximum * (dB) | 25.12 | 30.2 -20% | 31.9 -27% | 25.3 -1% | 25.1 -0% |
| Load Average * (dB) | 27.15 | 30.6 -13% | 40 -47% | 33.2 -22% | 28.6 -5% |
| Witcher 3 ultra * (dB) | 27.15 | 30.5 -12% | 34.5 -27% | 30.1 -11% | |
| Load Maximum * (dB) | 27.15 | 36.4 -34% | 40.5 -49% | 37.8 -39% | 34 -25% |
* ... smaller is better
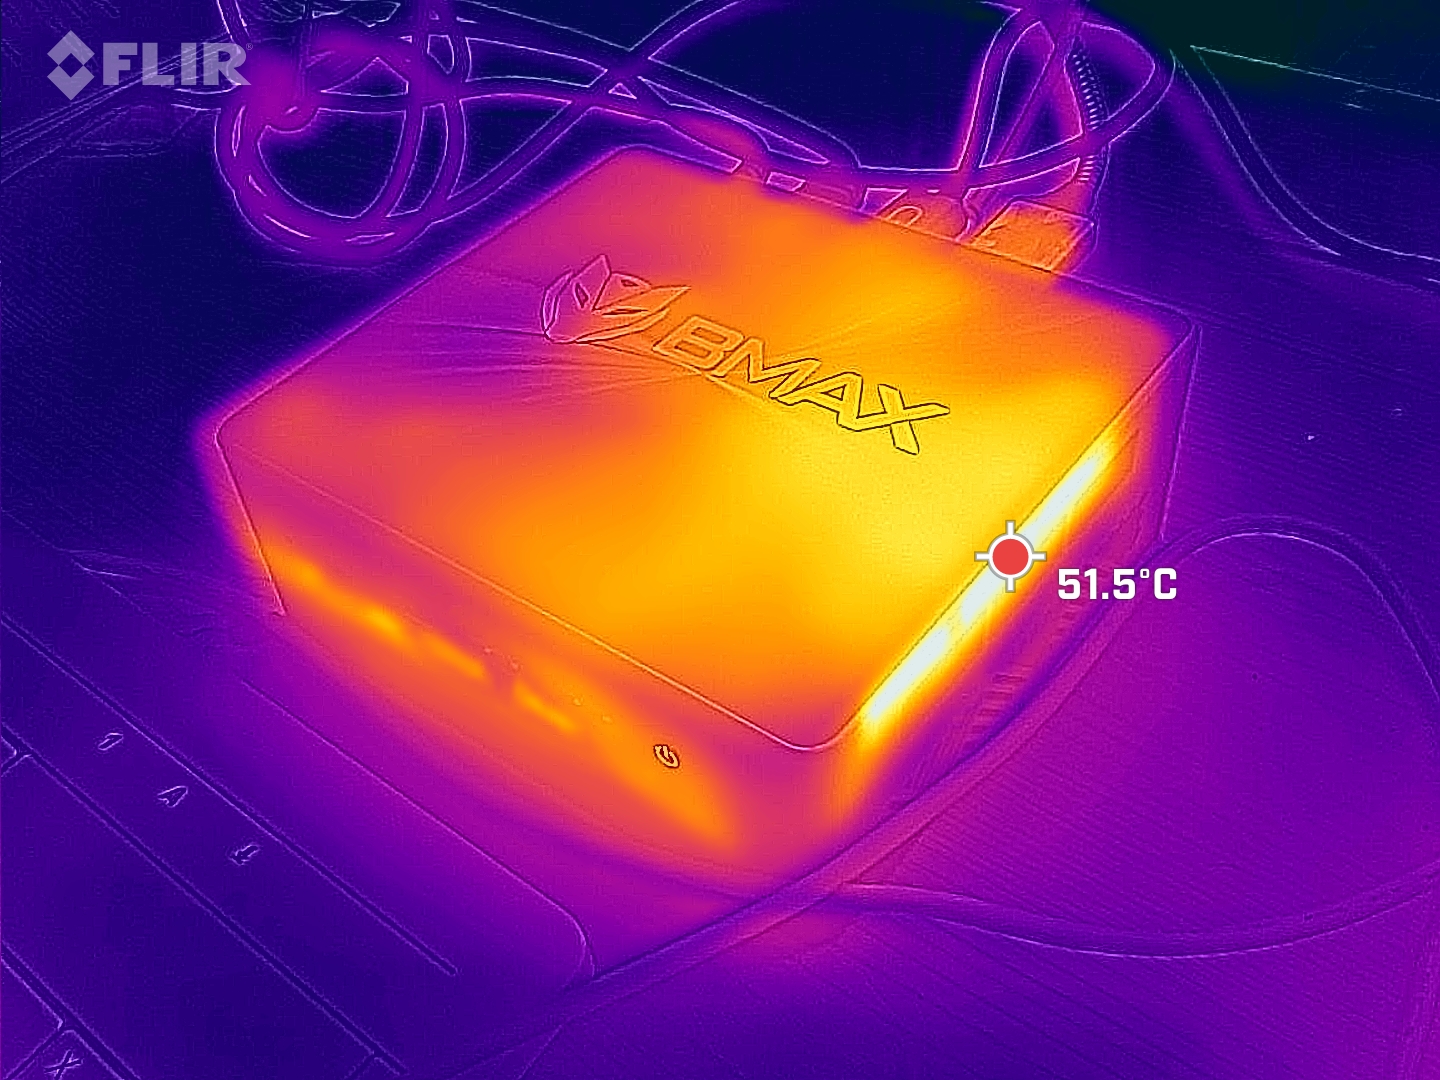
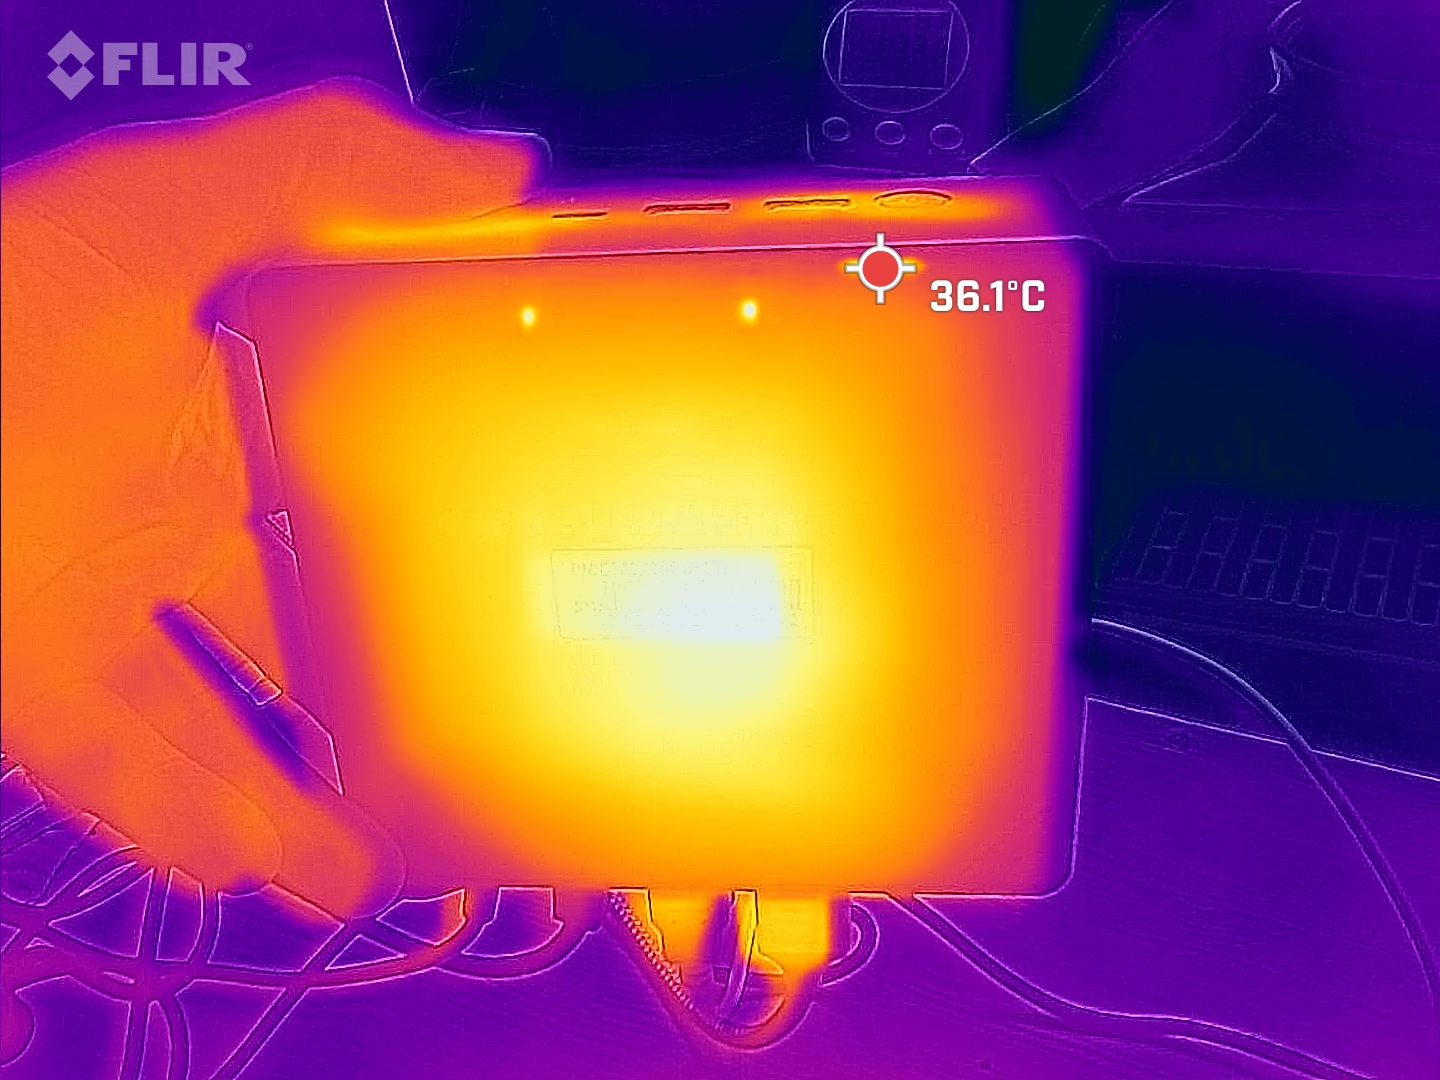
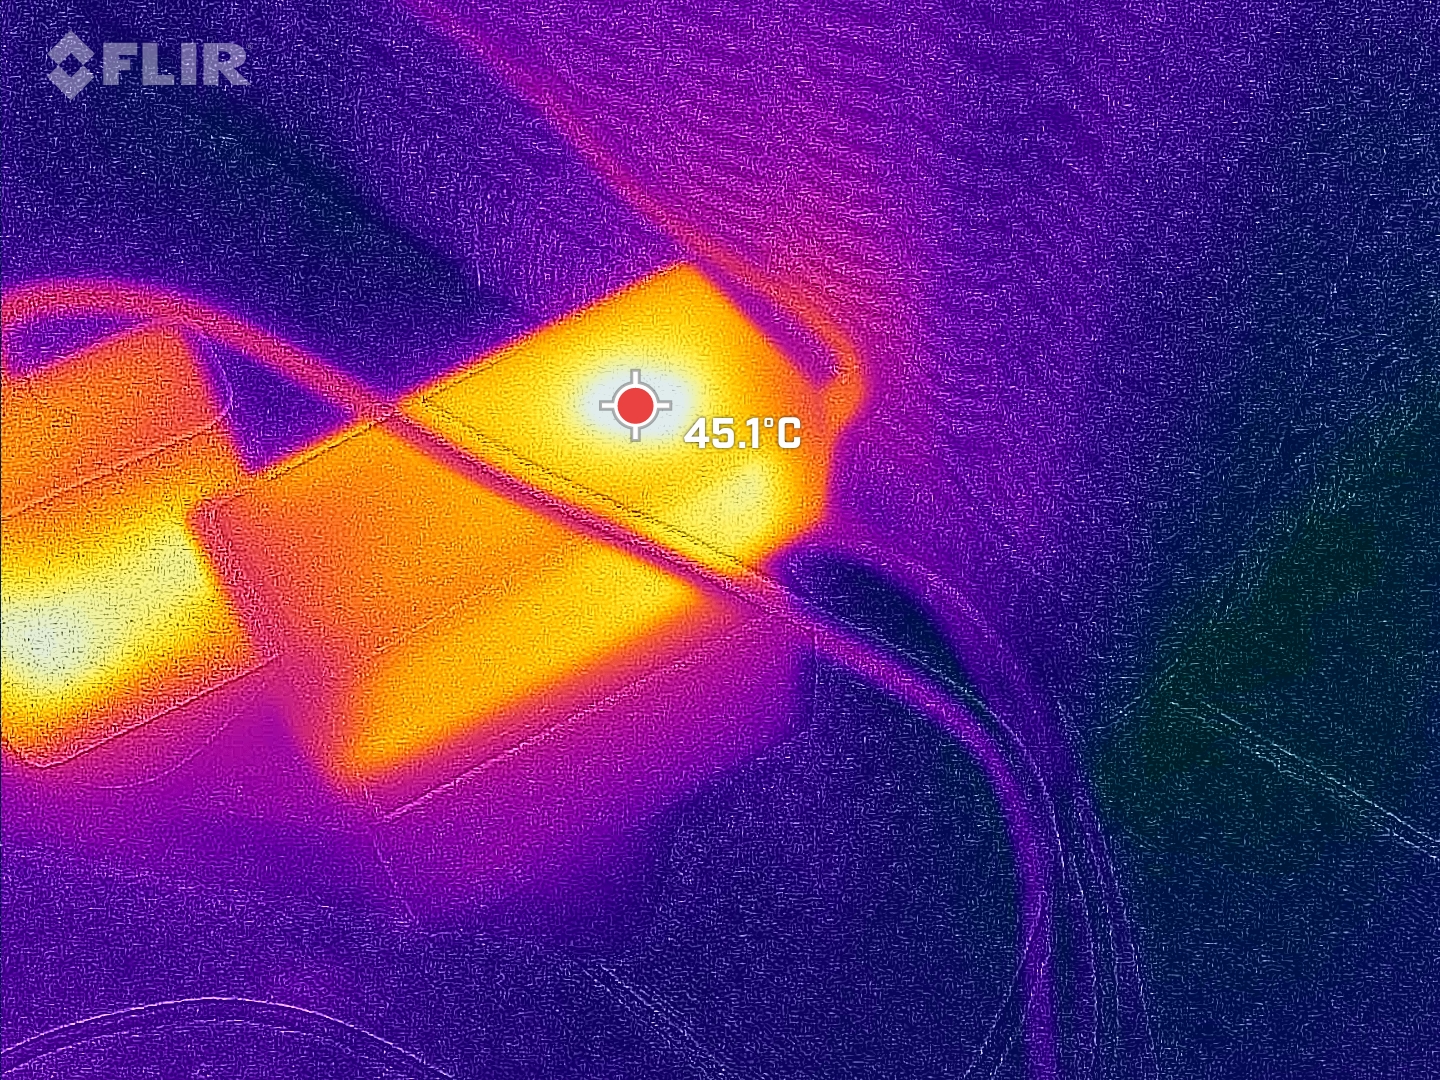
温度
另一方面,静音风扇也会导致相当高的温度--幸好只是在风栅的位置。在游戏和压力测试中,机箱顶部和底部的平均温度仅为 43 °C。而在机箱右侧的出风口,我们测得的温度高达 54 °C。
(±) The maximum temperature on the upper side is 43 °C / 109 F, compared to the average of 35.4 °C / 96 F, ranging from 20.6 to 69.5 °C for the class Mini PC.
(±) The bottom heats up to a maximum of 42 °C / 108 F, compared to the average of 36.1 °C / 97 F
(±) In idle usage, the average temperature for the upper side is 35.2 °C / 95 F, compared to the device average of 32.1 °C / 90 F.
压力测试
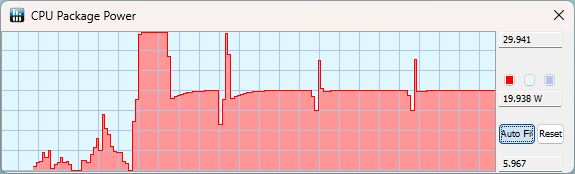
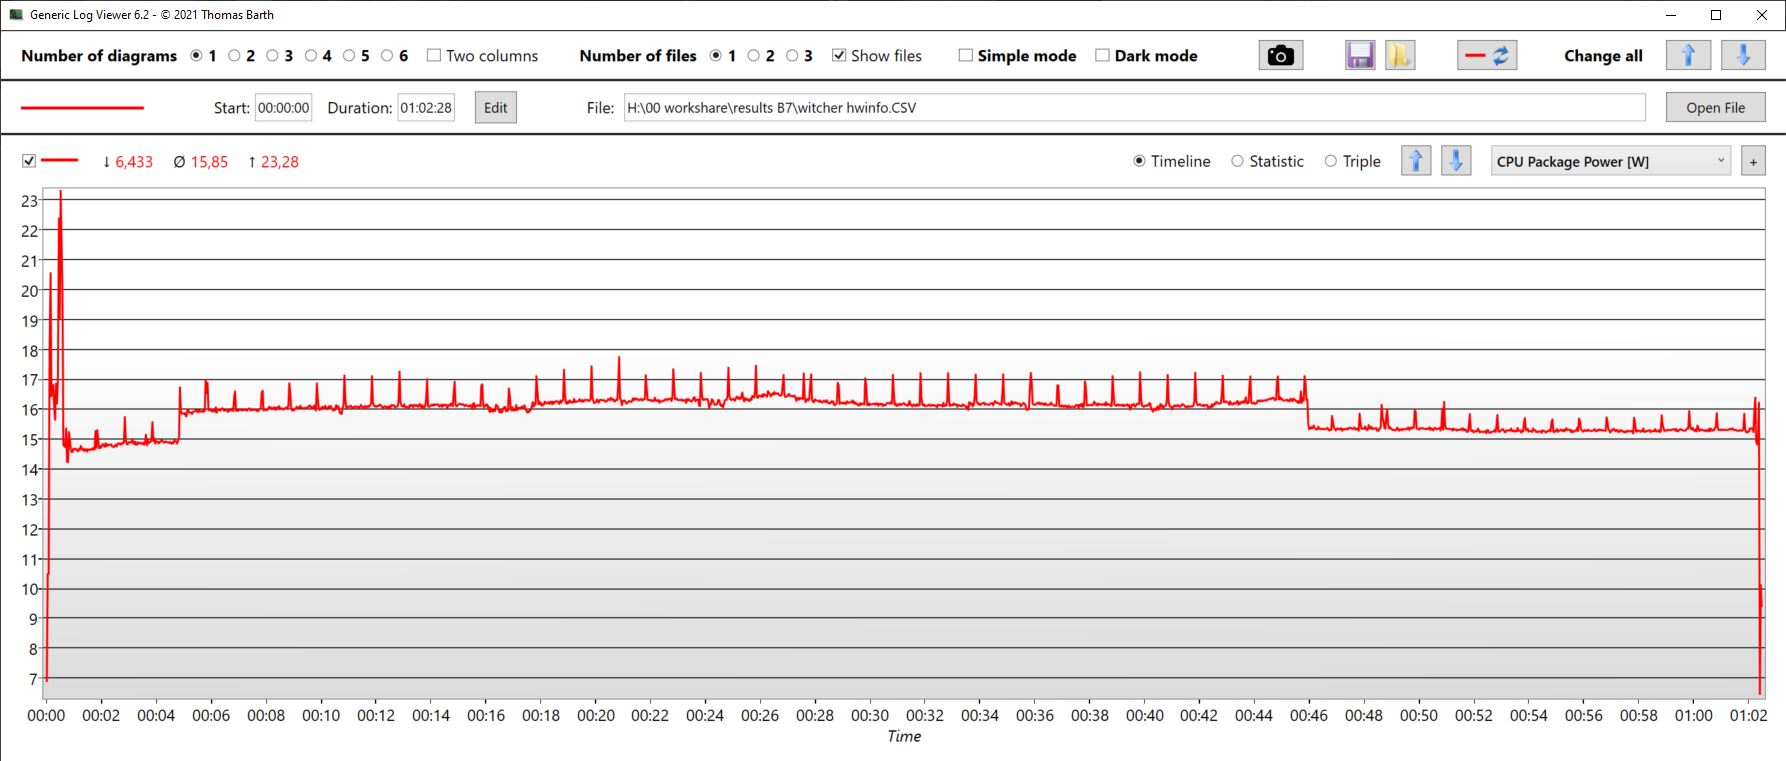
在压力测试中,Prime95 和 Furmark 同时运行。CPU 的主频曾一度超过 2.8 GHz。短暂下降后,处理器在随后的 5 分钟内保持 2.8 GHz 的频率,之后又反复循环下降到 1.8 至 2.3 GHz。单个内核的温度从未超过 78°C。不过,CPU 整体升温至 82°C,但平均温度保持在 78°C。
开始时 CPU 功耗为 24 瓦,但平均功耗仅为 19 瓦。
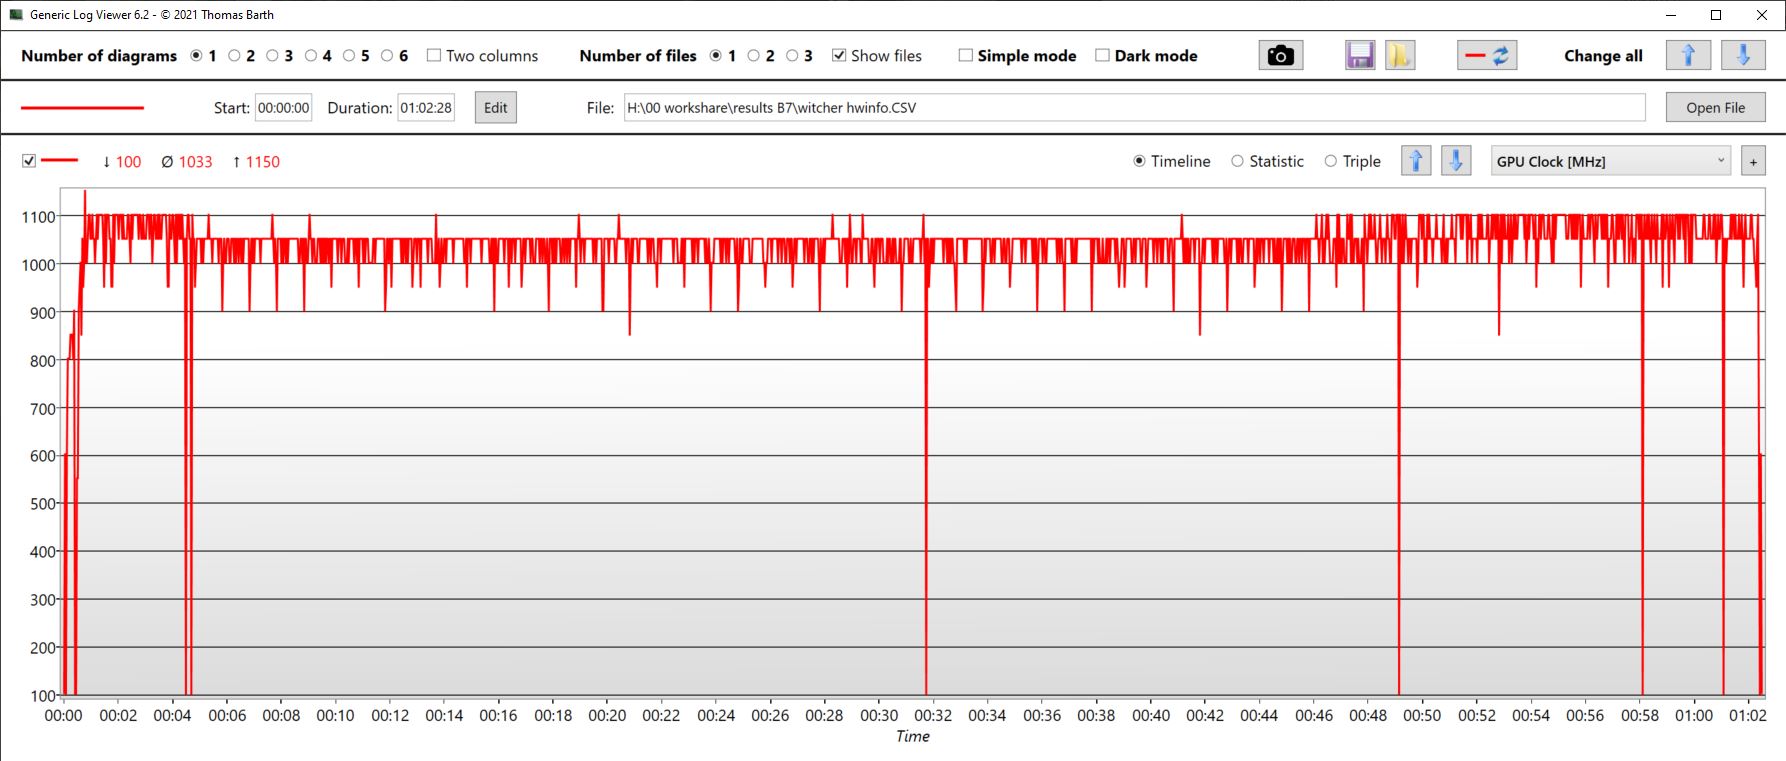
集成图形处理器的时钟频率在很短的时间内达到 1.4 GHz,之后又从约 600 MHz 周期性下降到 100 至 350 MHz。图形处理器的平均时钟频率为 400 MHz。
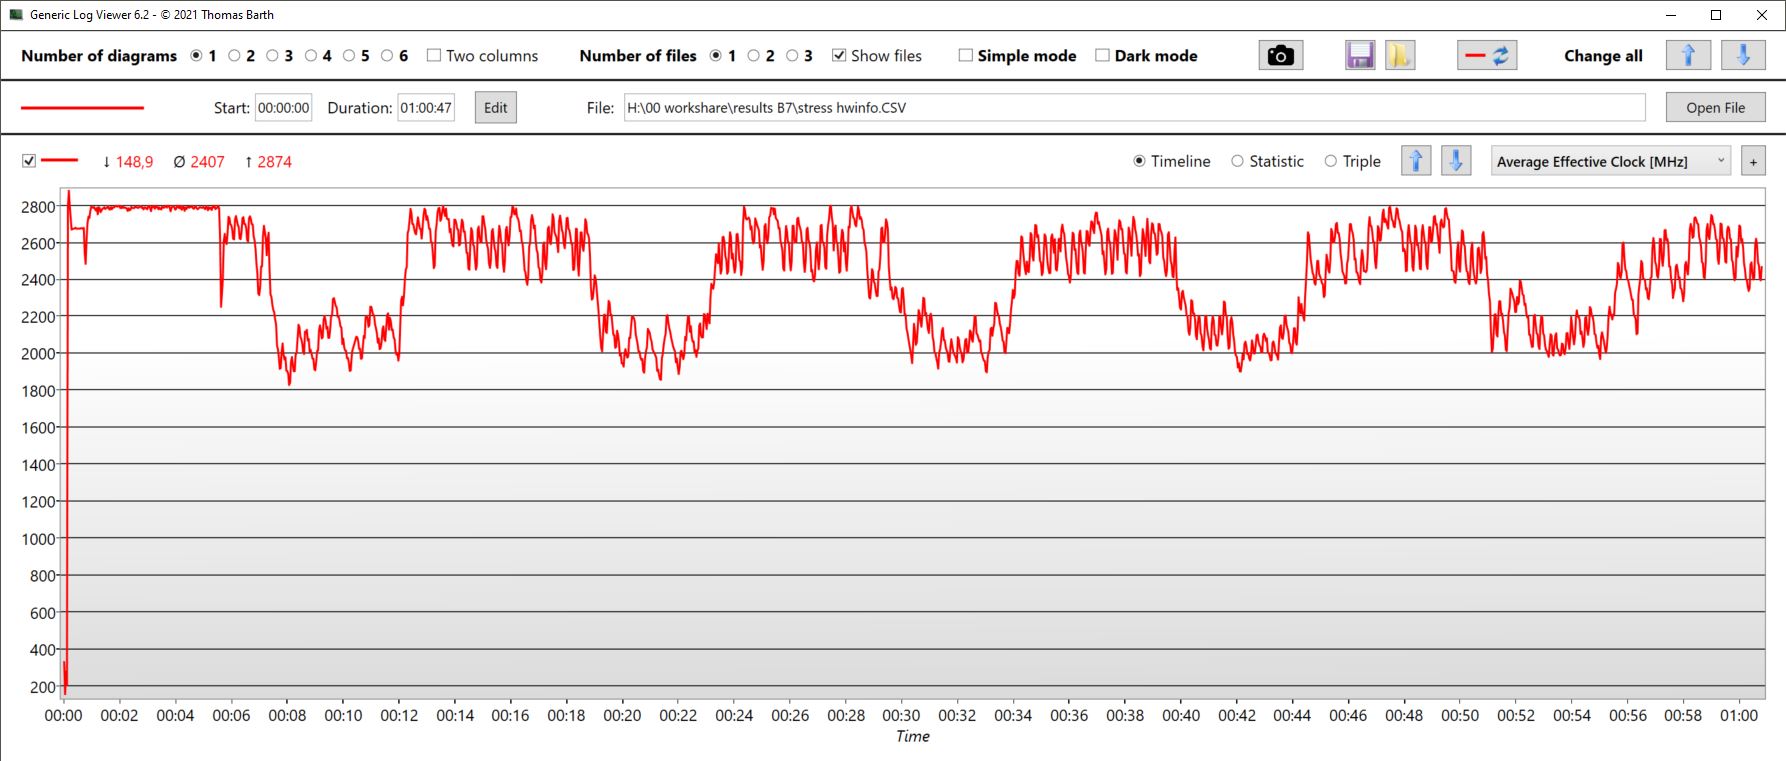
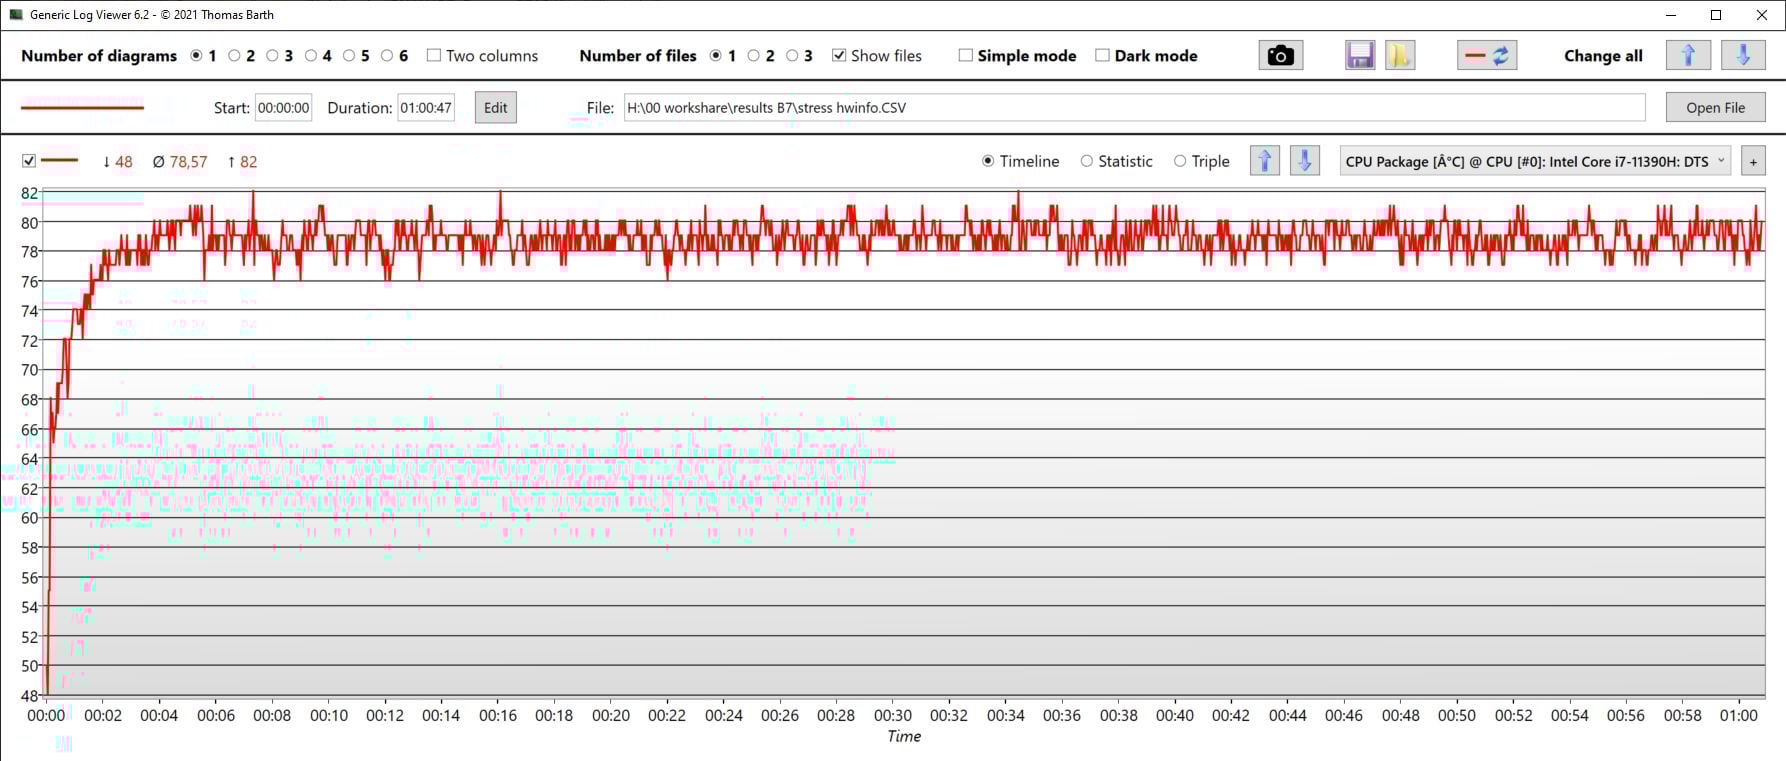
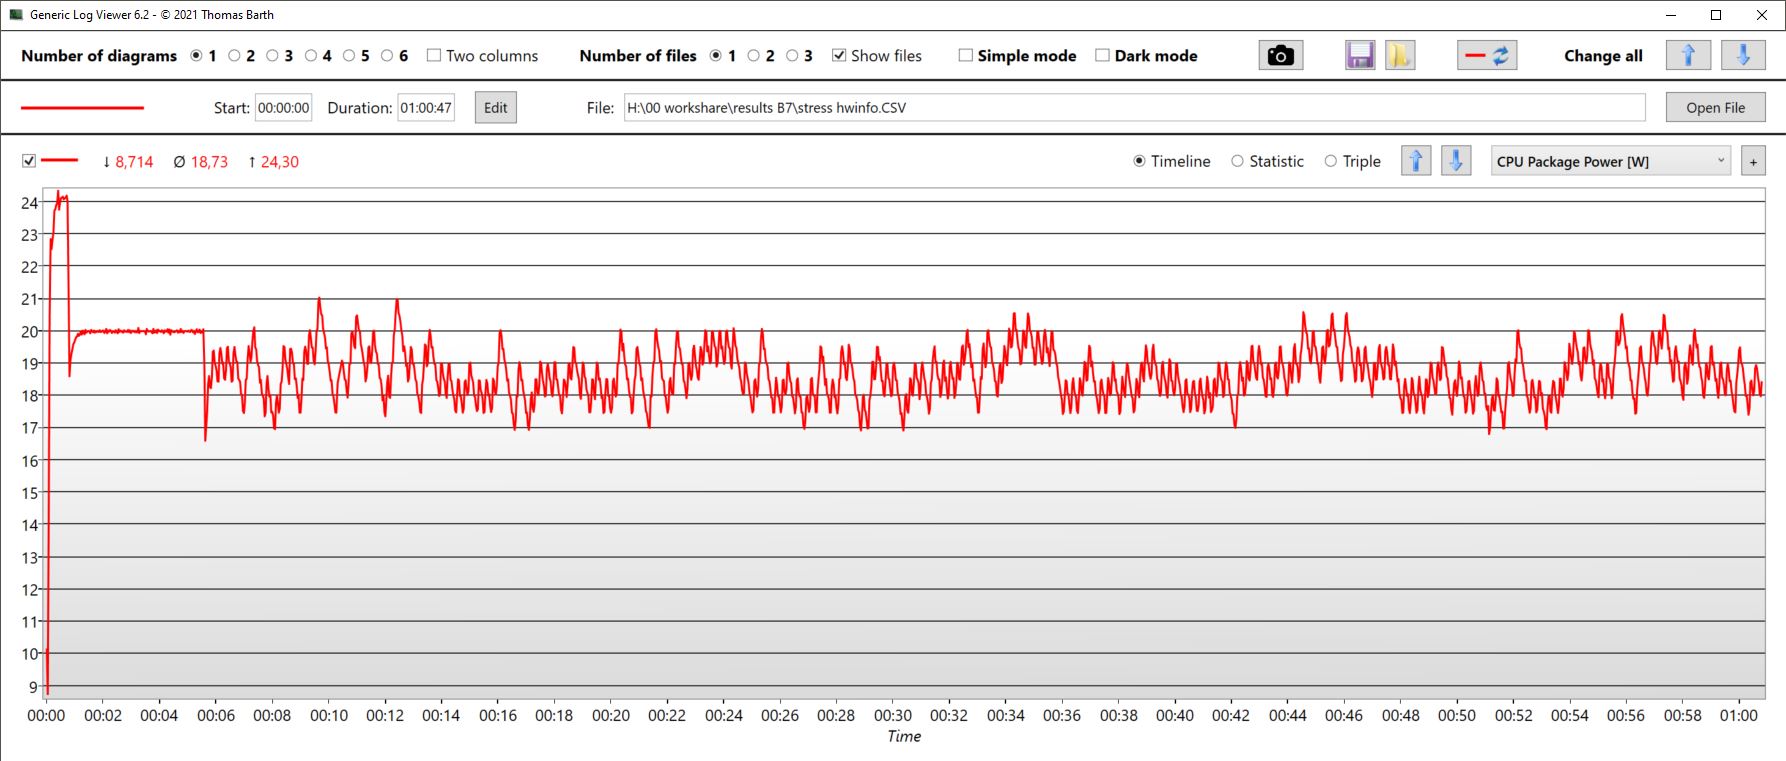
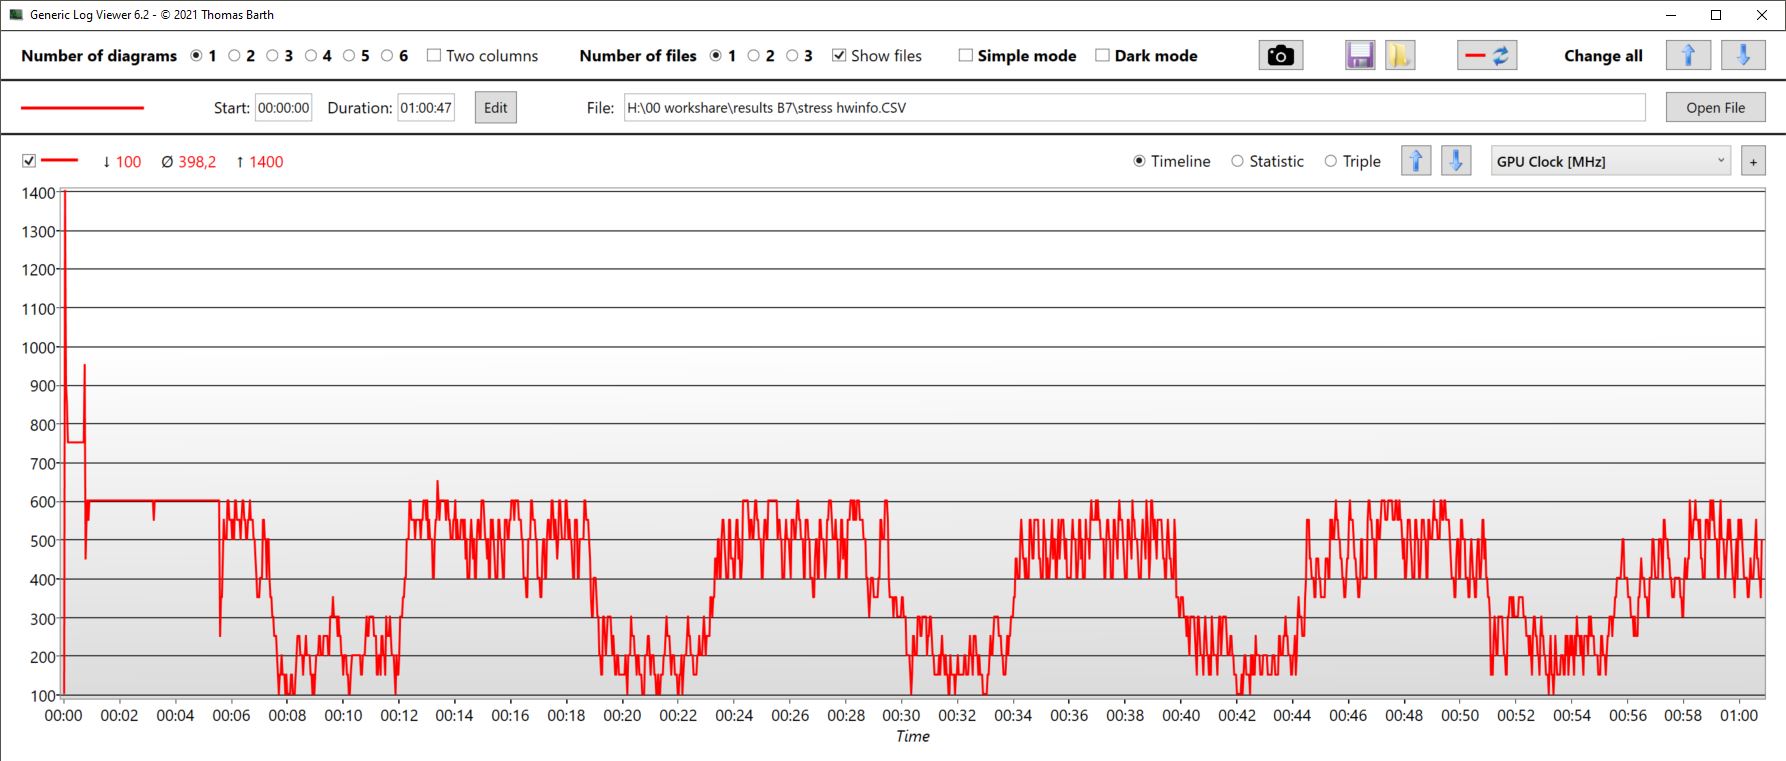
| CPU 时钟 (GHz) | GPU 时钟 (MHz) | CPU 平均温度 (°C) | GPU 平均温度(°C) | |
| Prime95 + FurMark 压力 | 2.4 | 400 | 79 | 79 |
| Witcher 3 压力 | 0.7 | 1033 | 69 | 69 |
电源管理 - 非常节俭的 BMAX B7
耗电量
总体而言,B7 Power 非常节俭。根据不同的功率模式,我们在空闲模式下测得的功率在 9 到 10 瓦之间。在负载情况下,B7 才真正显示出它的节俭。
其绝对最大功耗暂时略低于 44 瓦,但平均而言,B7 Power 的功耗不会持续超过 35 瓦。其小型电源的额定功率为 47.5 瓦(19 V 和 2.5 A)。另外,只要充电器符合最低规格,您也可以通过 USB-C 连接为 B7 供电。
需要注意的是:如果 B7 处于关机状态,其耗电量仍将近 1 瓦。 此外,USB 端口会循环供电。因此,即使在关闭状态下,我们的 RGB 鼠标仍会发光。在没有键盘和鼠标的情况下,B7 关机时的功耗为 830 毫瓦。使用鼠标和键盘时,其功耗部分超过 1 瓦。根据应用情况,我们建议为 B7 Power 配备一个可切换的电源插座。
| Off / Standby | |
| Idle | |
| Load |
|
Key:
min: | |
| BMAX B7 Power G7A2 i7-11390H, Iris Xe G7 96EUs, Kston K765-1TB, , x, | Geekom Mini IT11, i7-11390H i7-11390H, Iris Xe G7 96EUs, Lexar 1024GB LNM6A1X001T-HNNNG, , x, | Intel NUC 13 Pro Kit NUC13ANK i7-1360P, Iris Xe G7 96EUs, Samsung PM9A1 MZVL2512HCJQ, , x, | Beelink SEi11 Pro i5-11320H, Iris Xe G7 96EUs, Kingston NV1 SNVS/500GCN, , x, | BMAX B5 Pro G7H8 i5-8260U, UHD Graphics 620, , , x, | Average Intel Iris Xe Graphics G7 96EUs | Average of class Mini PC | |
|---|---|---|---|---|---|---|---|
| Power Consumption | -8% | -61% | -48% | -8% | -28% | -88% | |
| Idle Minimum * (Watt) | 9.1 | 7.3 20% | 5.1 44% | 9.8 -8% | 6 34% | 5.51 ? 39% | 8.82 ? 3% |
| Idle Average * (Watt) | 9.5 | 7.8 18% | 5.8 39% | 10.3 -8% | 6.2 35% | 8.66 ? 9% | 10.9 ? -15% |
| Idle Maximum * (Watt) | 10 | 8.4 16% | 10.2 -2% | 10.5 -5% | 6.3 37% | 10.9 ? -9% | 13.9 ? -39% |
| Load Average * (Watt) | 27.1 | 28.7 -6% | 68.1 -151% | 54.2 -100% | 42.8 -58% | 45.6 ? -68% | 65 ? -140% |
| Witcher 3 ultra * (Watt) | 29.1 | 53.1 -82% | 35 -20% | ||||
| Load Maximum * (Watt) | 32.3 | 61.1 -89% | 108.3 -235% | 59 -83% | 55.8 -73% | 67.8 ? -110% | 113.5 ? -251% |
* ... smaller is better
Power consumption with external monitor
Pros
Cons
结论 - 更像是 "B7 经济型"

BMAX B7 Power 毫无必要地造成了一种假象。安装的处理器是两代前的产品,即使在同类产品中也是非常慢的,因为它被节流了。与此同时,B7 也不必自惭形秽,因为它的优势--如安静和节俭--足以说明这款电脑的用途完全不同。
这款 X86 微型电脑适用于所有需要达到一定性能水平,同时又要保持低功耗和低噪音的用途。这些用途包括很多方面,如用作家庭服务器、复古游戏机等。B7 Power 的市场定位根本就是错误的。如果你在这个时代还在购买英特尔 Gen11,那么无论如何你都不可能把目光投向最高性能--因此,B7 的真正优势应该得到更多的宣传。给它起个名字,比如 B7 Power Server、B7 Home Server 或 B7 Efficient,会更合适。
如果你追求的是最大 "功率",那么你就找错了地方,BMAX B7 Power 配备了经过节流处理的 Gen11 GPU。反之,如果您正在寻找家庭服务器或类似设备,那么这款设备就非常适合您。
价格和供应情况
B7 Power 可直接从Bmax 网站购买,售价为 399.99 美元。售价 399.99 美元。也可从亚马逊以同样的价格购买这款迷你电脑。
BMAX B7 Power G7A2
- 09/12/2023 v7 (old)
Christian Hintze
Transparency
The selection of devices to be reviewed is made by our editorial team. The test sample was provided to the author as a loan by the manufacturer or retailer for the purpose of this review. The lender had no influence on this review, nor did the manufacturer receive a copy of this review before publication. There was no obligation to publish this review. As an independent media company, Notebookcheck is not subjected to the authority of manufacturers, retailers or publishers.
This is how Notebookcheck is testing
Every year, Notebookcheck independently reviews hundreds of laptops and smartphones using standardized procedures to ensure that all results are comparable. We have continuously developed our test methods for around 20 years and set industry standards in the process. In our test labs, high-quality measuring equipment is utilized by experienced technicians and editors. These tests involve a multi-stage validation process. Our complex rating system is based on hundreds of well-founded measurements and benchmarks, which maintains objectivity. Further information on our test methods can be found here.
Price comparison

