Notebookcheck Logo

AMD Radeon RX 7700S

AMD Radeon RX 7700S

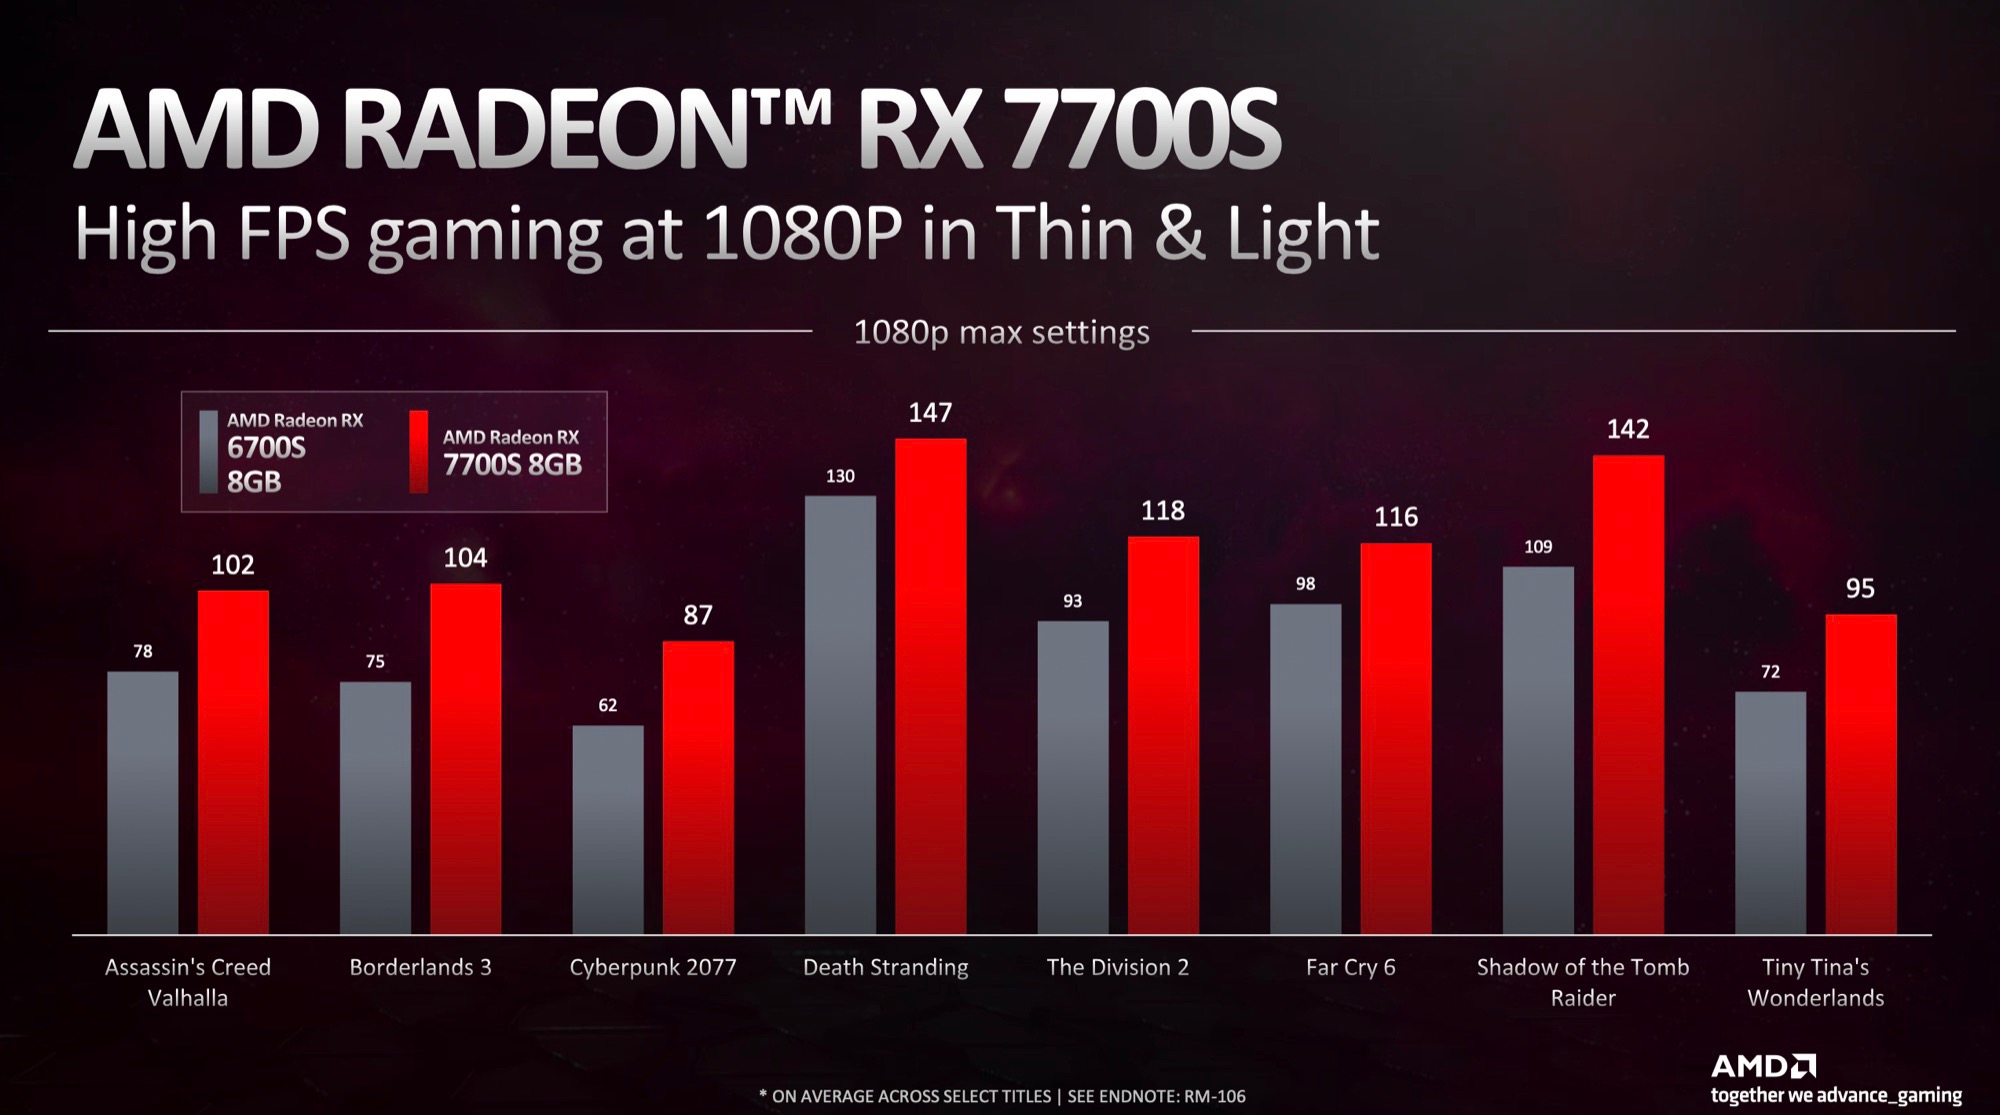
AMD Radeon RX 7700S 是一款基于 6 纳米制造的 Navi 33 芯片(RDNA 3 架构)的移动中高端显卡。它具有 2,048 个核心(32 个 CU - 计算单元)和与 128 位内存总线连接的 8 GB 快速 GDDR6 图形内存。该芯片还包括 32 MB 无限高速缓存。 AMD 表示,核心的时钟速度将取决于笔记本电脑。指定的游戏时钟速度为 2200 MHz(最有可能为 100 W TGP)。 7700S 是 RX 7600M XT 的节能版本,时钟速度(-100 MHz)和 TDP(最大 -20W)略有降低。

AMD 将其性能与旧版 Radeon RX 6700S 进行了比较,后者很容易被 7700S 击败。由于理论性能仅略低于 7600M XT(100W TGP),因此 7700S 也应该击败 RTX 3060 桌面 GPU。尽管 RDNA 3 的光线追踪性能确实有所提高,但 GeForce GPU 在这方面仍然更快。

Navi 33 芯片由台积电采用当前的 6nm 工艺制造(相对于 Nvidia RTX 4000 系列的 4nm)。功耗 (TGP) 指定为 75 至 100 瓦。

Radeon RX 7000M Series

Radeon RX 7900M 4608 @ 1.83 - 2.09 GHz256 Bit @ 18000 MHz
Radeon RX 7600M XT 2048 @ 2.3 GHz128 Bit @ 18000 MHz
Radeon RX 7700S 2048 @ 2.2 GHz128 Bit @ 18000 MHz
Radeon RX 7600M 1792 @ 2.07 GHz128 Bit @ 16000 MHz
Radeon RX 7600S 1792 @ 1.87 GHz128 Bit @ 16000 MHz
CodenameNavi 33
ArchitectureRDNA 3
Pipelines2048 - unified
ROPs64
Core Speed2200 (Boost) MHz
Theoretical Performance31 TFLOPS FP16, 20.5 TFLOPS FP32
CacheL3: 32 MB
Memory Speed18000 MHz
Memory Bus Width128 Bit
Memory TypeGDDR6
Max. Amount of Memory8 GB
Shared Memoryno
Memory Bandwidth288 GB/s
APIDirectX 12, Shader 6.4, OpenGL 4.6
Power Consumption100 Watt (75 - 100 Watt TGP)
Transistor Count13.3 Billion
Die Size 204 mm²
technology6 nm
Notebook Sizelarge
Date of Announcement05.01.2023
Link to Manufacturer Pagewww.amd.com

Benchmarks

3DMark - 3DMark Speed Way Score
1869 Points (13%)
3DMark - 3DMark Fire Strike Standard Score
21865 Points (33%)
3DMark - 3DMark Fire Strike Standard Graphics
24246 Points (22%)
3DMark - 3DMark Time Spy Score
10294 Points (27%)
3DMark - 3DMark Time Spy Graphics
10206 Points (21%)
Intel UHD Graphics 600
107.5 -99%
...
9300 -9%
9332 -9%
NVIDIA RTX PRO 2000 Blackwell Generation Laptop
9448 -7%
AMD Radeon 8050S
9502 -7%
9652 -5%
9770 -4%
9943 -3%
10043 -2%
10046 -2%
AMD Radeon RX 7700S
10206
NVIDIA GeForce RTX 2080 Super Mobile
10301 1%
10455 2%
10478 3%
10681 5%
10783 6%
10979 8%
11067 8%
11609 14%
11705 15%
...
Nvidia RTX PRO 5000 Blackwell Generation Laptop
23277 128%
max:
NVIDIA GeForce RTX 5090
44789 339%
0%
100%
Restrict / Search: Model: Max. age: years
3DMark 11 - 3DM11 Performance Score
32427 Points (39%)
3DMark 11 - 3DM11 Performance GPU
37918 Points (29%)
171.8 -100%
...
35101 -7%
NVIDIA GeForce RTX 2080 Super Mobile
35153 -7%
35286 -7%
35743 -6%
35944 -5%
36101 -5%
36164 -5%
AMD Radeon 8050S
36323 -4%
37375 -1%
AMD Radeon RX 7700S
37918
38052 0%
38259 1%
39029 3%
39402 4%
40391 7%
40462 7%
41630 10%
42016 11%
43219 14%
...
Nvidia RTX PRO 5000 Blackwell Generation Laptop
68271 80%
max:
NVIDIA GeForce RTX 5090
129772 242%
0%
100%
Restrict / Search: Model: Max. age: years
Cinebench R15
Cinebench R15 OpenGL 64 Bit +
Cinebench R15 - Cinebench R15 OpenGL 64 Bit
282 fps (16%)
Cinebench R15 OpenGL Ref. Match 64 Bit +
Cinebench R15 - Cinebench R15 OpenGL Ref. Match 64 Bit
97.9 % (98%)
Basemark GPU 1.2 - Basemark GPU 1.2 Vulkan Official Medium Offscreen 1080
104.6 fps (3%)
Basemark GPU 1.2 - Basemark GPU 1.2 Vulkan Official High Offscreen 2160
3.6 fps (1%)
Geekbench 6.5 - Geekbench 6.5 GPU OpenCL
73082 points (19%)
Geekbench 6.5 - Geekbench 6.5 GPU Vulkan
31001 points (8%)
Power Consumption - Furmark Stress Test Power Consumption - external Monitor *
167.5 Watt (23%)
0102030405060708090100110120130140150160Tooltip
Power Consumption - The Witcher 3 Power Consumption - external Monitor *
171.3 Watt (24%)
0102030405060708090100110120130140150160170Tooltip
Power Consumption - Witcher 3 Power Consumption *
171.9 Watt (38%)
0102030405060708090100110120130140150160170Tooltip
Power Consumption - Power Efficiency - Witcher 3 ultra external Monitor
0.6 fps per Watt (48%)
Emissions Witcher 3 Fan Noise +
Emissions - Witcher 3 Fan Noise
51.9 dB(A) (74%)
- Range of benchmark values
red legend - Average benchmark values
* Smaller numbers mean a higher performance

Game Benchmarks

The following benchmarks stem from our benchmarks of review laptops. The performance depends on the used graphics memory, clock rate, processor, system settings, drivers, and operating systems. So the results don't have to be representative for all laptops with this GPU. For detailed information on the benchmark results, click on the fps number.

low 1920x1080
100.7  fps    + Compare
med. 1920x1080
80.5  fps    + Compare
high 1920x1080
68.1  fps    + Compare
ultra 1920x1080
60.7  fps    + Compare
QHD 2560x1440
37.3  fps    + Compare
4K 3840x2160
15.8  fps    + Compare
» With all tested laptops playable in detail settings ultra.
Additional Benchmarks
Low Preset (FSR off) 1280x720
150.2
Ray Tracing Ultra Preset (DLSS off) 1920x1080
17.6
Ultra Preset (FSR2 on) 1920x1080
75.6
low 1920x1080
106.8  fps    + Compare
med. 1920x1080
88  fps    + Compare
high 1920x1080
76.4  fps    + Compare
ultra 1920x1080
73.6  fps    + Compare
QHD 2560x1440
51.1  fps    + Compare
4K 3840x2160
24.7  fps    + Compare
» With all tested laptops playable in detail settings ultra.
F1 22

F1 22

2022
low 1920x1080
251  fps    + Compare
med. 1920x1080
221  fps    + Compare
high 1920x1080
168  fps    + Compare
ultra 1920x1080
47.7  fps    + Compare
QHD 2560x1440
29.9  fps    + Compare
4K 3840x2160
11.3  fps    + Compare
» With all tested laptops playable in detail settings ultra.
Additional Benchmarks
Ultra Low Preset 16xAF TAA 1280x720
360
low 1920x1080
183.5  fps    + Compare
med. 1920x1080
140.4  fps    + Compare
high 1920x1080
92  fps    + Compare
ultra 1920x1080
71.2  fps    + Compare
QHD 2560x1440
47.3  fps    + Compare
4K 3840x2160
23.1  fps    + Compare
» With all tested laptops playable in detail settings ultra.
Strange Brigade

Strange Brigade

2018
low 1280x720
449  fps    + Compare
med. 1920x1080
202  fps    + Compare
high 1920x1080
167.4  fps    + Compare
ultra 1920x1080
143.9  fps    + Compare
QHD 2560x1440
91.9  fps    + Compare
4K 3840x2160
47.9  fps    + Compare
» With all tested laptops playable in detail settings ultra.
Far Cry 5

Far Cry 5

2018
low 1280x720
148  fps    + Compare + 📈 Graph
med. 1920x1080
130  fps    + Compare + 📈 Graph
high 1920x1080
123  fps    + Compare + 📈 Graph
ultra 1920x1080
117  fps    + Compare + 📈 Graph
QHD 2560x1440
81  fps    + Compare + 📈 Graph
4K 3840x2160
39  fps    + Compare + 📈 Graph
» With all tested laptops playable in detail settings ultra.
low 1280x720
97.6  fps    + Compare
med. 1920x1080
79.3  fps    + Compare
high 1920x1080
65  fps    + Compare
4K 3840x2160
46.8  fps    + Compare
» With all tested laptops playable in detail settings high.
low 1280x720
206  fps    + Compare
med. 1920x1080
106  fps    + Compare
high 1920x1080
74.8  fps    + Compare
QHD 2560x1440
54.5  fps    + Compare
4K 3840x2160
29  fps    + Compare
» With all tested laptops playable in detail settings high.
low 1280x720
174  fps    + Compare
med. 1366x768
159.8  fps    + Compare
high 1920x1080
156.5  fps    + Compare
ultra 1920x1080
136.8  fps    + Compare
4K 3840x2160
85.3  fps    + Compare
» With all tested laptops playable in detail settings ultra.
low 1024x768
392.2  fps    + Compare
med. 1366x768
277.5  fps    + Compare
high 1920x1080
147.1  fps    + Compare
ultra 1920x1080
84  fps    + Compare + 📈 Graph
4K 3840x2160
43  fps    + Compare
» With all tested laptops playable in detail settings ultra.
GTA V

GTA V

2015
low 1024x768
184  fps    + Compare
med. 1366x768
178.6  fps    + Compare
high 1920x1080
170.6  fps    + Compare
ultra 1920x1080
95.8  fps    + Compare
QHD 2560x1440
67.1  fps    + Compare
4K 3840x2160
68.4  fps    + Compare
» With all tested laptops playable in detail settings ultra.
Additional Benchmarks
Highest 16xAF 4xMSAA + FXAA 3840x2160
31.3
Normal/Off 4xAF 1920x1080
179
Lowest Settings possible 1920x1080
183.3
lowmed.highultraQHD4K
Cyberpunk 2077100.780.568.160.737.315.8
Baldur's Gate 3106.88876.473.651.124.7
F1 2225122116847.729.911.3
Tiny Tina's Wonderlands183.5140.49271.247.323.1
Strange Brigade449202167.4143.991.947.9
Far Cry 51481301231178139
X-Plane 11.1197.679.36546.8
Final Fantasy XV Benchmark20610674.854.529
Dota 2 Reborn174159.8156.5136.885.3
The Witcher 3392.2277.5147.18443
GTA V184178.6170.695.867.168.4
lowmed.highultraQHD4K
< 30 fps
< 60 fps
< 120 fps
≥ 120 fps


3
8


4
7


5
6

1
6
2
1
4
3
5
4
2

For more games that might be playable and a list of all games and graphics cards visit our Gaming List

Amazon Logo
  • $859.00
    ASUS TUF Gaming A16 Laptop 16" WUXGA 165Hz 7ms 100% sRGB AMD Octa-core Ryzen 7 7735HS 16GB RAM 512GB SSD AMD Radeon RX 7700S 8GB (>RTX4060) Backlit Type-C USB4 Fast Charging Win11 Pro ICP Accessory
  • $1,149.00
    ASUS TUF 16" Ryzen 7 Ultimate Gaming Laptop, 16" FHD+ 165Hz, AMD Ryzen 7 7735HS, AMD Radeon RX 7700S (Beats GeForce RTX 4060), 32GB DDR5 RAM, 1TB SSD, RGB Backlit KB, Wi-Fi 6, Windows 11 Home, Black
  • $859.00
    ASUS TUF Gaming A16 Laptop 16" WUXGA 165Hz 7ms 100% sRGB AMD Octa-core Ryzen 7 7735HS 16GB RAM 512GB SSD AMD Radeon RX 7700S 8GB (>RTX4060) Backlit Type-C USB4 Fast Charging Win11 Pro ICP Accessory
  • $849.00
    ASUS TUF Gaming A16 Laptop 16" FHD+ 165Hz 7ms 100% sRGB AMD Octa-core Ryzen 7 7735HS 16GB RAM 512GB SSD Radeon RX 7700S 8GB (>RTX4060) Backlit Type-C USB4 Fast Charging Win11 ICP Accessory
  • $879.00
    ASUS TUF Gaming A16 Laptop 16" WUXGA 165Hz 100% sRGB AMD 8-core Ryzen 7 7735HS 16GB RAM 512GB SSD Radeon RX 7700S 8GB (>RTX4060) Backlit USB4 Fast Charge AI Noise Cancelation Win11 w/ICP Accessory

v1.35
log 28. 00:59:11

#0 ran 0s before starting gpusingle class +0s ... 0s

#1 no ids found in url (should be separated by "_") +0s ... 0s

#2 not redirecting to Ajax server +0s ... 0s

#3 did not recreate cache, as it is less than 5 days old! Created at Mon, 26 Jan 2026 12:25:57 +0100 +0.001s ... 0.001s

#4 no comparison url found in template nbc.compare_page_1 needed +0.038s ... 0.039s

#5 no comparison url found in template nbc.compare_page_1 needed +0s ... 0.039s

#6 no comparison url found in template nbc.compare_page_1 needed +0s ... 0.04s

#7 no comparison url found in template nbc.compare_page_1 needed +0s ... 0.04s

#8 composed specs +0s ... 0.04s

#9 did output specs +0s ... 0.04s

#10 start showIntegratedCPUs +0s ... 0.04s

#11 getting avg benchmarks for device 11554 +0.013s ... 0.053s

#12 got single benchmarks 11554 +0.01s ... 0.063s

#13 got avg benchmarks for devices +0s ... 0.063s

#14 min, max, avg, median took s +0.379s ... 0.442s

#15 before gaming benchmark output +0s ... 0.442s

#16 Got 61 rows for game benchmarks. +0.037s ... 0.479s

#17 composed SQL query for gamebenchmarks +0s ... 0.479s

#18 got data and put it in $dataArray +0.007s ... 0.485s

#19 benchmarks composed for output. +0.124s ... 0.609s

#20 no comparison url found in template nbc.compare_page_1 needed +0.788s ... 1.397s

#21 return log +0s ... 1.397s

Please share our article, every link counts!
Mail Logo

» Comparison of GPUs
Detailed list of all laptop GPUs sorted by class and performance.

» Benchmark List
Sort and restrict laptop GPUs based on performance in synthetic benchmarks.

» Notebook Gaming List
Playable games for each graphics card and their average FPS results.

Class 1

Class 2

GeForce RTX 2080 Super Mobile
RTX PRO 2000 Blackwell Generation Laptop *
M1 Max 32-Core GPU *
GeForce RTX 2070 Super Mobile
M1 Max 24-Core GPU *
Radeon 8050S
Quadro RTX 5000 Max-Q
Radeon RX 5700M *
GeForce GTX 1080 Mobile
Quadro RTX 4000 (Laptop)
M1 Pro 16-Core GPU *
Radeon PRO W6600M *
GeForce RTX 2070 Super Max-Q
Quadro RTX 4000 Max-Q *
M1 Pro 14-Core GPU *
Quadro P5200
RTX PRO 1000 Blackwell Generation Laptop *
Quadro RTX 3000 Max-Q *
Quadro P4200
Radeon 8040S *
Pro A60M *

Class 3

Quadro P5000 Max-Q *
Quadro P4000
Arc 140T *
Pro A30M *
Quadro P4000 Max-Q
Quadro P3200
Radeon RX 580X (Laptop) *
Radeon RX 580 (Laptop)
Radeon Pro 5300M
Radeon RX 5300M
Quadro P3000 Max-Q *
Quadro T2000 Max-Q *
Radeon RX 570X (Laptop) *
Radeon RX 570 (Laptop) *
Quadro T1000 Max-Q *
Vega M GH
GeForce GTX 1050 Ti Mobile
Radeon 680M
Quadro P2000
Quadro P2000 Max-Q
T500 Laptop GPU *
Arc 130T
GeForce GTX 1050 Ti Max-Q *
Radeon Pro Vega 16
WX Vega M GL
GeForce GTX 1050 Max-Q *
Radeon 660M
Radeon Pro WX 4150 *
Radeon RX 560X (Laptop)
Radeon RX 560 (Laptop)
Quadro P1000
Xe MAX
Radeon Pro 560X
Radeon Pro 560
Quadro P620 *
Radeon RX 550X (Laptop)
Radeon Pro WX 3200 *
Radeon Pro 555X
Radeon Pro 555
Quadro P600
Graphics 3-Core iGPU (Arrow Lake) *
Radeon RX 540X *
Radeon Pro WX 2100 *
Radeon Pro WX 3100 *
Graphics 2-Core iGPU (Arrow Lake) *
Radeon 630
Radeon 540X *
Quadro P520
Intel Graphics 2 Xe3
Quadro P500 *
Iris Plus Graphics G7 (Ice Lake 64 EU) *
Vega 10 *
Vega 9
UHD Graphics Xe G4 48EUs *
UHD Graphics 32EUs
UHD Graphics Xe 32EUs (Tiger Lake-H) *
UHD Graphics 750
UHD Graphics 730
Vega 7
Vega 8
Iris Plus Graphics G4 (Ice Lake 48 EU)
Iris Plus Graphics 650
Radeon 625
Vega 6 *
Iris Plus Graphics 640
UHD Graphics 24EUs (Alder Lake-N) *
GeForce 920M
Radeon 620
Radeon 610
Radeon 610M *
Vega 6 *
UHD Graphics G1 (Ice Lake 32 EU)
UHD Graphics Xe 16EUs (Tiger Lake-H) *
Adreno 690 *
Adreno 685 *
Adreno 680 *
GeForce 910M

Class 4

* Approximate position of the graphics adapter