


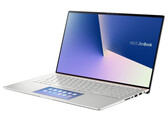
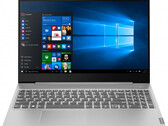
华硕ZenBook 15 UX534FTC笔记本电脑评测:雾面屏续航王者
华硕为这款超薄笔记本电脑配备了四核处理器和独立显卡。 其他方面的功能也很出色:雾面IPS屏幕,NVMe SSD,16 GB RAM(双通道),背光键盘。 最重要的是,出色的续航时间使它更加完美。
Intel Core i7-10510U, NVIDIA GeForce GTX 1650 Max-Q, 15.6", 1.6 kg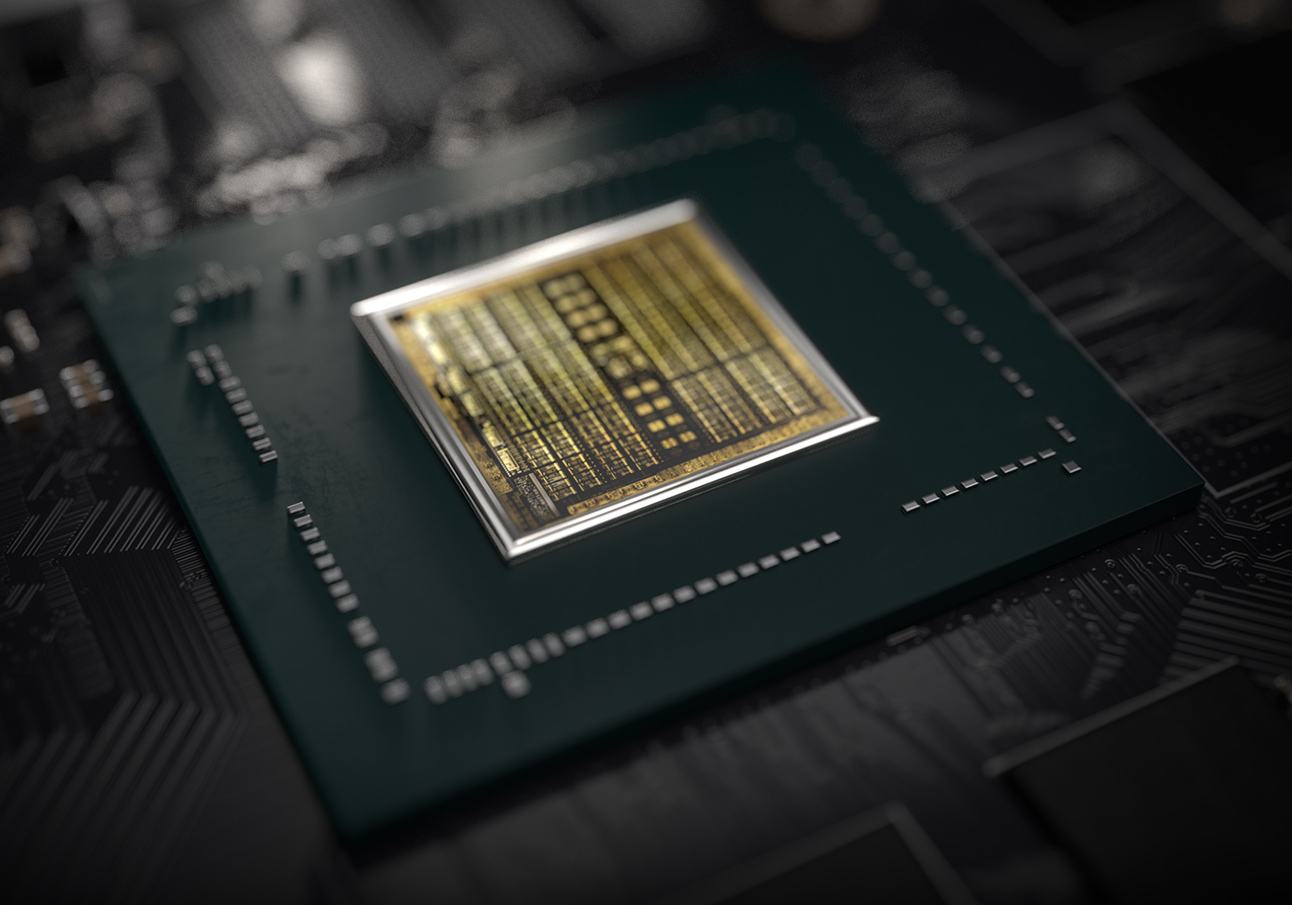
采用Max-Q设计的Nvidia GeForce GTX 1650是基于Turing架构(TU117芯片)的移动图形卡。与更快的RTX 2000 GPU(例如RTX 2060)相比,1650没有集成Raytracing或Tensor内核。与台式机版本相比,移动版和Max-Q版使用了TU117芯片的所有1024个着色器。它是为轻薄型笔记本电脑设计的,性能比普通的笔记本电脑GTX 1650差10-15%(取决于散热能力)。根据规格,Max-Q型号的基频低20%,睿频低27%。
性能应该比旧的GeForce GTX 1050 Ti Max-Q强一点。
Turing一代不仅为RTX卡引入了光追,而且还优化了内核和缓存的体系结构。根据Nvidia的说法,CUDA内核现在可以同时执行浮点和整数运算,以提高现代游戏中计算繁重的工作负载的性能。此外,也对缓存进行了重新设计(新的统一内存体系结构的缓存是Pascal的两倍)。与Pascal相比,这使得每个时钟指令增加高达50%,能耗提高40%。
与较大的Turing芯片(例如GTX 1660 Ti的TU116和RTX系列)相比,TU117不包括新的NVENC编码器,而是较旧的类似于Pascal和Volta中使用的编码器。
Nvidia规定功耗为35瓦TGP(总图形功率),因此比笔记本电脑的正常版(Max-P)1650低15瓦。因此,Max-Q型号非常适合轻薄笔记本电脑。 TU117芯片采用台积电12nm FFN工艺制成。
GeForce GTX 1600 Series
| ||||||||||||||||||||||||||||||||||
| Codename | N18P-G0 / N18P-G61 | |||||||||||||||||||||||||||||||||
| Architecture | Turing | |||||||||||||||||||||||||||||||||
| Pipelines | 1024 - unified | |||||||||||||||||||||||||||||||||
| TMUs | 64 | |||||||||||||||||||||||||||||||||
| ROPs | 32 | |||||||||||||||||||||||||||||||||
| Core Speed | 1020 - 1245 (Boost) MHz | |||||||||||||||||||||||||||||||||
| Memory Speed | 8000 effective = 1750 MHz | |||||||||||||||||||||||||||||||||
| Memory Bus Width | 128 Bit | |||||||||||||||||||||||||||||||||
| Memory Type | GDDR5, GDDR6 | |||||||||||||||||||||||||||||||||
| Max. Amount of Memory | 4 GB | |||||||||||||||||||||||||||||||||
| Shared Memory | no | |||||||||||||||||||||||||||||||||
| Memory Bandwidth | 112.1 GB/s | |||||||||||||||||||||||||||||||||
| API | DirectX 12_1, OpenGL 4.6 | |||||||||||||||||||||||||||||||||
| Power Consumption | 35 Watt | |||||||||||||||||||||||||||||||||
| Man. Technology | 12 nm | |||||||||||||||||||||||||||||||||
| PCIe | 3.0 | |||||||||||||||||||||||||||||||||
| Notebook Size | medium sized | |||||||||||||||||||||||||||||||||
| Date of Announcement | 23.04.2019 | |||||||||||||||||||||||||||||||||
| Link to Manufacturer Page | www.nvidia.com | |||||||||||||||||||||||||||||||||
The following benchmarks stem from our benchmarks of review laptops. The performance depends on the used graphics memory, clock rate, processor, system settings, drivers, and operating systems. So the results don't have to be representative for all laptops with this GPU. For detailed information on the benchmark results, click on the fps number.


For more games that might be playable and a list of all games and graphics cards visit our Gaming List
Asus VivoBook Pro 15 K3500PH: Intel Core i7-11370H, 15.60", 1.7 kg
External Review » Asus VivoBook Pro 15 K3500PH
MSI GV15 Thin 11SC-633: Intel Core i5-11400H, 15.60", 1.9 kg
External Review » MSI GV15 Thin 11SC-633
Acer Swift X SFX14-41G-R6BZ: AMD Ryzen 5 5500U, 14.00", 1.5 kg
External Review » Acer Swift X SFX14-41G-R6BZ
Acer Swift X SFX14-41G-R9Q5: AMD Ryzen 5 5500U, 14.00", 1.5 kg
External Review » Acer Swift X SFX14-41G-R9Q5
Asus ROG Flow X13 GV301QH-K6069T: AMD Ryzen 7 5800HS, 13.40", 1.3 kg
External Review » Asus ROG Flow X13 GV301QH-K6069T
Asus ZenBook Pro 15 UX535LH-BN150T : Intel Core i7-10870H, 15.60", 1.8 kg
External Review » Asus ZenBook Pro 15 UX535LH-BN150T
Asus ZenBook Pro 15 UX535LH-BN024T: Intel Core i5-10300H, 15.60", 1.8 kg
External Review » Asus ZenBook Pro 15 UX535LH-BN024T
Lenovo ThinkBook 15p IMH-20V30007GE: Intel Core i5-10300H, 15.60", 1.9 kg
External Review » Lenovo ThinkBook 15p IMH-20V30007GE
Asus ZenBook Flip 15 UX564PH-EZ007R: Intel Core i7-11370H, 15.60", 1.9 kg
External Review » Asus ZenBook Flip 15 UX564PH-EZ007R
MSI GF63 Thin 10SC-206: Intel Core i5-10300H, 15.60", 1.9 kg
External Review » MSI GF63 Thin 10SC-206
Asus ROG Flow X13 GV301QH-K6034T-BE: AMD Ryzen 7 5800HS, 13.40", 1.3 kg
External Review » Asus ROG Flow X13 GV301QH-K6034T-BE
MSI Prestige 15 A11SCX-019XES: Intel Core i7-1185G7, 15.60", 1.7 kg
External Review » MSI Prestige 15 A11SCX-019XES
MSI Prestige 15 A10SC-014: Intel Core i7-10710U, 15.60", 1.7 kg
External Review » MSI Prestige 15 A10SC-014
Asus ROG Flow X13 GV301QH: AMD Ryzen 9 5980HS, 13.40", 1.4 kg
External Review » Asus ROG Flow X13 GV301QH
Lenovo ThinkPad X1 Extreme-20QV000WGE: Intel Core i7-9750H, 15.60", 1.7 kg
External Review » Lenovo ThinkPad X1 Extreme-20QV000WGE
Microsoft Surface Book 3 13.5: Intel Core i7-1065G7, 13.50", 1.6 kg
External Review » Microsoft Surface Book 3 13.5
MSI Prestige 14 A10SC-009: Intel Core i7-10710U, 14.00", 1.3 kg
External Review » MSI Prestige 14 A10SC-009
Lenovo ThinkPad X1 Extreme G2-20QV000KUS: Intel Core i7-9850H, 15.60", 1.8 kg
External Review » Lenovo ThinkPad X1 Extreme G2-20QV000KUS
Razer Blade Stealth i7-1065G7, GTX 1650 Max-Q: Intel Core i7-1065G7, 13.30", 1.5 kg
External Review » Razer Blade Stealth i7-1065G7, GTX 1650 Max-Q
Lenovo ThinkPad X1 Extreme G2-20QV00CEGE: Intel Core i9-9880H, 15.60", 1.8 kg
External Review » Lenovo ThinkPad X1 Extreme G2-20QV00CEGE
Lenovo ThinkPad X1 Extreme G2-20QV00CMGE: Intel Core i7-9750H, 15.60", 1.7 kg
External Review » Lenovo ThinkPad X1 Extreme G2-20QV00CMGE
Lenovo Yoga C940-15IRH: Intel Core i7-9750H, 15.60", 2 kg
External Review » Lenovo Yoga C940-15IRH
MSI Prestige 15 A10SC-029NL: Intel Core i7-10710U, 15.60", 1.6 kg
External Review » MSI Prestige 15 A10SC-029NL
MSI Prestige 15 A10SC-044XES: Intel Core i7-10710U, 15.60", 1.7 kg
External Review » MSI Prestige 15 A10SC-044XES
MSI Prestige 14 A10SC-004NL: Intel Core i7-10710U, 14.00", 1.3 kg
External Review » MSI Prestige 14 A10SC-004NL
MSI Prestige 15 A10SC-060XES: Intel Core i7-10710U, 15.60", 1.7 kg
External Review » MSI Prestige 15 A10SC-060XES
Lenovo ThinkPad X1 Extreme G2-20QV000UGE: Intel Core i5-9300H, 15.60", 1.7 kg
External Review » Lenovo ThinkPad X1 Extreme G2-20QV000UGE
Asus ZenBook 15 UX534FT-DB77: Intel Core i7-8565U, 15.60", 1.7 kg
External Review » Asus ZenBook 15 UX534FT-DB77
Asus ZenBook 15 UX534FTC-A8078R: Intel Core i7-10510U, 15.60", 1.7 kg
External Review » Asus ZenBook 15 UX534FTC-A8078R
MSI Prestige 15 A10SC: Intel Core i7-10710U, 15.60", 1.7 kg
External Review » MSI Prestige 15 A10SC
Asus ZenBook 15 UX534FT-A8145T: Intel Core i7-8565U, 15.60", 1.7 kg
External Review » Asus ZenBook 15 UX534FT-A8145T
MSI Prestige 15 A10SC-011: Intel Core i7-10710U, 15.60", 1.6 kg
External Review » MSI Prestige 15 A10SC-011
Lenovo ThinkPad X1 Extreme G2-20QV000WGE: Intel Core i7-9750H, 15.60", 1.7 kg
External Review » Lenovo ThinkPad X1 Extreme G2-20QV000WGE
MSI GF63 9SC-662: Intel Core i5-9300H, 15.60", 1.9 kg
External Review » MSI GF63 9SC-662
MSI Prestige 14 i7-10710U: Intel Core i7-10710U, 14.00", 1.3 kg
External Review » MSI Prestige 14 i7-10710U
Lenovo Ideapad S540-15IWL 81SW001SMH: Intel Core i5-8265U, 15.60", 1.8 kg
External Review » Lenovo Ideapad S540-15IWL 81SW001SMH
MSI GF75 Thin 9SC-039XES: Intel Core i7-9750H, 15.60", 2.2 kg
External Review » MSI GF75 Thin 9SC-039XES
Asus ZenBook 15 UX534FT, i7-8565U: Intel Core i7-8565U, 15.60", 1.7 kg
External Review » Asus ZenBook 15 UX534FT, i7-8565U
MSI PS63 8SC-003NL: Intel Core i7-8565U, 15.60", 1.6 kg
External Review » MSI PS63 8SC-003NL
» Comparison of GPUs
Detailed list of all laptop GPUs sorted by class and performance.
» Benchmark List
Sort and restrict laptop GPUs based on performance in synthetic benchmarks.
» Notebook Gaming List
Playable games for each graphics card and their average FPS results.
* Approximate position of the graphics adapter
» Notebookcheck多媒体笔记本电脑Top 10排名
» Notebookcheck游戏笔记本电脑Top 10排名
» Notebookcheck低价办公/商务笔记本电脑Top 10排名
» Notebookcheck高端办公/商务笔记本电脑Top 10排名
» Notebookcheck工作站笔记本电脑Top 10排名
» Notebookcheck亚笔记本电脑Top 10排名
» Notebookcheck超级本产品Top 10排名
» Notebookcheck变形本产品Top 10排名
» Notebookcheck平板电脑Top 10排名
» Notebookcheck智能手机Top 10排名
» Notebookcheck评测过最出色的笔记本电脑屏幕
» Notebookcheck售价500欧元以下笔记本电脑Top 10排名
» Notebookcheck售价300欧元以下笔记本电脑Top 10排名