
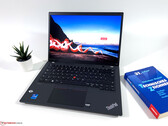
联想ThinkPad T14 G3评测--商务笔记本用英特尔和Nvidia更糟糕
在我们已经测试了采用AMD处理器的ThinkPad T14 G3之后,我们现在看看采用英特尔Core i7-1260P和专用GeForce MX550的版本。哪种配置能提供更高的性能和更长的电池寿命?而与快速的Radeon 680M iGPU相比,GeForce GPU是否值得购买?
Intel Core i7-1260P, NVIDIA GeForce MX550, 14", 1.5 kg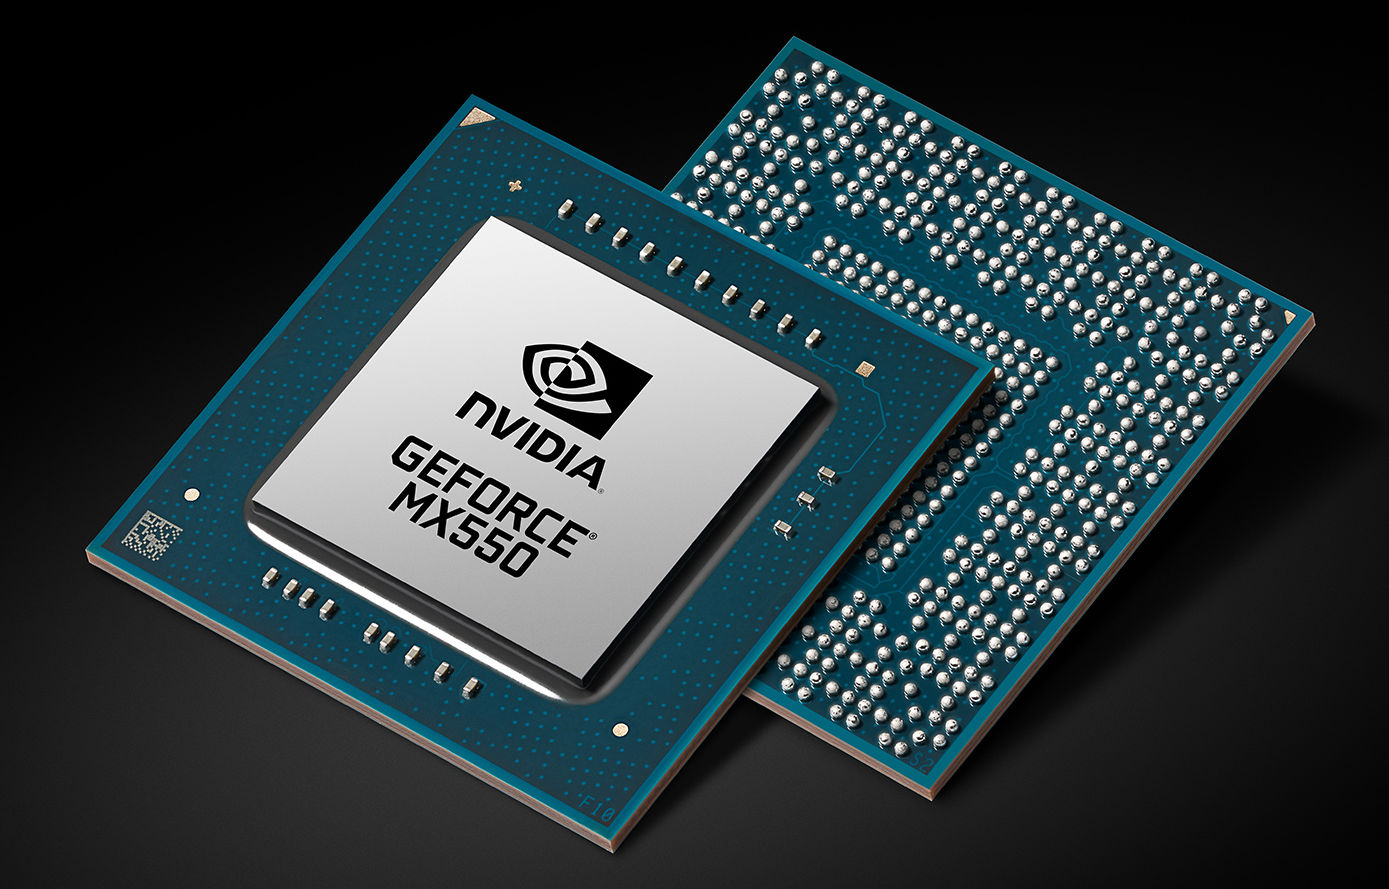
Nvidia GeForce MX550(GN18-S5-A1,TU117-670-A1芯片)是一款用于笔记本电脑的入门级移动显卡。它基于旧的图灵TU117芯片(与旧的MX450一样),使用64位内存总线和GDDR6显存。第一个基准测试显示,与旧的GeForce MX450相比,性能提高了17%,这可能表明有更多的着色器(1024而不是896)。名称相似的GeForce MX570的速度约为30%,使用Ampere GA107芯片。
游戏性能应该与老款的GeForce GTX 1050 Ti相似,因此要求高的游戏只能在低设置下流畅地运行。
TU117芯片采用12纳米台积电工艺制造,其额定功率为25瓦TGP(与旧版MX450一样)。
GeForce MX500 Series
| |||||||
| Codename | GN18-S5 | ||||||
| Architecture | Turing | ||||||
| Pipelines | 1024 - unified | ||||||
| Core Speed | 1320 (Boost) MHz | ||||||
| Memory Speed | 12000 MHz | ||||||
| Memory Bus Width | 64 Bit | ||||||
| Memory Type | GDDR6 | ||||||
| Shared Memory | no | ||||||
| API | DirectX 12_1, OpenGL 4.6 | ||||||
| Power Consumption | 15-25 Watt | ||||||
| Man. Technology | 12 nm | ||||||
| Features | Vulkan 1.2, OpenGL 4.6, OpenCL 3.0, GPU Boost, Optimus, PCIe 4.0, Game Ready Drivers, Win 10 / 11 | ||||||
| Date of Announcement | 17.12.2021 | ||||||
The following benchmarks stem from our benchmarks of review laptops. The performance depends on the used graphics memory, clock rate, processor, system settings, drivers, and operating systems. So the results don't have to be representative for all laptops with this GPU. For detailed information on the benchmark results, click on the fps number.


| low | med. | high | ultra | QHD | 4K | |
|---|---|---|---|---|---|---|
| F1 22 | 59.4 | 51.3 | 41.2 | 28.1 | ||
| Ghostwire Tokyo | 35.8 | 35.5 | 35.1 | 33.2 | ||
| GRID Legends | 85 | 70 | 44 | 30 | ||
| God of War | 36 | 28 | 7 | |||
| Farming Simulator 22 | 169 | 80 | 60 | 42 | ||
| Forza Horizon 5 | 119 | 47 | 31 | 12 | ||
| F1 2021 | 166 | 63 | 51 | 28 | ||
| Cyberpunk 2077 1.0 | 31 | 24 | 17 | 7 | ||
| Strange Brigade | 152 | 60 | 52 | 42 | ||
| Far Cry 5 | 100 | 45 | 38 | 35 | ||
| X-Plane 11.11 | 106 | 88 | 70 | |||
| Final Fantasy XV Benchmark | 75 | 36 | 22 | |||
| Dota 2 Reborn | 142 | 127 | 111 | 104 | ||
| The Witcher 3 | 154 | 92 | 50 | 27 | ||
| GTA V | 163 | 154 | 76 | 34 | ||
| low | med. | high | ultra | QHD | 4K | < 30 fps < 60 fps < 120 fps ≥ 120 fps | 4 5 6 | 2 5 6 2 | 3 8 4 | 4 6 1 | | 1 |
For more games that might be playable and a list of all games and graphics cards visit our Gaming List
Acer Aspire 5 A517-53G-757V: Intel Core i7-1255U, 17.30", 2.3 kg
External Review » Acer Aspire 5 A517-53G-757V
Acer Aspire 5 A515-57G-57CW: Intel Core i5-1235U, 15.60", 1.8 kg
External Review » Acer Aspire 5 A515-57G-57CW
Acer Aspire 5 A515-57G-74D3: Intel Core i7-1255U, 15.60", 1.8 kg
External Review » Acer Aspire 5 A515-57G-74D3
HP Pavilion Plus 14-eh0754ng: Intel Core i5-1235U, 14.00", 1.4 kg
External Review » HP Pavilion Plus 14-eh0754ng
Xiaomi Notebook Pro 120G: Intel Core i5-12450H, 14.00", 1.4 kg
External Review » Xiaomi Notebook Pro 120G
Xiaomi RedmiBook Pro 14 2022, i5-12450H MX550: Intel Core i5-12450H, 14.00", 1.5 kg
External Review » Xiaomi RedmiBook Pro 14 2022, i5-12450H MX550
HP 15-dw4020nu: Intel Core i7-1255U, 15.60", 1.8 kg
External Review » HP 15-dw4020nu
Dell Latitude 15 5531, i5-12600H MX550: Intel Core i5-12600H, 15.60", 1.8 kg
External Review » Dell Latitude 15 5531, i5-12600H MX550
» Comparison of GPUs
Detailed list of all laptop GPUs sorted by class and performance.
» Benchmark List
Sort and restrict laptop GPUs based on performance in synthetic benchmarks.
» Notebook Gaming List
Playable games for each graphics card and their average FPS results.
* Approximate position of the graphics adapter
» Notebookcheck多媒体笔记本电脑Top 10排名
» Notebookcheck游戏笔记本电脑Top 10排名
» Notebookcheck低价办公/商务笔记本电脑Top 10排名
» Notebookcheck高端办公/商务笔记本电脑Top 10排名
» Notebookcheck工作站笔记本电脑Top 10排名
» Notebookcheck亚笔记本电脑Top 10排名
» Notebookcheck超级本产品Top 10排名
» Notebookcheck变形本产品Top 10排名
» Notebookcheck平板电脑Top 10排名
» Notebookcheck智能手机Top 10排名
» Notebookcheck评测过最出色的笔记本电脑屏幕
» Notebookcheck售价500欧元以下笔记本电脑Top 10排名
» Notebookcheck售价300欧元以下笔记本电脑Top 10排名