



Notebookcheck Logo

Qualcomm Adreno X2-85

Qualcomm X2-85

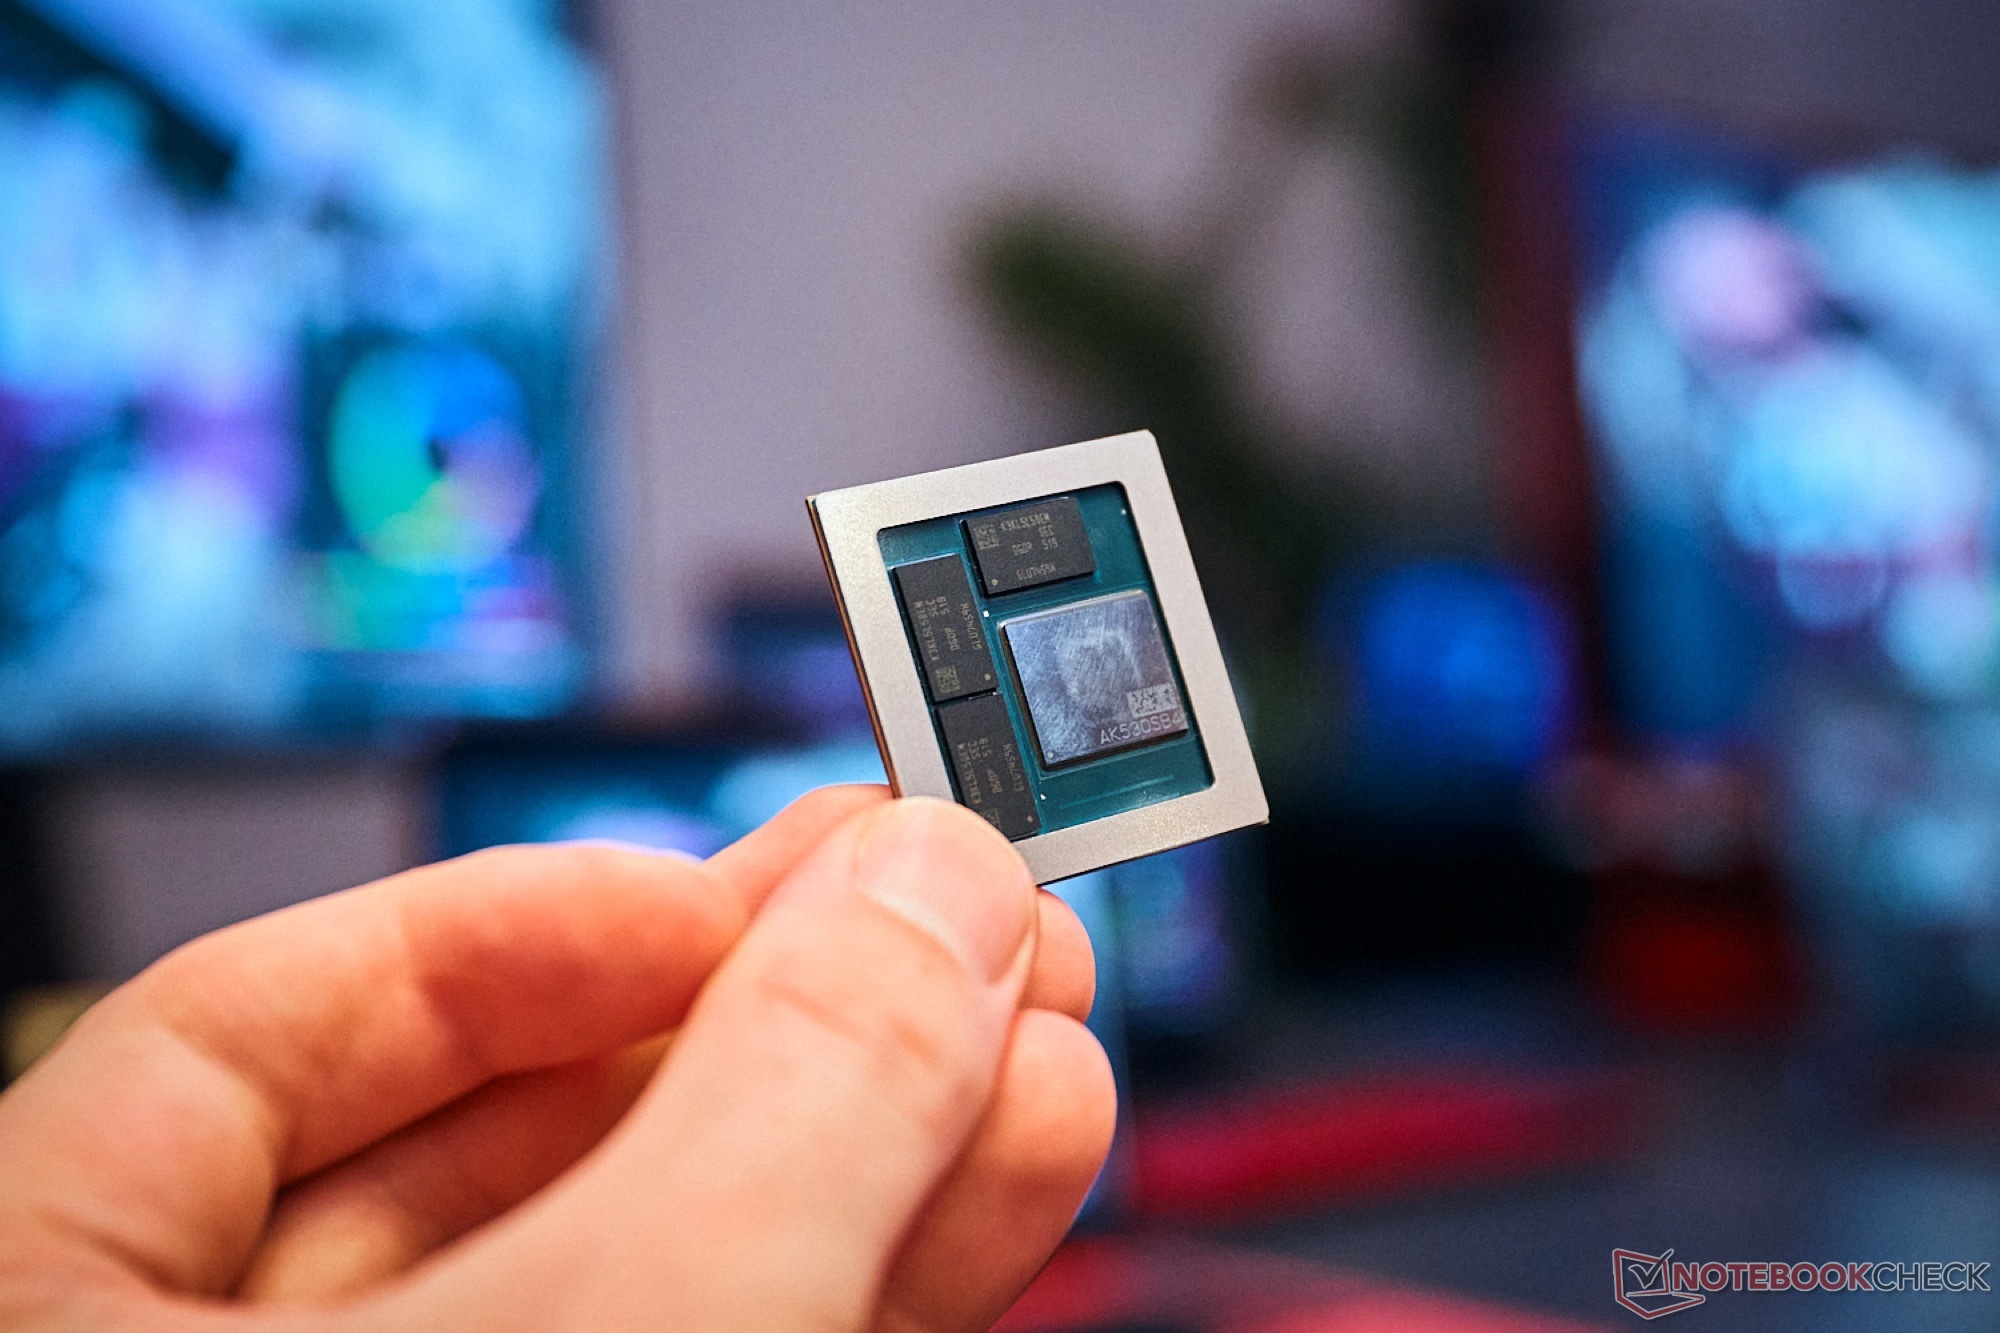
高通公司的 Adreno X2-85 是最慢的骁龙 X2 Elite SoC(例如:骁龙 X2E-80-100)中的快速集成显卡。 骁龙 X2E-80-100)中的快速集成显卡,时钟频率高达 1700 MHz。与速度更快的 X2-90 相比,目前只知道较慢的时钟频率。

Adreno iGPU 支持 DirectX 12.2 Ultimate、Vulkan 1.4 和 OpenCL 3.0。根据高通公司的说法,还对光线追踪进行了改进(硬件支持)。

SoC 采用台积电的现代 3NP 工艺制造,应该会有不错的效率。

iGPUIntegrated Graphics
Core Speed1700 (Boost) MHz
Shared Memoryyes
APIDirectX 12_2, OpenCL 3.0, Vulkan 1.4
Man. Technology3 nm
Date of Announcement29.09.2025
CPU in X2-85GPU Base SpeedGPU Boost / Turbo
Qualcomm Snapdragon X2 Elite X2E-84-10012 x 3400 MHz? MHz1700 MHz
Qualcomm Snapdragon X2 Elite X2E-80-10012 x 3400 MHz? MHz1700 MHz
Qualcomm Snapdragon X2 Elite X2E-78-10012 x 3400 MHz? MHz1350 MHz
min. - max.? MHz1350 - 1700 MHz

Benchmarks

3DMark - 3DMark Steel Nomad
711 Points (5%)
3DMark - 3DMark Steel Nomad Light
min: 3464     avg: 3964     median: 4124 (9%)     max: 4142 Points
3DMark - 3DMark Solar Bay
18104 Points (7%)
3DMark - 3DMark Fire Strike Standard Score
7218 Points (11%)
3DMark - 3DMark Fire Strike Standard Graphics
7617 Points (7%)
3DMark - 3DMark Time Spy Score
2926 Points (8%)
3DMark - 3DMark Time Spy Graphics
2605 Points (5%)
Intel UHD Graphics 600
107.5 -96%
...
AMD Radeon 680M
2214 -15%
NVIDIA GeForce GTX 1050 Ti Max-Q
2245 -14%
2260 -13%
2262 -13%
NVIDIA GeForce GTX 1050 Ti Mobile
2309 -11%
Intel Arc Graphics 130T
2378 -9%
2430 -7%
2472 -5%
2601 0%
Qualcomm Adreno X2-85
2605
2657 2%
2766 6%
2805 8%
AMD Radeon HD 8970M Crossfire
2827 9%
2864 10%
2866 10%
2881 11%
AMD Radeon RX Vega M GH
2908 12%
2993 15%
...
NVIDIA RTX PRO 5000 Blackwell Generation Laptop
23277 794%
max:
NVIDIA GeForce RTX 5090
44063 1591%
0%
100%
Restrict / Search: Model: Max. age: years
3DMark 11 - 3DM11 Performance Score
9002 Points (11%)
3DMark 11 - 3DM11 Performance GPU
8565 Points (7%)
171.8 -98%
...
8067 -6%
8129 -5%
Intel Iris Xe MAX Graphics
8133 -5%
8133 -5%
NVIDIA Quadro P2000 Max-Q
8148 -5%
NVIDIA Quadro M3000M
8289 -3%
AMD Radeon RX 560 (Laptop)
8323 -3%
NVIDIA Quadro P2000
8387 -2%
8553 0%
Qualcomm Adreno X2-85
8565
AMD Radeon R9 M395
8656 1%
NVIDIA GeForce GTX 1050 Ti Max-Q
8781 3%
AMD Radeon R9 M295X
8851 3%
Intel Arc Graphics 130T
9183 7%
9448 10%
NVIDIA GeForce GTX 770M SLI
9569 12%
NVIDIA GeForce GTX 1050 Ti Mobile
9591 12%
AMD FirePro W7170M
9708 13%
9709 13%
...
NVIDIA RTX PRO 5000 Blackwell Generation Laptop
68271 697%
max:
NVIDIA GeForce RTX 5090
129772 1415%
0%
100%
Restrict / Search: Model: Max. age: years
3DMark Vantage
3DM Vant. Perf. total +
3DMark Vantage - 3DM Vant. Perf. total
34888 Points (10%)
3DM Vant. Perf. GPU no PhysX +
3DMark Vantage - 3DM Vant. Perf. GPU no PhysX
34027 Points (19%)
Restrict / Search: Model: Max. age: years
3DMark 06 3DMark 06 - Standard 1280x1024 +
3DMark 06
23647 Points (31%)
Unigine Valley 1.0 - Unigine Valley 1.0 DX
21.1 fps (6%)
Cinebench R10 Cinebench R10 Shading (32bit) +
Cinebench R10 - Cinebench R10 Shading (32bit)
11700 points (8%)
Geekbench 6.7 - Geekbench 6.7.1 GPU OpenCL
25013 points (6%)
Geekbench 6.7 - Geekbench 6.7.1 GPU Vulkan
29039 points (7%)
LuxMark v2.0 64Bit - LuxMark v2.0 Room GPU
584 Samples/s (2%)
LuxMark v2.0 64Bit - LuxMark v2.0 Sala GPU
1688 Samples/s (3%)
ComputeMark v2.1 - ComputeMark v2.1 Result
6907 points (6%)
Power Consumption - Furmark Stress Test Power Consumption - external Monitor *
25.6 Watt (3%)
0510152025303540Tooltip
Power Consumption - Cyberpunk 2077 Power Consumption 150cd *
20.3 Watt (6%)
051015202530Tooltip
Power Consumption - Cyberpunk 2077 Power Consumption - external Monitor *
33.7 Watt (4%)
05101520253035Tooltip
Power Consumption - Power Efficiency - Cyberpunk 2077 ultra
0.6 fps per Watt (2%)
- Range of benchmark values
red legend - Average benchmark values
* Smaller numbers mean a higher performance

Game Benchmarks

The following benchmarks stem from our benchmarks of review laptops. The performance depends on the used graphics memory, clock rate, processor, system settings, drivers, and operating systems. So the results don't have to be representative for all laptops with this GPU. For detailed information on the benchmark results, click on the fps number.

low 1920x1080
40.7  fps    + Compare
med. 1920x1080
31.9  fps    + Compare
high 1920x1080
27.2  fps    + Compare
ultra 1920x1080
23.9  fps    + Compare
» With all tested laptops playable in detail settings low.
Additional Benchmarks
30min Start Ultra Preset (FSR off) 1920x1080
20.4
low 1920x1080
39.4  fps    + Compare + 📈 Graph
med. 1920x1080
29.3  fps    + Compare + 📈 Graph
high 1920x1080
25.6  fps    + Compare + 📈 Graph
ultra 1920x1080
25  fps    + Compare + 📈 Graph
» With all tested laptops playable in detail settings low.
Strange Brigade

Strange Brigade

2018
low 1280x720
196.2  fps    + Compare
med. 1920x1080
70.4  fps    + Compare
high 1920x1080
57.6  fps    + Compare
ultra 1920x1080
48.3  fps    + Compare
» With all tested laptops playable in detail settings ultra.
low 1280x720
54.7  fps    + Compare
med. 1920x1080
48  fps    + Compare
high 1920x1080
40.4  fps    + Compare
» With all tested laptops playable in detail settings high.
low 1280x720
79.6  fps    + Compare
med. 1920x1080
42.9  fps    + Compare
high 1920x1080
23.1  fps    + Compare
» With all tested laptops playable in detail settings med..
low 1280x720
91.8  fps    + Compare
med. 1366x768
76.2  fps    + Compare
high 1920x1080
68.1  fps    + Compare
ultra 1920x1080
60.9  fps    + Compare
» With all tested laptops playable in detail settings ultra.
GTA V

GTA V

2015
low 1024x768
135.9  fps    + Compare
med. 1366x768
127.5  fps    + Compare
high 1920x1080
62.5  fps    + Compare
ultra 1920x1080
27.2  fps    + Compare
» With all tested laptops playable in detail settings high.
lowmed.highultraQHD4K
Cyberpunk 207740.731.927.223.9
Baldur's Gate 339.429.325.625
Strange Brigade196.270.457.648.3
X-Plane 11.1154.74840.4
Final Fantasy XV Benchmark79.642.923.1
Dota 2 Reborn91.876.268.160.9
GTA V135.9127.562.527.2
lowmed.highultraQHD4K
< 30 fps
< 60 fps
< 120 fps
≥ 120 fps

3
2
2
1
3
2
1
3
2
2
3
1
1


For more games that might be playable and a list of all games and graphics cards visit our Gaming List

Amazon Logo
  • ASUS Vivobook 14 Laptop, 14” WUXGA 60Hz Display, Qualcomm Snapdragon X, Qualcomm Adreno GPU, 16GB RAM, 512GB SSD, Windows 11, Cool Silver, X1407QA-BS56

v1.35
log 22. 11:28:34

#0 ran 0s before starting gpusingle class +0s ... 0s

#1 no ids found in url (should be separated by "_") +0s ... 0s

#2 not redirecting to Ajax server +0s ... 0s

#3 did not recreate cache, as it is less than 5 days old! Created at Wed, 22 Jul 2026 05:30:55 +0200 +0.003s ... 0.003s

#4 composed specs +0.006s ... 0.009s

#5 did output specs +0s ... 0.009s

#6 start showIntegratedCPUs +0s ... 0.009s

#7 getting avg benchmarks for device 13266 +0.017s ... 0.025s

#8 got single benchmarks 13266 +0.008s ... 0.033s

#9 got avg benchmarks for devices +0s ... 0.033s

#10 min, max, avg, median took s +1.116s ... 1.149s

#11 before gaming benchmark output +0s ... 1.149s

#12 Got 26 rows for game benchmarks. +0.009s ... 1.158s

#13 composed SQL query for gamebenchmarks +0s ... 1.158s

#14 got data and put it in $dataArray +0.004s ... 1.162s

#15 benchmarks composed for output. +0.104s ... 1.266s

#16 no comparison url found in template nbc.compare_page_1 needed +0.27s ... 1.536s

#17 return log +0s ... 1.536s

Google LogoAdd as a preferred source on Google
Mail Logo

» Comparison of GPUs
Detailed list of all laptop GPUs sorted by class and performance.

» Benchmark List
Sort and restrict laptop GPUs based on performance in synthetic benchmarks.

» Notebook Gaming List
Playable games for each graphics card and their average FPS results.

Class 1

Class 2

GeForce RTX 2080 Super Mobile
RTX PRO 2000 Blackwell Generation Laptop
M5 Max 32-Core GPU *
M1 Max 32-Core GPU *
M1 Max 24-Core GPU *
GeForce RTX 2070 Super Mobile
Radeon 8050S
Quadro RTX 5000 Max-Q
Radeon RX 5700M *
Quadro RTX 4000 (Laptop)
GeForce GTX 1080 Mobile
M1 Pro 16-Core GPU *
Radeon PRO W6600M *
GeForce RTX 2070 Super Max-Q
RTX PRO 1000 Blackwell Generation Laptop *
M1 Pro 14-Core GPU *
Quadro RTX 4000 Max-Q
Quadro RTX 3000 Max-Q
Radeon 8040S *
Pro A60M *

Class 3

Pro A30M
Radeon Pro 5300M
Radeon RX 5300M
GeForce GTX 1050 Ti Mobile
GeForce GTX 1050 Ti Max-Q
Radeon 680M
T500 Laptop GPU
Arc 130T
Radeon Pro Vega 16
GeForce GTX 1050 Max-Q
Radeon 660M
Xe MAX
Radeon Pro 560X
Radeon Pro 560
Quadro P620
Radeon RX 550X (Laptop)
Radeon Pro WX 3200 *
Radeon Pro 555X
Radeon Pro 555
Graphics 3-Core iGPU (Arrow Lake) *
Graphics 2-Core iGPU (Arrow Lake) *
Radeon 630
Quadro P520
Radeon 540X *
Vega 10
Vega 9
UHD Graphics 32EUs
UHD Graphics 750
Vega 7
UHD Graphics Xe 32EUs (Tiger Lake-H)
UHD Graphics Xe G4 48EUs
Vega 8
UHD Graphics 730
Vega 6 *
UHD Graphics 24EUs (Alder Lake-N) *
Radeon 610M *
Vega 6 *
UHD Graphics Xe 16EUs *
Adreno 690 *
Adreno 685 *
Adreno 680 *

Class 4

* Approximate position of the graphics adapter