


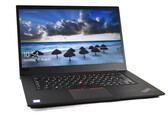
联想ThinkPad P1 2019笔记本电脑评测:GPU变强CPU变弱的超薄工作站
联想已将其第二代超薄高端ThinkPad P1工作站推向市场。 搭载包括基于Turing的最新Nvidia Quadro GPU,更亮的显示选项以及最新的Intel处理器。 但是,Lenovo ThinkPad P1 Gen 2在所有方面都显示出CPU性能的某些弱点。
Intel Core i7-9850H, NVIDIA Quadro T1000 (Laptop), 15.6", 1.7 kg
用于笔记本电脑的Nvidia Quadro T1000是基于Turing架构(TU117芯片)的专业移动图形卡。与消费类GTX 1650相比,Quadro T1000具有更少的CUDA内核/着色器(768比896)。 Quadro T2000使用相同的TU117芯片,但具有全部1024个内核(是T1000的2倍),因此性能要强得多。该芯片基于台积电的12nm FinFET制造。
Turing一代不仅为RTX卡引入了光追,而且还优化了内核和缓存的体系结构。根据Nvidia的说法,CUDA内核现在可以同时执行浮点和整数运算,以提高现代游戏中计算繁重的工作负载的性能。此外,也对缓存进行了重新设计(新的统一内存体系结构的缓存是Pascal的两倍)。与Pascal相比,这使得每个时钟指令增加高达50%,能耗提高40%。
与更快的Quadro RTX卡不同,T1000和T2000不具有光线追踪和Tensor内核。
Quadro Turing Series
| ||||||||||||||||||||||||||||||||||||||||||||||||||||
| Codename | N19P-Q1 | |||||||||||||||||||||||||||||||||||||||||||||||||||
| Architecture | Turing | |||||||||||||||||||||||||||||||||||||||||||||||||||
| Pipelines | 768 - unified | |||||||||||||||||||||||||||||||||||||||||||||||||||
| Core Speed | 1395 - 1455 (Boost) MHz | |||||||||||||||||||||||||||||||||||||||||||||||||||
| Memory Speed | 8000 MHz | |||||||||||||||||||||||||||||||||||||||||||||||||||
| Memory Bus Width | 128 Bit | |||||||||||||||||||||||||||||||||||||||||||||||||||
| Memory Type | GDDR5 | |||||||||||||||||||||||||||||||||||||||||||||||||||
| Max. Amount of Memory | 4 GB | |||||||||||||||||||||||||||||||||||||||||||||||||||
| Shared Memory | no | |||||||||||||||||||||||||||||||||||||||||||||||||||
| API | DirectX 12_1, OpenGL 4.6 | |||||||||||||||||||||||||||||||||||||||||||||||||||
| Power Consumption | 50 Watt | |||||||||||||||||||||||||||||||||||||||||||||||||||
| Man. Technology | 12 nm | |||||||||||||||||||||||||||||||||||||||||||||||||||
| Notebook Size | medium sized | |||||||||||||||||||||||||||||||||||||||||||||||||||
| Date of Announcement | 27.05.2019 | |||||||||||||||||||||||||||||||||||||||||||||||||||
The following benchmarks stem from our benchmarks of review laptops. The performance depends on the used graphics memory, clock rate, processor, system settings, drivers, and operating systems. So the results don't have to be representative for all laptops with this GPU. For detailed information on the benchmark results, click on the fps number.


For more games that might be playable and a list of all games and graphics cards visit our Gaming List
HP ZBook Fury 17 G7-2C9X7EA: Intel Core i7-10750H, 17.30", 3 kg
External Review » HP ZBook Fury 17 G7-2C9X7EA
Acer ConceptD 3 Ezel Pro CC314-72P-75P3: Intel Core i7-10750H, 14.00", 2 kg
External Review » Acer ConceptD 3 Ezel Pro CC314-72P-75P3
Asus ProArt StudioBook Pro X W730G1T-H8004R: Intel Core i7-9750H, 17.00", 2.5 kg
External Review » Asus ProArt StudioBook Pro X W730G1T-H8004R
Acer ConceptD 5 Pro CN515-71P-767Y: Intel Core i7-9750H, 15.60", 2.5 kg
External Review » Acer ConceptD 5 Pro CN515-71P-767Y
Acer ConceptD 3 Pro CN315-71P-73W1: Intel Core i7-9750H, 15.60", 2.4 kg
External Review » Acer ConceptD 3 Pro CN315-71P-73W1
Lenovo ThinkPad P53-20QN002VMX: Intel Core i7-9750H, 15.60", 2.5 kg
External Review » Lenovo ThinkPad P53-20QN002VMX
Acer ConceptD 5 Pro CN515-71P (i7-9750H, Quadro T1000): Intel Core i7-9750H, 15.60", 2.5 kg
External Review » Acer ConceptD 5 Pro CN515-71P (i7-9750H, Quadro T1000)
Lenovo ThinkPad P1 20QT000LMH : Intel Core i7-9750H, 15.60", 1.7 kg
External Review » Lenovo ThinkPad P1 20QT000LMH
Lenovo ThinkPad P53-20QNS00Q00: Intel Core i5-9400H, 15.60", 2.5 kg
External Review » Lenovo ThinkPad P53-20QNS00Q00
» Comparison of GPUs
Detailed list of all laptop GPUs sorted by class and performance.
» Benchmark List
Sort and restrict laptop GPUs based on performance in synthetic benchmarks.
» Notebook Gaming List
Playable games for each graphics card and their average FPS results.
* Approximate position of the graphics adapter
» Notebookcheck多媒体笔记本电脑Top 10排名
» Notebookcheck游戏笔记本电脑Top 10排名
» Notebookcheck低价办公/商务笔记本电脑Top 10排名
» Notebookcheck高端办公/商务笔记本电脑Top 10排名
» Notebookcheck工作站笔记本电脑Top 10排名
» Notebookcheck亚笔记本电脑Top 10排名
» Notebookcheck超级本产品Top 10排名
» Notebookcheck变形本产品Top 10排名
» Notebookcheck平板电脑Top 10排名
» Notebookcheck智能手机Top 10排名
» Notebookcheck评测过最出色的笔记本电脑屏幕
» Notebookcheck售价500欧元以下笔记本电脑Top 10排名
» Notebookcheck售价300欧元以下笔记本电脑Top 10排名