


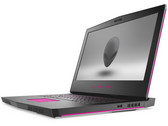
外星人 15 R3 (i7-7820HK, GTX 1080 Max-Q, Full-HD) 笔记本电脑简短评测
游戏界明星。 外星人 15 R3拥有一个哑光的 60-Hz IPS屏幕,它支持Nvidia's G-Sync技术。强劲性能,足以顺畅运行当下的所有游戏。
Intel Core i7-7820HK, NVIDIA GeForce GTX 1080 Max-Q, 15.6", 3.6 kg采用Max-Q设计的英伟达GeForce GTX 1080是来自Pascal系列的移动高端显卡。它是专为轻薄笔记本电脑设计。比笔记本电脑中普通的GTX 1080慢10-15%左右(需要考虑散热能力)。基础频率(1101-1290 MHz)也比常规GTX 1080(1566 MHz,至少少18%)低很多,而睿频(1278-1458 MHz)也比常规的GTX 1080的1733 MHz低得多(至少少16%)然而,内存的时钟频率是相同的。
时钟频率不是它与常规的GTX 1080的唯一区别。Max-Q版本的驱动程序针对效率(而不是性能)进行了优化,优化的电压转换器可用于1V操作,拥有高端冷却方法以及40 dB的风扇噪声限制(靠着时钟频率的调整)。
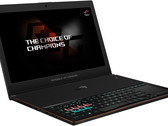
性能比GTX 1080(至少在华硕Zephyrus上)更接近普通(Max-P)GeForce GTX 1070。因此,即便是要求最苛刻的游戏,也应该可以在全高清和最大细节设置下运行(请参阅下面的游戏基准)。
特点
GP104芯片采用台积电16nm FinFET工艺制造,提供了一系列新功能。DisplayPort 1.4(Ready),HDMI 2.0b,HDR,同时多投影(SMP),以及改良后的H.265视频编解码器(用于PlayReady 3.0)只是其中一部分功能。有关更多详细信息,请参阅我们的Pascal体系构架页面。
英伟达称,Max-Q设计的功耗显着低于笔记本电脑中的普通GTX 1080显卡,范围在90到110瓦(TGP)。
GeForce GTX 1000 Series
| ||||||||||||||||||||||||||||||||||||||||||||||||||||||||||||||||
| Codename | N17E-G3 Max-Q | |||||||||||||||||||||||||||||||||||||||||||||||||||||||||||||||
| Architecture | Pascal | |||||||||||||||||||||||||||||||||||||||||||||||||||||||||||||||
| Pipelines | 2560 - unified | |||||||||||||||||||||||||||||||||||||||||||||||||||||||||||||||
| Core Speed | 1101 - 1290 - 1278 - 1468 (Boost) MHz | |||||||||||||||||||||||||||||||||||||||||||||||||||||||||||||||
| Memory Speed | 10000 MHz | |||||||||||||||||||||||||||||||||||||||||||||||||||||||||||||||
| Memory Bus Width | 256 Bit | |||||||||||||||||||||||||||||||||||||||||||||||||||||||||||||||
| Memory Type | GDDR5X | |||||||||||||||||||||||||||||||||||||||||||||||||||||||||||||||
| Max. Amount of Memory | 8 GB | |||||||||||||||||||||||||||||||||||||||||||||||||||||||||||||||
| Shared Memory | no | |||||||||||||||||||||||||||||||||||||||||||||||||||||||||||||||
| API | DirectX 12_1, OpenGL 4.5 | |||||||||||||||||||||||||||||||||||||||||||||||||||||||||||||||
| Power Consumption | 90 - 110 Watt | |||||||||||||||||||||||||||||||||||||||||||||||||||||||||||||||
| Transistor Count | 7.2 Billion | |||||||||||||||||||||||||||||||||||||||||||||||||||||||||||||||
| Man. Technology | 16 nm | |||||||||||||||||||||||||||||||||||||||||||||||||||||||||||||||
| Features | Multi-Projection, VR Ready, G-SYNC, Vulkan, Multi Monitor | |||||||||||||||||||||||||||||||||||||||||||||||||||||||||||||||
| Notebook Size | large | |||||||||||||||||||||||||||||||||||||||||||||||||||||||||||||||
| Date of Announcement | 30.05.2017 | |||||||||||||||||||||||||||||||||||||||||||||||||||||||||||||||
The following benchmarks stem from our benchmarks of review laptops. The performance depends on the used graphics memory, clock rate, processor, system settings, drivers, and operating systems. So the results don't have to be representative for all laptops with this GPU. For detailed information on the benchmark results, click on the fps number.


For more games that might be playable and a list of all games and graphics cards visit our Gaming List
Asus Zephyrus GX501GI: Intel Core i7-8750H, 15.60", 2.3 kg
External Review » Asus Zephyrus GX501GI
Alienware 15 R3 Max-Q: Intel Core i7-7820HK, 15.60", 3.6 kg
External Review » Alienware 15 R3 Max-Q
Asus Zephyrus GX501VIK: Intel Core i7-7700HQ, 15.60", 2.3 kg
External Review » Asus Zephyrus GX501VIK
Asus Zephyrus GX501VI-XS74: Intel Core i7-7700HQ, 15.60", 2.3 kg
External Review » Asus Zephyrus GX501VI-XS74
Asus Zephyrus GX501: Intel Core i7-7700HQ, 15.60", 2.3 kg
External Review » Asus Zephyrus GX501
Acer Predator Triton 700: Intel Core i7-7700HQ, 15.60", 2.4 kg
External Review » Acer Predator Triton 700
» Comparison of GPUs
Detailed list of all laptop GPUs sorted by class and performance.
» Benchmark List
Sort and restrict laptop GPUs based on performance in synthetic benchmarks.
» Notebook Gaming List
Playable games for each graphics card and their average FPS results.
* Approximate position of the graphics adapter
» Notebookcheck多媒体笔记本电脑Top 10排名
» Notebookcheck游戏笔记本电脑Top 10排名
» Notebookcheck低价办公/商务笔记本电脑Top 10排名
» Notebookcheck高端办公/商务笔记本电脑Top 10排名
» Notebookcheck工作站笔记本电脑Top 10排名
» Notebookcheck亚笔记本电脑Top 10排名
» Notebookcheck超级本产品Top 10排名
» Notebookcheck变形本产品Top 10排名
» Notebookcheck平板电脑Top 10排名
» Notebookcheck智能手机Top 10排名
» Notebookcheck评测过最出色的笔记本电脑屏幕
» Notebookcheck售价500欧元以下笔记本电脑Top 10排名
» Notebookcheck售价300欧元以下笔记本电脑Top 10排名