Notebookcheck Logo

Intel Graphics 1 Xe3 Wildcat Lake iGPU

Intel Intel Graphics 1 Xe3 WCL

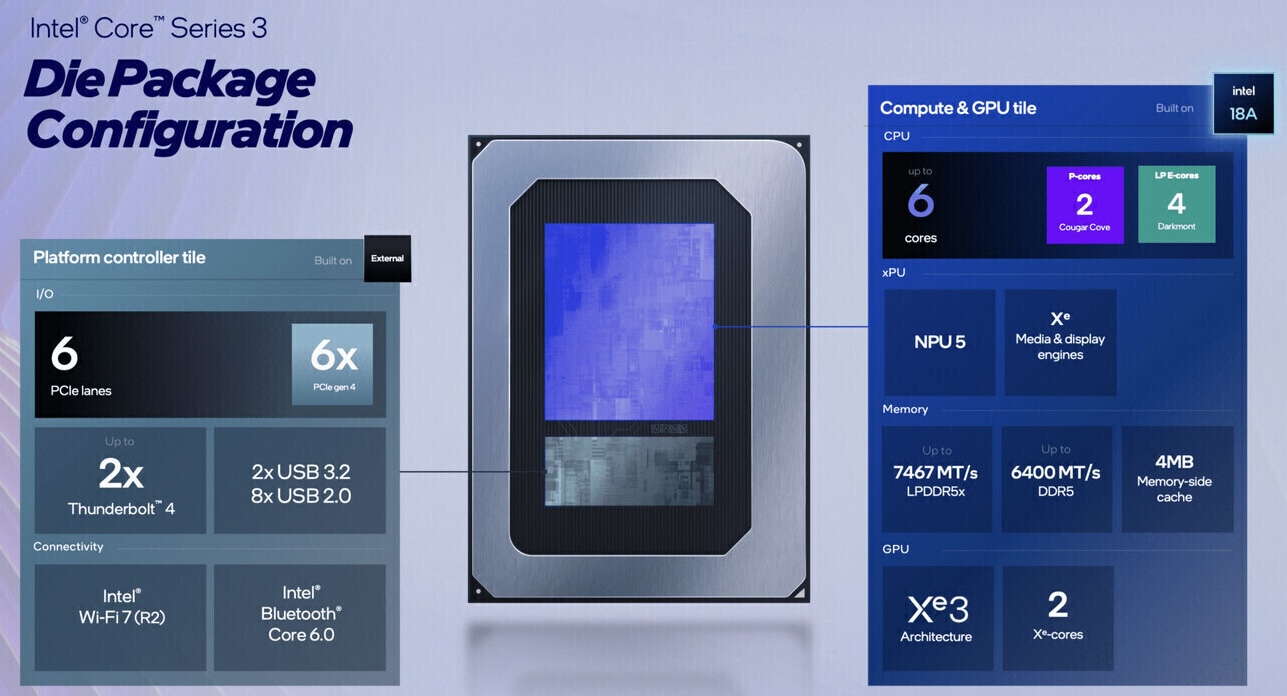
英特尔图形 1 核 Xe3 是 Wildcat Lake SoC 中的集成显卡,具有两个 Xe3 内核(8 个 EU / 128 个 ALU)和一个光线追踪内核。

新的媒体引擎现在支持 AV1 编解码、VVC 解码、AVC 10 位和 eDP 1.5。

小型 iGPU 不适合要求较高的 3D 游戏。只有要求不高的老游戏才能流畅运行。

图形核心位于 WCL 芯片的计算和 GPU 瓦内,采用现代 1.8 纳米工艺(英特尔 18A)制造。

Wildcat Lake Xe3 Series

Intel Graphics 2 Xe3 WCL 16 @ 2.6 GHz
Intel Graphics 1 Xe3 WCL 8 @ 2.3 GHz
CodenameWildcat Lake
iGPUIntegrated Graphics
Pipelines8 - unified
Raytracing Cores1
Core Speed2300 (Boost) MHz
AI GPU9 TOPS INT8
Shared Memoryno
APIDirectX 12_2
Man. Technology1.8 nm
Date of Announcement01.05.2026
CPU in Intel Graphics 1 Xe3 WCLGPU Base SpeedGPU Boost / Turbo
Intel Core 3 3056 x 1400 MHz, 15 W? MHz2300 MHz
Intel Core 3 3045 x 1400 MHz, 15 W? MHz2300 MHz
min. - max.? MHz2300 MHz

Benchmarks

3DMark - 3DMark Steel Nomad Light
587 Points (1%)
3DMark - 3DMark Fire Strike Standard Score
1917 Points (3%)
3DMark - 3DMark Fire Strike Standard Graphics
1998 Points (2%)
3DMark - 3DMark Time Spy Score
858 Points (2%)
3DMark - 3DMark Time Spy Graphics
753 Points (2%)
Intel UHD Graphics 600
107.5 -86%
...
NVIDIA Quadro M600M
631 -16%
Intel Iris Plus Graphics G4 (Ice Lake 48 EU)
639 -15%
650 -14%
Intel UHD Graphics Xe 32EUs (Tiger Lake-H)
670 -11%
AMD Radeon RX Vega 8 (Ryzen 2000/3000)
673 -11%
AMD Radeon RX Vega 10
724 -4%
733 -3%
744 -1%
Intel Iris Plus Graphics G7 (Ice Lake 64 EU)
744 -1%
Intel Graphics 1 Xe3 Wildcat Lake iGPU
753
758 1%
786 4%
787 5%
AMD Radeon 540X
797 6%
Qualcomm Adreno 690
811 8%
Intel UHD Graphics Xe G4 48EUs
812 8%
AMD Radeon Pro WX 3100
820 9%
AMD Radeon RX Vega 6 (Ryzen 4000/5000)
821 9%
862 14%
...
NVIDIA RTX PRO 5000 Blackwell Generation Laptop
23277 2991%
max:
NVIDIA GeForce RTX 5090
44063 5752%
0%
100%
Restrict / Search: Model: Max. age: years
3DMark 11 - 3DM11 Performance Score
2475 Points (3%)
3DMark 11 - 3DM11 Performance GPU
2165 Points (2%)
171.8 -92%
...
2017 -7%
2085 -4%
2092 -3%
2104 -3%
2110 -3%
2118 -2%
2125 -2%
2139 -1%
2145 -1%
Intel Graphics 1 Xe3 Wildcat Lake iGPU
2165
Intel UHD Graphics G1 (Ice Lake 32 EU)
2171 0%
2185 1%
AMD Radeon HD 8790M
2187 1%
Intel Iris Graphics 540
2187 1%
AMD Radeon R6 M255DX
2198 2%
AMD Radeon R7 M445
2208 2%
NVIDIA GeForce GT 745M
2213 2%
2215 2%
AMD FirePro W4190M
2221 3%
...
NVIDIA RTX PRO 5000 Blackwell Generation Laptop
68271 3053%
max:
NVIDIA GeForce RTX 5090
129772 5894%
0%
100%
Restrict / Search: Model: Max. age: years
Cinebench R10 Cinebench R10 Shading (32bit) +
Cinebench R10 - Cinebench R10 Shading (32bit)
11254 points (8%)
Cinebench R11.5 Cinebench R11.5 OpenGL 64 Bit +
Cinebench R11.5 - Cinebench R11.5 OpenGL 64 Bit
49.1 fps (5%)
Cinebench R15
Cinebench R15 OpenGL 64 Bit +
Cinebench R15 - Cinebench R15 OpenGL 64 Bit
69.8 fps (4%)
Cinebench R15 OpenGL Ref. Match 64 Bit +
Cinebench R15 - Cinebench R15 OpenGL Ref. Match 64 Bit
97.8 % (98%)
Basemark GPU 1.2 - Basemark GPU 1.2 Vulkan Official Medium Offscreen 1080
315 fps (8%)
Geekbench 6.7 - Geekbench 6.7.1 GPU OpenCL
5978 points (2%)
Geekbench 6.7 - Geekbench 6.7.1 GPU Vulkan
7288 points (2%)
LuxMark v2.0 64Bit - LuxMark v2.0 Room GPU
204 Samples/s (1%)
LuxMark v2.0 64Bit - LuxMark v2.0 Sala GPU
436 Samples/s (1%)
ComputeMark v2.1 - ComputeMark v2.1 Result
1304 points (1%)
- Range of benchmark values
red legend - Average benchmark values
* Smaller numbers mean a higher performance

Game Benchmarks

The following benchmarks stem from our benchmarks of review laptops. The performance depends on the used graphics memory, clock rate, processor, system settings, drivers, and operating systems. So the results don't have to be representative for all laptops with this GPU. For detailed information on the benchmark results, click on the fps number.

low 1920x1080
9.5  fps    + Compare
med. 1920x1080
7.1  fps    + Compare
high 1920x1080
0 (!)  fps    + Compare
» The benchmarks indicate that the game is not playable in the tested settings.
Strange Brigade

Strange Brigade

2018
low 1280x720
62  fps    + Compare
med. 1920x1080
23.6  fps    + Compare
high 1920x1080
18.2  fps    + Compare
ultra 1920x1080
0 (!)  fps    + Compare
» With all tested laptops playable in detail settings low.
low 1280x720
24.6  fps    + Compare
med. 1920x1080
16.3  fps    + Compare
high 1920x1080
16.2  fps    + Compare
» The benchmarks indicate that the game is not playable in the tested settings.
low 1280x720
23.2  fps    + Compare
med. 1920x1080
10.4  fps    + Compare
high 1920x1080
8.4  fps    + Compare
» The benchmarks indicate that the game is not playable in the tested settings.
low 1280x720
98.1  fps    + Compare
med. 1366x768
78.7  fps    + Compare
high 1920x1080
38.7  fps    + Compare
ultra 1920x1080
36.1  fps    + Compare
» With all tested laptops playable in detail settings ultra.
GTA V

GTA V

2015
low 1024x768
90.5  fps    + Compare
med. 1366x768
71.4  fps    + Compare
high 1920x1080
15  fps    + Compare
ultra 1920x1080
4.7  fps    + Compare
» With all tested laptops playable in detail settings med..
lowmed.highultraQHD4K
Cyberpunk 20779.527.12
Strange Brigade6223.618.2
X-Plane 11.1124.616.316.2
Final Fantasy XV Benchmark23.210.48.37
Dota 2 Reborn98.178.738.736.1
GTA V90.571.4154.73
lowmed.highultraQHD4K
< 30 fps
< 60 fps
< 120 fps
≥ 120 fps
3

3
4

2
4
1

1
1


For more games that might be playable and a list of all games and graphics cards visit our Gaming List

v1.35
log 01. 03:38:42

#0 ran 0s before starting gpusingle class +0s ... 0s

#1 no ids found in url (should be separated by "_") +0s ... 0s

#2 not redirecting to Ajax server +0s ... 0s

#3 did not recreate cache, as it is less than 5 days old! Created at Mon, 31 Aug 2026 05:34:52 +0200 +0.002s ... 0.002s

#4 no comparison url found in template nbc.compare_page_1 needed +0.012s ... 0.014s

#5 composed specs +0s ... 0.014s

#6 did output specs +0s ... 0.014s

#7 start showIntegratedCPUs +0s ... 0.014s

#8 getting avg benchmarks for device 13536 +0.012s ... 0.026s

#9 got single benchmarks 13536 +0.007s ... 0.033s

#10 got avg benchmarks for devices +0s ... 0.033s

#11 min, max, avg, median took s +0.648s ... 0.681s

#12 before gaming benchmark output +0s ... 0.681s

#13 Got 21 rows for game benchmarks. +0.005s ... 0.686s

#14 composed SQL query for gamebenchmarks +0s ... 0.686s

#15 got data and put it in $dataArray +0.003s ... 0.689s

#16 benchmarks composed for output. +0.049s ... 0.738s

#17 no comparison url found in template nbc.compare_page_1 needed +0.247s ... 0.985s

#18 return log +0s ... 0.985s

Google LogoAdd as a preferred source on Google
Mail Logo

» Comparison of GPUs
Detailed list of all laptop GPUs sorted by class and performance.

» Benchmark List
Sort and restrict laptop GPUs based on performance in synthetic benchmarks.

» Notebook Gaming List
Playable games for each graphics card and their average FPS results.

Class 1

Class 2

GeForce RTX 2080 Super Mobile
RTX PRO 2000 Blackwell Generation Laptop
M5 Max 32-Core GPU *
M1 Max 32-Core GPU *
M1 Max 24-Core GPU *
GeForce RTX 2070 Super Mobile
Radeon 8050S
Quadro RTX 5000 Max-Q
Radeon RX 5700M *
Quadro RTX 4000 (Laptop)
GeForce GTX 1080 Mobile
M1 Pro 16-Core GPU *
Radeon PRO W6600M *
GeForce RTX 2070 Super Max-Q
RTX PRO 1000 Blackwell Generation Laptop *
M1 Pro 14-Core GPU *
Quadro RTX 4000 Max-Q
Quadro RTX 3000 Max-Q
Radeon 8040S *
Pro A60M *

Class 3

Pro A30M
Radeon Pro 5300M
Radeon RX 5300M
GeForce GTX 1050 Ti Mobile
GeForce GTX 1050 Ti Max-Q
Radeon 680M
T500 Laptop GPU
Arc 130T
Radeon Pro Vega 16
GeForce GTX 1050 Max-Q
Radeon 660M
Xe MAX
Radeon Pro 560X
Radeon Pro 560
Quadro P620
Radeon RX 550X (Laptop)
Radeon Pro WX 3200 *
Radeon Pro 555X
Radeon Pro 555
Graphics 3-Core iGPU (Arrow Lake) *
Graphics 2-Core iGPU (Arrow Lake) *
Radeon 630
Quadro P520
Radeon 540X *
Vega 10
Vega 9
UHD Graphics 32EUs
UHD Graphics 750
Vega 7
UHD Graphics Xe 32EUs (Tiger Lake-H)
UHD Graphics Xe G4 48EUs
Vega 8
UHD Graphics 730
Vega 6 *
UHD Graphics 24EUs (Alder Lake-N) *
Radeon 610M *
Vega 6 *
UHD Graphics Xe 16EUs *
Adreno 690 *
Adreno 685 *
Adreno 680 *

Class 4

* Approximate position of the graphics adapter

Klaus Hinum (Update: 2026-04-19)