Notebookcheck Logo

AMD Radeon Pro 5500M

AMD Radeon Pro 5500M

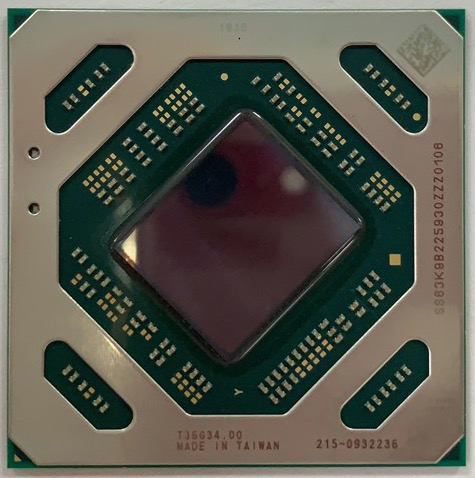
基于Navi 14芯片(新的RDNA架构)并以7nm工艺制造的中端移动图形卡。芯片提供了24个CU(= 1,536个着色器),比类似名称的移动Radeon RX 5500M和台式机RX 5500多2个CU。但是,在Pro中,GPU和内存的频率降低了很多,它配备于具有4或8 GB GDDR6图形内存的2019 Apple MacBook Pro 16高端机型。

Navi 14芯片使用了新的RDNA(Radeon DNA)微体系结构,它是GCN指令集的后继产品。它具有新的处理器设计,多级缓存层次结构和改进的渲染管线,并支持GDDR6内存。

据说Pro 5500M的性能是旧Radeon RX 560X(前身)的2.1倍。尽管比Radeon RX 5500M多了两个CU,但是根据AMD的说法,频率的降低导致峰值性能降低了13%(4个对比4.6 TFLOPS)。因此,在Windows下的游戏中,游戏性能应略低于Radeon RX 5500M,这比Pro 560X(Alpha 15 vs MBP15 2019)强约1.9倍。与Nvidia GPU相比,性能应该在GeForce GTX 1650和GeForce GTX 1060之间。

相似的RX 5500M芯片的TDP为85瓦,因此比频率较低的Radeon RX5300M高20瓦。在游戏中,芯片的功耗介于64到105瓦之间(使用HWInfo64记录的Ghost Recon游戏)。但是,根据AMD,Pro 5500M的额定TGP为50瓦,因此可能使用的是特挑的芯片。

Radeon Pro 5000M Series

Radeon Pro 5500M 1536 @ 1.3 GHz128 Bit @ 12000 MHz
Radeon Pro 5300M 1280 @ 1.25 GHz128 Bit @ 12000 MHz
CodenameNavi 14
ArchitectureNavi / RDNA
Pipelines1536 - unified
Core Speed1300 (Boost) MHz
Memory Speed12000 MHz
Memory Bus Width128 Bit
Memory TypeGDDR6
Max. Amount of Memory8 GB
Shared Memoryno
APIDirectX 12, Shader 6.4, OpenGL 4.6
Power Consumption50 Watt
Transistor Count6.4 Billion
technology7 nm
FeaturesDisplayPort 1.4 w/DFSC, HDMI 2.0b, Radeon Media Engine (H.264 4K150 decode, 4K90 encode / H.265 4K90 decode, 4K60 encode / VP9 4K90 decode)
Notebook Sizemedium sized
Date of Announcement13.11.2019

Benchmarks

3DMark - 3DMark Time Spy Score
3629 Points (10%)
3DMark - 3DMark Time Spy Graphics
3364 Points (9%)
Intel UHD Graphics 605
113 -97%
...
2998 -11%
3074 -9%
NVIDIA Quadro T2000 Max-Q
3094 -8%
3107 -8%
3123 -7%
3139 -7%
3160 -6%
3269 -3%
3324 -1%
AMD Radeon Pro 5500M
3364
3430 2%
3492 4%
AMD Radeon RX 580 (Laptop)
3505 4%
AMD Radeon RX 5300M
3567 6%
3601 7%
3610 7%
3650 9%
3689 10%
3883 15%
...
19434 478%
max:
36485 985%
0%
100%
3DMark - 3DMark Ice Storm Unlimited Graphics
364184 Points (41%)
3DMark - 3DMark Cloud Gate Score
30690 Points (33%)
3DMark - 3DMark Cloud Gate Graphics
65776 Points (17%)
3DMark - 3DMark Fire Strike Standard Score
9196 Points (16%)
3DMark - 3DMark Fire Strike Standard Graphics
10399 Points (12%)
3DMark 11 - 3DM11 Performance Score
14097 Points (20%)
3DMark 11 - 3DM11 Performance GPU
14725 Points (13%)
171.8 -99%
...
13524 -8%
13581 -8%
13714 -7%
NVIDIA GeForce GTX 780M SLI
14140 -4%
14147 -4%
AMD Radeon RX Vega M GH
14302 -3%
AMD Radeon RX 5300M
14412 -2%
14428 -2%
14692 0%
AMD Radeon Pro 5500M
14725
15135 3%
AMD Radeon RX 580 (Laptop)
15223 3%
NVIDIA Quadro P4000
15433 5%
15711 7%
15823 7%
NVIDIA Quadro P4000 Max-Q
15837 8%
NVIDIA Quadro P3200
16233 10%
16564 12%
NVIDIA GeForce GTX 980 (Laptop)
17028 16%
...
59943 307%
max:
106023 620%
0%
100%
3DMark 06 3DMark 06 - Standard 1280x1024 +
3DMark 06
34321 Points (45%)
SPECviewperf 12
specvp12 sw-03 +
SPECviewperf 12 - specvp12 sw-03
93 fps (23%)
specvp12 snx-02 +
SPECviewperf 12 - specvp12 snx-02
86.8 fps (13%)
specvp12 showcase-01 +
SPECviewperf 12 - specvp12 showcase-01
62.2 fps (14%)
specvp12 mediacal-01 +
SPECviewperf 12 - specvp12 mediacal-01
22.5 fps (6%)
specvp12 maya-04 +
SPECviewperf 12 - specvp12 maya-04
73.9 fps (20%)
specvp12 energy-01 +
SPECviewperf 12 - specvp12 energy-01
5.5 fps (5%)
specvp12 creo-01 +
SPECviewperf 12 - specvp12 creo-01
66.8 fps (27%)
specvp12 catia-04 +
SPECviewperf 12 - specvp12 catia-04
85.5 fps (14%)
specvp12 3dsmax-05 +
SPECviewperf 12 - specvp12 3dsmax-05
90.6 fps (16%)
SPECviewperf 13 specvp13 sw-04 +
SPECviewperf 13 - specvp13 sw-04
92.3 fps (25%)
specvp13 snx-03 +
SPECviewperf 13 - specvp13 snx-03
157 fps (17%)
specvp13 showcase-02 +
SPECviewperf 13 - specvp13 showcase-02
62.4 fps (14%)
specvp13 medical-02 +
SPECviewperf 13 - specvp13 medical-02
40.1 fps (8%)
specvp13 maya-05 +
SPECviewperf 13 - specvp13 maya-05
126 fps (14%)
specvp13 energy-02 +
SPECviewperf 13 - specvp13 energy-02
17 fps (5%)
specvp13 creo-02 +
SPECviewperf 13 - specvp13 creo-02
93.1 fps (14%)
specvp13 catia-05 +
SPECviewperf 13 - specvp13 catia-05
125 fps (14%)
specvp13 3dsmax-06 +
SPECviewperf 13 - specvp13 3dsmax-06
89 fps (15%)
Cinebench R15
Cinebench R15 OpenGL 64 Bit +
Cinebench R15 - Cinebench R15 OpenGL 64 Bit
min: 139.6     avg: 169.3     median: 169.3 (10%)     max: 199 fps
Cinebench R15 OpenGL Ref. Match 64 Bit +
Cinebench R15 - Cinebench R15 OpenGL Ref. Match 64 Bit
min: 98     avg: 98.8     median: 98.8 (99%)     max: 99.5 %
GFXBench - GFXBench 5.0 Aztec Ruins High Tier Offscreen
94.7 fps (17%)
3.3 -97%
...
Apple M1 7-Core GPU
72.4 -24%
Apple M1 8-Core GPU
74.3 -22%
78.8 -17%
80.5 -15%
83.4 -12%
87.1 -8%
89.3 -6%
Apple M2 8-Core GPU
91 -4%
93.2 -2%
AMD Radeon Pro 5500M
94.7
96.8 2%
Apple M2 10-Core GPU
100.4 6%
NVIDIA Quadro RTX 3000 Max-Q
102.9 9%
108 14%
109 15%
110.2 16%
Apple M3 10-Core GPU
118.5 25%
Apple M1 Pro 14-Core GPU
147 55%
NVIDIA Quadro RTX 5000 Max-Q
153 62%
...
536 466%
0%
100%
GFXBench - GFXBench 5.0 Aztec Ruins Normal Tier Offscreen
254 fps (19%)
GFXBench - GFXBench Car Chase Offscreen
210 fps (24%)
Power Consumption - Furmark Stress Test Power Consumption - external Monitor *
min: 78     avg: 81.1     median: 81.1 (12%)     max: 84.2 Watt
0102030405060708090100Tooltip
Power Consumption - The Witcher 3 Power Consumption - external Monitor *
89.6 Watt (13%)
05101520253035404550556065707580859095Tooltip
Power Consumption - Witcher 3 Power Consumption *
103 Watt (23%)
Power Consumption - GFXBench Aztec Ruins Normal Tier Offscreen Power Consumption 150cd *
92.1 Watt (36%)
05101520253035404550556065707580859095Tooltip
Power Consumption - Witcher 3 ultra Power Efficiency
0.4 fps per Watt (37%)
Power Consumption - Witcher 3 ultra Power Efficiency - external Monitor
0.4 fps per Watt (36%)
Emissions Witcher 3 Fan Noise +
Emissions - Witcher 3 Fan Noise
45.4 dB(A) (73%)
Clock Speed - GPU Clock Witcher 3 ultra
970 MHz (38%)
- Range of benchmark values for this graphics card
- Average benchmark values for this graphics card
* Smaller numbers mean a higher performance

Game Benchmarks

The following benchmarks stem from our benchmarks of review laptops. The performance depends on the used graphics memory, clock rate, processor, system settings, drivers, and operating systems. So the results don't have to be representative for all laptops with this GPU. For detailed information on the benchmark results, click on the fps number.

low 1280x720
85  fps    + Compare
med. 1920x1080
31  fps    + Compare
» With all tested laptops playable in detail settings low.
low 1280x720
43.1  fps    + Compare + 📈 Graph
med. 1920x1080
21.7  fps    + Compare + 📈 Graph
» With all tested laptops playable in detail settings low.
low 1280x720
61  fps    + Compare
med. 1920x1080
41  fps    + Compare
high 1920x1080
28  fps    + Compare
» With all tested laptops playable in detail settings med..
Far Cry 6

Far Cry 6

2021
low 1280x720
0 (!)  fps    + Compare
low 1280x720
81.7  fps    + Compare + 📈 Graph
med. 1920x1080
38.9  fps    + Compare + 📈 Graph
high 1920x1080
40.6  fps    + Compare + 📈 Graph
» With all tested laptops playable in detail settings high.
Outriders

Outriders

2021
low 1280x720
70.7  fps    + Compare + 📈 Graph
med. 1920x1080
44.4  fps    + Compare + 📈 Graph
high 1920x1080
36  fps    + Compare + 📈 Graph
ultra 1920x1080
27.6  fps    + Compare + 📈 Graph
» With all tested laptops playable in detail settings high.
Hitman 3

Hitman 3

2021
low 1280x720
157  fps    + Compare
med. 1920x1080
81.3  fps    + Compare
high 1920x1080
66.3  fps    + Compare
ultra 1920x1080
62  fps    + Compare
» With all tested laptops playable in detail settings ultra.
low 1280x720
54.8  fps    + Compare + 📈 Graph
med. 1920x1080
29.9  fps    + Compare + 📈 Graph
high 1920x1080
23.5  fps    + Compare + 📈 Graph
» With all tested laptops playable in detail settings low.
FIFA 21

FIFA 21

2020
ultra 1920x1080
151  fps    + Compare + 📈 Graph
QHD 2560x1440
115  fps    + Compare + 📈 Graph
4K 3840x2160
70  fps    + Compare + 📈 Graph
» With all tested laptops playable in detail settings ultra.
ultra 1920x1080
95.6  fps    + Compare + 📈 Graph
QHD 2560x1440
69.7  fps    + Compare + 📈 Graph
4K 3840x2160
26.4  fps    + Compare + 📈 Graph
» With all tested laptops playable in detail settings ultra.
high 1920x1080
52.5  fps    + Compare + 📈 Graph
QHD 2560x1440
37.5  fps    + Compare + 📈 Graph
» With all tested laptops playable in detail settings high.
low 1280x720
47.4  fps    + Compare
med. 1920x1080
28  fps    + Compare
high 1920x1080
19.2  fps    + Compare
ultra 1920x1080
12.2  fps    + Compare
» With all tested laptops playable in detail settings low.
F1 2020

F1 2020

2020
low 1280x720
0 (!)  fps    + Compare
high 1920x1080
60  fps    + Compare
ultra 1920x1080
47.6  fps    + Compare
QHD 2560x1440
30.7  fps    + Compare
» With all tested laptops playable in detail settings ultra.
med. 1920x1080
84.8  fps    + Compare
high 1920x1080
47.5  fps    + Compare
ultra 1920x1080
27.5  fps    + Compare
QHD 2560x1440
21.9  fps    + Compare
4K 3840x2160
15.1  fps    + Compare
» With all tested laptops playable in detail settings high.
low 1920x1080
33.2  fps    + Compare
med. 1920x1080
32  fps    + Compare
high 1920x1080
59.7  fps    + Compare
4K 3840x2160
59.6  fps    + Compare
» With all tested laptops playable in detail settings high.
Fall Guys

Fall Guys

2020
high 1920x1080
59.4  fps    + Compare + 📈 Graph
QHD 2560x1440
59.4  fps    + Compare + 📈 Graph
4K 3840x2160
38.1  fps    + Compare + 📈 Graph
» With all tested laptops playable in detail settings high.
low 1280x720
97.6  fps    + Compare
med. 1920x1080
55.2  fps    + Compare
high 1920x1080
35.8  fps    + Compare
ultra 1920x1080
20.9  fps    + Compare
QHD 2560x1440
0 (!)  fps    + Compare
4K 3840x2160
0 (!)  fps    + Compare
» With all tested laptops playable in detail settings high.
med. 1920x1080
75  fps    + Compare
high 1920x1080
61  fps    + Compare
ultra 1920x1080
54.3  fps    + Compare
QHD 2560x1440
35  fps    + Compare
4K 3840x2160
16.2  fps    + Compare
» With all tested laptops playable in detail settings ultra.
low 1280x720
74  fps    + Compare
med. 1920x1080
56.7  fps    + Compare
high 1920x1080
50.9  fps    + Compare
ultra 1920x1080
44.7  fps    + Compare
QHD 2560x1440
28  fps    + Compare
4K 3840x2160
12.8  fps    + Compare
» With all tested laptops playable in detail settings ultra.
ultra 1920x1080
34.7  fps    + Compare
» The benchmarks indicate that the game is not playable in the tested settings.
GRID 2019

GRID 2019

2019
ultra 1920x1080
46.3  fps    + Compare
QHD 2560x1440
36.6  fps    + Compare
4K 3840x2160
23.2  fps    + Compare
» With all tested laptops playable in detail settings ultra.
high 1920x1080
50  fps    + Compare
ultra 1920x1080
35  fps    + Compare
» With all tested laptops playable in detail settings high.
FIFA 20

FIFA 20

2019
ultra 1920x1080
144  fps    + Compare
QHD 2560x1440
124  fps    + Compare
4K 3840x2160
90  fps    + Compare
» With all tested laptops playable in detail settings ultra.
high 1920x1080
41.4  fps    + Compare
ultra 1920x1080
30.8  fps    + Compare
QHD 2560x1440
21.4  fps    + Compare
4K 3840x2160
3.8  fps    + Compare
» With all tested laptops playable in detail settings high.
Control

Control

2019
low 1280x720
139  fps    + Compare
med. 1920x1080
41.5  fps    + Compare
high 1920x1080
29.2  fps    + Compare
QHD 2560x1440
18.1  fps    + Compare
» With all tested laptops playable in detail settings med..
F1 2019

F1 2019

2019
low 1280x720
174  fps    + Compare
med. 1920x1080
105  fps    + Compare
high 1920x1080
97  fps    + Compare
ultra 1920x1080
65  fps    + Compare
QHD 2560x1440
49  fps    + Compare
» With all tested laptops playable in detail settings ultra.
low 1280x720
175  fps    + Compare
med. 1920x1080
64.1  fps    + Compare
high 1920x1080
40.5  fps    + Compare
ultra 1920x1080
29.7  fps    + Compare
QHD 2560x1440
19  fps    + Compare
4K 3840x2160
7  fps    + Compare
» With all tested laptops playable in detail settings high.
Rage 2

Rage 2

2019
low 1280x720
113  fps    + Compare
med. 1920x1080
53.7  fps    + Compare
high 1920x1080
45.2  fps    + Compare
ultra 1920x1080
44.4  fps    + Compare
QHD 2560x1440
28.4  fps    + Compare
» With all tested laptops playable in detail settings ultra.
Anno 1800

Anno 1800

2019
med. 1920x1080
67  fps    + Compare
high 1920x1080
44.6  fps    + Compare
ultra 1920x1080
21.7  fps    + Compare
» With all tested laptops playable in detail settings high.
high 1920x1080
56  fps    + Compare
ultra 1920x1080
39  fps    + Compare
» With all tested laptops playable in detail settings ultra.
high 1920x1080
90  fps    + Compare
ultra 1920x1080
50.2  fps    + Compare
QHD 2560x1440
35.8  fps    + Compare
» With all tested laptops playable in detail settings ultra.
low 1280x720
86  fps    + Compare + 📈 Graph
med. 1920x1080
67  fps    + Compare + 📈 Graph
high 1920x1080
64  fps    + Compare + 📈 Graph
ultra 1920x1080
57  fps    + Compare + 📈 Graph
QHD 2560x1440
41  fps    + Compare + 📈 Graph
4K 3840x2160
21  fps    + Compare + 📈 Graph
» With all tested laptops playable in detail settings ultra.
low 1280x720
92  fps    + Compare
med. 1920x1080
47.1  fps    + Compare
high 1920x1080
34.3  fps    + Compare
ultra 1920x1080
28.6  fps    + Compare
QHD 2560x1440
22  fps    + Compare
» With all tested laptops playable in detail settings med..
ultra 1920x1080
63  fps    + Compare
QHD 2560x1440
43.5  fps    + Compare
» With all tested laptops playable in detail settings ultra.
low 1280x720
85  fps    + Compare
med. 1920x1080
76  fps    + Compare
high 1920x1080
62  fps    + Compare
ultra 1920x1080
58.9  fps    + Compare
QHD 2560x1440
47  fps    + Compare
4K 3840x2160
14.4  fps    + Compare
» With all tested laptops playable in detail settings ultra.
low 1280x720
120  fps    + Compare
med. 1920x1080
58  fps    + Compare
high 1920x1080
54  fps    + Compare
ultra 1920x1080
46  fps    + Compare
QHD 2560x1440
30  fps    + Compare
4K 3840x2160
13  fps    + Compare
» With all tested laptops playable in detail settings ultra.
Far Cry 5

Far Cry 5

2018
ultra 1920x1080
55  fps    + Compare + 📈 Graph
QHD 2560x1440
40  fps    + Compare + 📈 Graph
4K 3840x2160
20  fps    + Compare + 📈 Graph
» With all tested laptops playable in detail settings ultra.
World of Tanks enCore

World of Tanks enCore

2018
ultra 1920x1080
76  fps    + Compare
QHD 2560x1440
49.1  fps    + Compare
4K 3840x2160
24.6  fps    + Compare
» With all tested laptops playable in detail settings ultra.
med. 1920x1080
48.4  fps    + Compare
high 1920x1080
20.4  fps    + Compare
» With all tested laptops playable in detail settings med..
high 1920x1080
153  fps    + Compare
QHD 2560x1440
107  fps    + Compare
4K 3840x2160
59  fps    + Compare
» With all tested laptops playable in detail settings high.
high 1920x1080
52  fps    + Compare
ultra 1920x1080
27.8  fps    + Compare
4K 3840x2160
16.9  fps    + Compare
» With all tested laptops playable in detail settings high.
Overwatch

Overwatch

2016
ultra 1920x1080
98  fps    + Compare
» With all tested laptops playable in detail settings ultra.
Additional Benchmarks
Epic (Render Scale 100 %) 16xAF SMAA 3820x2160
32.8
Epic (Render Scale 100 %) 16xAF SMAA 2560x1440
66
ultra 1920x1080
126  fps    + Compare
4K 3840x2160
44.8  fps    + Compare
» With all tested laptops playable in detail settings ultra.
4K 3840 x 2160
43.4  fps    + Compare
low 1280x720
137  fps    + Compare
med. 1366x768
125  fps    + Compare
high 1920x1080
111  fps    + Compare
ultra 1920x1080
107  fps    + Compare
4K 3840x2160
53.9  fps    + Compare
» With all tested laptops playable in detail settings ultra.
high 1920x1080
68  fps    + Compare
ultra 1920x1080
38.8  fps    + Compare + 📈 Graph
» With all tested laptops playable in detail settings ultra.
GTA V

GTA V

2015
low 1024x768
168  fps    + Compare
high 1920x1080
91 91.4 ~ 91 fps    + Compare
ultra 1920x1080
46.5 47.6 ~ 47 fps    + Compare
QHD 2560x1440
34.5  fps    + Compare
4K 3840x2160
17.3 32.3 ~ 25 fps    + Compare
» With all tested laptops playable in detail settings ultra.
Additional Benchmarks
Highest Settings possible 16xAF 4xMSAA + FXAA 3840x2160
19.6
Normal/Off 4xAF 1920x1080
155
Lowest Settings possible 1920x1080
161
ultra 1920x1080
208  fps    + Compare
QHD 2560x1440
118  fps    + Compare
4K 3820x2160
71.4  fps    + Compare
» With all tested laptops playable in detail settings ultra.
lowmed.highultraQHD4K
Forza Horizon 58531
Call of Duty Vanguard43.121.7
Riders Republic614128
Far Cry 6
Resident Evil Village81.738.940.6
Outriders70.744.43627.6
Hitman 315781.366.362
Cyberpunk 2077 1.054.829.923.5
FIFA 2115111570
Star Wars Squadrons95.669.726.4
Mafia Definitive Edition52.537.5
Flight Simulator 202047.42819.212.2
F1 2020
Gears Tactics6047.630.7
Doom Eternal84.847.527.521.915.1
Hearthstone33.23259.759.6
Fall Guys59.459.438.1
Red Dead Redemption 297.655.235.820.9
Star Wars Jedi Fallen Order756154.33516.2
Need for Speed Heat7456.750.944.72812.8
Call of Duty Modern Warfare 201934.7
GRID 201946.336.623.2
Ghost Recon Breakpoint5035
FIFA 2014412490
Borderlands 341.430.821.43.8
Control13941.529.218.1
F1 2019174105976549
Total War: Three Kingdoms17564.140.529.7197
Rage 211353.745.244.428.4
Anno 18006744.621.7
The Division 25639
Dirt Rally 2.09050.235.8
Far Cry New Dawn866764574121
Metro Exodus9247.134.328.622
Apex Legends6343.5
Battlefield V85766258.94714.4
Shadow of the Tomb Raider1205854463013
Far Cry 5554020
World of Tanks enCore7649.124.6
Final Fantasy XV Benchmark48.420.4
Rocket League15310759
Deus Ex Mankind Divided5227.816.9
Overwatch98
Rainbow Six Siege12644.8
World of Warships43.4
Dota 2 Reborn13712511110753.9
The Witcher 36838.8
GTA V168914734.525
Counter-Strike: GO20811871.4
< 30 fps
< 60 fps
< 120 fps
≥ 120 fps

4
10
7
3
12
8
1
5
17
10
1
8
16
7
4
7
14
4
1
14
6
3

For more games that might be playable and a list of all games and graphics cards visit our Gaming List

v1.26
log 19. 05:36:48

#0 no ids found in url (should be separated by "_") +0s ... 0s

#1 not redirecting to Ajax server +0s ... 0s

#2 did not recreate cache, as it is less than 5 days old! Created at Tue, 16 Apr 2024 05:39:00 +0200 +0.001s ... 0.001s

#3 no comparison url found in template nbc.compare_page_1 needed +0.046s ... 0.047s

#4 composed specs +0s ... 0.047s

#5 did output specs +0s ... 0.047s

#6 start showIntegratedCPUs +0s ... 0.047s

#7 getting avg benchmarks for device 9966 +0.019s ... 0.066s

#8 got single benchmarks 9966 +0.011s ... 0.077s

#9 got avg benchmarks for devices +0s ... 0.077s

#10 min, max, avg, median took s +0.76s ... 0.837s

#11 before gaming benchmark output +0s ... 0.837s

#12 Got 169 rows for game benchmarks. +0.033s ... 0.869s

#13 composed SQL query for gamebenchmarks +0s ... 0.869s

#14 got data and put it in $dataArray +0.037s ... 0.906s

#15 benchmarks composed for output. +1.821s ... 2.727s

#16 no comparison url found in template nbc.compare_page_1 needed +0.004s ... 2.732s

#17 return log +0s ... 2.732s

Notebook reviews with AMD Radeon Pro 5500M graphics card

Apple MacBook Pro 16 2019 i9 5500M: Intel Core i9-9880H, 16.00", 2 kg
  External Review » Apple MacBook Pro 16 2019 i9 5500M

Please share our article, every link counts!

» Comparison of GPUs
Detailed list of all laptop GPUs sorted by class and performance.

» Benchmark List
Sort and restrict laptop GPUs based on performance in synthetic benchmarks.

» Notebook Gaming List
Playable games for each graphics card and their average FPS results.

Class 1

GeForce RTX 2080 Super Mobile

Class 2

M1 Max 32-Core GPU *
GeForce RTX 2070 Super Mobile
M1 Max 24-Core GPU *
Quadro RTX 5000 Max-Q
Radeon RX 5700M *
GeForce GTX 1080 Mobile
Quadro RTX 4000 (Laptop)
M1 Pro 16-Core GPU *
Radeon PRO W6600M *
GeForce RTX 2070 Super Max-Q
Quadro RTX 4000 Max-Q *
M1 Pro 14-Core GPU *
Quadro P5200
Quadro RTX 3000 Max-Q *
Quadro P4200
Quadro P5000 Max-Q *
GeForce GTX 980 (Laptop)
Quadro P4000
Quadro P4000 Max-Q
Quadro P3200
Radeon RX 580X (Laptop) *
Radeon RX 580 (Laptop)
Radeon Pro 5300M
Radeon RX 5300M
Quadro P3000 Max-Q *
Quadro T2000 Max-Q *
Radeon Pro WX 7100 *
Radeon RX 570X (Laptop) *
Radeon RX 570 (Laptop) *
Radeon RX 470 (Laptop) *
Quadro T1000 Max-Q *

Class 3

Vega M GH
Quadro M5000M
GeForce GTX 1050 Ti Mobile
Radeon 680M
Quadro P2000
Quadro P2000 Max-Q
Quadro M4000M
T500 Laptop GPU *
Radeon R9 M395X
GeForce GTX 1050 Ti Max-Q *
Radeon Pro Vega 16
WX Vega M GL
Radeon R9 M485X
Quadro M3000M
FirePro W7170M
Radeon R9 M395
GeForce GTX 1050 Max-Q *
Radeon 660M
Radeon Pro WX 4150 *
Radeon RX 560X (Laptop)
Radeon RX 560 (Laptop)
Radeon RX 460 (Laptop)
Quadro P1000
Radeon R9 M390
Xe MAX
Radeon Pro 560X
Radeon Pro 560
Radeon Pro 460
Radeon Pro WX 4130 *
GeForce GTX 960M
Quadro P620 *
Radeon RX 550X (Laptop)
Radeon Pro WX 3200 *
Radeon Pro 555X
Radeon Pro 555
Radeon Pro 455
Quadro P600
Quadro M2000M
Radeon RX 540X *
Radeon Pro WX 2100 *
Radeon Pro WX 3100 *
GeForce GTX 950M
Radeon Pro 450
Radeon 630
Radeon 540X *
Radeon R9 M385X
Quadro P520
Quadro M1000M
GeForce 945M
Quadro P500 *
Iris Plus Graphics G7 (Ice Lake 64 EU) *
Vega 10 *
Iris Pro Graphics 580
FirePro W5170M *
Radeon R9 M370X
Vega 9
FirePro W5130M
UHD Graphics Xe G4 48EUs *
UHD Graphics 32EUs
UHD Graphics Xe 32EUs (Tiger Lake-H) *
UHD Graphics 750
Vega 7
Radeon R7 M465
Iris Pro Graphics 6200
Vega 8
GeForce 940M
Iris Plus Graphics G4 (Ice Lake 48 EU)
Quadro M600M
FirePro W4190M
Radeon R9 M375
Radeon R7 M445
Iris Plus Graphics 650
Iris Graphics 550
Radeon 625
Vega 6 *
Iris Plus Graphics 640
Iris Graphics 540
UHD Graphics 24EUs (Alder Lake-N) *
Radeon R7 M360
GeForce 920M
Radeon 620
Radeon R7 M340
Radeon 610
Radeon 610M *
Vega 6 *
UHD Graphics G1 (Ice Lake 32 EU)
UHD Graphics Xe 16EUs (Tiger Lake-H) *
HD Graphics 530
Radeon R5 (Bristol Ridge)
Adreno 690 *
Adreno 685 *
Adreno 680 *
Radeon R5 M330
GeForce 910M
HD Graphics 520

Class 4

UHD Graphics 730
Radeon R5 M320 *
Radeon R5 M315 *
Radeon R5 M420 *
Vega 2 *
UHD Graphics 617
UHD Graphics 615
HD Graphics 515
UHD Graphics 610
HD Graphics 510
UHD Graphics 605
Radeon R4 (Stoney Ridge)
Radeon R2 (Stoney Ridge)
HD Graphics (Broadwell)
UHD Graphics 600
HD Graphics (Braswell)

Class 5

* Approximate position of the graphics adapter