Notebookcheck Logo

Intel Arc A350M

Intel A350M

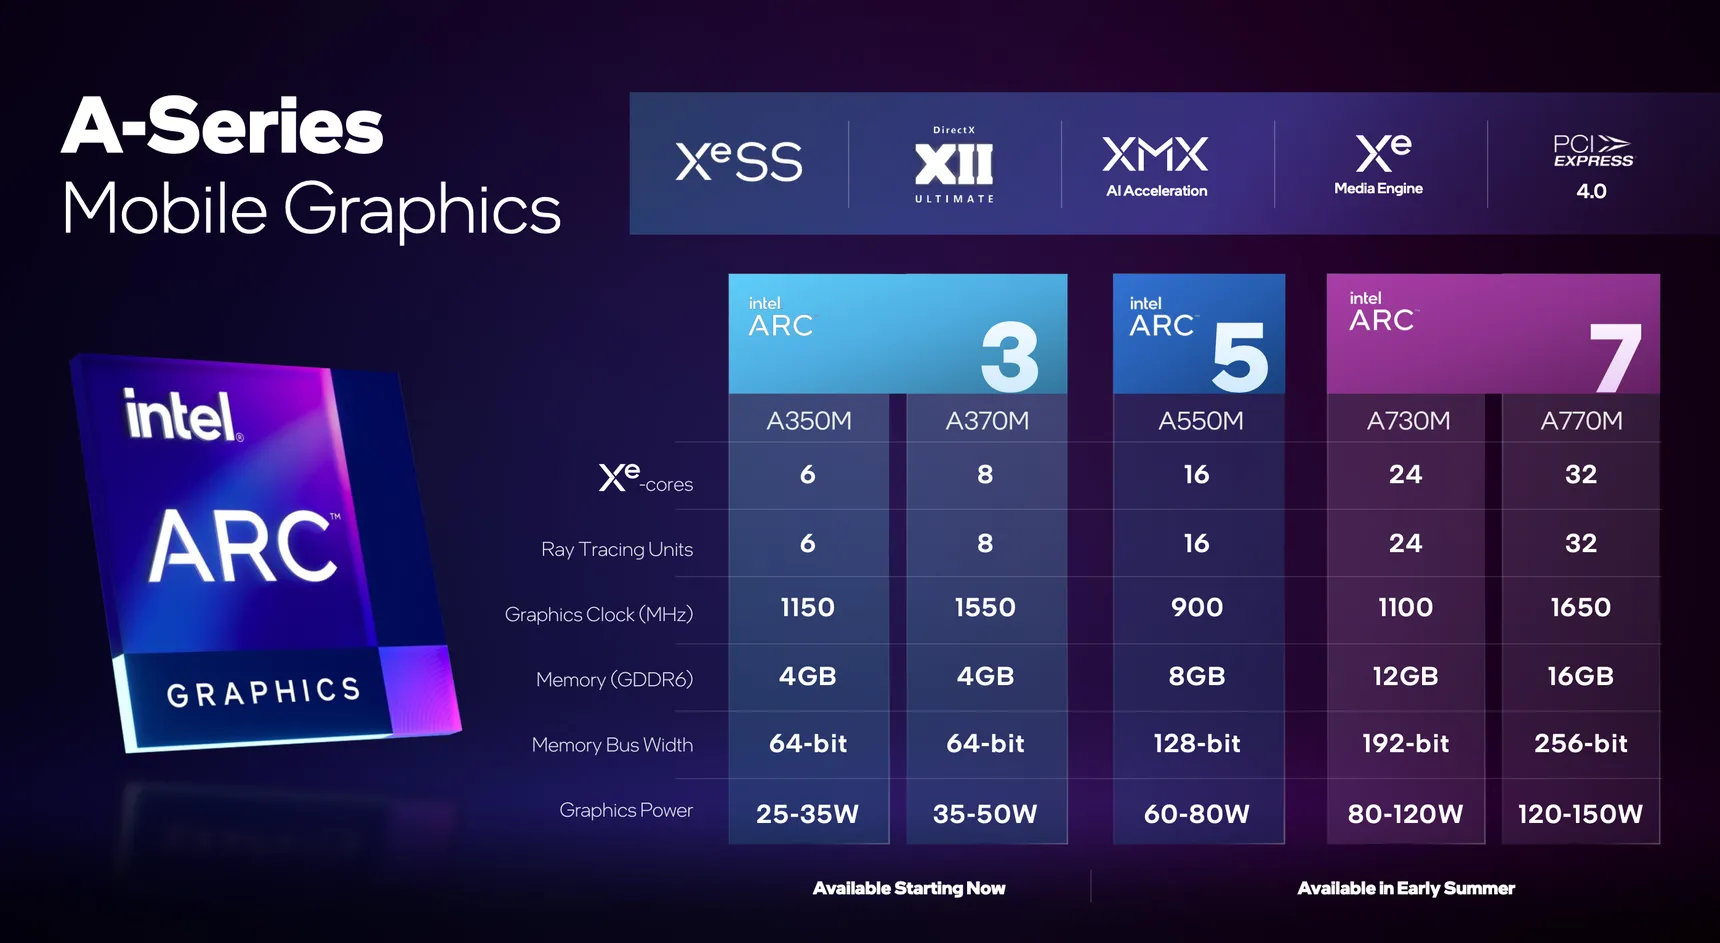
英特尔Arc A350M是一款基于Xe HPG微架构的专用移动入门级显卡。它提供6个内核(96个ALU),6个光线追踪单元和1150MHz的基本内核。TGP被指定在25至35瓦之间。

--

英特尔Arc A350M是一款基于Xe HPG微架构的笔记本电脑专用移动入门级显卡。它使用ACM-G11芯片,提供8个Xe-cores中的6个(95个ALU),8个光线追踪单元中的6个,以及用于4GB GDDR6显存的64位内存总线。该芯片集成了72亿个晶体管,芯片尺寸为157平方毫米。

该芯片还集成了两个媒体引擎,用于VP9、AVC、HEVC和AV1 8k的编码和解码。4条显示管道通过DMI 2.0B或DisplayPort 2.0 10G支持多达4x 4k120 HDR。 

A350M在台积电的6纳米工艺(N6工艺)下生产,支持与第12代英特尔CPU(Alder Lake)的动态功率共享(使用Deep Link)。

Arc Series

Arc A770 4096 @ 2.1 - 2.4 GHz256 Bit @ 16000 MHz
Arc A750 3584 @ 2.05 - 2.4 GHz256 Bit @ 16000 MHz
Arc A580 3072 @ 1.7 - 2 GHz256 Bit @ 16000 MHz
A770M 512 @ 1.65 GHz256 Bit @ 16000 MHz
A730M 384 @ 1.1 GHz192 Bit @ 14000 MHz
A570M 16 @ 0.9 - 1.3 GHz128 Bit @ 14000 MHz
A550M 16 @ 0.9 - 2.01 GHz128 Bit @ 14000 MHz
A530M 12 @ 0.9 - 1.3 GHz128 Bit @ 14000 MHz
A370M 8 @ 1.55 GHz64 Bit @ 14000 MHz
Arc A380 1024 @ 2 GHz96 Bit @ 15500 MHz
A310 6 @ 2 GHz64 Bit @ 15500 MHz
A350M 6 @ 1.15 GHz64 Bit @ 14000 MHz
CodenameAlchemist
ArchitectureXe HPG
Pipelines6 - unified
Raytracing Cores6
Core Speed1150 MHz
CacheL1: 1.1 MB, L2: 4 MB
Memory Speed14000 MHz
Memory Bus Width64 Bit
Memory TypeGDDR6
Max. Amount of Memory4 GB
Shared Memoryno
Memory Bandwidth112 GB/s
APIDirectX 12_2, OpenGL 4.6, Vulkan 1.3
Power Consumption35 Watt (25 - 35 Watt TGP)
Transistor Count7.2 Billion
Die Size 157 mm²
technology6 nm
PCIe4 8x
Displays4 Displays (max.), HDMI 2.0b, DisplayPort 2.0 10G Ready
Date of Announcement30.03.2022
Link to Manufacturer Pageark.intel.com

Benchmarks

3DMark - 3DMark Time Spy Score
min: 2976     avg: 3289     median: 3397 (10%)     max: 3494 Points
3DMark - 3DMark Time Spy Graphics
min: 2731     avg: 2993     median: 3050 (8%)     max: 3197 Points
Intel UHD Graphics 605
113 -96%
...
NVIDIA GeForce GTX 1050 Ti Mobile
2309 -23%
2472 -17%
2601 -13%
2667 -11%
2766 -8%
2805 -6%
AMD Radeon HD 8970M Crossfire
2827 -6%
2864 -4%
AMD Radeon RX Vega M GH
2908 -3%
Intel Arc A350M
2993
2998 0%
3074 3%
NVIDIA Quadro T2000 Max-Q
3094 3%
3123 4%
3132 5%
3139 5%
3160 6%
3269 9%
3324 11%
...
19434 549%
max:
36485 1119%
0%
100%
3DMark - 3DMark Cloud Gate Score
min: 23965     avg: 25147     median: 25146.5 (27%)     max: 26328 Points
3DMark - 3DMark Cloud Gate Graphics
min: 28623     avg: 36315     median: 36314.5 (10%)     max: 44006 Points
3DMark - 3DMark Fire Strike Standard Score
min: 5961     avg: 6267     median: 6009 (11%)     max: 6832 Points
3DMark - 3DMark Fire Strike Standard Graphics
min: 6800     avg: 7088     median: 7147 (8%)     max: 7318 Points
3DMark - 3DMark Wild Life Unlimited
19449 Points (10%)
3DMark - 3DMark Wild Life Extreme Unlimited
min: 5189     avg: 5300     median: 5299.5 (6%)     max: 5410 Points
3DMark 11 - 3DM11 Performance Score
min: 10123     avg: 10766     median: 10766 (15%)     max: 11409 Points
3DMark 11 - 3DM11 Performance GPU
min: 10687     avg: 10730     median: 10730 (9%)     max: 10773 Points
171.8 -98%
...
9840 -8%
9910 -8%
9950 -7%
AMD Radeon 680M
9979 -7%
10005 -7%
AMD Radeon Pro WX Vega M GL
10020 -7%
NVIDIA Quadro M4000M
10259 -4%
10498 -2%
AMD Radeon Pro Vega 16
10569 -2%
Intel Arc A350M
10730
10748 0%
10952 2%
11119 4%
11171 4%
11305 5%
NVIDIA Quadro T2000 Max-Q
11461 7%
11795 10%
11796 10%
11823 10%
...
59943 459%
max:
106023 888%
0%
100%
3DMark Vantage
3DM Vant. Perf. total +
3DMark Vantage - 3DM Vant. Perf. total
31023 Points (9%)
3DM Vant. Perf. GPU no PhysX +
3DMark Vantage - 3DM Vant. Perf. GPU no PhysX
28186 Points (16%)
ATI Radeon HD 3200
62 -100%
...
24915 -12%
25270 -10%
NVIDIA GeForce GTX 1050 Max-Q
25293 -10%
NVIDIA GeForce GTX 765M SLI
25664 -9%
AMD FirePro W7170M
25898 -8%
26569 -6%
AMD Radeon 680M
26762 -5%
NVIDIA GeForce GTX 780M
27315 -3%
NVIDIA Quadro M3000M
27921 -1%
Intel Arc A350M
28186
28693 2%
29214 4%
NVIDIA GeForce GTX 1050 Ti Max-Q
29448 4%
29844 6%
AMD Radeon R9 M295X
29938 6%
30252 7%
NVIDIA Quadro P2000 Max-Q
30786 9%
NVIDIA Quadro P2000
31451 12%
31800 13%
...
132443 370%
max:
170928 506%
0%
100%
3DMark 06 3DMark 06 - Standard 1280x1024 +
3DMark 06
31625 Points (41%)
Unigine Valley 1.0 - Unigine Valley 1.0 DX
19.5 fps (6%)
SPECviewperf 13 specvp13 sw-04 +
SPECviewperf 13 - specvp13 sw-04
57.6 fps (15%)
specvp13 snx-03 +
SPECviewperf 13 - specvp13 snx-03
3.2 fps (0%)
specvp13 showcase-02 +
SPECviewperf 13 - specvp13 showcase-02
27.7 fps (6%)
specvp13 medical-02 +
SPECviewperf 13 - specvp13 medical-02
19.9 fps (4%)
specvp13 maya-05 +
SPECviewperf 13 - specvp13 maya-05
63.6 fps (7%)
specvp13 energy-02 +
SPECviewperf 13 - specvp13 energy-02
11.8 fps (4%)
specvp13 creo-02 +
SPECviewperf 13 - specvp13 creo-02
49.1 fps (7%)
specvp13 catia-05 +
SPECviewperf 13 - specvp13 catia-05
77 fps (9%)
specvp13 3dsmax-06 +
SPECviewperf 13 - specvp13 3dsmax-06
55.7 fps (10%)
SPECviewperf 2020 specvp2020 solidworks-05 1080p +
SPECviewperf 2020 - specvp2020 solidworks-05 1080p
17.2 fps (3%)
specvp2020 snx-04 1080p +
SPECviewperf 2020 - specvp2020 snx-04 1080p
3.2 fps (1%)
specvp2020 medical-03 1080p +
SPECviewperf 2020 - specvp2020 medical-03 1080p
9.1 fps (9%)
specvp2020 maya-06 1080p +
SPECviewperf 2020 - specvp2020 maya-06 1080p
72 fps (10%)
specvp2020 energy-03 1080p +
SPECviewperf 2020 - specvp2020 energy-03 1080p
12 fps (10%)
specvp2020 creo-03 1080p +
SPECviewperf 2020 - specvp2020 creo-03 1080p
30.8 fps (15%)
specvp2020 catia-06 1080p +
SPECviewperf 2020 - specvp2020 catia-06 1080p
17.4 fps (11%)
specvp2020 3dsmax-07 1080p +
SPECviewperf 2020 - specvp2020 3dsmax-07 1080p
20.9 fps (9%)
Cinebench R15
Cinebench R15 OpenGL 64 Bit +
Cinebench R15 - Cinebench R15 OpenGL 64 Bit
min: 138.13     avg: 149.3     median: 149.3 (9%)     max: 160.4 fps
Cinebench R15 OpenGL Ref. Match 64 Bit +
Cinebench R15 - Cinebench R15 OpenGL Ref. Match 64 Bit
97.8 % (98%)
GFXBench - GFXBench 5.0 4K Aztec Ruins High Tier Offscreen
29.6 fps (12%)
GFXBench - GFXBench 5.0 Aztec Ruins High Tier Offscreen
62.8 fps (11%)
3.3 -95%
...
NVIDIA GeForce GTX 1050 Max-Q
48.1 -23%
48.6 -23%
AMD Radeon 680M
49.2 -22%
NVIDIA GeForce GTX 1050 Ti Max-Q
49.5 -21%
AMD Radeon RX 560X (Laptop)
52.4 -17%
58.3 -7%
61.4 -2%
62.7 0%
62.7 0%
Intel Arc A350M
62.8
63.8 2%
NVIDIA Quadro T2000 Max-Q
64.8 3%
65.5 4%
Apple M1 7-Core GPU
72.4 15%
Apple M1 8-Core GPU
74.3 18%
78.8 25%
80.5 28%
83.4 33%
87.1 39%
...
536 754%
0%
100%
GFXBench - GFXBench 5.0 Aztec Ruins Normal Tier Offscreen
160 fps (12%)
GFXBench - GFXBench Car Chase Offscreen
125 fps (14%)
GFXBench 3.1 - GFXBench Manhattan ES 3.1 Offscreen
194 fps (4%)
GFXBench 3.0 - GFXBench 3.0 Manhattan Offscreen
309 fps (18%)
GFXBench (DX / GLBenchmark) 2.7
GFXBench T-Rex HD Offscreen C24Z16 +
GFXBench (DX / GLBenchmark) 2.7 - GFXBench T-Rex HD Offscreen C24Z16
640 fps (5%)
LuxMark v2.0 64Bit - LuxMark v2.0 Room GPU
1062 Samples/s (5%)
LuxMark v2.0 64Bit - LuxMark v2.0 Sala GPU
2796 Samples/s (5%)
ComputeMark v2.1 - ComputeMark v2.1 Result
4447 points (5%)
Power Consumption - Furmark Stress Test Power Consumption - external Monitor *
min: 60.5     avg: 69.4     median: 69.4 (10%)     max: 78.3 Watt
05101520253035404550556065707580Tooltip
Power Consumption - The Witcher 3 Power Consumption - external Monitor *
min: 53.2     avg: 65.1     median: 65.1 (9%)     max: 77 Watt
05101520253035404550556065707580Tooltip
Power Consumption - Witcher 3 Power Consumption *
min: 56.7     avg: 71.2     median: 71.2 (16%)     max: 85.6 Watt
0510152025303540455055606570758085Tooltip
Power Consumption - Witcher 3 ultra Power Efficiency
min: 0.2395     avg: 0.3     median: 0.3 (28%)     max: 0.3245 fps per Watt
Power Consumption - Witcher 3 ultra Power Efficiency - external Monitor
0.3 fps per Watt (29%)
Emissions Witcher 3 Fan Noise +
Emissions - Witcher 3 Fan Noise
47.5 dB(A) (76%)
- Range of benchmark values for this graphics card
- Average benchmark values for this graphics card
* Smaller numbers mean a higher performance

Game Benchmarks

The following benchmarks stem from our benchmarks of review laptops. The performance depends on the used graphics memory, clock rate, processor, system settings, drivers, and operating systems. So the results don't have to be representative for all laptops with this GPU. For detailed information on the benchmark results, click on the fps number.

low 1920x1080
37.5  fps    + Compare + 📈 Graph
med. 1920x1080
25  fps    + Compare + 📈 Graph
high 1920x1080
19.8  fps    + Compare + 📈 Graph
ultra 1920x1080
15.3  fps    + Compare + 📈 Graph
QHD 2560x1440
10.1  fps    + Compare + 📈 Graph
4K 3840x2160
3  fps    + Compare + 📈 Graph
» With all tested laptops playable in detail settings low.
Additional Benchmarks
Low Preset Low TAA 1280x720
58.3
Ultra Preset + Full Ray Tracing High TAA 1920x1080
8.3
low 1920x1080
56.3  fps    + Compare + 📈 Graph
med. 1920x1080
42.6  fps    + Compare + 📈 Graph
high 1920x1080
36.1  fps    + Compare + 📈 Graph
ultra 1920x1080
29.7  fps    + Compare + 📈 Graph
QHD 2560x1440
20.4  fps    + Compare + 📈 Graph
» With all tested laptops playable in detail settings high.
Additional Benchmarks
Low Preset / Off 1280x720
95.2
low 1920x1080
71.9  fps    + Compare + 📈 Graph
med. 1920x1080
42.6  fps    + Compare + 📈 Graph
high 1920x1080
38.2  fps    + Compare + 📈 Graph
ultra 1920x1080
27.8  fps    + Compare + 📈 Graph
QHD 2560x1440
18.8  fps    + Compare + 📈 Graph
4K 3840x2160
4.4  fps    + Compare + 📈 Graph
» With all tested laptops playable in detail settings high.
Additional Benchmarks
Low Preset 1280x720
118.1
low 1920x1080
med. 1920x1080
high 1920x1080
ultra 1920x1080
QHD 2560x1440
4K 3840x2160
» With all tested laptops playable in detail settings low.
Additional Benchmarks
Low Preset (without FSR Upscaling) 1280x720
69
low 1920x1080
41.5  fps    + Compare + 📈 Graph
med. 1920x1080
33.2  fps    + Compare + 📈 Graph
high 1920x1080
25.4  fps    + Compare + 📈 Graph
ultra 1920x1080
20.4  fps    + Compare + 📈 Graph
QHD 2560x1440
14.7  fps    + Compare + 📈 Graph
4K 3840x2160
7.2  fps    + Compare + 📈 Graph
» With all tested laptops playable in detail settings low.
Additional Benchmarks
Very Low Preset 1280x720
66
low 1920x1080
41  fps    + Compare
med. 1920x1080
37  fps    + Compare
high 1920x1080
23  fps    + Compare
ultra 1920x1080
12  fps    + Compare
QHD 2560x1440
7  fps    + Compare
4K 3840x2160
6  fps    + Compare
» With all tested laptops playable in detail settings med..
Additional Benchmarks
Basic Quality Preset T2X SMAA 1280x720
68
low 1920x1080
29.9  fps    + Compare + 📈 Graph
med. 1920x1080
24.3  fps    + Compare + 📈 Graph
high 1920x1080
20  fps    + Compare + 📈 Graph
QHD 2560x1440
13.1 16.8 ~ 15 fps    + Compare + 📈 Graph
4K 3840x2160
6.4  fps    + Compare + 📈 Graph
» The benchmarks indicate that the game is not playable in the tested settings.
Additional Benchmarks
Low Preset 1280x720
39.5
F1 22

F1 22

2022
low 1920x1080
52.1  fps    + Compare
med. 1920x1080
51.4  fps    + Compare
high 1920x1080
35.5  fps    + Compare
» With all tested laptops playable in detail settings high.
Additional Benchmarks
Ultra Low Preset 16xAF TAA 1280x720
118.4
low 1920x1080
80.6  fps    + Compare + 📈 Graph
med. 1920x1080
64.7  fps    + Compare + 📈 Graph
high 1920x1080
54.9  fps    + Compare + 📈 Graph
ultra 1920x1080
49.9  fps    + Compare + 📈 Graph
QHD 2560x1440
30.6  fps    + Compare + 📈 Graph
4K 3840x2160
10.8  fps    + Compare + 📈 Graph
» With all tested laptops playable in detail settings ultra.
Additional Benchmarks
Low Preset 1280x720
201
low 1920x1080
32.2  fps    + Compare
med. 1920x1080
30.6  fps    + Compare
high 1920x1080
29.6  fps    + Compare
ultra 1920x1080
29.2  fps    + Compare
» The benchmarks indicate that the game is not playable in the tested settings.
low 1920x1080
27.4  fps    + Compare
med. 1920x1080
18.5  fps    + Compare
high 1920x1080
16.2  fps    + Compare
ultra 1920x1080
11.6  fps    + Compare
» The benchmarks indicate that the game is not playable in the tested settings.
low 1920x1080
78  fps    + Compare
med. 1920x1080
56  fps    + Compare
high 1920x1080
41  fps    + Compare
ultra 1920x1080
28  fps    + Compare
» With all tested laptops playable in detail settings high.
low 1920x1080
26.7  fps    + Compare + 📈 Graph
med. 1920x1080
21.9  fps    + Compare + 📈 Graph
high 1920x1080
17.8  fps    + Compare + 📈 Graph
» The benchmarks indicate that the game is not playable in the tested settings.
Additional Benchmarks
Low Quality 1280x720
39.8
low 1920x1080
68  fps    + Compare
med. 1920x1080
52  fps    + Compare
high 1920x1080
45  fps    + Compare
ultra 1920x1080
30  fps    + Compare
QHD 2560x1440
17  fps    + Compare
4K 3840x2160
2.6  fps    + Compare
» With all tested laptops playable in detail settings high.
Additional Benchmarks
Ultra Low Preset (with Fixed Resolution Quality) 1280x720
130
low 1920x1080
22  fps    + Compare
med. 1920x1080
18  fps    + Compare
high 1920x1080
15  fps    + Compare
ultra 1920x1080
11  fps    + Compare
» The benchmarks indicate that the game is not playable in the tested settings.
low 1280x720
121  fps    + Compare
med. 1920x1080
63  fps    + Compare
high 1920x1080
47  fps    + Compare
ultra 1920x1080
43  fps    + Compare
» With all tested laptops playable in detail settings ultra.
low 1280x720
med. 1920x1080
50  fps    + Compare
high 1920x1080
47  fps    + Compare
ultra 1920x1080
11  fps    + Compare
QHD 2560x1440
9  fps    + Compare
4K 3840x2160
6  fps    + Compare
» With all tested laptops playable in detail settings high.
Additional Benchmarks
Low Preset 1920x1080
64
low 1280x720
60  fps    + Compare
med. 1920x1080
32  fps    + Compare
high 1920x1080
25  fps    + Compare
ultra 1920x1080
21  fps    + Compare
QHD 2560x1440
12  fps    + Compare
4K 3840x2160
7  fps    + Compare
» With all tested laptops playable in detail settings low.
Additional Benchmarks
Low Preset 1920x1080
38
low 1280x720
139.3  fps    + Compare + 📈 Graph
med. 1920x1080
60.2  fps    + Compare + 📈 Graph
high 1920x1080
48.1  fps    + Compare + 📈 Graph
ultra 1920x1080
46  fps    + Compare + 📈 Graph
QHD 2560x1440
31  fps    + Compare + 📈 Graph
4K 3840x2160
14.9  fps    + Compare + 📈 Graph
» With all tested laptops playable in detail settings ultra.
Additional Benchmarks
Low Preset (DX12) 1920x1080
87.3
F1 2021

F1 2021

2021
low 1280x720
166.6  fps    + Compare
med. 1920x1080
63.8  fps    + Compare
high 1920x1080
52.2  fps    + Compare
ultra 1920x1080
21.1  fps    + Compare
» With all tested laptops playable in detail settings high.
low 1280x720
65  fps    + Compare
med. 1920x1080
35  fps    + Compare
high 1920x1080
20  fps    + Compare
ultra 1920x1080
16  fps    + Compare
QHD 2560x1440
14  fps    + Compare
» With all tested laptops playable in detail settings low.
low 1280x720
43.1  fps    + Compare + 📈 Graph
» With all tested laptops playable in detail settings low.
Additional Benchmarks
Low-End TAAAA 1920x1080
35.2
low 1280x720
113.4  fps    + Compare + 📈 Graph
med. 1920x1080
55.6  fps    + Compare + 📈 Graph
» With all tested laptops playable in detail settings med..
low 1280x720
92  fps    + Compare
med. 1920x1080
46  fps    + Compare
high 1920x1080
37  fps    + Compare
ultra 1920x1080
27  fps    + Compare
QHD 2560x1440
17  fps    + Compare
4K 3840x2160
7  fps    + Compare
» With all tested laptops playable in detail settings high.
Strange Brigade

Strange Brigade

2018
low 1280x720
138 163.4 ~ 151 fps    + Compare
med. 1920x1080
59.8 71.6 ~ 66 fps    + Compare
high 1920x1080
47.4 58.7 ~ 53 fps    + Compare
ultra 1920x1080
40.9 49.1 ~ 45 fps    + Compare
QHD 2560x1440
36.6  fps    + Compare
4K 3840x2160
18.8 19.6 ~ 19 fps    + Compare
» With all tested laptops playable in detail settings ultra.
Far Cry 5

Far Cry 5

2018
low 1280x720
65 89 ~ 77 fps    + Compare + 📈 Graph
med. 1920x1080
39 44 ~ 42 fps    + Compare + 📈 Graph
high 1920x1080
37 41 ~ 39 fps    + Compare + 📈 Graph
ultra 1920x1080
35 38 ~ 37 fps    + Compare + 📈 Graph
QHD 2560x1440
25  fps    + Compare + 📈 Graph
4K 3840x2160
12  fps    + Compare + 📈 Graph
» With most tested laptops playable in detail settings ultra.
Additional Benchmarks
Low Preset TAA 1920x1080
49
low 1280x720
33.9 43.9 ~ 39 fps    + Compare
med. 1920x1080
29.4 32.2 ~ 31 fps    + Compare
high 1920x1080
25.8 27.9 ~ 27 fps    + Compare
4K 3840x2160
» With most tested laptops playable in detail settings low.
low 1280x720
59.3 64.8 ~ 62 fps    + Compare
med. 1920x1080
29.8 33.2 ~ 32 fps    + Compare
high 1920x1080
18.2 20.7 ~ 19 fps    + Compare
QHD 2560x1440
13.6  fps    + Compare
4K 3840x2160
7 7.3 ~ 7 fps    + Compare
» With all tested laptops playable in detail settings low.
low 1280x720
102.1 102.9 ~ 103 fps    + Compare
med. 1366x768
83.5 85.8 ~ 85 fps    + Compare
high 1920x1080
60.6 63.9 ~ 62 fps    + Compare
ultra 1920x1080
56.1 62.1 ~ 59 fps    + Compare
» With all tested laptops playable in detail settings ultra.
low 1024x768
120 140.1 ~ 130 fps    + Compare
med. 1366x768
76 83.6 ~ 80 fps    + Compare
high 1920x1080
41 45 ~ 43 fps    + Compare
ultra 1920x1080
18.4 20.5 ~ 19 fps    + Compare + 📈 Graph
4K 3840x2160
15.1  fps    + Compare
» With all tested laptops playable in detail settings high.
Additional Benchmarks
Ultra Graphics & Postprocessing (HBAO+) 3840x2160
9.8
Medium Graphics & Postprocessing 1920x1080
53.3
GTA V

GTA V

2015
low 1024x768
134.5 170.7 ~ 153 fps    + Compare
med. 1366x768
109.3 156.3 ~ 133 fps    + Compare
high 1920x1080
36.5 38 ~ 37 fps    + Compare
ultra 1920x1080
14.7 15.2 ~ 15 fps    + Compare
QHD 2560x1440
10.1  fps    + Compare
4K 3840x2160
11.1  fps    + Compare
» With all tested laptops playable in detail settings high.
Additional Benchmarks
Highest Settings possible 16xAF 4xMSAA + FXAA 3840x2160
4.7
Normal/Off 4xAF 1920x1080
116.2
Lowest Settings possible 1920x1080
142.3
lowmed.highultraQHD4K
Hogwarts Legacy37.52519.815.310.12.96
The Witcher 3 v4.0056.342.636.129.720.4
High On Life71.942.638.227.818.84.36
The Callisto Protocol42.128.312.313.98.33.1
Spider-Man Miles Morales41.533.225.420.414.77.22
Call of Duty Modern Warfare 2 20224137231276
A Plague Tale Requiem29.924.320156.4
F1 2252.151.435.5
Vampire Bloodhunt80.664.754.949.930.610.8
Ghostwire Tokyo32.230.629.629.2
Cyberpunk 2077 1.627.418.516.211.6
GRID Legends78564128
Dying Light 226.721.917.8
Rainbow Six Extraction68524530172.6
God of War22181511
Farming Simulator 22121634743
Forza Horizon 510850471196
Riders Republic60322521127
Back 4 Blood139.360.248.1463114.9
F1 2021166.663.852.221.1
Assassin´s Creed Valhalla6535201614
Flight Simulator 202043.1
Doom Eternal113.455.6
The Division 292463727177
Strange Brigade15166534536.619
Far Cry 5774239372512
X-Plane 11.1139312719.6
Final Fantasy XV Benchmark62321913.67
Dota 2 Reborn103856259
The Witcher 313080431915.1
GTA V153133371510.111.1
< 30 fps
< 60 fps
< 120 fps
≥ 120 fps
4
9
12
6
6
16
7
1
13
15
1
17
7

15
3

18


For more games that might be playable and a list of all games and graphics cards visit our Gaming List

v1.26
log 24. 06:03:13

#0 no ids found in url (should be separated by "_") +0s ... 0s

#1 not redirecting to Ajax server +0s ... 0s

#2 did not recreate cache, as it is less than 5 days old! Created at Mon, 22 Apr 2024 05:40:21 +0200 +0.001s ... 0.001s

#3 no comparison url found in template nbc.compare_page_1 needed +0.084s ... 0.085s

#4 no comparison url found in template nbc.compare_page_1 needed +0s ... 0.086s

#5 no comparison url found in template nbc.compare_page_1 needed +0s ... 0.086s

#6 no comparison url found in template nbc.compare_page_1 needed +0s ... 0.087s

#7 no comparison url found in template nbc.compare_page_1 needed +0s ... 0.087s

#8 no comparison url found in template nbc.compare_page_1 needed +0s ... 0.087s

#9 no comparison url found in template nbc.compare_page_1 needed +0s ... 0.087s

#10 no comparison url found in template nbc.compare_page_1 needed +0s ... 0.088s

#11 no comparison url found in template nbc.compare_page_1 needed +0s ... 0.088s

#12 no comparison url found in template nbc.compare_page_1 needed +0s ... 0.088s

#13 no comparison url found in template nbc.compare_page_1 needed +0s ... 0.088s

#14 composed specs +0s ... 0.088s

#15 did output specs +0s ... 0.089s

#16 start showIntegratedCPUs +0s ... 0.089s

#17 getting avg benchmarks for device 11149 +0.021s ... 0.11s

#18 got single benchmarks 11149 +0.02s ... 0.13s

#19 got avg benchmarks for devices +0s ... 0.13s

#20 min, max, avg, median took s +1.076s ... 1.206s

#21 before gaming benchmark output +0s ... 1.206s

#22 Got 179 rows for game benchmarks. +0.056s ... 1.261s

#23 composed SQL query for gamebenchmarks +0s ... 1.261s

#24 got data and put it in $dataArray +0.028s ... 1.289s

#25 benchmarks composed for output. +1.725s ... 3.014s

#26 no comparison url found in template nbc.compare_page_1 needed +0.005s ... 3.019s

#27 return log +0s ... 3.019s

Please share our article, every link counts!

» Comparison of GPUs
Detailed list of all laptop GPUs sorted by class and performance.

» Benchmark List
Sort and restrict laptop GPUs based on performance in synthetic benchmarks.

» Notebook Gaming List
Playable games for each graphics card and their average FPS results.

Class 1

GeForce RTX 2080 Super Mobile

Class 2

M1 Max 32-Core GPU *
GeForce RTX 2070 Super Mobile
M1 Max 24-Core GPU *
Quadro RTX 5000 Max-Q
Radeon RX 5700M *
GeForce GTX 1080 Mobile
Quadro RTX 4000 (Laptop)
M1 Pro 16-Core GPU *
Radeon PRO W6600M *
GeForce RTX 2070 Super Max-Q
Quadro RTX 4000 Max-Q *
M1 Pro 14-Core GPU *
Quadro P5200
Quadro RTX 3000 Max-Q *
Quadro P4200
Quadro P5000 Max-Q *
GeForce GTX 980 (Laptop)
Quadro P4000
Quadro P4000 Max-Q
Quadro P3200
Radeon RX 580X (Laptop) *
Radeon RX 580 (Laptop)
Radeon Pro 5300M
Radeon RX 5300M
Quadro P3000 Max-Q *
Quadro T2000 Max-Q *
Radeon Pro WX 7100 *
Radeon RX 570X (Laptop) *
Radeon RX 570 (Laptop) *
Radeon RX 470 (Laptop) *
Quadro T1000 Max-Q *

Class 3

Vega M GH
Quadro M5000M
GeForce GTX 1050 Ti Mobile
Radeon 680M
Quadro P2000
Quadro P2000 Max-Q
Quadro M4000M
T500 Laptop GPU *
Radeon R9 M395X
GeForce GTX 1050 Ti Max-Q *
Radeon Pro Vega 16
WX Vega M GL
Radeon R9 M485X
Quadro M3000M
FirePro W7170M
Radeon R9 M395
GeForce GTX 1050 Max-Q *
Radeon 660M
Radeon Pro WX 4150 *
Radeon RX 560X (Laptop)
Radeon RX 560 (Laptop)
Radeon RX 460 (Laptop)
Quadro P1000
Radeon R9 M390
Xe MAX
Radeon Pro 560X
Radeon Pro 560
Radeon Pro 460
Radeon Pro WX 4130 *
GeForce GTX 960M
Quadro P620 *
Radeon RX 550X (Laptop)
Radeon Pro WX 3200 *
Radeon Pro 555X
Radeon Pro 555
Radeon Pro 455
Quadro P600
Quadro M2000M
Radeon RX 540X *
Radeon Pro WX 2100 *
Radeon Pro WX 3100 *
GeForce GTX 950M
Radeon Pro 450
Radeon 630
Radeon 540X *
Radeon R9 M385X
Quadro P520
Quadro M1000M
GeForce 945M
Quadro P500 *
Iris Plus Graphics G7 (Ice Lake 64 EU) *
Vega 10 *
Iris Pro Graphics 580
FirePro W5170M *
Radeon R9 M370X
Vega 9
FirePro W5130M
UHD Graphics Xe G4 48EUs *
UHD Graphics 32EUs
UHD Graphics Xe 32EUs (Tiger Lake-H) *
UHD Graphics 750
Vega 7
Radeon R7 M465
Iris Pro Graphics 6200
Vega 8
GeForce 940M
Iris Plus Graphics G4 (Ice Lake 48 EU)
Quadro M600M
FirePro W4190M
Radeon R9 M375
Radeon R7 M445
Iris Plus Graphics 650
Iris Graphics 550
Radeon 625
Vega 6 *
Iris Plus Graphics 640
Iris Graphics 540
UHD Graphics 24EUs (Alder Lake-N) *
Radeon R7 M360
GeForce 920M
Radeon 620
Radeon R7 M340
Radeon 610
Radeon 610M *
Vega 6 *
UHD Graphics G1 (Ice Lake 32 EU)
UHD Graphics Xe 16EUs (Tiger Lake-H) *
HD Graphics 530
Radeon R5 (Bristol Ridge)
Adreno 690 *
Adreno 685 *
Adreno 680 *
Radeon R5 M330
GeForce 910M
HD Graphics 520

Class 4

UHD Graphics 730
Radeon R5 M320 *
Radeon R5 M315 *
Radeon R5 M420 *
Vega 2 *
UHD Graphics 617
UHD Graphics 615
HD Graphics 515
UHD Graphics 610
HD Graphics 510
UHD Graphics 605
Radeon R4 (Stoney Ridge)
Radeon R2 (Stoney Ridge)
HD Graphics (Broadwell)
UHD Graphics 600
HD Graphics (Braswell)

Class 5

* Approximate position of the graphics adapter