


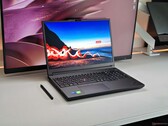
Alienware 16 Area-51 评测:新酷睿 Ultra 9 290HX Plus 不惜一切代价提供强劲动力
英特尔Arrow Lake-H今年推出了性能更强的SKU,取代了酷睿Ultra 9 275HX。然而,从相同的底层架构中榨取更高的性能也有其后果。
Intel Core Ultra 9 290HX Plus, NVIDIA GeForce RTX 5080 Laptop, 16", 3.3 kg
NvidiaGeForce RTX 5080 Laptop是一款高端笔记本显卡,在 2025 年的 CES 上亮相,并于 2025 年 4 月上市销售。
GeForce RTX 5080 移动版采用 Blackwell GB203 芯片,使用了该芯片 10,752 个核心中的 8,192 个。因此,与同类命名的桌面芯片相比,它更接近于桌面 RTX 5070(6.144 个核心) ,而不是同类命名的桌面 RTX 5080 (10.752 个核心)。不过,内存总线与台式机 RTX 5080 一样,都是 256 位总线,用于 16 GB GDDR7。
作为一项新功能,Blackwell 借助第五代张量内核,通过 DLSS4 支持多帧生成 (MFG)。
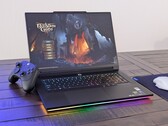
笔记本电脑 RTX 5080 的平均理论性能与台式机 RTX 5070 和较早的 RTX 4090 笔记本电脑 GPU(Time Spy GPU)相近。在游戏(如《毁灭战士:黑暗时代》)中,虽然 RTX 5080 支持前面提到的 MFG 选项以获得令人印象深刻的帧速率,但其性能也与旧版 RTX 4090 笔记本电脑 GPU 相当。不过延迟还是一样的,所以在没有帧生成的情况下,你至少应该从 60 fps 开始。
GB203 由台积电采用 4N FinFET 工艺制造(定制 4NP 5nm)。显卡的最大 TGP 可以达到 150 瓦(125 瓦 + 25 瓦 Dynamic Boost)。
GeForce RTX 5000 Laptop GPU Series
| |||||||||||||||||||
| Codename | GN22-X9 | ||||||||||||||||||
| Architecture | Blackwell | ||||||||||||||||||
| Pipelines | 8192 - unified | ||||||||||||||||||
| TMUs | 256 | ||||||||||||||||||
| ROPs | 96 | ||||||||||||||||||
| Raytracing Cores | 64 | ||||||||||||||||||
| Tensor / AI Cores | 256 | ||||||||||||||||||
| Core Speed | 975 - 2287 (Boost) MHz | ||||||||||||||||||
| AI GPU | 1334 TOPS INT8 | ||||||||||||||||||
| Cache | L1: 8 MB, L2: 64 MB | ||||||||||||||||||
| Memory Speed | 28000 effective = 1750 MHz | ||||||||||||||||||
| Memory Bus Width | 256 Bit | ||||||||||||||||||
| Memory Type | GDDR7 | ||||||||||||||||||
| Max. Amount of Memory | 16 GB | ||||||||||||||||||
| Shared Memory | no | ||||||||||||||||||
| Memory Bandwidth | 896 GB/s | ||||||||||||||||||
| API | DirectX 12_2, OpenGL 4.6, OpenCL 3.0, Vulkan 1.4 | ||||||||||||||||||
| Power Consumption | 150 Watt (80 - 150 Watt TGP) | ||||||||||||||||||
| Man. Technology | 5 nm | ||||||||||||||||||
| PCIe | 5 | ||||||||||||||||||
| Displays | 4 Displays (max.), HDMI 2.1b, DisplayPort 2.1b | ||||||||||||||||||
| Notebook Size | large | ||||||||||||||||||
| Date of Announcement | 02.01.2025 | ||||||||||||||||||
| Predecessor | GeForce RTX 4080 Laptop GPU | ||||||||||||||||||
The following benchmarks stem from our benchmarks of review laptops. The performance depends on the used graphics memory, clock rate, processor, system settings, drivers, and operating systems. So the results don't have to be representative for all laptops with this GPU. For detailed information on the benchmark results, click on the fps number.


| low | med. | high | ultra | QHD | 4K | |
|---|---|---|---|---|---|---|
| Assassin's Creed Black Flag Resynced | 135 | 108 | 97 | 64 | 50 | 29 |
| 007 First Light | 116.2 | 108.7 | 97 | 93 | 64 | 34.7 |
| Pragmata | 218 | 162.5 | 137 | 100 | 55.3 | |
| Death Stranding 2 | 109.6 | 102.9 | 102 | 82 | 64 | 39.1 |
| Crimson Desert | 144.2 | 107.1 | 105 | 93 | 71 | 42.1 |
| Resident Evil Requiem | 177.7 | 155.4 | 158 | 87 | 57 | 28.4 |
| Call of Duty Black Ops 7 | 189 | 165 | 60 | 40 | 21 | |
| Anno 117: Pax Romana | 152.2 | 121.6 | 96.9 | 55 | 38.3 | 21.1 |
| ARC Raiders | 194.4 | 156.1 | 106.4 | 78.9 | 46.1 | |
| The Outer Worlds 2 | 130.2 | 109.2 | 67.4 | 45.8 | 24 | |
| Battlefield 6 | 214 | 196.7 | 172.7 | 128.4 | 87.9 | 47.5 |
| Borderlands 4 | 96 | 75.6 | 64.1 | 45.5 | 31.5 | 16.8 |
| F1 25 | 214 | 207 | 192 | 45 | 27 | 12 |
| Doom: The Dark Ages | 101 | 106 | 95 | 90 | 65 | 34 |
| The Elder Scrolls IV Oblivion Remastered | 76 | 87 | 80 | 50 | 29 | 17.9 |
| Assassin's Creed Shadows | 103 | 94 | 82 | 61 | 52 | 37 |
| Civilization 7 | 173.4 | 165.5 | 158 | |||
| Monster Hunter Wilds | 110 | 102 | 83 | 68 | 43 | |
| Kingdom Come Deliverance 2 | 173.8 | 145.6 | 101.6 | 74.5 | ||
| Indiana Jones and the Great Circle | 170 | 130 | 119 | 93 | 58 | |
| Stalker 2 | 65.7 | 76 | 62 | 58 | 50 | 28.2 |
| Call of Duty Black Ops 6 | 183 | 167 | 128 | 119 | 91 | 72 |
| Until Dawn | 92.9 | 91 | 81.6 | 59 | ||
| Space Marine 2 | 90 | 89.7 | 88.7 | 86.2 | ||
| Star Wars Outlaws | 82.6 | 81 | 74 | 67 | 51 | 30 |
| Black Myth: Wukong | 139 | 115 | 89 | 54 | 41 | 24 |
| F1 24 | 323 | 325 | 283 | 123 | 80 | 40 |
| Senua's Saga Hellblade 2 | 99.3 | 76 | 55.1 | |||
| Ghost of Tsushima | 110.7 | 105.7 | 97.5 | 76.7 | ||
| Horizon Forbidden West | 148.2 | 117.7 | 115.5 | 90.7 | ||
| Dragon's Dogma 2 | 84.8 | 82.3 | ||||
| Helldivers 2 | 135.9 | 134.5 | 131.9 | 127.8 | ||
| Prince of Persia The Lost Crown | 356 | 356 | 356 | 356 | ||
| Avatar Frontiers of Pandora | 137 | 126 | 111 | 85 | 55 | 28 |
| Alan Wake 2 | 117 | 107 | 108 | 74 | 39 | |
| Counter-Strike 2 | 345 | 290 | 255 | 205 | ||
| Cyberpunk 2077 | 172 | 164 | 149 | 138 | 95 | 43 |
| Baldur's Gate 3 | 223 | 192 | 176 | 178 | 130 | 71 |
| Far Cry 6 | 189.8 | 164.6 | 151 | 148.7 | 139.8 | 92.2 |
| Strange Brigade | 544 | 422 | 397 | 366 | 270 | 151 |
| X-Plane 11.11 | 148 | 133 | 111 | 93 | ||
| Final Fantasy XV Benchmark | 222 | 211 | 180 | 144 | 85 | |
| Dota 2 Reborn | 225 | 198 | 192 | 176 | 161 | |
| The Witcher 3 | 648 | 574 | 419 | 205 | 167.7 | 149.5 |
| GTA V | 186 | 184 | 180 | 153 | 147 | 172 |
| low | med. | high | ultra | QHD | 4K | < 30 fps < 60 fps < 120 fps ≥ 120 fps | 10 21 | 17 26 | 22 22 | 6 20 12 | 2 13 18 10 | 11 14 5 4 |
For more games that might be playable and a list of all games and graphics cards visit our Gaming List

Acer Predator Helios 18 AI: Intel Core Ultra 9 275HX, 18.00", 3.5 kg
Review » 宏碁掠夺者 Helios 18 AI 评测:终于有了更安静的游戏笔记本电脑,但代价是什么?
Alienware 16 Area-51: Intel Core Ultra 9 275HX, 16.00", 3.3 kg
Review » Alienware 16 Area-51 笔记本电脑评测:戴尔迄今为止最好的旗舰游戏笔记本电脑
MSI Raider A18 HX A9WIG-080: AMD Ryzen 9 9955HX3D, 18.00", 3.6 kg
Review » AMD 为 Ryzen 9 9955HX3D 带来激情:微星 Raider A18 HX A9W 笔记本电脑评测
Razer Blade 16 RTX 5080: AMD Ryzen AI 9 365, 16.00", 2.1 kg
Review » Razer Blade 16 RTX 5080 笔记本电脑评测:几乎一样快,却便宜很多
Medion Erazer Beast 18 X1 MD62731: Intel Core Ultra 9 275HX, 18.00", 3.6 kg
Review » Medion Erazer Beast 18 X1 笔记本电脑评测:RTX 5080 在游戏巨头中表现如何?
Asus ROG Zephyrus G14 2025 GA403WW: AMD Ryzen AI 9 HX 370, 14.00", 1.6 kg
Review » 14 英寸GeForce RTX 5080 笔记本电脑 - 华硕 ROG Zephyrus G14 2025 评论
Asus ROG Strix G16 G615: Intel Core Ultra 9 275HX, 16.00", 2.6 kg
Review » RTX 5080 笔记本电脑是 WQHD 游戏的最佳选择 - 华硕 ROG Strix G16 G615 评测
Lenovo Legion Pro 7i 16 Gen 10: Intel Core Ultra 9 275HX, 16.00", 2.6 kg
Review » 联想Legion Pro 7i 16 代 10 笔记本电脑评测:几乎无损的 400 W 电源
Schenker XMG Neo 16 A25 5080 Engineering Sample: AMD Ryzen 9 9955HX
Review » XMG Neo 16 2025 预览版--配备 AMD、RTX 5000 和 300 Hz Mini-LED 的最快游戏笔记本电脑
Review » NvidiaGeForce RTX 5090 笔记本电脑分析--速度更快,但还有更多惊喜等着你
MSI Stealth 16 AI+ B3WI: Intel Core Ultra 9 386H, 16.00", 2 kg
External Review » MSI Stealth 16 AI+ B3WI - 评测与配置
MSI Raider 16 Max HX B2WI: Intel Core Ultra 9 290HX Plus, 16.00", 2.6 kg
External Review » MSI Raider 16 Max HX B2WI - 评测与配置
MSI Raider A16 HX B8WI: AMD Ryzen 9 8940HX, 16.00", 2.5 kg
External Review » MSI Raider A16 HX B8WI - 评测与配置
Asus ROG Zephyrus G16 GU606AW: Intel Core Ultra 9 386H, 16.00", 2 kg
External Review » 华硕 ROG Zephyrus G16 GU606AW - 评测与配置
Aorus Master 16 AM6J: AMD Ryzen 9 9955HX3D, 16.00", 2.3 kg
External Review » Aorus Master 16 AM6J - 评测与配置
Asus ROG Zephyrus G14 GU405AW: Intel Core Ultra 9 386H, 14.00", 1.6 kg
External Review » Asus ROG Zephyrus G14 GU405AW
Alienware 16 Area-51 Core Ultra 9 290HX Plus: Intel Core Ultra 9 290HX Plus, 16.00", 3.3 kg
External Review » Alienware 16 Area-51 Core Ultra 9 290HX Plus
HP Omen Max 16 ah000: Intel Core Ultra 9 275HX, 16.00"
External Review » HP Omen Max 16 ah000
Asus ProArt P16 H7606WW: AMD Ryzen AI 9 HX 370, 16.00", 1.9 kg
External Review » Asus ProArt P16 H7606WW
HP Omen Max 16-ak0000: AMD Ryzen AI 9 HX 375, 16.00", 2.7 kg
External Review » HP Omen Max 16-ak0000
Gigabyte Gaming A16 Pro GA6DH: Intel Core 7 240H, 16.00", 2.3 kg
External Review » Gigabyte Gaming A16 Pro GA6DH
Asus ROG Strix G16 G615LW: Intel Core Ultra 9 275HX, 16.00", 2.5 kg
External Review » Asus ROG Strix G16 G615LW
Lenovo Legion 9 18IAX10: Intel Core Ultra 9 275HX, 18.00", 3.5 kg
External Review » Lenovo Legion 9 18IAX10
Lenovo Legion 9 18IAX10, RTX 5080: Intel Core Ultra 9 275HX, 18.00", 3.5 kg
External Review » Lenovo Legion 9 18IAX10, RTX 5080
MSI Raider A18 HX A9WIG-080: AMD Ryzen 9 9955HX3D, 18.00", 3.6 kg
External Review » MSI Raider A18 HX A9WIG-080
Asus ROG Strix G18 G815LW: Intel Core Ultra 9 275HX, 18.00", 3.2 kg
External Review » Asus ROG Strix G18 G815LW
Alienware 16 Area-51: Intel Core Ultra 9 275HX, 16.00", 3.3 kg
External Review » Alienware 16 Area-51
Acer Predator Helios 18 AI PH18-73, RTX 5080: Intel Core Ultra 9 275HX, 18.00", 3.2 kg
External Review » Acer Predator Helios 18 AI PH18-73, RTX 5080
MSI Vector 17 HX AI A2XWIG: Intel Core Ultra 9 275HX, 17.00", 3 kg
External Review » MSI Vector 17 HX AI A2XWIG
Razer Blade 18 2025 RTX 5080: Intel Core Ultra 9 275HX, 18.00", 3 kg
External Review » Razer Blade 18 2025 RTX 5080
Alienware 18 Area-51, RTX 5080: Intel Core Ultra 9 275HX, 18.00", 4.3 kg
External Review » Alienware 18 Area-51, RTX 5080
MSI Titan 18 HX AI A2XWIG: Intel Core Ultra 9 285HX, 18.00", 3.6 kg
External Review » MSI Titan 18 HX AI A2XWIG
Asus ROG Zephyrus G14 2025 GA403WW: AMD Ryzen AI 9 HX 370, 14.00", 1.6 kg
External Review » Asus ROG Zephyrus G14 2025 GA403WW
MSI Stealth 18 HX AI A2XWIG: Intel Core Ultra 9 275HX, 17.00", 2.9 kg
External Review » MSI Stealth 18 HX AI A2XWIG
Asus ROG Zephyrus G16 GU605CW: Intel Core Ultra 9 285H, 16.00", 2 kg
External Review » Asus ROG Zephyrus G16 GU605CW
Alienware 16 Area-51, RTX 5080: Intel Core Ultra 9 275HX, 16.00", 3.4 kg
External Review » Alienware 16 Area-51, RTX 5080
Asus ROG Strix G16 G615: Intel Core Ultra 9 275HX, 16.00", 2.6 kg
External Review » Asus ROG Strix G16 G615
Asus ROG Strix Scar 16 G635LW: Intel Core Ultra 9 275HX, 16.00", 2.8 kg
External Review » Asus ROG Strix Scar 16 G635LW
Lenovo Legion Pro 7i 16 Gen 10: Intel Core Ultra 9 275HX, 16.00", 2.6 kg
External Review » Lenovo Legion Pro 7i 16 Gen 10
MSI Vector A18 HX A9WIG: AMD Ryzen 9 9955HX, 18.00", 3.6 kg
External Review » MSI Vector A18 HX A9WIG
Asus ROG Strix Scar 18 G835LW: Intel Core Ultra 9 275HX, 18.00", 3.3 kg
External Review » Asus ROG Strix Scar 18 G835LW
MSI Vector 16 HX AI A2XWIG: Intel Core Ultra 9 275HX, 16.00", 2.7 kg
External Review » MSI Vector 16 HX AI A2XWIG
Aorus Master 16 AM6H, RTX 5080 (BYH): Intel Core Ultra 9 275HX, 16.00", 2.5 kg
External Review » Aorus Master 16 AM6H, RTX 5080 (BYH)
MSI Raider 18 HX AI A2XWIG: Intel Core Ultra 9 285HX, 18.00", 3.6 kg
External Review » MSI Raider 18 HX AI A2XWIG
Razer Blade 16 RTX 5080: AMD Ryzen AI 9 365, 16.00", 2.1 kg
External Review » Razer Blade 16 RTX 5080
Lenovo Legion Pro 7 16IAX10H : Intel Core Ultra 9 275HX, 16.00", 2.3 kg
External Review » Lenovo Legion Pro 7 16IAX10H
HP Omen Max 16-ah0000ng: Intel Core Ultra 9 275HX, 16.00", 2.7 kg
External Review » HP Omen Max 16-ah0000ng
Alienware 16 Area-51 Core Ultra 9 290HX Plus: Intel Core Ultra 9 290HX Plus, 16.00", 3.3 kg
» 对于游戏而言,Alienware 16 上的超大音量超频模式基本没有必要
» 酷睿至尊 9 290HX Plus 是最热的移动 CPU 之一,负载下温度超过 100 C
» 配备酷睿 Ultra 9 290HX Plus 的全新 Alienware 16 速度惊人,但也有后遗症
» 如果不是因为一个大问题,新的 OLED 选项正是 Alienware 16 所需要的
Lenovo ThinkPad T16g Gen 3 RTX 5080: Intel Core Ultra 9 275HX, 16.00", 2.6 kg
» 联想的 ThinkPad T16g Gen 3 配备了 Thunderbolt 5 和 Tandem OLED 屏幕,但只有慢速版的 RTX 5080
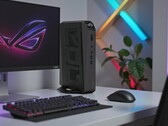
Asus ROG NUC 15-90AS00I1: Intel Core Ultra 9 275HX, 3 kg
» 华硕 ROG NUC 15 在评测中给人留下深刻印象,在迷你游戏电脑中独占鳌头 - 英特尔-英伟达双核处理器带来高端性能
Lenovo Legion 9 18IAX10: Intel Core Ultra 9 275HX, 18.00", 3.5 kg
» 被低估的联想Legion 9 18 比雷蛇、微星等公司的笔记本电脑有更多升级选项
» 如果设置为平衡模式,联想Legion 9 18 性能下降 20% 以上
Alienware 16 Area-51: Intel Core Ultra 9 275HX, 16.00", 3.3 kg
» 尺寸依然重要:Alienware 16 Area-51 RTX 5080 性能超越 Razer Blade 16 RTX 5090
» Alienware 16 Area-51 将其最快的 175 W TGP 图形模式锁定在最响亮的风扇设置后面
MSI Raider A18 HX A9WIG-080: AMD Ryzen 9 9955HX3D, 18.00", 3.6 kg
» 18 英寸笔记本电脑:这一类别不应仅限于微星 Raider A18 这样的游戏笔记本电脑
Asus ROG Zephyrus G14 2025 GA403WW: AMD Ryzen AI 9 HX 370, 14.00", 1.6 kg
» 华硕 ROG Zephyrus G14:最快的 14 英寸游戏机,却没有 5090,错失良机
Asus ROG Strix G16 G615: Intel Core Ultra 9 275HX, 16.00", 2.6 kg
» 华硕 ROG Strix G16 2025 评测结论:不错的 RTX 5080 游戏笔记本电脑,但更快的 Ryzen 9 9955HX 仅支持 RTX 5070 Ti
» Comparison of GPUs
Detailed list of all laptop GPUs sorted by class and performance.
» Benchmark List
Sort and restrict laptop GPUs based on performance in synthetic benchmarks.
» Notebook Gaming List
Playable games for each graphics card and their average FPS results.
* Approximate position of the graphics adapter
» Notebookcheck多媒体笔记本电脑Top 10排名
» Notebookcheck游戏笔记本电脑Top 10排名
» Notebookcheck低价办公/商务笔记本电脑Top 10排名
» Notebookcheck高端办公/商务笔记本电脑Top 10排名
» Notebookcheck工作站笔记本电脑Top 10排名
» Notebookcheck亚笔记本电脑Top 10排名
» Notebookcheck超级本产品Top 10排名
» Notebookcheck变形本产品Top 10排名
» Notebookcheck平板电脑Top 10排名
» Notebookcheck智能手机Top 10排名
» Notebookcheck评测过最出色的笔记本电脑屏幕
» Notebookcheck售价500欧元以下笔记本电脑Top 10排名
» Notebookcheck售价300欧元以下笔记本电脑Top 10排名