宏碁TravelMate P6(2021)评论。欢迎对已经有能力的商务笔记本电脑进行改进,但并非没有注意事项
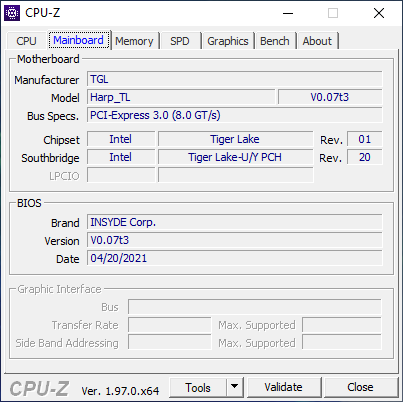
宏碁公司 最近刷新了它的TravelMate系列商务笔记本有英特尔Tiger Lake 。我们带来了宏碁TravelMate P6 P614P-52笔记本电脑供我们评测。今年的TravelMate P6是根据以下标准制造的 Intel Evo平台的要求,并配备了5G连接、16:10显示屏、Thunderbolt 4端口等便利条件。新的TravelMate系列可望于9月在欧洲、中东和非洲地区上市,12月在北美上市。
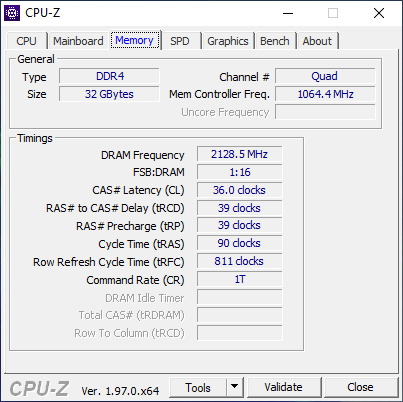
我们测试的TravelMate P6 P614P-52设备配备了 英特尔酷睿i7-1165G7处理器,32GB LPDDR4X内存,1TB PCIe SSD,以及14英寸16:10 FHD显示屏。这个模型还提供5G和NFC连接。在这篇评论中,我们对更新的TravelMate P6进行评估,看看它在竞争的商务笔记本电脑中表现如何。
注:由于新的TravelMate P6尚未在全球上市,宏碁给我们送来了一个预生产单位供评估。因此,在写这篇文章时,集成的指纹识别器、Windows Hello相机、宏碁用户感应技术等的驱动程序还没有正式推出。因此,我们目前不会对该设备进行评级。宏碁向我们证实,这些驱动程序将在9月的某个时候在官方支持网站上提供。
Potential competitors in comparison
Rating | Date | Model | Weight | Height | Size | Resolution | Price |
|---|---|---|---|---|---|---|---|
v (old) | 09 / 2021 | Acer TravelMate P614P-52 i7-1165G7, Iris Xe G7 96EUs | 1 kg | 16.8 mm | 14.00" | 1920x1200 | |
| 89.4 % v7 (old) | 08 / 2021 | Lenovo ThinkPad T14s G2 20WM003TGE i7-1165G7, Iris Xe G7 96EUs | 1.3 kg | 16.14 mm | 14.00" | 1920x1080 | |
| 87.1 % v7 (old) | 09 / 2021 | Asus ExpertBook B9 B9400CE-KC0166R i7-1165G7, Iris Xe G7 96EUs | 995 g | 14.9 mm | 14.00" | 1920x1080 | |
| 88 % v7 (old) | 08 / 2021 | HP EliteBook 830 G8-i7-1165G7 i7-1165G7, Iris Xe G7 96EUs | 1.3 kg | 18 mm | 13.30" | 1920x1080 | |
| 85.5 % v7 (old) | 08 / 2021 | Lenovo ThinkPad E15 G3-20YG003UGE R7 5700U, Vega 8 | 1.8 kg | 18.9 mm | 15.60" | 1920x1080 | |
| 82.1 % v7 (old) | Asus VivoBook S15 D533UA R7 5700U, Vega 8 | 1.8 kg | 16.1 mm | 15.60" | 1920x1080 | ||
| 85.4 % v7 (old) | 08 / 2021 | Framework Laptop 13.5 i7-1165G7, Iris Xe G7 96EUs | 1.3 kg | 15.85 mm | 13.50" | 2256x1504 | |
| 89 % v7 (old) | 09 / 2021 | Dell Latitude 9420 2-in-1 i7-1185G7, Iris Xe G7 96EUs | 1.5 kg | 13.94 mm | 14.00" | 2560x1600 | |
| 86.6 % v7 (old) | 12 / 2020 | Razer Book 13 FHD i7-1165G7, Iris Xe G7 96EUs | 1.4 kg | 15.15 mm | 13.40" | 1920x1200 |
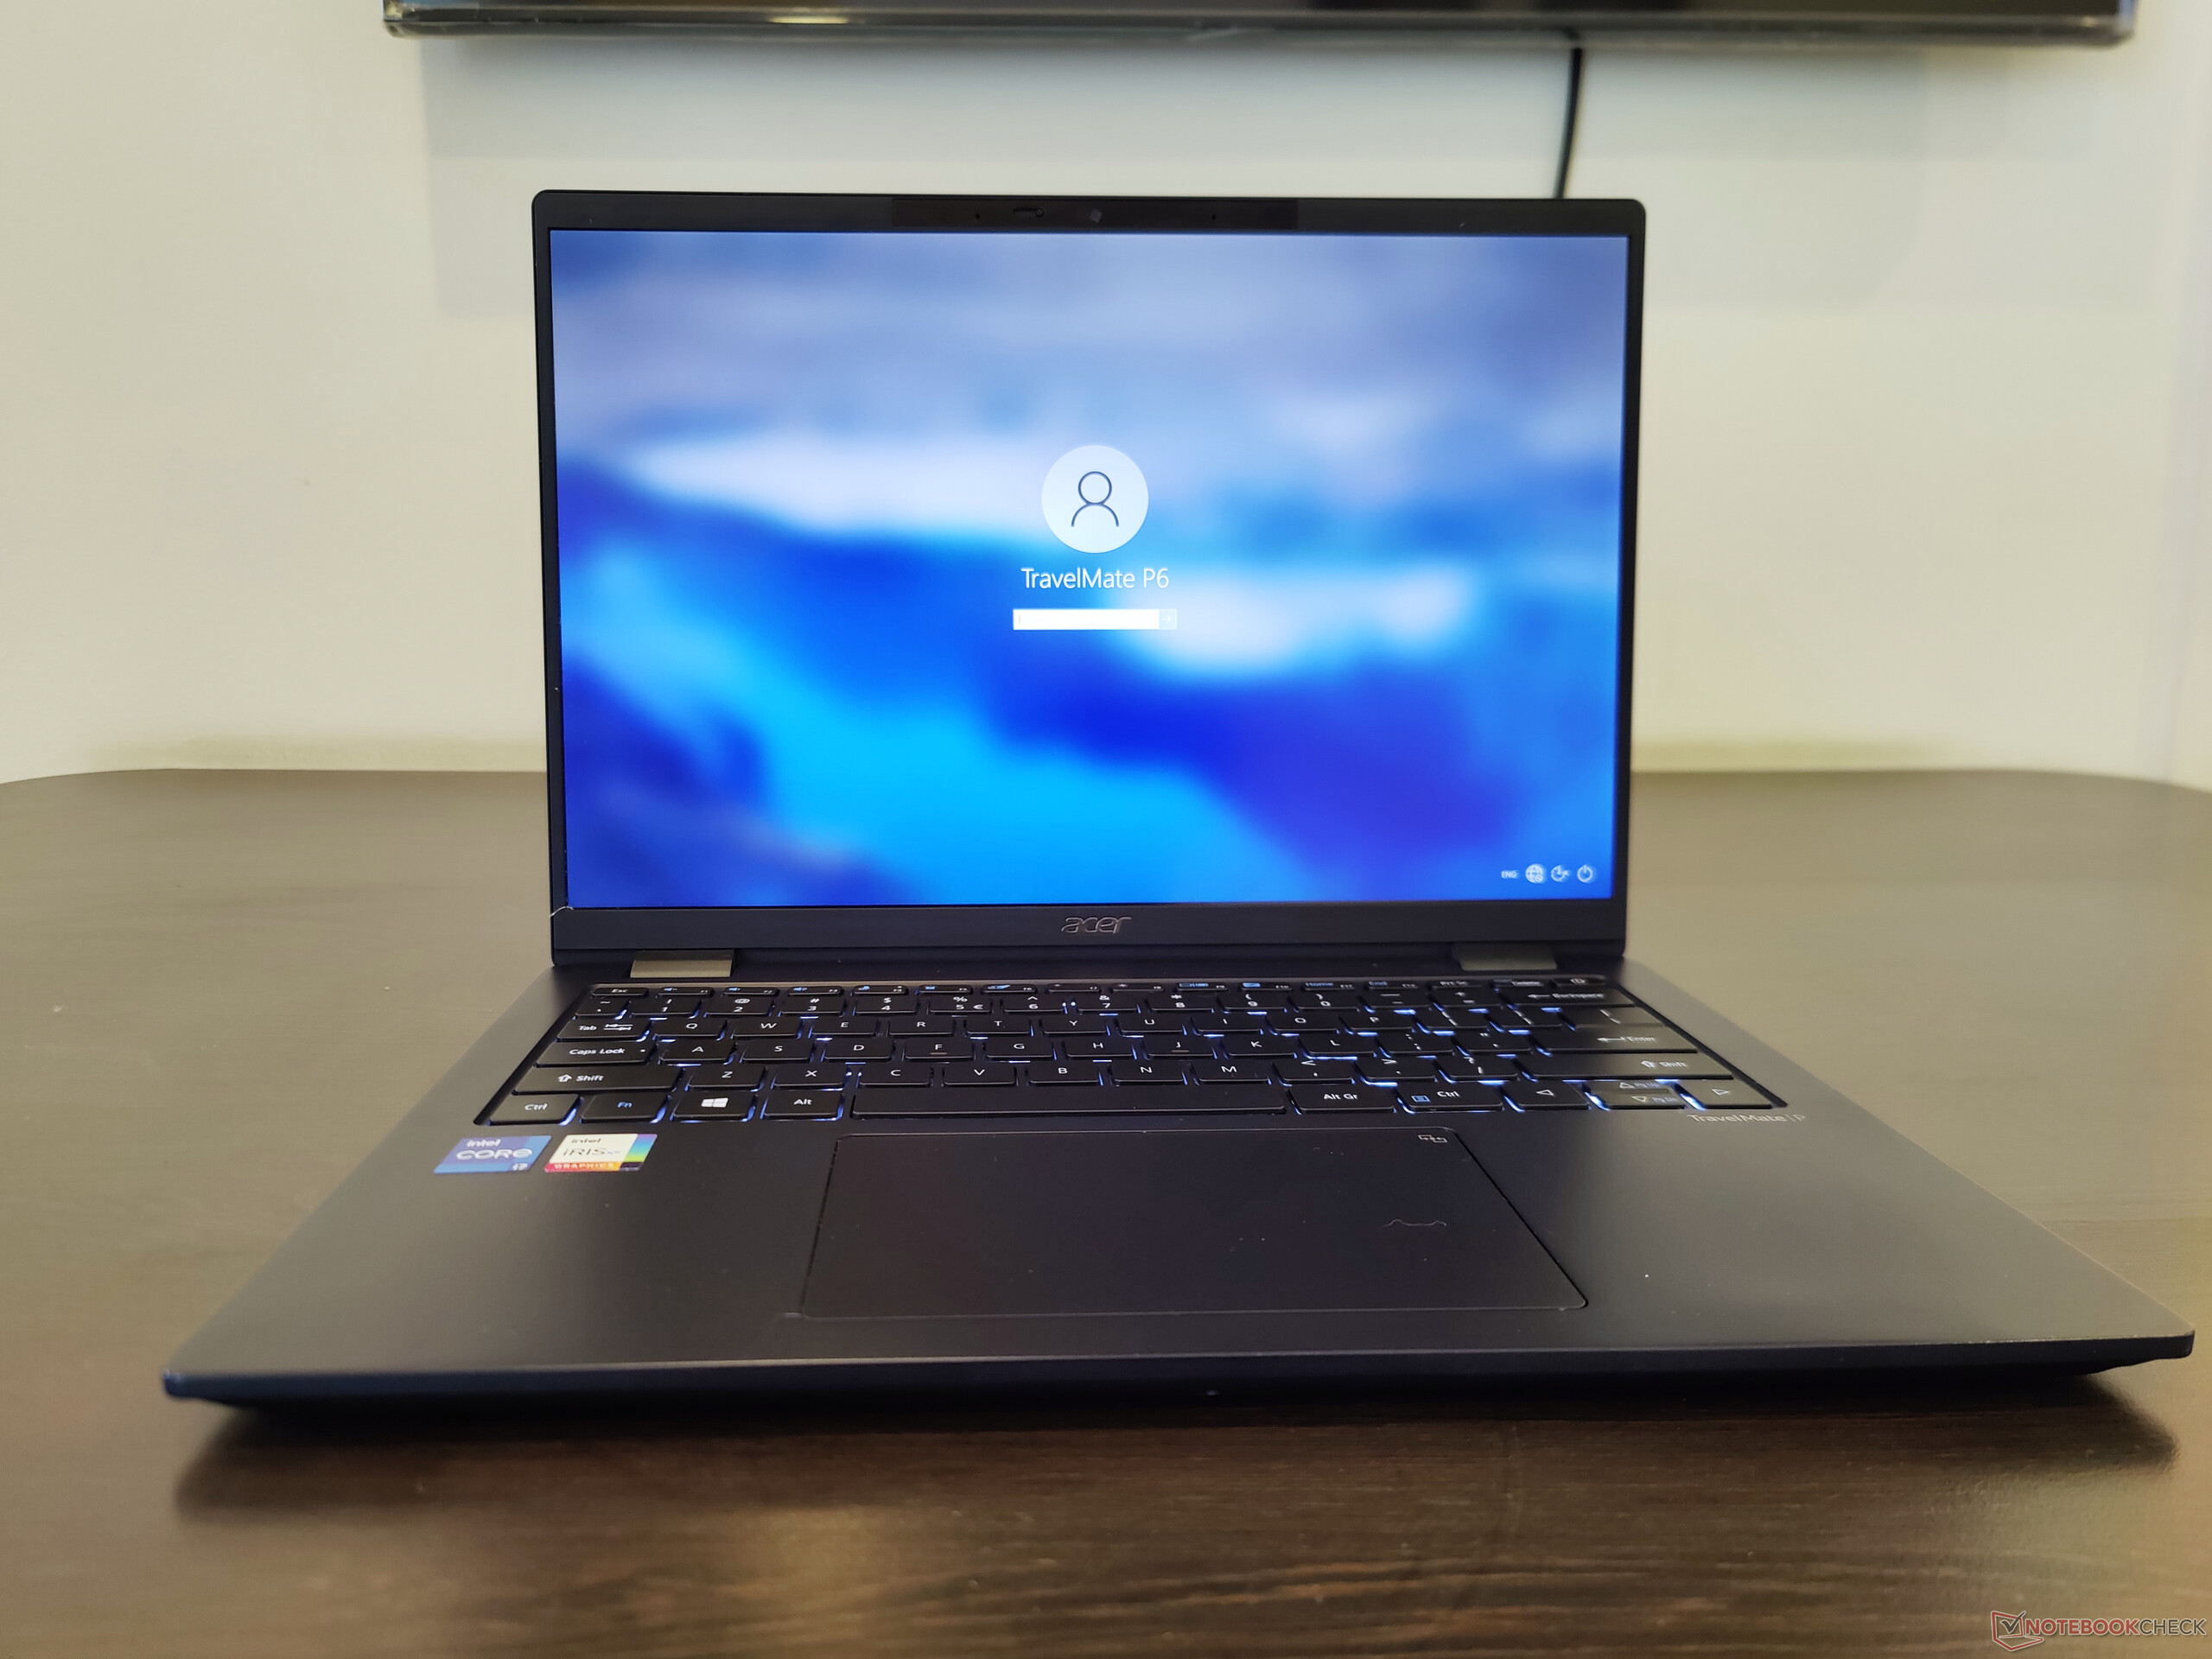
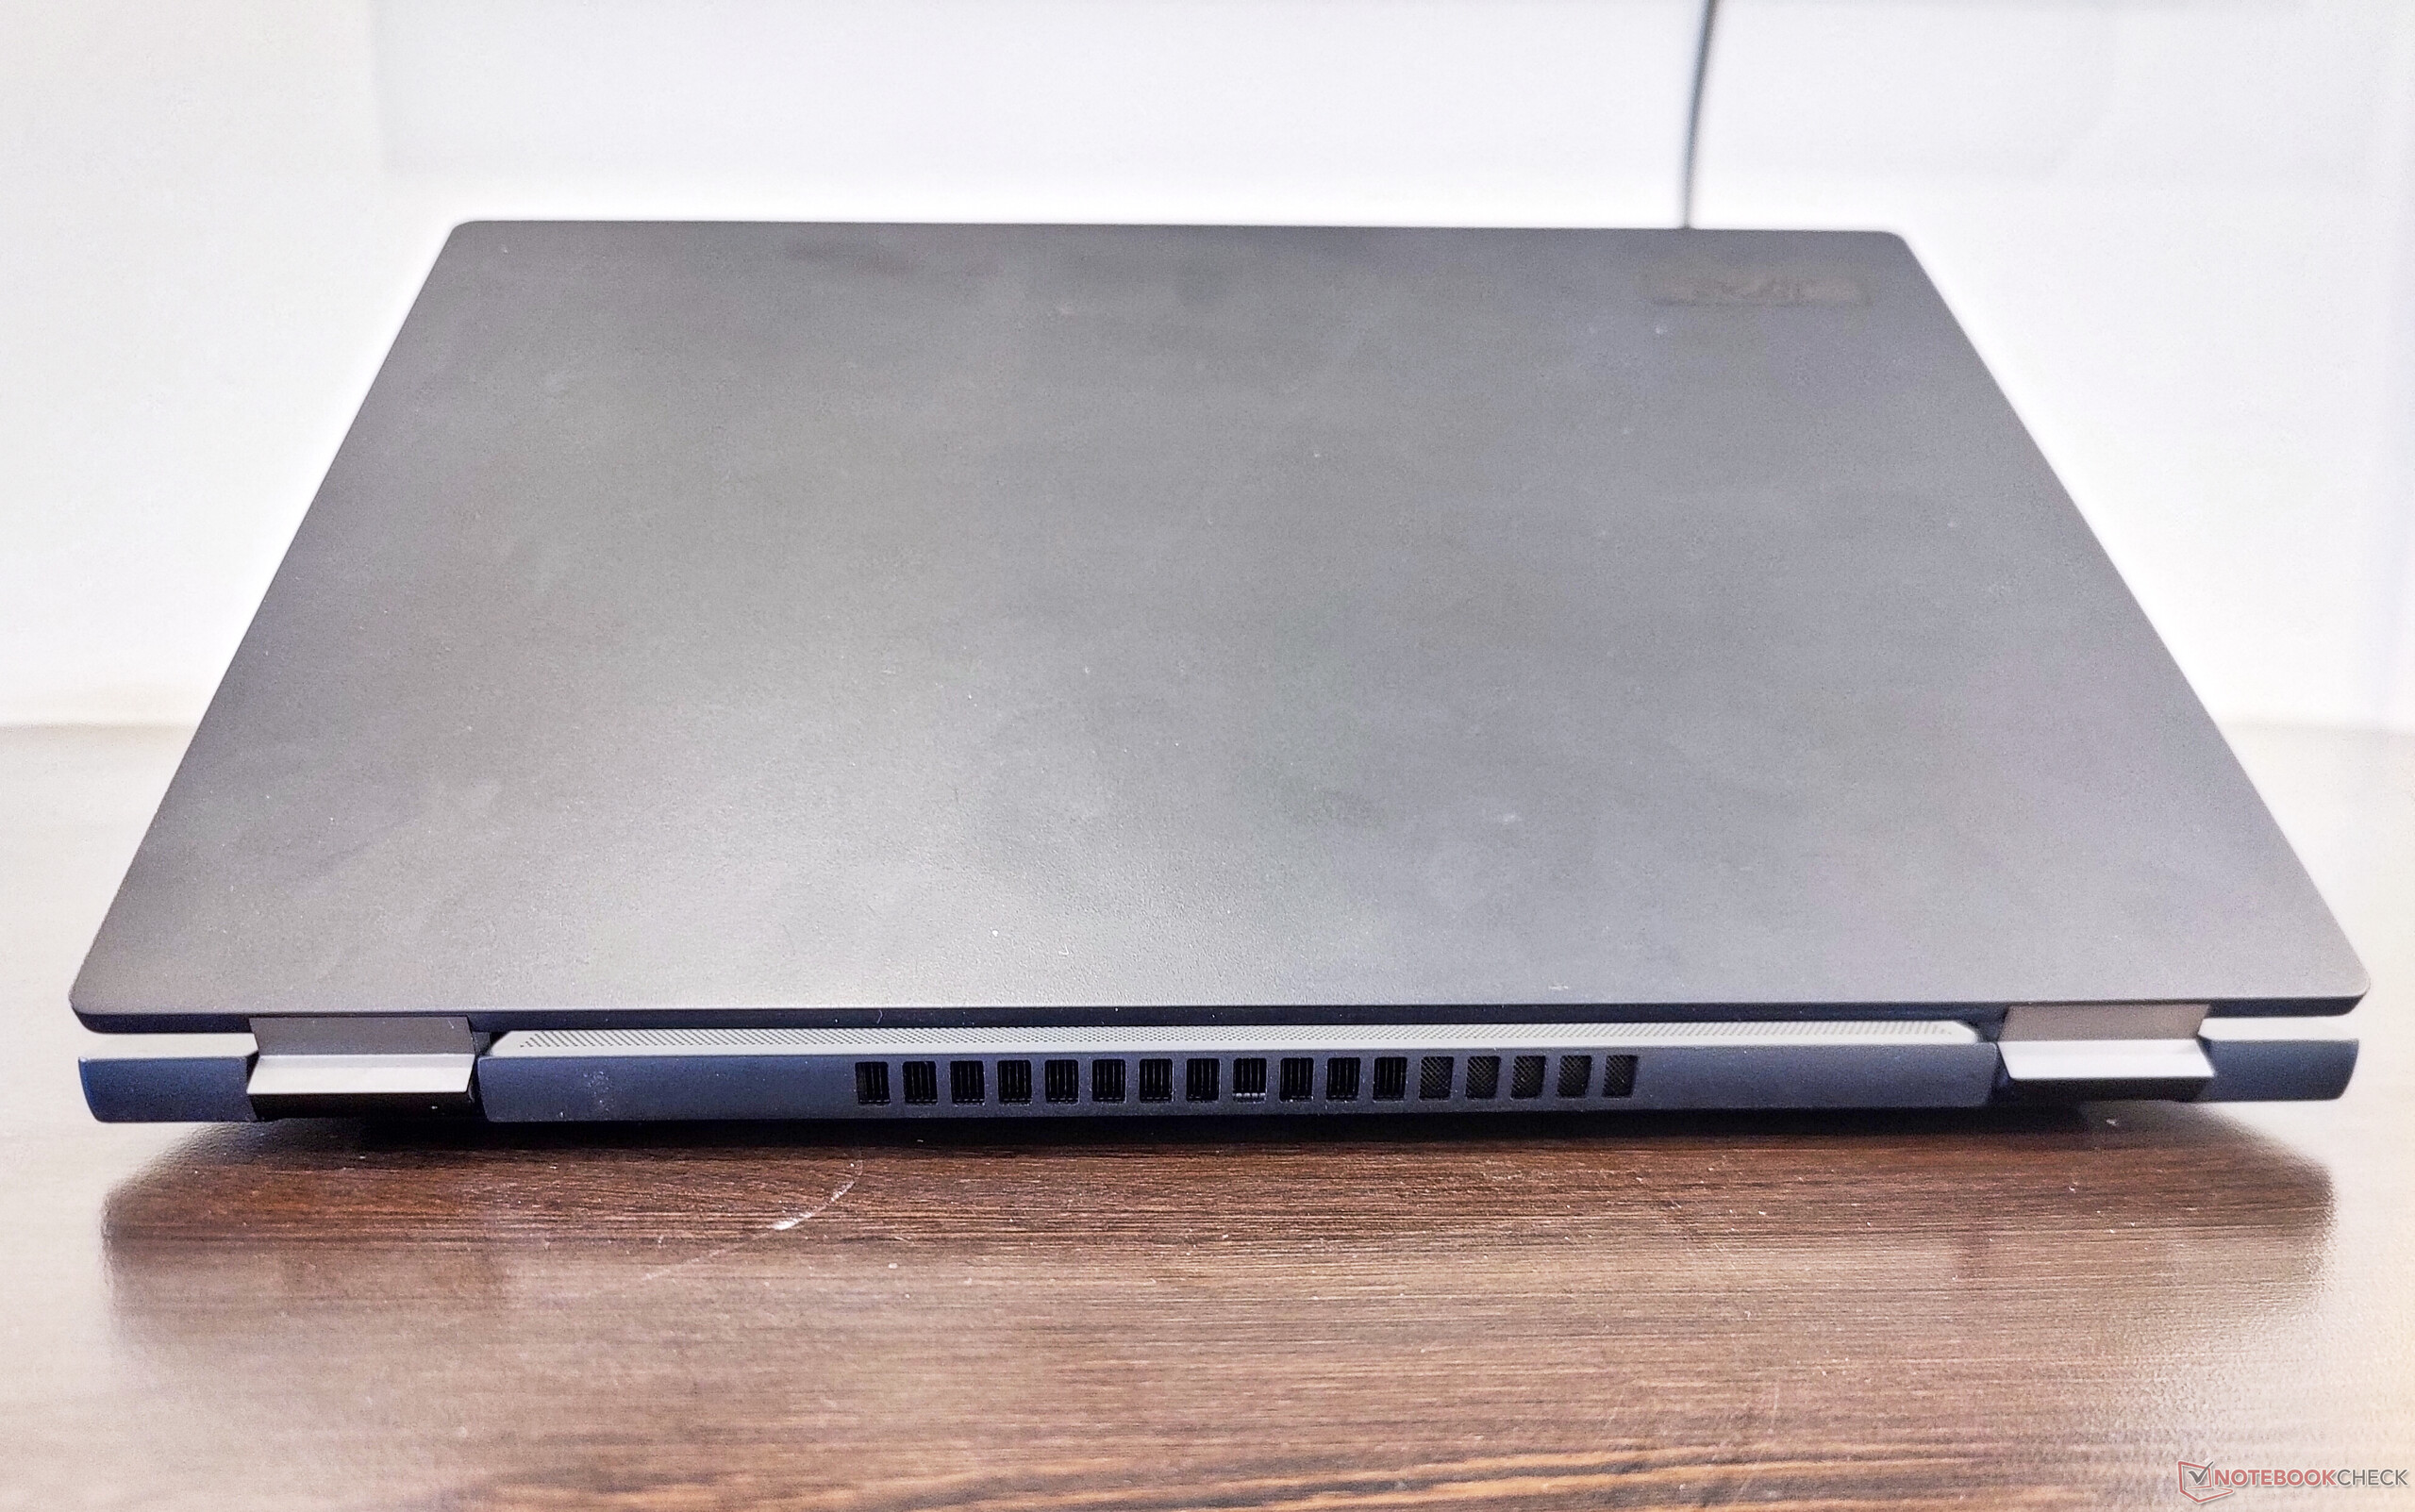
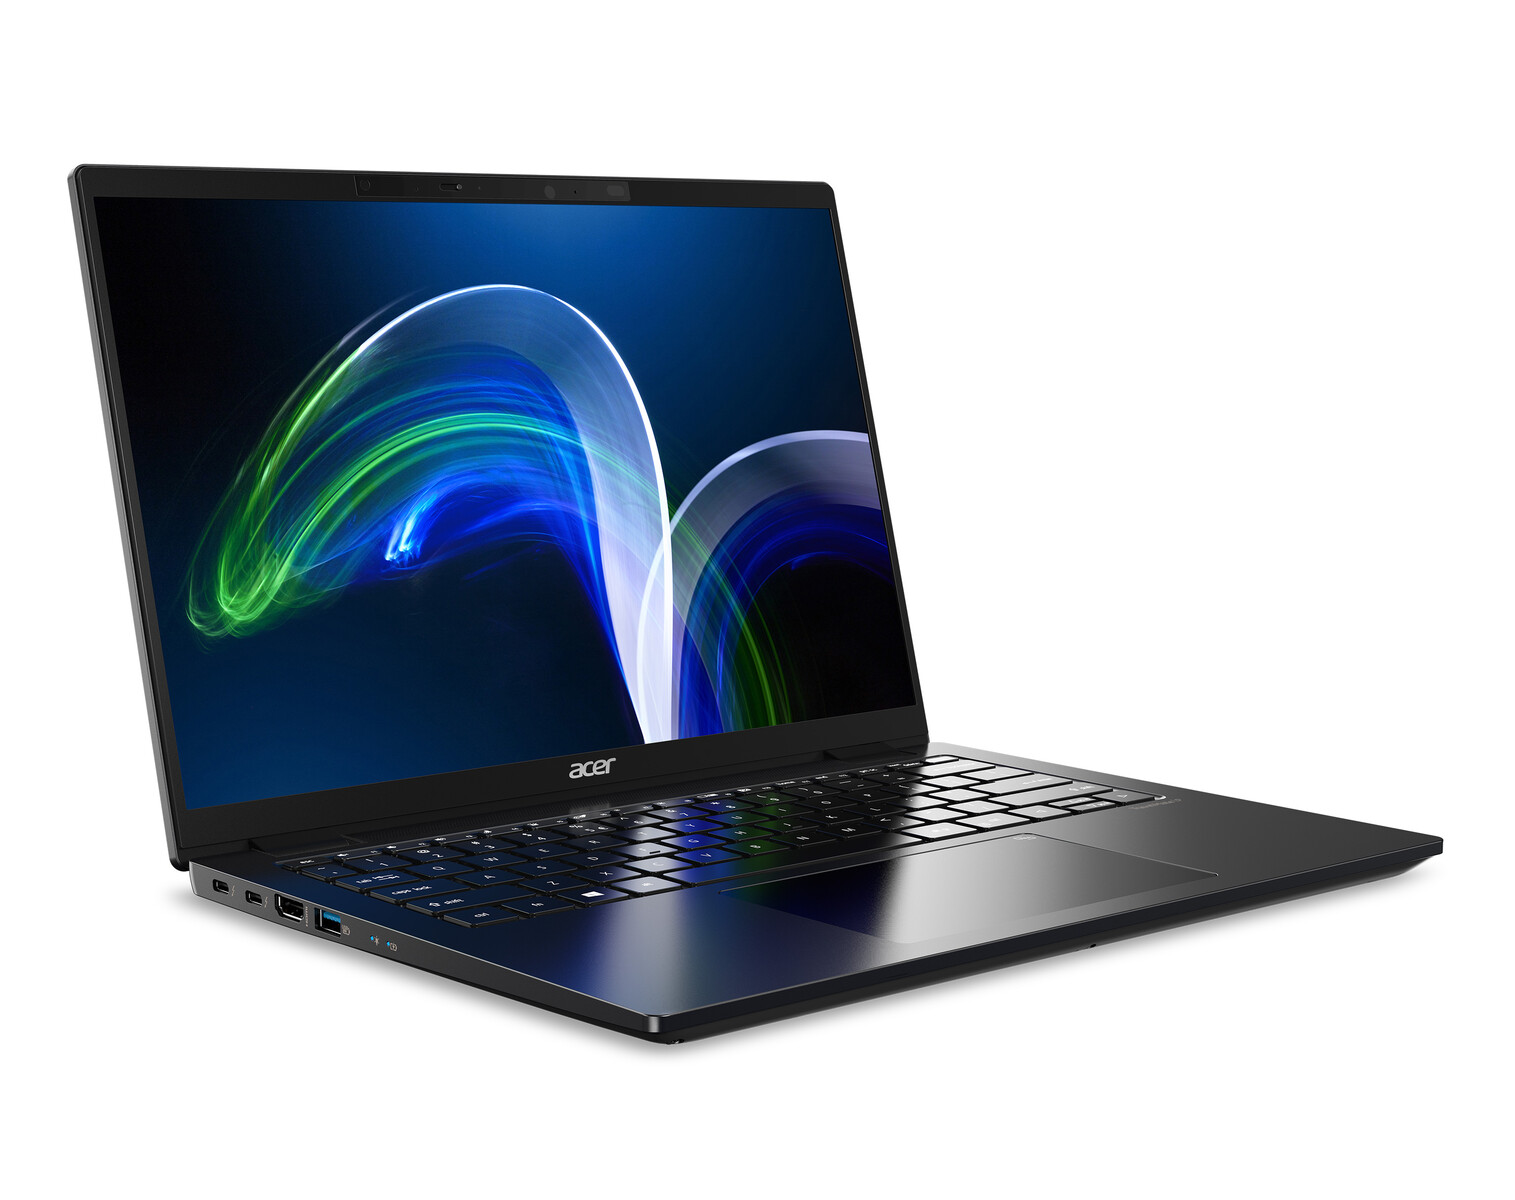
外壳:为公路而建,但重量轻
去年的TravelMate P6已经是最轻的商务笔记本电脑之一,其重量仅为1.17公斤。今年,宏碁进一步减轻了重量,仅有1公斤。宏碁TravelMate P6 P614P-52是英特尔Evo认证的设计,但不会引起任何关注。它保持了一个最小的轮廓,对于预期的商业受众来说非常有效。
机身主要由铝镁合金制成,厚度仅为16.8毫米,但整体质地确实有塑料感。盖子相当薄,在压力下确实有点弯曲。虽然如此,它铰链也感觉相当结实。当按下盖子的背面时,我们没有注意到显示器上有任何人工痕迹。
用一根手指就可以轻松地掀开盖子,而不会导致笔记本滑动,并且可以完全平放旋转180°。我们没有注意到机箱结构中的任何嘎吱声、弯曲或尖锐的角落,除了内部的显示屏边框,它似乎不太能牢固地连接到LCD面板上。据宏碁称,TravelMate P6通过了MIL-STD 810H认证,可以持久运行。
连接性。慢速microSD和Wi-Fi
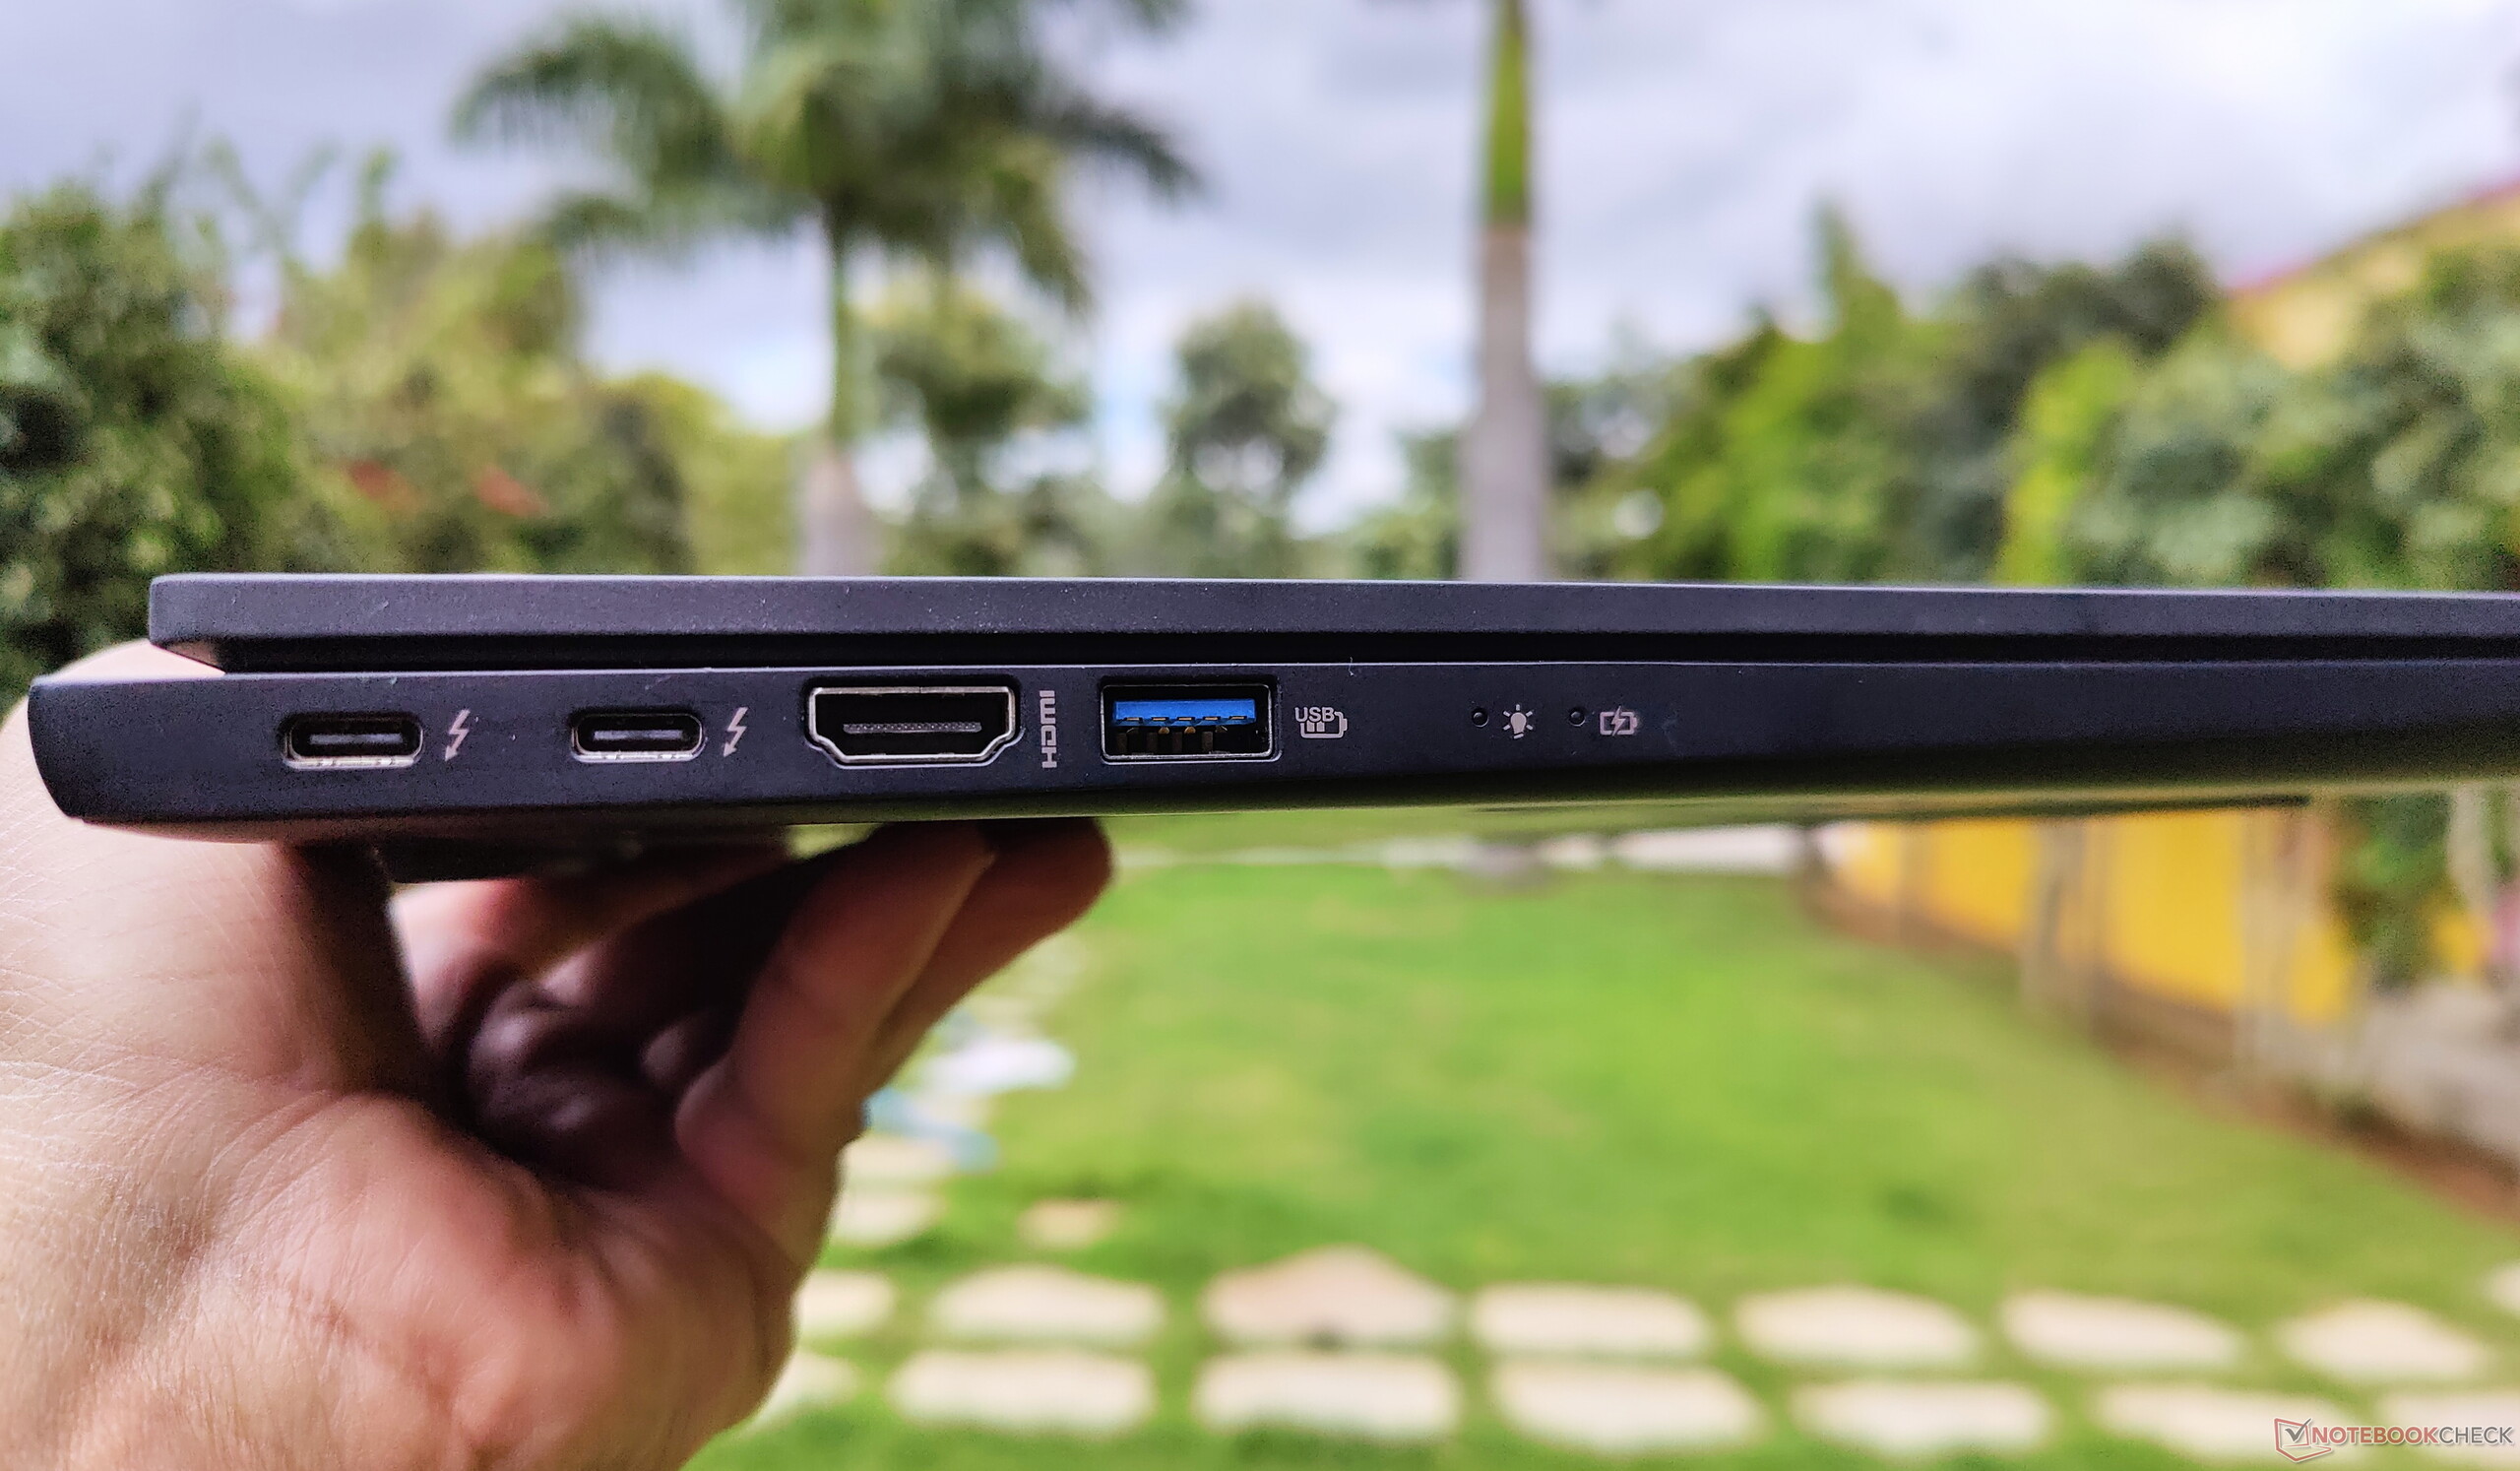
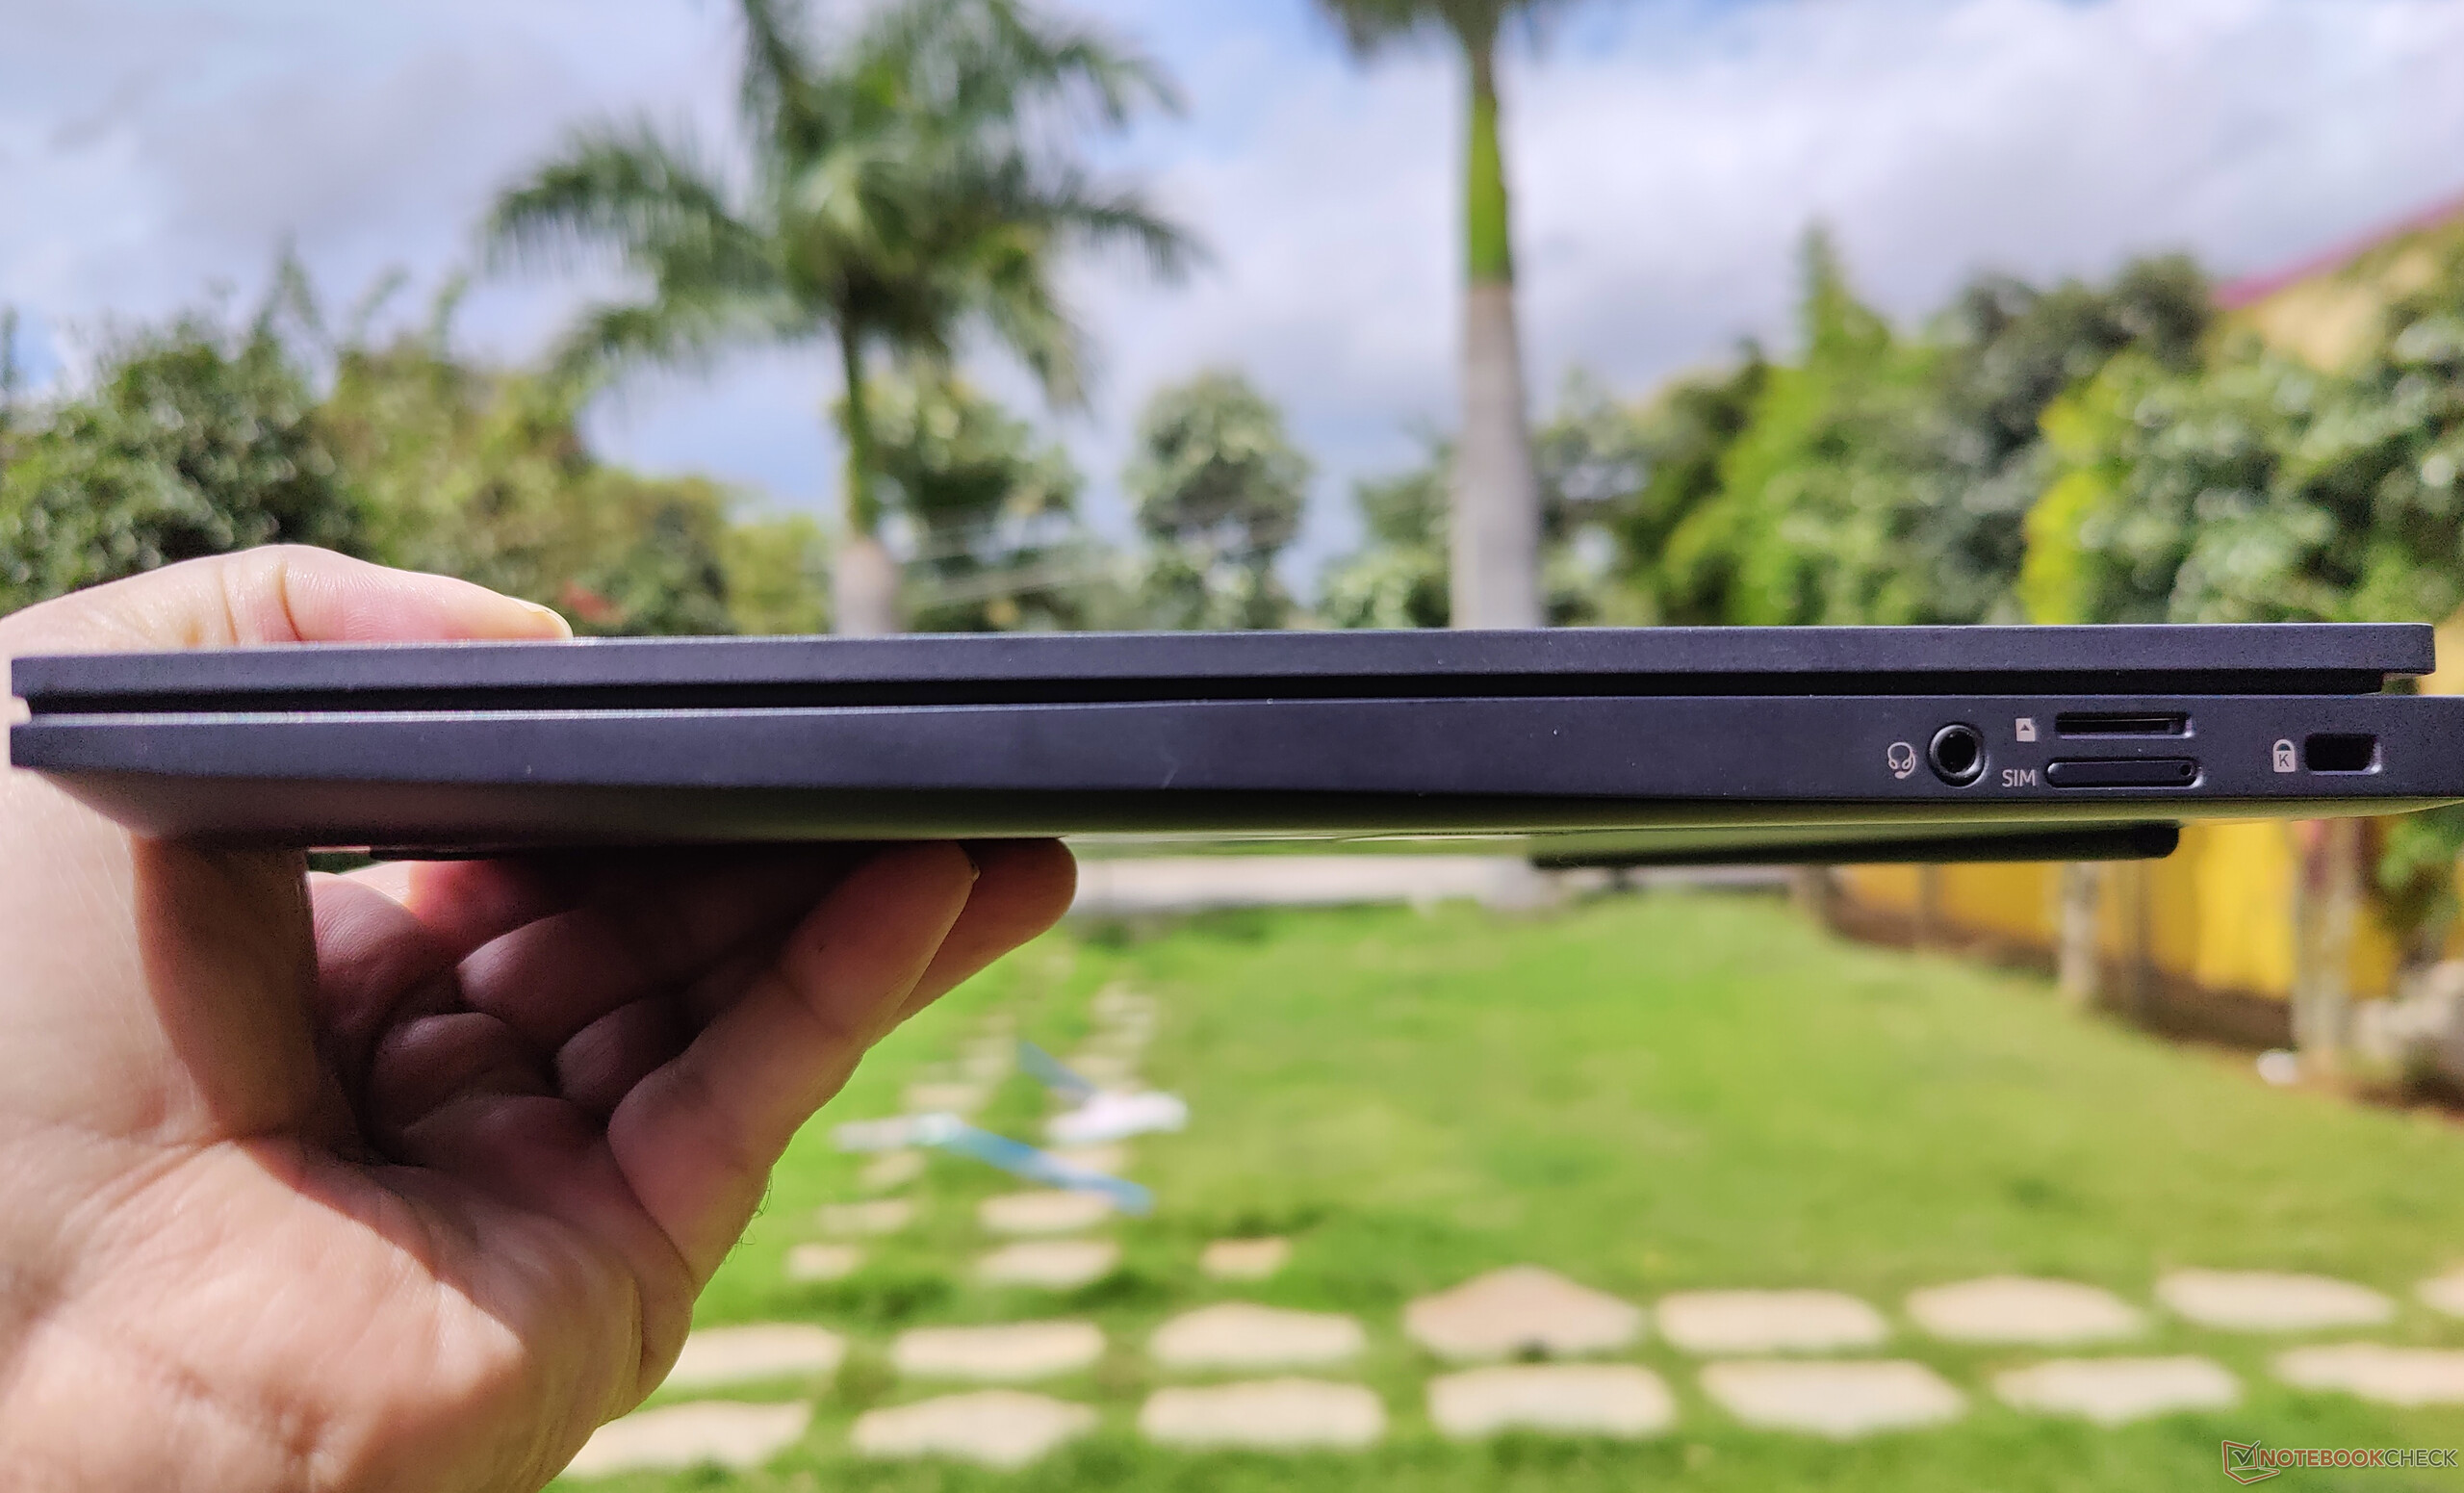
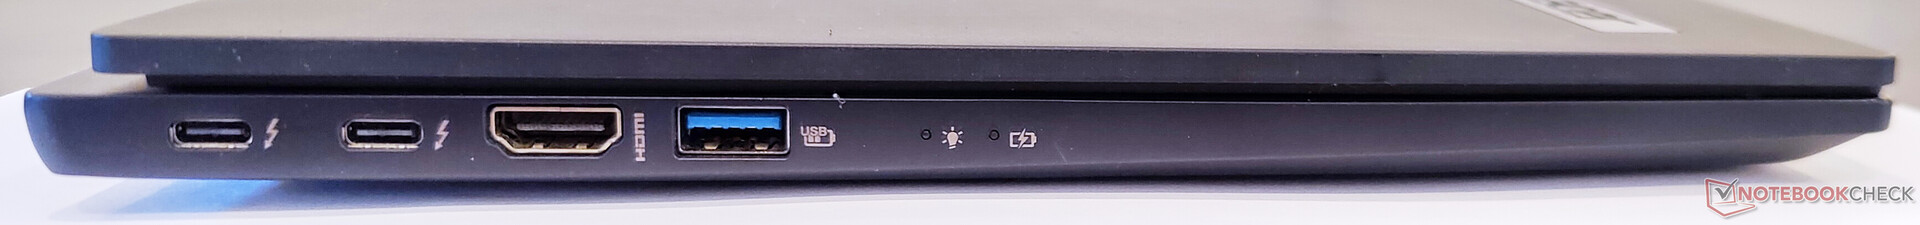
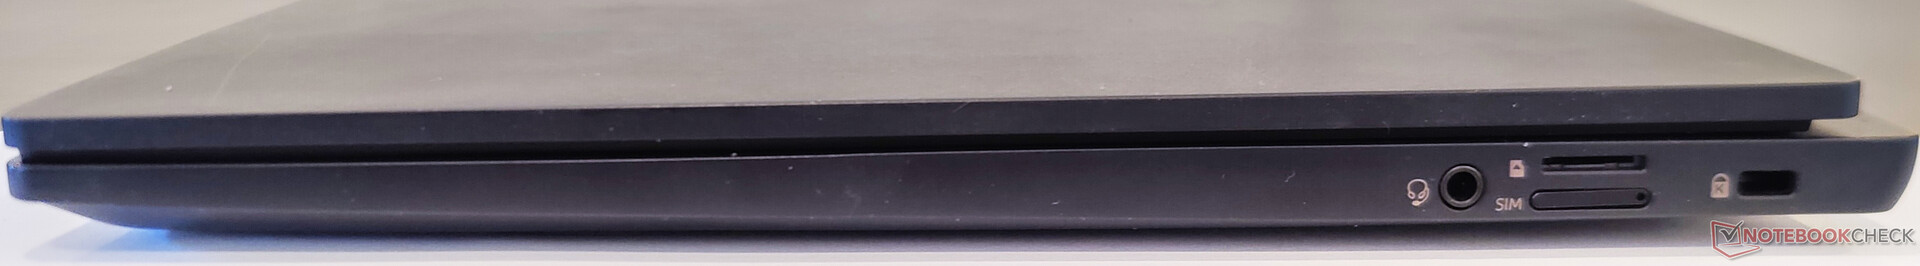
TravelMate P614P-52拥有一个相当体面的端口选择。在设备的左侧,我们发现了两个Thunderbolt 4端口、一个HDMI端口和USB 3.2 Gen2 Type-A。在右侧,我们有一个microSD读卡器、nano-SIM卡插槽、一个3.5毫米组合音频插孔和一个Kensington锁插槽。该设备的正面和背面没有任何端口。
SD卡阅读器
与去年的型号相比,宏碁似乎并没有改进microSD卡的性能。TravelMate P6414P-52在我们的标准文件复制测试中(250个JPEG文件,每个约4.5MB),与我们的参考AV PRO 128 GB V60 UHS II microSD卡一起测试时,最大传输率仅约20.2MB/s。连续读数略好,为23.61MB/s。
| SD Card Reader | |
| average JPG Copy Test (av. of 3 runs) | |
| Razer Book 13 FHD (Toshiba Exceria Pro M501 32 GB UHS-II) | |
| Dell Latitude 9420 2-in-1 (AV PRO microSD 128 GB V60) | |
| Framework Laptop 13.5 (AV Pro UHS-II V60) | |
| Average of class Office (22.4 - 198.5, n=22, last 2 years) | |
| Asus VivoBook S15 D533UA (AV PRO microSD 128 GB V60) | |
| Acer TravelMate P614P-52 (AV PRO microSD 128 GB V60) | |
| maximum AS SSD Seq Read Test (1GB) | |
| Razer Book 13 FHD (Toshiba Exceria Pro M501 32 GB UHS-II) | |
| Dell Latitude 9420 2-in-1 (AV PRO microSD 128 GB V60) | |
| Framework Laptop 13.5 (AV Pro UHS-II V60) | |
| Average of class Office (27.4 - 249, n=20, last 2 years) | |
| Asus VivoBook S15 D533UA (AV PRO microSD 128 GB V60) | |
| Acer TravelMate P614P-52 (AV PRO microSD 128 GB V60) | |
沟通
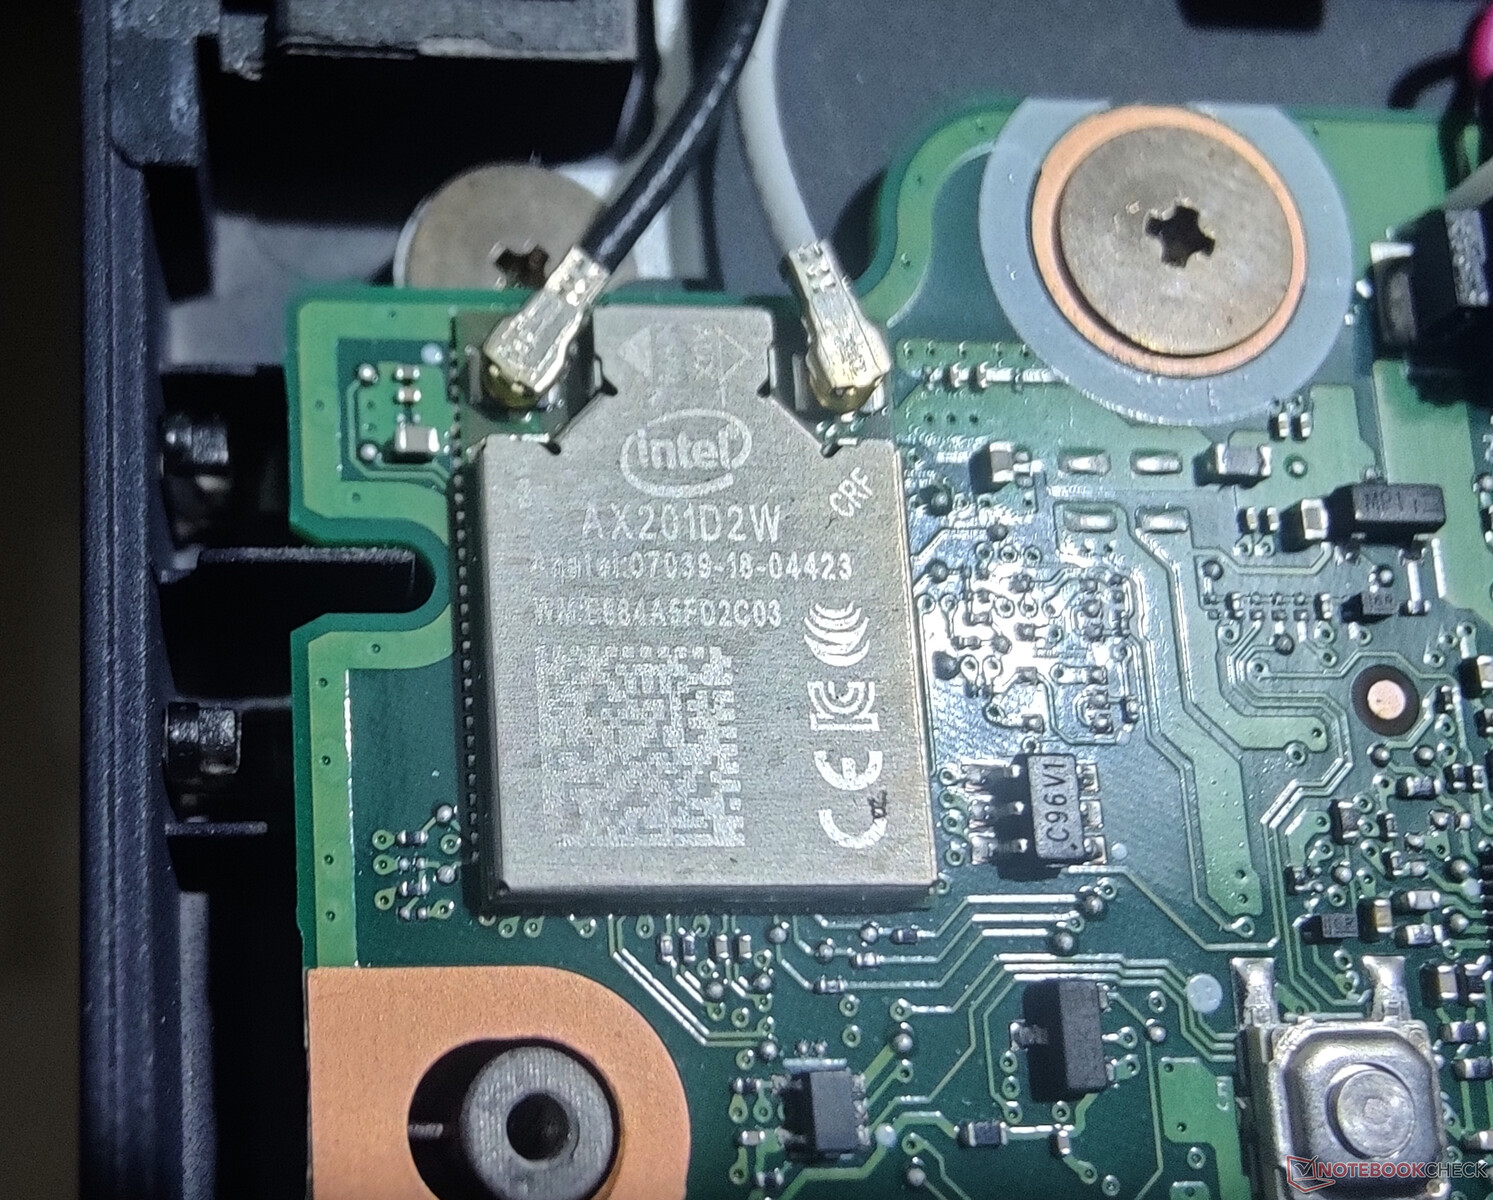
TravelMate P6配备了英特尔Wi-Fi AX201 Wi-Fi卡,还提供蓝牙5.0。我们使用参考的Netgear Nighthawk AX12 RAX120路由器测试了Wi-Fi性能,距离设备1米,在没有任何障碍物的情况下直接视线。
Wi-Fi性能还算不错,特别是在下载方面,尽管我们在去年的型号中看到了更高的吞吐量。快速上传绝对不是TravelMate P6的强项,至少在我们的评测样品中是如此。
我们的设备还内置了英特尔WWAN模块,支持5G-NSA。除了物理nano-SIM插槽外,还支持eSIM。4G LTE接收很好,与我们观察到的智能手机相似(一加9)在同一地区的情况相似。
网络摄像头
今年的TravelMate P6配备了一个全高清网络摄像头,与上一代产品相比,其色彩准确性有了明显的提高,最大Delta E为12.35。然而,从我们的测试图表中可以看出,在图像清晰度方面,集成的网络摄像头还有很多需要改进的地方。我们还注意到,网络摄像头有一种偏红到偏黄的色调倾向。总的来说,网络摄像头的质量对于视频通话来说是合格的。


安全问题
作为一款商务笔记本电脑,TravelMate P6提供了若干安全功能。有一个独立的可信平台模块(TPM)2.0芯片,以及多种认证选项,如面部和指纹。宏碁提供ProShield Plus应用程序来配置额外的安全选项,如文件加密、文件解密、文件粉碎、应用程序保护、浏览器保护、USB设备过滤器等。
网络摄像头配备了手动隐私快门。TravelMate P6还支持宏碁用户感应技术,当用户不在范围内时自动锁定屏幕。然而,由于在审查时没有提供驱动程序,我们无法测试这一功能。
辅料
盒子里的东西包括通常的文件和一个65瓦的充电器。由于有两个Thunderbolt 4端口,有足够的空间进行外围扩展。虽然在宏碁网站上还没有列出,但诸如宏碁USB Type-C Dock II等配件预计很快就会上市。
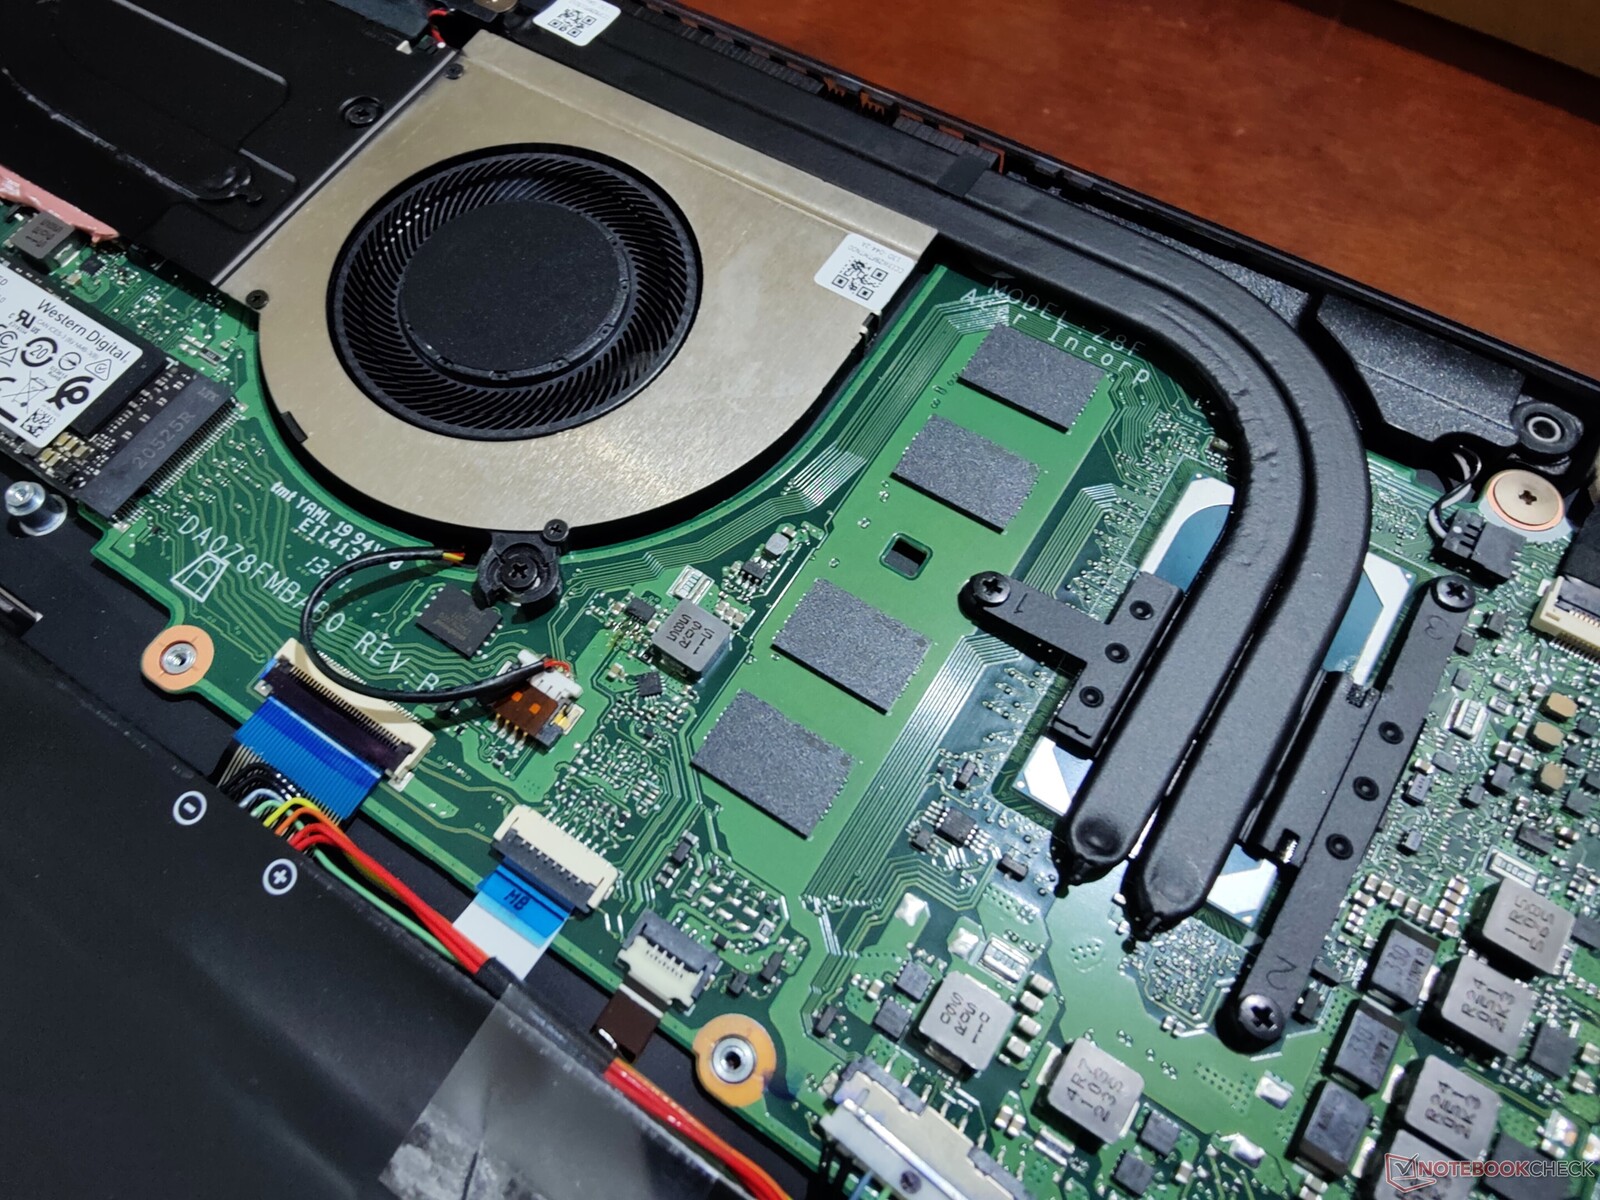
维护
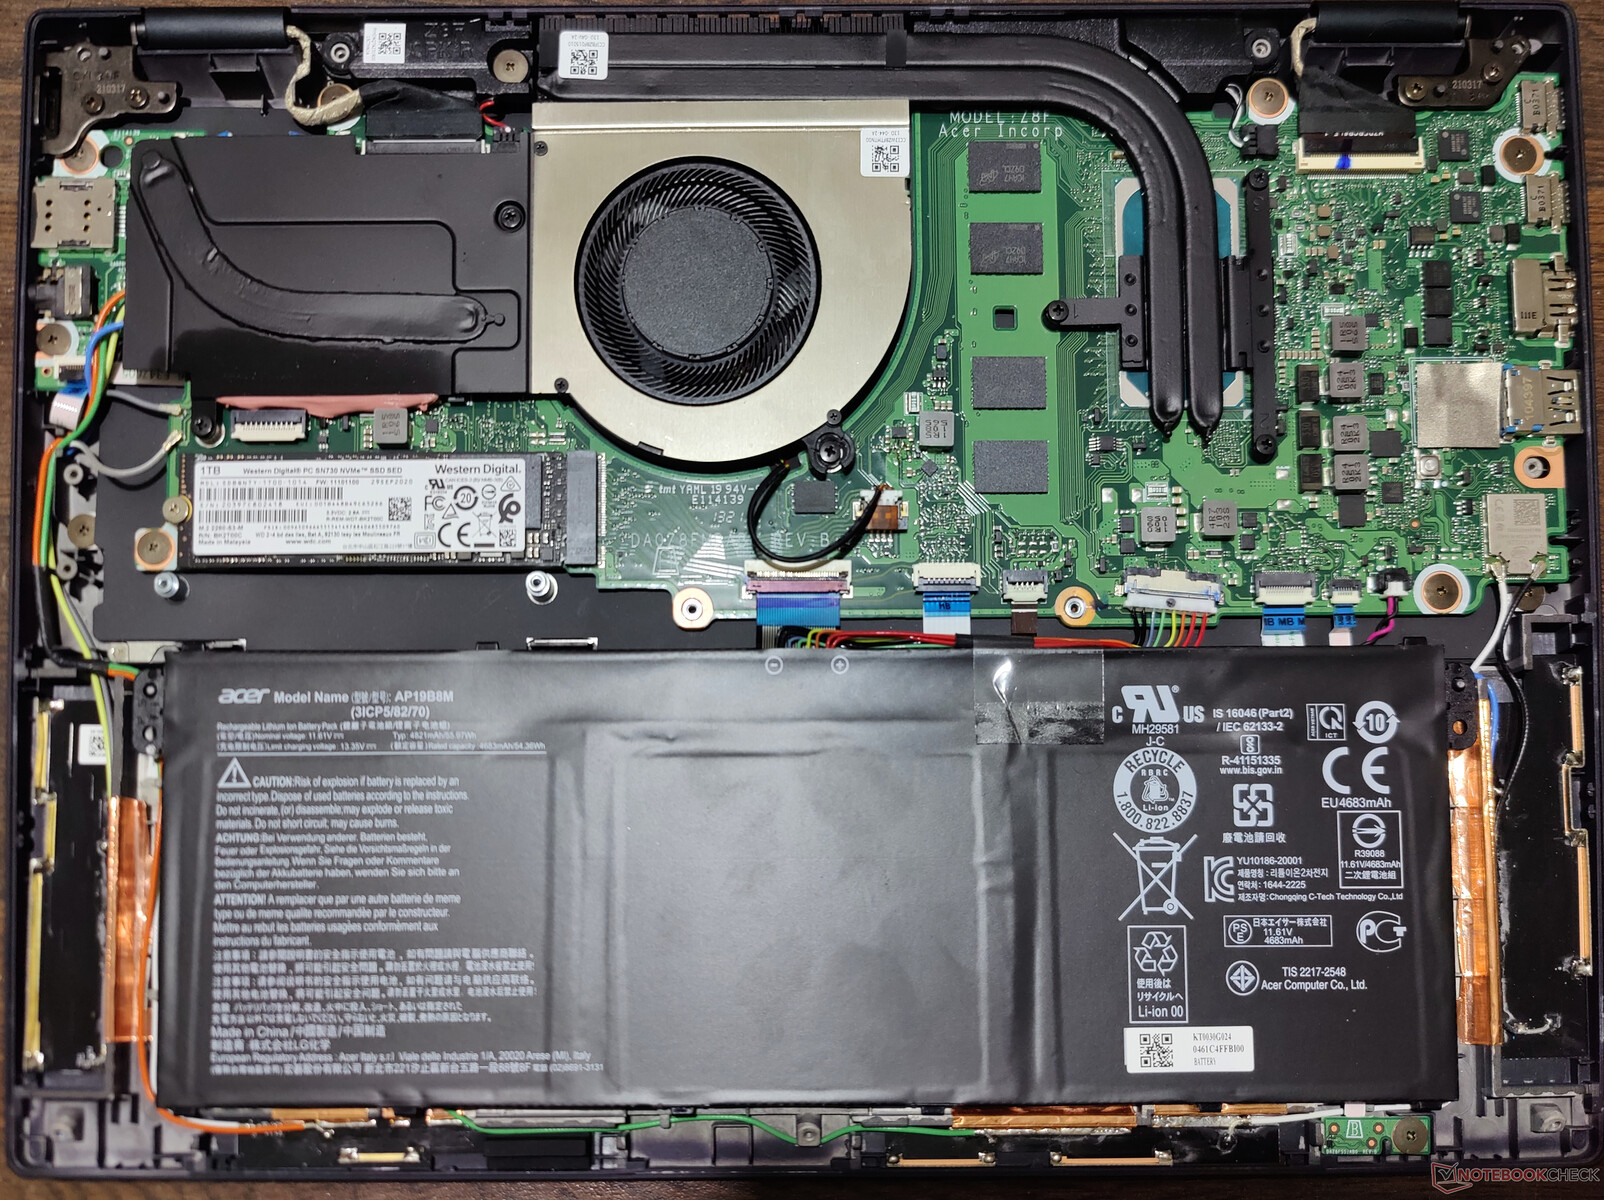
没有提供专门的维护舱口。卸下底部的11颗Torx T5螺钉,可以用最小的力气掀开底盖。
TravelMate P6并不是一个非常便于用户维修的笔记本电脑。LPDDR4X内存和英特尔AX201 Wi-Fi模块被焊接在主板上。只有PCIe NVMe固态硬盘可以被换掉。没有额外的存储扩展范围。
担保
宏碁印度公司为在印度购买的TravelMate P6设备提供三年或五年的保修期。国际保修可以从台湾宏基公司获得,该公司提供一年的全球携带式保修,仅限于Acer International Travelers Warranty中指定的国家。文件。
输入设备。长时间使用也很舒适
键盘
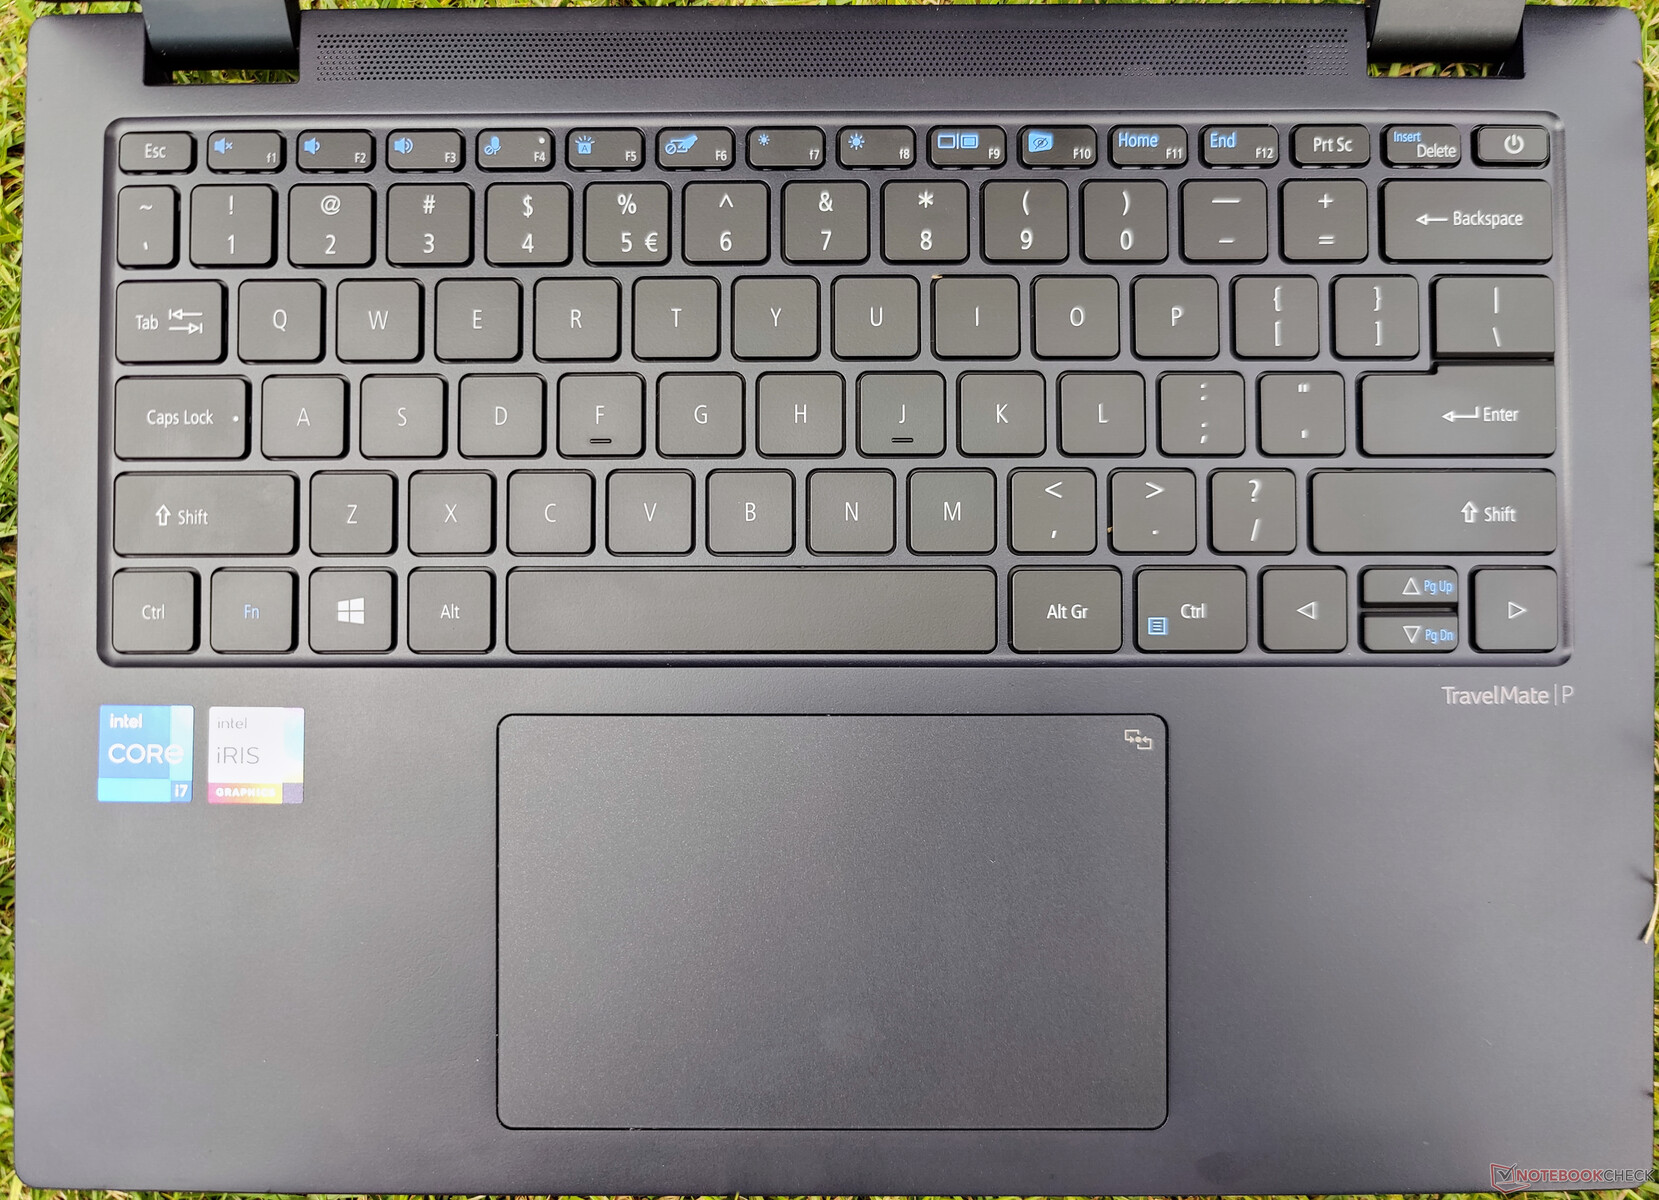
TravelMate P6通过其Chiclet背光键盘提供了良好的打字体验。键盘的行程较短,触觉反馈一般。也就是说,按键的间距足够大,长时间打字也相当舒适。不幸的是,背光灯没有多级亮度控制。
触摸板
新款TravelMate P6的触摸板尺寸为7.5 x 12.5厘米,与上一代产品相比,其面积更大。触摸板提供了流畅的滑行体验,并支持WindowsPrecision 手势。左右两边的按钮与触摸板齐平,即使在角落里也有相当的反应,尽管它们的点击声似乎比我们希望的要大一点。
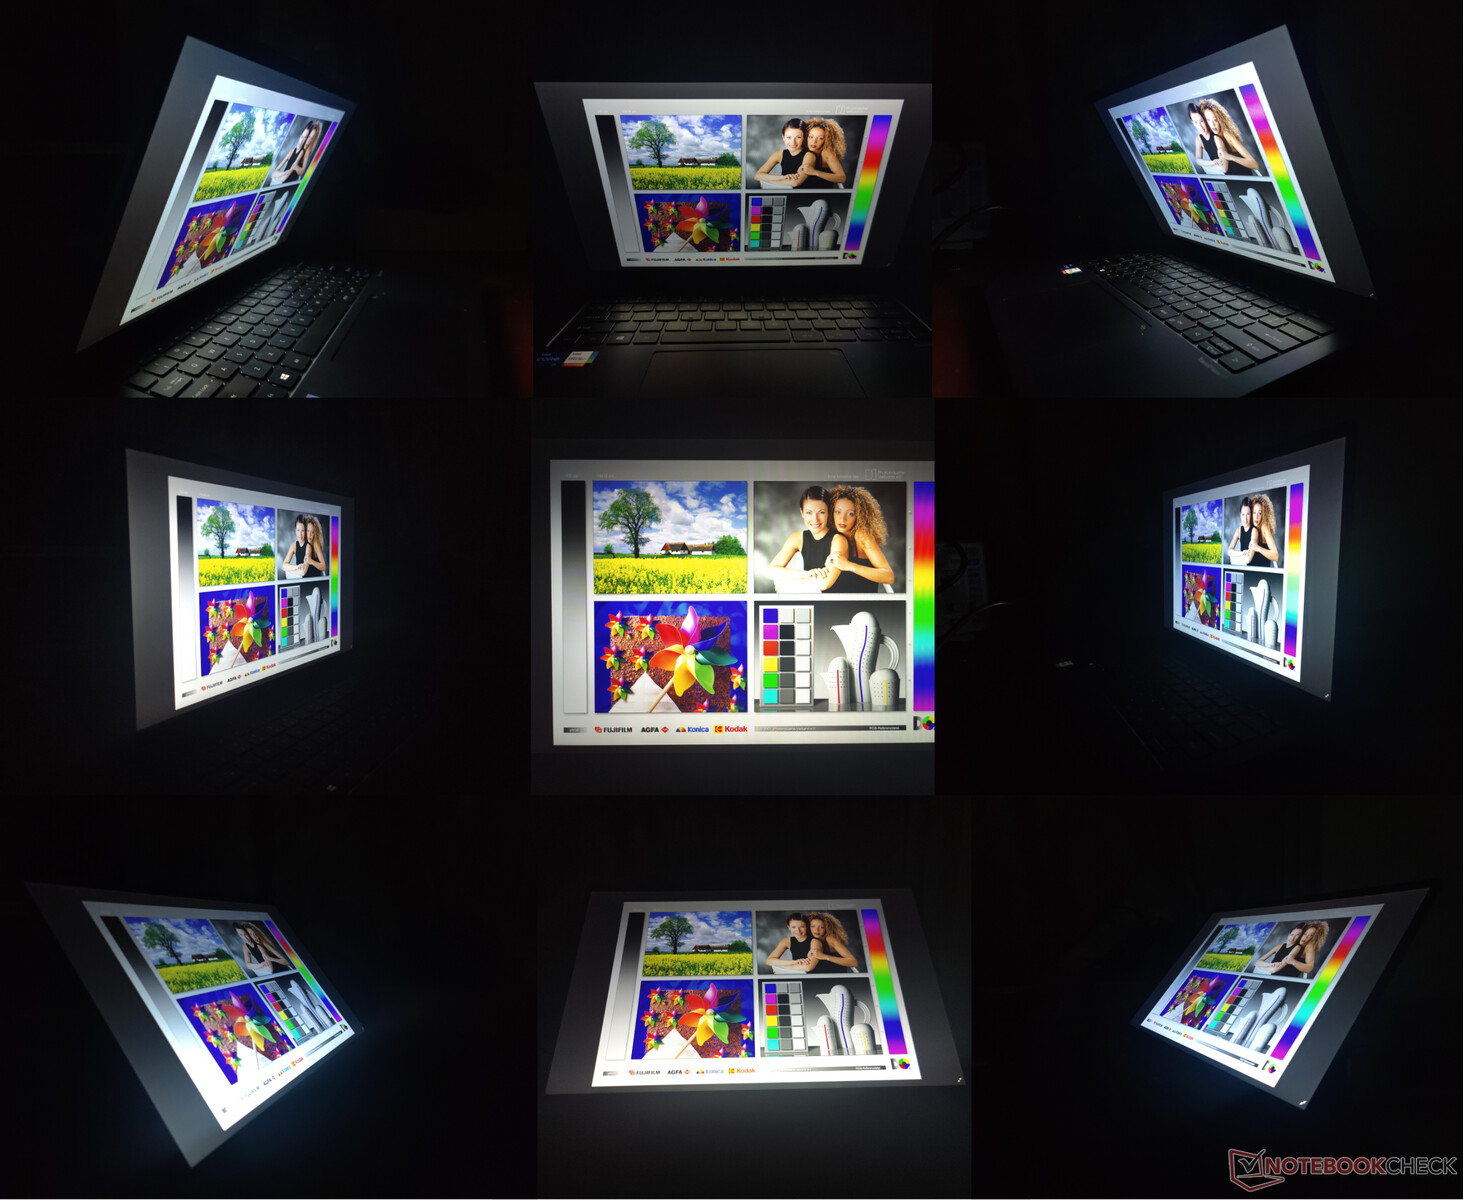
显示。16:10,颜色好,PWM高
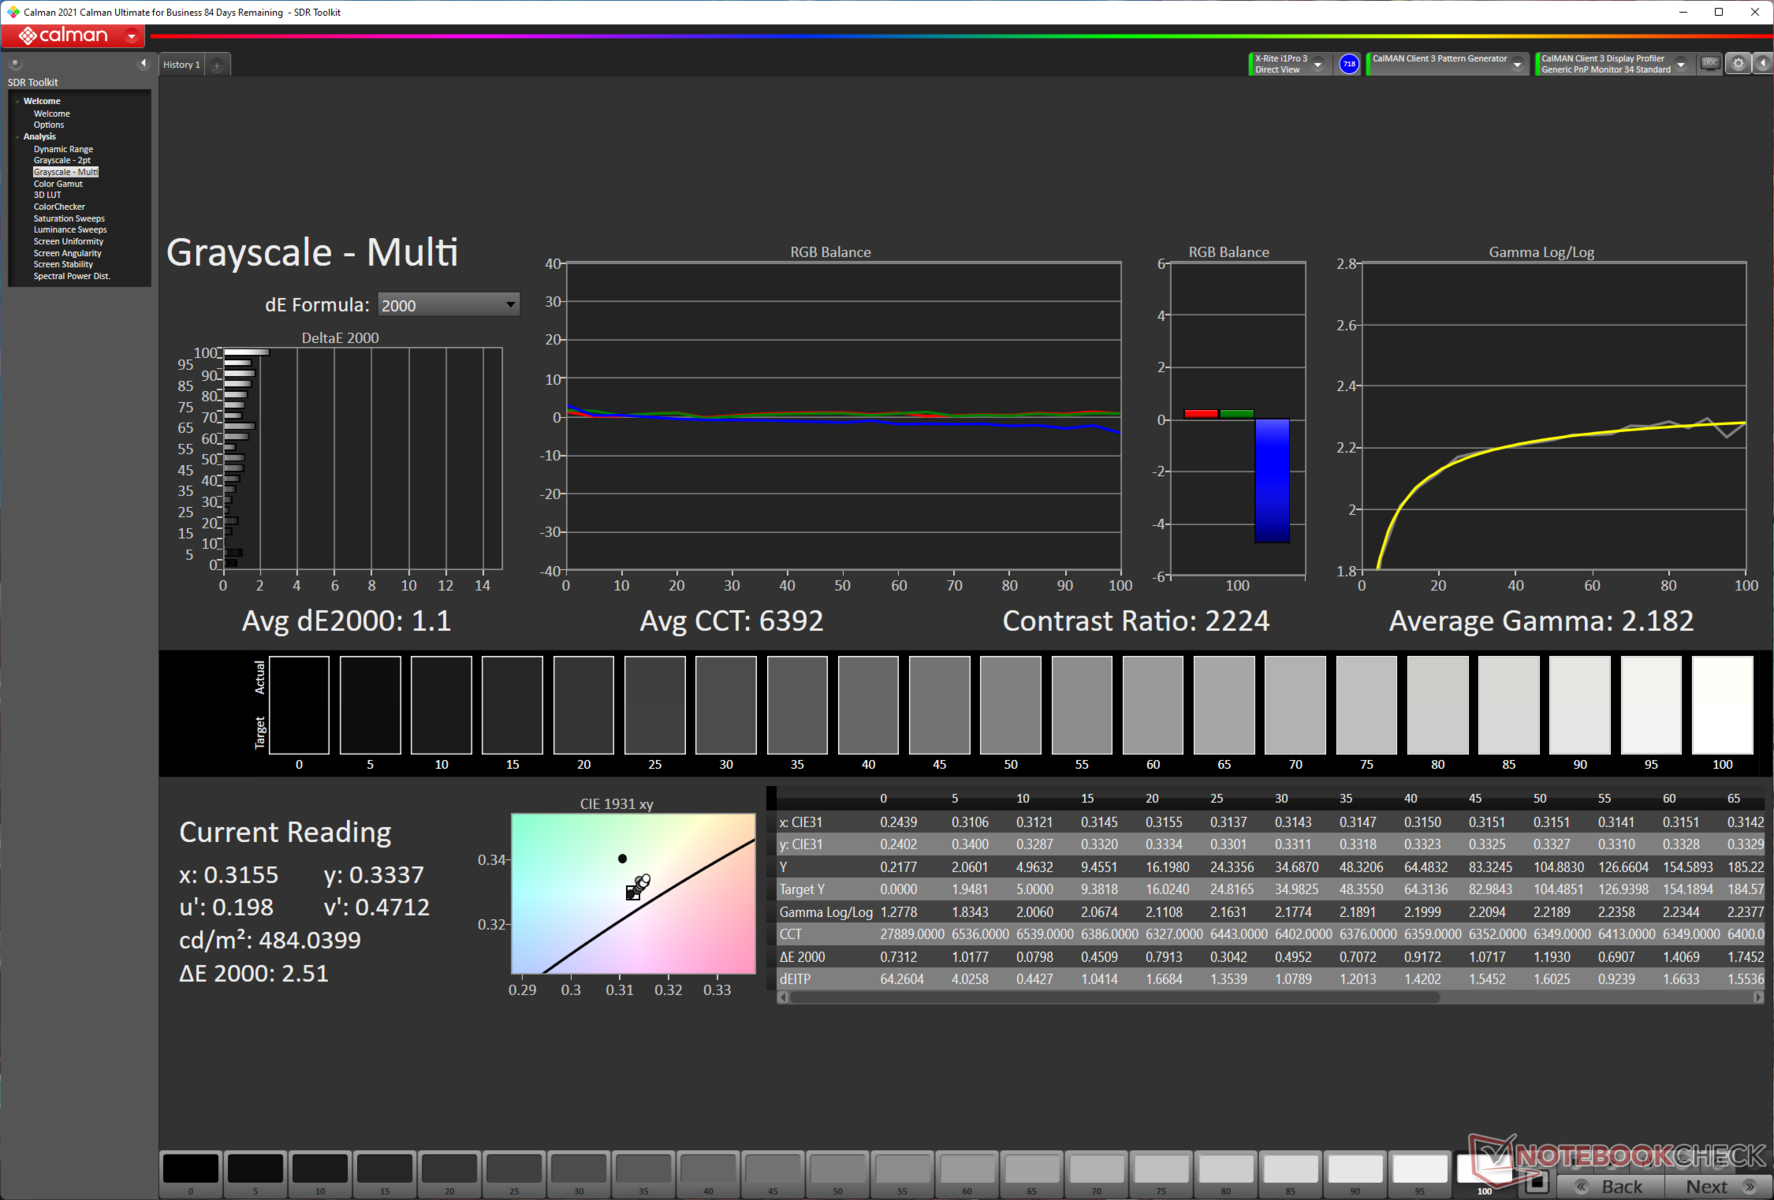
我们的TravelMate P6装置配备了一个14英寸FHD 16:10非触摸哑光面板,刷新率为60赫兹。宏碁这次改进了TravelMate P6的显示屏,色彩还原度非常好,亮度水平也有很大提高。
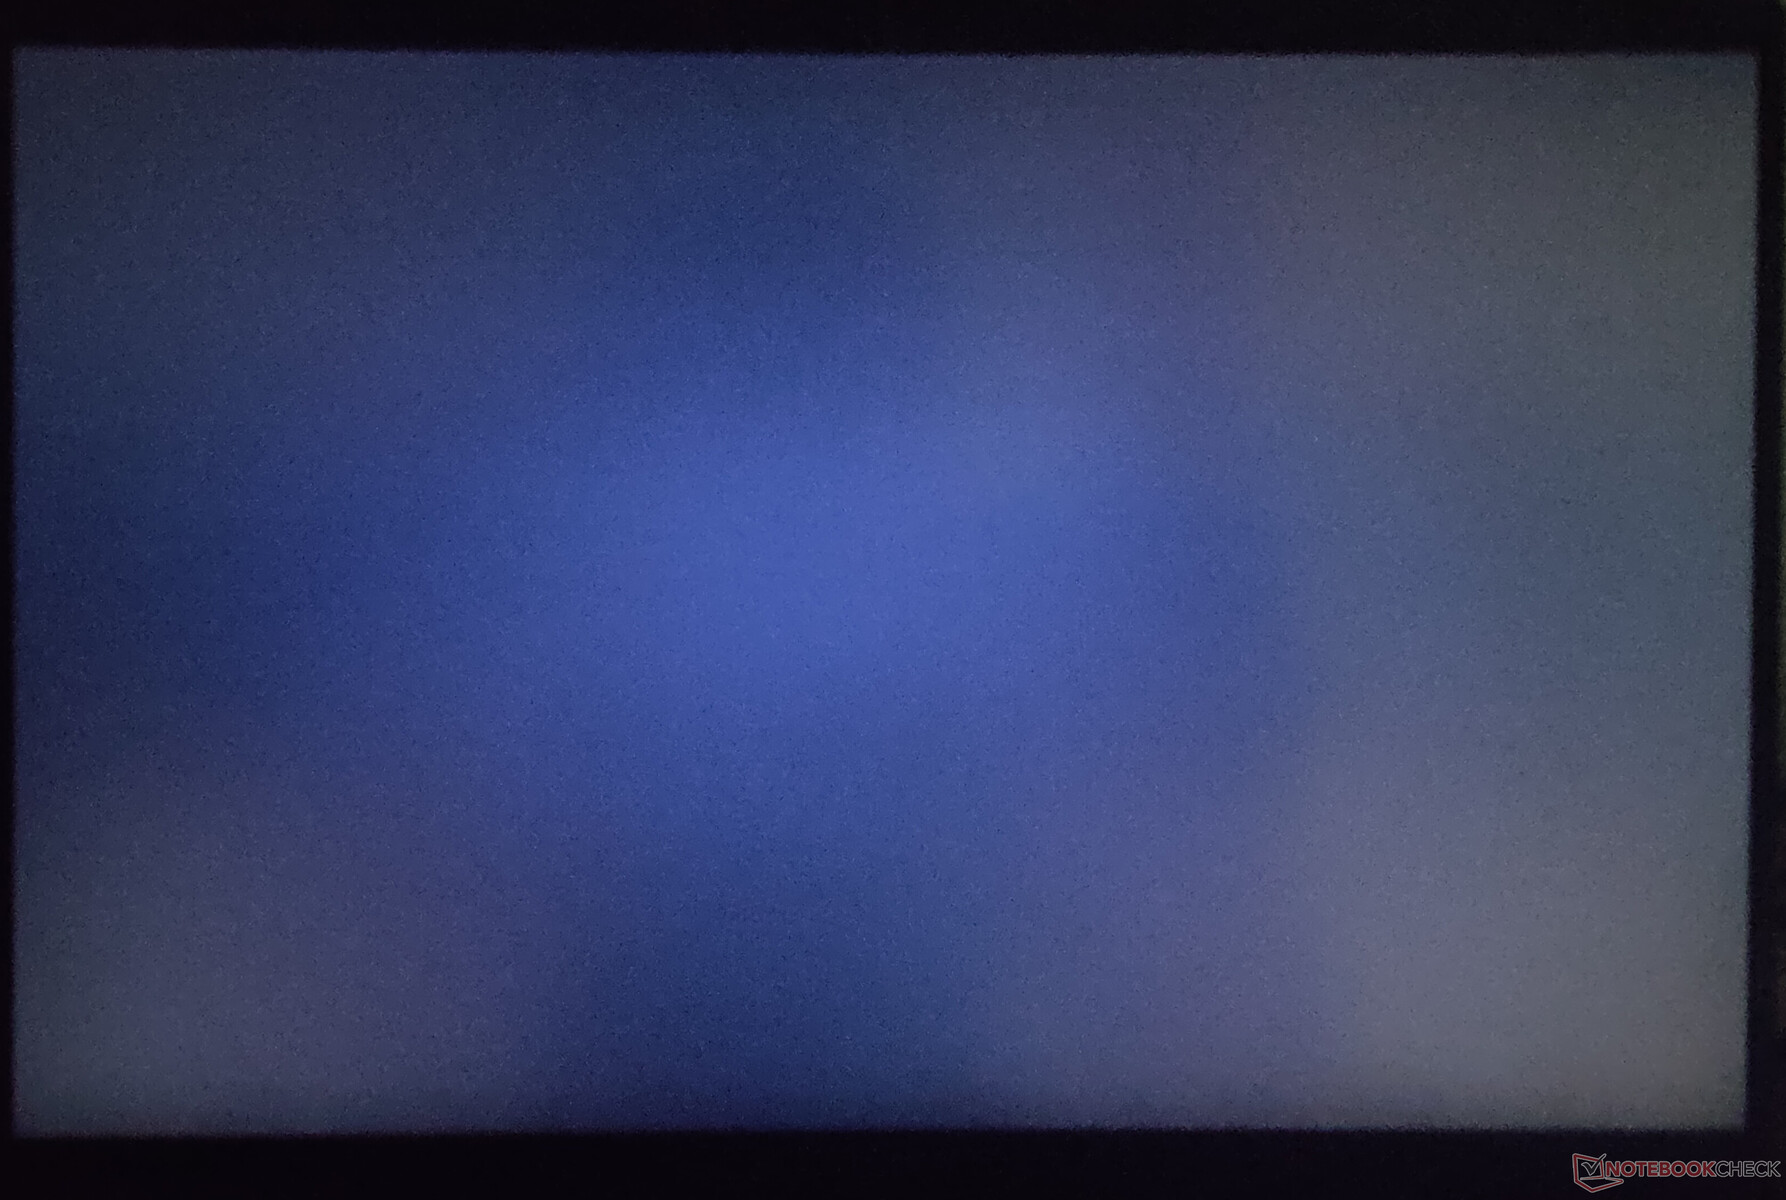
TravelMate P6面板的整体特性似乎非常好,黑色很深,实测对比度高达2653:1。我们测得的峰值亮度为529.58cd/m2,尽管分布本身没有达到标准。
所有的显示参数都是在交流电的情况下测量的,因为我们观察到,即使亮度滑块本身被设置为最大,笔记本在电池上的亮度也会降低约192cd/m2。
| |||||||||||||||||||||||||
Brightness Distribution: 77 %
Center on Battery: 312.04 cd/m²
Contrast: 2653:1 (Black: 0.19 cd/m²)
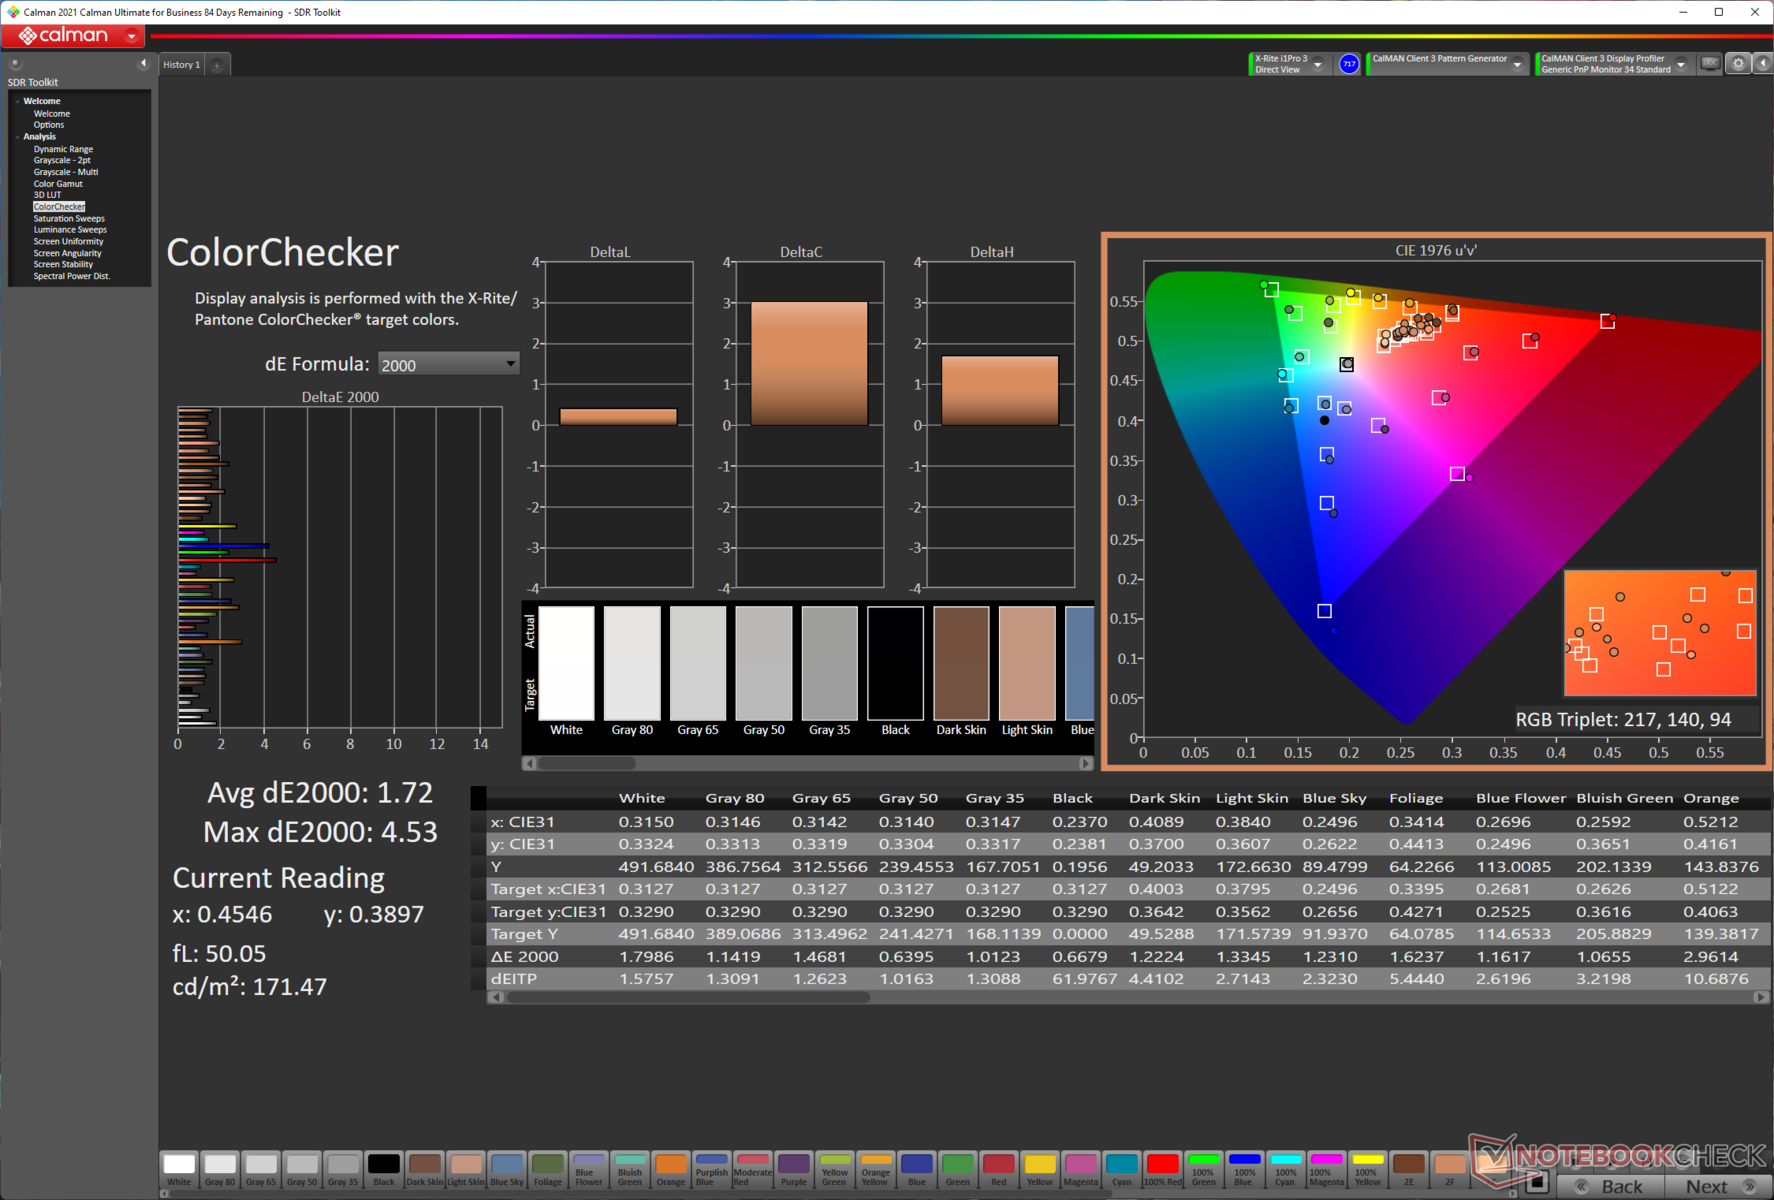
ΔE ColorChecker Calman: 2.75 | ∀{0.5-29.43 Ø4.73}
calibrated: 1.72
ΔE Greyscale Calman: 1.9 | ∀{0.09-98 Ø4.97}
75.5% AdobeRGB 1998 (Argyll 3D)
99.4% sRGB (Argyll 3D)
76% Display P3 (Argyll 3D)
Gamma: 2.13
CCT: 6426 K
| Acer TravelMate P614P-52 AU Optronics B140UAV01.0, IPS, 14", 1920x1200 | Lenovo ThinkPad T14s G2 20WM003TGE NE140FHM-N61, IPS LED, 14", 1920x1080 | Dell Latitude 9420 2-in-1 AU Optronics B140QAN, IPS, 14", 2560x1600 | Asus ExpertBook B9 B9400CE-KC0166R B140HAN06.B, IPS, 14", 1920x1080 | Razer Book 13 FHD Sharp LQ134N1JW48, IPS, 13.4", 1920x1200 | HP EliteBook 830 G8-i7-1165G7 X133NVFF R0, IPS, 13.3", 1920x1080 | |
|---|---|---|---|---|---|---|
| Display | -10% | 4% | -5% | -4% | -7% | |
| Display P3 Coverage (%) | 76 | 68.1 -10% | 80.7 6% | 69.8 -8% | 70.1 -8% | 69.2 -9% |
| sRGB Coverage (%) | 99.4 | 91.7 -8% | 100 1% | 98.8 -1% | 99.3 0% | 94.5 -5% |
| AdobeRGB 1998 Coverage (%) | 75.5 | 67.1 -11% | 79.7 6% | 71.3 -6% | 71.6 -5% | 71.1 -6% |
| Response Times | -58% | -38% | -38% | -54% | -21% | |
| Response Time Grey 50% / Grey 80% * (ms) | 40.79 ? | 68 ? -67% | 54 ? -32% | 60 ? -47% | 56.8 ? -39% | 45 ? -10% |
| Response Time Black / White * (ms) | 22.9 ? | 34 ? -48% | 32.8 ? -43% | 29.6 ? -29% | 38.8 ? -69% | 30 ? -31% |
| PWM Frequency (Hz) | 1000 ? | 22730 ? | 2475 ? | |||
| Screen | -59% | -29% | -6% | -0% | -17% | |
| Brightness middle (cd/m²) | 504.15 | 422.9 -16% | 483.6 -4% | 437 -13% | 545.3 8% | 1007 100% |
| Brightness (cd/m²) | 482 | 397 -18% | 465 -4% | 421 -13% | 507 5% | 985 104% |
| Brightness Distribution (%) | 77 | 91 18% | 92 19% | 87 13% | 88 14% | 87 13% |
| Black Level * (cd/m²) | 0.19 | 0.32 -68% | 0.32 -68% | 0.29 -53% | 0.31 -63% | 0.34 -79% |
| Contrast (:1) | 2653 | 1322 -50% | 1511 -43% | 1507 -43% | 1759 -34% | 2962 12% |
| Colorchecker dE 2000 * | 2.75 | 4.8 -75% | 3.69 -34% | 1.8 35% | 1.39 49% | 4 -45% |
| Colorchecker dE 2000 max. * | 4.66 | 8.7 -87% | 5.97 -28% | 3.5 25% | 2.61 44% | 8.9 -91% |
| Colorchecker dE 2000 calibrated * | 1.72 | 1.9 -10% | 2.05 -19% | 1.4 19% | 2.72 -58% | 2.4 -40% |
| Greyscale dE 2000 * | 1.9 | 6.1 -221% | 3.5 -84% | 2.3 -21% | 1.3 32% | 4.3 -126% |
| Gamma | 2.13 103% | 2.23 99% | 2.04 108% | 2.18 101% | 2.2 100% | 2.1 105% |
| CCT | 6426 101% | 7635 85% | 6158 106% | 6782 96% | 6476 100% | 6462 101% |
| Color Space (Percent of AdobeRGB 1998) (%) | 65.4 | 65.9 | ||||
| Color Space (Percent of sRGB) (%) | 98.7 | 99.6 | ||||
| Total Average (Program / Settings) | -42% /
-48% | -21% /
-23% | -16% /
-10% | -19% /
-9% | -15% /
-15% |
* ... smaller is better
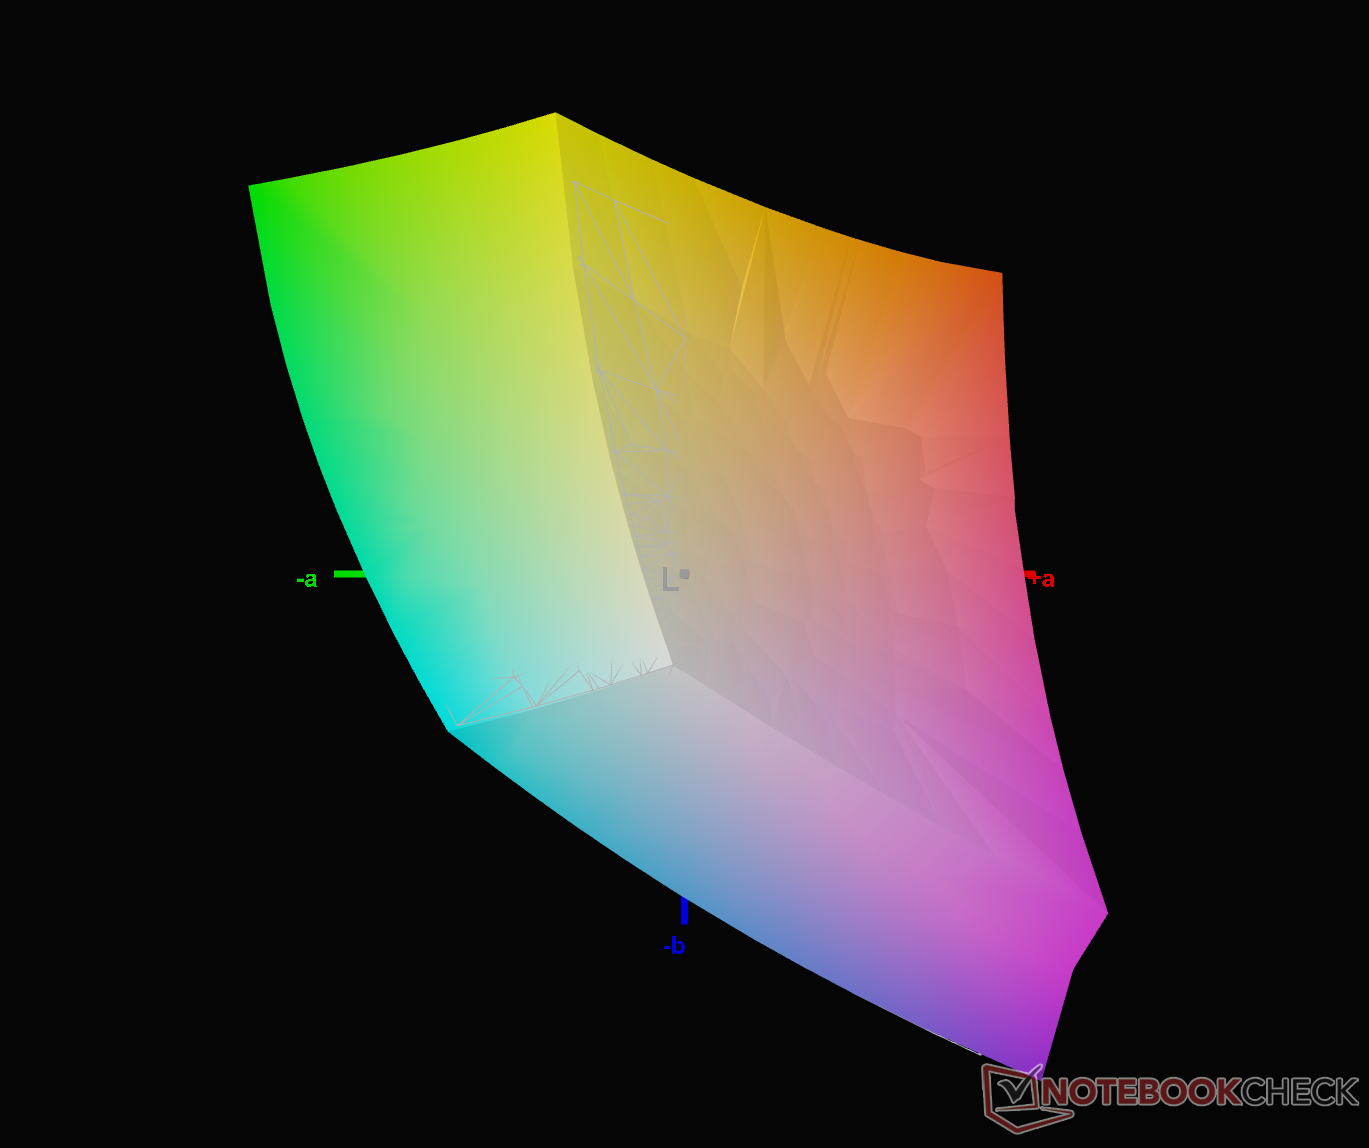
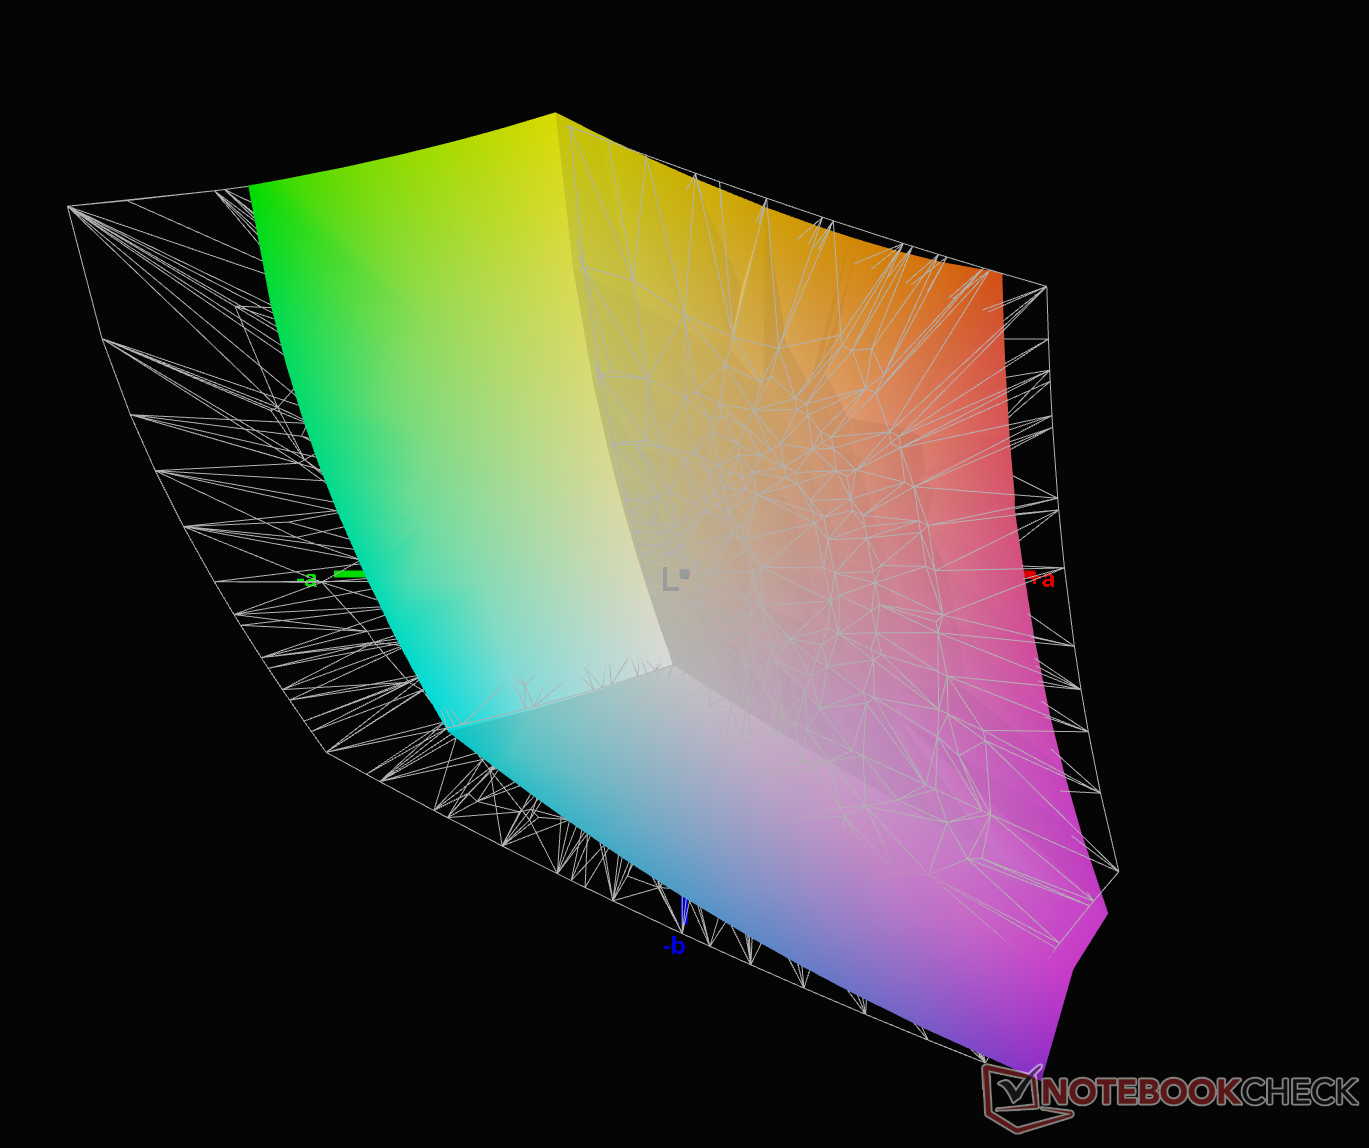
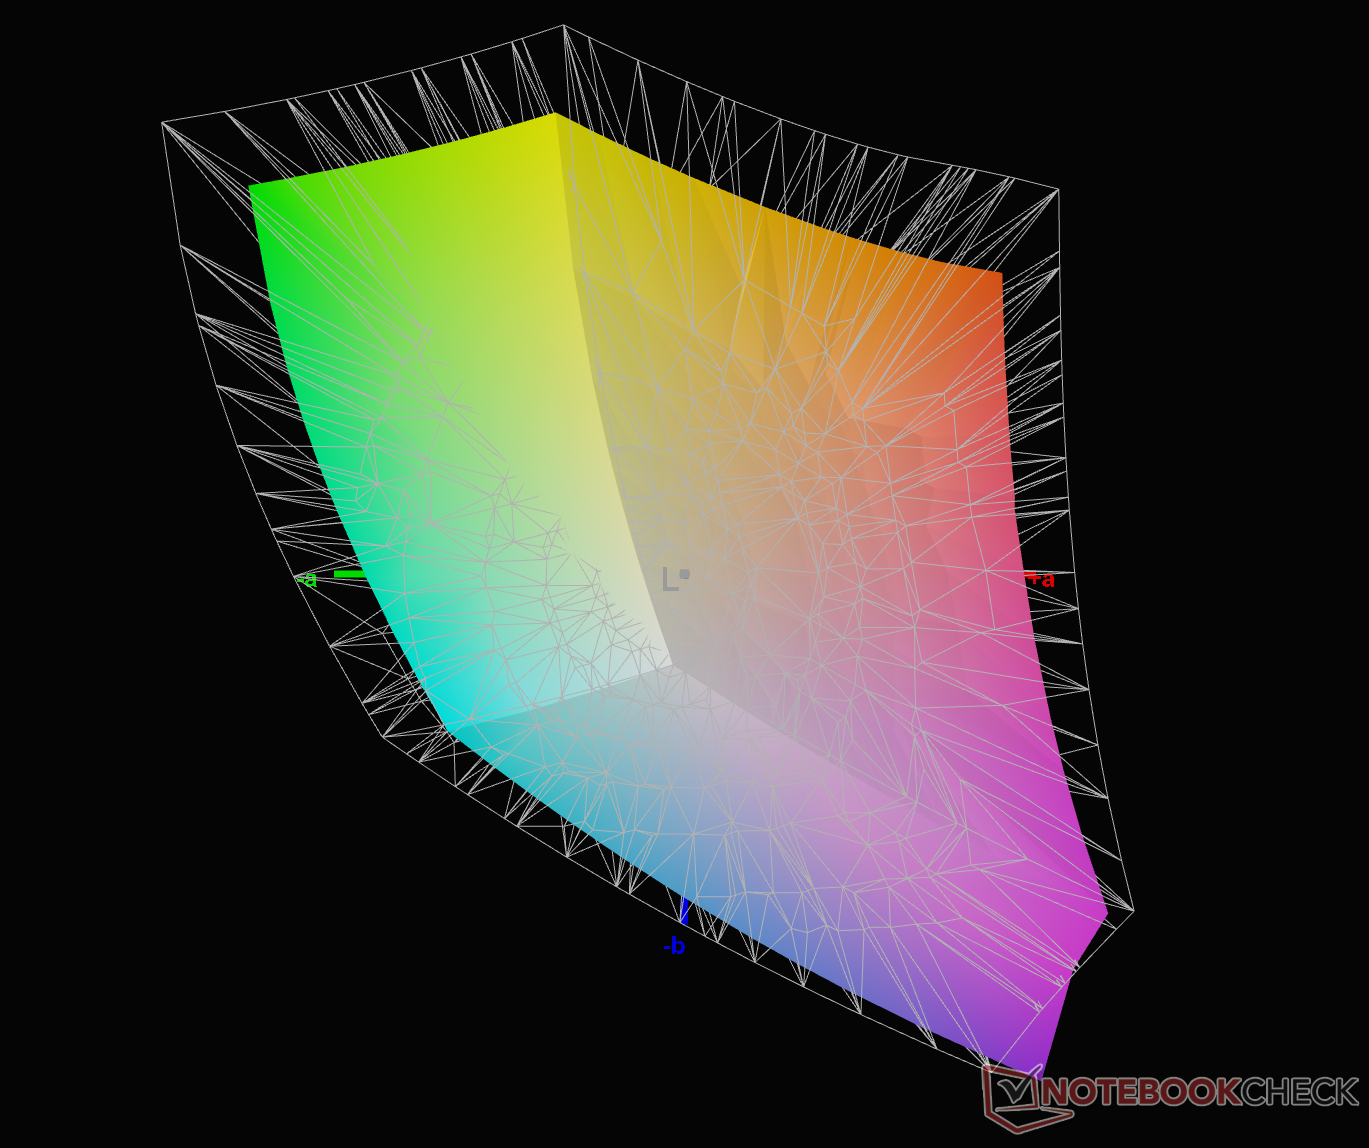
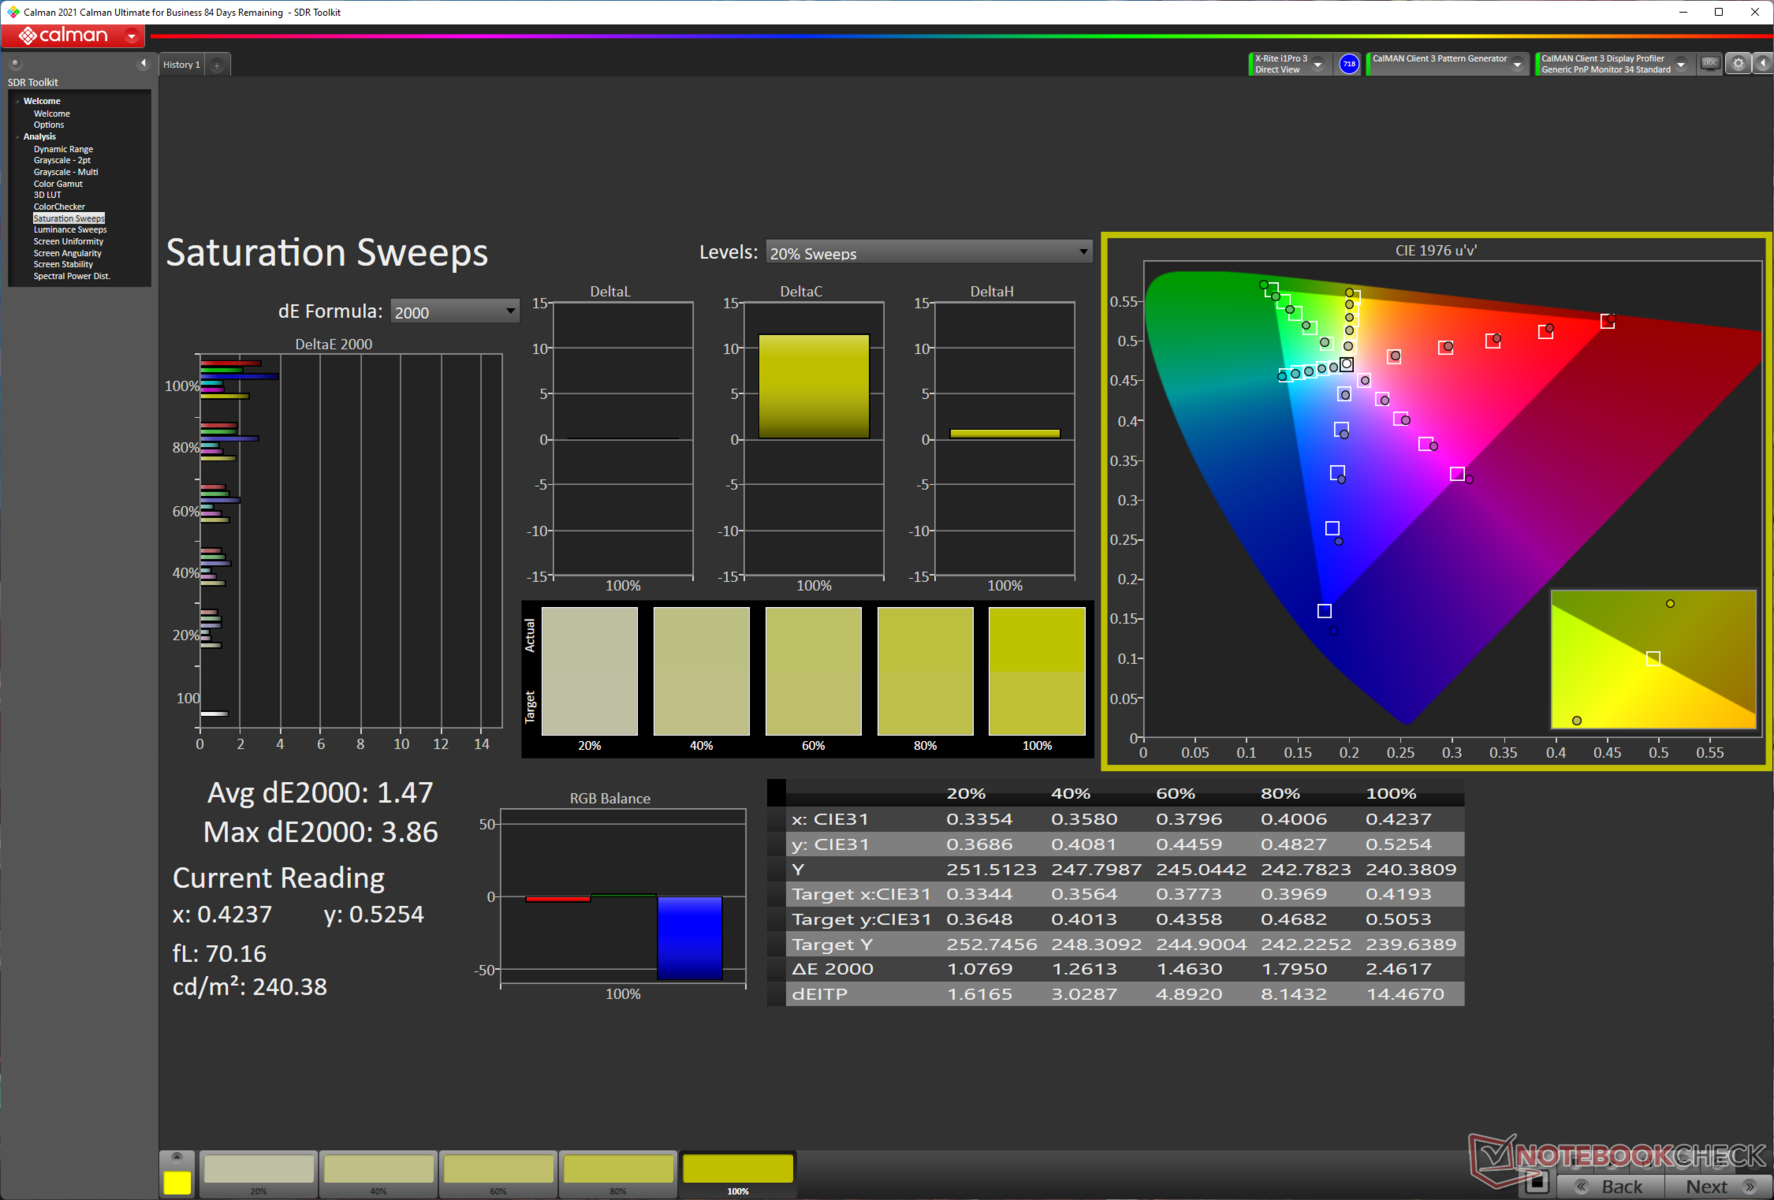
TravelMate P6几乎涵盖了整个sRGB色域,同时也有不错的AdobeRGB和DCI-P3覆盖率。该面板已经显示出良好的开箱即用的色彩准确性,但我们可以通过校准达到更好的效果。

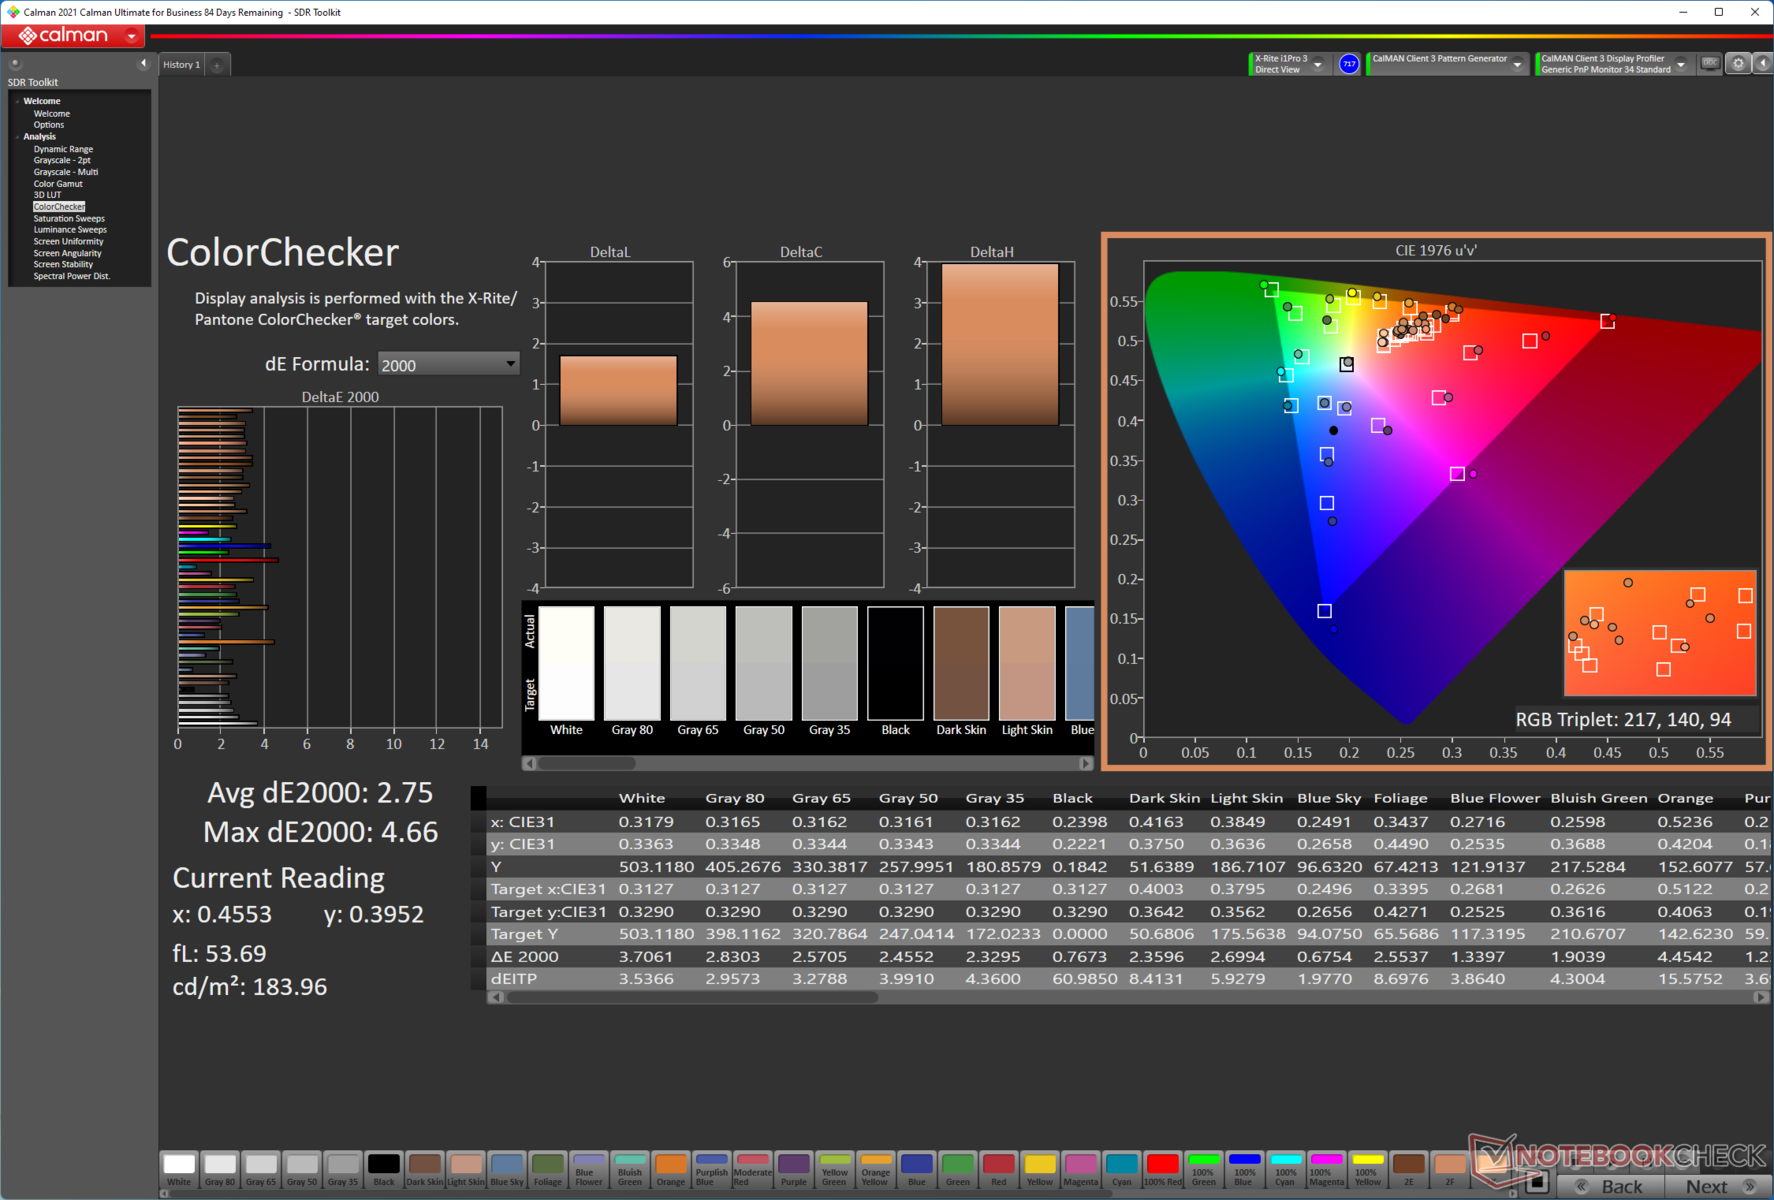

我们测量了从黑色到白色的综合反应时间为22.9毫秒,从50%的灰色到80%的灰色为40.79毫秒。虽然不完全适合游戏,但与竞争的商务笔记本相比,宏碁TravelMate P6提供了体面的响应时间。
TravelMate P6使用PWM进行背光调节。虽然我们在100%的亮度下观察到了非常高甚至没有的PWM,但是当亮度降低到99%时,1000赫兹的PWM就很明显。好在这个1000赫兹的PWM频率在从0到99%的所有亮度水平上都保持不变,因此对PWM敏感的用户在长时间使用时应该不会有任何不适。
关于PWM的更多信息,请查看我们的文章:"为什么脉冲宽度调制(PWM)是如此令人头疼".另外,请看我们的 PWM排名表以了解所有评测设备的PWM和响应时间的概况。
Display Response Times
| ↔ Response Time Black to White | ||
|---|---|---|
| 22.9 ms ... rise ↗ and fall ↘ combined | ↗ 10.96 ms rise | 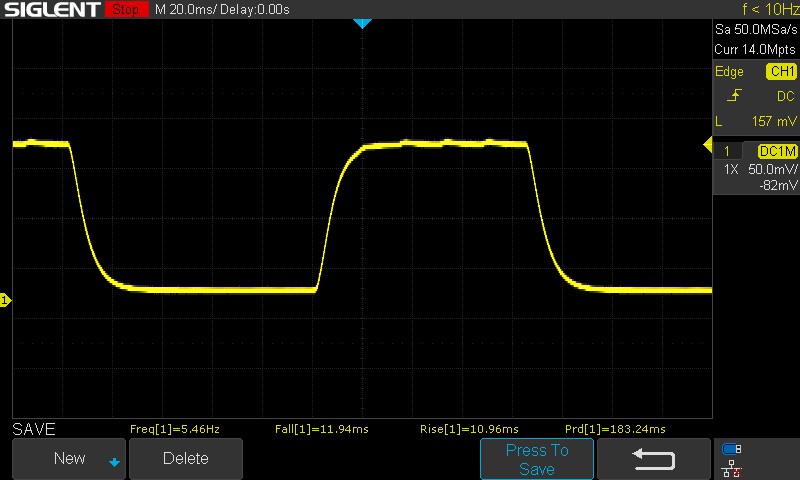 |
| ↘ 11.94 ms fall | ||
| The screen shows good response rates in our tests, but may be too slow for competitive gamers. In comparison, all tested devices range from 0.1 (minimum) to 240 (maximum) ms. » 52 % of all devices are better. This means that the measured response time is worse than the average of all tested devices (19.9 ms). | ||
| ↔ Response Time 50% Grey to 80% Grey | ||
| 40.79 ms ... rise ↗ and fall ↘ combined | ↗ 17.72 ms rise | 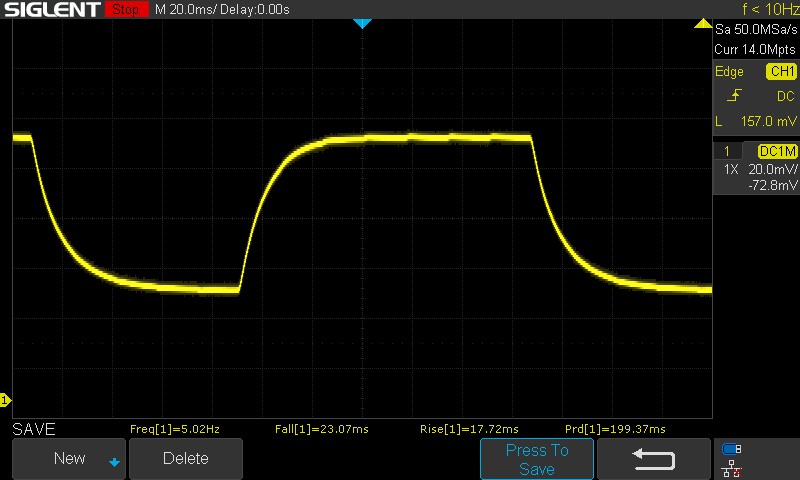 |
| ↘ 23.07 ms fall | ||
| The screen shows slow response rates in our tests and will be unsatisfactory for gamers. In comparison, all tested devices range from 0.165 (minimum) to 636 (maximum) ms. » 64 % of all devices are better. This means that the measured response time is worse than the average of all tested devices (31.1 ms). | ||
Screen Flickering / PWM (Pulse-Width Modulation)
| Screen flickering / PWM detected | 1000 Hz | ≤ 99 % brightness setting | 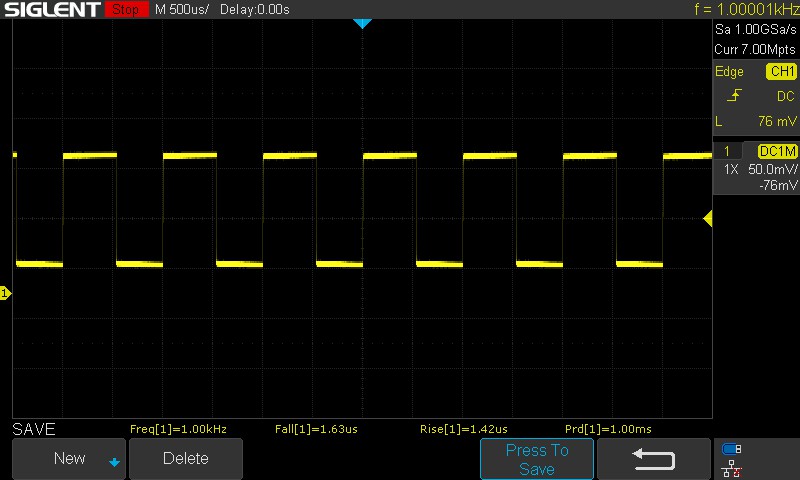 |
The display backlight flickers at 1000 Hz (worst case, e.g., utilizing PWM) Flickering detected at a brightness setting of 99 % and below. There should be no flickering or PWM above this brightness setting. The frequency of 1000 Hz is quite high, so most users sensitive to PWM should not notice any flickering. In comparison: 52 % of all tested devices do not use PWM to dim the display. If PWM was detected, an average of 7798 (minimum: 5 - maximum: 343500) Hz was measured. | |||
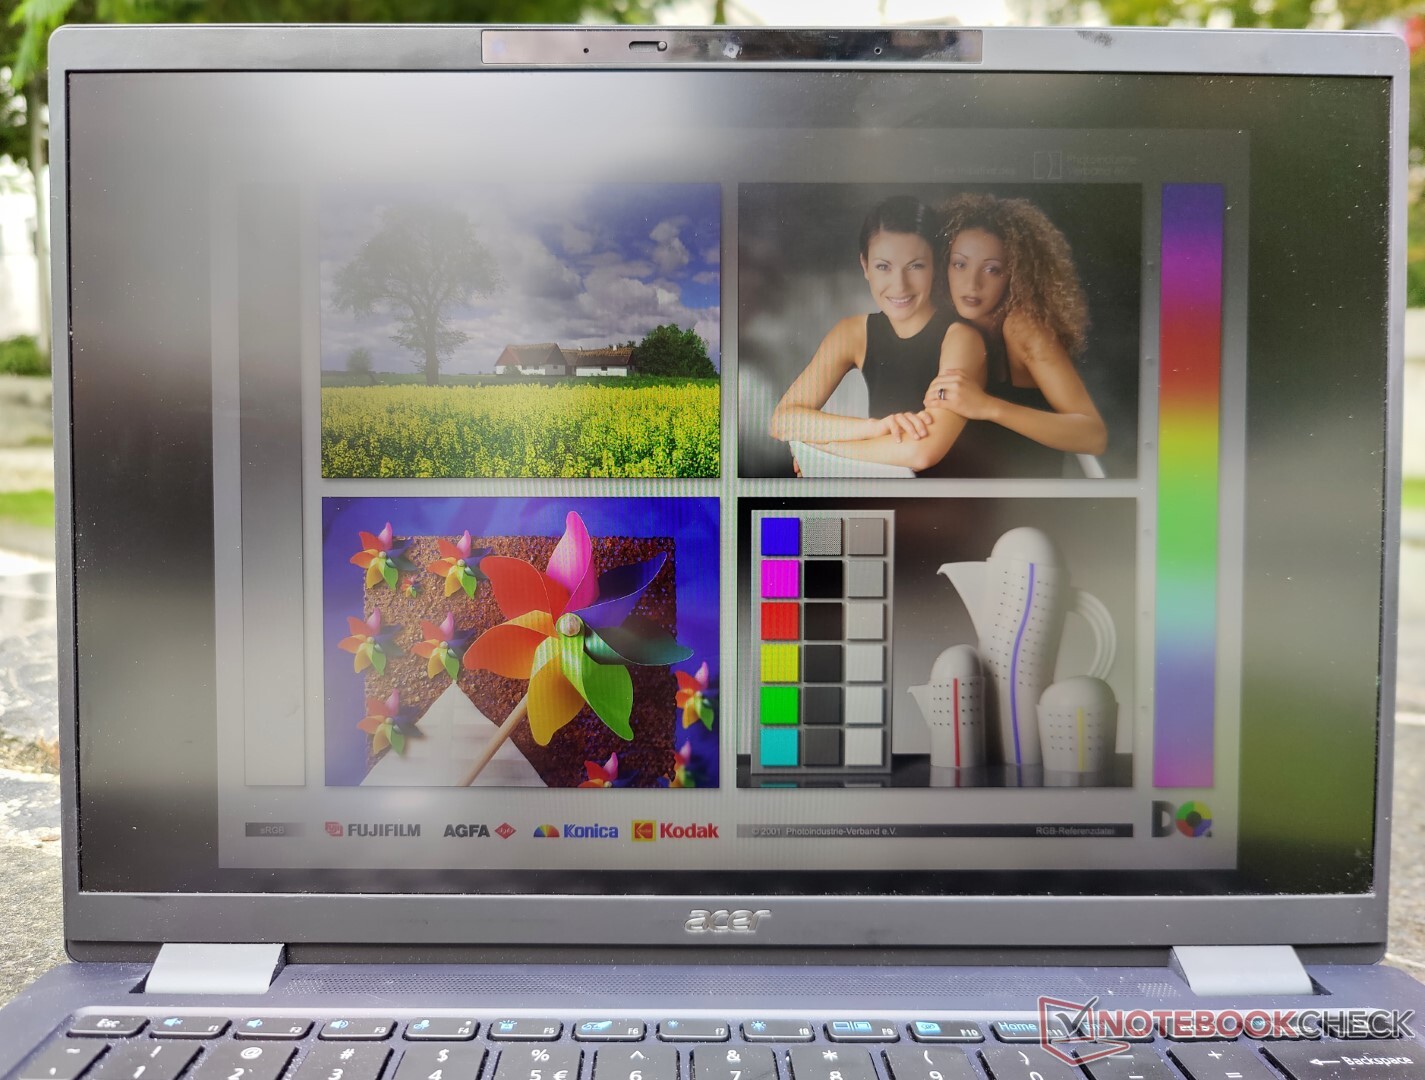
我们的设备配备了可选的宏碁隐私面板,将视角限制在90°。按Fn+F10可以切换隐私面板,在较低的亮度水平上可以看到最佳效果。奇怪的是,PrivacyPanel似乎在交流电时自动启用,按Fn+F10显然不能禁用它。
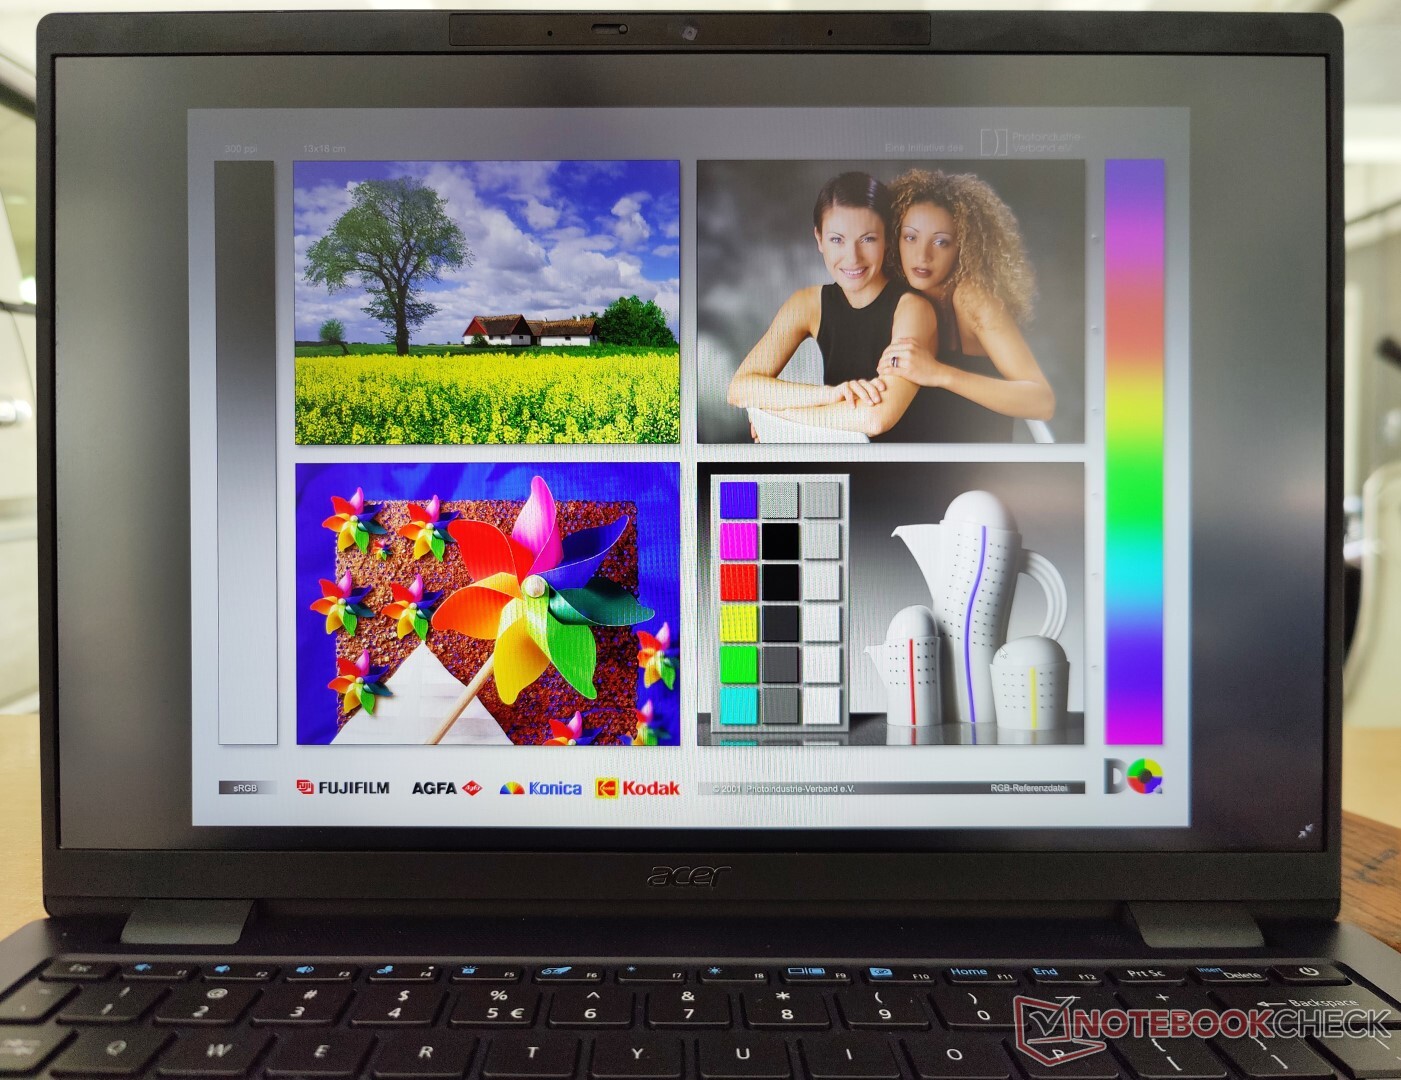
如上所述,由于电池亮度降低,TravelMate P6的面板在阳光直射下观看会有困难。宏碁声称有170°宽的视角,如果关闭PrivacyPanel,这一点是真的。然而,我们确实注意到从极端边缘观看时的颜色偏移。
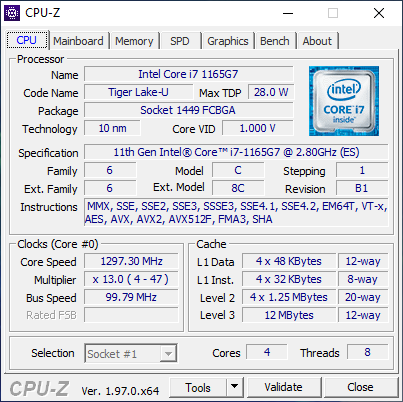
表现。持续良好,但没有破纪录
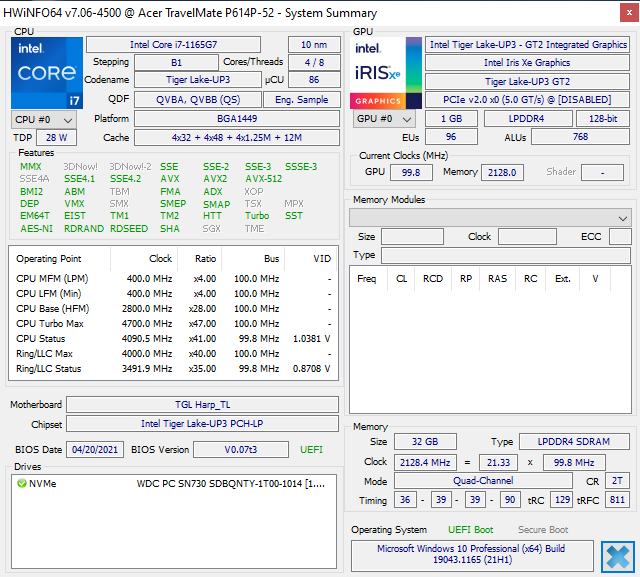
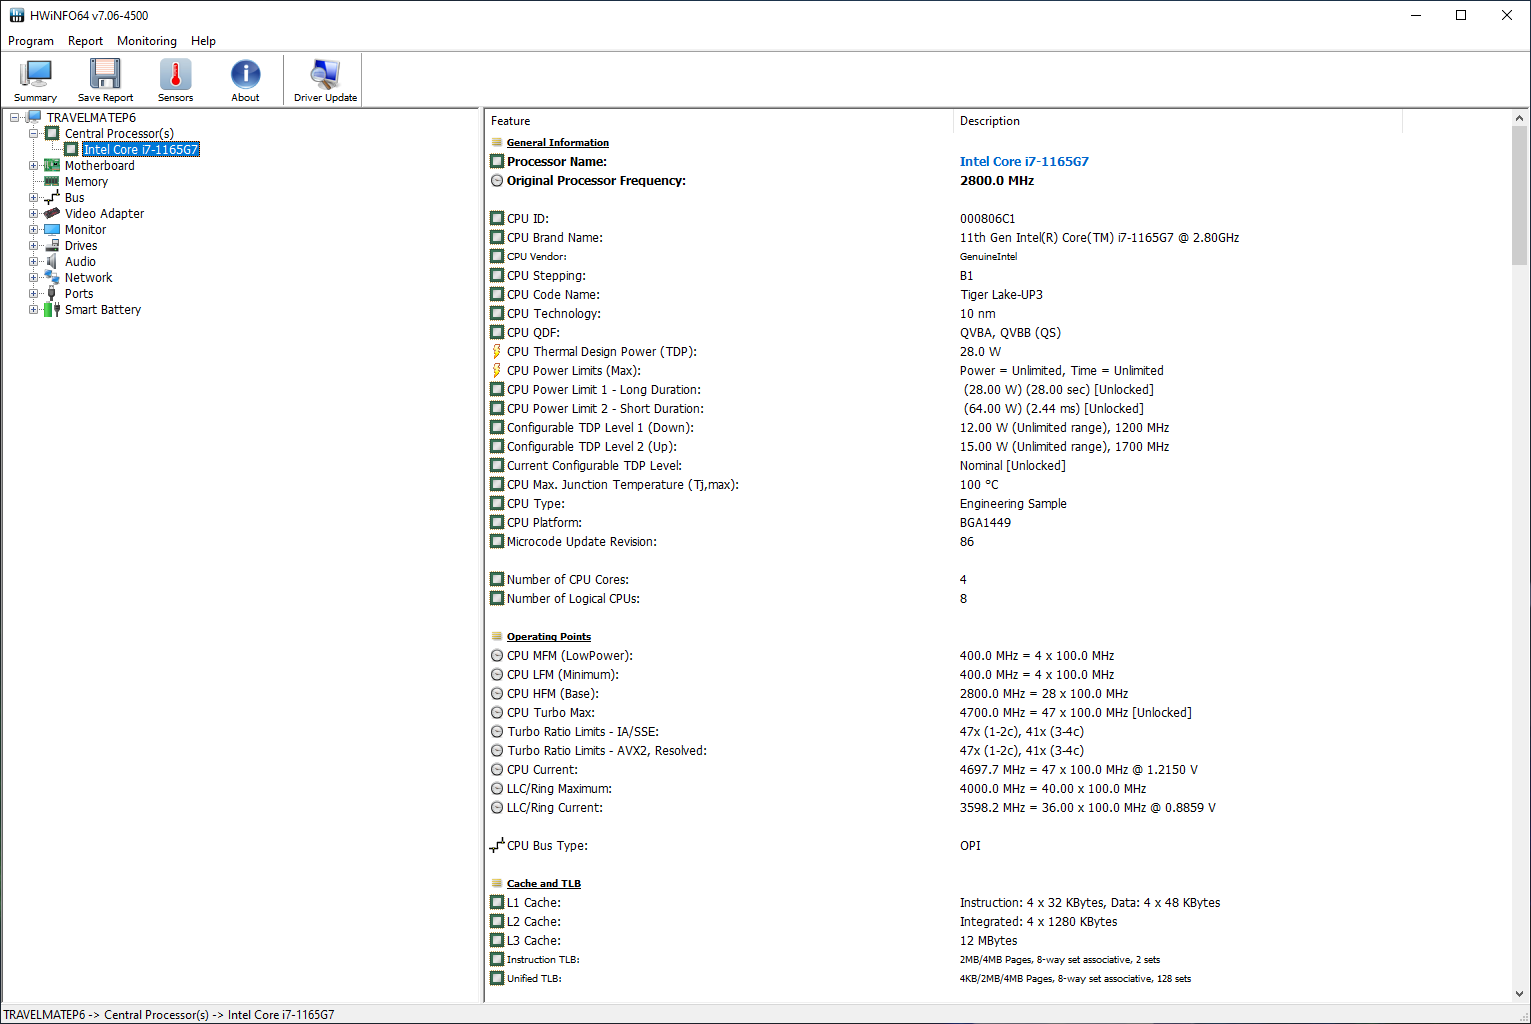
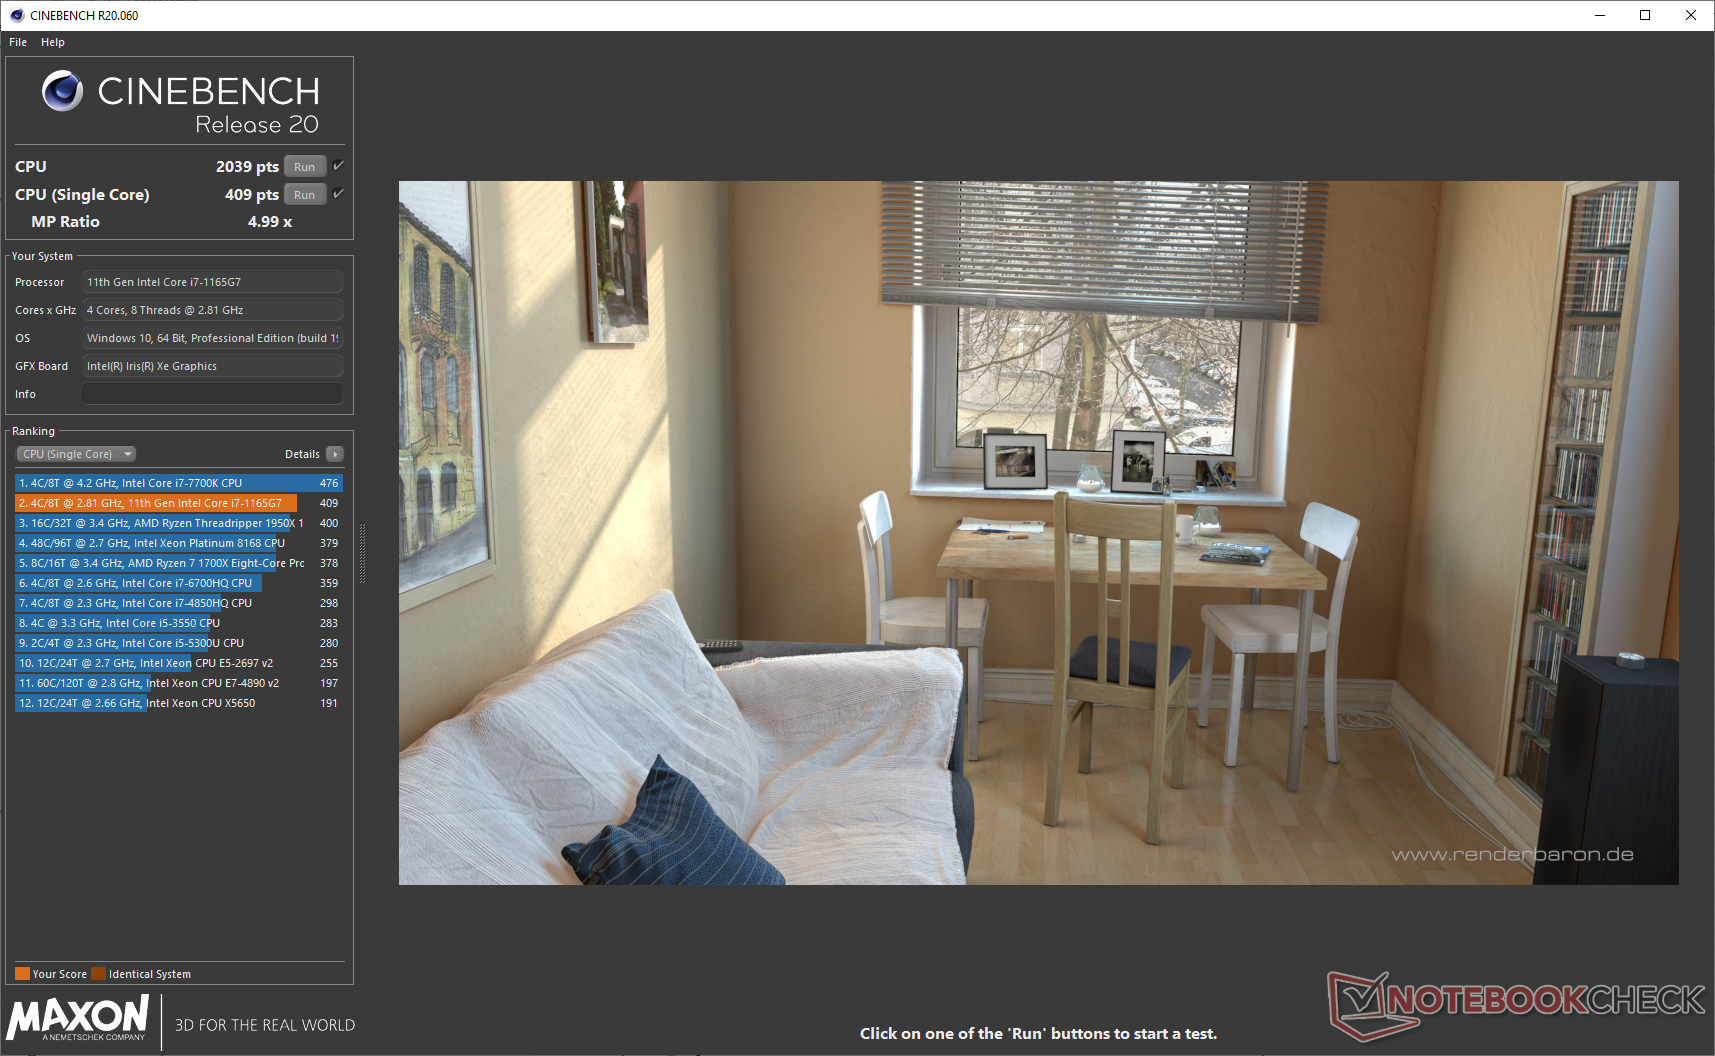
我们的测试装置采用了一个 英特尔Tiger Lake 酷睿i7-1165G7CPU,这是一个4C/8T部件,基础频率为2.8GHz,提升频率为4.7GHz。购买者可以选择 酷睿i5-1135G7和 酷睿i7-1185G7选项。
处理器
TravelMate P6中的Core i7-1165G7提供了非常好的性能,在所有Cinebench单核测试中领先17%,在Geekbench单核测试中领先32%。 AMD Ryzen 7 5700U.单核性能也与酷睿i7-1185G7相当,尽管TravelMate P6的实现不一定是对比中最快的酷睿i7-1165G7。
我们在Cinebench R15循环测试中没有发现节流的迹象,而且性能比我们在联想ThinkPad T14s G2 。宏碁还没有提供基于Ryzen 5000 Mobile的TravelMate P6笔记本电脑,考虑到与基于Ryzen 7 5700U的设备(如联想ThinkPad E15 G3 )相比,在多线程性能方面看到的巨大差距,这是很不幸的。
我们测试样品中的酷睿i7-1165G7允许28W的持续PL1和64W的短爆PL2。根据宏碁的文档,应该可以通过使用Fn+F键盘快捷键在静音、正常和性能模式之间切换。然而,我们收到的预生产样品并没有这个功能。我们还用最新版本的宏碁快速访问应用程序验证了这一点,该应用程序应该提供性能模式选择,但我们找不到任何此类选项。
查看我们专门的 酷睿i7-1165G7页面了解更多信息和基准测试。
Cinebench R15 Multi Loop
Cinebench R20: CPU (Multi Core) | CPU (Single Core)
Cinebench R23: Multi Core | Single Core
Blender: v2.79 BMW27 CPU
7-Zip 18.03: 7z b 4 -mmt1 | 7z b 4
Geekbench 5.5: Single-Core | Multi-Core
HWBOT x265 Benchmark v2.2: 4k Preset
LibreOffice : 20 Documents To PDF
R Benchmark 2.5: Overall mean
| Cinebench R15 / CPU Multi 64Bit | |
| Average of class Office (250 - 3380, n=74, last 2 years) | |
| Asus VivoBook S15 D533UA | |
| Lenovo ThinkPad E15 G3-20YG003UGE | |
| Lenovo ThinkPad T14s G2 20WM003TGE | |
| Razer Book 13 FHD | |
| Dell Latitude 9420 2-in-1 | |
| Asus ExpertBook B9 B9400CE-KC0166R | |
| Acer TravelMate P614P-52 | |
| Framework Laptop 13.5 | |
| Average Intel Core i7-1165G7 (553 - 1027, n=86) | |
| HP EliteBook 830 G8-i7-1165G7 | |
| Cinebench R15 / CPU Single 64Bit | |
| Average of class Office (99.5 - 312, n=74, last 2 years) | |
| Razer Book 13 FHD | |
| Lenovo ThinkPad T14s G2 20WM003TGE | |
| Dell Latitude 9420 2-in-1 | |
| Framework Laptop 13.5 | |
| HP EliteBook 830 G8-i7-1165G7 | |
| Acer TravelMate P614P-52 | |
| Asus ExpertBook B9 B9400CE-KC0166R | |
| Average Intel Core i7-1165G7 (115 - 230, n=78) | |
| Asus VivoBook S15 D533UA | |
| Lenovo ThinkPad E15 G3-20YG003UGE | |
| Cinebench R20 / CPU (Multi Core) | |
| Average of class Office (648 - 8840, n=72, last 2 years) | |
| Asus VivoBook S15 D533UA | |
| Lenovo ThinkPad E15 G3-20YG003UGE | |
| Razer Book 13 FHD | |
| Dell Latitude 9420 2-in-1 | |
| Framework Laptop 13.5 | |
| Acer TravelMate P614P-52 | |
| Asus ExpertBook B9 B9400CE-KC0166R | |
| Average Intel Core i7-1165G7 (1060 - 2657, n=81) | |
| Lenovo ThinkPad T14s G2 20WM003TGE | |
| HP EliteBook 830 G8-i7-1165G7 | |
| Cinebench R20 / CPU (Single Core) | |
| Average of class Office (345 - 816, n=72, last 2 years) | |
| Razer Book 13 FHD | |
| Framework Laptop 13.5 | |
| Dell Latitude 9420 2-in-1 | |
| Acer TravelMate P614P-52 | |
| Asus ExpertBook B9 B9400CE-KC0166R | |
| Average Intel Core i7-1165G7 (442 - 589, n=81) | |
| Lenovo ThinkPad T14s G2 20WM003TGE | |
| HP EliteBook 830 G8-i7-1165G7 | |
| Asus VivoBook S15 D533UA | |
| Lenovo ThinkPad E15 G3-20YG003UGE | |
| Cinebench R23 / Multi Core | |
| Average of class Office (1673 - 22808, n=73, last 2 years) | |
| Asus VivoBook S15 D533UA | |
| Lenovo ThinkPad E15 G3-20YG003UGE | |
| Razer Book 13 FHD | |
| Dell Latitude 9420 2-in-1 | |
| Framework Laptop 13.5 | |
| Acer TravelMate P614P-52 | |
| Average Intel Core i7-1165G7 (2525 - 6862, n=64) | |
| Lenovo ThinkPad T14s G2 20WM003TGE | |
| Asus ExpertBook B9 B9400CE-KC0166R | |
| HP EliteBook 830 G8-i7-1165G7 | |
| Cinebench R23 / Single Core | |
| Average of class Office (708 - 2130, n=73, last 2 years) | |
| Framework Laptop 13.5 | |
| Dell Latitude 9420 2-in-1 | |
| Acer TravelMate P614P-52 | |
| Average Intel Core i7-1165G7 (1110 - 1539, n=59) | |
| Asus ExpertBook B9 B9400CE-KC0166R | |
| HP EliteBook 830 G8-i7-1165G7 | |
| Lenovo ThinkPad T14s G2 20WM003TGE | |
| Asus VivoBook S15 D533UA | |
| Lenovo ThinkPad E15 G3-20YG003UGE | |
| Blender / v2.79 BMW27 CPU | |
| HP EliteBook 830 G8-i7-1165G7 | |
| Average Intel Core i7-1165G7 (468 - 1138, n=80) | |
| Lenovo ThinkPad T14s G2 20WM003TGE | |
| Acer TravelMate P614P-52 | |
| Asus ExpertBook B9 B9400CE-KC0166R | |
| Framework Laptop 13.5 | |
| Dell Latitude 9420 2-in-1 | |
| Razer Book 13 FHD | |
| Average of class Office (158 - 1940, n=73, last 2 years) | |
| Asus VivoBook S15 D533UA | |
| Lenovo ThinkPad E15 G3-20YG003UGE | |
| 7-Zip 18.03 / 7z b 4 -mmt1 | |
| Framework Laptop 13.5 | |
| Average of class Office (3387 - 6469, n=74, last 2 years) | |
| HP EliteBook 830 G8-i7-1165G7 | |
| Razer Book 13 FHD | |
| Dell Latitude 9420 2-in-1 | |
| Asus ExpertBook B9 B9400CE-KC0166R | |
| Average Intel Core i7-1165G7 (4478 - 5507, n=80) | |
| Lenovo ThinkPad T14s G2 20WM003TGE | |
| Acer TravelMate P614P-52 | |
| Asus VivoBook S15 D533UA | |
| Lenovo ThinkPad E15 G3-20YG003UGE | |
| 7-Zip 18.03 / 7z b 4 | |
| Asus VivoBook S15 D533UA | |
| Average of class Office (7098 - 76886, n=75, last 2 years) | |
| Lenovo ThinkPad E15 G3-20YG003UGE | |
| Razer Book 13 FHD | |
| Dell Latitude 9420 2-in-1 | |
| Lenovo ThinkPad T14s G2 20WM003TGE | |
| Framework Laptop 13.5 | |
| Acer TravelMate P614P-52 | |
| Asus ExpertBook B9 B9400CE-KC0166R | |
| Average Intel Core i7-1165G7 (15347 - 27405, n=80) | |
| HP EliteBook 830 G8-i7-1165G7 | |
| Geekbench 5.5 / Single-Core | |
| Average of class Office (811 - 2128, n=71, last 2 years) | |
| Razer Book 13 FHD | |
| HP EliteBook 830 G8-i7-1165G7 | |
| Acer TravelMate P614P-52 | |
| Average Intel Core i7-1165G7 (1302 - 1595, n=77) | |
| Lenovo ThinkPad T14s G2 20WM003TGE | |
| Asus ExpertBook B9 B9400CE-KC0166R | |
| Asus VivoBook S15 D533UA | |
| Lenovo ThinkPad E15 G3-20YG003UGE | |
| Geekbench 5.5 / Multi-Core | |
| Average of class Office (1483 - 16999, n=71, last 2 years) | |
| Asus VivoBook S15 D533UA | |
| Lenovo ThinkPad E15 G3-20YG003UGE | |
| Razer Book 13 FHD | |
| Acer TravelMate P614P-52 | |
| Lenovo ThinkPad T14s G2 20WM003TGE | |
| HP EliteBook 830 G8-i7-1165G7 | |
| Average Intel Core i7-1165G7 (3078 - 5926, n=77) | |
| Asus ExpertBook B9 B9400CE-KC0166R | |
| HWBOT x265 Benchmark v2.2 / 4k Preset | |
| Average of class Office (2.21 - 26, n=73, last 2 years) | |
| Asus VivoBook S15 D533UA | |
| Lenovo ThinkPad E15 G3-20YG003UGE | |
| Razer Book 13 FHD | |
| Dell Latitude 9420 2-in-1 | |
| Lenovo ThinkPad T14s G2 20WM003TGE | |
| Framework Laptop 13.5 | |
| Asus ExpertBook B9 B9400CE-KC0166R | |
| Acer TravelMate P614P-52 | |
| Average Intel Core i7-1165G7 (1.39 - 8.47, n=80) | |
| HP EliteBook 830 G8-i7-1165G7 | |
| LibreOffice / 20 Documents To PDF | |
| Lenovo ThinkPad E15 G3-20YG003UGE | |
| Average of class Office (41.5 - 102.3, n=73, last 2 years) | |
| Asus VivoBook S15 D533UA | |
| HP EliteBook 830 G8-i7-1165G7 | |
| Razer Book 13 FHD | |
| Asus ExpertBook B9 B9400CE-KC0166R | |
| Average Intel Core i7-1165G7 (21.5 - 88.1, n=78) | |
| Dell Latitude 9420 2-in-1 | |
| Acer TravelMate P614P-52 | |
| Framework Laptop 13.5 | |
| Lenovo ThinkPad T14s G2 20WM003TGE | |
| R Benchmark 2.5 / Overall mean | |
| Lenovo ThinkPad E15 G3-20YG003UGE | |
| Acer TravelMate P614P-52 | |
| Average Intel Core i7-1165G7 (0.552 - 1.002, n=80) | |
| Asus ExpertBook B9 B9400CE-KC0166R | |
| Lenovo ThinkPad T14s G2 20WM003TGE | |
| Asus VivoBook S15 D533UA | |
| Framework Laptop 13.5 | |
| Dell Latitude 9420 2-in-1 | |
| HP EliteBook 830 G8-i7-1165G7 | |
| Razer Book 13 FHD | |
| Average of class Office (0.4098 - 0.888, n=73, last 2 years) | |
* ... smaller is better
在电池上快速运行Cinebench R20测试在平衡电源配置文件中与交流电源相比,在多核得分方面没有显示出太大的变化。
然而,我们确实看到单核性能下降了近27%,因为电池上的时钟从~4.5GHz降到~3.2GHz。
系统性能
TravelMate P6的一般生产力不是问题。这款笔记本电脑的反应相当快,日常使用的整体体验基本没有滞后性。酷睿i7-1165G7提供了足够的动力来满足移动中的典型业务需求。PCMark 10结果显示,TravelMate P6与Ryzen 7 5700U和Core i7-1185G7驱动的笔记本电脑不相上下。
| PCMark 10 / Score | |
| Average of class Office (2601 - 9298, n=63, last 2 years) | |
| Lenovo ThinkPad E15 G3-20YG003UGE | |
| Asus VivoBook S15 D533UA | |
| Acer TravelMate P614P-52 | |
| Dell Latitude 9420 2-in-1 | |
| Lenovo ThinkPad T14s G2 20WM003TGE | |
| Razer Book 13 FHD | |
| HP EliteBook 830 G8-i7-1165G7 | |
| Asus ExpertBook B9 B9400CE-KC0166R | |
| Average Intel Core i7-1165G7, Intel Iris Xe Graphics G7 96EUs (4531 - 5454, n=50) | |
| Framework Laptop 13.5 | |
| PCMark 10 / Essentials | |
| Acer TravelMate P614P-52 | |
| Razer Book 13 FHD | |
| Dell Latitude 9420 2-in-1 | |
| Framework Laptop 13.5 | |
| Lenovo ThinkPad T14s G2 20WM003TGE | |
| Asus ExpertBook B9 B9400CE-KC0166R | |
| Average Intel Core i7-1165G7, Intel Iris Xe Graphics G7 96EUs (8997 - 11505, n=50) | |
| Average of class Office (3245 - 11594, n=63, last 2 years) | |
| HP EliteBook 830 G8-i7-1165G7 | |
| Lenovo ThinkPad E15 G3-20YG003UGE | |
| Asus VivoBook S15 D533UA | |
| PCMark 10 / Productivity | |
| Average of class Office (5336 - 17243, n=63, last 2 years) | |
| Lenovo ThinkPad E15 G3-20YG003UGE | |
| Asus VivoBook S15 D533UA | |
| Acer TravelMate P614P-52 | |
| Dell Latitude 9420 2-in-1 | |
| Lenovo ThinkPad T14s G2 20WM003TGE | |
| Asus ExpertBook B9 B9400CE-KC0166R | |
| HP EliteBook 830 G8-i7-1165G7 | |
| Razer Book 13 FHD | |
| Average Intel Core i7-1165G7, Intel Iris Xe Graphics G7 96EUs (5570 - 7136, n=50) | |
| Framework Laptop 13.5 | |
| PCMark 10 / Digital Content Creation | |
| Average of class Office (2049 - 13541, n=63, last 2 years) | |
| Asus VivoBook S15 D533UA | |
| Lenovo ThinkPad E15 G3-20YG003UGE | |
| Acer TravelMate P614P-52 | |
| Dell Latitude 9420 2-in-1 | |
| Lenovo ThinkPad T14s G2 20WM003TGE | |
| HP EliteBook 830 G8-i7-1165G7 | |
| Razer Book 13 FHD | |
| Framework Laptop 13.5 | |
| Asus ExpertBook B9 B9400CE-KC0166R | |
| Average Intel Core i7-1165G7, Intel Iris Xe Graphics G7 96EUs (4083 - 5550, n=50) | |
| PCMark 8 Home Score Accelerated v2 | 5686 points | |
| PCMark 8 Creative Score Accelerated v2 | 7783 points | |
| PCMark 10 Score | 5317 points | |
Help | ||
DPC延时
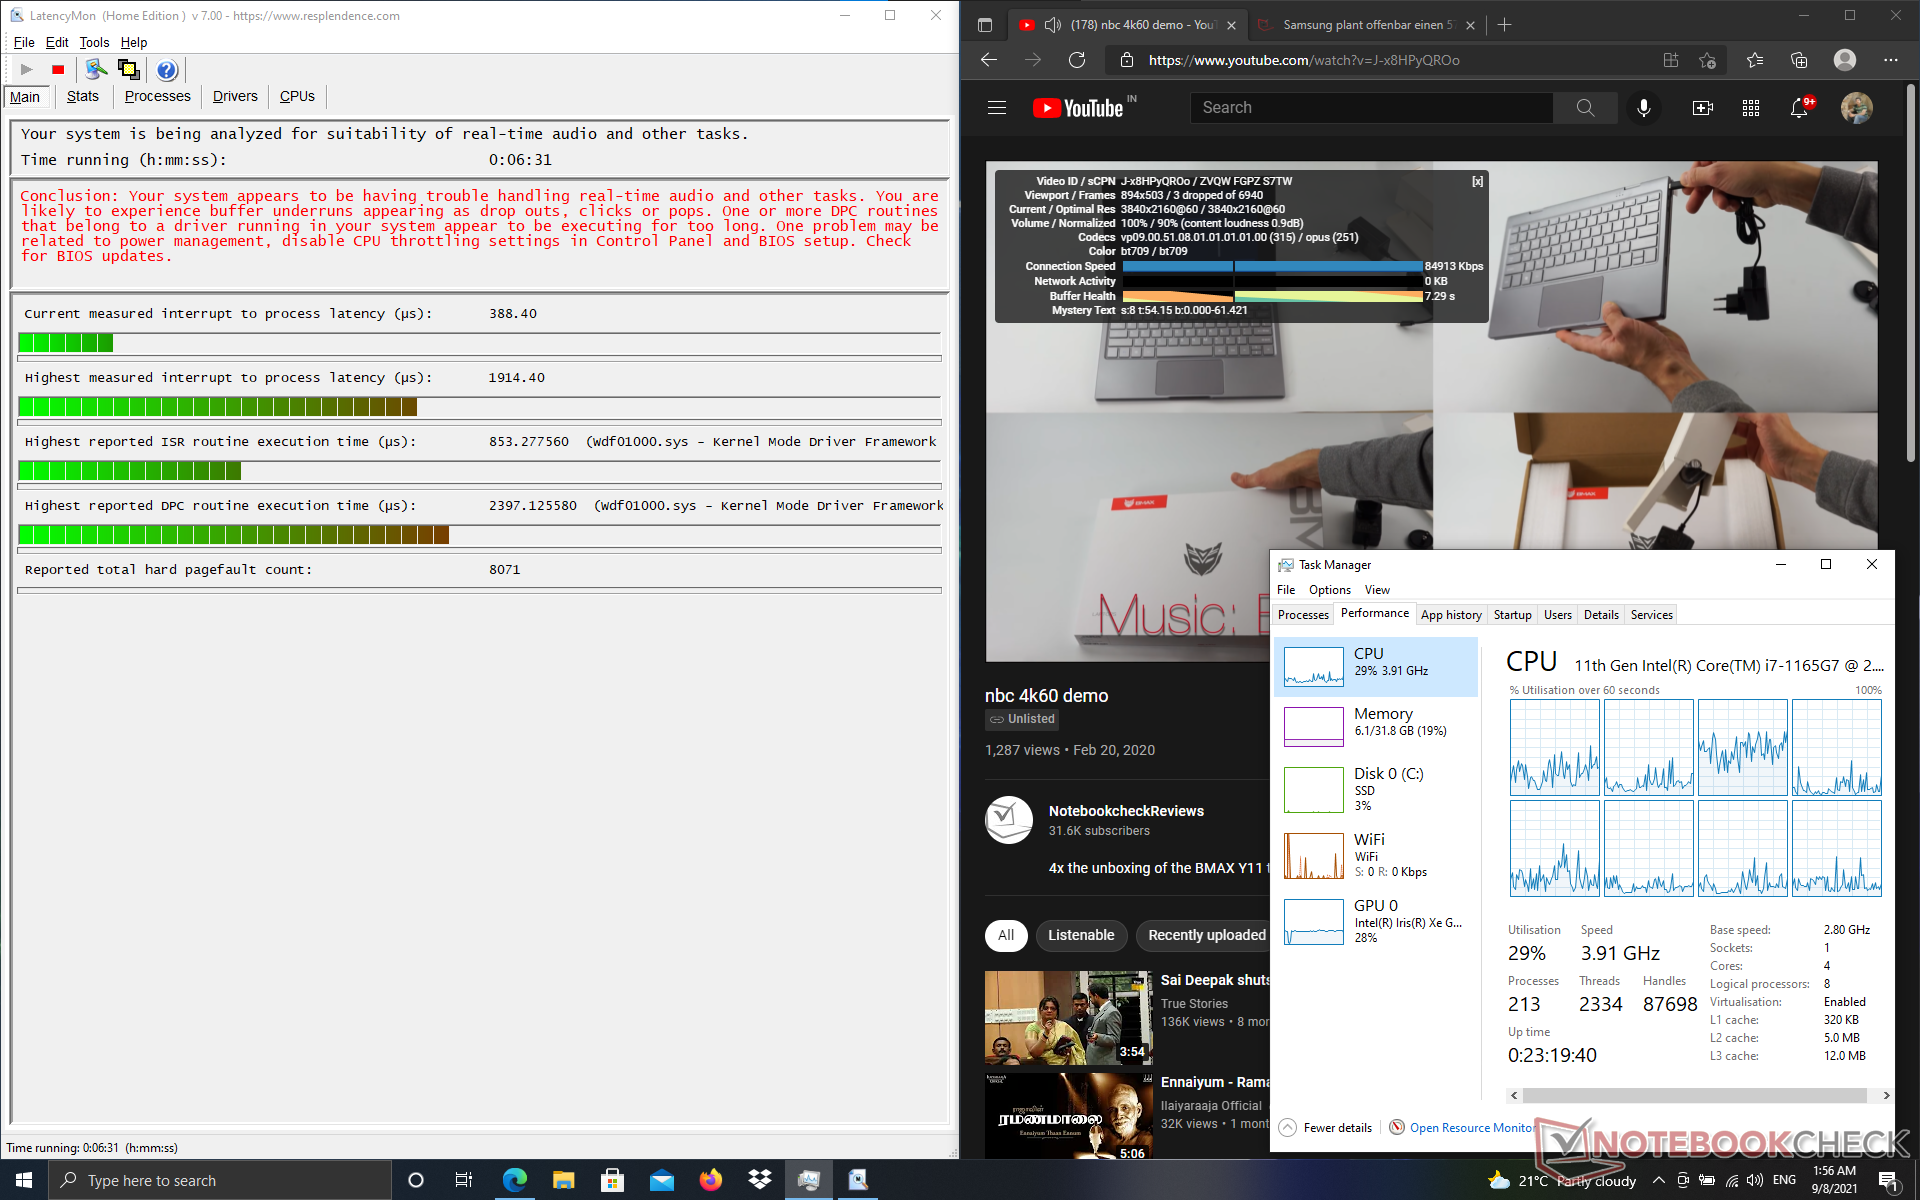
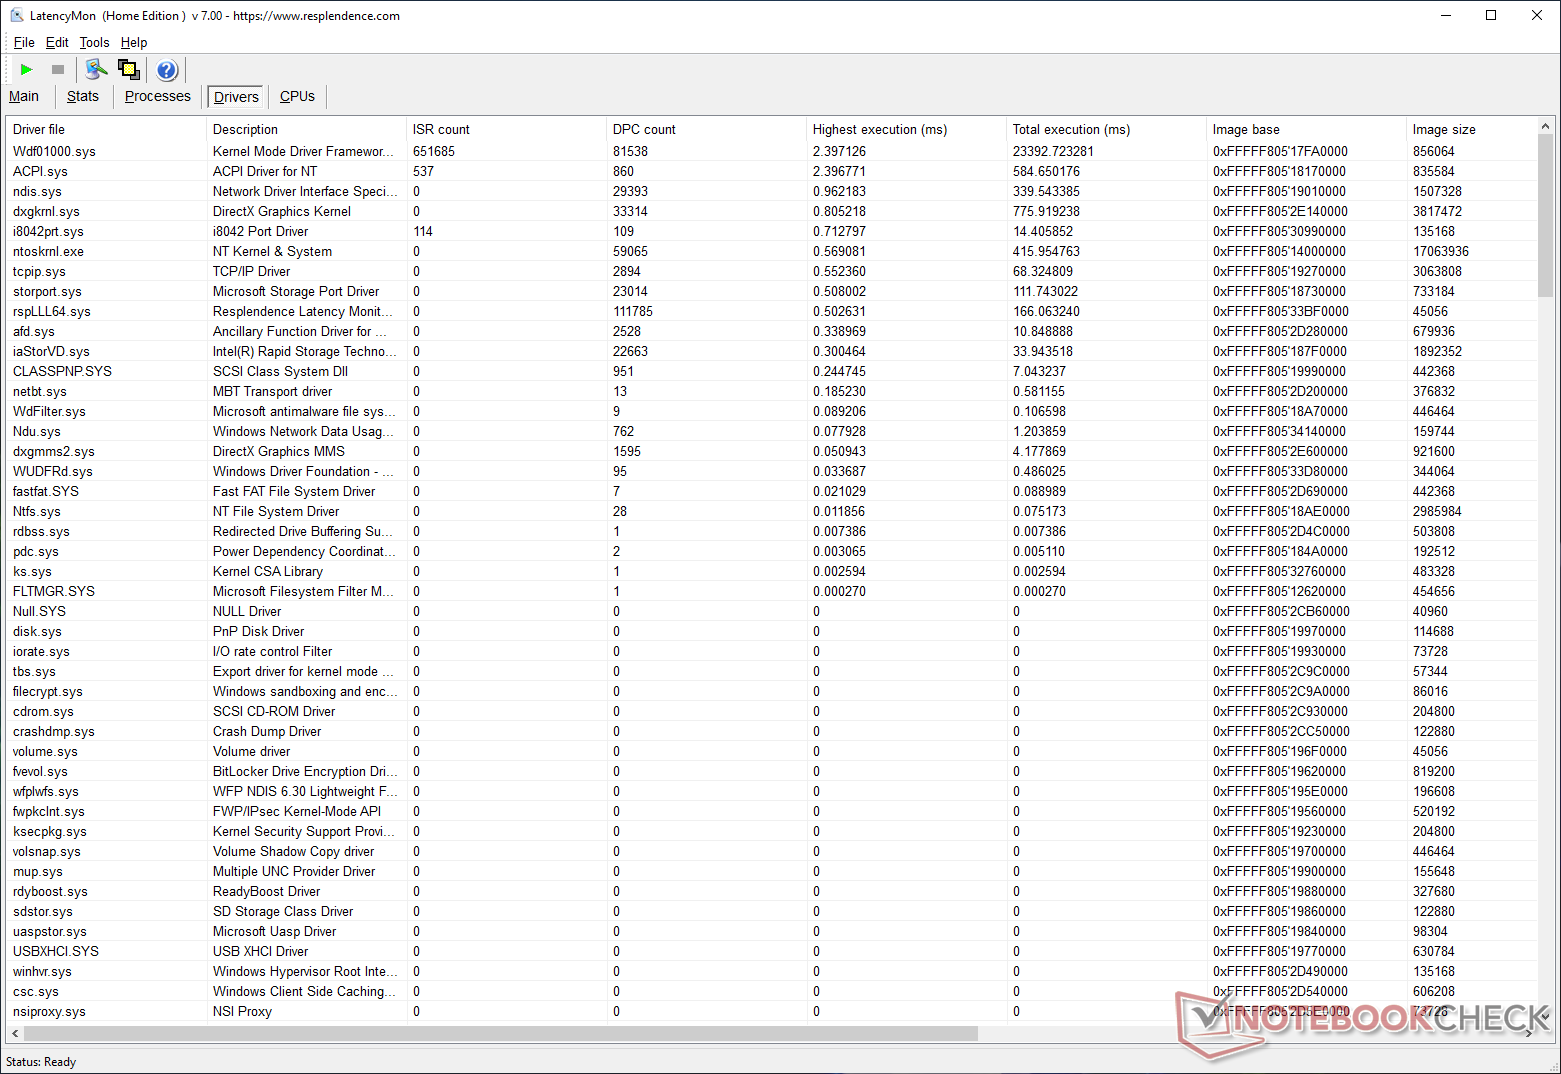
我们使用LatencyMon测量了系统延迟,同时打开我们网站的多个标签,在YouTube上播放我们的4K视频样本,并运行Prime95原地大型FFT压力10秒。我们记录了1914.40微秒的高延迟。LatencyMon显示Wdf01000.sys,也就是Windows内核模式驱动框架,是执行时间最长的驱动。
也就是说,Wdf01000.sys的高执行时间通常是由于其他错误的驱动程序造成的,在这种情况下主要是ACPI.sys。尽管如此,TravelMate P6似乎并不适合进行实时音频或视频编辑。
请查看我们的DPC延迟排名 页面,了解更多的延迟比较。
| DPC Latencies / LatencyMon - interrupt to process latency (max), Web, Youtube, Prime95 | |
| Lenovo ThinkPad T14s G2 20WM003TGE | |
| Framework Laptop 13.5 | |
| Acer TravelMate P614P-52 | |
| Razer Book 13 FHD | |
| HP EliteBook 830 G8-i7-1165G7 | |
| Lenovo ThinkPad E15 G3-20YG003UGE | |
| Asus VivoBook S15 D533UA | |
| Dell Latitude 9420 2-in-1 | |
| Asus ExpertBook B9 B9400CE-KC0166R | |
* ... smaller is better
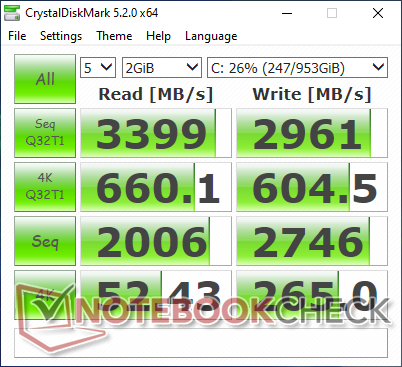
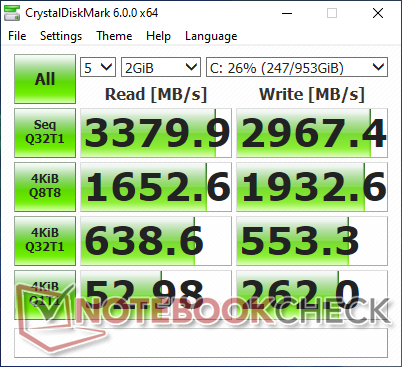
存储设备
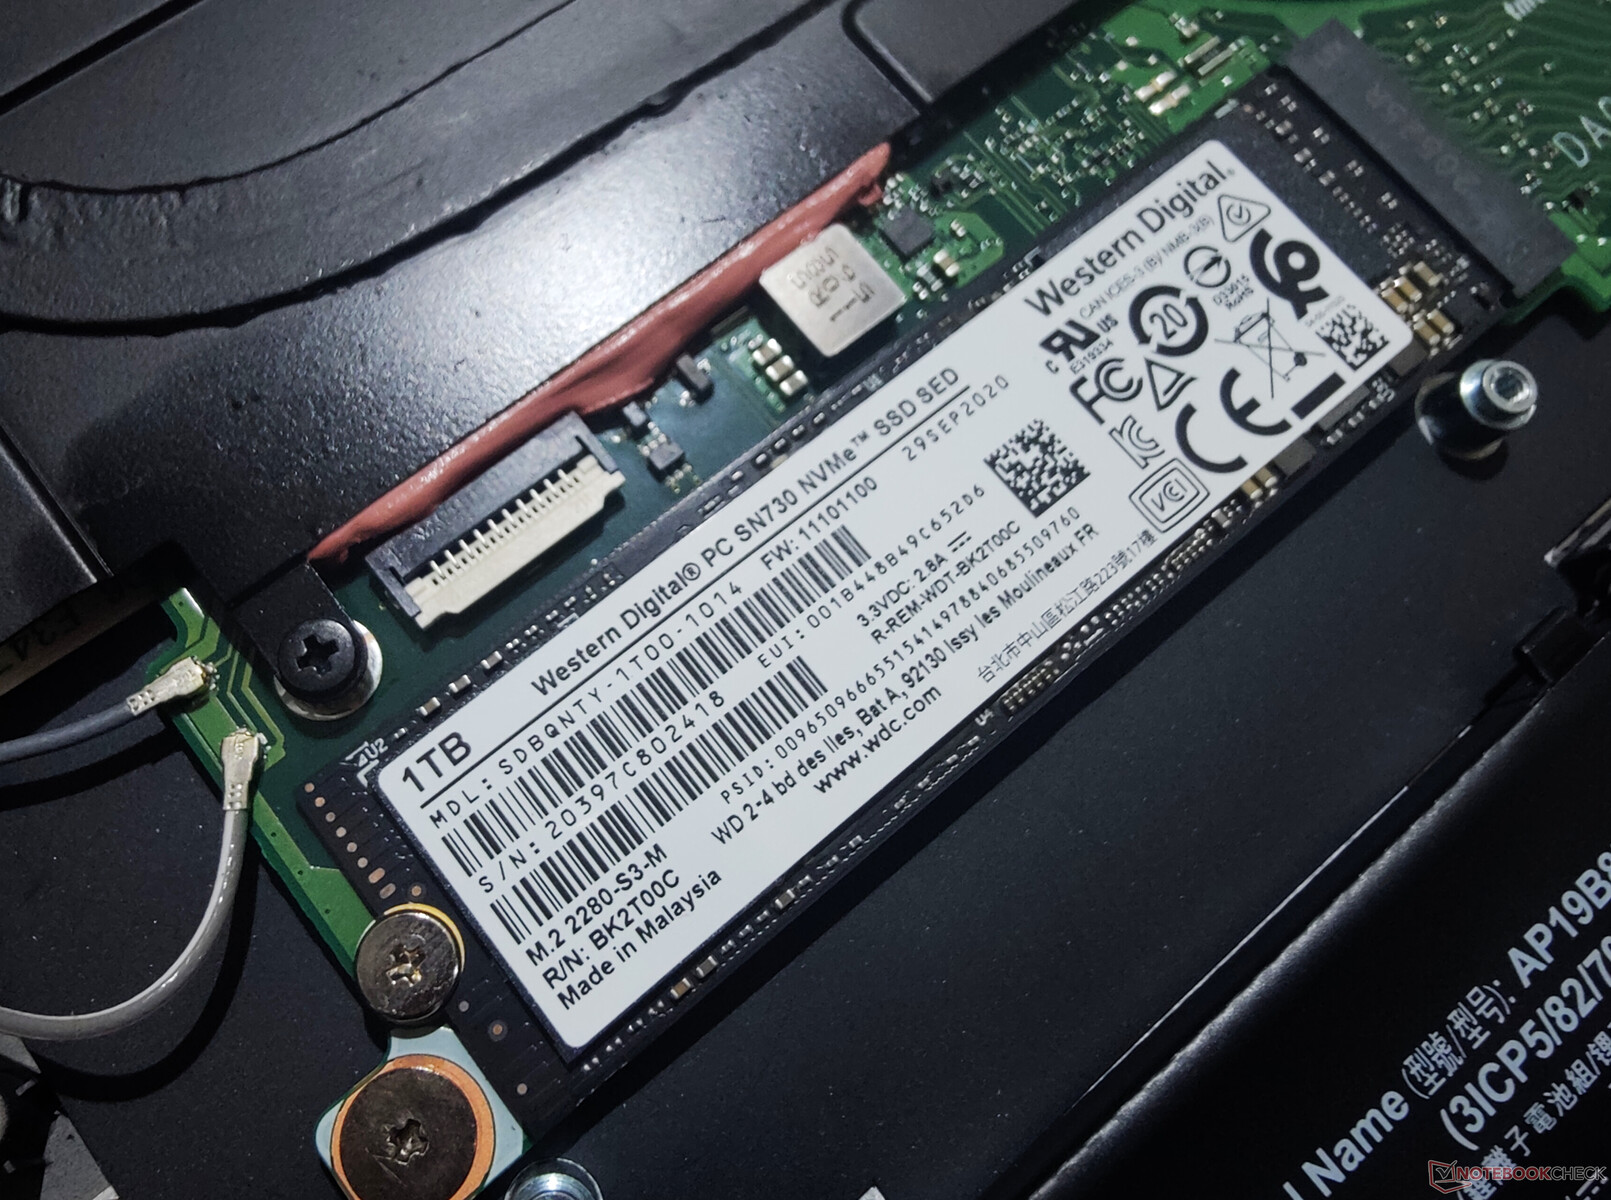
我们的设备配备了一个1TB的西部数据SN730 PCIe Gen3 NVMe SSD,占据了主板上唯一的M.2 2280插槽。没有通过额外的M.2插槽或驱动器托架进行存储扩展的空间。合成基准显示,TravelMate P6中的SN730固态硬盘明显快于竞争对手,仅被Framework Laptop 13.5中的SN850 PCIe Gen4固态硬盘击败 。
我们在DiskSpd读取循环测试中也没有观察到任何节流现象。这款硬盘的性能对于预期的商业人群来说是绰绰有余的。
请看我们的 SSD和HDD基准测试页面了解更多存储性能的比较。
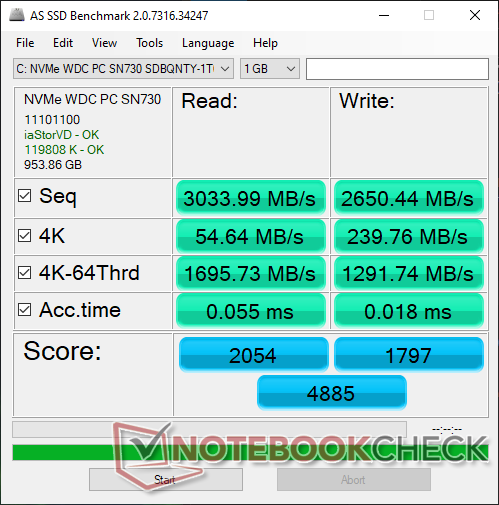
| Acer TravelMate P614P-52 WDC PC SN730 SDBQNTY-1T00 | Lenovo ThinkPad T14s G2 20WM003TGE Samsung PM981a MZVLB1T0HBLR | HP EliteBook 830 G8-i7-1165G7 Samsung PM981a MZVLB1T0HBLR | Framework Laptop 13.5 Western Digital WD_BLACK SN850 WDS100T1X0E | Dell Latitude 9420 2-in-1 WDC PC SN530 SDBPNPZ-512G | Razer Book 13 FHD Samsung SSD PM981a MZVLB256HBHQ | Average WDC PC SN730 SDBQNTY-1T00 | |
|---|---|---|---|---|---|---|---|
| AS SSD | -8% | -24% | 30% | -86% | -57% | -12% | |
| Seq Read (MB/s) | 3034 | 2825 -7% | 2797 -8% | 5613 85% | 2102 -31% | 2329 -23% | 2679 ? -12% |
| Seq Write (MB/s) | 2650 | 1288 -51% | 1528 -42% | 4909 85% | 1155 -56% | 1011 -62% | 2311 ? -13% |
| 4K Read (MB/s) | 54.6 | 61.2 12% | 54.3 -1% | 80.6 48% | 45.63 -16% | 53 -3% | 45.7 ? -16% |
| 4K Write (MB/s) | 239.8 | 190.6 -21% | 128.4 -46% | 256.6 7% | 238.9 0% | 188.4 -21% | 148.8 ? -38% |
| 4K-64 Read (MB/s) | 1696 | 1147 -32% | 1095 -35% | 2222 31% | 752 -56% | 546 -68% | 1549 ? -9% |
| 4K-64 Write (MB/s) | 1292 | 1827 41% | 1640 27% | 2050 59% | 396.1 -69% | 416.4 -68% | 1747 ? 35% |
| Access Time Read * (ms) | 0.055 | 0.055 -0% | 0.041 25% | 0.032 42% | 0.062 -13% | 0.067 -22% | 0.0615 ? -12% |
| Access Time Write * (ms) | 0.018 | 0.019 -6% | 0.03 -67% | 0.044 -144% | 0.167 -828% | 0.058 -222% | 0.02817 ? -57% |
| Score Read (Points) | 2054 | 1491 -27% | 1429 -30% | 2864 39% | 1008 -51% | 832 -59% | 1863 ? -9% |
| Score Write (Points) | 1797 | 2146 19% | 1922 7% | 2797 56% | 751 -58% | 706 -61% | 2129 ? 18% |
| Score Total (Points) | 4885 | 4336 -11% | 4029 -18% | 7098 45% | 2238 -54% | 1914 -61% | 4927 ? 1% |
| Copy ISO MB/s (MB/s) | 2678 | 2715 1% | 1926 -28% | 1588 -41% | 1664 -38% | 1868 ? -30% | |
| Copy Program MB/s (MB/s) | 469.8 | 130.1 -72% | 947 102% | 1038 121% | 415.2 -12% | 512 ? 9% | |
| Copy Game MB/s (MB/s) | 1958 | 459.3 -77% | 1880 -4% | 1006 -49% | 420.2 -79% | 1365 ? -30% | |
| CrystalDiskMark 5.2 / 6 | -8% | -12% | 67% | -25% | -19% | -10% | |
| Write 4K (MB/s) | 265 | 149.7 -44% | 133.1 -50% | 299.4 13% | 190 -28% | 138.1 -48% | 169.8 ? -36% |
| Read 4K (MB/s) | 52.4 | 64.5 23% | 58 11% | 87.6 67% | 48.1 -8% | 44.97 -14% | 50.4 ? -4% |
| Write Seq (MB/s) | 2746 | 1933 -30% | 2032 -26% | 5205 90% | 1700 -38% | 1948 -29% | 2351 ? -14% |
| Read Seq (MB/s) | 2006 | 2512 25% | 2456 22% | 4276 113% | 1594 -21% | 2225 11% | 2078 ? 4% |
| Write 4K Q32T1 (MB/s) | 605 | 514 -15% | 461.9 -24% | 846 40% | 517 -15% | 526 -13% | 457 ? -24% |
| Read 4K Q32T1 (MB/s) | 660 | 475.9 -28% | 454.2 -31% | 905 37% | 477.8 -28% | 379.6 -42% | 513 ? -22% |
| Write Seq Q32T1 (MB/s) | 2961 | 2968 0% | 3021 2% | 5189 75% | 1841 -38% | 2258 -24% | 3048 ? 3% |
| Read Seq Q32T1 (MB/s) | 3399 | 3542 4% | 3534 4% | 6921 104% | 2472 -27% | 3528 4% | 3334 ? -2% |
| Write 4K Q8T8 (MB/s) | 1933 | 1933 ? 0% | |||||
| Read 4K Q8T8 (MB/s) | 1653 | 1653 ? 0% | |||||
| Total Average (Program / Settings) | -8% /
-8% | -18% /
-19% | 49% /
44% | -56% /
-64% | -38% /
-43% | -11% /
-11% |
* ... smaller is better

Disk Throttling: DiskSpd Read Loop, Queue Depth 8
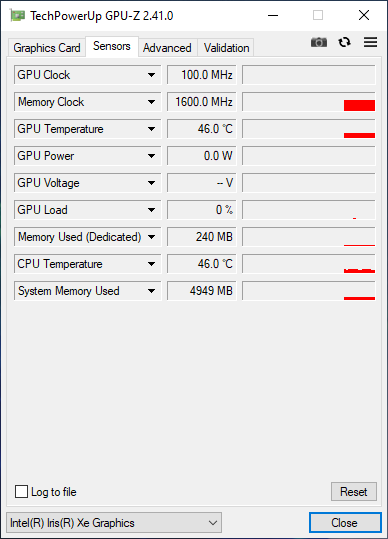
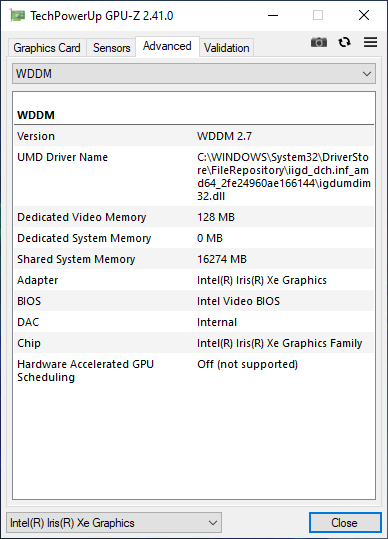
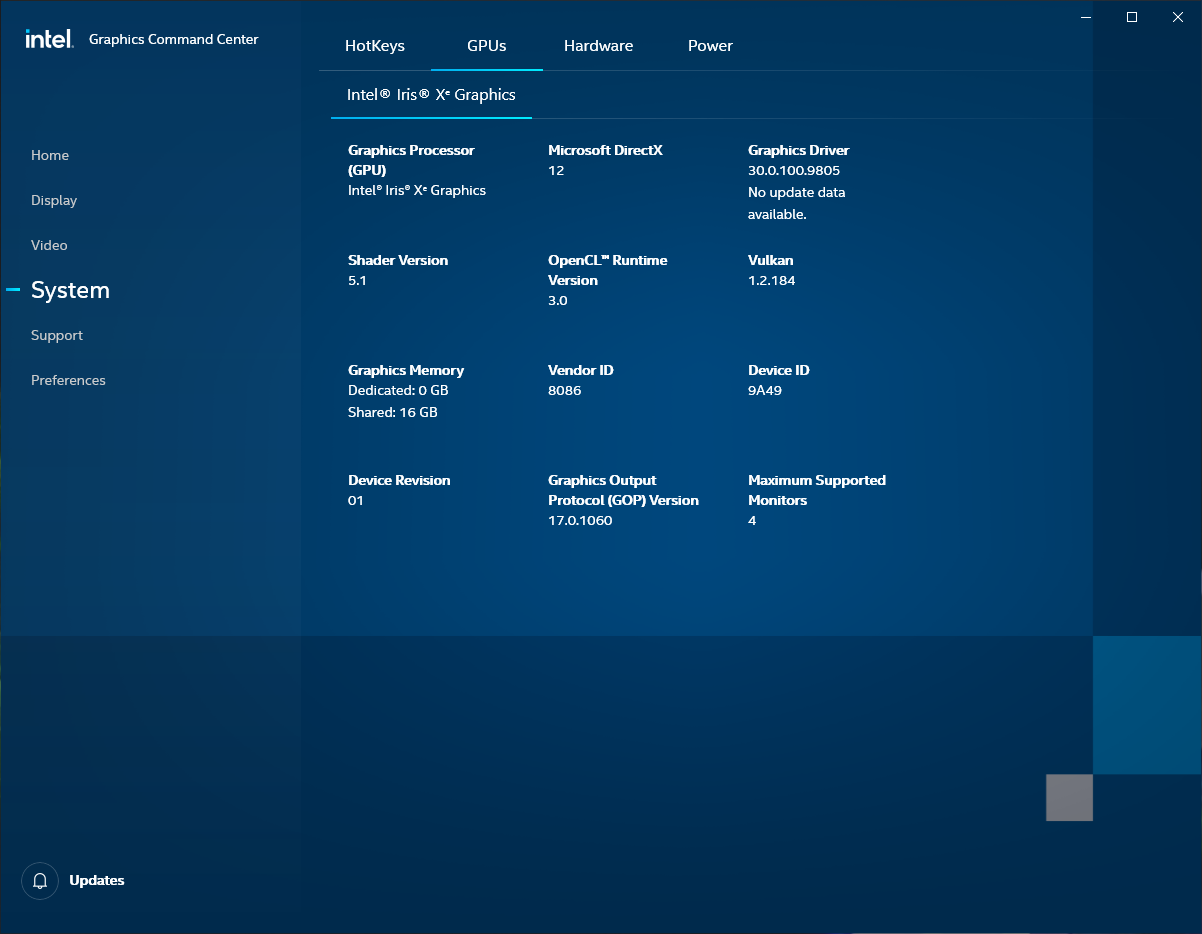
GPU性能
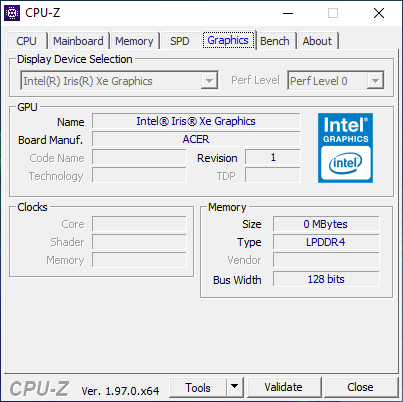
酷睿i7-1165G7配备了Iris Xe Graphics G7 iGPU,有96个执行单元(EUs),其基本时钟为400 MHz,提升频率高达1300 MHz。从下面的基准测试可以看出,Iris Xe Graphics G7适用于轻度3D工作负载。
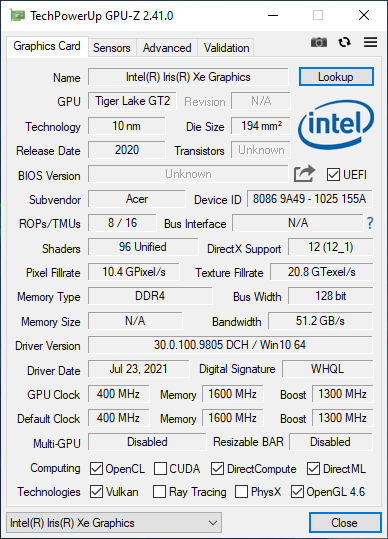
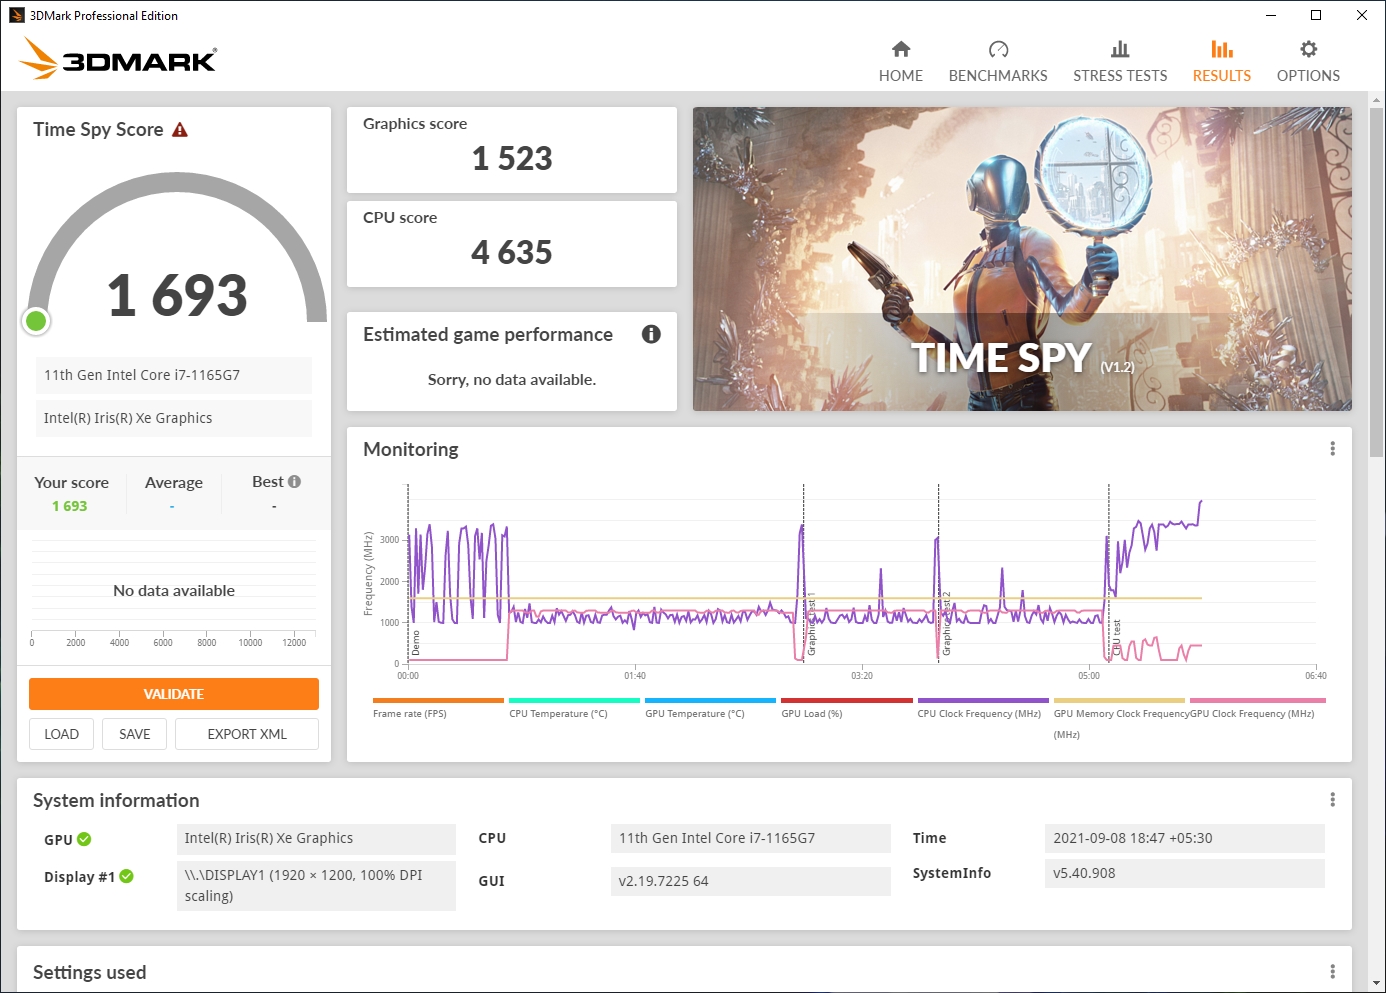
Iris Xe Graphics G7在3DMark中的性能在预期范围内,通常在稍快的时钟变量的范围内。 酷睿i7-1185G7.Iris Xe Graphics G7明显快于 Radeon RX Vega 8iGPU在Ryzen 7 5700U中的速度。
在3DMarkTime Spy 中,我们看到在平衡电源配置文件中,电池的性能只下降了约6%,这并不是一个重大的下降。
| 3DMark 11 Performance | 7145 points | |
| 3DMark Ice Storm Standard Score | 93056 points | |
| 3DMark Cloud Gate Standard Score | 20427 points | |
| 3DMark Fire Strike Score | 5000 points | |
| 3DMark Time Spy Score | 1804 points | |
Help | ||
游戏性能
Iris Xe Graphics G7适合在低到中等设置下进行旧游戏的轻度游戏。有趣的是,我们发现游戏性能有时甚至优于酷睿i7-1185G7中稍快的版本,并且远远高于迄今为止测试的所有Xe Graphics G7的96 EU的总体平均水平。
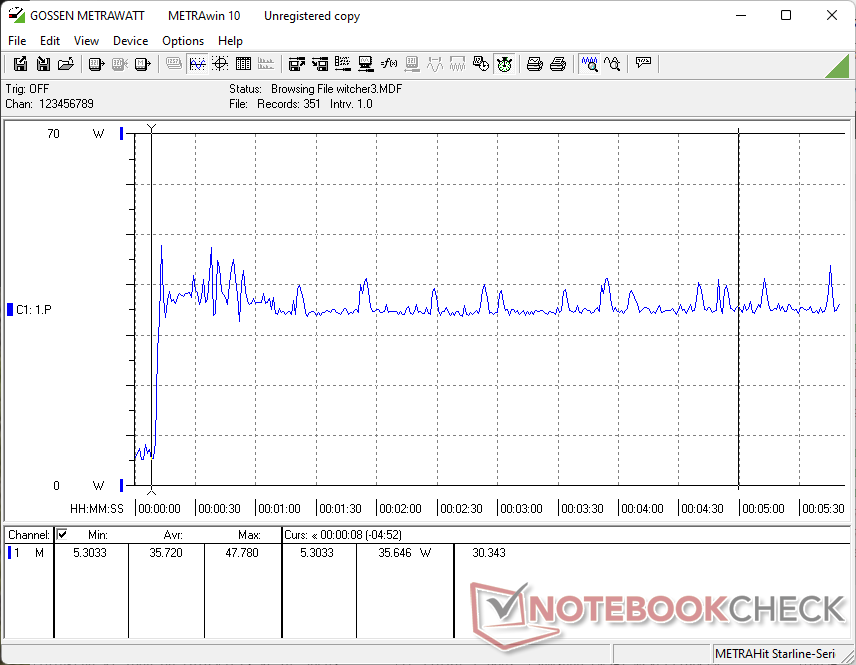
Witcher 3 FPS图表
在TheWitcher 3压力测试中,iGPU在1080p Ultra下难以维持稳定的帧率。因此,大多数现代游戏在高设置下将不会带来愉快的体验。
请查看我们的专用 Iris Xe Graphics G7 96 EUs网页,了解更多的比较和性能基准。
| low | med. | high | ultra | |
|---|---|---|---|---|
| BioShock Infinite (2013) | 142.3 | 100.5 | 114.7 | 32.75 |
| The Witcher 3 (2015) | 97.7 | 62.7 | 32.9 | 16.3 |
| Dota 2 Reborn (2015) | 125.8 | 82.2 | 59.5 | 57.1 |
| Final Fantasy XV Benchmark (2018) | 45.4 | 25 | 25 | |
| X-Plane 11.11 (2018) | 28.5 | 43.4 | 33.9 | |
| Strange Brigade (2018) | 85 | 38.6 | 30.9 | 24.9 |
Emissions: Quiet and comfortable for the most part
系统噪音
TravelMate P6在大多数工作负荷下都能很好地提供一个相对愉快的计算体验。在Prime95+FurMark负载下,我们观察到最大的风扇噪音为43.71 dB(A),而在1080p Ultra下运行The Wither 3压力时,大约为40.7 dB(A)。
在常规使用中,风扇只在负载时开启,噪音情况在大多数情况下是可控的。我们没有观察到任何杂音,如咔嚓声或线圈啸叫声。
| Acer TravelMate P614P-52 Iris Xe G7 96EUs, i7-1165G7, WDC PC SN730 SDBQNTY-1T00 | Lenovo ThinkPad T14s G2 20WM003TGE Iris Xe G7 96EUs, i7-1165G7, Samsung PM981a MZVLB1T0HBLR | HP EliteBook 830 G8-i7-1165G7 Iris Xe G7 96EUs, i7-1165G7, Samsung PM981a MZVLB1T0HBLR | Framework Laptop 13.5 Iris Xe G7 96EUs, i7-1165G7, Western Digital WD_BLACK SN850 WDS100T1X0E | Dell Latitude 9420 2-in-1 Iris Xe G7 96EUs, i7-1185G7, WDC PC SN530 SDBPNPZ-512G | Razer Book 13 FHD Iris Xe G7 96EUs, i7-1165G7, Samsung SSD PM981a MZVLB256HBHQ | |
|---|---|---|---|---|---|---|
| Noise | 11% | 6% | 1% | 9% | 6% | |
| off / environment * (dB) | 26.61 | 24.81 7% | 26 2% | 23.9 10% | 25.4 5% | 27 -1% |
| Idle Minimum * (dB) | 26.61 | 24.81 7% | 26 2% | 23.9 10% | 25.4 5% | 27 -1% |
| Idle Average * (dB) | 26.61 | 24.81 7% | 26 2% | 23.9 10% | 25.4 5% | 27 -1% |
| Idle Maximum * (dB) | 26.61 | 24.81 7% | 27.5 -3% | 23.9 10% | 25.4 5% | 27.1 -2% |
| Load Average * (dB) | 42.1 | 35.14 17% | 35.4 16% | 45.6 -8% | 25.4 40% | 29 31% |
| Witcher 3 ultra * (dB) | 40.7 | 47.1 -16% | 41.3 -1% | 33.3 18% | ||
| Load Maximum * (dB) | 43.71 | 35.14 20% | 35.3 19% | 47.9 -10% | 41.3 6% | 44.8 -2% |
* ... smaller is better
Noise level
| Idle |
| 26.61 / 26.61 / 26.61 dB(A) |
| Load |
| 42.1 / 43.71 dB(A) |
 | ||
30 dB silent 40 dB(A) audible 50 dB(A) loud |
||
min: | ||
温度
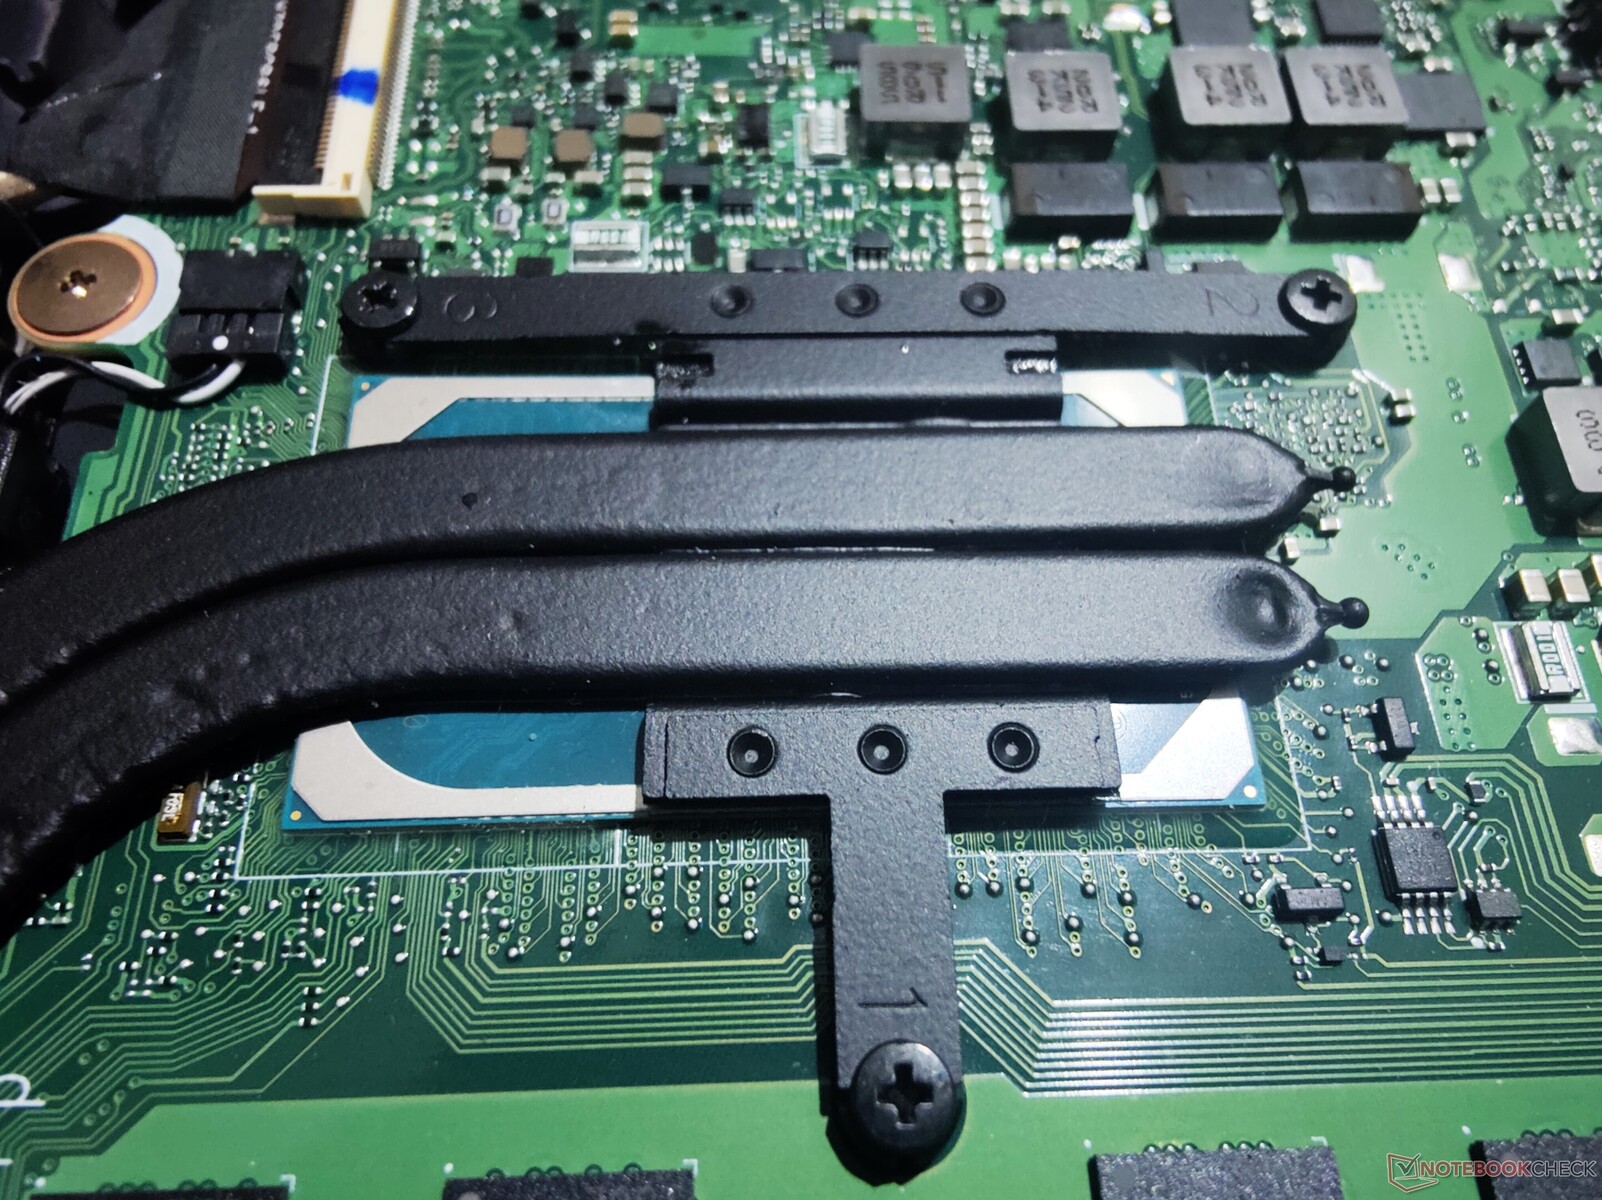
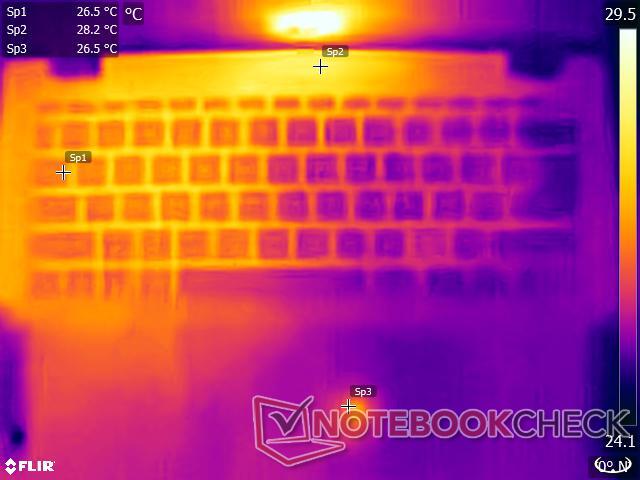
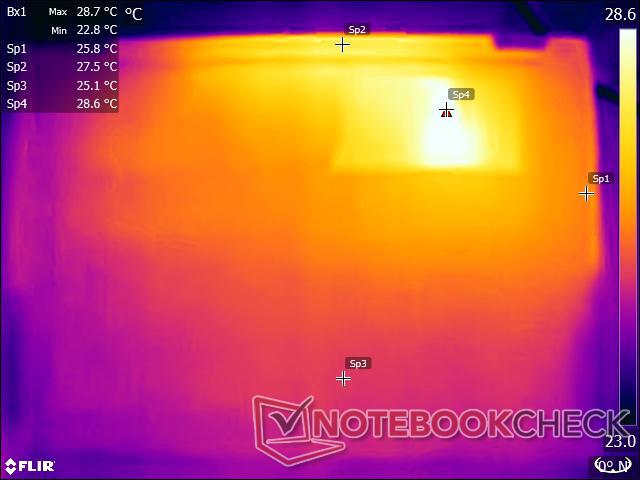
鉴于处理器的超低电压性质,TravelMate P6配备了一个双热管布置的单风扇。这种冷却机制对于目标人群来说是相当充分的,能够处理我们对它施加的人为压力,而不会导致表面温度过高。
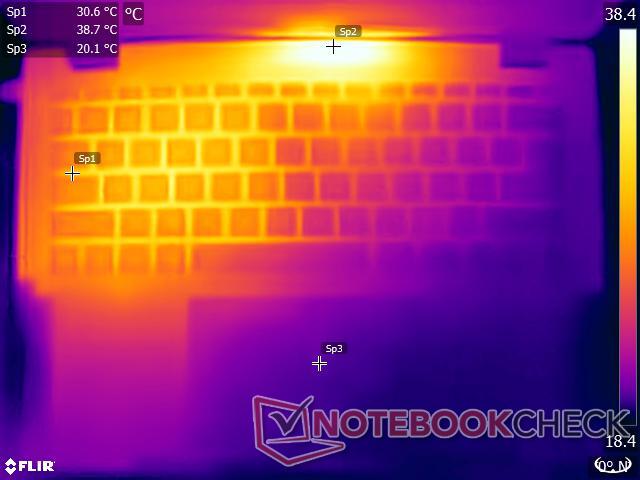
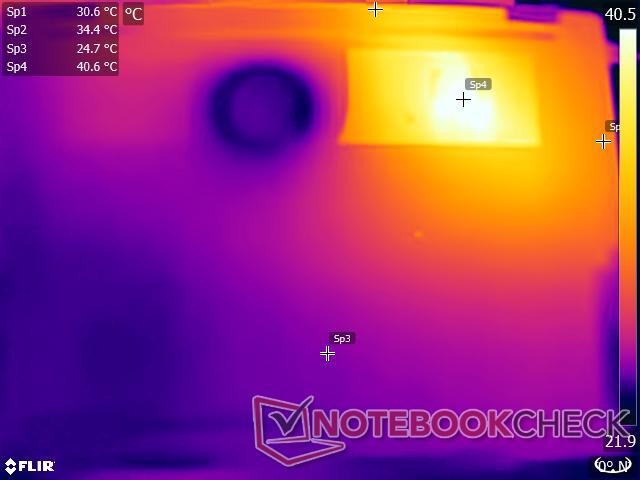
在压力下,较高的温度主要是在设备的前部左上方和底部右上方观察到的。在接近43℃的最高温度下,它们并不令人感到不适。触摸板和掌托区域继续保持相对凉爽,这是一个优点。请注意,现实生活中的应用不太可能给设备带来那么大的压力,所以用户在工作中处理该设备或在腿上安全使用该设备时应该不会遇到问题。
(±) The maximum temperature on the upper side is 41 °C / 106 F, compared to the average of 34.3 °C / 94 F, ranging from 21.2 to 62.5 °C for the class Office.
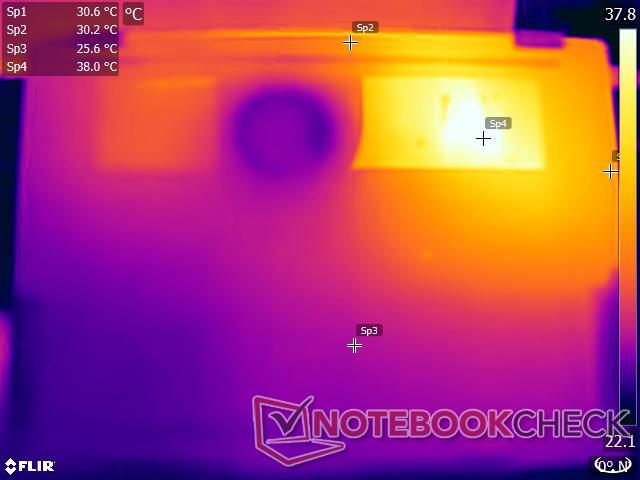
(±) The bottom heats up to a maximum of 43 °C / 109 F, compared to the average of 36.8 °C / 98 F
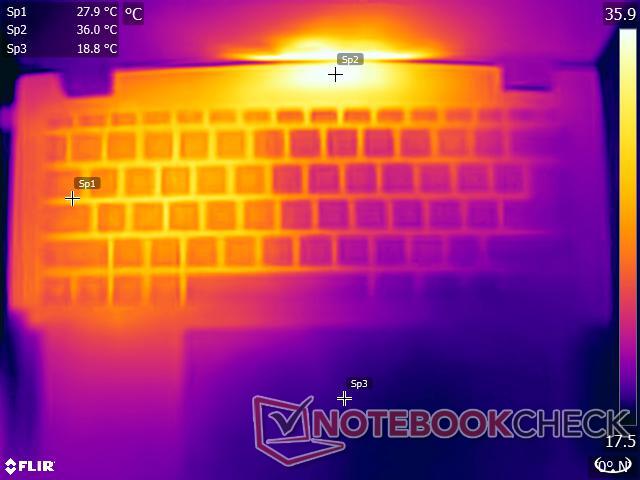
(+) In idle usage, the average temperature for the upper side is 26.82 °C / 80 F, compared to the device average of 29.5 °C / 85 F.
(±) Playing The Witcher 3, the average temperature for the upper side is 34.55 °C / 94 F, compared to the device average of 29.5 °C / 85 F.
(+) The palmrests and touchpad are reaching skin temperature as a maximum (32.4 °C / 90.3 F) and are therefore not hot.
(-) The average temperature of the palmrest area of similar devices was 27.5 °C / 81.5 F (-4.9 °C / -8.8 F).
压力测试
在Prime95压力下,CPU时钟上升到最高2.65GHz,并继续在这个频率上保持相对稳定,没有任何明显的节流迹象。在加入FurMark后,CPU的时钟在瞬间飙升到5.4GHz后降低到1.6GHz。GPU最初能够达到1,300 MHz的最大提升,但在整个测试的剩余时间里很快就稳定在1,000 MHz的水平。
我们看到,在《Witcher 3》的压力下,CPU有时能够提升得更高,这让GPU暂时失去了一些动力。虽然GPU试图以其最大的提升频率运行,但它并没有持续这样做,导致帧率的波动。
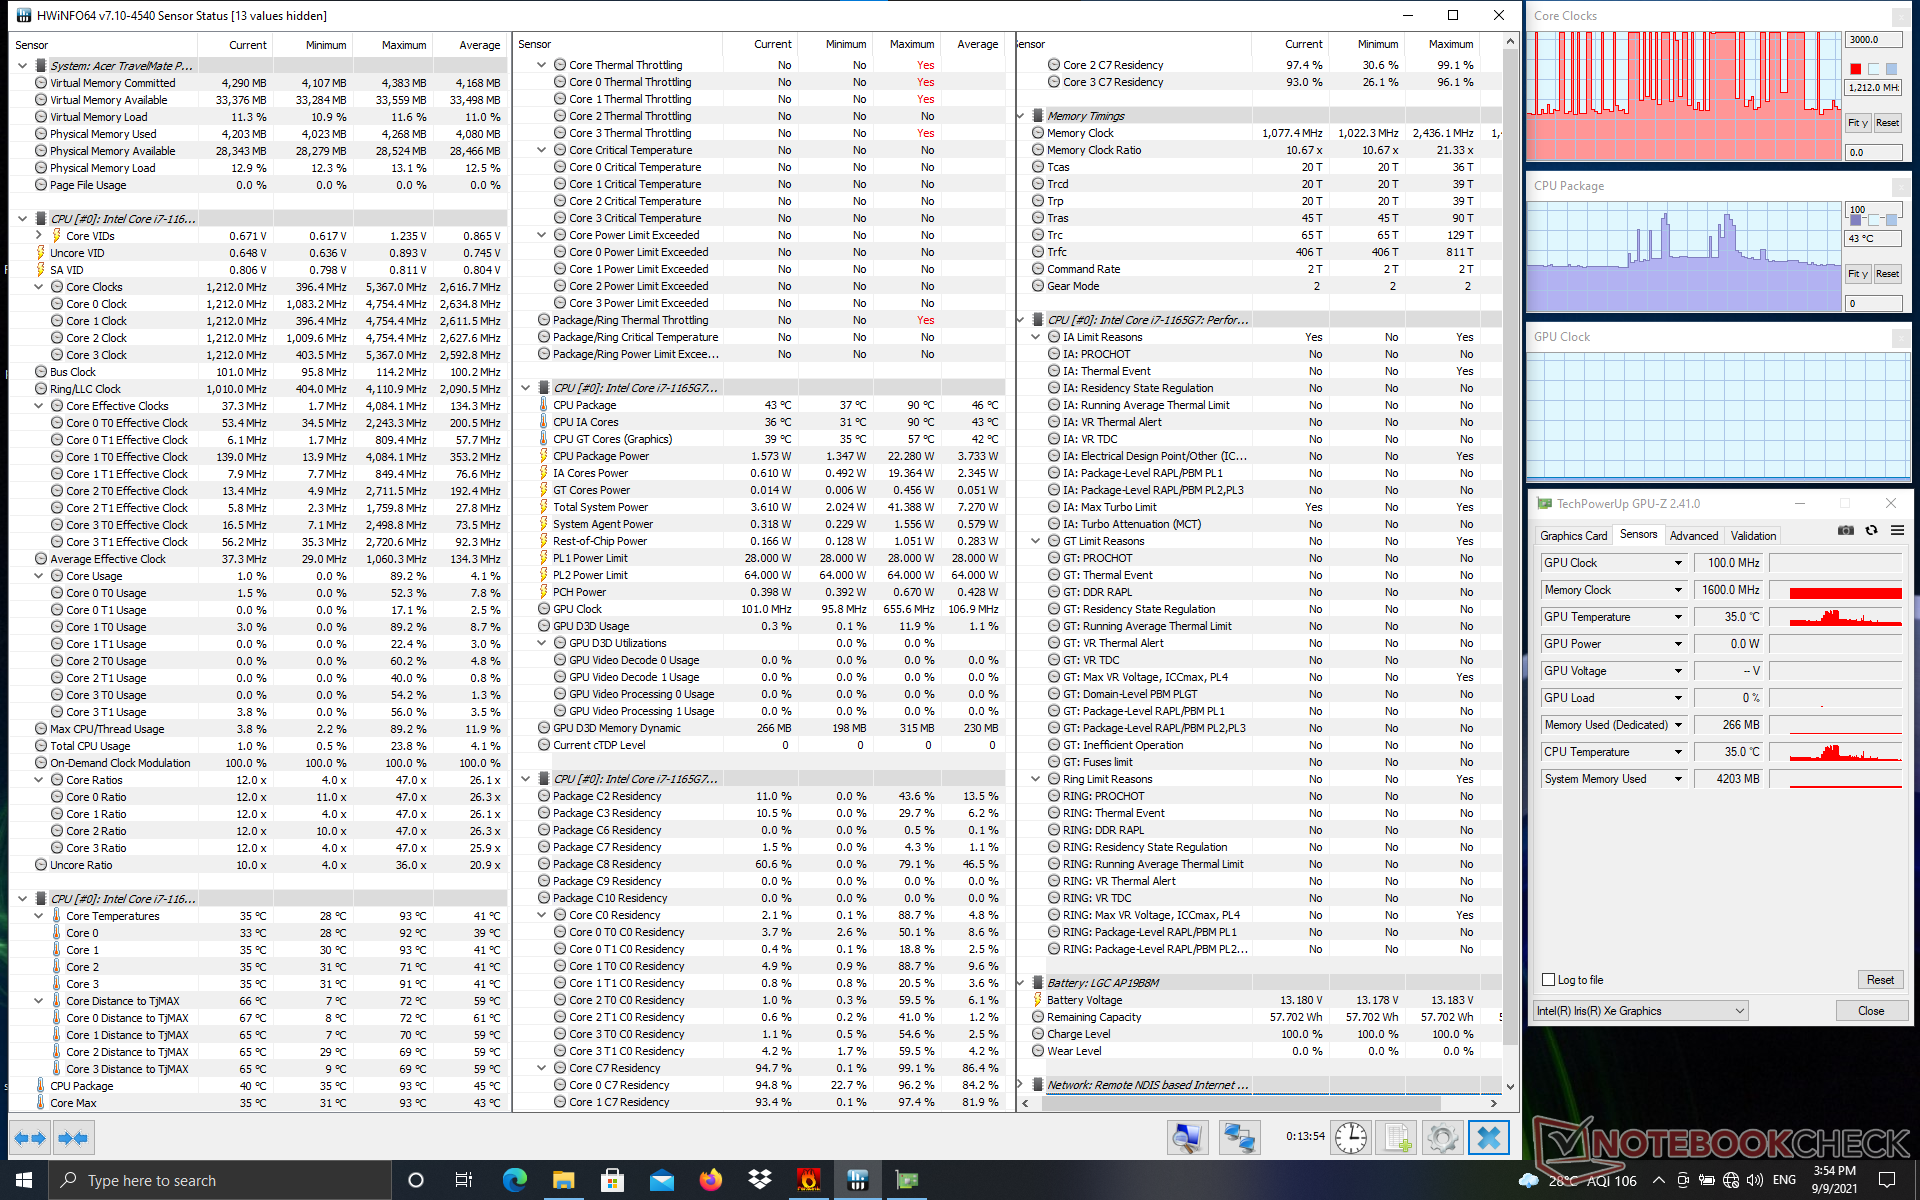
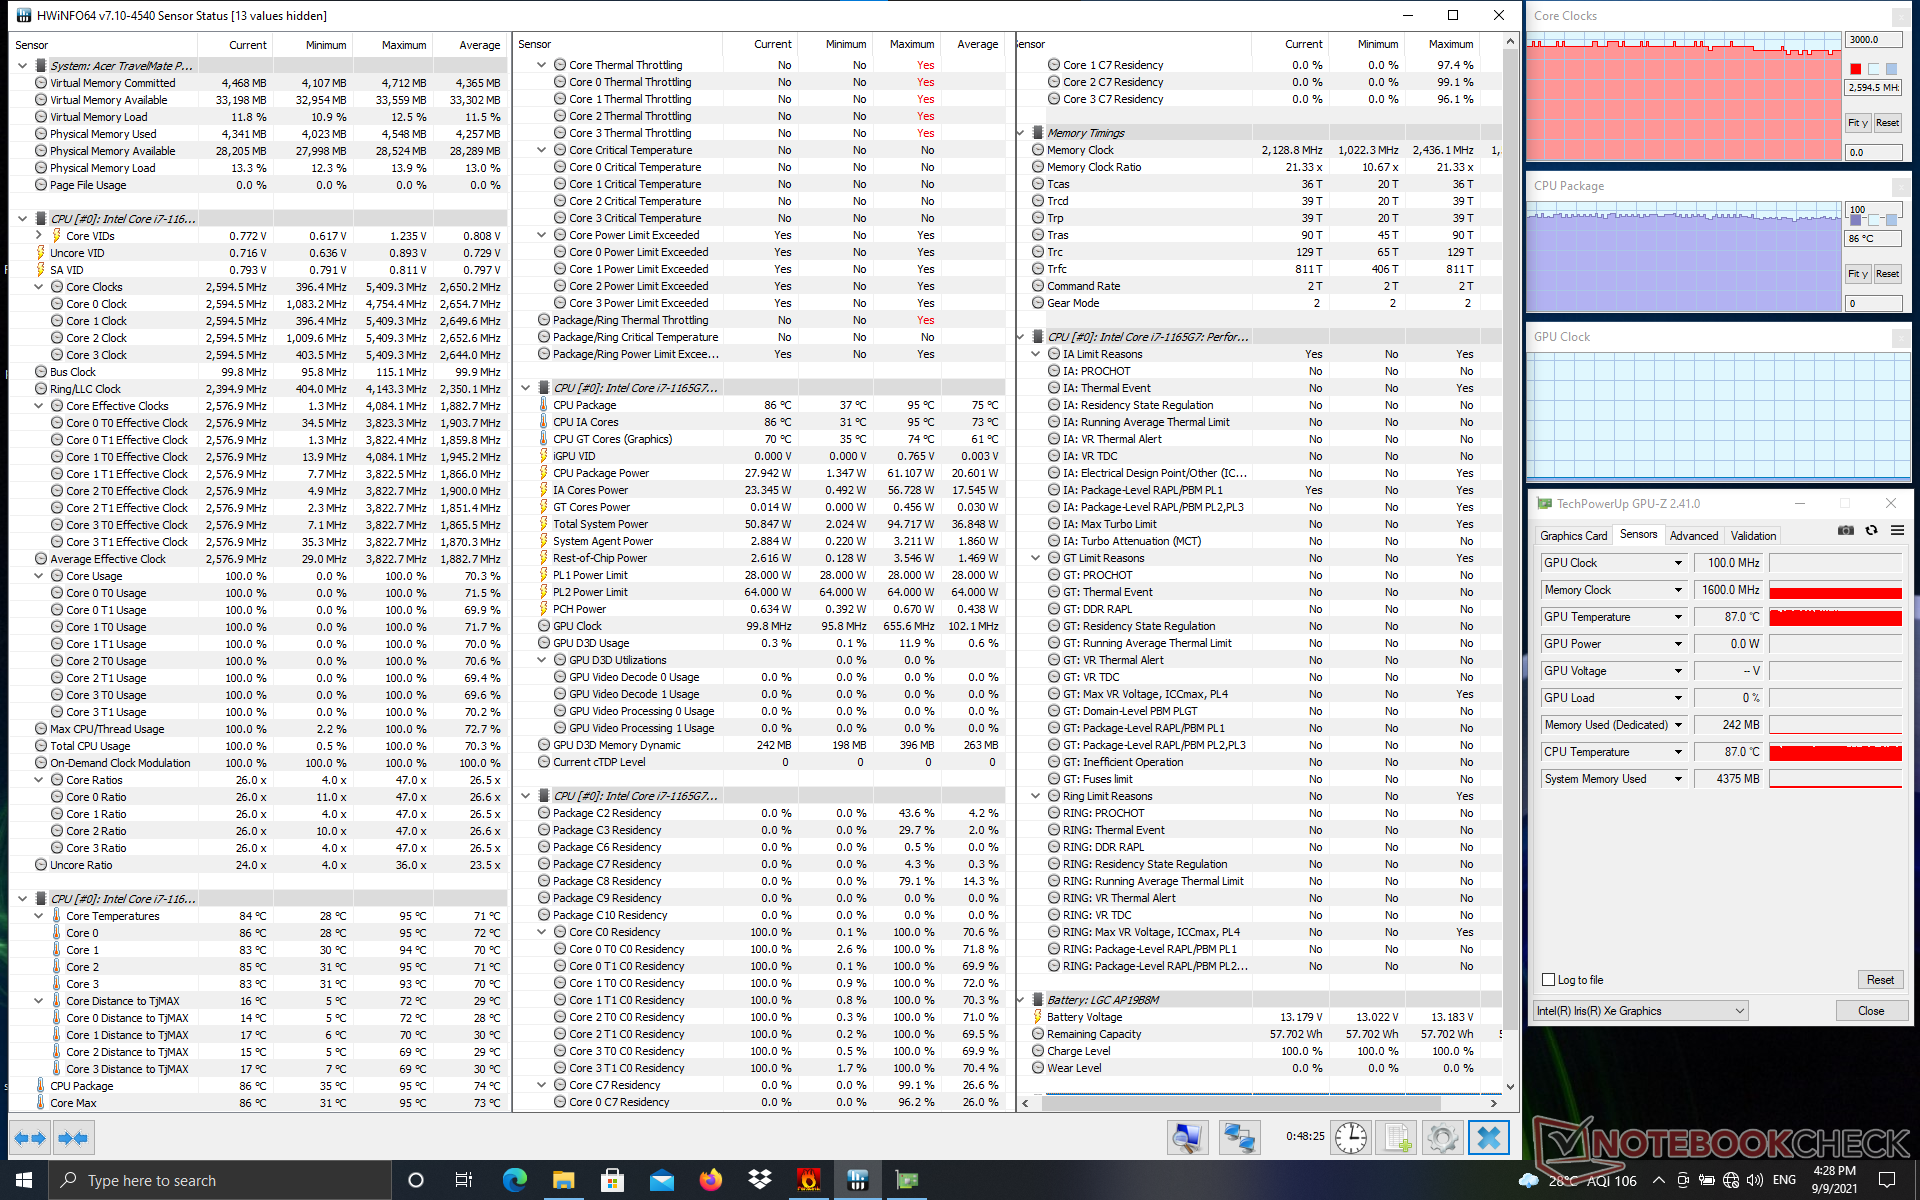
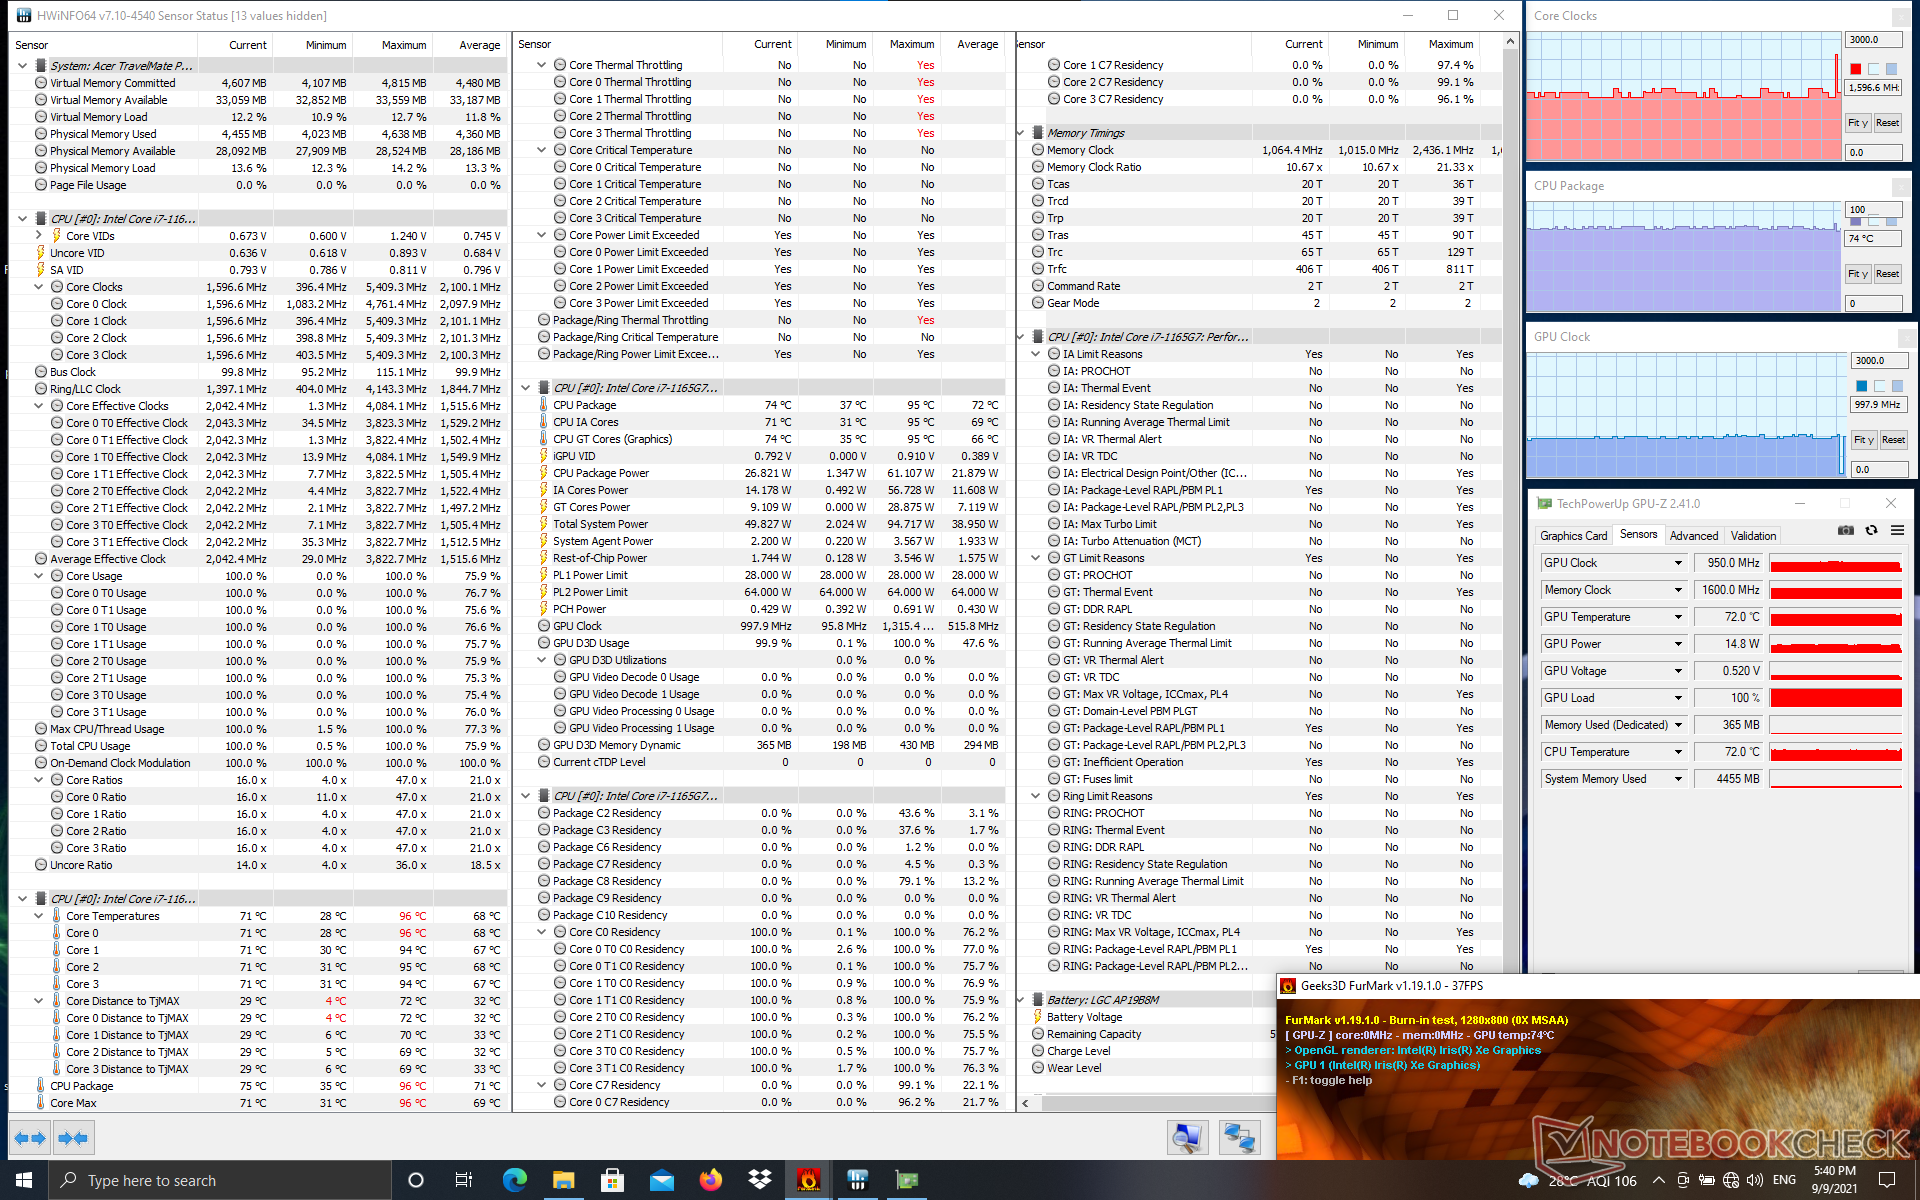
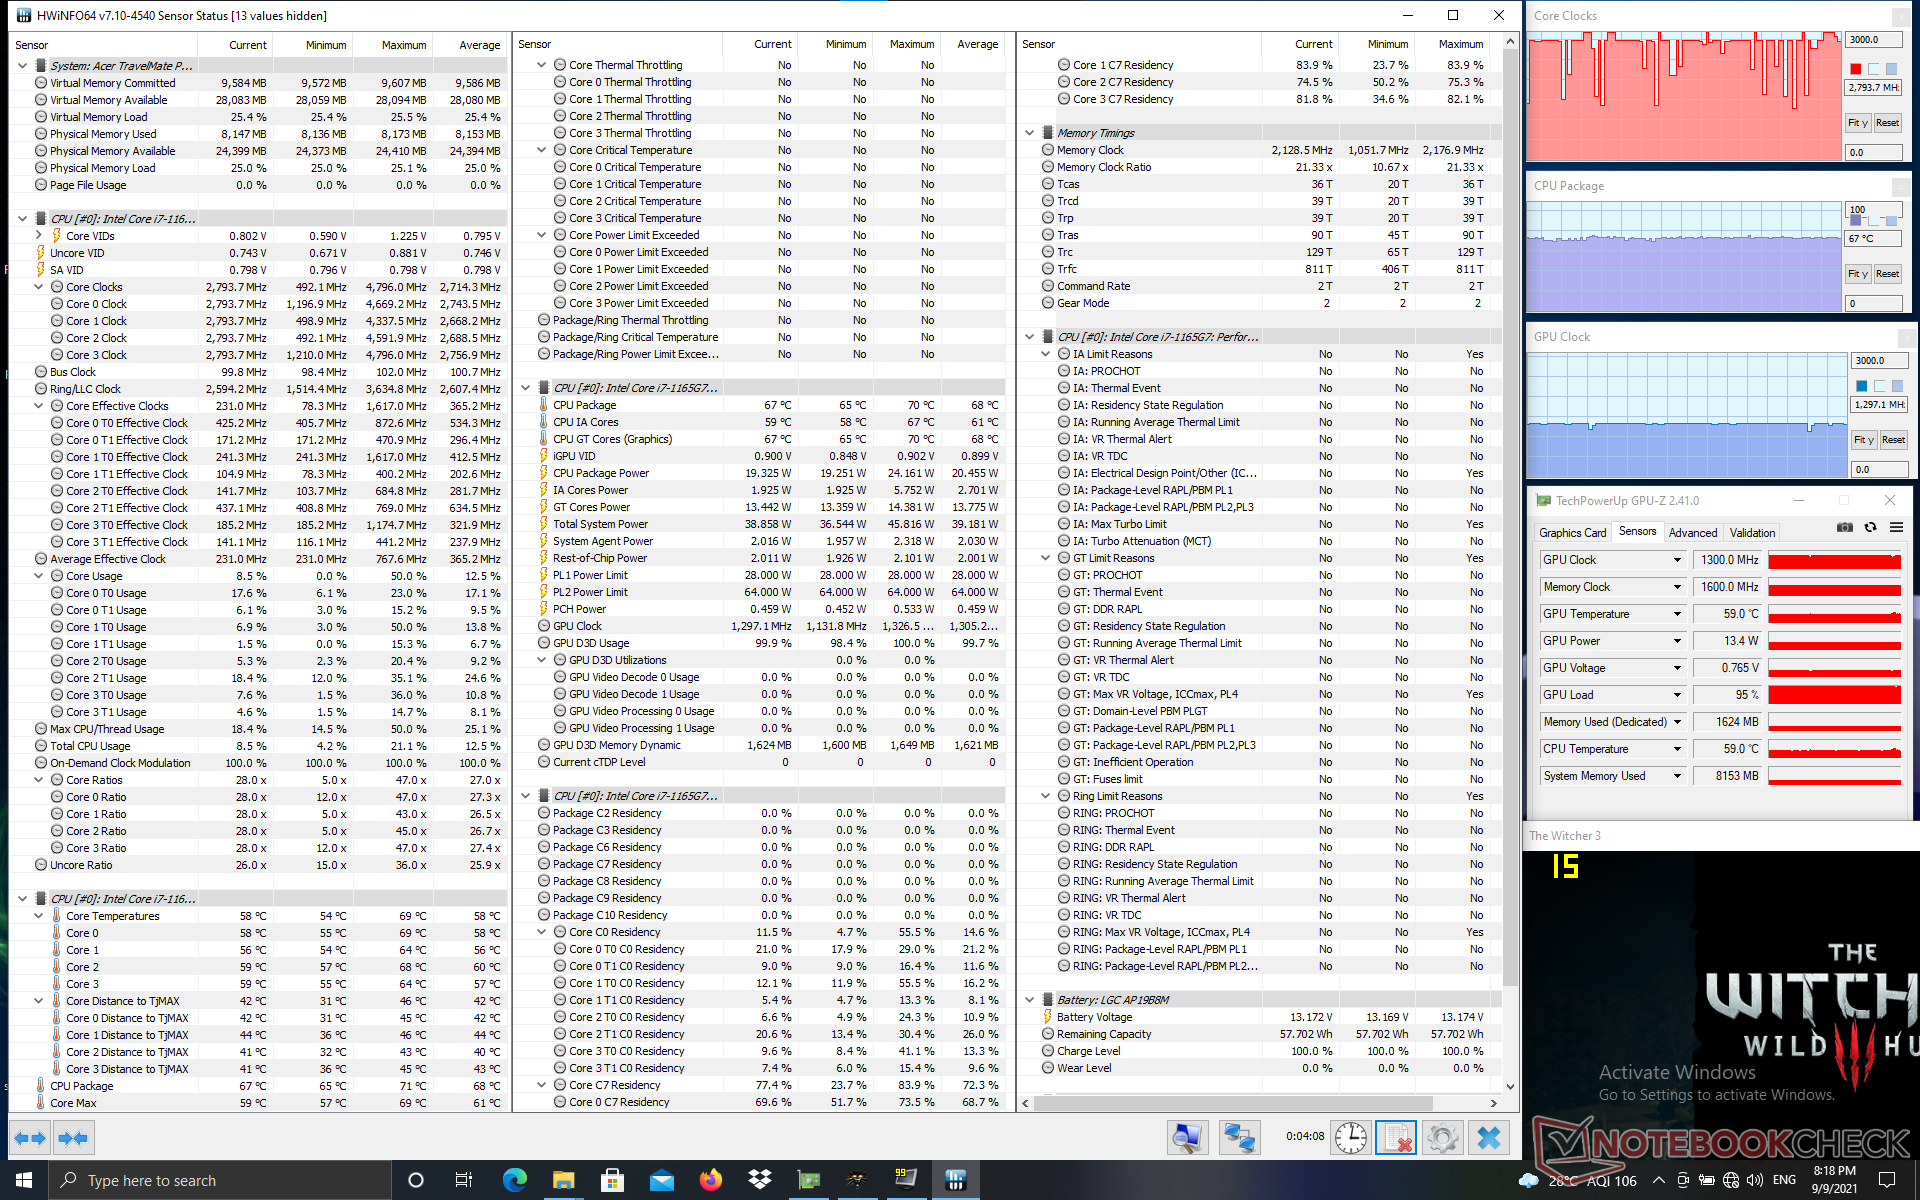
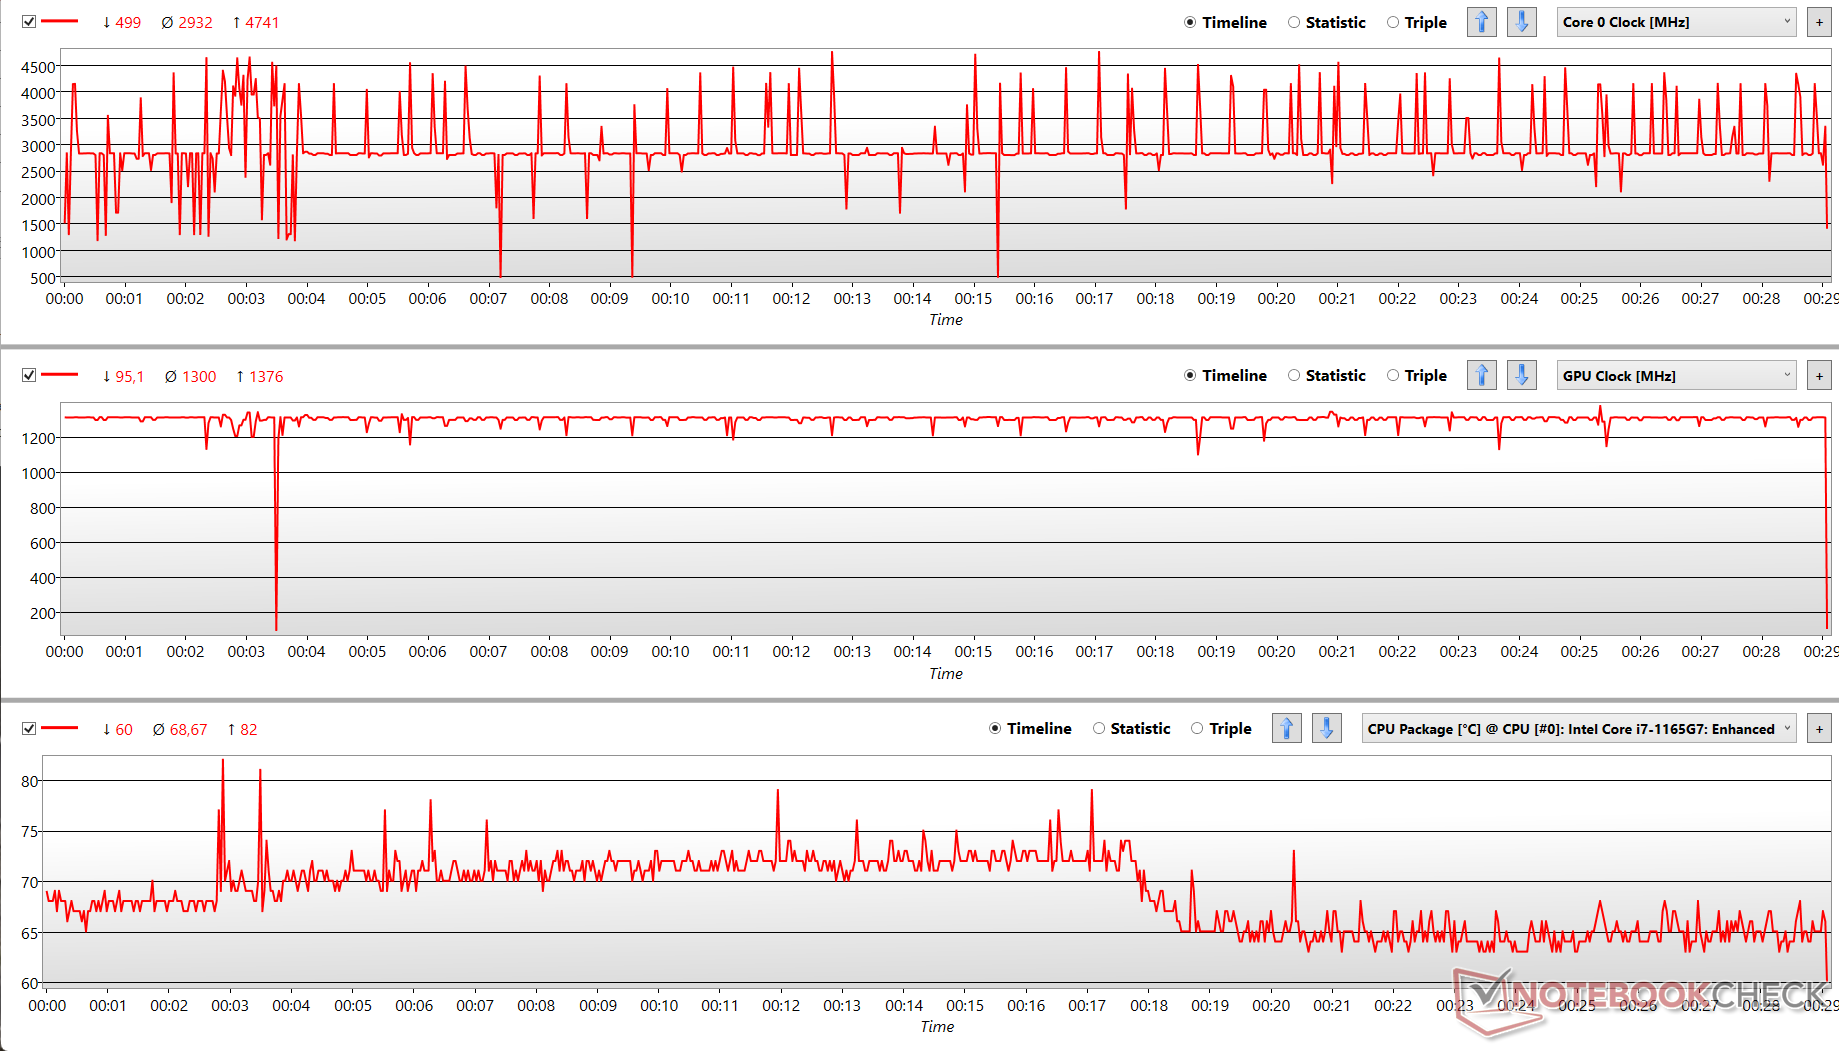
| 压力测试 | CPU时钟(GHz) | GPU时钟(MHz) | 平均封装温度(°C |
| 系统空闲 | 1.2 | 101 | 46 |
| Prime95 | 2.5 | 99.8 | 75 |
| Prime95 + FurMark | 1.6 | 997.9 | 72 |
| Witcher 3 | 2.8 | 1.3 | 68 |
发言人

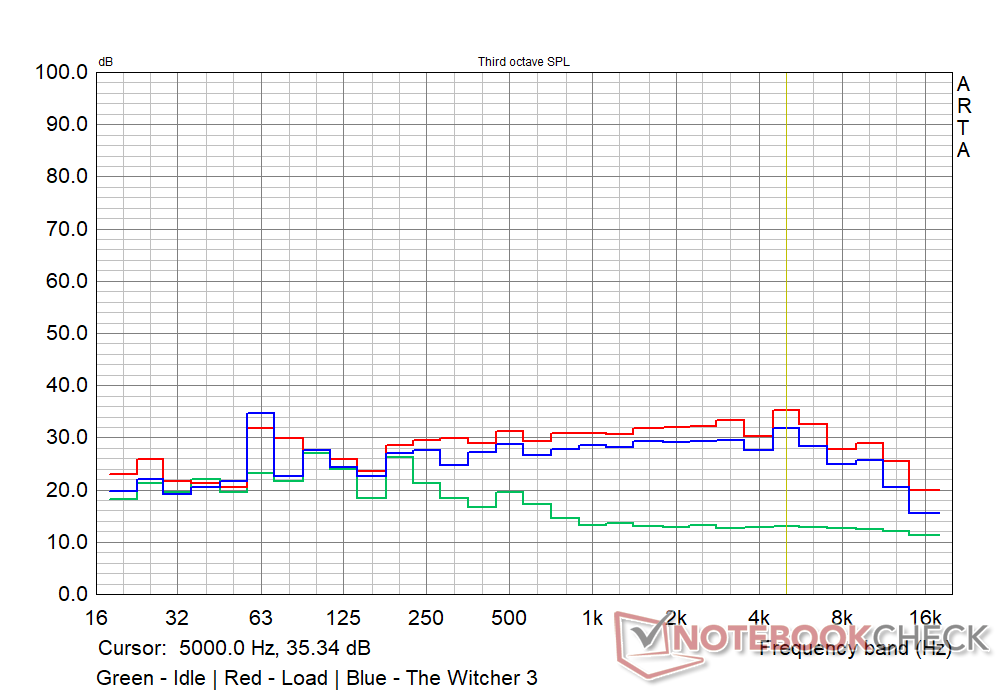
与上一代产品类似,2021年的TravelMate P6也提供了向上发射的扬声器,其格栅位于键盘甲板上方。宏碁这次似乎在响度方面有所改进,这可能是由于其所谓的智能放大器的作用。对于个人听觉和在离设备合理的距离上听觉来说,音量确实足够。低音肯定是缺乏的,尽管我们确实看到较高的中音和相对平衡的高音。
总的来说,这些扬声器对于涉及视频会议或偶尔观看YouTube视频的常规办公室工作来说,几乎没有问题。如果你想安装性能更好的耳机,有一个3.5毫米的组合音频插孔可用。虽然在我们的预生产样品中没有激活,但宏碁确实表示TravelMate P6可以使用DTS音频处理。
Acer TravelMate P614P-52 audio analysis
(±) | speaker loudness is average but good (73.5 dB)
Bass 100 - 315 Hz
(-) | nearly no bass - on average 21.4% lower than median
(±) | linearity of bass is average (8.1% delta to prev. frequency)
Mids 400 - 2000 Hz
(±) | higher mids - on average 7.4% higher than median
(±) | linearity of mids is average (12% delta to prev. frequency)
Highs 2 - 16 kHz
(+) | balanced highs - only 1.1% away from median
(+) | highs are linear (3.7% delta to prev. frequency)
Overall 100 - 16.000 Hz
(±) | linearity of overall sound is average (24% difference to median)
Compared to same class
» 69% of all tested devices in this class were better, 9% similar, 22% worse
» The best had a delta of 7%, average was 21%, worst was 53%
Compared to all devices tested
» 72% of all tested devices were better, 6% similar, 22% worse
» The best had a delta of 4%, average was 24%, worst was 134%
Apple MacBook 12 (Early 2016) 1.1 GHz audio analysis
(+) | speakers can play relatively loud (83.6 dB)
Bass 100 - 315 Hz
(±) | reduced bass - on average 11.3% lower than median
(±) | linearity of bass is average (14.2% delta to prev. frequency)
Mids 400 - 2000 Hz
(+) | balanced mids - only 2.4% away from median
(+) | mids are linear (5.5% delta to prev. frequency)
Highs 2 - 16 kHz
(+) | balanced highs - only 2% away from median
(+) | highs are linear (4.5% delta to prev. frequency)
Overall 100 - 16.000 Hz
(+) | overall sound is linear (10.2% difference to median)
Compared to same class
» 7% of all tested devices in this class were better, 2% similar, 91% worse
» The best had a delta of 5%, average was 18%, worst was 53%
Compared to all devices tested
» 5% of all tested devices were better, 1% similar, 94% worse
» The best had a delta of 4%, average was 24%, worst was 134%
Energy Management: Not the most economical in its class
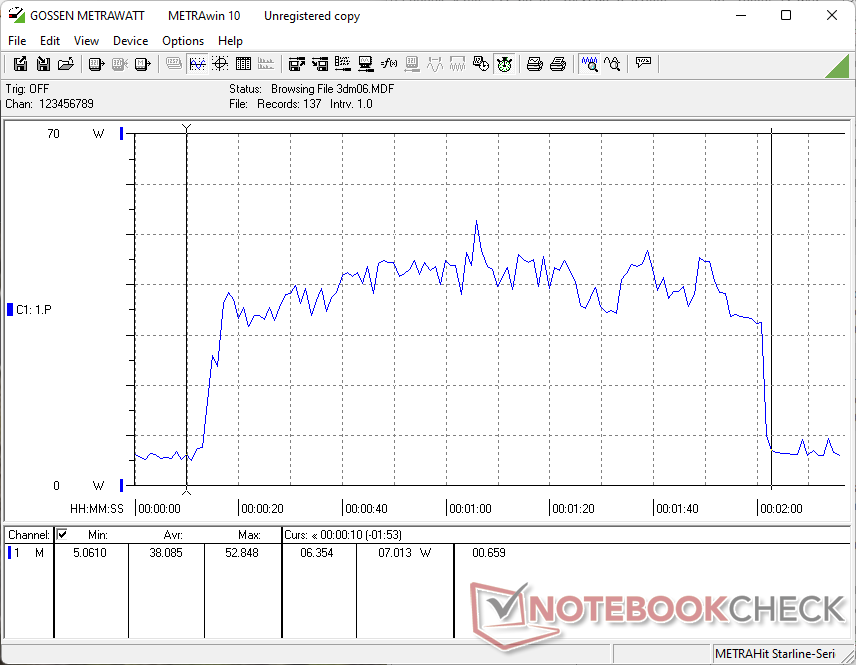
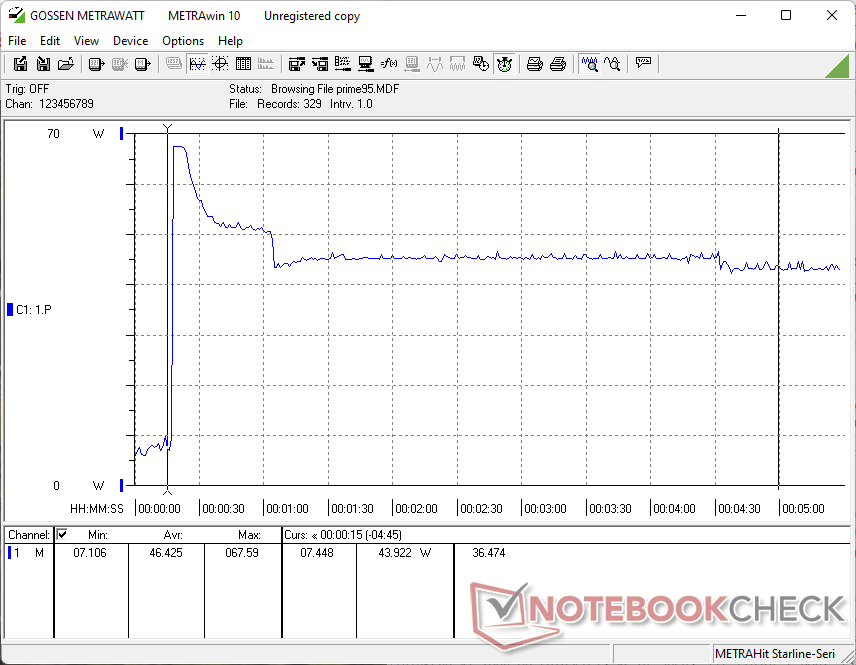
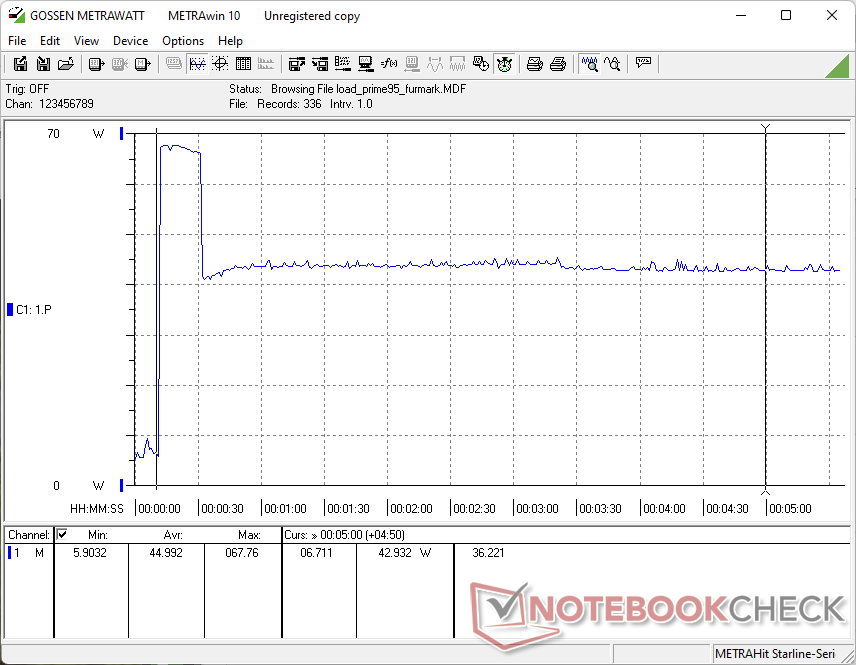
消耗功率
空闲时的功耗平均约为8W。在Prime95+FurMark负载压力测试中,功耗峰值约为67W,最终稳定在平均43W。
我们注意到在整个 Witcher 3,这与之前观察到的CPU和GPU时钟波动有关。宏碁在盒子里提供了一个65瓦的USB-C电源适配器,即使在压力条件下也能为设备提供足够的电力。
| Off / Standby | |
| Idle | |
| Load |
|
Key:
min: | |
| Acer TravelMate P614P-52 i7-1165G7, Iris Xe G7 96EUs, WDC PC SN730 SDBQNTY-1T00, IPS, 1920x1200, 14" | Lenovo ThinkPad T14s G2 20WM003TGE i7-1165G7, Iris Xe G7 96EUs, Samsung PM981a MZVLB1T0HBLR, IPS LED, 1920x1080, 14" | HP EliteBook 830 G8-i7-1165G7 i7-1165G7, Iris Xe G7 96EUs, Samsung PM981a MZVLB1T0HBLR, IPS, 1920x1080, 13.3" | Framework Laptop 13.5 i7-1165G7, Iris Xe G7 96EUs, Western Digital WD_BLACK SN850 WDS100T1X0E, IPS, 2256x1504, 13.5" | Dell Latitude 9420 2-in-1 i7-1185G7, Iris Xe G7 96EUs, WDC PC SN530 SDBPNPZ-512G, IPS, 2560x1600, 14" | Razer Book 13 FHD i7-1165G7, Iris Xe G7 96EUs, Samsung SSD PM981a MZVLB256HBHQ, IPS, 1920x1200, 13.4" | |
|---|---|---|---|---|---|---|
| Power Consumption | 16% | 10% | -1% | -9% | 17% | |
| Idle Minimum * (Watt) | 6.99 | 2.2 69% | 6.5 7% | 4.3 38% | 4.6 34% | 3.3 53% |
| Idle Average * (Watt) | 8.32 | 5.5 34% | 8.4 -1% | 8.2 1% | 7.8 6% | 6.4 23% |
| Idle Maximum * (Watt) | 12.18 | 6.1 50% | 10.3 15% | 8.7 29% | 8.2 33% | 7 43% |
| Load Average * (Watt) | 38.08 | 41.3 -8% | 34.6 9% | 43.5 -14% | 47.9 -26% | 37.3 2% |
| Witcher 3 ultra * (Watt) | 35.7 | 34.5 3% | 34.4 4% | 43.5 -22% | 38.8 -9% | 36.4 -2% |
| Load Maximum * (Watt) | 44.99 | 67.3 -50% | 33 27% | 61.8 -37% | 87.1 -94% | 53.7 -19% |
* ... smaller is better
Power Consumption Witcher 3 / Stresstest
电池寿命
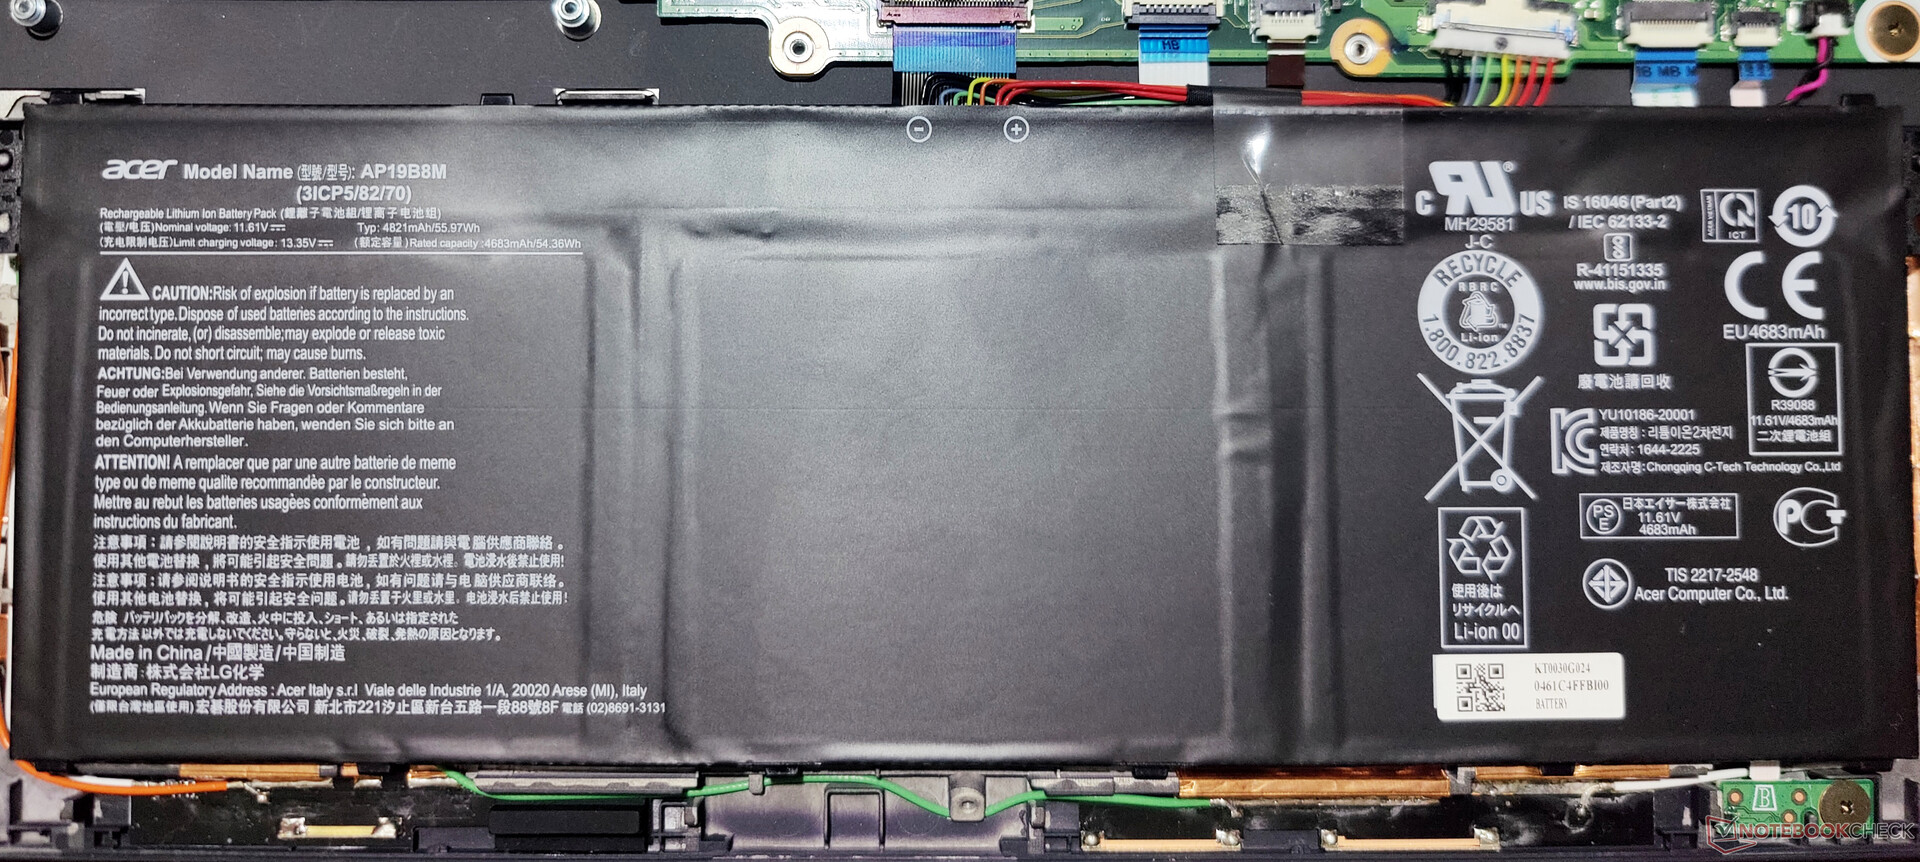
TravelMate P6的56瓦特电池提供了一个体面的电池寿命,可以让你度过一个典型的工作日而没有什么问题。然而,我们发现与去年采用60Wh电池的机型相比,运行时间有了明显的减少。
在我们的标准网上冲浪测试中,我们记录了接近9小时的电池寿命,在150cd/m2的亮度下,视频播放了近12小时。有趣的是,我们注意到 Razer Book 13与TravelMate P6有类似的配置和电池容量,可以提供比TravelMate P6高66%的运行时间。
将电池从零充电到100%需要近两个小时。我们还观察到,尽管指示灯和Windows显示电池已经充满电,但我们的功率计的耗电量更高。这可能是该设备的一个孤立问题,但我们还是建议尽可能延长充电时间。
| Acer TravelMate P614P-52 i7-1165G7, Iris Xe G7 96EUs, 56 Wh | Lenovo ThinkPad T14s G2 20WM003TGE i7-1165G7, Iris Xe G7 96EUs, 57 Wh | Dell Latitude 9420 2-in-1 i7-1185G7, Iris Xe G7 96EUs, 60 Wh | Asus ExpertBook B9 B9400CE-KC0166R i7-1165G7, Iris Xe G7 96EUs, 66 Wh | Razer Book 13 FHD i7-1165G7, Iris Xe G7 96EUs, 55 Wh | HP EliteBook 830 G8-i7-1165G7 i7-1165G7, Iris Xe G7 96EUs, 53 Wh | |
|---|---|---|---|---|---|---|
| Battery runtime | 9% | 51% | 89% | 68% | 14% | |
| Reader / Idle (h) | 21 | 28.7 37% | 36.8 75% | |||
| WiFi v1.3 (h) | 8.9 | 9.7 9% | 11.7 31% | 12.4 39% | 14.8 66% | 8 -10% |
| Witcher 3 ultra (h) | 2 | |||||
| Load (h) | 1.3 | 1.4 8% | 2.4 85% | 3.1 138% | 2.1 62% | 1.8 38% |
Pros
Cons
评语。有能力的商务全能选手,但有一些怪癖
宏碁将其TravelMate P6系列与时俱进,在内部和外部都进行了升级。该设备的结构非常好,日常使用的人机工程学也很好。虽然现在只有TravelMate Spin P6系列有触摸屏选项,但显示屏在色彩还原和16:10的长宽比方面得到了很大的改善。
端口选择和通信选项都很好,5G USIM和PrivacyPanel的选项将受到企业的欢迎。TravelMate P6的引擎盖下有足够的动力来满足大多数移动商业应用,有时甚至可以与酷睿i7-1185G7-动力 戴尔Latitude 9420 2合1.尽管 睿禅7 5700U-基于 联想ThinkPad E15 G3提供了一些严重的多任务处理能力,但TravelMate P6也不是完全的懒惰。表面温度是可控的,在极端负载下,风扇噪音也在可容忍的范围内。
有了宏碁TravelMate P6,企业就可以得到一个轻便、高效、安全的设备,可以满足新常态的要求。TravelMate P6得到了必要的升级,可以在不牺牲基本条件的情况下与2021年的其他著名商务笔记本电脑竞争。它不会打破任何性能记录,但整体包装绝对是有希望的。
话虽如此,TravelMate P6也不是没有一些怪癖。虽然英特尔Evo平台确实确保了一些标准化,但它也限制了TravelMate P6的服务能力。由于这是一个预生产模型,一些与安全有关的功能无法得到充分评估。这意味着我们不得不在大多数情况下依靠库存驱动和Windows Update。
另外,宏碁应该考虑一个更好的网络摄像头、更快的Wi-Fi和更快的存储卡阅读器。电池寿命虽然不差,但鉴于竞争对手能够在类似的电池容量下实现相当大的运行时间提升,因此可以做得更好。在功耗或电池寿命方面,TravelMate P6也不是最经济的设备。笔记本 联想ThinkPad T14s G2, Razer Book 13,以及 HP EliteBook 830 G8在这方面的表现都要好得多。
总的来说,宏碁在今年的TravelMate P6上已经做对了很多事情,尽管仍有很大的改进空间。希望我们在评测过程中观察到的一些棘手的问题,在零售单位开始广泛供应后,将通过官方驱动程序得到解决。
价格和可用性
宏碁TravelMate P6尚未在世界各地的零售店出售,因此我们的配置的价格信息还没有出来。然而,根据宏碁5月份的发布会信息,TravelMate P6系列应于12月在北美上市,起价1299.99美元,9月在欧洲、中东和非洲上市,起价999欧元,8月在中国上市,起价6999人民币。
Price comparison

