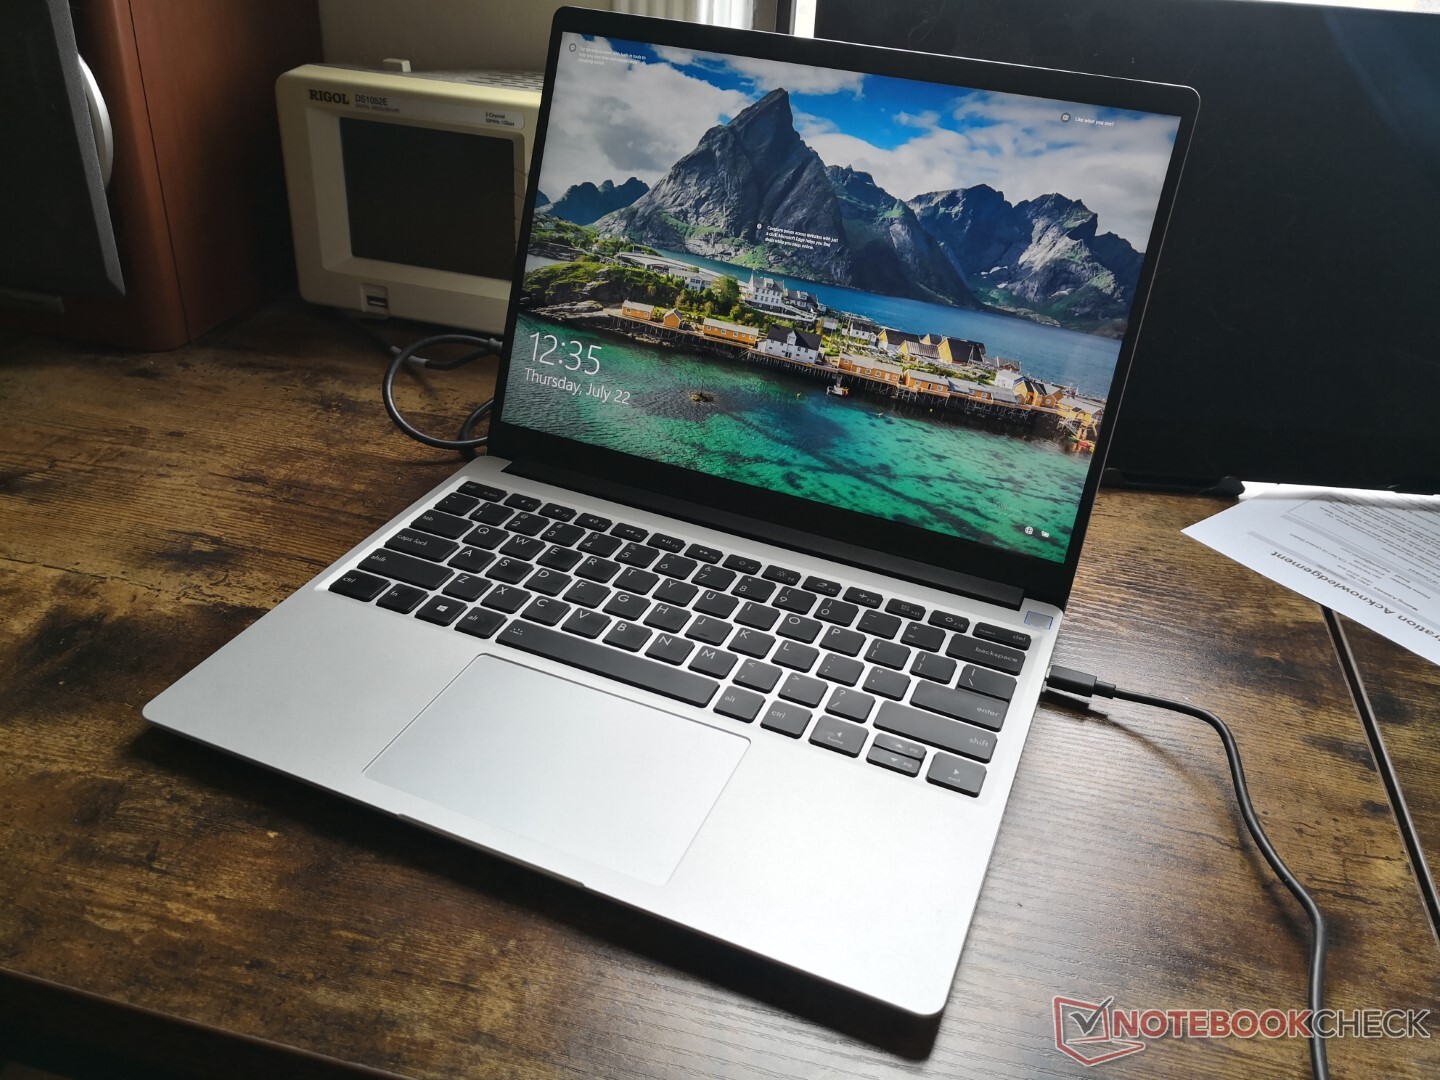
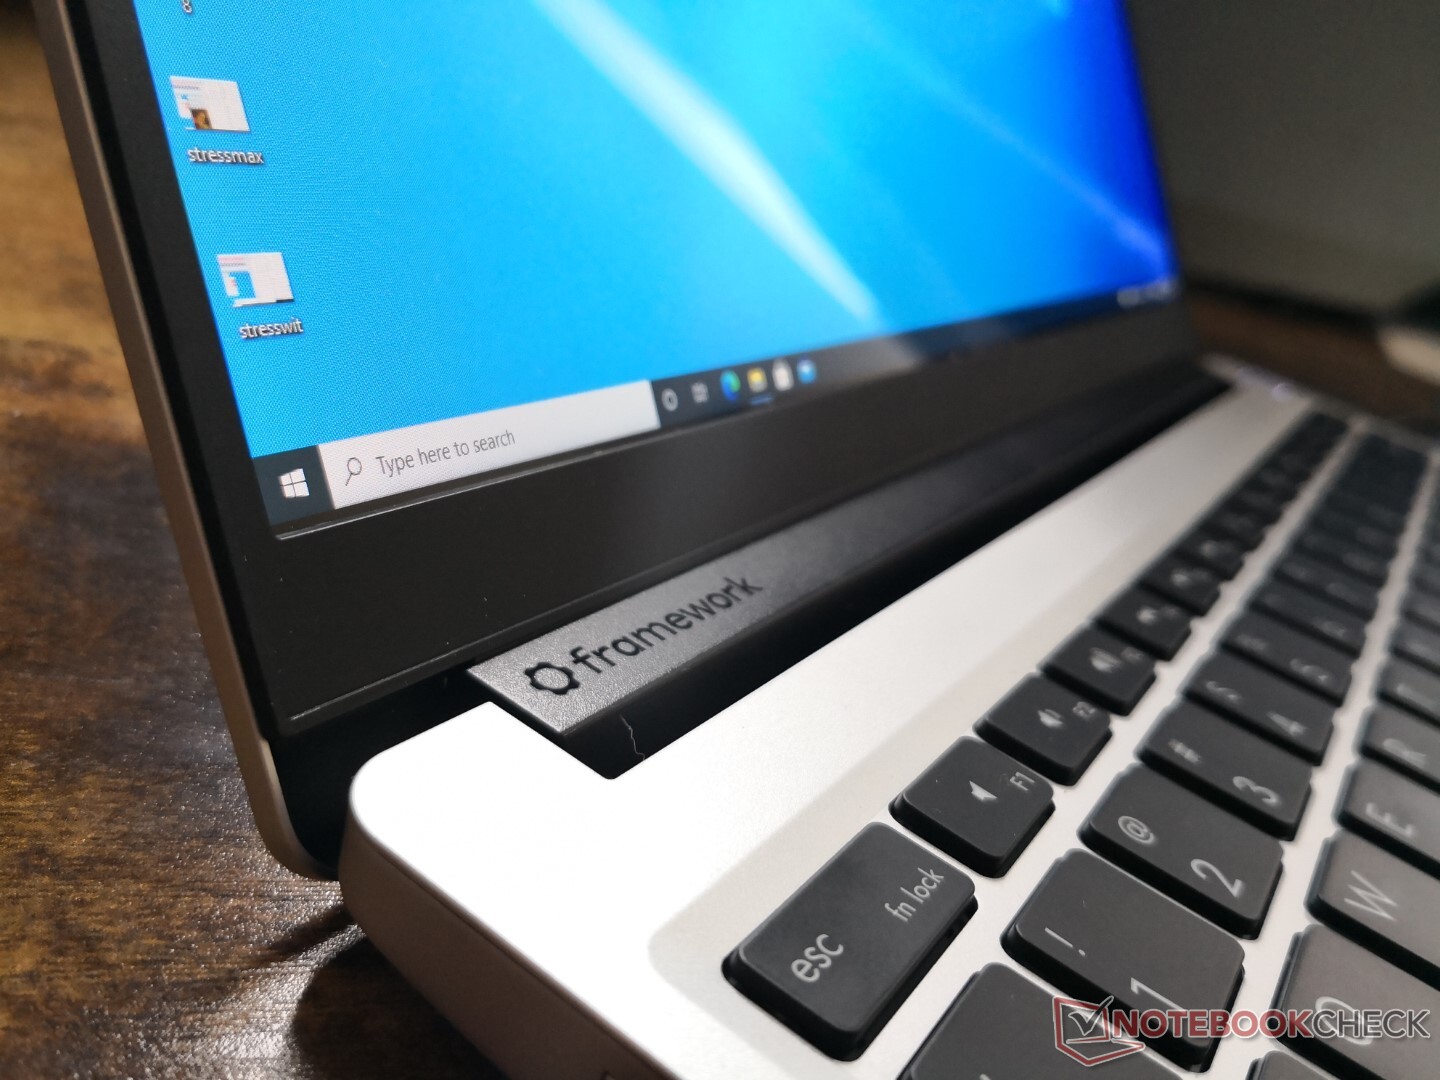
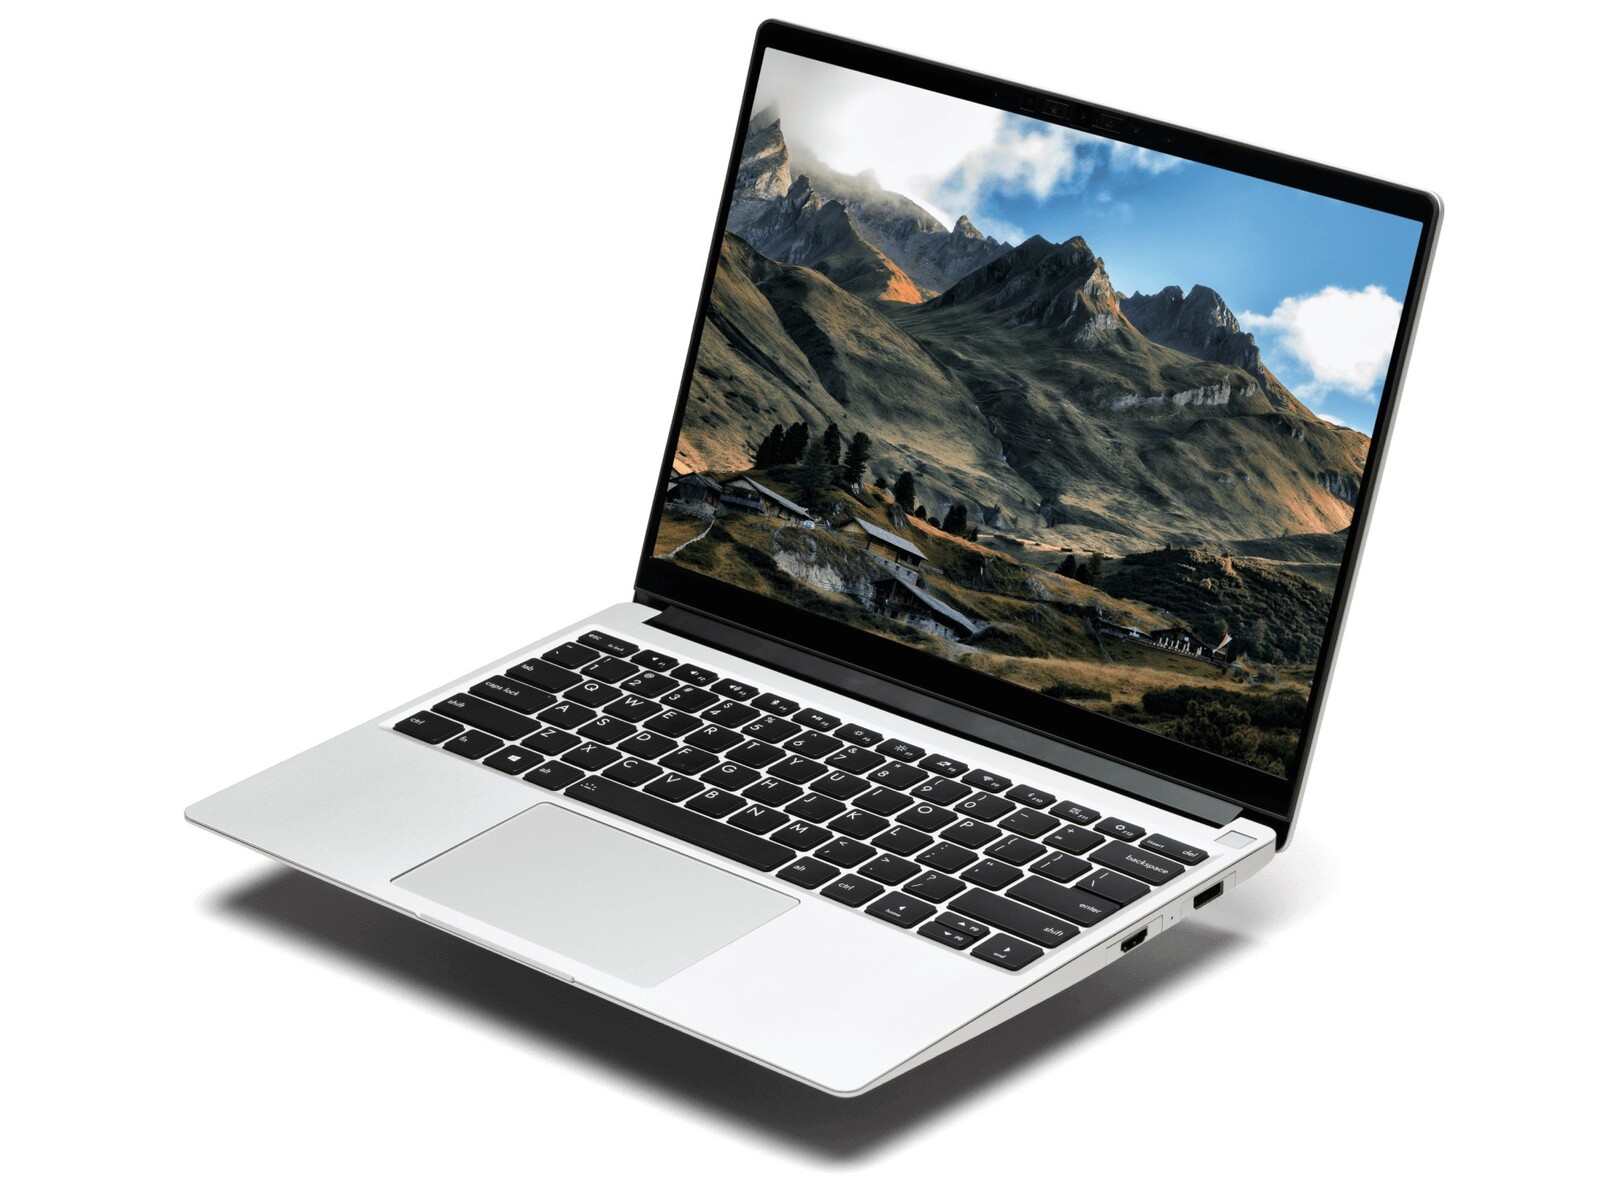
框架笔记本电脑13.5评论。如果微软生产可维修的Surface笔记本电脑,这将是它。
笔记本电脑永远不会像台式机那样可以升级或维修,但这并不意味着他们不应该尝试。Framework公司的一个小型开发者团队已经设计了他们自己的超薄笔记本电脑,以尽可能地实现最终用户的可维修性。关于他们项目和目标的更多细节,可以在他们的网站。.
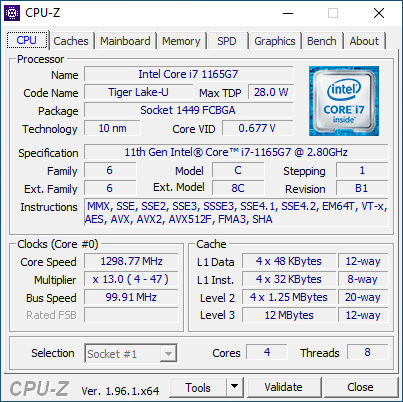
13.5英寸的Framework笔记本电脑是一个3:2外形的系统,与以下产品一脉相承 惠普Spectre x360 14或微软Surface Laptop 3。它运行在相同的第11代英特尔Tiger Lake-U平台上,该平台为更成熟的OEM厂商的大多数最新超极本提供动力。Tiger Lake ,这也是Framework Laptop的许多可定制功能的关键。本评论将探讨酷睿i7框架配置的性能,看看它与惠普、联想、微软和其他公司的大炮相比如何。
potential competitors in comparison
Rating | Date | Model | Weight | Height | Size | Resolution | Price |
|---|---|---|---|---|---|---|---|
| 85.4 % v7 (old) | 08 / 2021 | Framework Laptop 13.5 i7-1165G7, Iris Xe G7 96EUs | 1.3 kg | 15.85 mm | 13.50" | 2256x1504 | |
| 89.5 % v7 (old) | HP Spectre x360 14-ea0378ng i7-1165G7, Iris Xe G7 96EUs | 1.3 kg | 16.9 mm | 13.50" | 3000x2000 | ||
| 84.7 % v7 (old) | 05 / 2021 | Microsoft Surface Laptop 4 13 i7 i7-1185G7, Iris Xe G7 96EUs | 1.3 kg | 14.5 mm | 13.50" | 2256x1504 | |
| 87.3 % v7 (old) | 05 / 2021 | Lenovo ThinkPad X1 Titanium Yoga G1 20QA001RGE i7-1160G7, Iris Xe G7 96EUs | 1.2 kg | 11.5 mm | 13.50" | 2256x1504 | |
| 85.7 % v7 (old) | 08 / 2021 | HP ProBook x360 435 G8 R7-5800U R7 5800U, Vega 8 | 1.5 kg | 18 mm | 13.30" | 1920x1080 | |
| 84.7 % v7 (old) | 08 / 2021 | Lenovo Yoga 6 13 82ND0009US R5 5500U, Vega 7 | 1.3 kg | 18.2 mm | 13.30" | 1920x1080 |
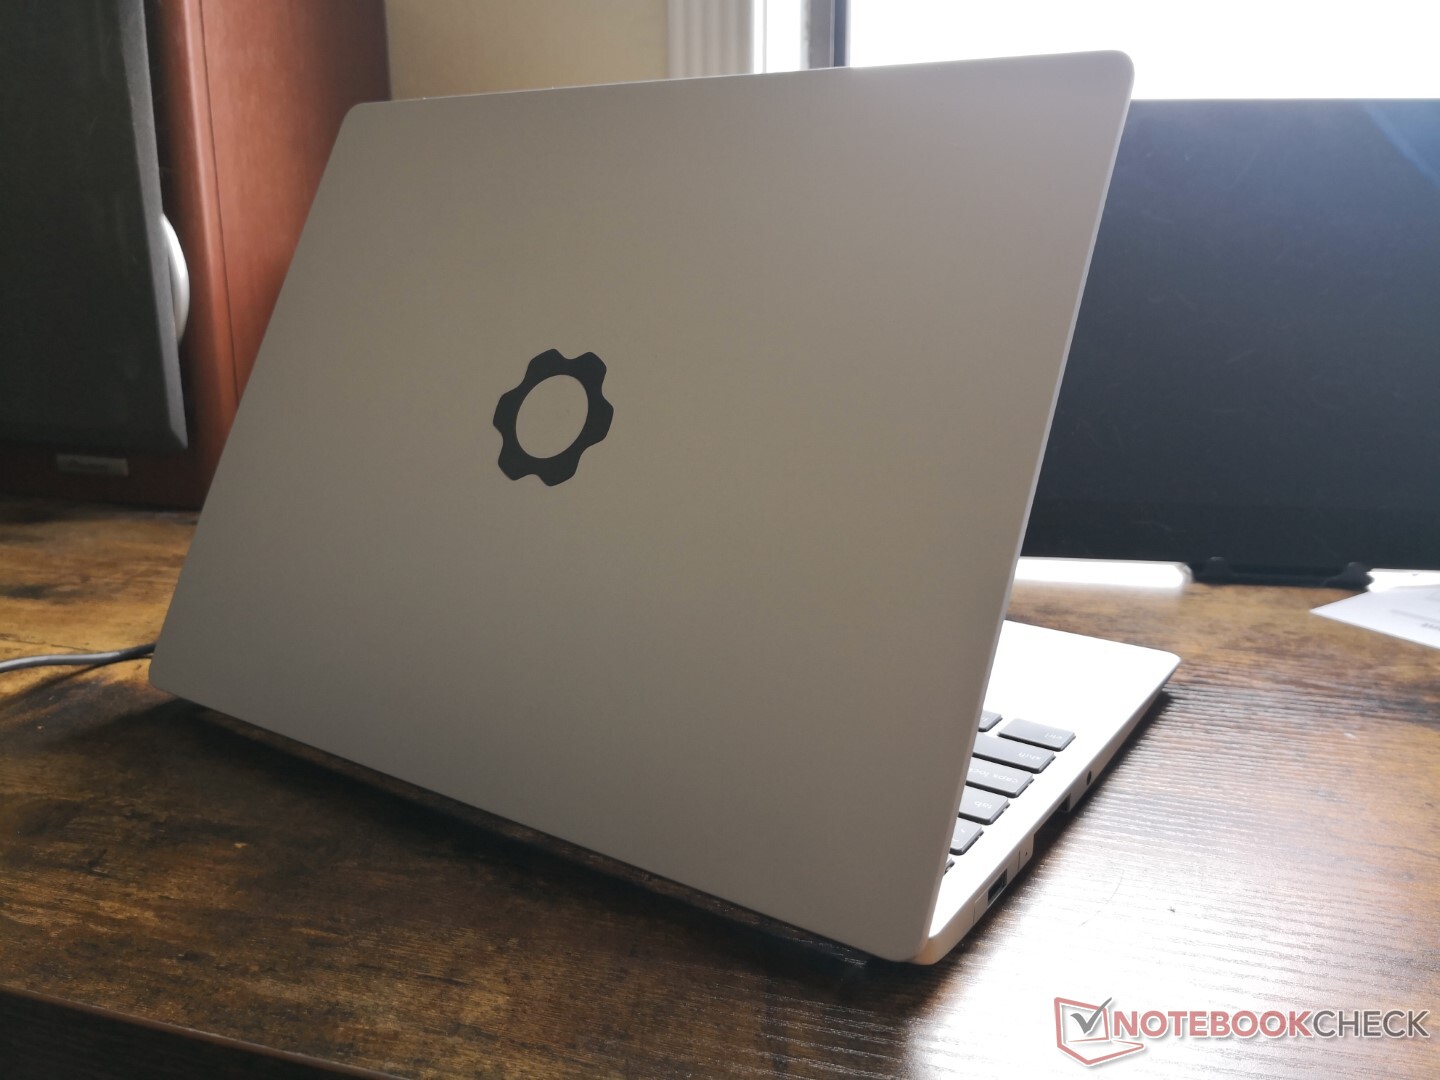
案例
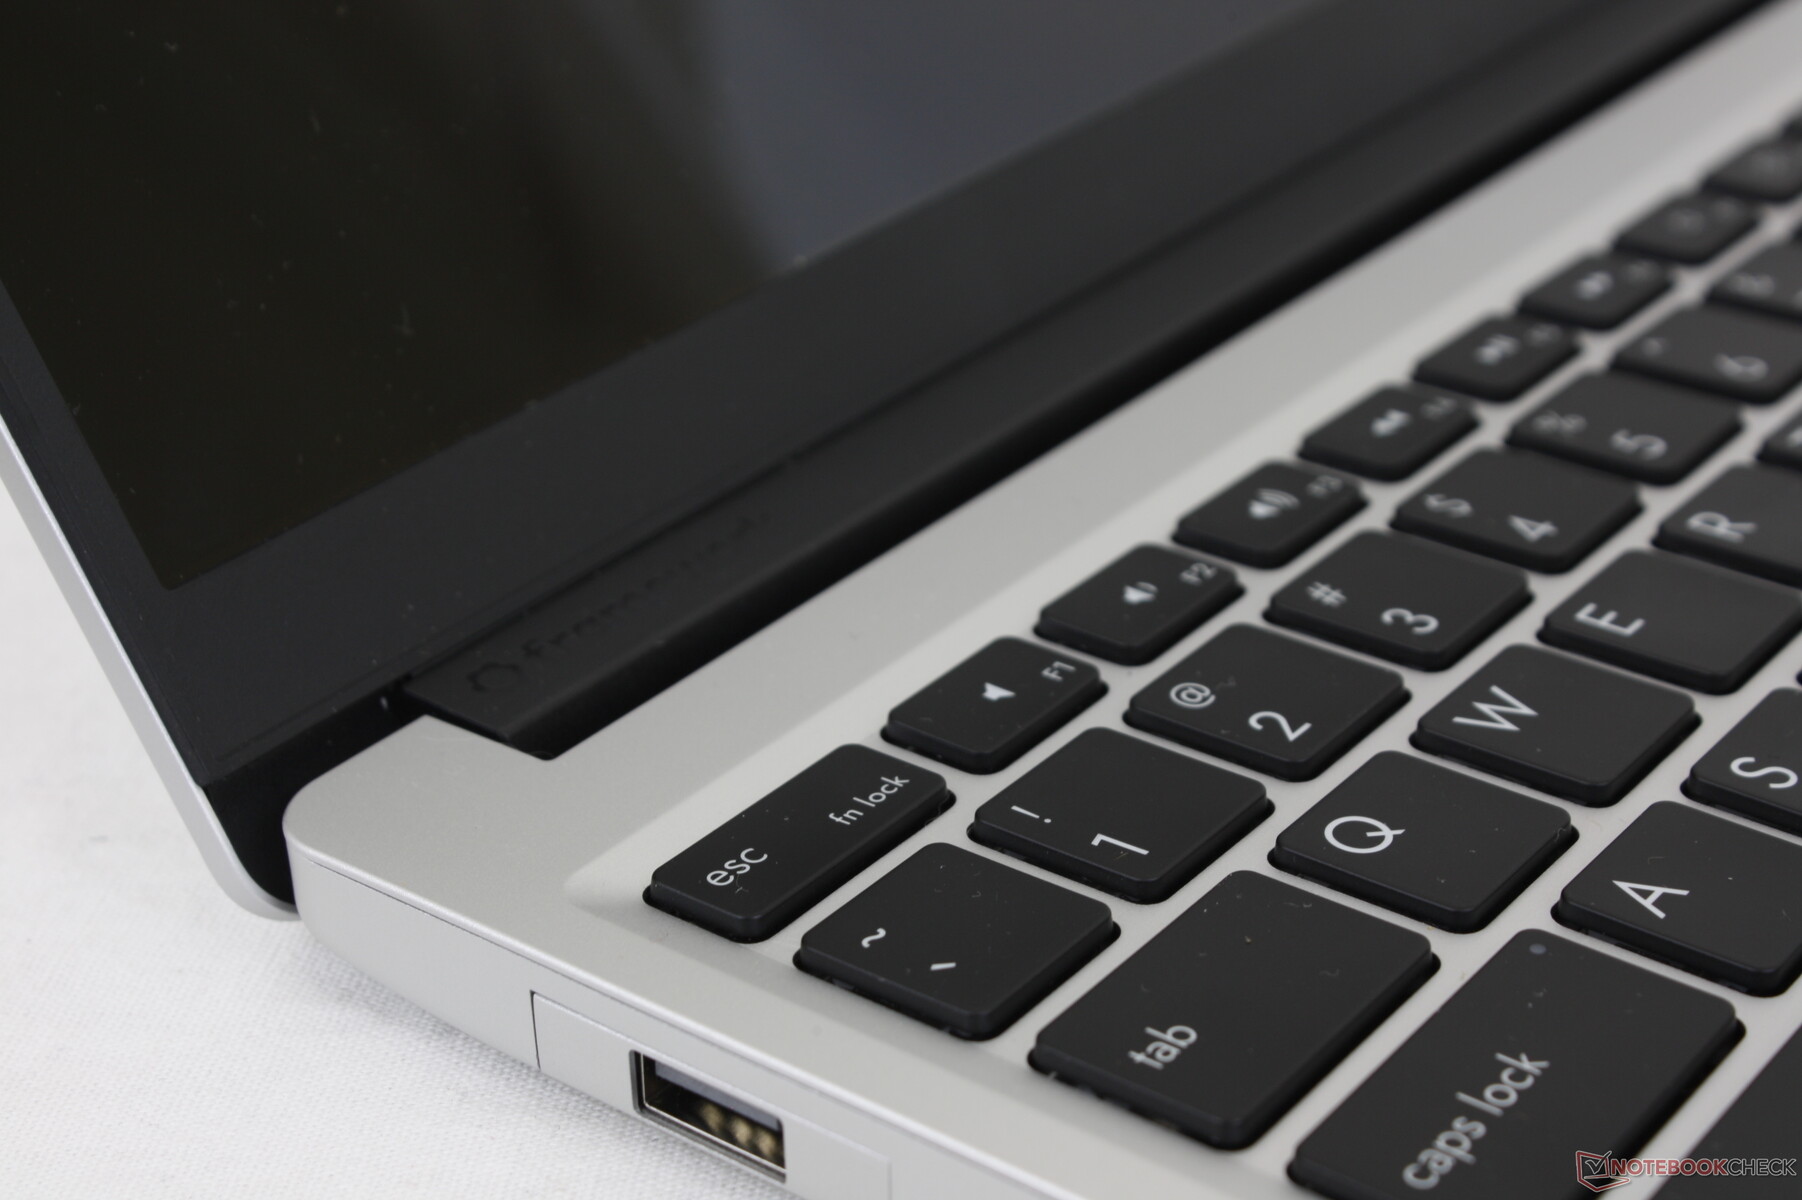
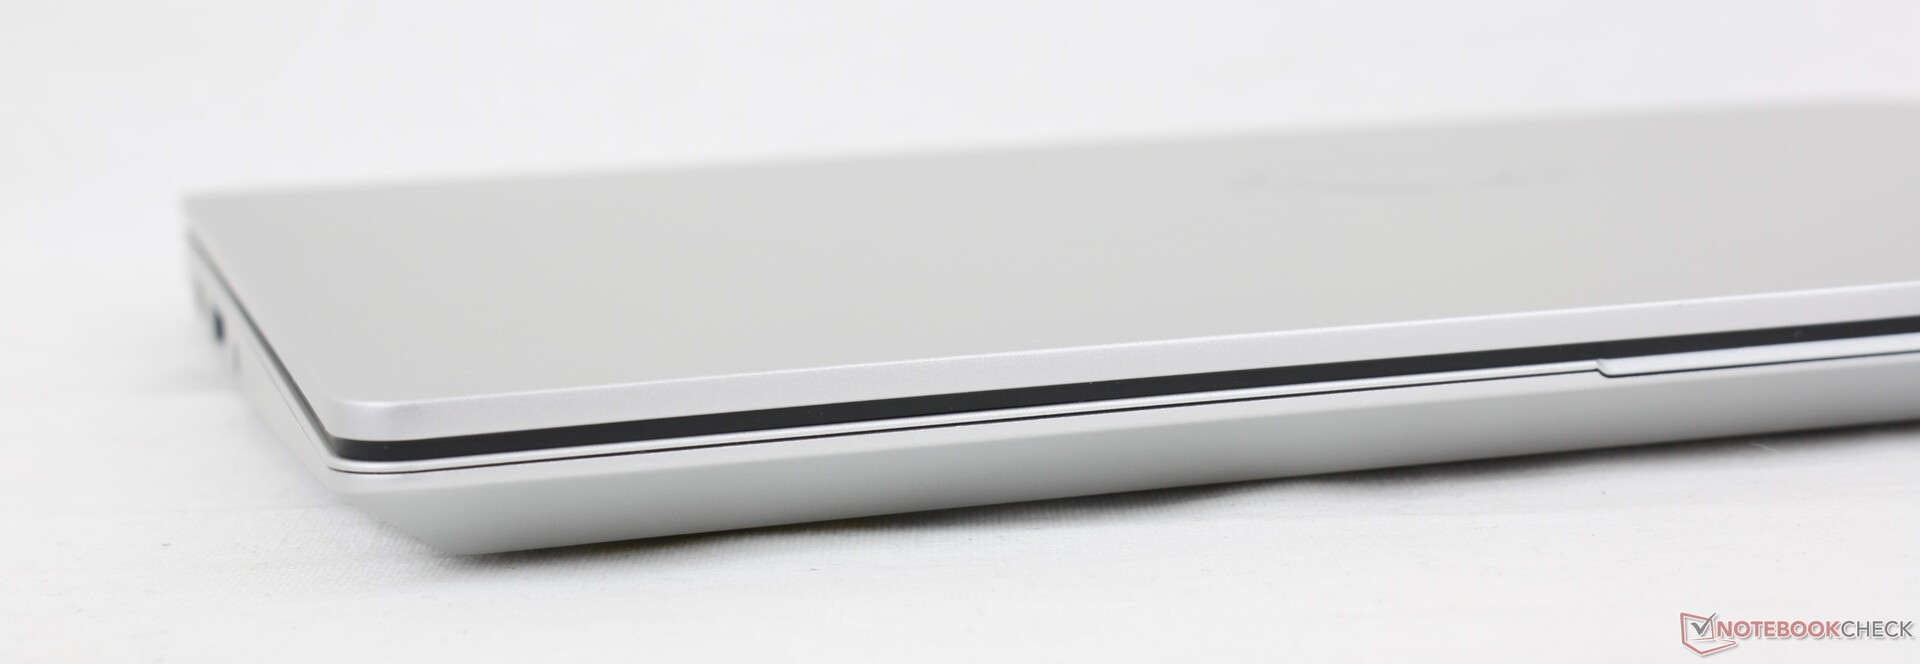
很明显,Framework Laptop的制造者们从以下方面获得了灵感 Apple MacBook当它涉及到机箱的设计时。然而,框架系统的底盘刚性并不那么牢固。显示器很容易弯曲,铰链可以更紧,以减少摇晃。底盘的尺寸和重量与13.5英寸的 ThinkPad X1 Titanium Yoga G1或略小于Acer Swift 3 SF313.
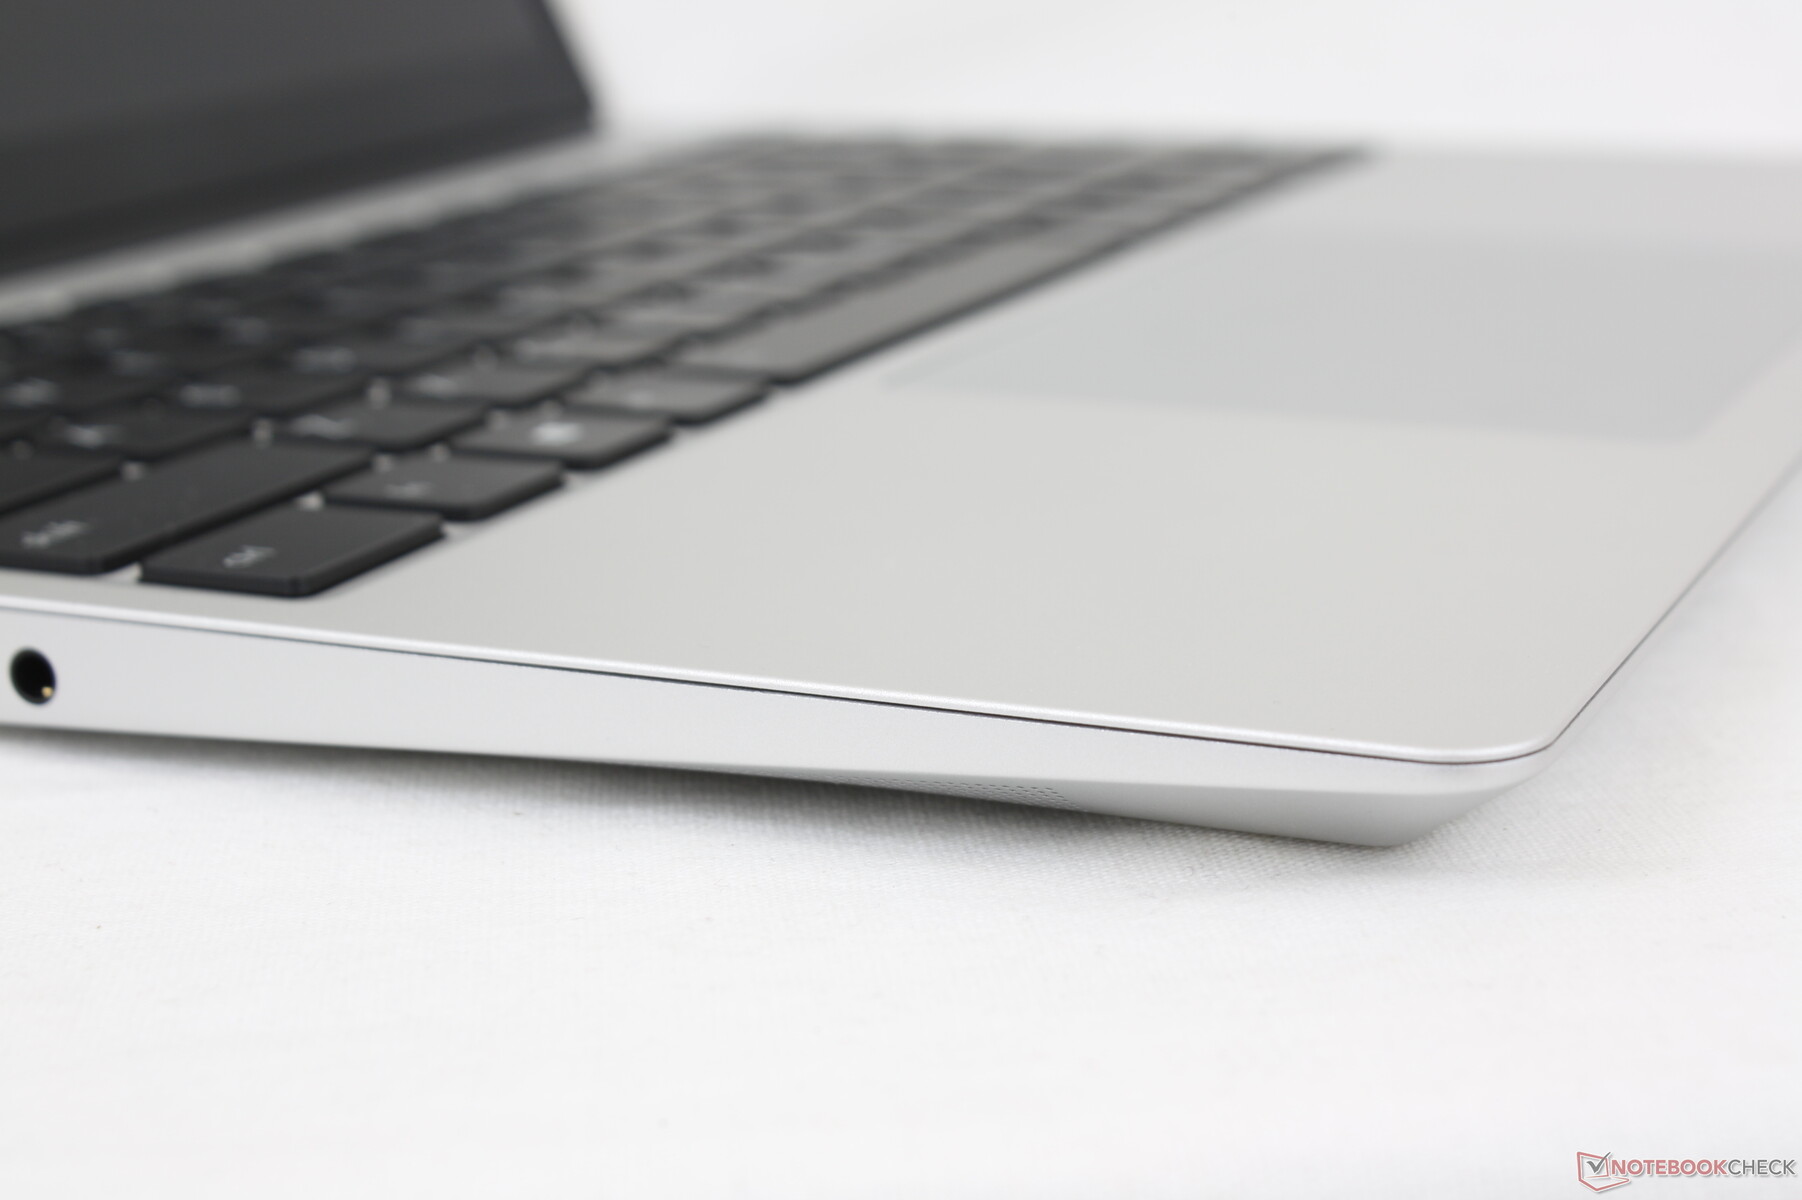
连接性
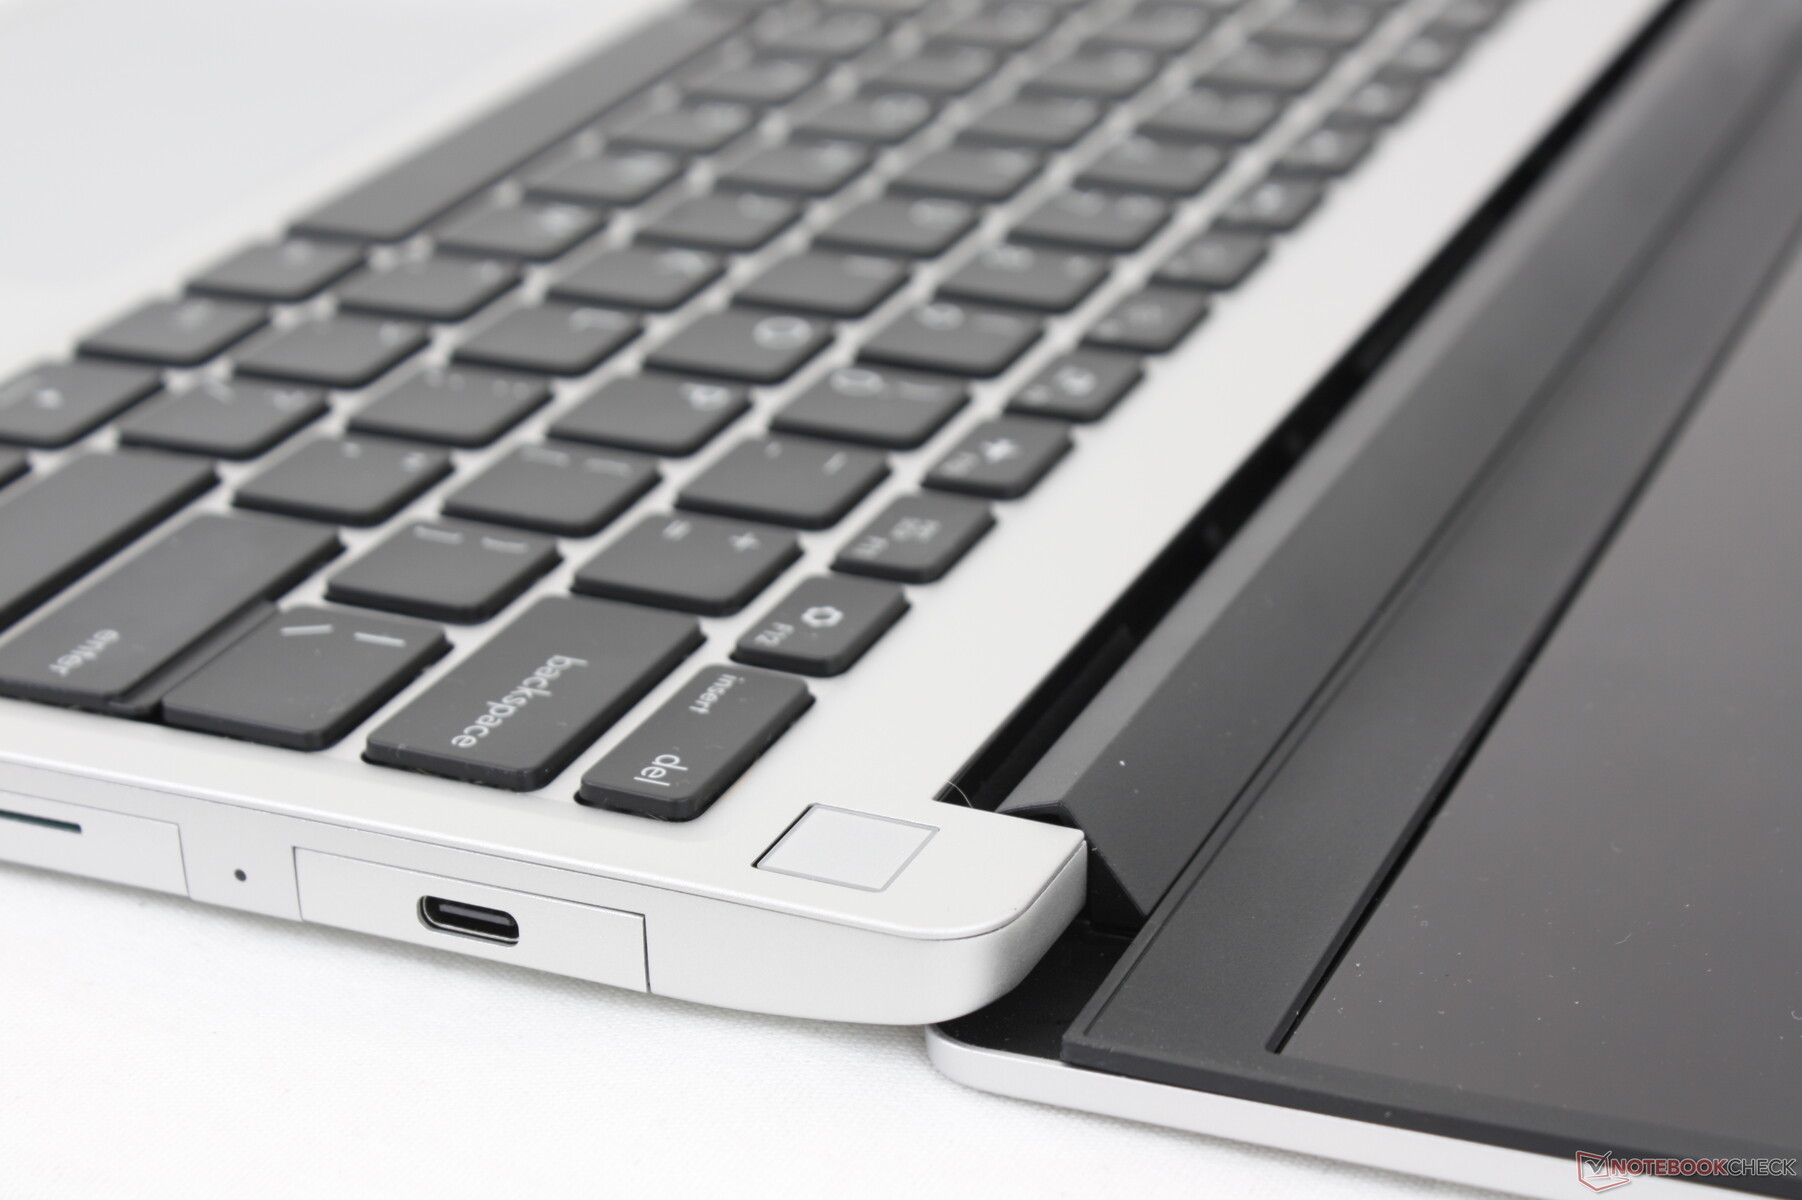
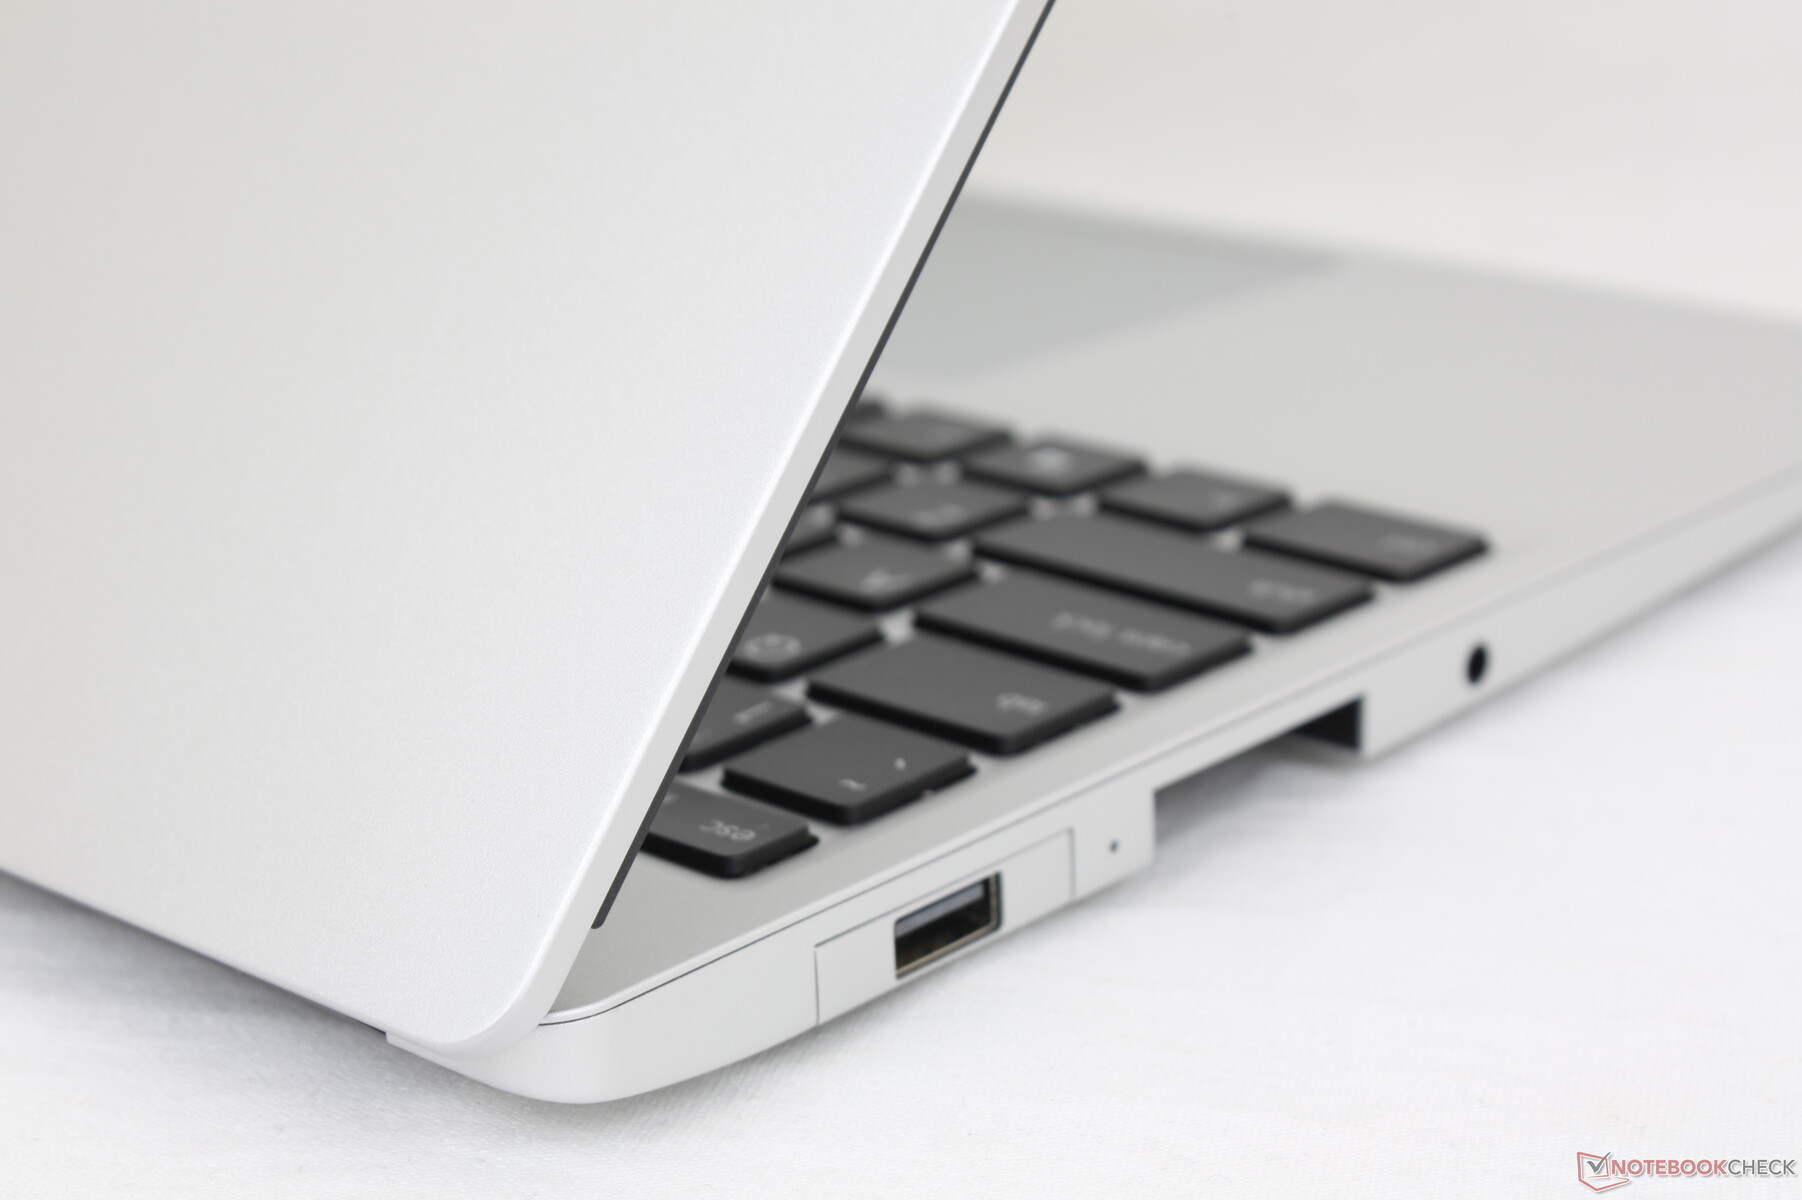
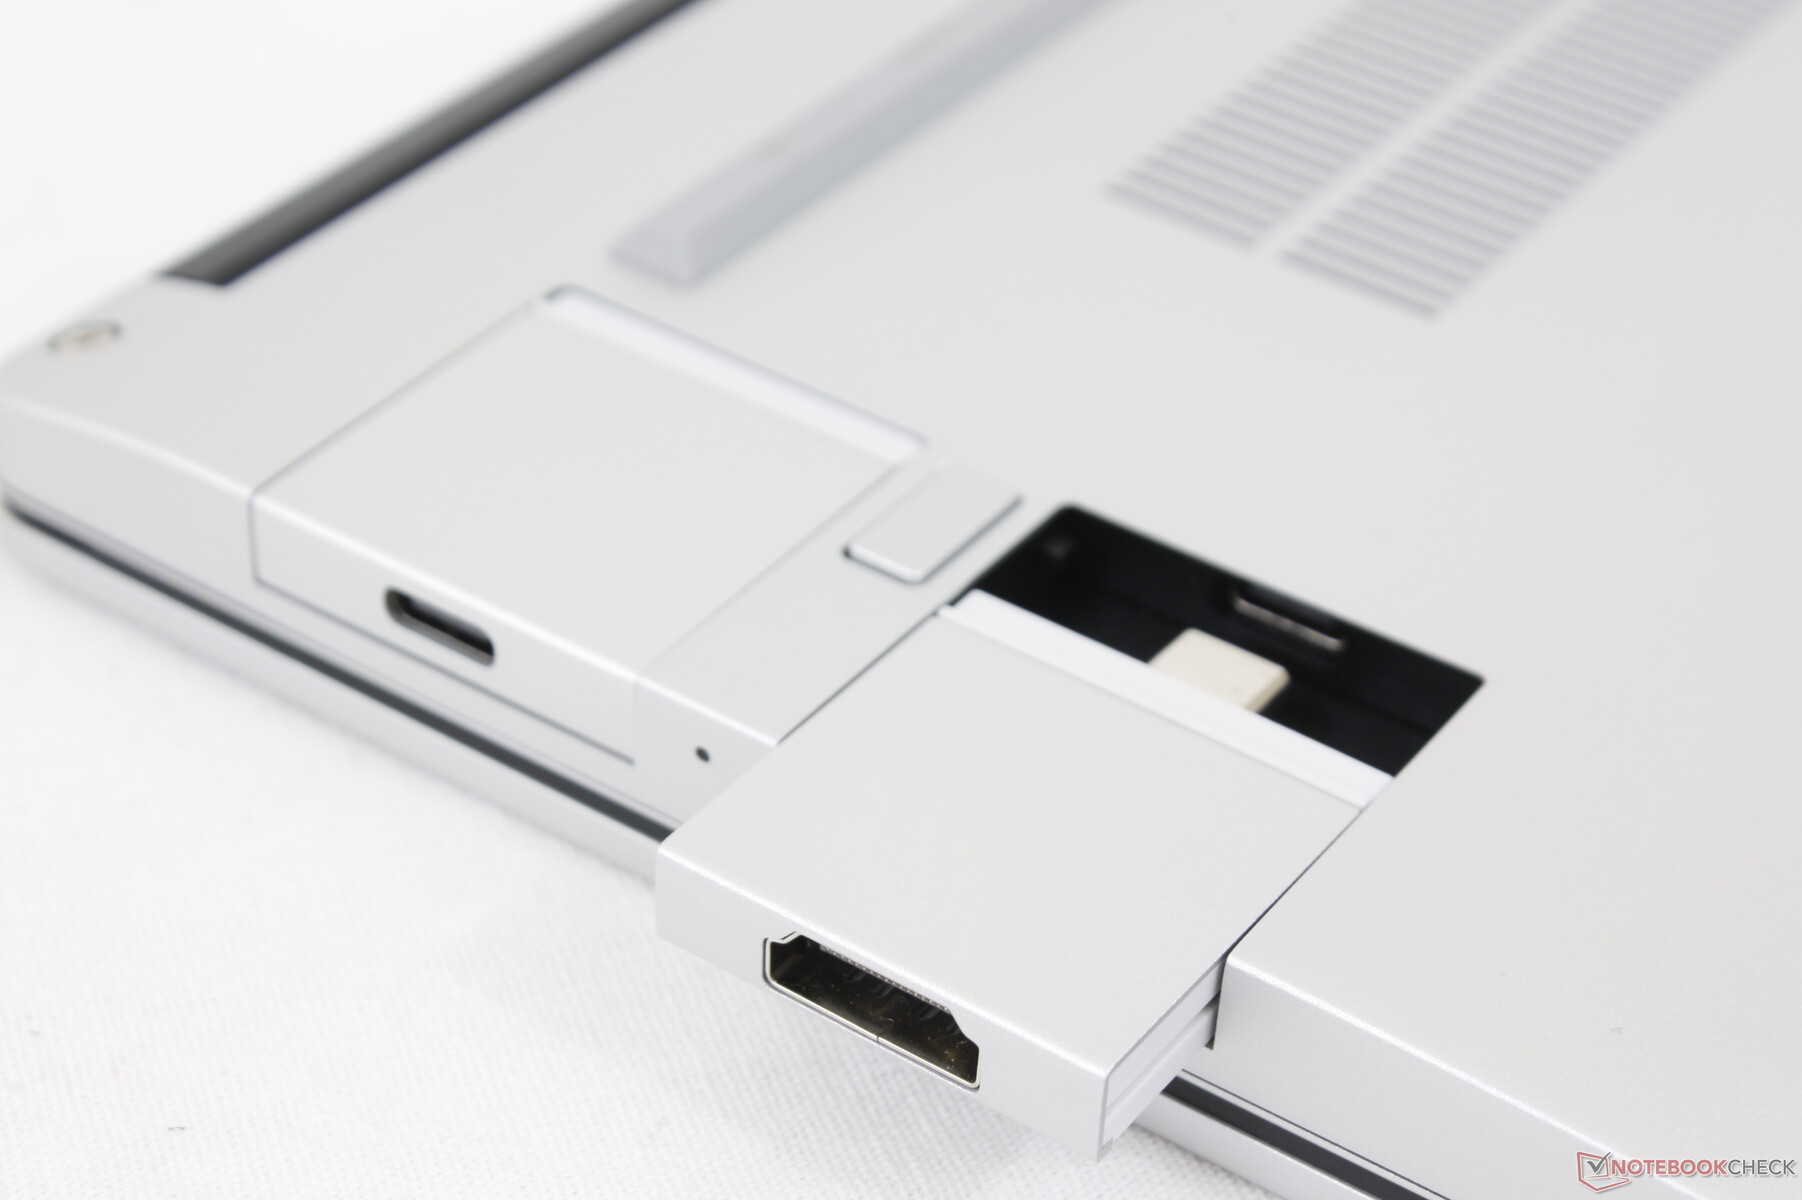
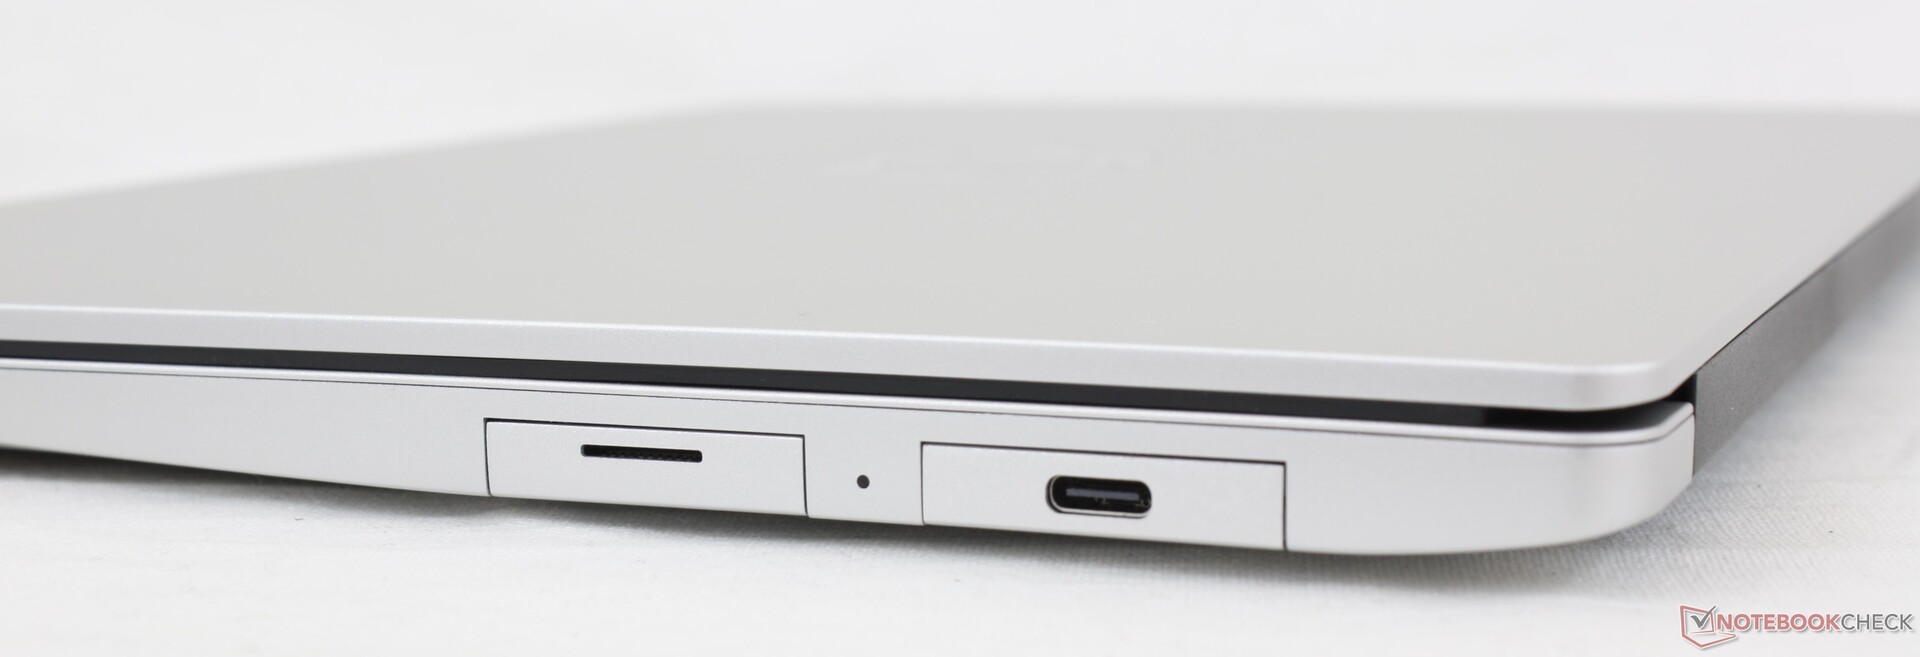
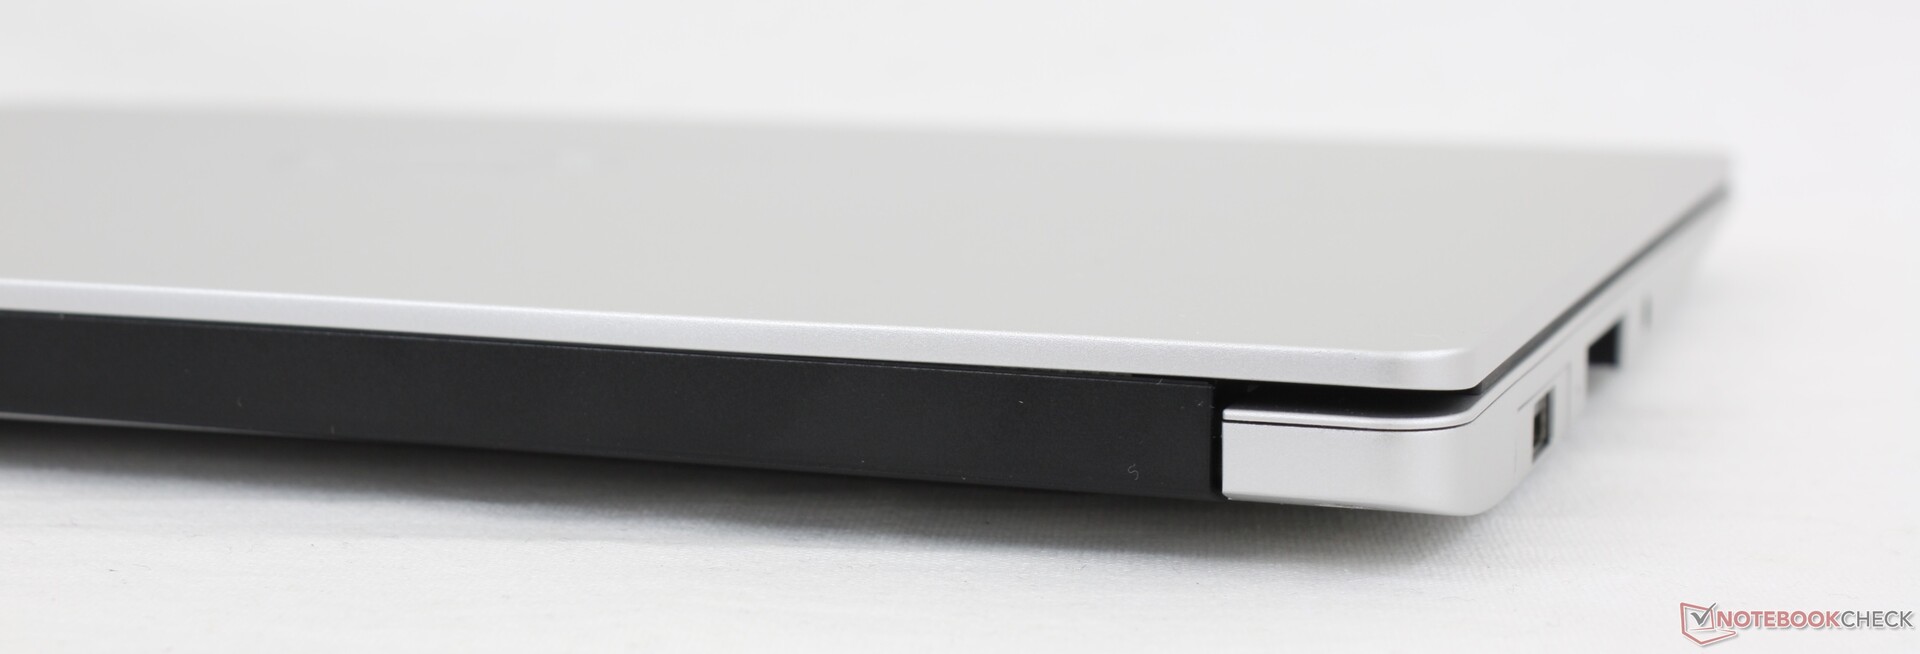
框架系统具有四个相同的USB-C端口,沿左右边缘均匀分布。所有的端口都支持USB 4的速度,并在技术上与Thunderbolt设备兼容,包括我们的 奥鲁斯游戏盒.然而,截至本文写作时,制造商官方只支持USB设备。
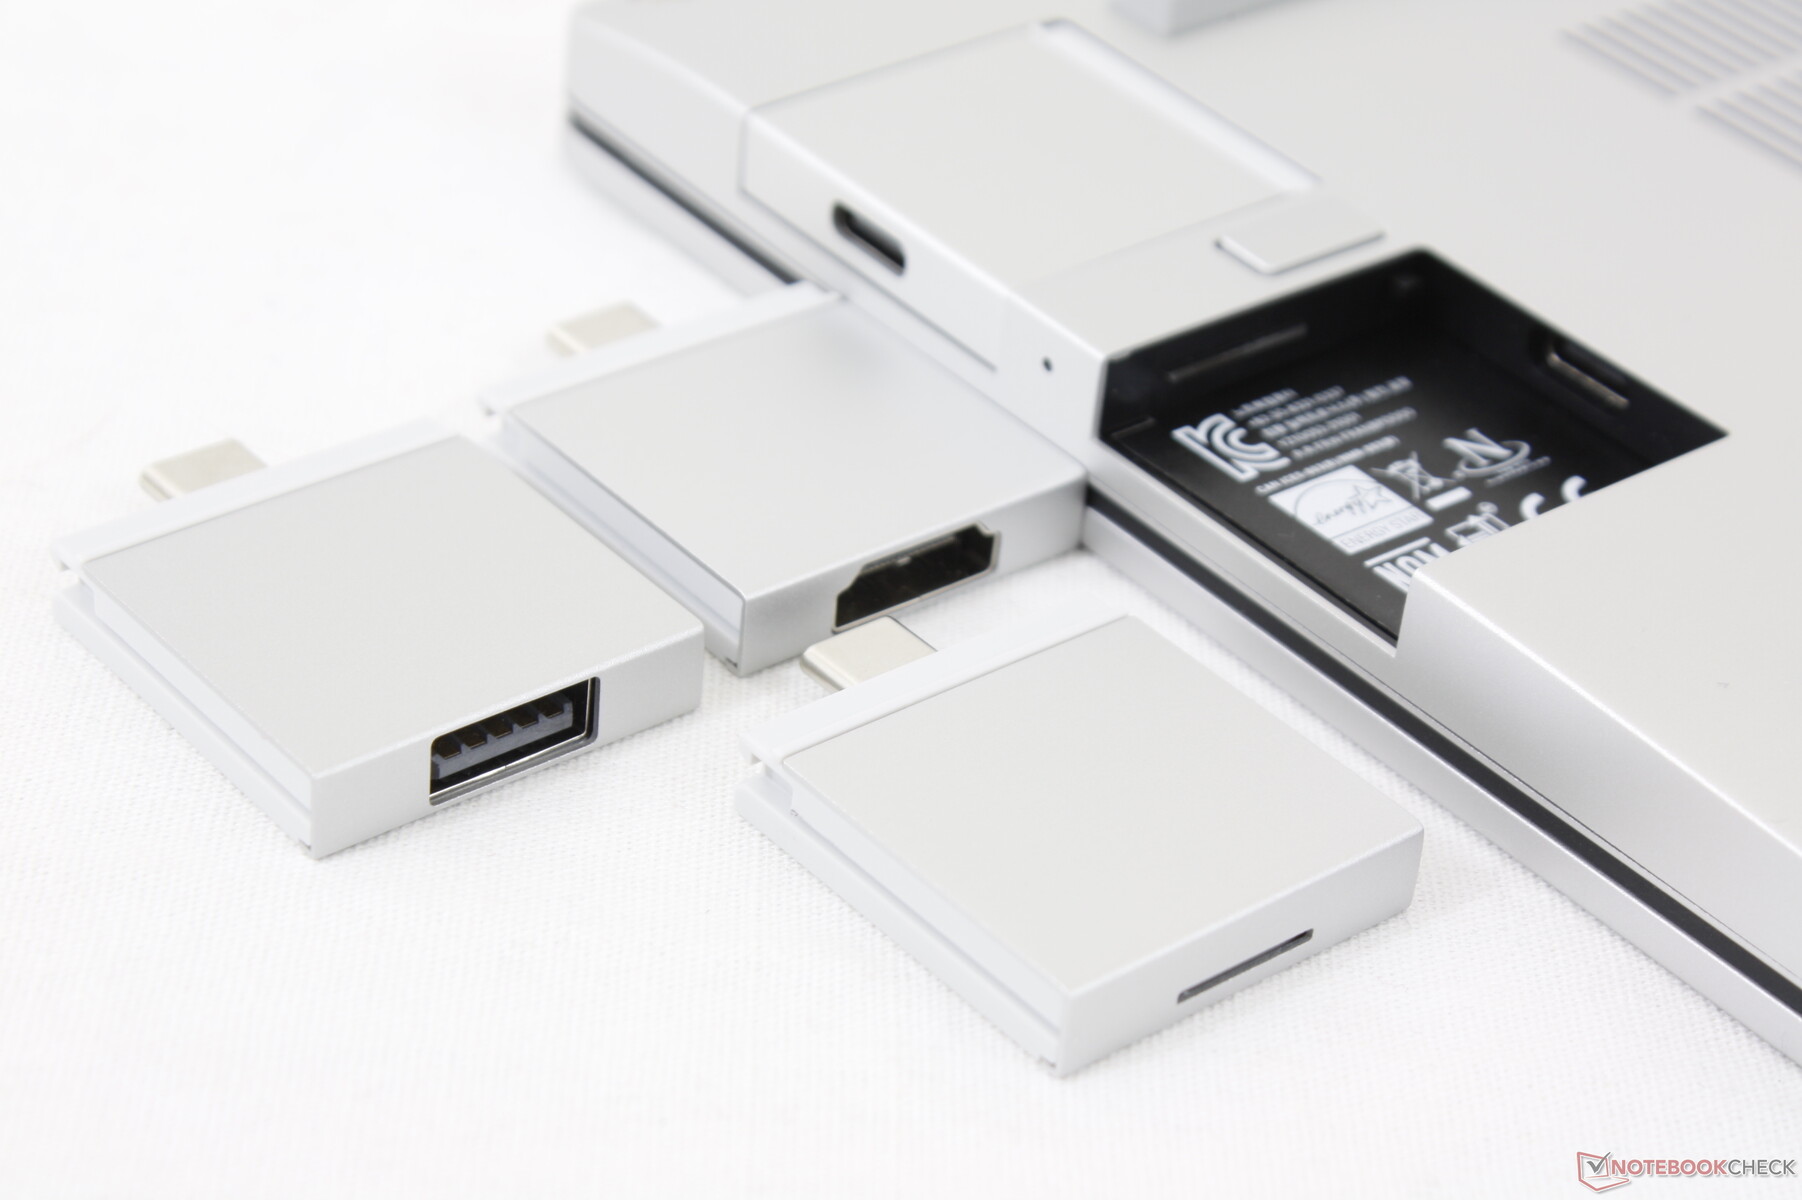
四个USB-C端口凹陷在机箱上,以允许扩展卡适配器的使用。物理适配器本身是专有的,但端口和连接器不是。因此,用户可以自由地混合和匹配不同的扩展卡适配器,将4个USB-C端口变成MicroSD、USB-A、HDMI、DisplayPort或它们的一些组合。
如果不连接任何适配器,凹陷的USB-C端口将表现得像任何USB-C端口,同时具有Power Delivery和DisplayPort。
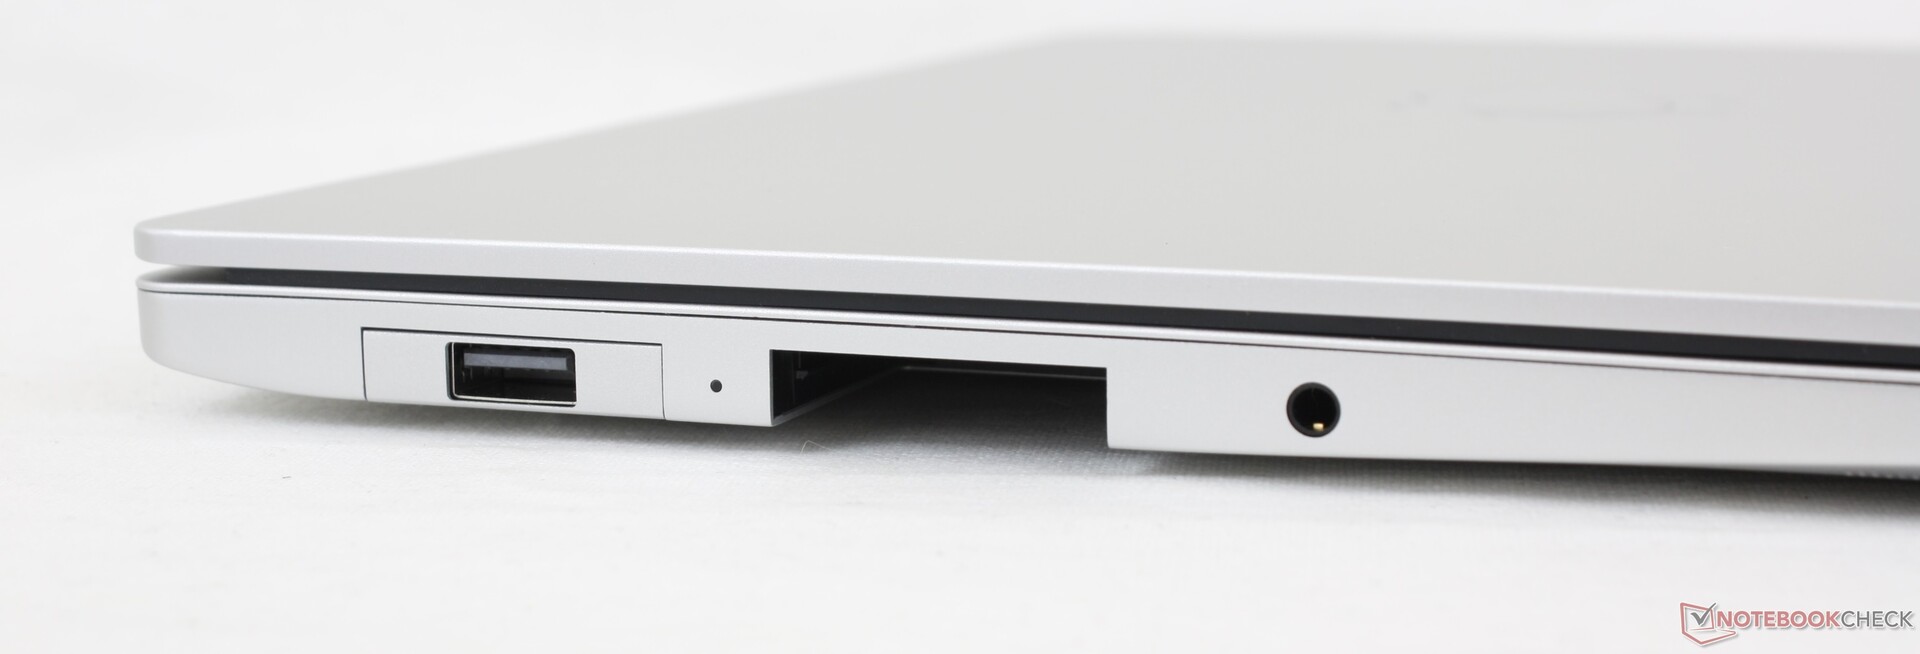
SD卡阅读器
MicroSD读卡器的扩展卡使用起来很麻烦。MicroSD插槽不是弹簧式的,所以卡很难插入和取出。每次我们在这里使用时,感觉我们的卡都处于破裂的边缘。
传输速率还不错,但不令人印象深刻。从我们的UHS-II测试卡中移动1GB的图片需要大约14秒,而在戴尔XPS 13上这一时间还不到一半。 戴尔XPS 13.
| SD Card Reader | |
| average JPG Copy Test (av. of 3 runs) | |
| HP Spectre x360 14-ea0378ng (Toshiba Exceria Pro M501 microSDXC 64GB) | |
| Framework Laptop 13.5 (AV Pro UHS-II V60) | |
| HP ProBook x360 435 G8 R7-5800U (AV Pro UHS-II V60) | |
| maximum AS SSD Seq Read Test (1GB) | |
| HP Spectre x360 14-ea0378ng (Toshiba Exceria Pro M501 microSDXC 64GB) | |
| Framework Laptop 13.5 (AV Pro UHS-II V60) | |
| HP ProBook x360 435 G8 R7-5800U (AV Pro UHS-II V60) | |
沟通
| Networking | |
| iperf3 transmit AX12 | |
| Lenovo ThinkPad X1 Titanium Yoga G1 20QA001RGE | |
| HP ProBook x360 435 G8 R7-5800U | |
| Microsoft Surface Laptop 4 13 i7 | |
| Framework Laptop 13.5 | |
| HP Spectre x360 14-ea0378ng | |
| Lenovo Yoga 6 13 82ND0009US | |
| iperf3 receive AX12 | |
| Microsoft Surface Laptop 4 13 i7 | |
| Lenovo ThinkPad X1 Titanium Yoga G1 20QA001RGE | |
| HP ProBook x360 435 G8 R7-5800U | |
| Framework Laptop 13.5 | |
| Lenovo Yoga 6 13 82ND0009US | |
| HP Spectre x360 14-ea0378ng | |
网络摄像头


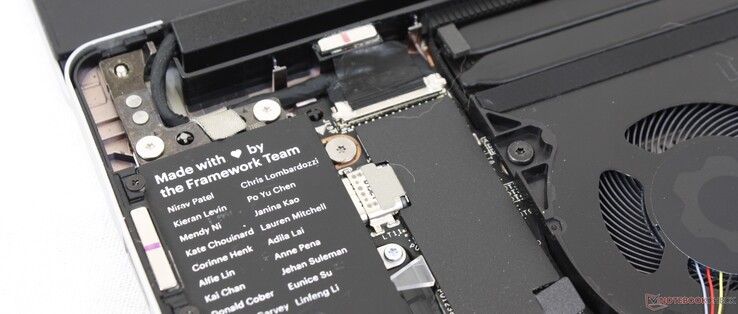
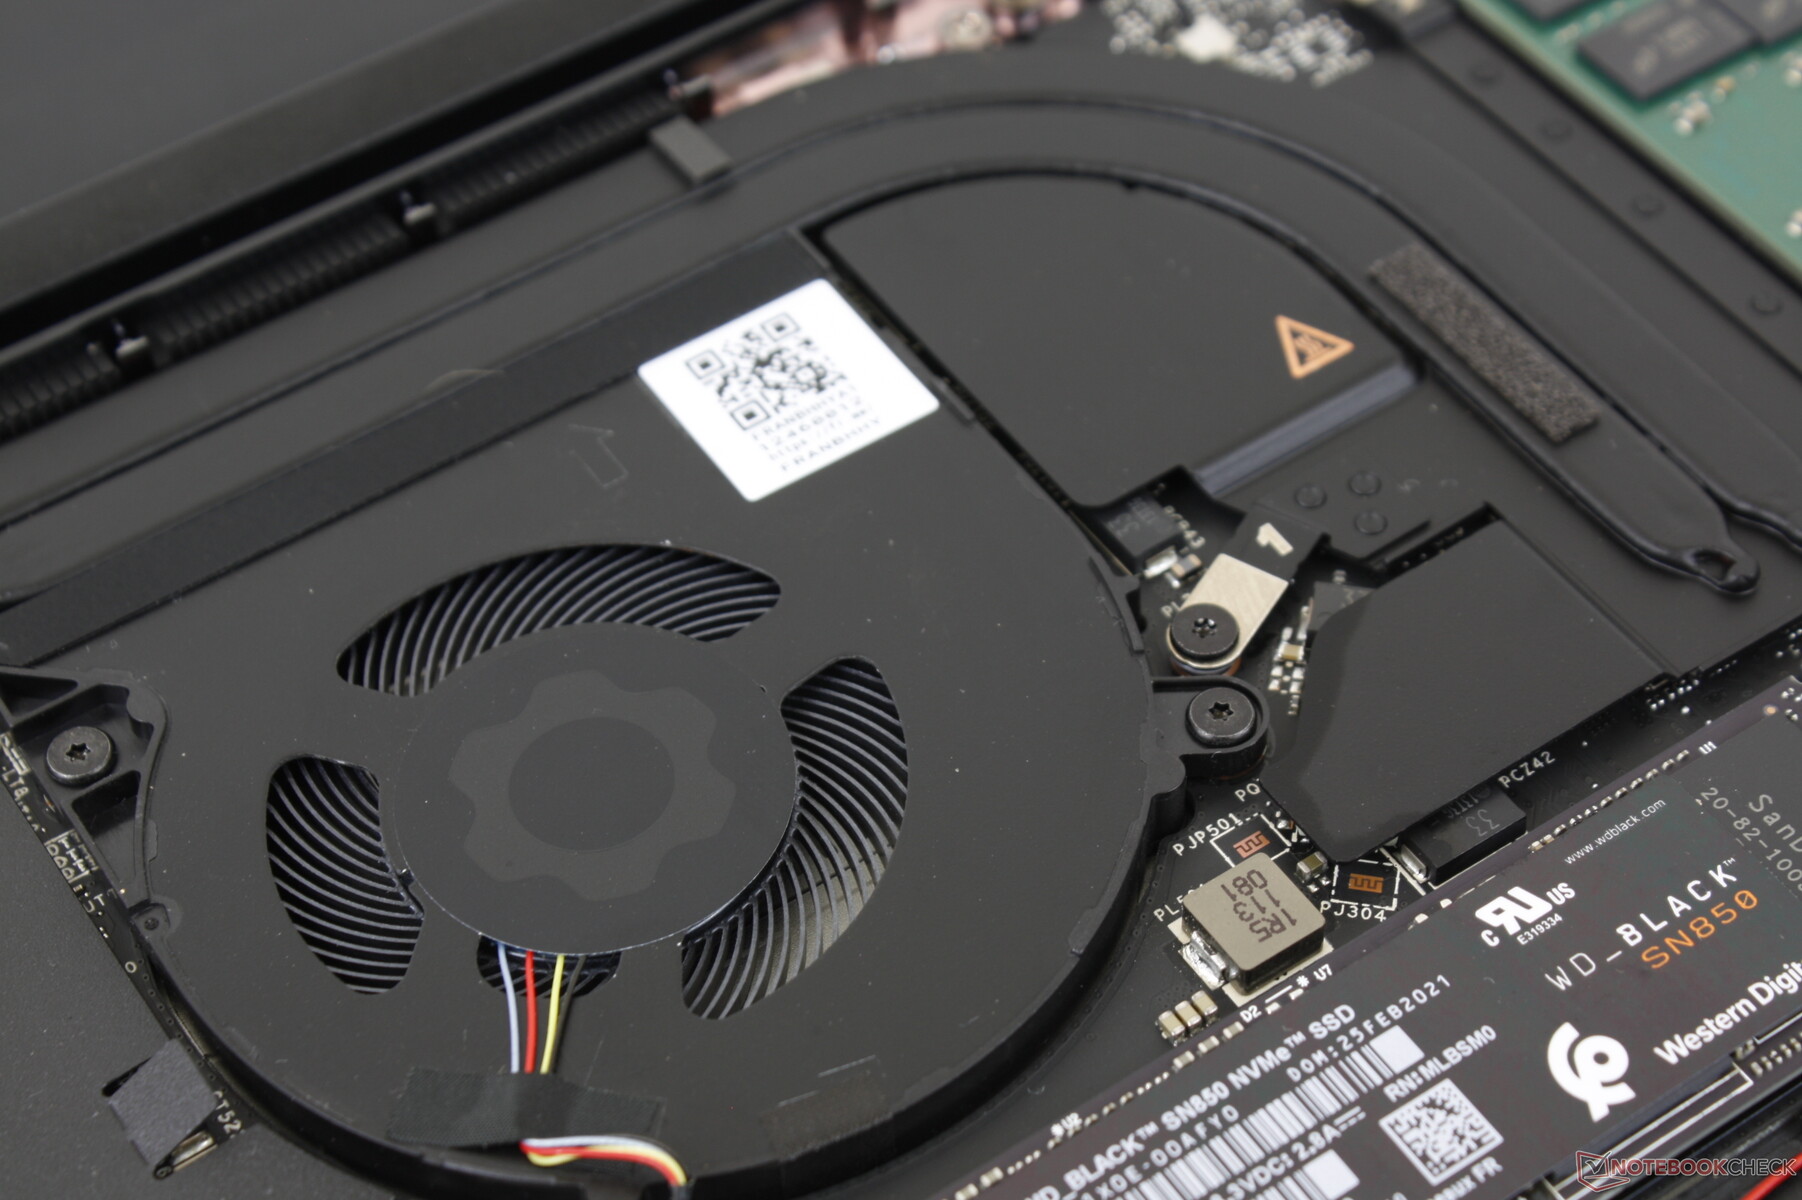
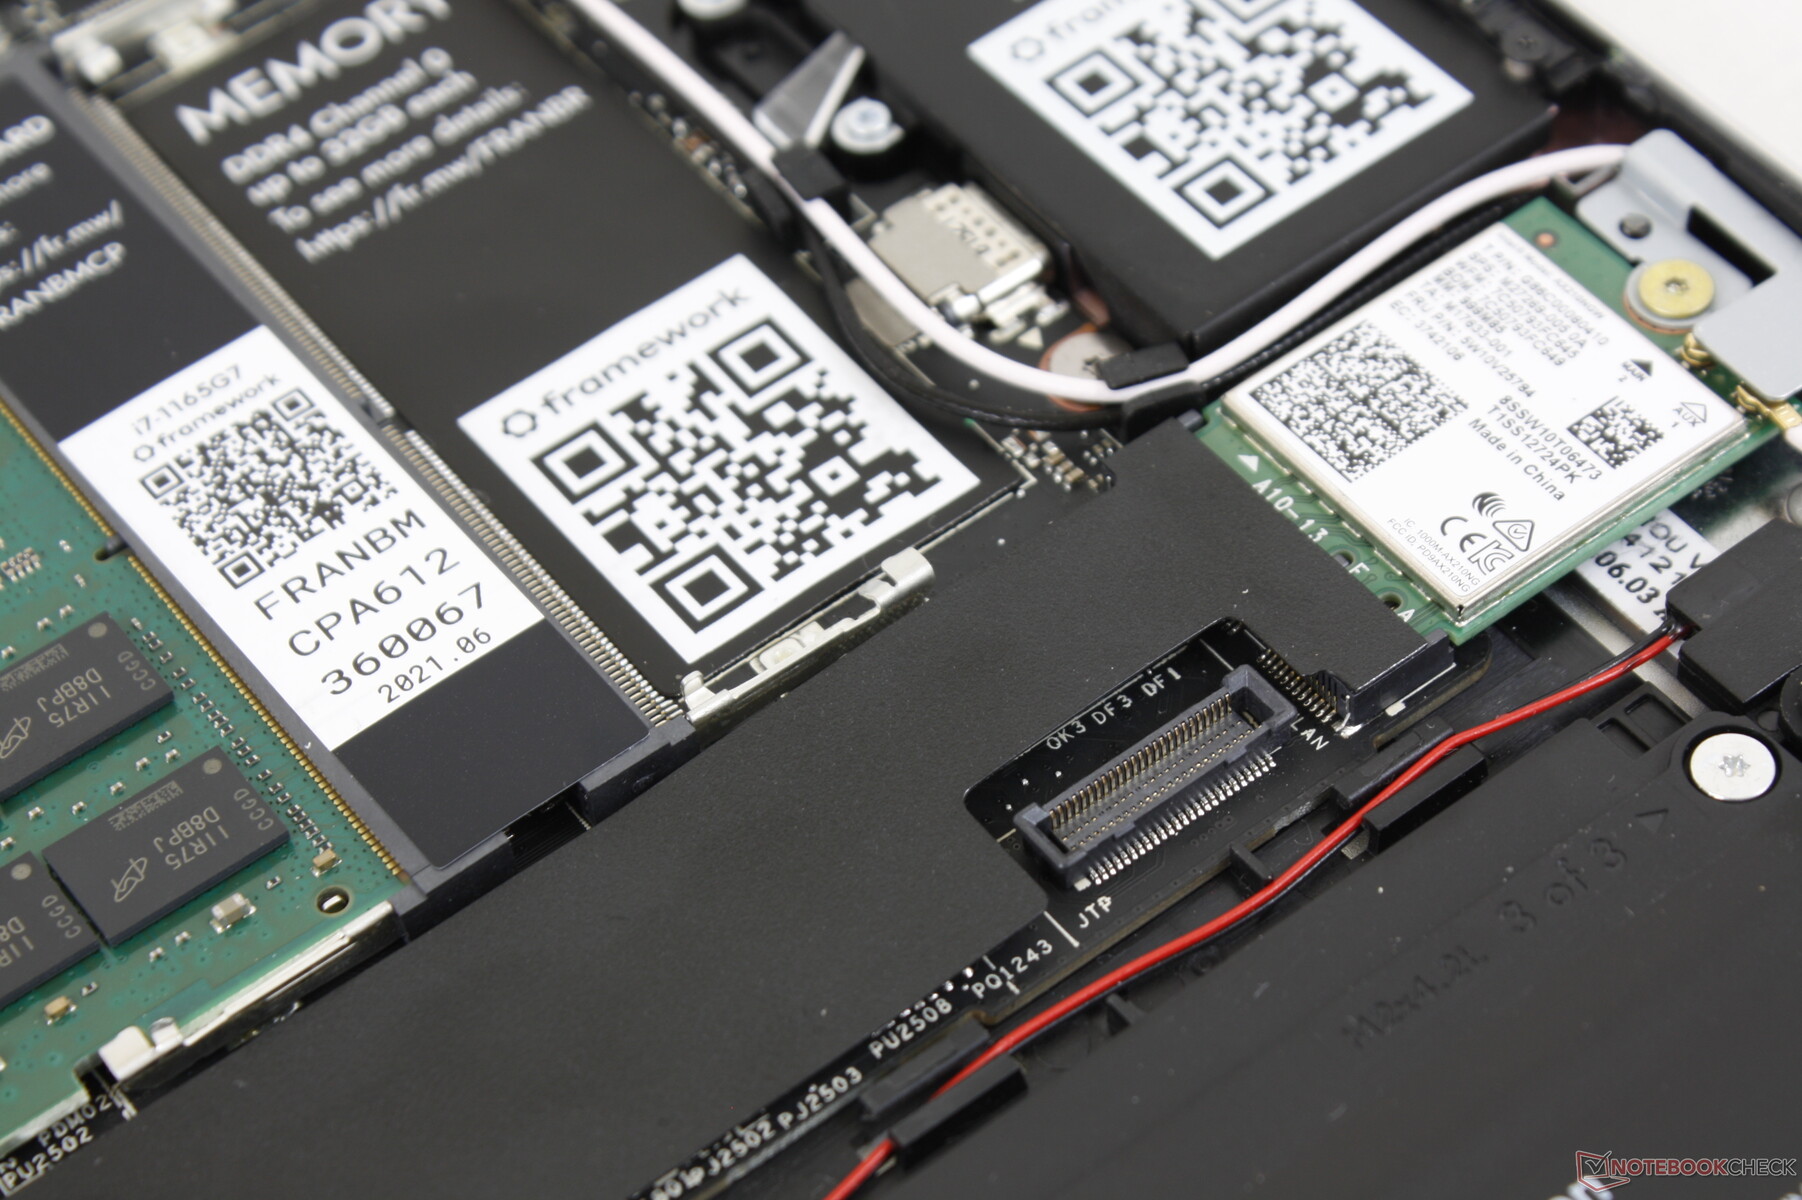
维护
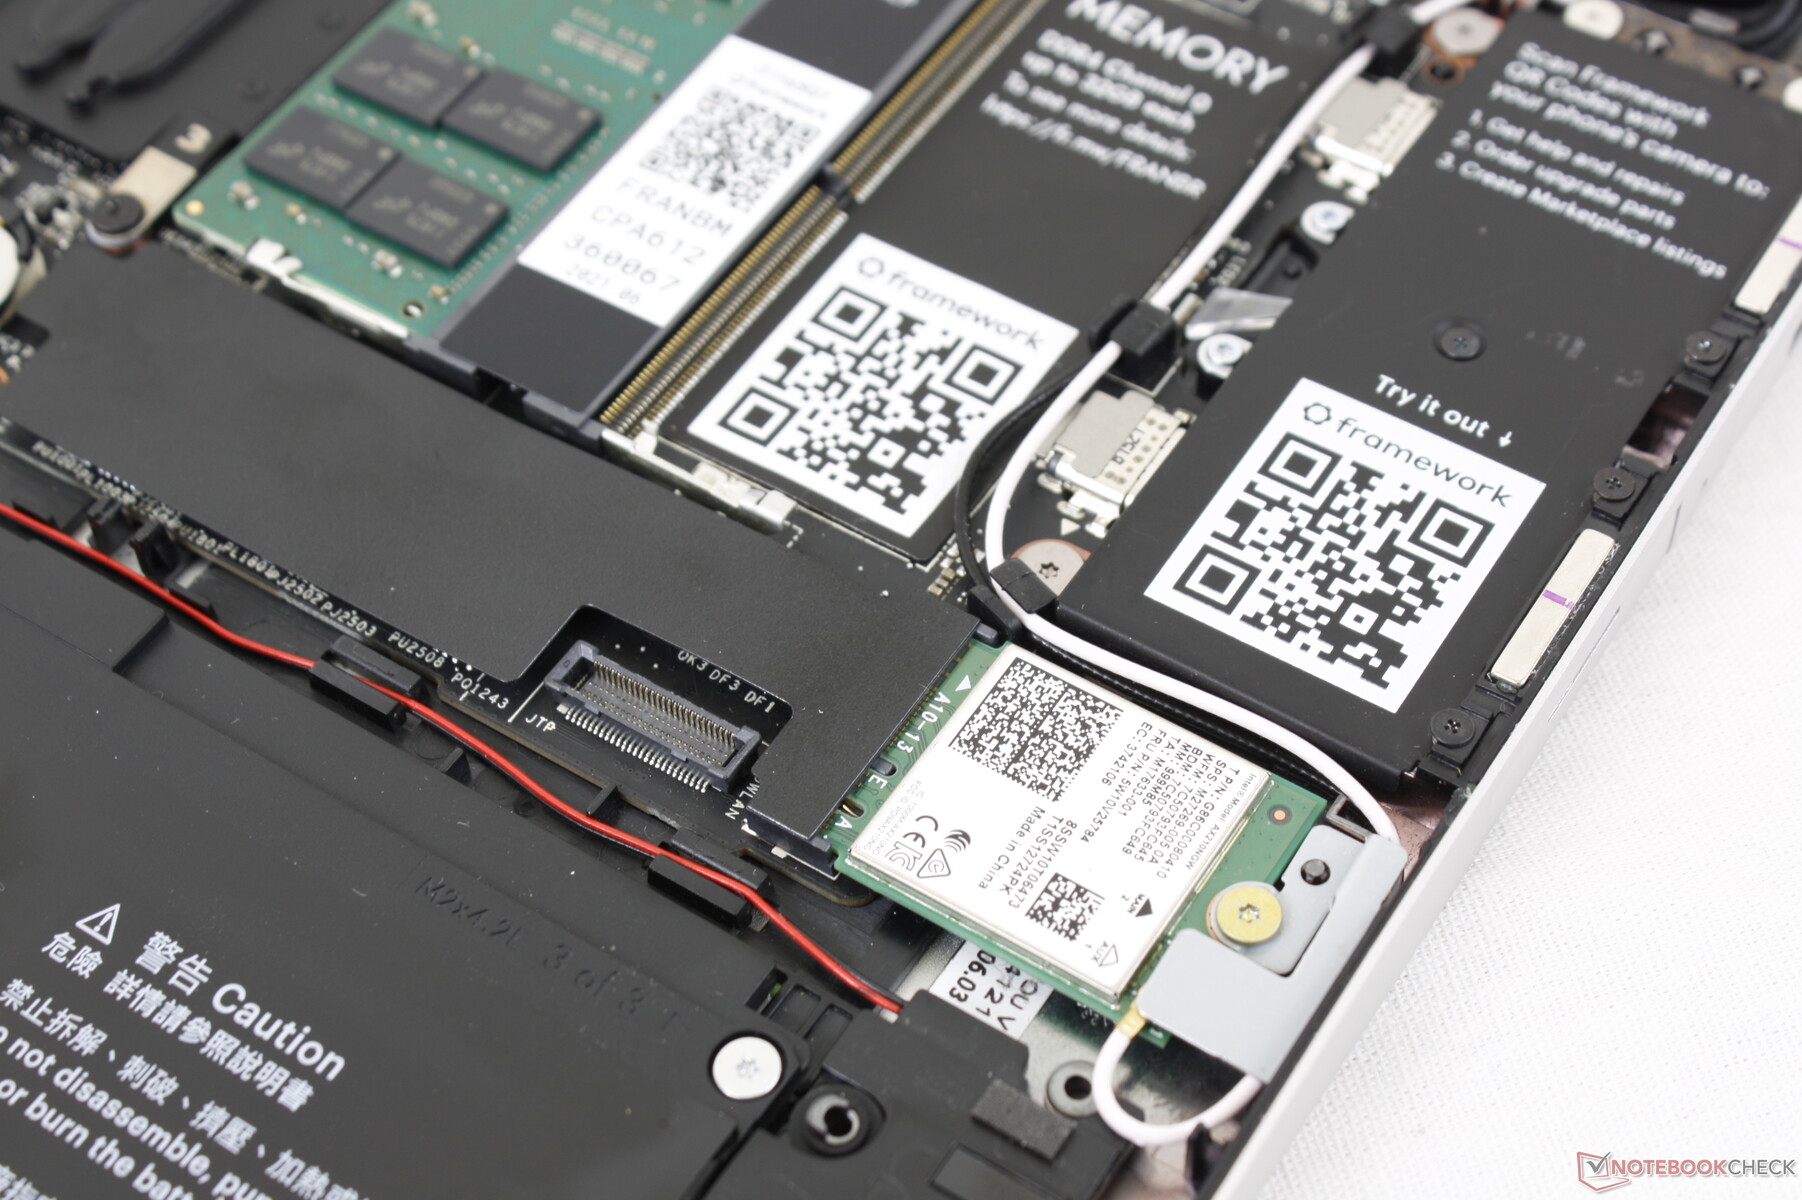
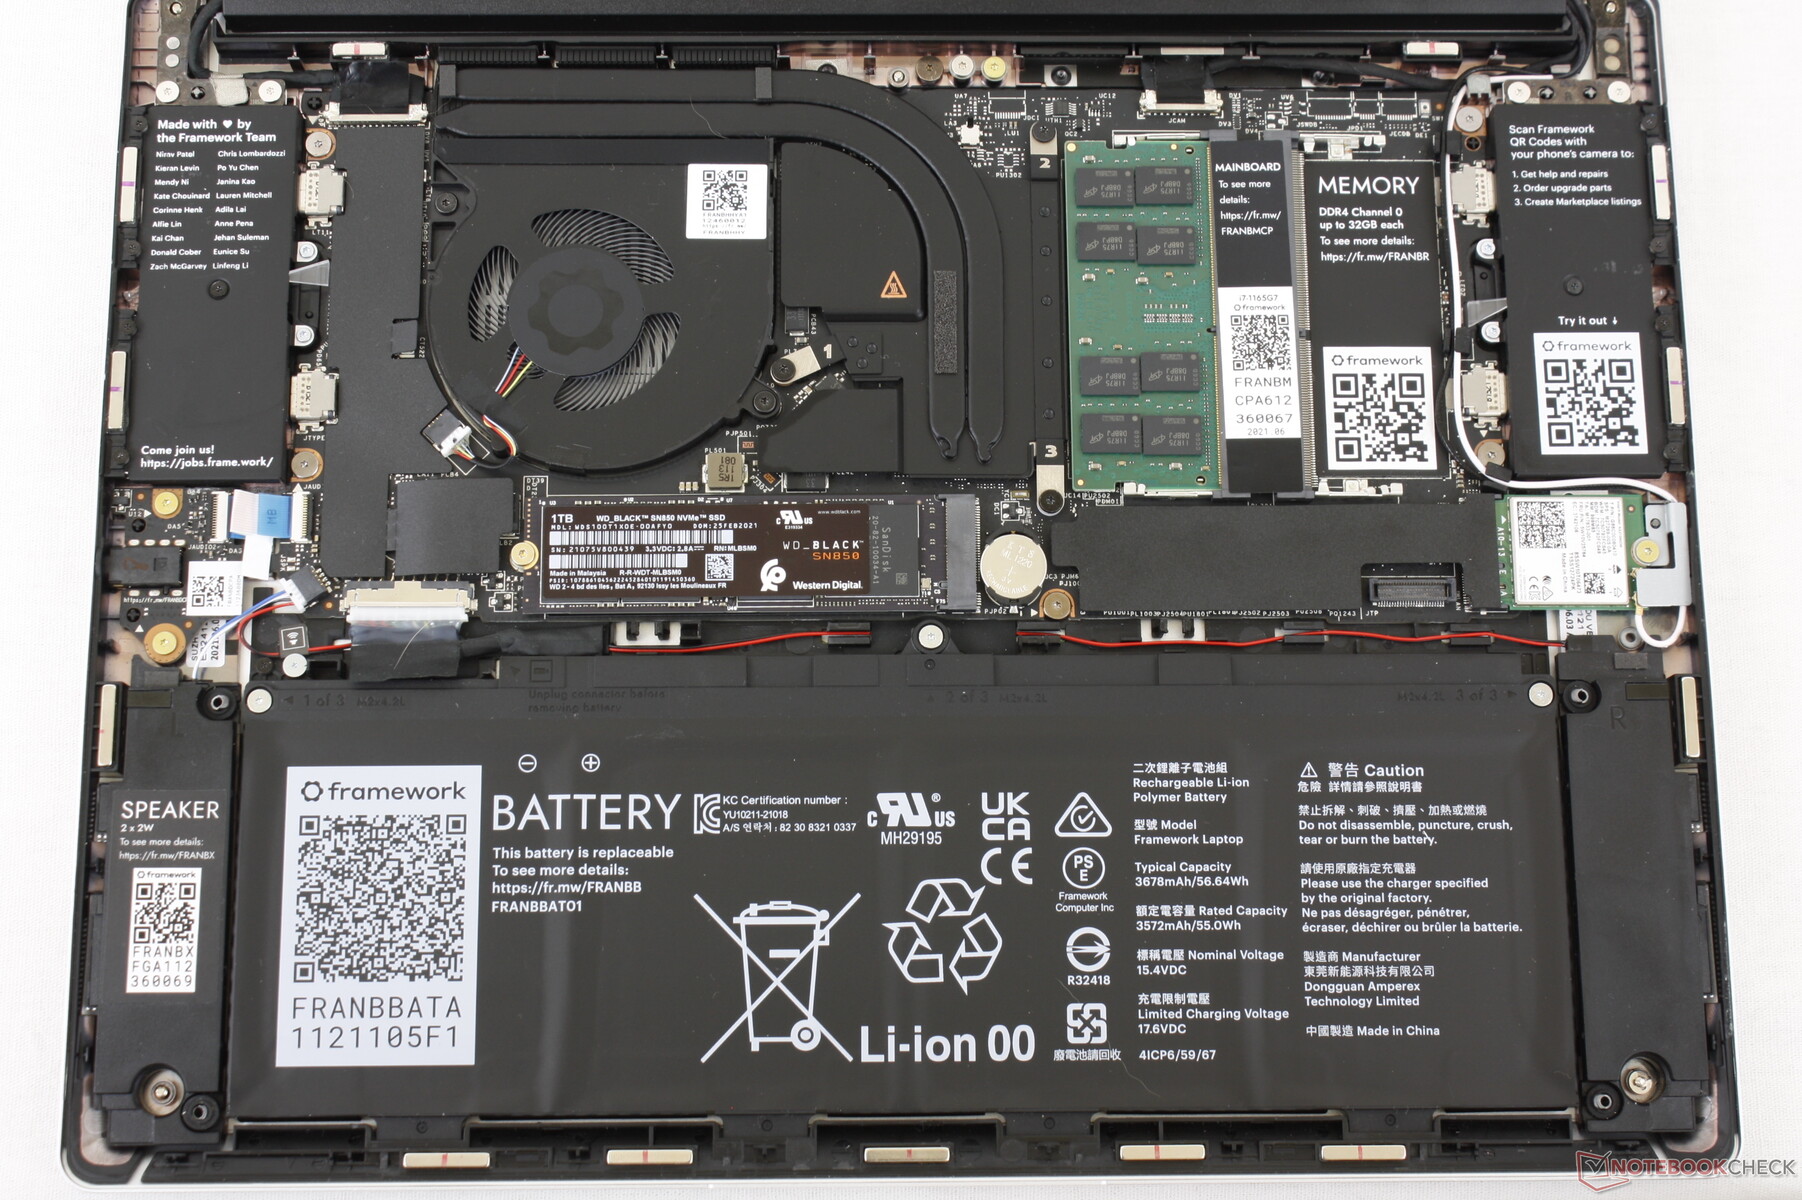
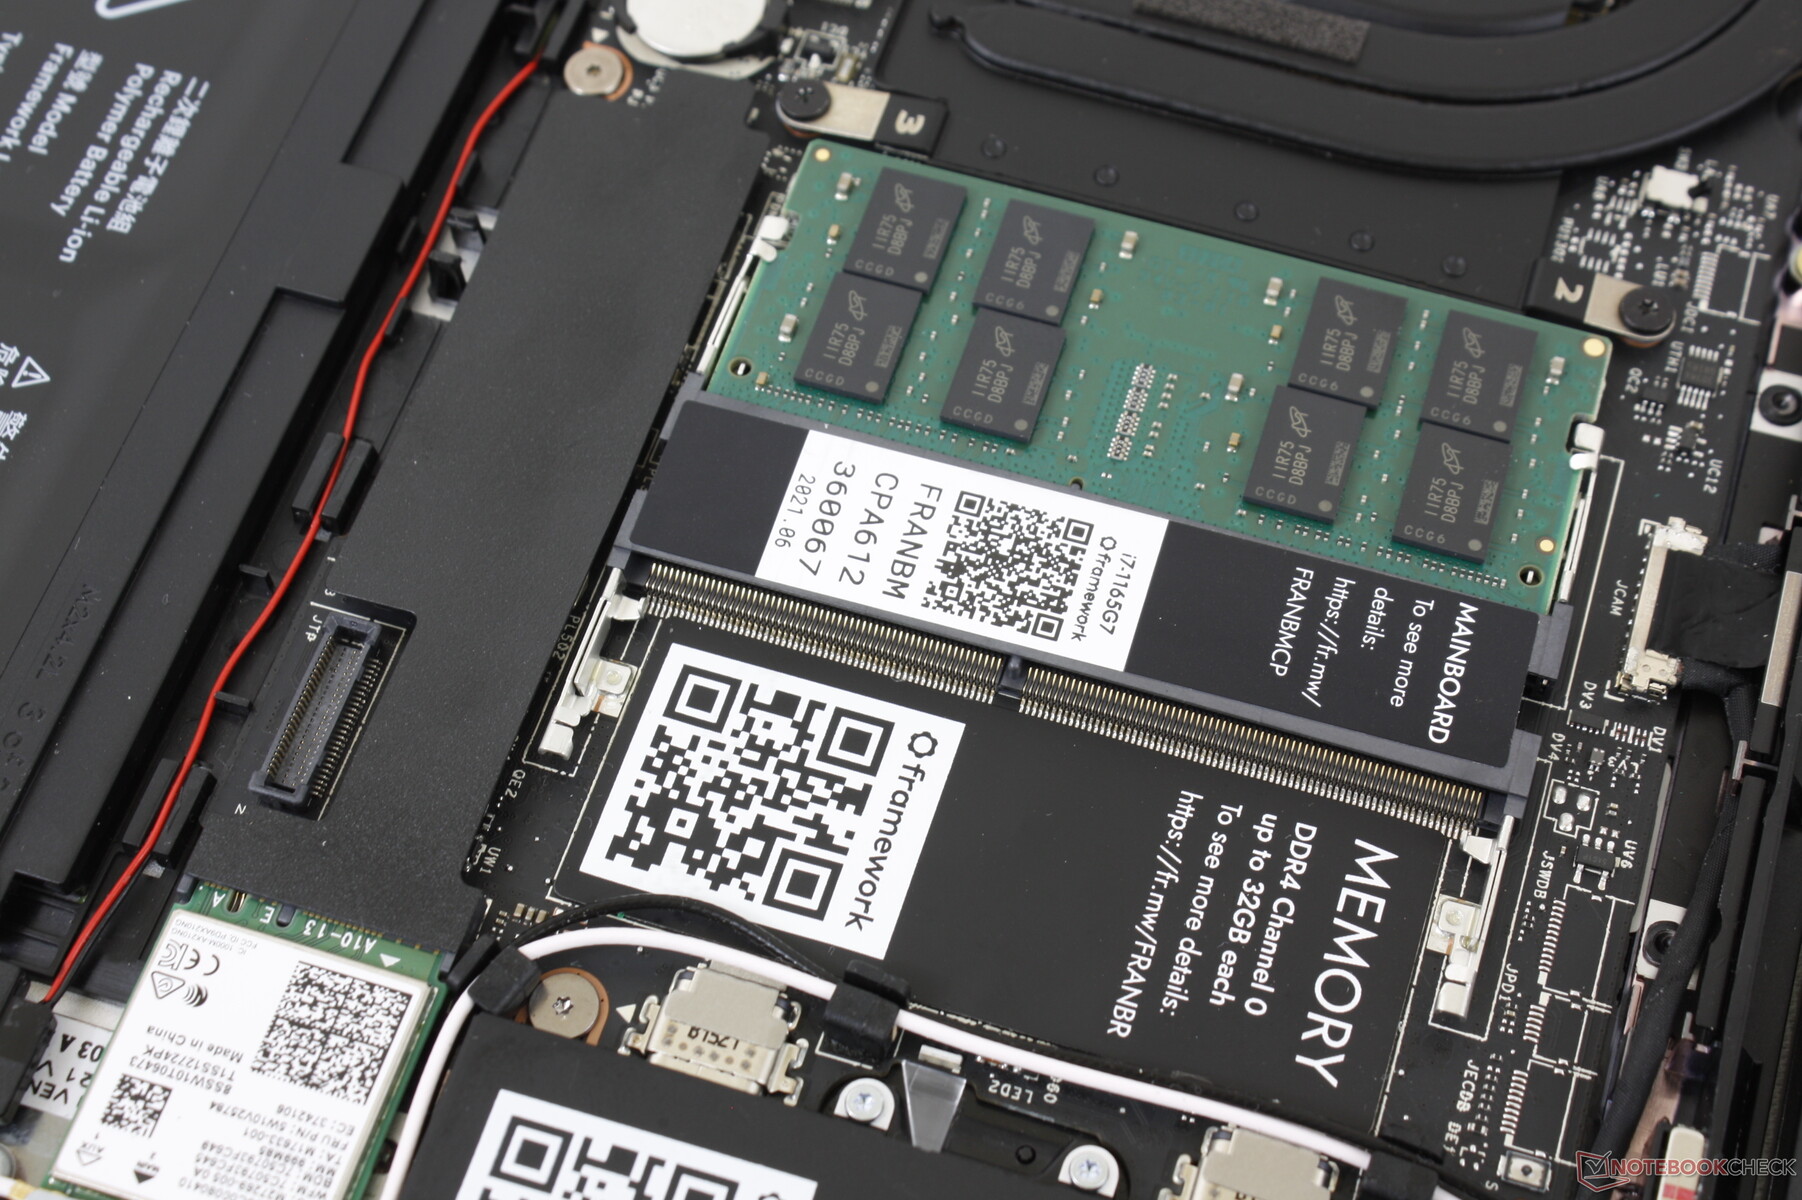
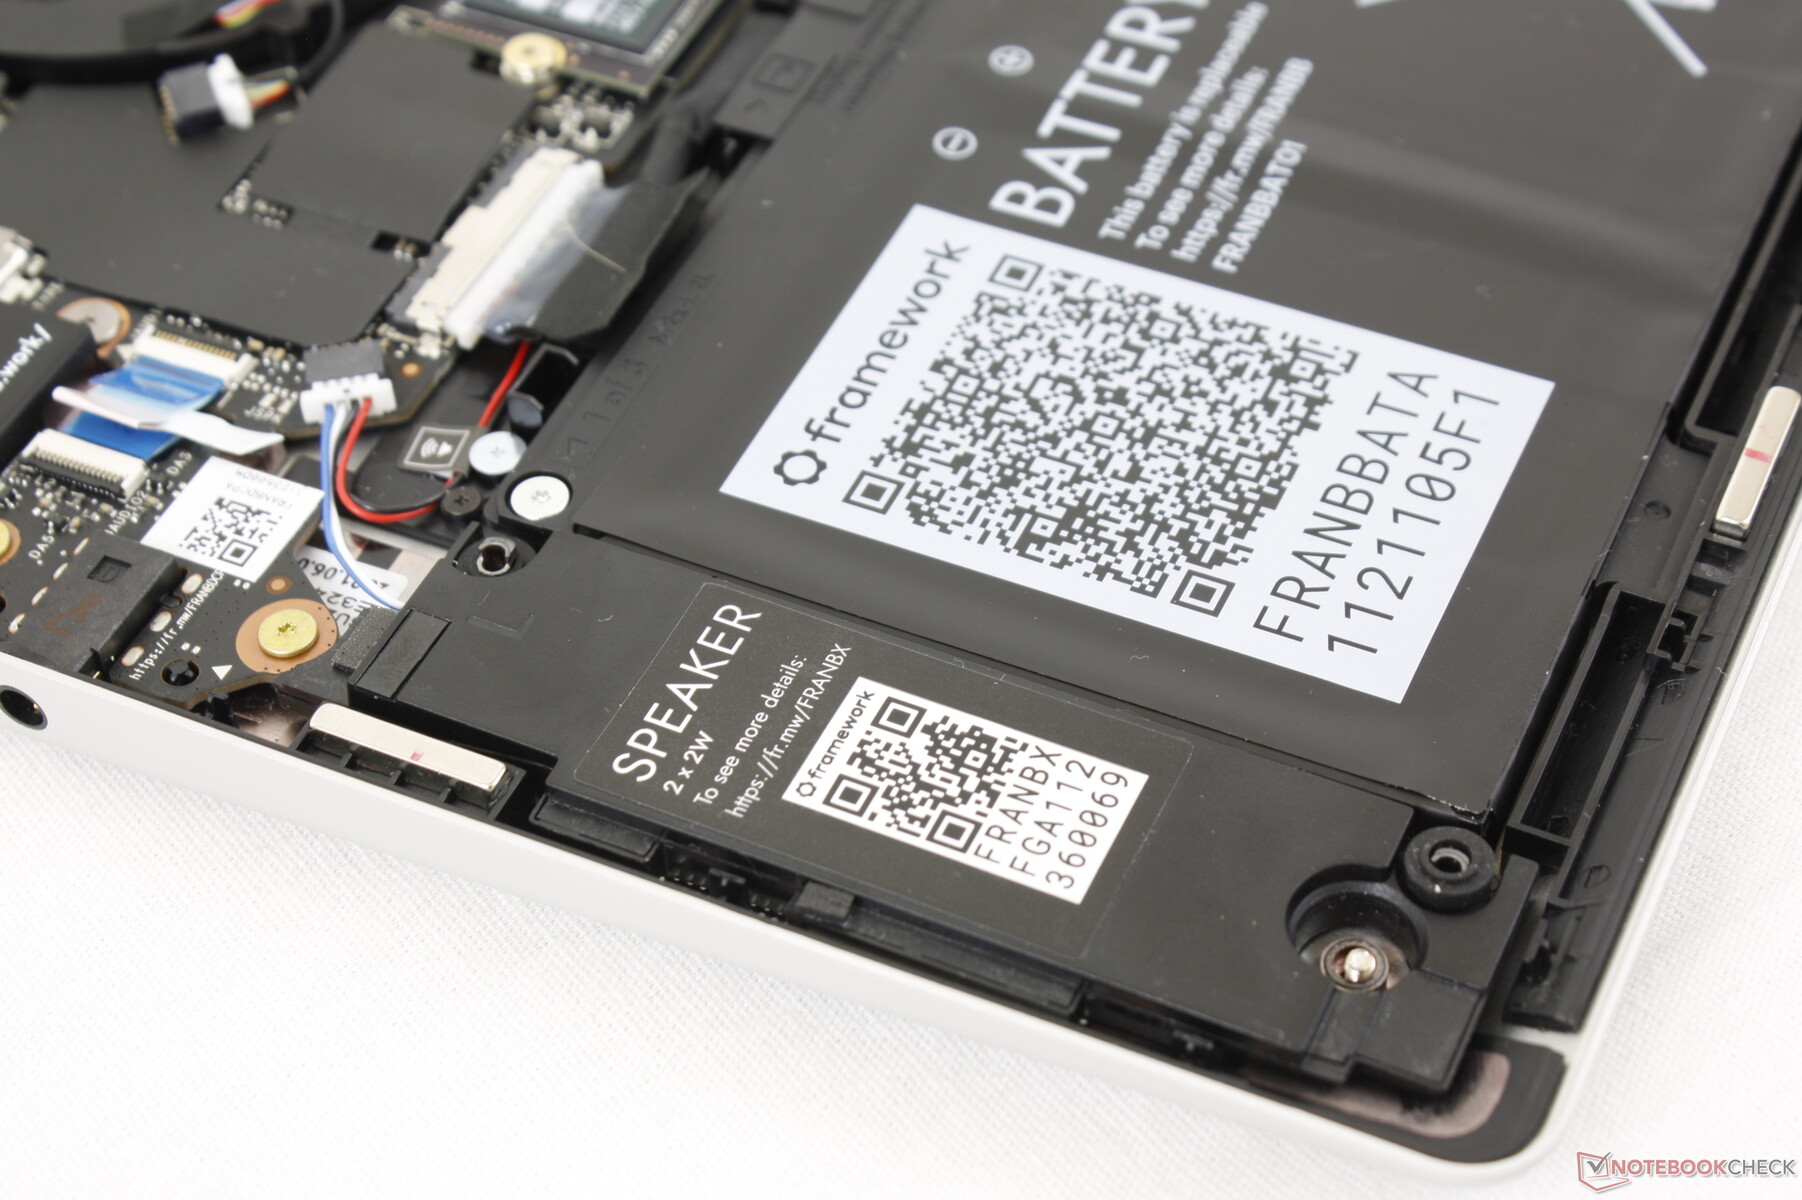
主板是倒置的,这与大多数其他笔记本电脑不同。因此,用户必须卸下键盘板而不是底板,才能进行任何升级。幸运的是,只要用户有一把T5 Torx扳手,这个过程就很容易。
用户可以直接访问2个SODIMM插槽,1个M.2 PCIe 4 2280 SSD插槽,1个WLAN插槽,以及电池。
配件和保修
该DIY套件包括一个Torx扳手、带有Windows驱动程序的U盘,以及用于HDMI、MicroSD、USB-C、USB-A和mini DisplayPort的几个扩展卡适配器。
适用标准的一年有限制造商保修。
输入设备
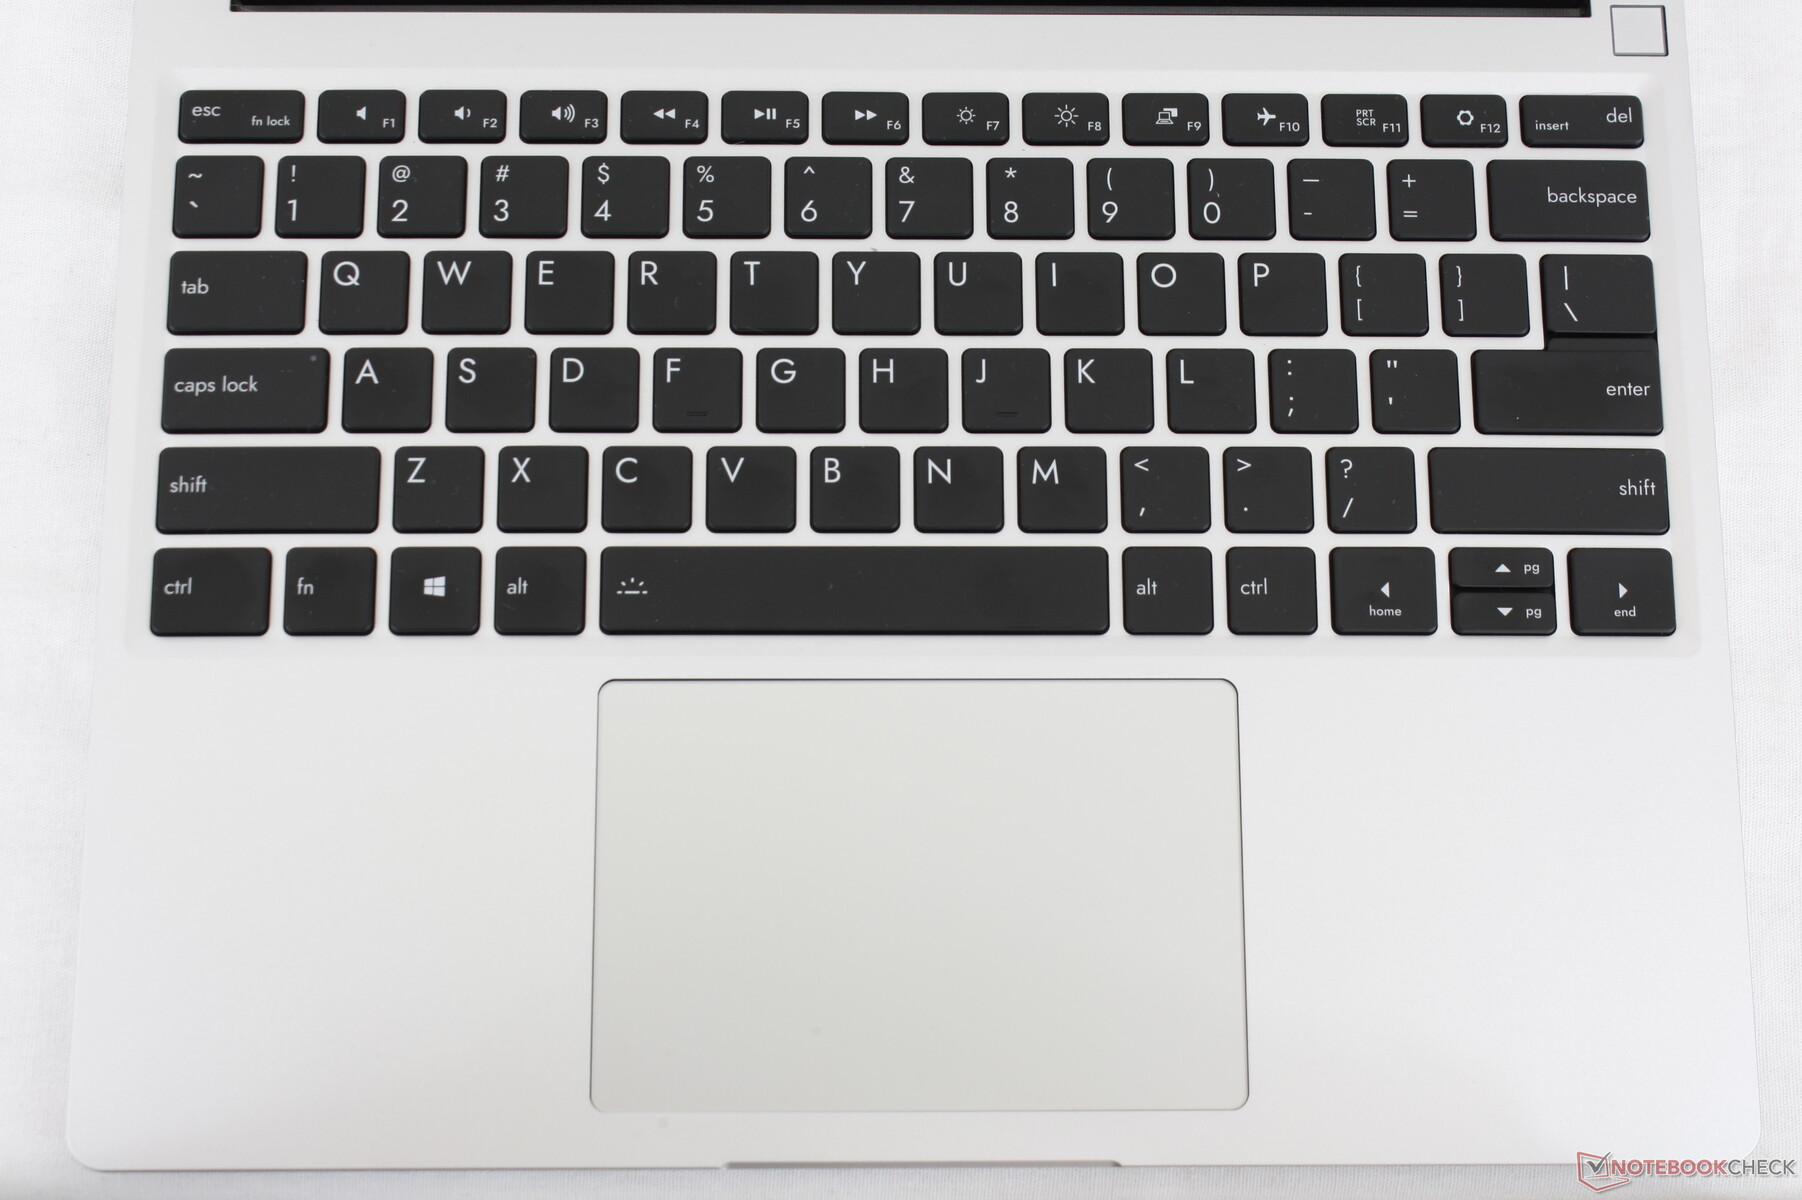
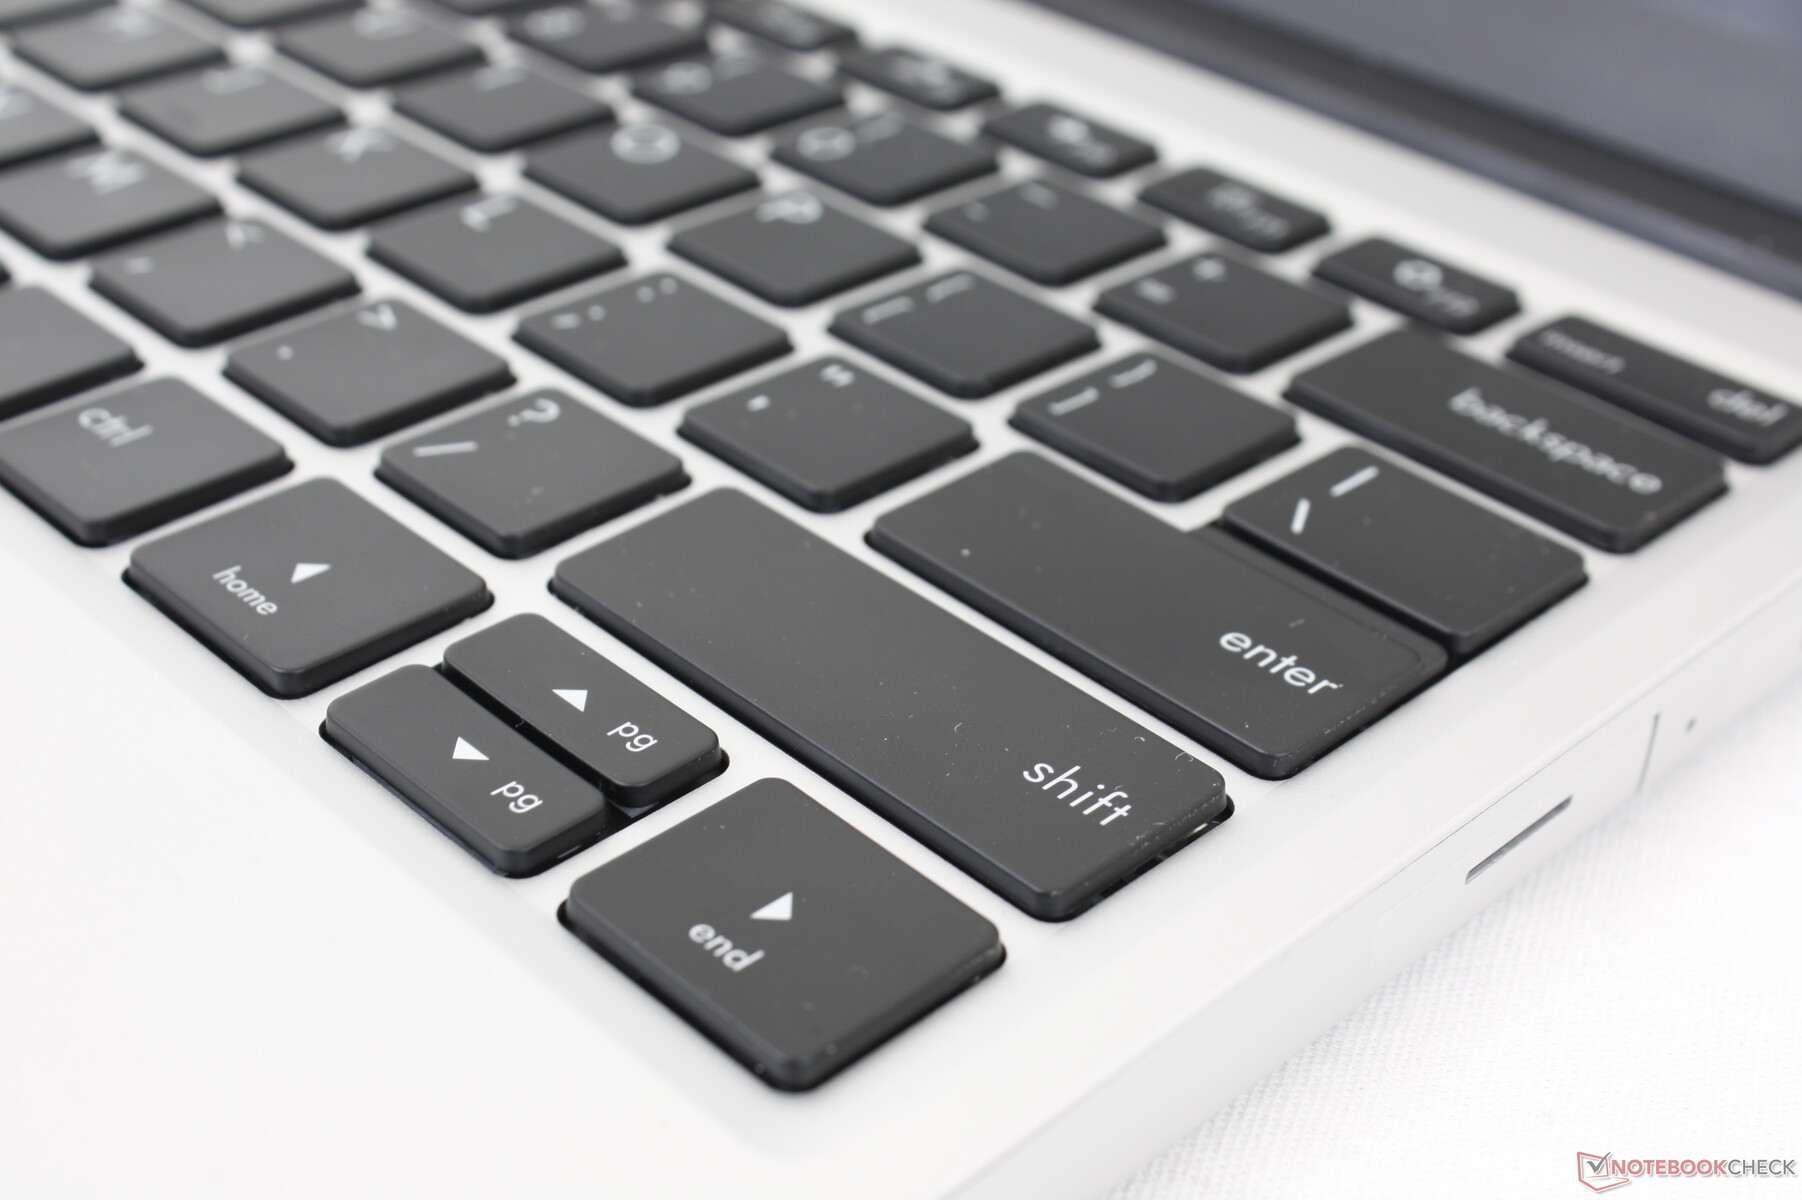
键盘
键盘反馈与惠普在其EliteBook或Spectre笔记本电脑上提供的接近,这两款笔记本电脑恰好拥有我们最喜欢的一些键盘。与华硕ZenBook等其他大多数超极本相比,反馈和行程都更硬,更深。
我们很希望看到专用的用户可编程或可定制的按键,这将很好地适应一个如此注重用户定制的笔记本电脑。
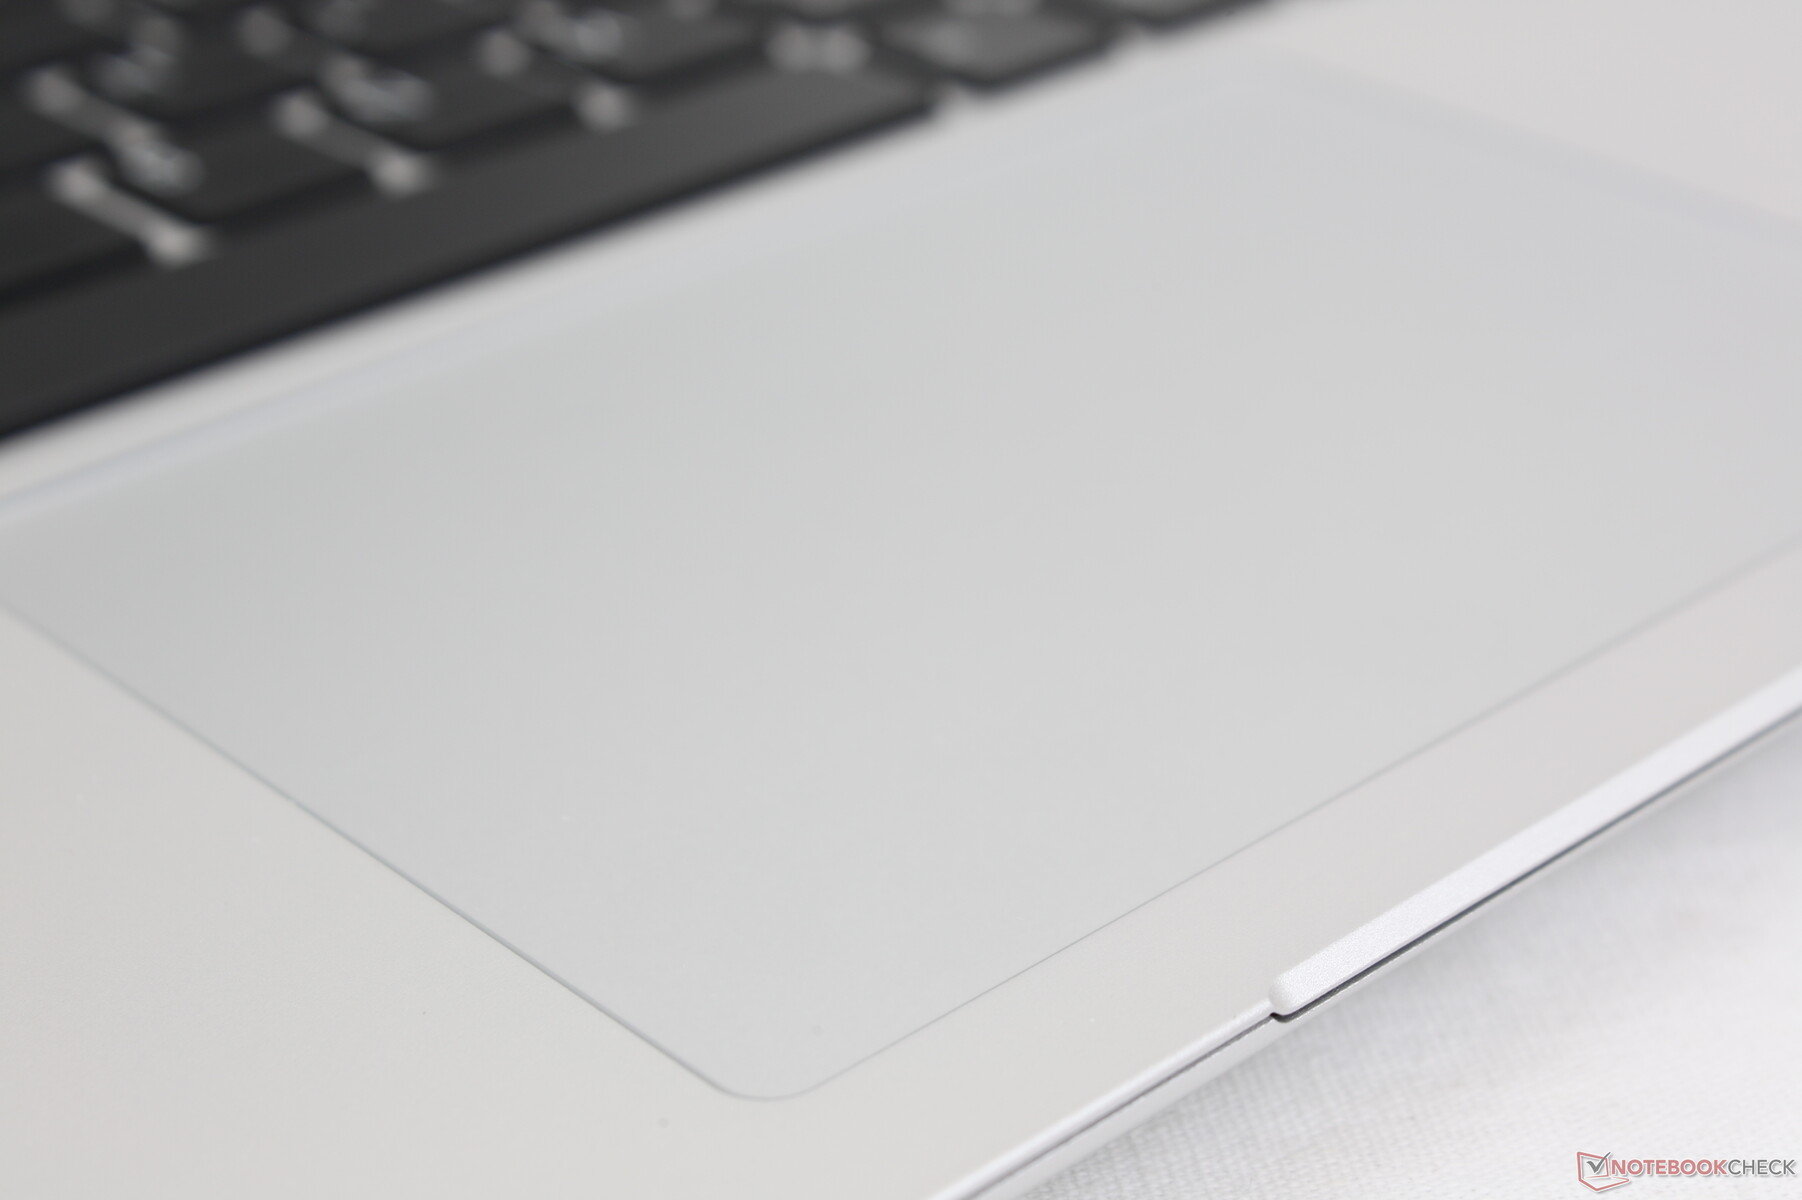
触摸板
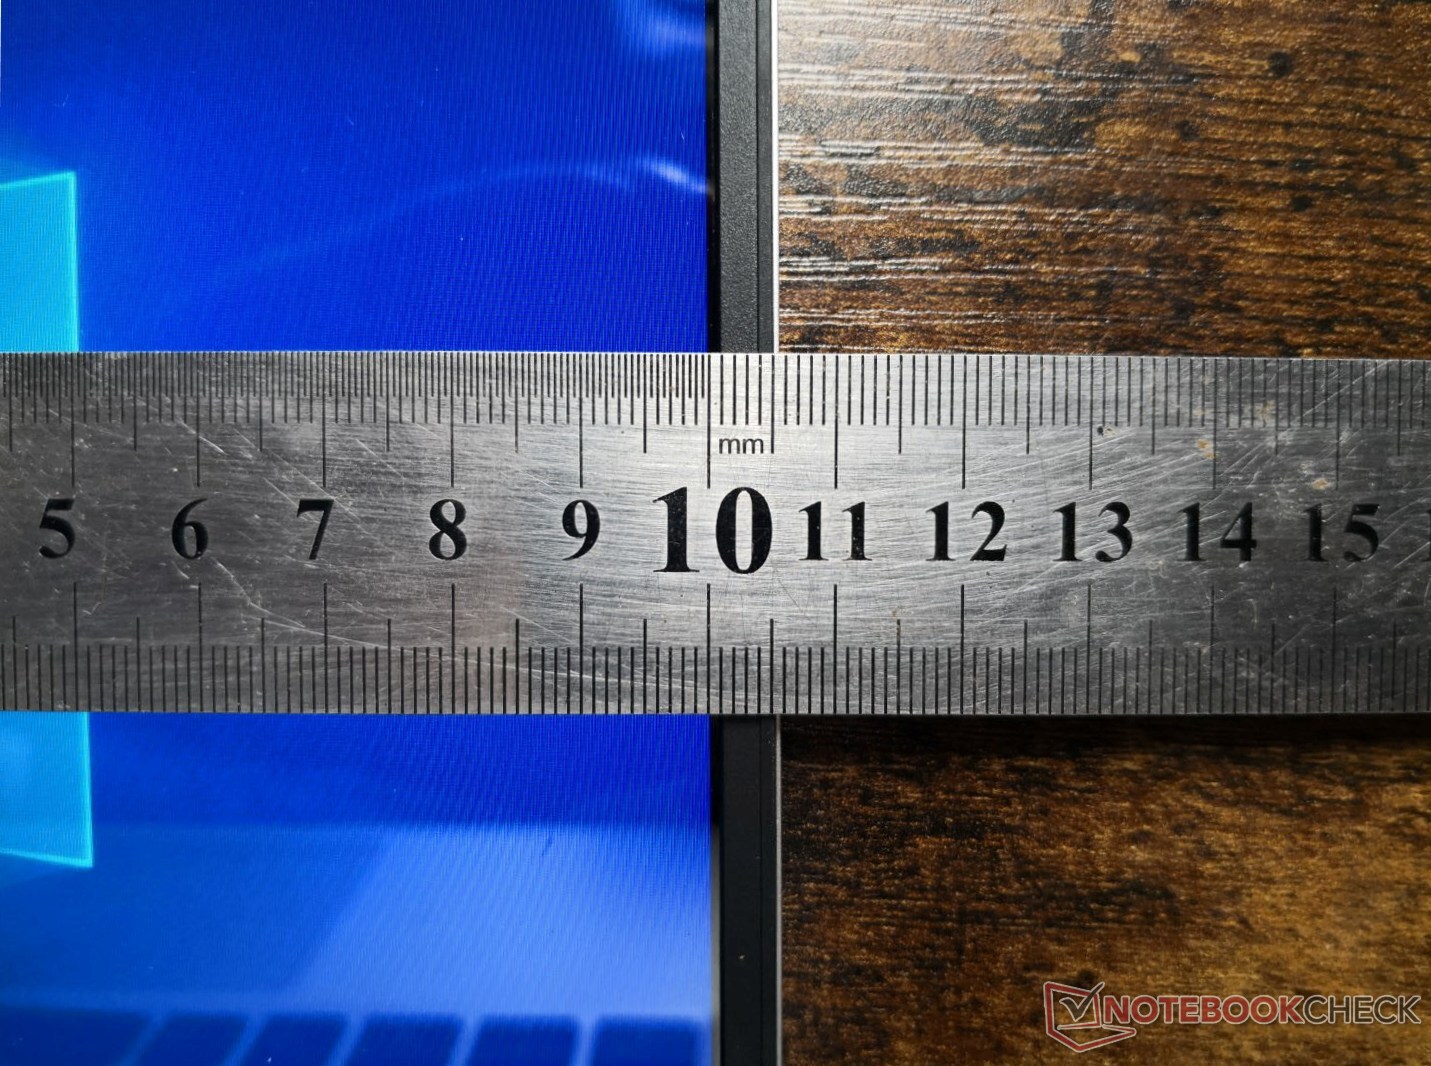
支持Precision ,点击板的大小与Surface Laptop 3上的点击板相同。 笔记本电脑3(11.5 x 7.6 cm)。然而,与微软的型号不同,Framework的点击板在按下时声音更大,反馈也略微柔和。

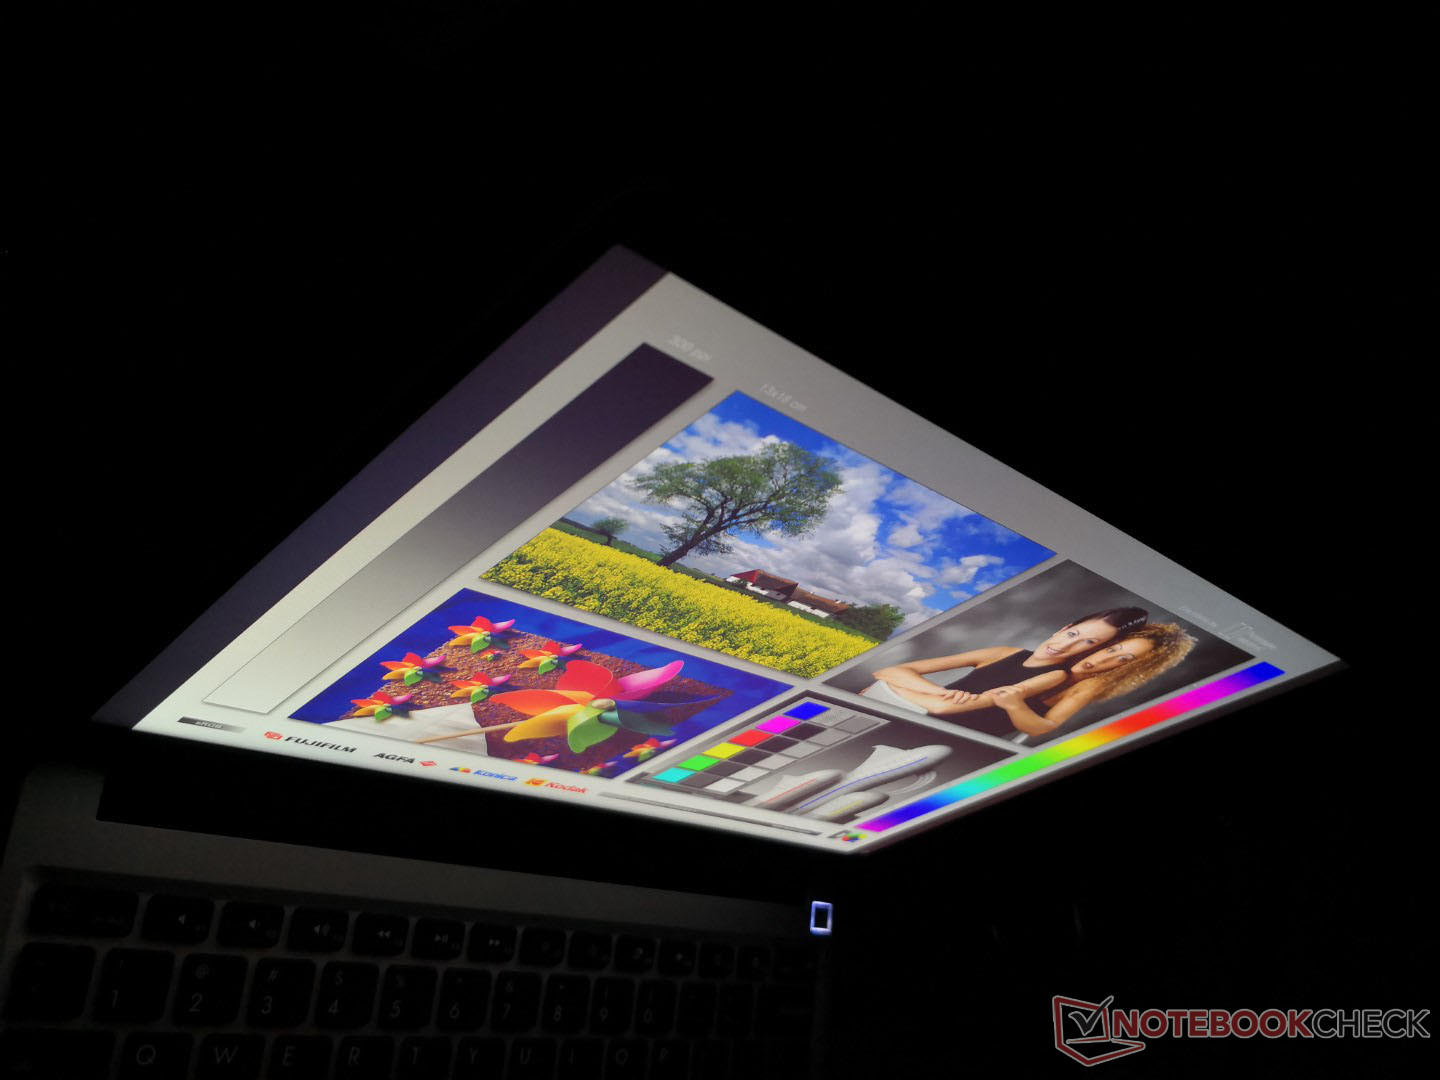
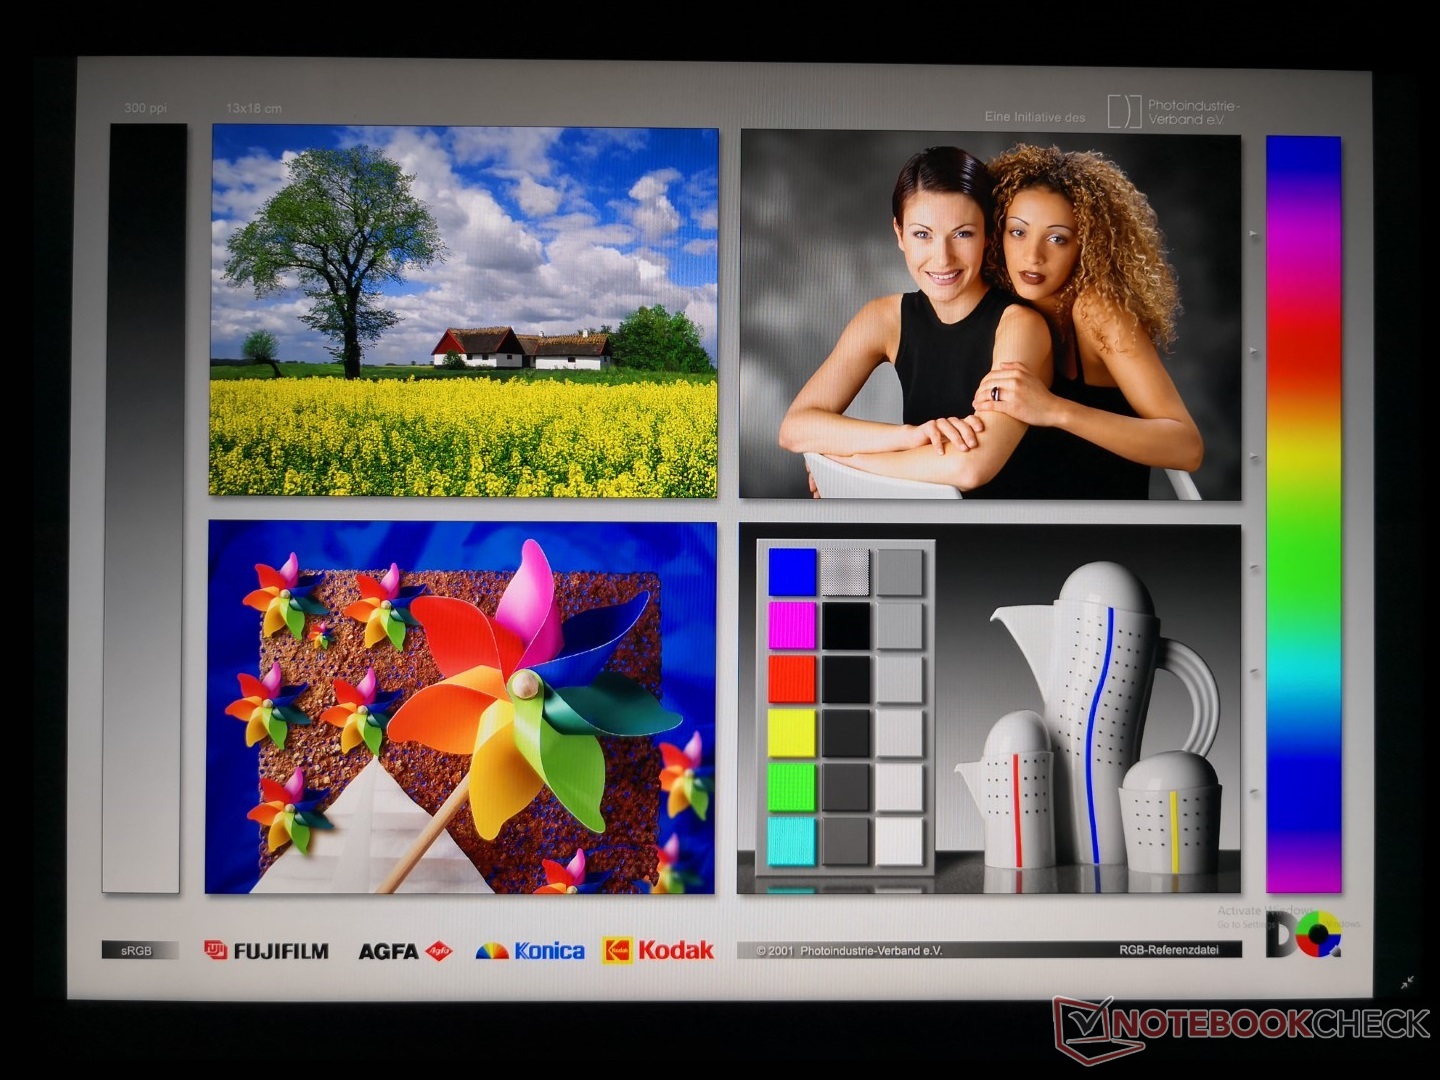
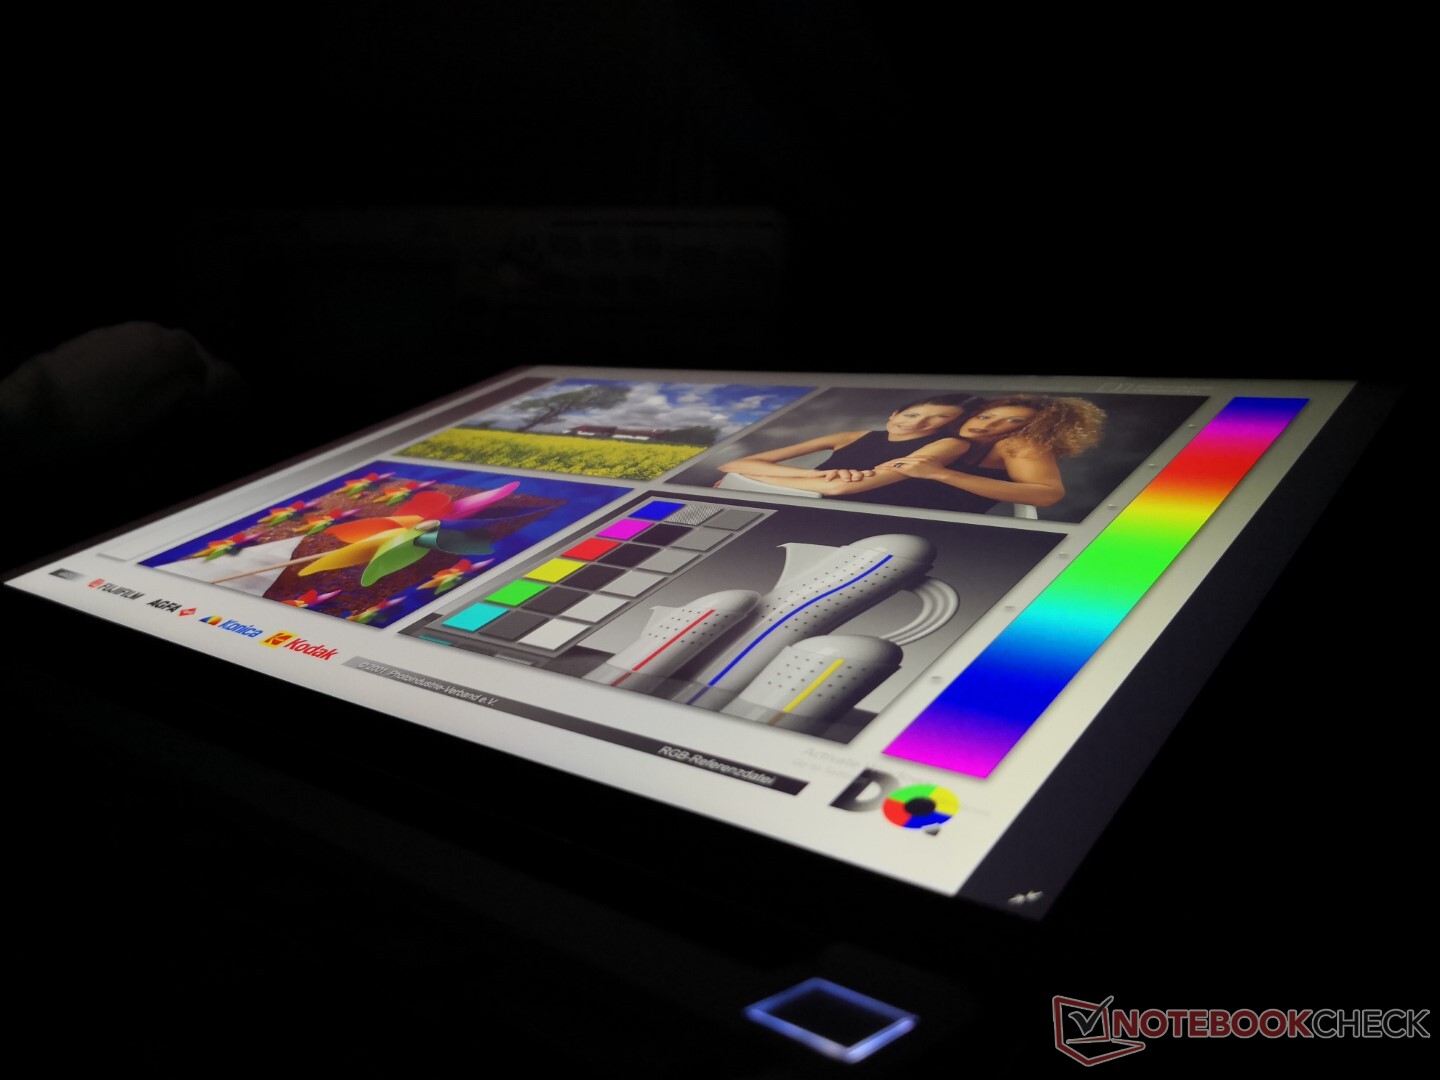
显示
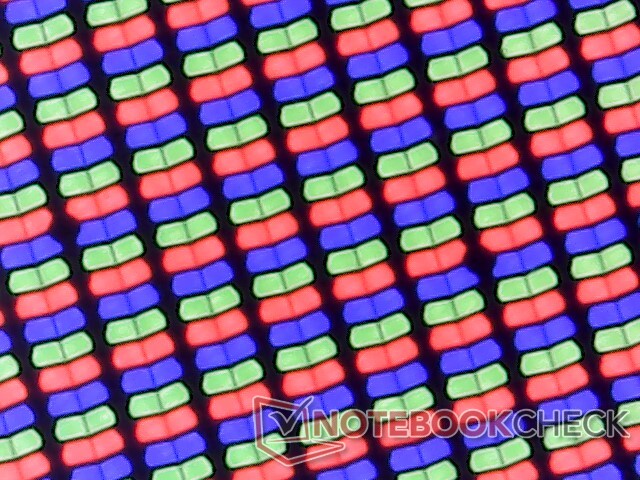
框架使用完全相同的13.5英寸京东方NE135FBM-N41 IPS面板的笔记本电脑,因为发现在 Acer Swift 3 SF313.因此,这两款机型有着相似的特点,包括宽广的色彩覆盖和相对较高的对比度。然而,响应时间很慢,这意味着用户在游戏时将经历很多重影和模糊。否则,对于办公室类型的工作负荷来说,缓慢的响应时间不是一个问题。
| |||||||||||||||||||||||||
Brightness Distribution: 93 %
Center on Battery: 449 cd/m²
Contrast: 1151:1 (Black: 0.39 cd/m²)
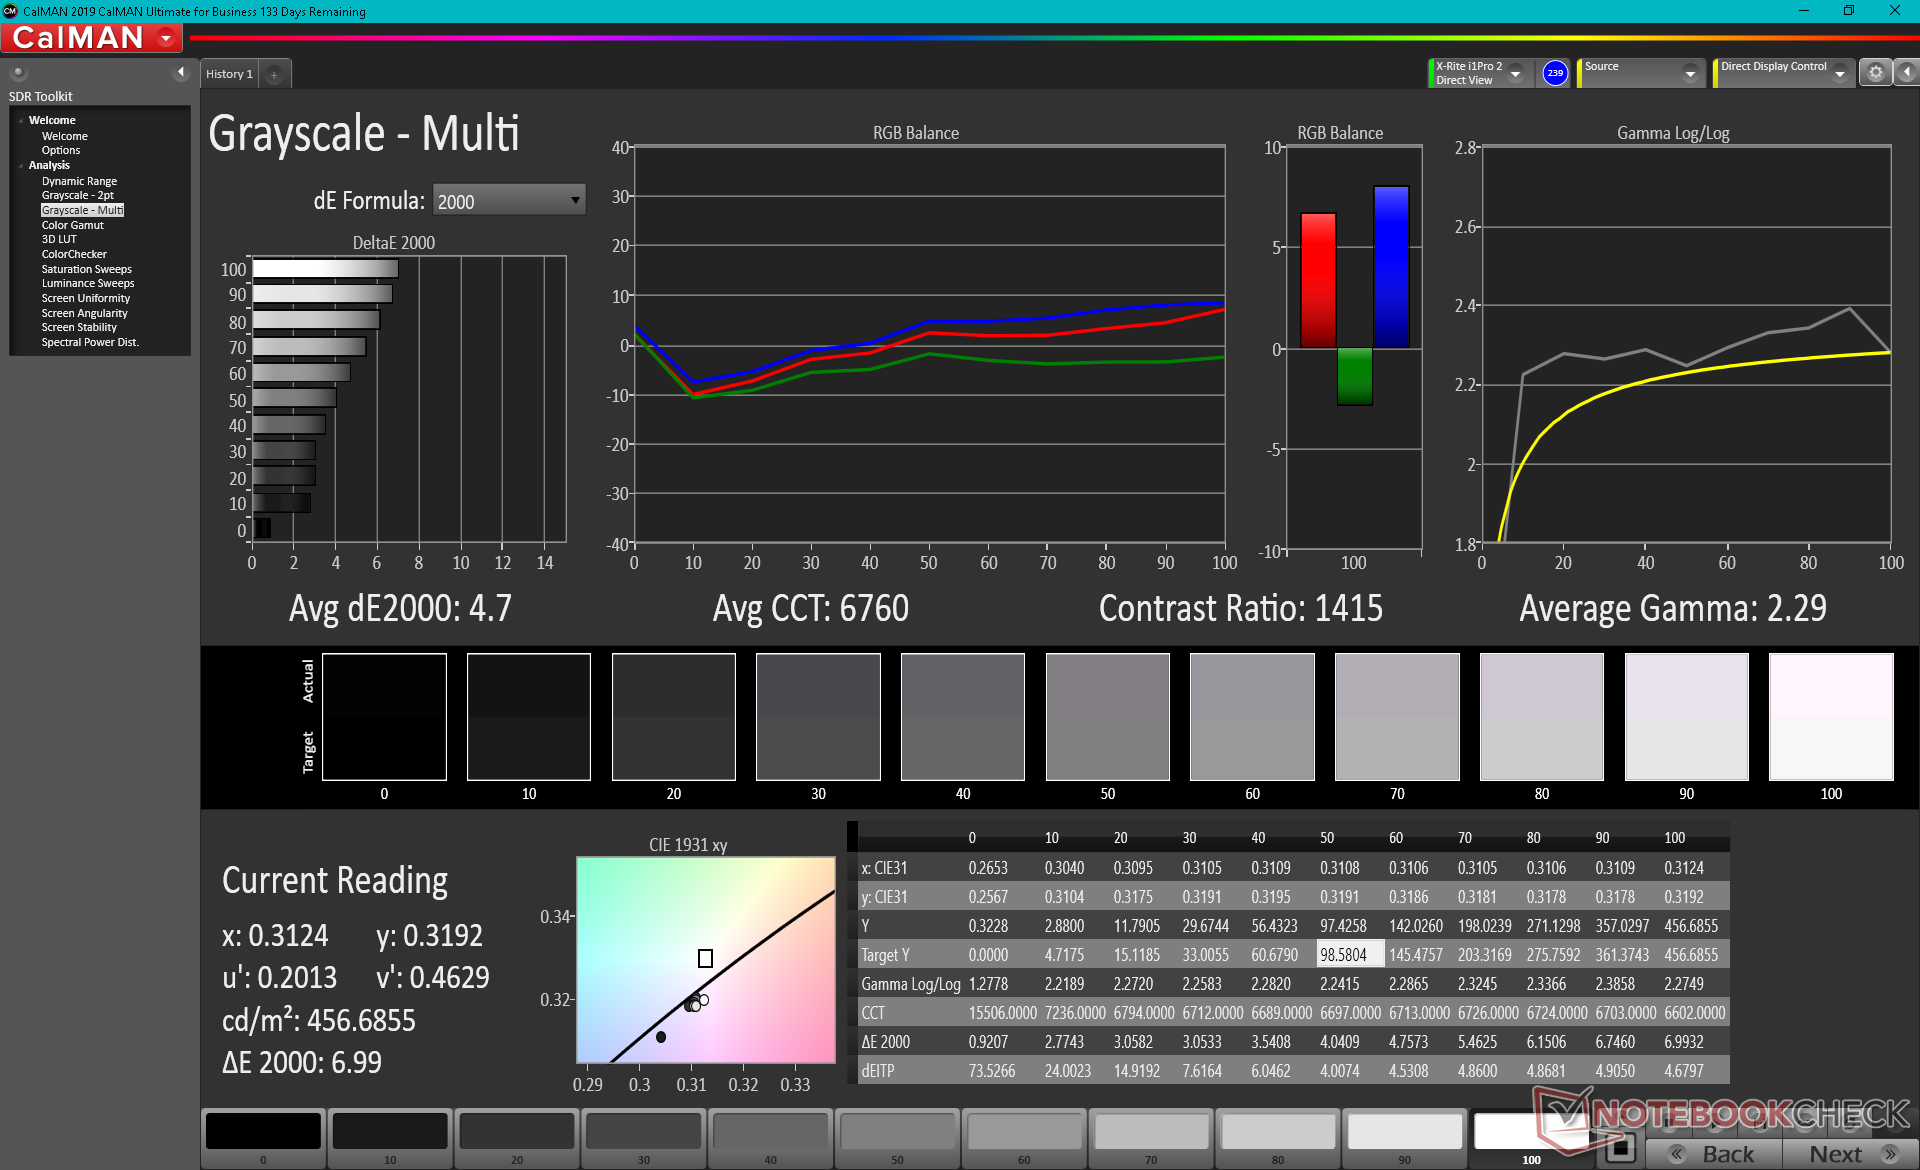
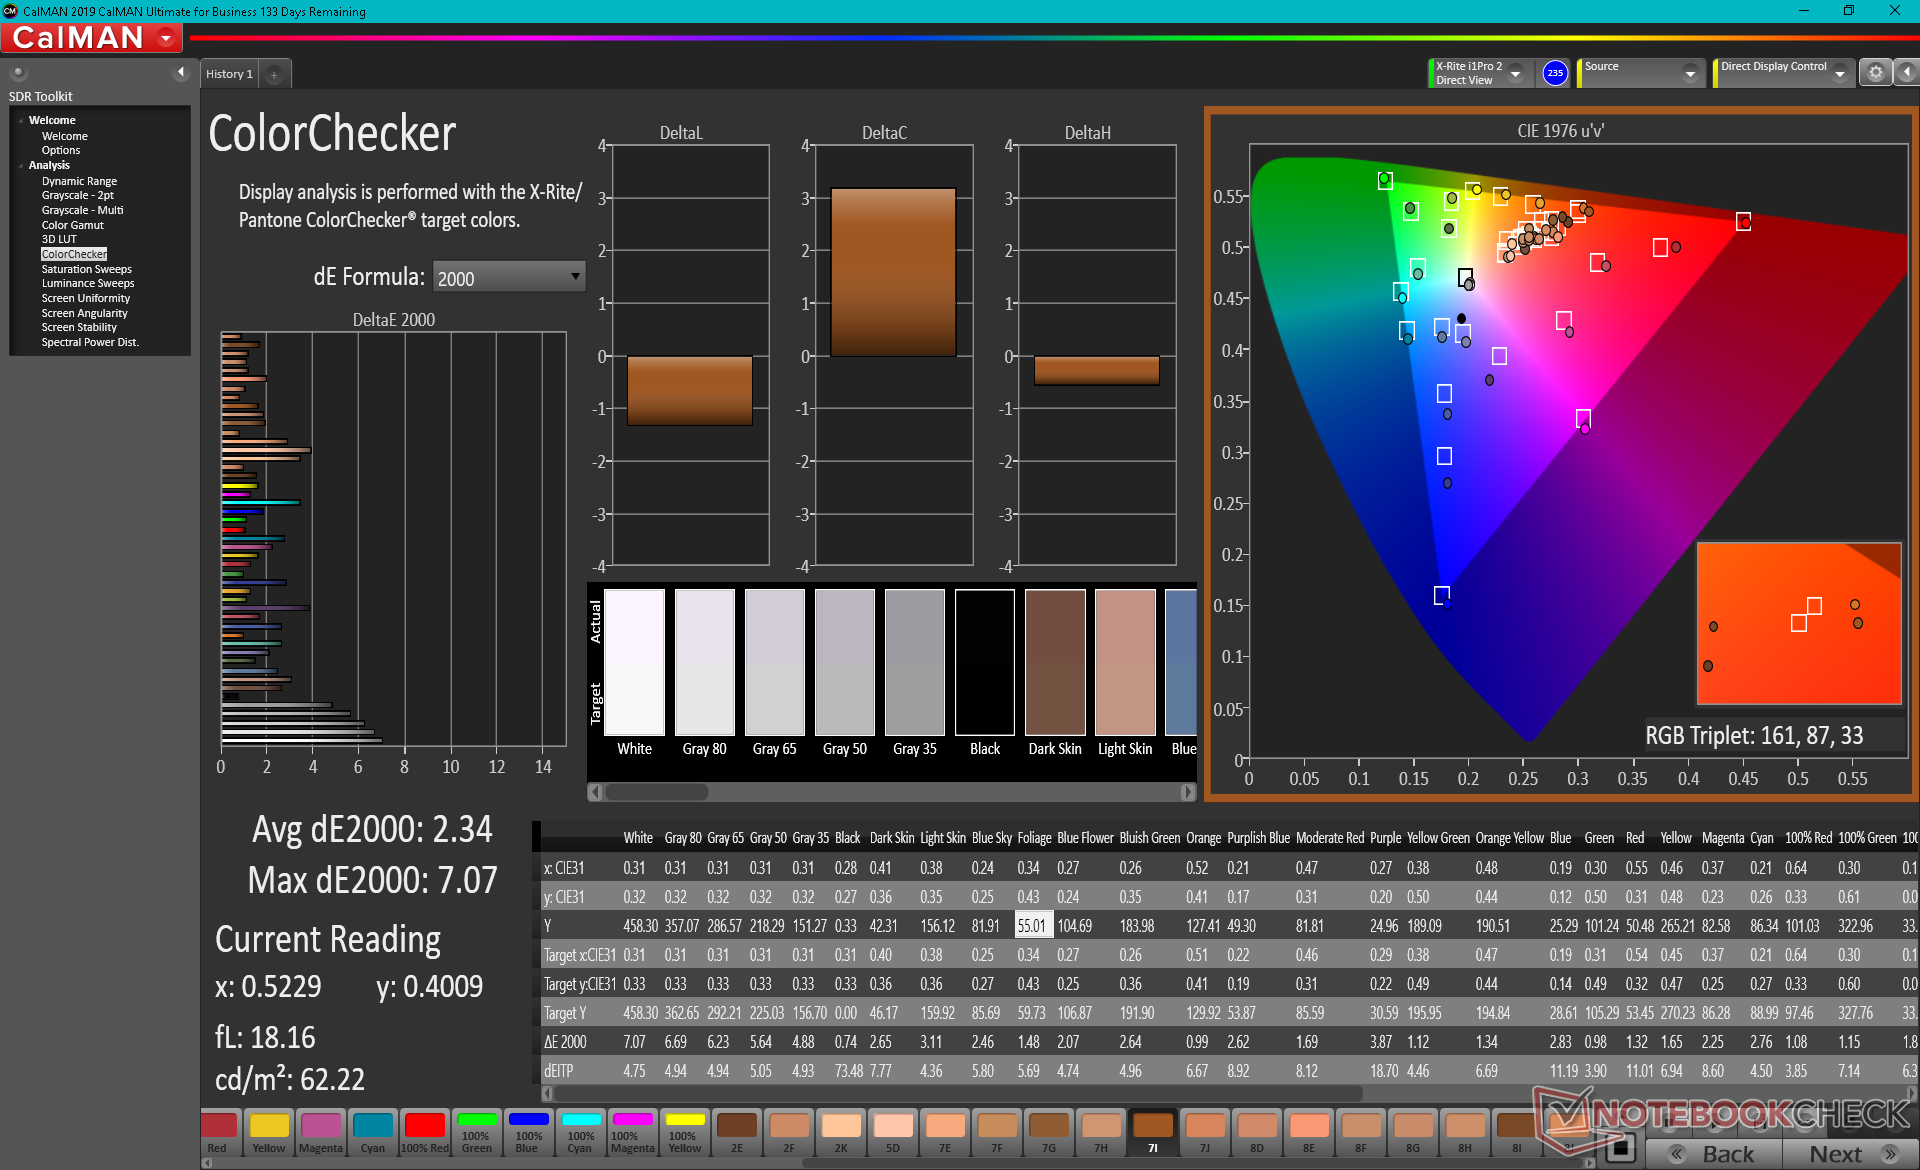
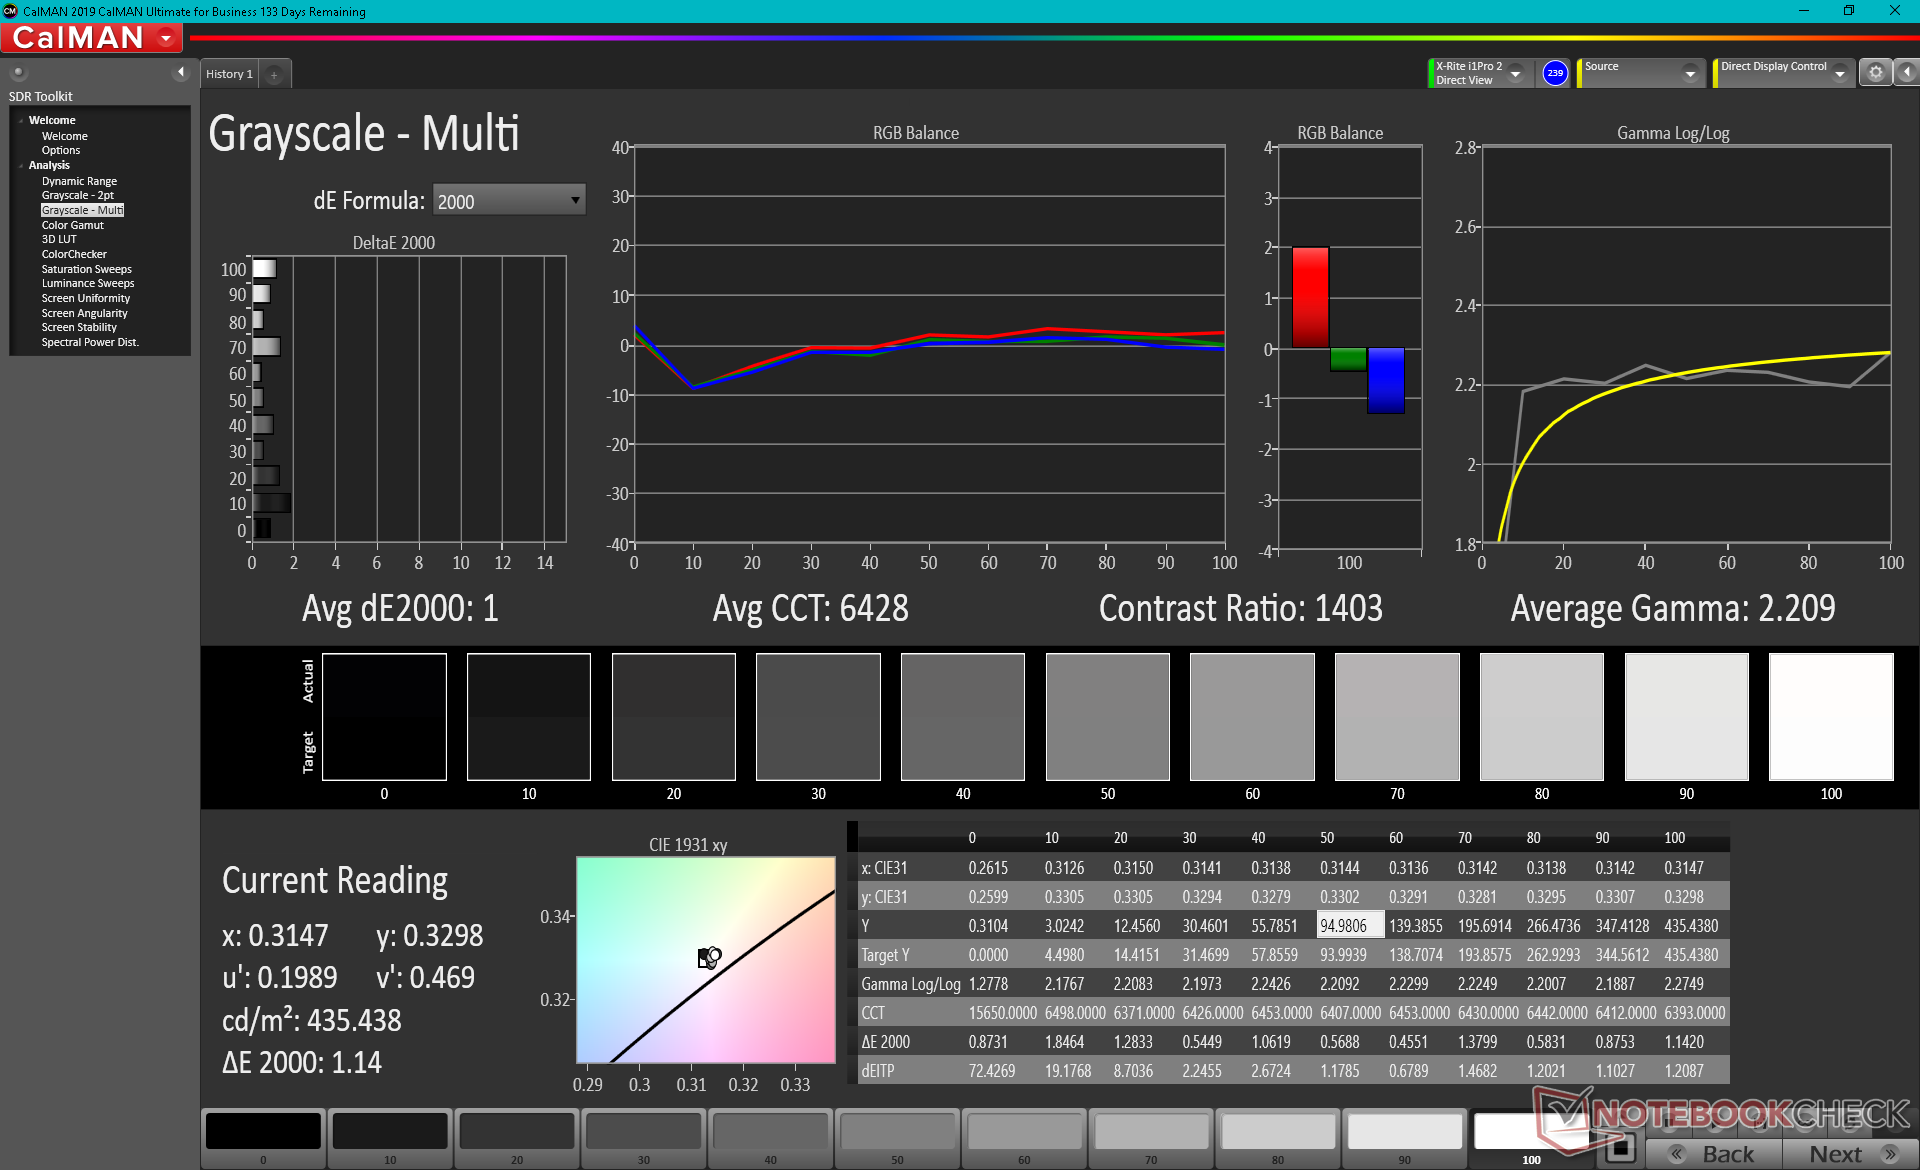
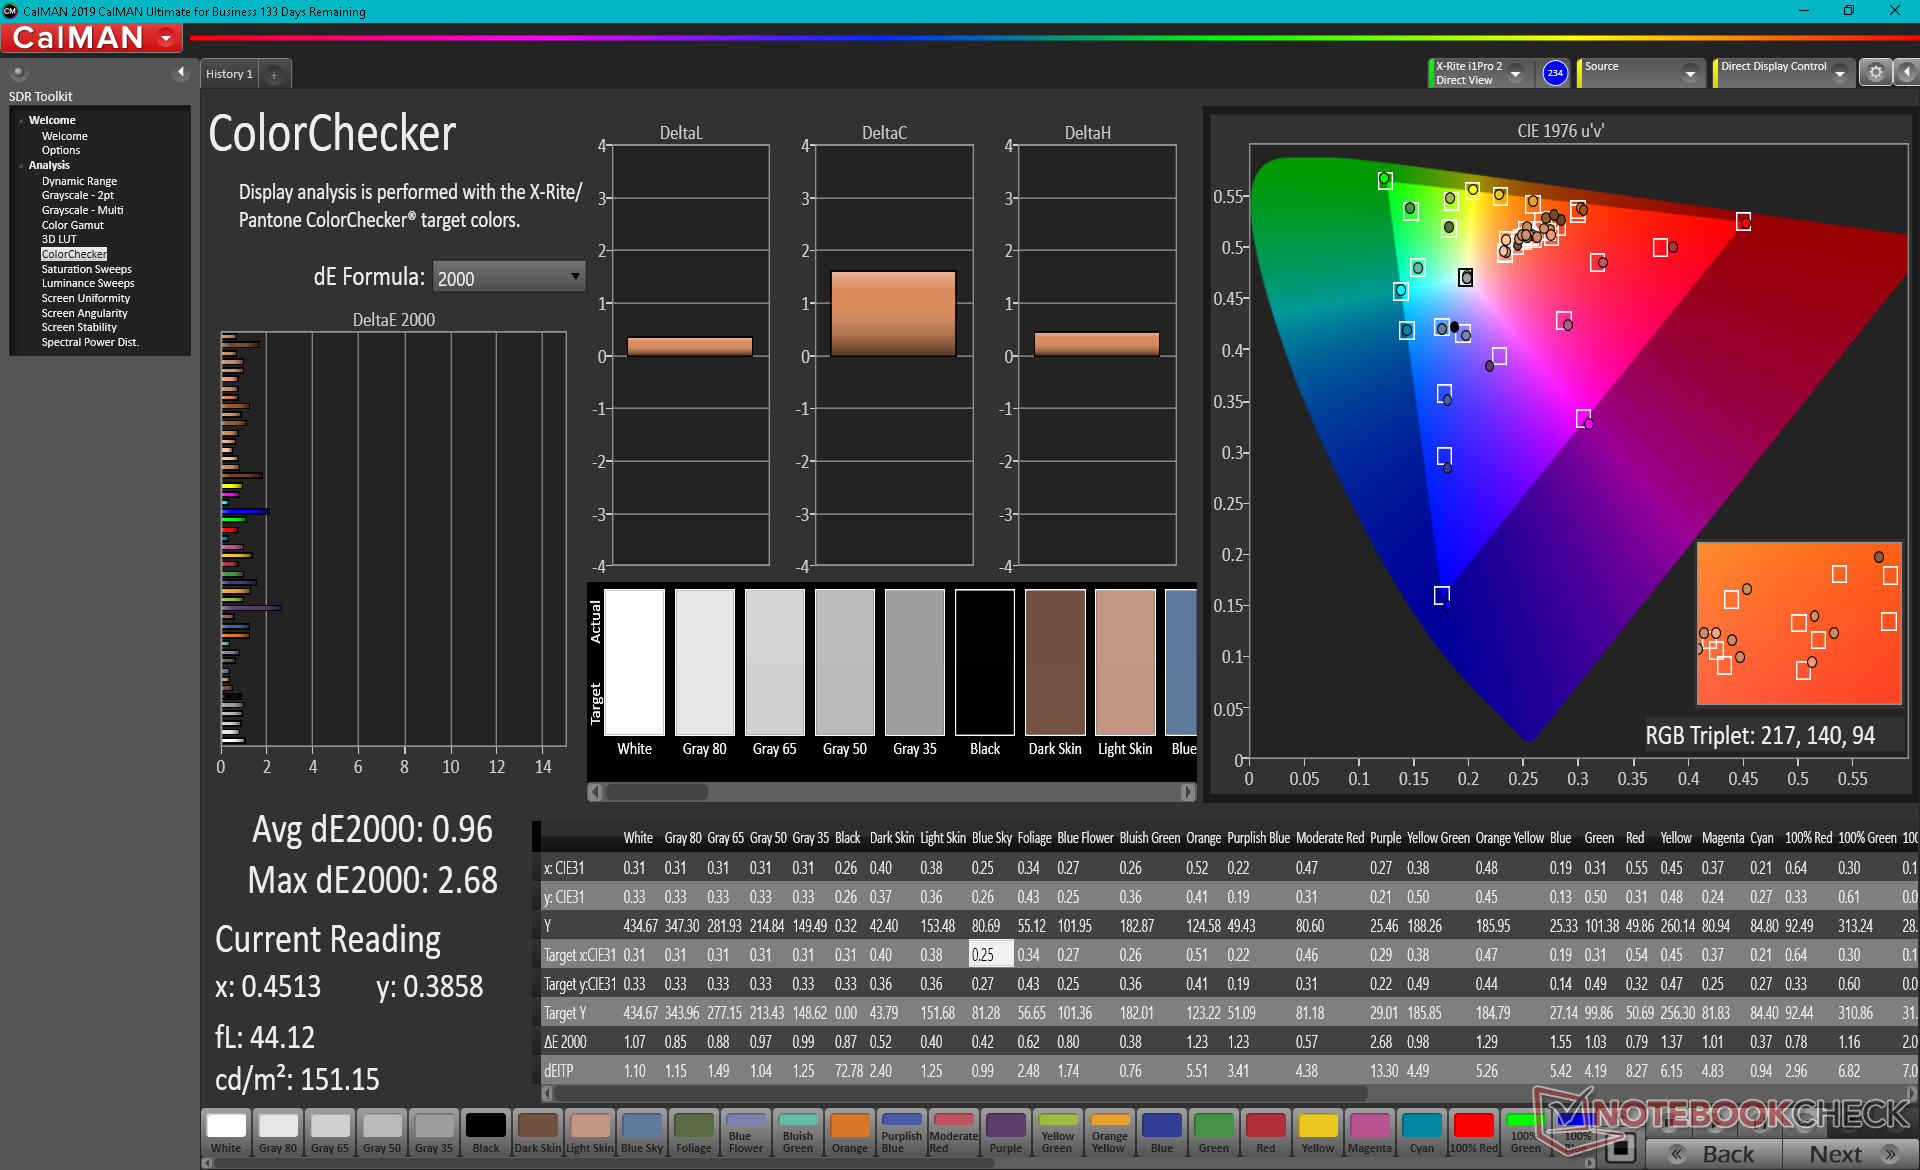
ΔE ColorChecker Calman: 2.34 | ∀{0.5-29.43 Ø4.71}
calibrated: 0.96
ΔE Greyscale Calman: 4.7 | ∀{0.09-98 Ø4.96}
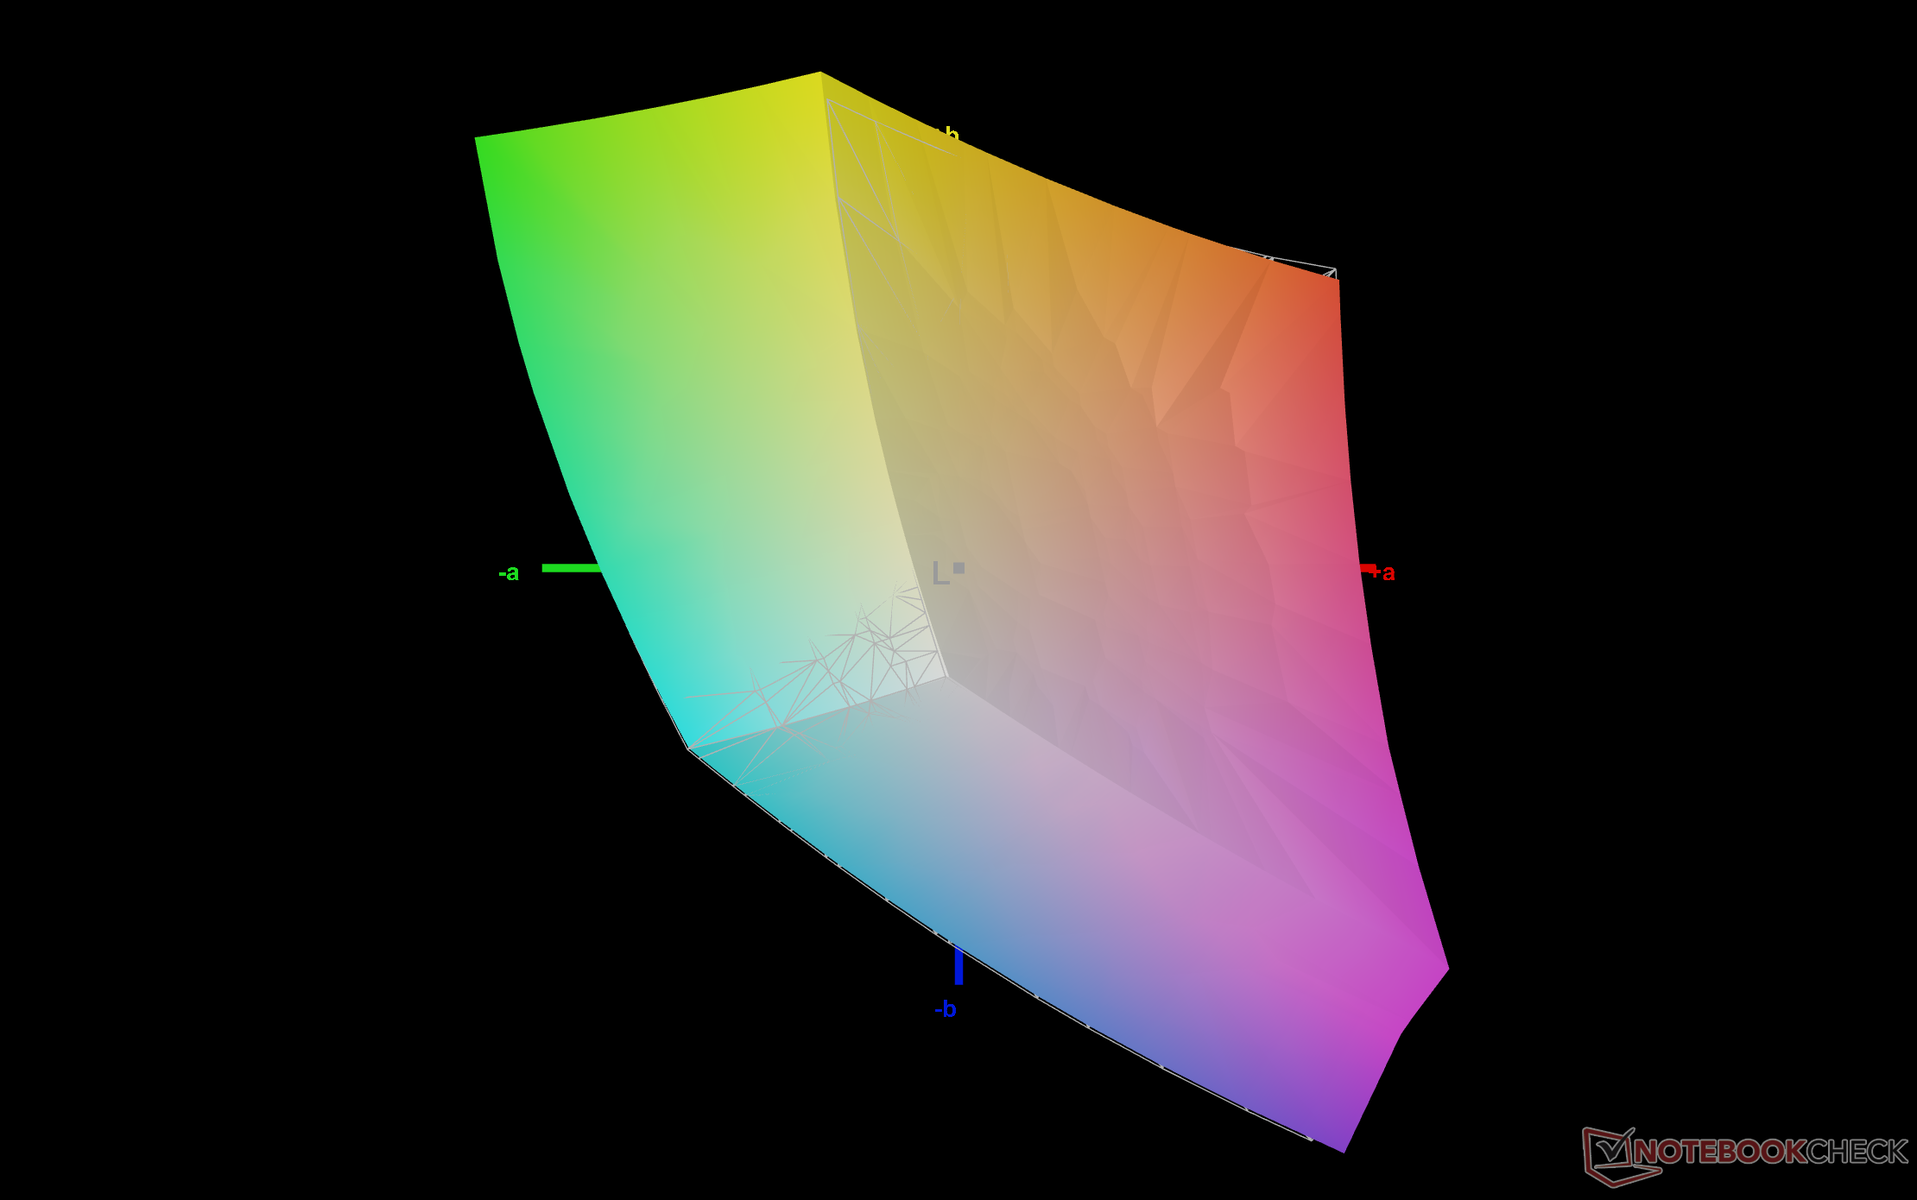
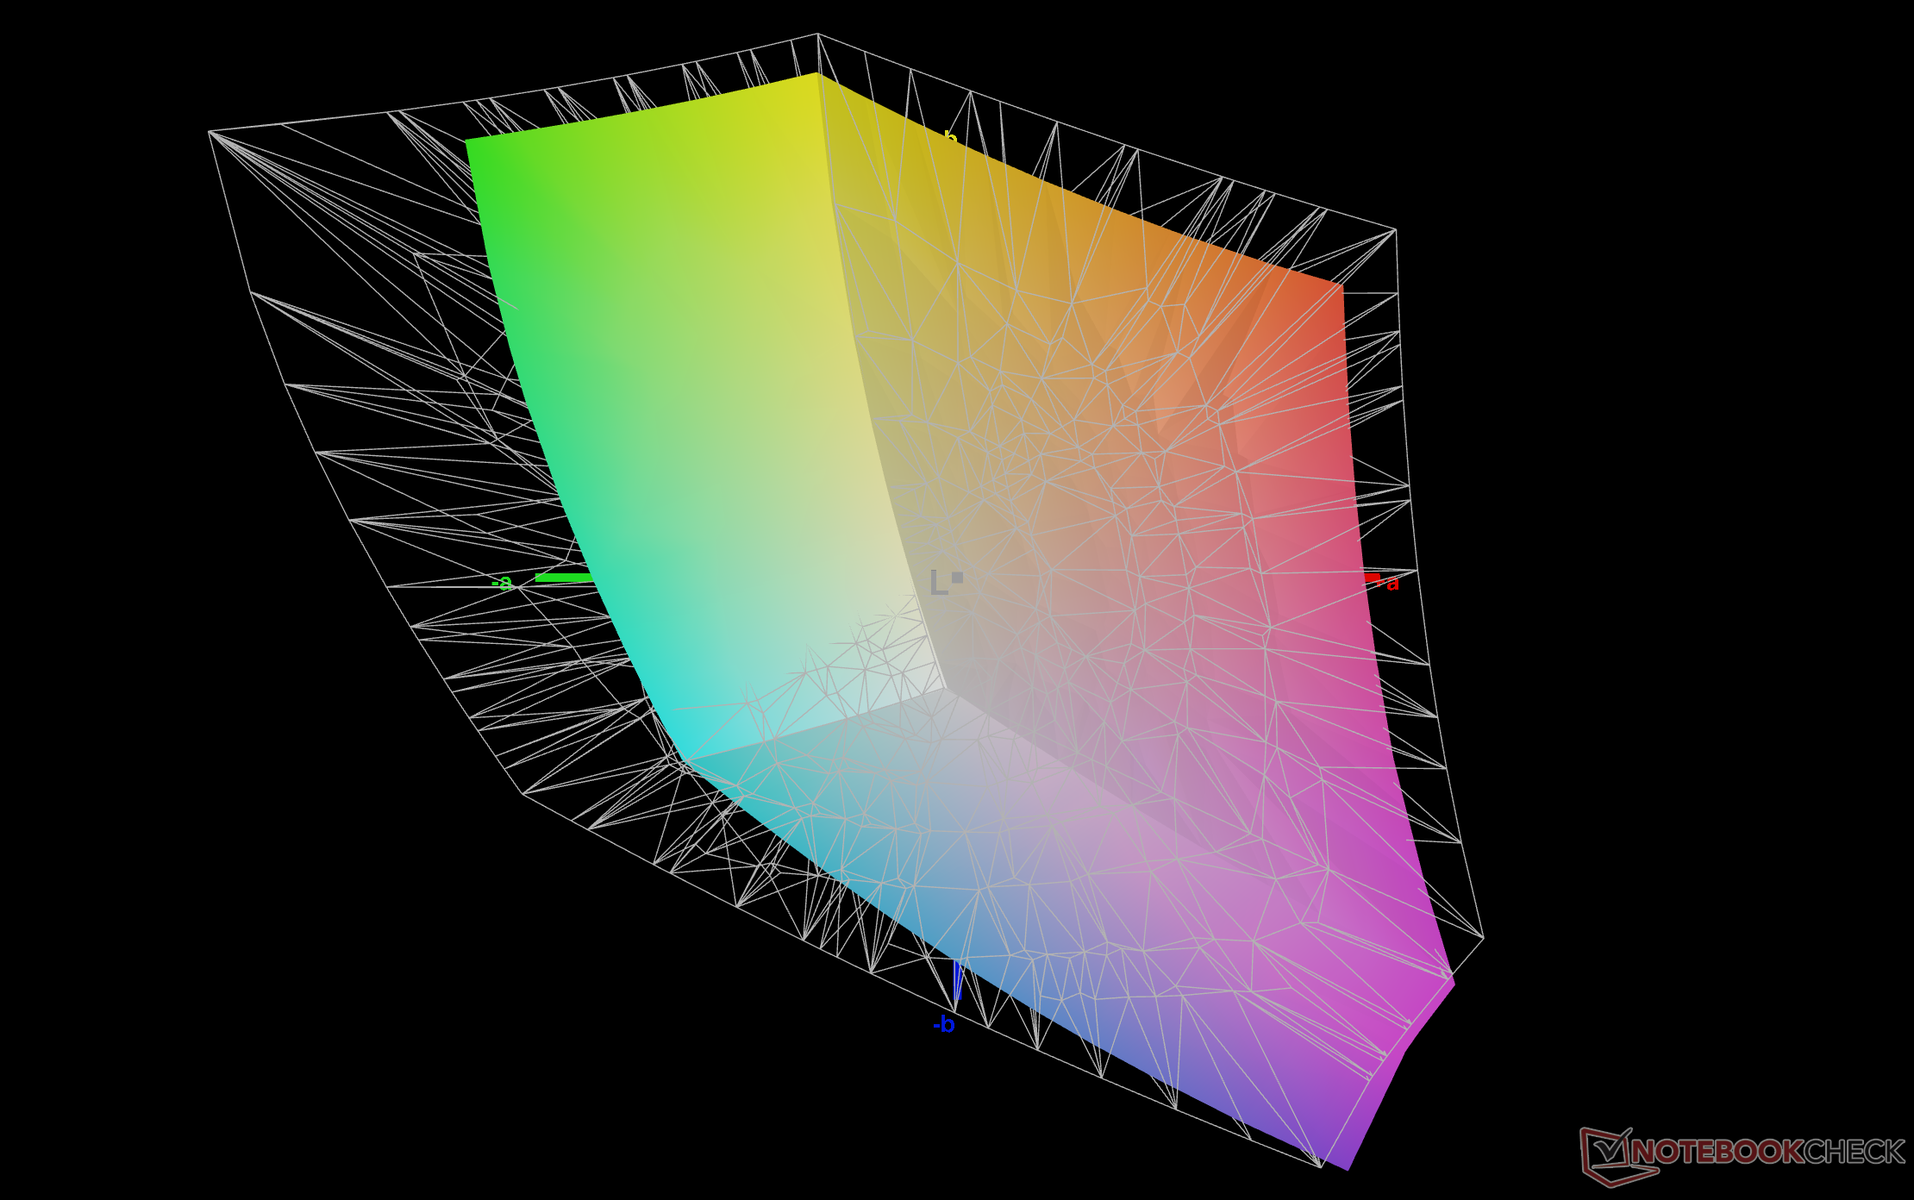
70.3% AdobeRGB 1998 (Argyll 3D)
99.3% sRGB (Argyll 3D)
69% Display P3 (Argyll 3D)
Gamma: 2.29
CCT: 6760 K
| Framework Laptop 13.5 BOE CQ NE135FBM-N41, IPS, 13.5", 2256x1504 | HP Spectre x360 14-ea0378ng Samsung SDC4148, OLED, 13.5", 3000x2000 | Microsoft Surface Laptop 4 13 i7 LQ135P1JX51, IPS, 13.5", 2256x1504 | Lenovo ThinkPad X1 Titanium Yoga G1 20QA001RGE LPM135M467, IPS, 13.5", 2256x1504 | HP ProBook x360 435 G8 R7-5800U AUO4B2D, IPS, 13.3", 1920x1080 | Lenovo Yoga 6 13 82ND0009US AU Optronics B133HAN05.F, IPS, 13.3", 1920x1080 | |
|---|---|---|---|---|---|---|
| Display | 28% | -4% | -41% | 1% | ||
| Display P3 Coverage (%) | 69 | 99.9 45% | 64.7 -6% | 40.1 -42% | 69.7 1% | |
| sRGB Coverage (%) | 99.3 | 100 1% | 97.2 -2% | 59.9 -40% | 99.2 0% | |
| AdobeRGB 1998 Coverage (%) | 70.3 | 96.1 37% | 66.9 -5% | 41.4 -41% | 71.4 2% | |
| Response Times | 95% | -12% | 19% | 17% | 18% | |
| Response Time Grey 50% / Grey 80% * (ms) | 55.6 ? | 2 ? 96% | 62.8 ? -13% | 53.6 ? 4% | 42.8 ? 23% | 46.8 ? 16% |
| Response Time Black / White * (ms) | 36 ? | 2 ? 94% | 39.8 ? -11% | 24 ? 33% | 32 ? 11% | 28.8 ? 20% |
| PWM Frequency (Hz) | 250 ? | 21930 ? | ||||
| Screen | 346% | 10% | 27% | -62% | -12% | |
| Brightness middle (cd/m²) | 449 | 370 -18% | 413 -8% | 466 4% | 304 -32% | 291.5 -35% |
| Brightness (cd/m²) | 435 | 374 -14% | 400 -8% | 454 4% | 292 -33% | 294 -32% |
| Brightness Distribution (%) | 93 | 90 -3% | 94 1% | 94 1% | 89 -4% | 93 0% |
| Black Level * (cd/m²) | 0.39 | 0.01 97% | 0.29 26% | 0.23 41% | 0.23 41% | 0.19 51% |
| Contrast (:1) | 1151 | 37000 3115% | 1424 24% | 2026 76% | 1322 15% | 1534 33% |
| Colorchecker dE 2000 * | 2.34 | 2.57 -10% | 2.8 -20% | 2.1 10% | 5 -114% | 3.83 -64% |
| Colorchecker dE 2000 max. * | 7.07 | 4.52 36% | 7.2 -2% | 4.5 36% | 17.7 -150% | 8.43 -19% |
| Colorchecker dE 2000 calibrated * | 0.96 | 2.31 -141% | 0.8 17% | 4.2 -338% | 1.07 -11% | |
| Greyscale dE 2000 * | 4.7 | 2.2 53% | 1.9 60% | 2.7 43% | 2.1 55% | 6.2 -32% |
| Gamma | 2.29 96% | 2.36 93% | 2.12 104% | 2.08 106% | 2.03 108% | 2.2 100% |
| CCT | 6760 96% | 6154 106% | 6510 100% | 6210 105% | 6443 101% | 6469 100% |
| Color Space (Percent of AdobeRGB 1998) (%) | 85.8 | 61.6 | 61.1 | |||
| Color Space (Percent of sRGB) (%) | 100 | 97.2 | 94.9 | |||
| Total Average (Program / Settings) | 156% /
242% | -2% /
4% | 23% /
25% | -29% /
-46% | 2% /
-5% |
* ... smaller is better
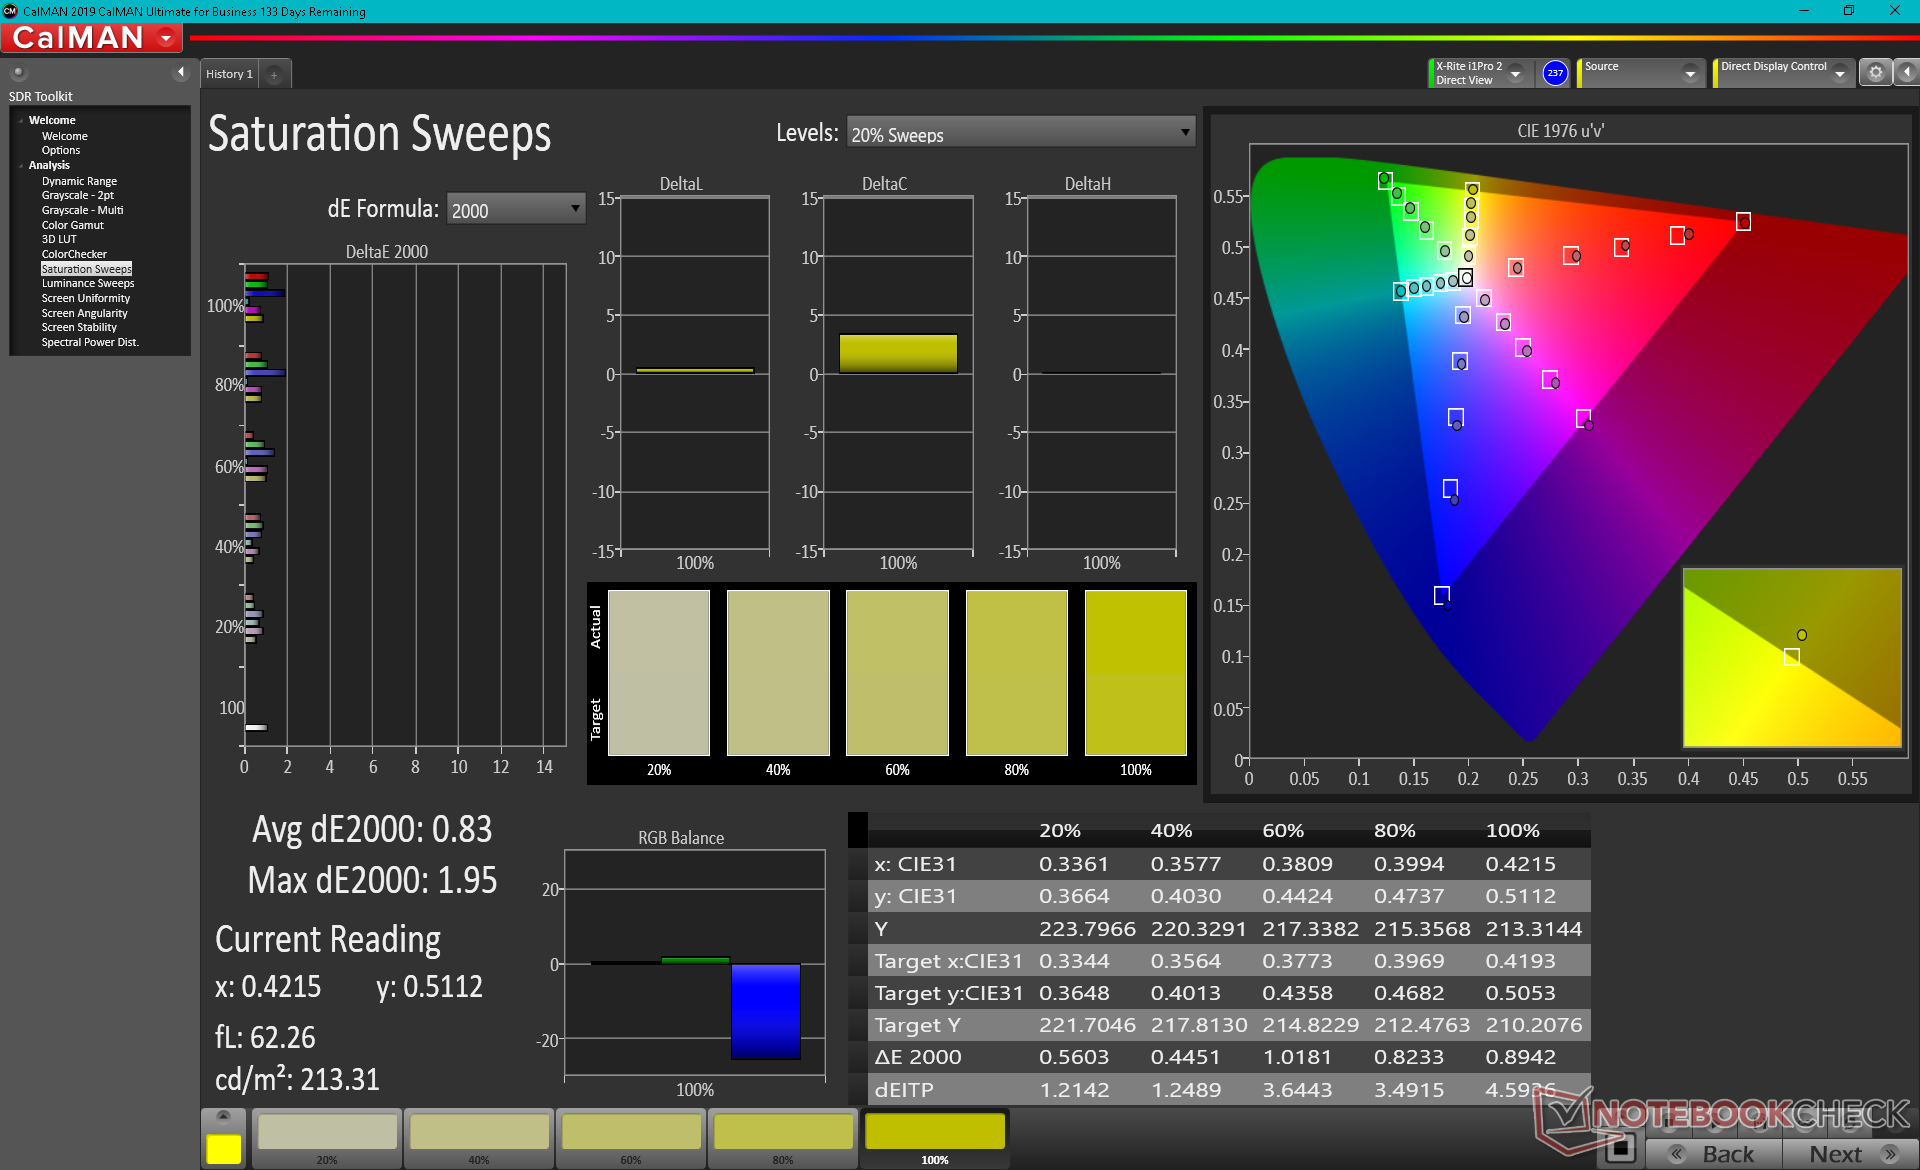
该面板完全覆盖了sRGB,与其他大多数中端到高端超极本一样。如果要完全覆盖P3,用户将不得不考虑使用某些4K或OLED面板的其他机型。
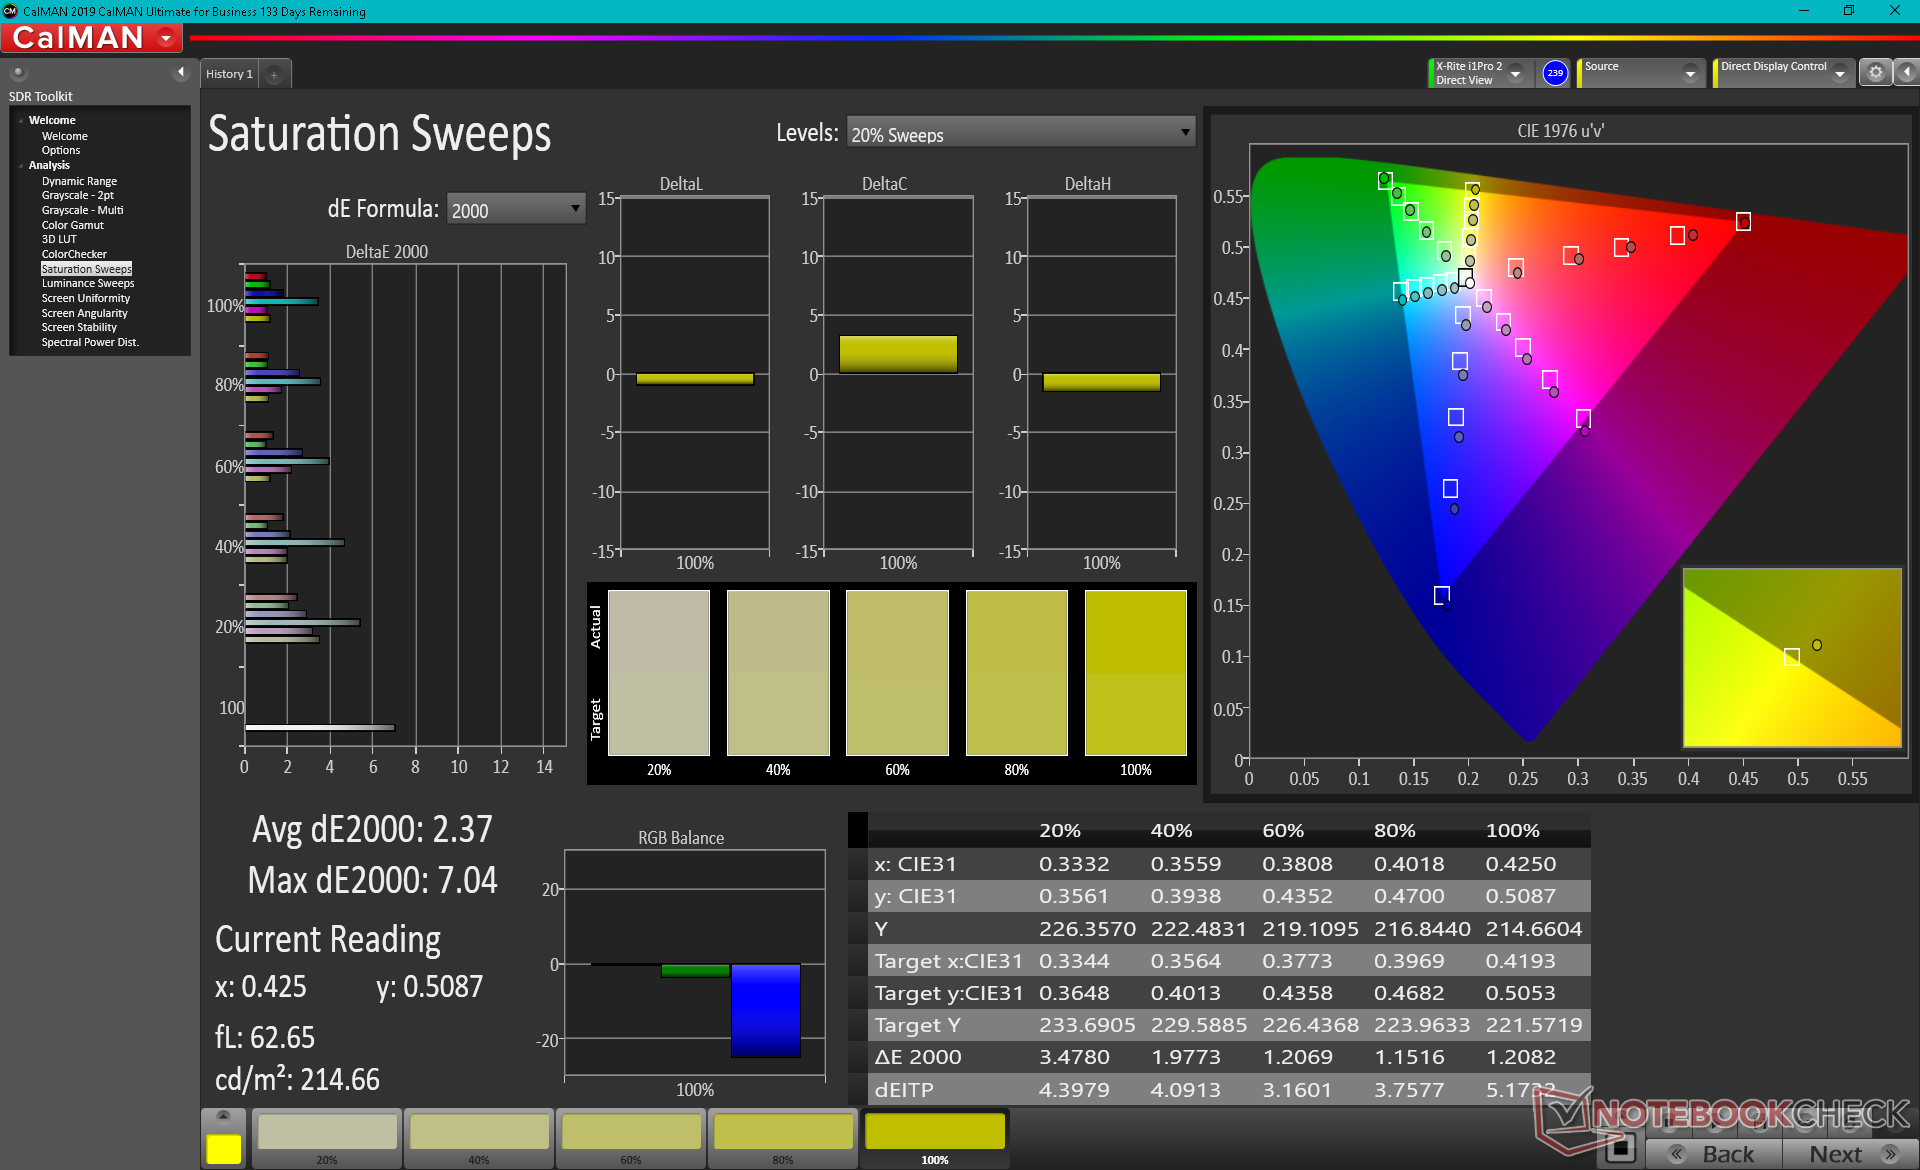
从我们的X-Rite色度计结果来看,制造商在出厂时并没有进行校准。一旦经过校准,平均灰度和色彩deltaE值将分别从4.7和2.34大幅提高到1.0和0.96。我们建议进行终端用户校准,以获得显示器的最大效益。另外,用户也可以应用我们上述校准的ICM配置文件。
Display Response Times
| ↔ Response Time Black to White | ||
|---|---|---|
| 36 ms ... rise ↗ and fall ↘ combined | ↗ 21.2 ms rise | 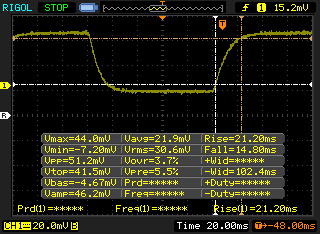 |
| ↘ 14.8 ms fall | ||
| The screen shows slow response rates in our tests and will be unsatisfactory for gamers. In comparison, all tested devices range from 0.1 (minimum) to 240 (maximum) ms. » 94 % of all devices are better. This means that the measured response time is worse than the average of all tested devices (19.8 ms). | ||
| ↔ Response Time 50% Grey to 80% Grey | ||
| 55.6 ms ... rise ↗ and fall ↘ combined | ↗ 27.2 ms rise | 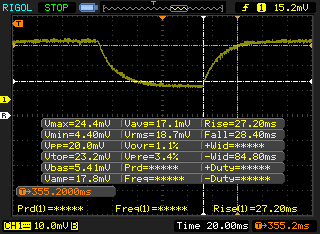 |
| ↘ 28.4 ms fall | ||
| The screen shows slow response rates in our tests and will be unsatisfactory for gamers. In comparison, all tested devices range from 0.165 (minimum) to 636 (maximum) ms. » 92 % of all devices are better. This means that the measured response time is worse than the average of all tested devices (31 ms). | ||
Screen Flickering / PWM (Pulse-Width Modulation)
| Screen flickering / PWM not detected | 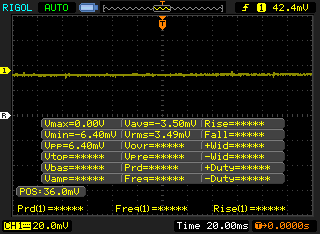 | ||
In comparison: 52 % of all tested devices do not use PWM to dim the display. If PWM was detected, an average of 7757 (minimum: 5 - maximum: 343500) Hz was measured. | |||
业绩
处理器
CPU性能在平均水平的5%以内 酷睿i7-1165G7在我们的数据库中的笔记本电脑。的性能。 i7-1185G7由于其对vPro安全功能的先天支持,速度稍慢。某些AMD的CPU,如 Ryzen 5 5500U或 Ryzen 7 5700U能够以单线程性能为代价,提供更快的多线程性能。
降级到 酷睿i5-1135G7SKU与我们的i7-1165G7 SKU相比,用户的多线程性能将损失10%到15%。
Cinebench R15 Multi Loop
Cinebench R23: Multi Core | Single Core
Cinebench R15: CPU Multi 64Bit | CPU Single 64Bit
Blender: v2.79 BMW27 CPU
7-Zip 18.03: 7z b 4 -mmt1 | 7z b 4
Geekbench 5.5: Single-Core | Multi-Core
HWBOT x265 Benchmark v2.2: 4k Preset
LibreOffice : 20 Documents To PDF
R Benchmark 2.5: Overall mean
| Cinebench R20 / CPU (Multi Core) | |
| Asus ZenBook 13 OLED UM325UA | |
| VAIO Z VJZ141C11L | |
| Lenovo Yoga 6 13 82ND0009US | |
| Framework Laptop 13.5 | |
| HP Envy x360 13-ay0010nr | |
| Average Intel Core i7-1165G7 (1060 - 2657, n=81) | |
| Microsoft Surface Laptop 4 13 i7 | |
| HP Spectre x360 13-aw2003dx | |
| Acer Spin 5 SP513-54N-79EY | |
| Asus VivoBook S13 S333JA-DS51 | |
| HP EliteBook x360 830 G6 | |
| Cinebench R20 / CPU (Single Core) | |
| VAIO Z VJZ141C11L | |
| Microsoft Surface Laptop 4 13 i7 | |
| Framework Laptop 13.5 | |
| Average Intel Core i7-1165G7 (442 - 589, n=81) | |
| HP Spectre x360 13-aw2003dx | |
| Asus ZenBook 13 OLED UM325UA | |
| Lenovo Yoga 6 13 82ND0009US | |
| Acer Spin 5 SP513-54N-79EY | |
| HP Envy x360 13-ay0010nr | |
| HP EliteBook x360 830 G6 | |
| Asus VivoBook S13 S333JA-DS51 | |
| Cinebench R23 / Multi Core | |
| Asus ZenBook 13 OLED UM325UA | |
| VAIO Z VJZ141C11L | |
| Lenovo Yoga 6 13 82ND0009US | |
| Framework Laptop 13.5 | |
| Microsoft Surface Laptop 4 13 i7 | |
| Average Intel Core i7-1165G7 (2525 - 6862, n=64) | |
| HP Spectre x360 13-aw2003dx | |
| Asus VivoBook S13 S333JA-DS51 | |
| Cinebench R23 / Single Core | |
| VAIO Z VJZ141C11L | |
| Microsoft Surface Laptop 4 13 i7 | |
| Framework Laptop 13.5 | |
| Average Intel Core i7-1165G7 (1110 - 1539, n=59) | |
| HP Spectre x360 13-aw2003dx | |
| Asus ZenBook 13 OLED UM325UA | |
| Lenovo Yoga 6 13 82ND0009US | |
| Asus VivoBook S13 S333JA-DS51 | |
| Cinebench R15 / CPU Multi 64Bit | |
| Asus ZenBook 13 OLED UM325UA | |
| Lenovo Yoga 6 13 82ND0009US | |
| Microsoft Surface Laptop 4 13 i7 | |
| VAIO Z VJZ141C11L | |
| Framework Laptop 13.5 | |
| Average Intel Core i7-1165G7 (553 - 1027, n=86) | |
| HP Envy x360 13-ay0010nr | |
| HP Spectre x360 13-aw2003dx | |
| Acer Spin 5 SP513-54N-79EY | |
| Asus VivoBook S13 S333JA-DS51 | |
| HP EliteBook x360 830 G6 | |
| Cinebench R15 / CPU Single 64Bit | |
| VAIO Z VJZ141C11L | |
| Microsoft Surface Laptop 4 13 i7 | |
| Framework Laptop 13.5 | |
| Average Intel Core i7-1165G7 (115 - 230, n=78) | |
| HP Spectre x360 13-aw2003dx | |
| Asus ZenBook 13 OLED UM325UA | |
| Acer Spin 5 SP513-54N-79EY | |
| Lenovo Yoga 6 13 82ND0009US | |
| HP Envy x360 13-ay0010nr | |
| HP EliteBook x360 830 G6 | |
| Asus VivoBook S13 S333JA-DS51 | |
| Blender / v2.79 BMW27 CPU | |
| Asus VivoBook S13 S333JA-DS51 | |
| Acer Spin 5 SP513-54N-79EY | |
| Microsoft Surface Laptop 4 13 i7 | |
| HP Spectre x360 13-aw2003dx | |
| Average Intel Core i7-1165G7 (468 - 1138, n=80) | |
| HP Envy x360 13-ay0010nr | |
| Framework Laptop 13.5 | |
| VAIO Z VJZ141C11L | |
| Lenovo Yoga 6 13 82ND0009US | |
| Asus ZenBook 13 OLED UM325UA | |
| 7-Zip 18.03 / 7z b 4 -mmt1 | |
| VAIO Z VJZ141C11L | |
| Framework Laptop 13.5 | |
| Microsoft Surface Laptop 4 13 i7 | |
| Average Intel Core i7-1165G7 (4478 - 5507, n=80) | |
| HP Spectre x360 13-aw2003dx | |
| Asus ZenBook 13 OLED UM325UA | |
| HP EliteBook x360 830 G6 | |
| Acer Spin 5 SP513-54N-79EY | |
| Lenovo Yoga 6 13 82ND0009US | |
| HP Envy x360 13-ay0010nr | |
| Asus VivoBook S13 S333JA-DS51 | |
| 7-Zip 18.03 / 7z b 4 | |
| Asus ZenBook 13 OLED UM325UA | |
| Lenovo Yoga 6 13 82ND0009US | |
| VAIO Z VJZ141C11L | |
| Framework Laptop 13.5 | |
| Microsoft Surface Laptop 4 13 i7 | |
| HP Envy x360 13-ay0010nr | |
| Average Intel Core i7-1165G7 (15347 - 27405, n=80) | |
| HP Spectre x360 13-aw2003dx | |
| Acer Spin 5 SP513-54N-79EY | |
| Asus VivoBook S13 S333JA-DS51 | |
| HP EliteBook x360 830 G6 | |
| Geekbench 5.5 / Single-Core | |
| VAIO Z VJZ141C11L | |
| Microsoft Surface Laptop 4 13 i7 | |
| Average Intel Core i7-1165G7 (1302 - 1595, n=77) | |
| HP Spectre x360 13-aw2003dx | |
| Acer Spin 5 SP513-54N-79EY | |
| Asus ZenBook 13 OLED UM325UA | |
| Asus VivoBook S13 S333JA-DS51 | |
| HP Envy x360 13-ay0010nr | |
| Geekbench 5.5 / Multi-Core | |
| Asus ZenBook 13 OLED UM325UA | |
| VAIO Z VJZ141C11L | |
| Microsoft Surface Laptop 4 13 i7 | |
| HP Spectre x360 13-aw2003dx | |
| Average Intel Core i7-1165G7 (3078 - 5926, n=77) | |
| HP Envy x360 13-ay0010nr | |
| Asus VivoBook S13 S333JA-DS51 | |
| Acer Spin 5 SP513-54N-79EY | |
| HWBOT x265 Benchmark v2.2 / 4k Preset | |
| Asus ZenBook 13 OLED UM325UA | |
| VAIO Z VJZ141C11L | |
| Lenovo Yoga 6 13 82ND0009US | |
| Framework Laptop 13.5 | |
| HP Envy x360 13-ay0010nr | |
| Average Intel Core i7-1165G7 (1.39 - 8.47, n=80) | |
| HP Spectre x360 13-aw2003dx | |
| Microsoft Surface Laptop 4 13 i7 | |
| Asus VivoBook S13 S333JA-DS51 | |
| LibreOffice / 20 Documents To PDF | |
| Lenovo Yoga 6 13 82ND0009US | |
| HP Envy x360 13-ay0010nr | |
| Asus VivoBook S13 S333JA-DS51 | |
| Asus ZenBook 13 OLED UM325UA | |
| HP Spectre x360 13-aw2003dx | |
| Acer Spin 5 SP513-54N-79EY | |
| Microsoft Surface Laptop 4 13 i7 | |
| Average Intel Core i7-1165G7 (21.5 - 88.1, n=78) | |
| VAIO Z VJZ141C11L | |
| Framework Laptop 13.5 | |
| R Benchmark 2.5 / Overall mean | |
| Asus VivoBook S13 S333JA-DS51 | |
| HP Spectre x360 13-aw2003dx | |
| Lenovo Yoga 6 13 82ND0009US | |
| HP Envy x360 13-ay0010nr | |
| Asus ZenBook 13 OLED UM325UA | |
| Average Intel Core i7-1165G7 (0.552 - 1.002, n=80) | |
| Microsoft Surface Laptop 4 13 i7 | |
| Framework Laptop 13.5 | |
| VAIO Z VJZ141C11L | |
* ... smaller is better
系统性能
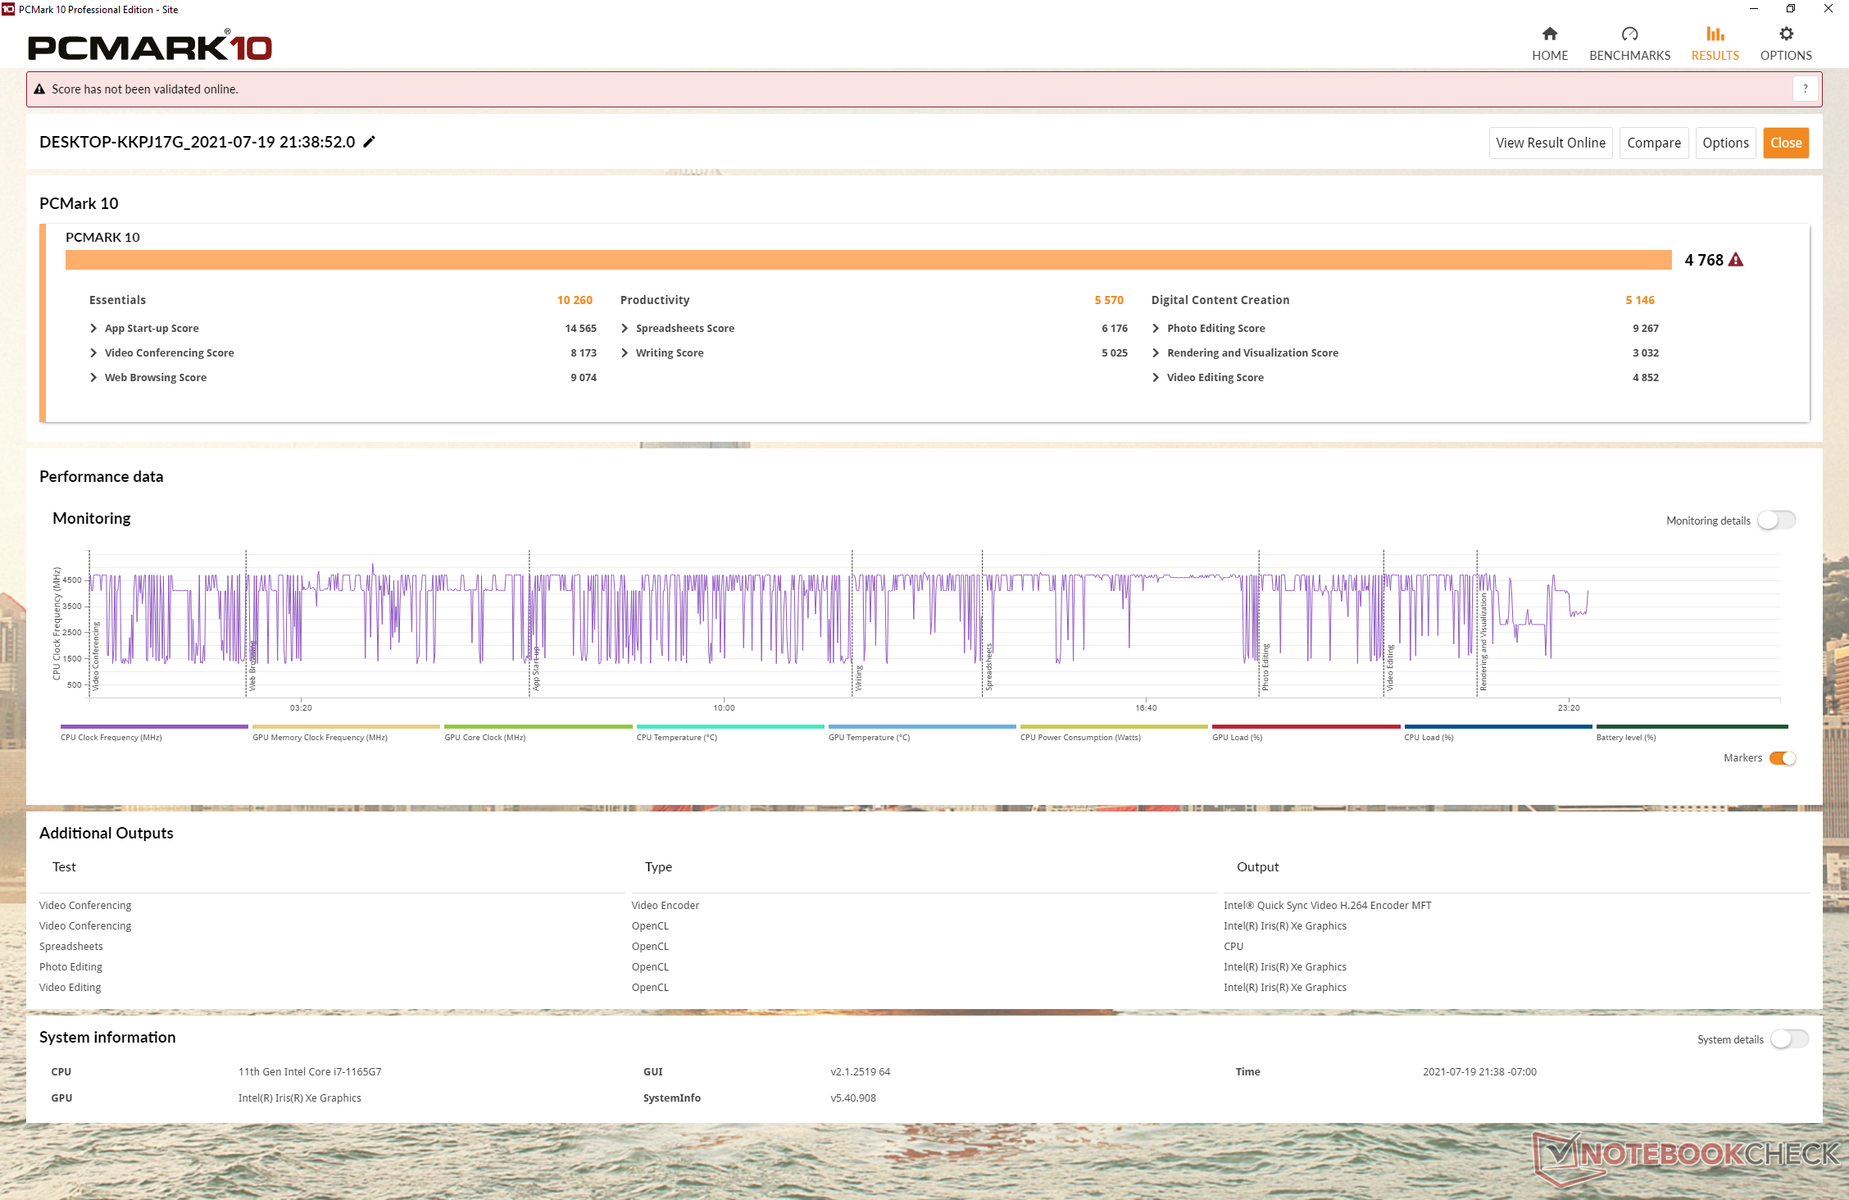
PCMark 10的平均成绩是我们期望的,相对于其他拥有相同Core i7-1165G7 CPU的笔记本电脑而言。然而,生产力基准得分,是一个有点低的预期。
| PCMark 10 / Score | |
| HP ProBook x360 435 G8 R7-5800U | |
| Lenovo Yoga 6 13 82ND0009US | |
| Average Intel Core i7-1165G7, Intel Iris Xe Graphics G7 96EUs (4531 - 5454, n=50) | |
| Microsoft Surface Laptop 4 13 i7 | |
| Framework Laptop 13.5 | |
| Lenovo ThinkPad X1 Titanium Yoga G1 20QA001RGE | |
| HP Spectre x360 14-ea0378ng | |
| PCMark 10 / Essentials | |
| Lenovo ThinkPad X1 Titanium Yoga G1 20QA001RGE | |
| Framework Laptop 13.5 | |
| Average Intel Core i7-1165G7, Intel Iris Xe Graphics G7 96EUs (8997 - 11505, n=50) | |
| Lenovo Yoga 6 13 82ND0009US | |
| HP ProBook x360 435 G8 R7-5800U | |
| HP Spectre x360 14-ea0378ng | |
| Microsoft Surface Laptop 4 13 i7 | |
| PCMark 10 / Productivity | |
| HP ProBook x360 435 G8 R7-5800U | |
| Lenovo Yoga 6 13 82ND0009US | |
| Average Intel Core i7-1165G7, Intel Iris Xe Graphics G7 96EUs (5570 - 7136, n=50) | |
| Microsoft Surface Laptop 4 13 i7 | |
| Lenovo ThinkPad X1 Titanium Yoga G1 20QA001RGE | |
| HP Spectre x360 14-ea0378ng | |
| Framework Laptop 13.5 | |
| PCMark 10 / Digital Content Creation | |
| Lenovo Yoga 6 13 82ND0009US | |
| HP ProBook x360 435 G8 R7-5800U | |
| Framework Laptop 13.5 | |
| Average Intel Core i7-1165G7, Intel Iris Xe Graphics G7 96EUs (4083 - 5550, n=50) | |
| Microsoft Surface Laptop 4 13 i7 | |
| HP Spectre x360 14-ea0378ng | |
| Lenovo ThinkPad X1 Titanium Yoga G1 20QA001RGE | |
| PCMark 10 Score | 4768 points | |
Help | ||
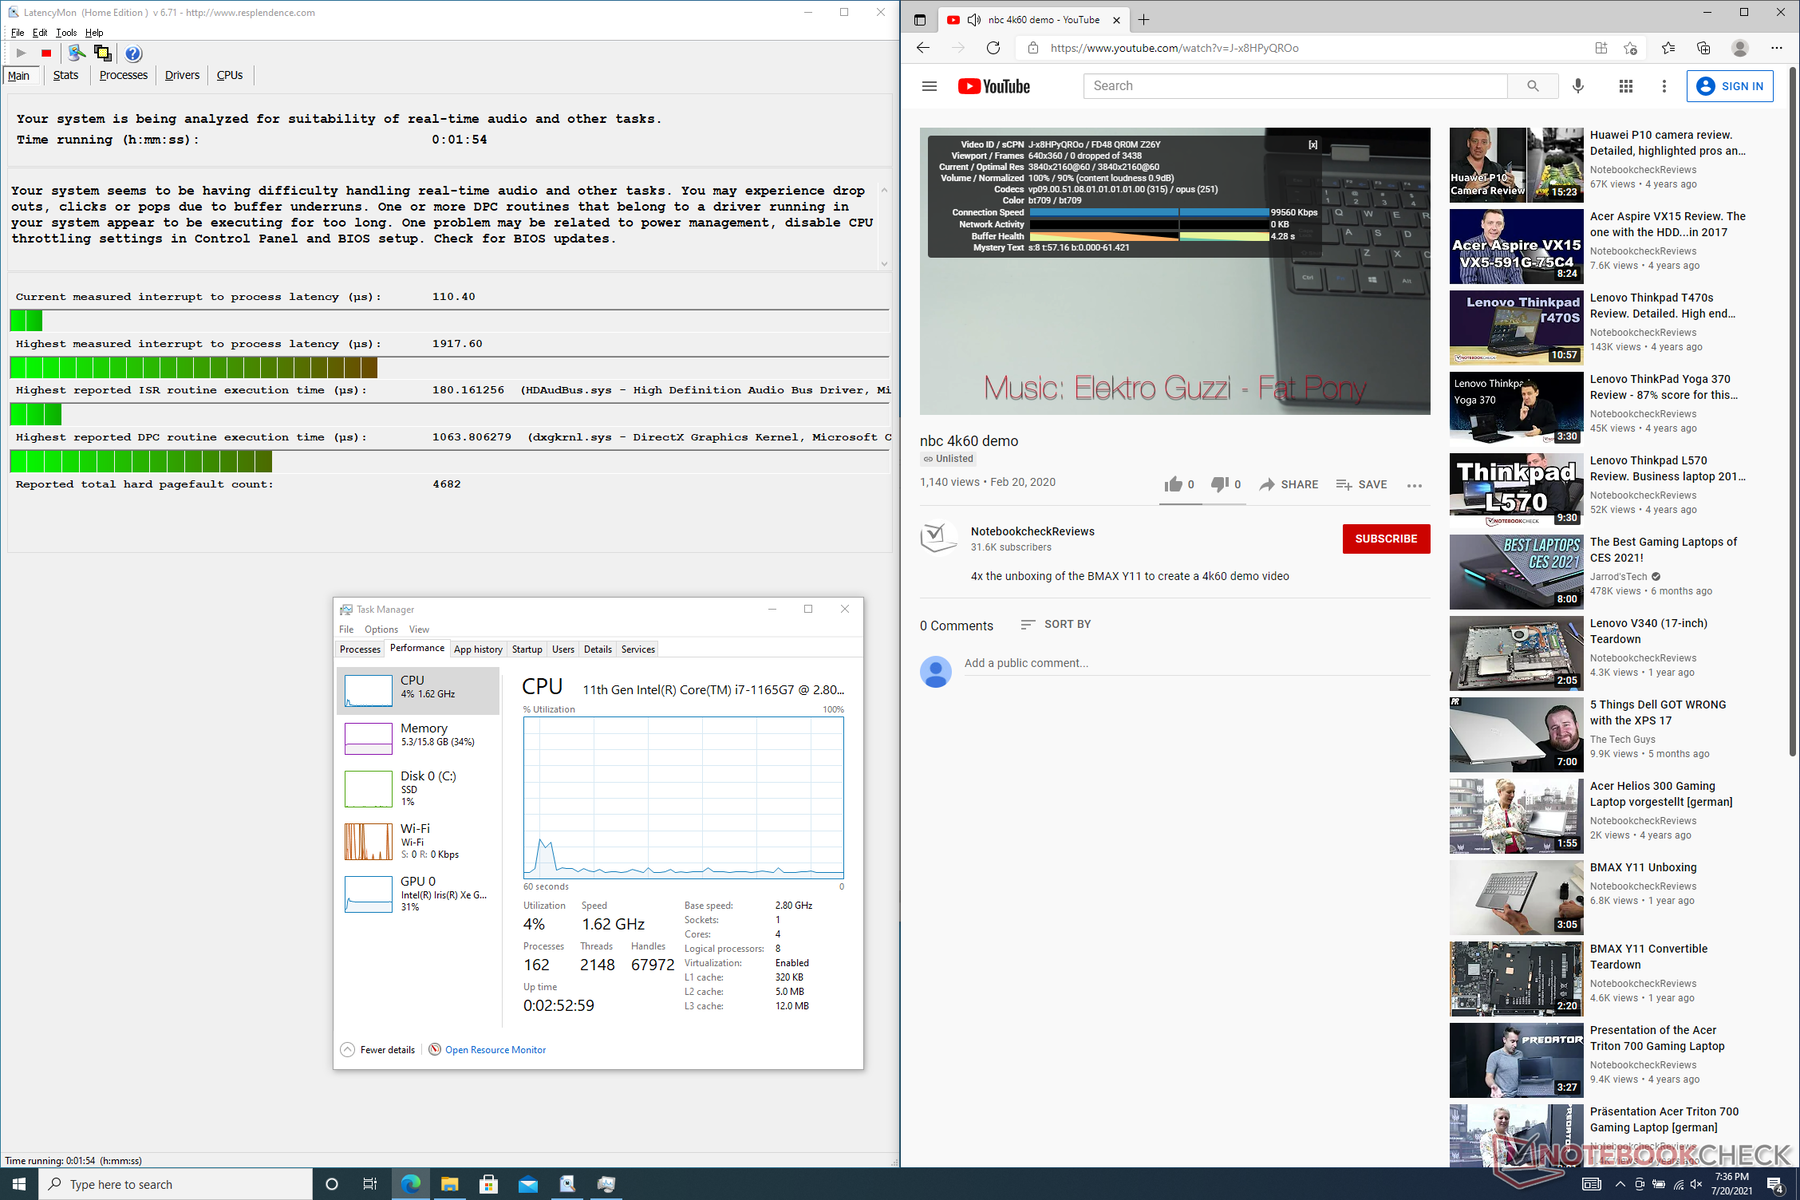
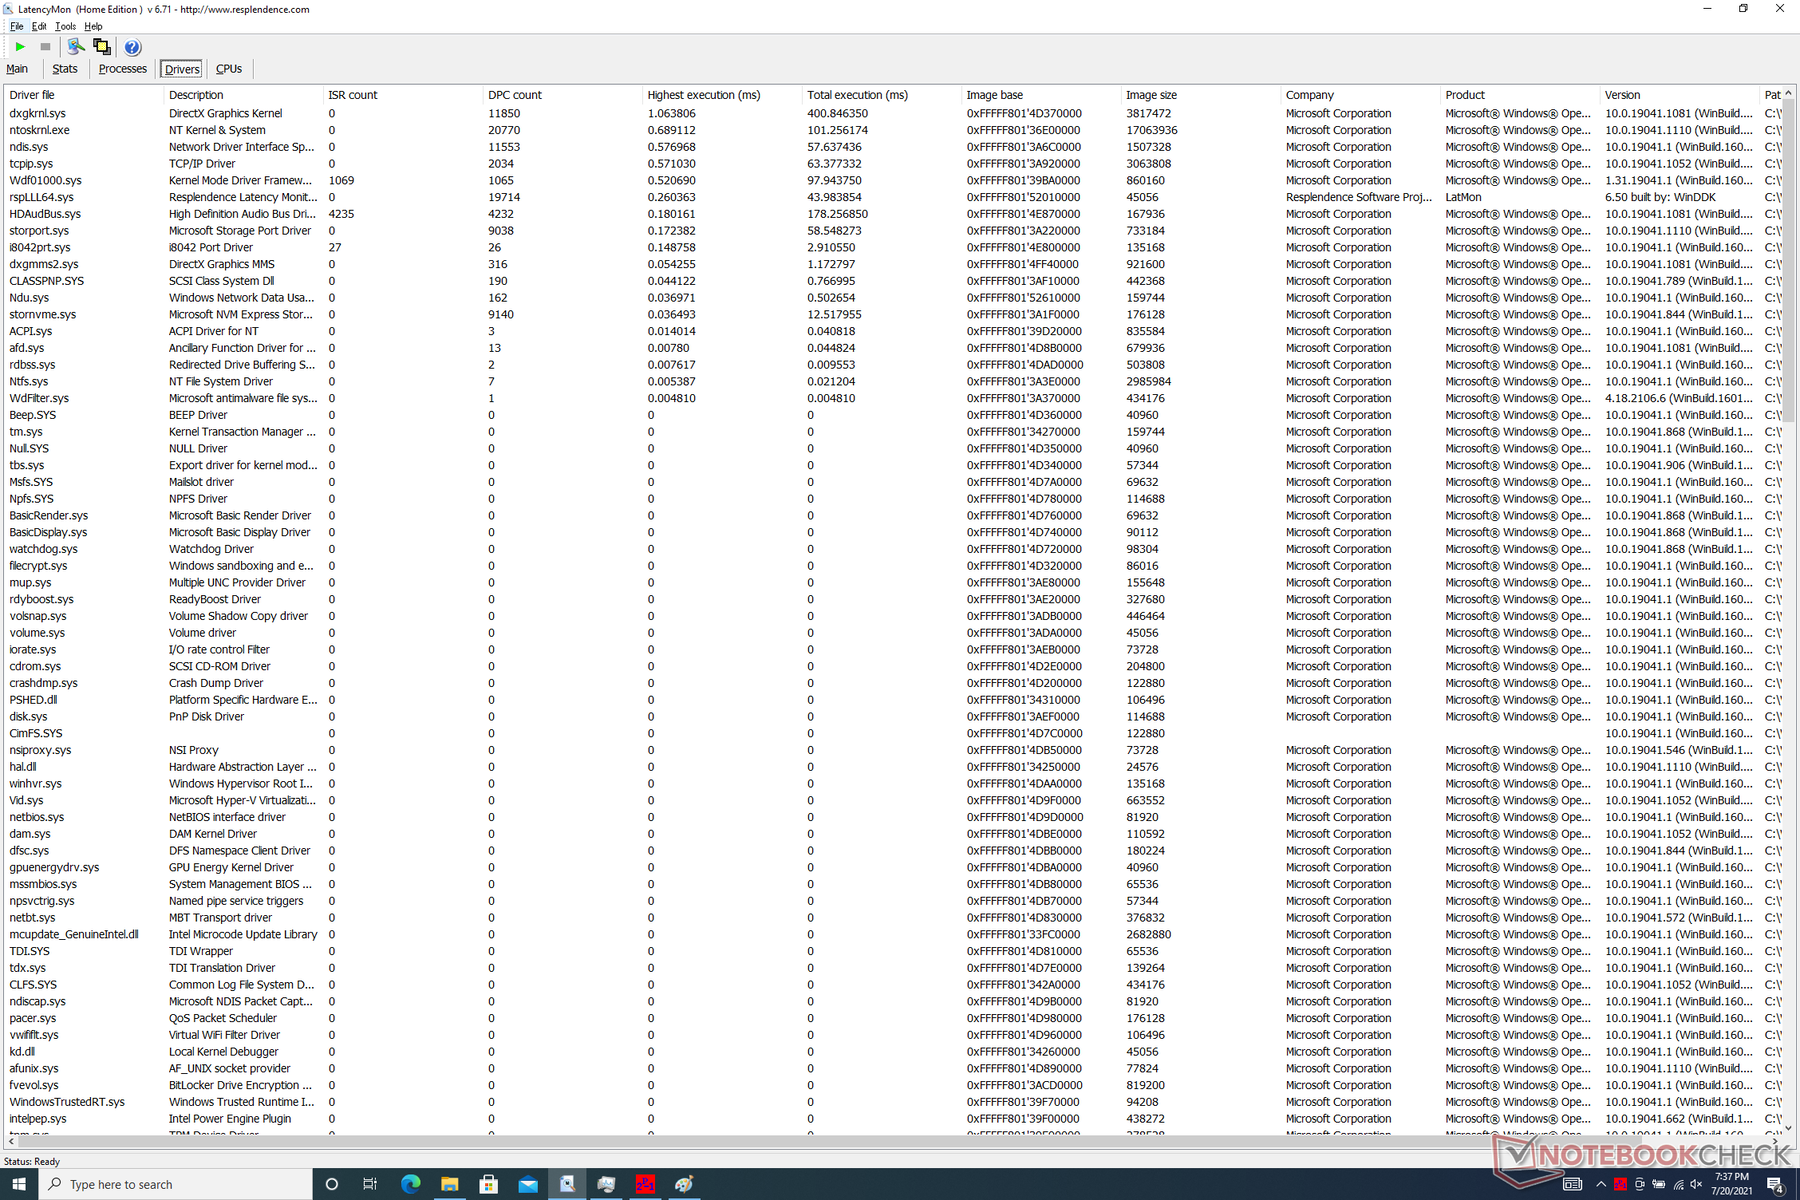
DPC延时
LatencyMon显示,在我们的主页上打开多个浏览器标签时有轻微的DPC延迟问题。在4K 60 FPS条件下,视频播放很流畅,没有任何丢帧。
| DPC Latencies / LatencyMon - interrupt to process latency (max), Web, Youtube, Prime95 | |
| Framework Laptop 13.5 | |
| HP Spectre x360 14-ea0378ng | |
| Lenovo ThinkPad X1 Titanium Yoga G1 20QA001RGE | |
| Lenovo Yoga 6 13 82ND0009US | |
| Microsoft Surface Laptop 4 13 i7 | |
| HP ProBook x360 435 G8 R7-5800U | |
* ... smaller is better
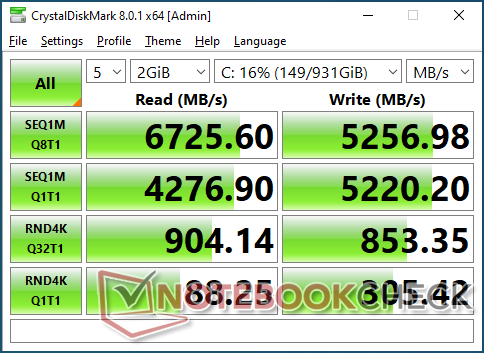
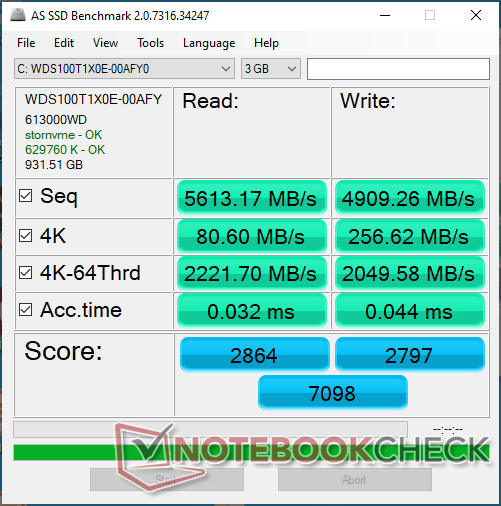
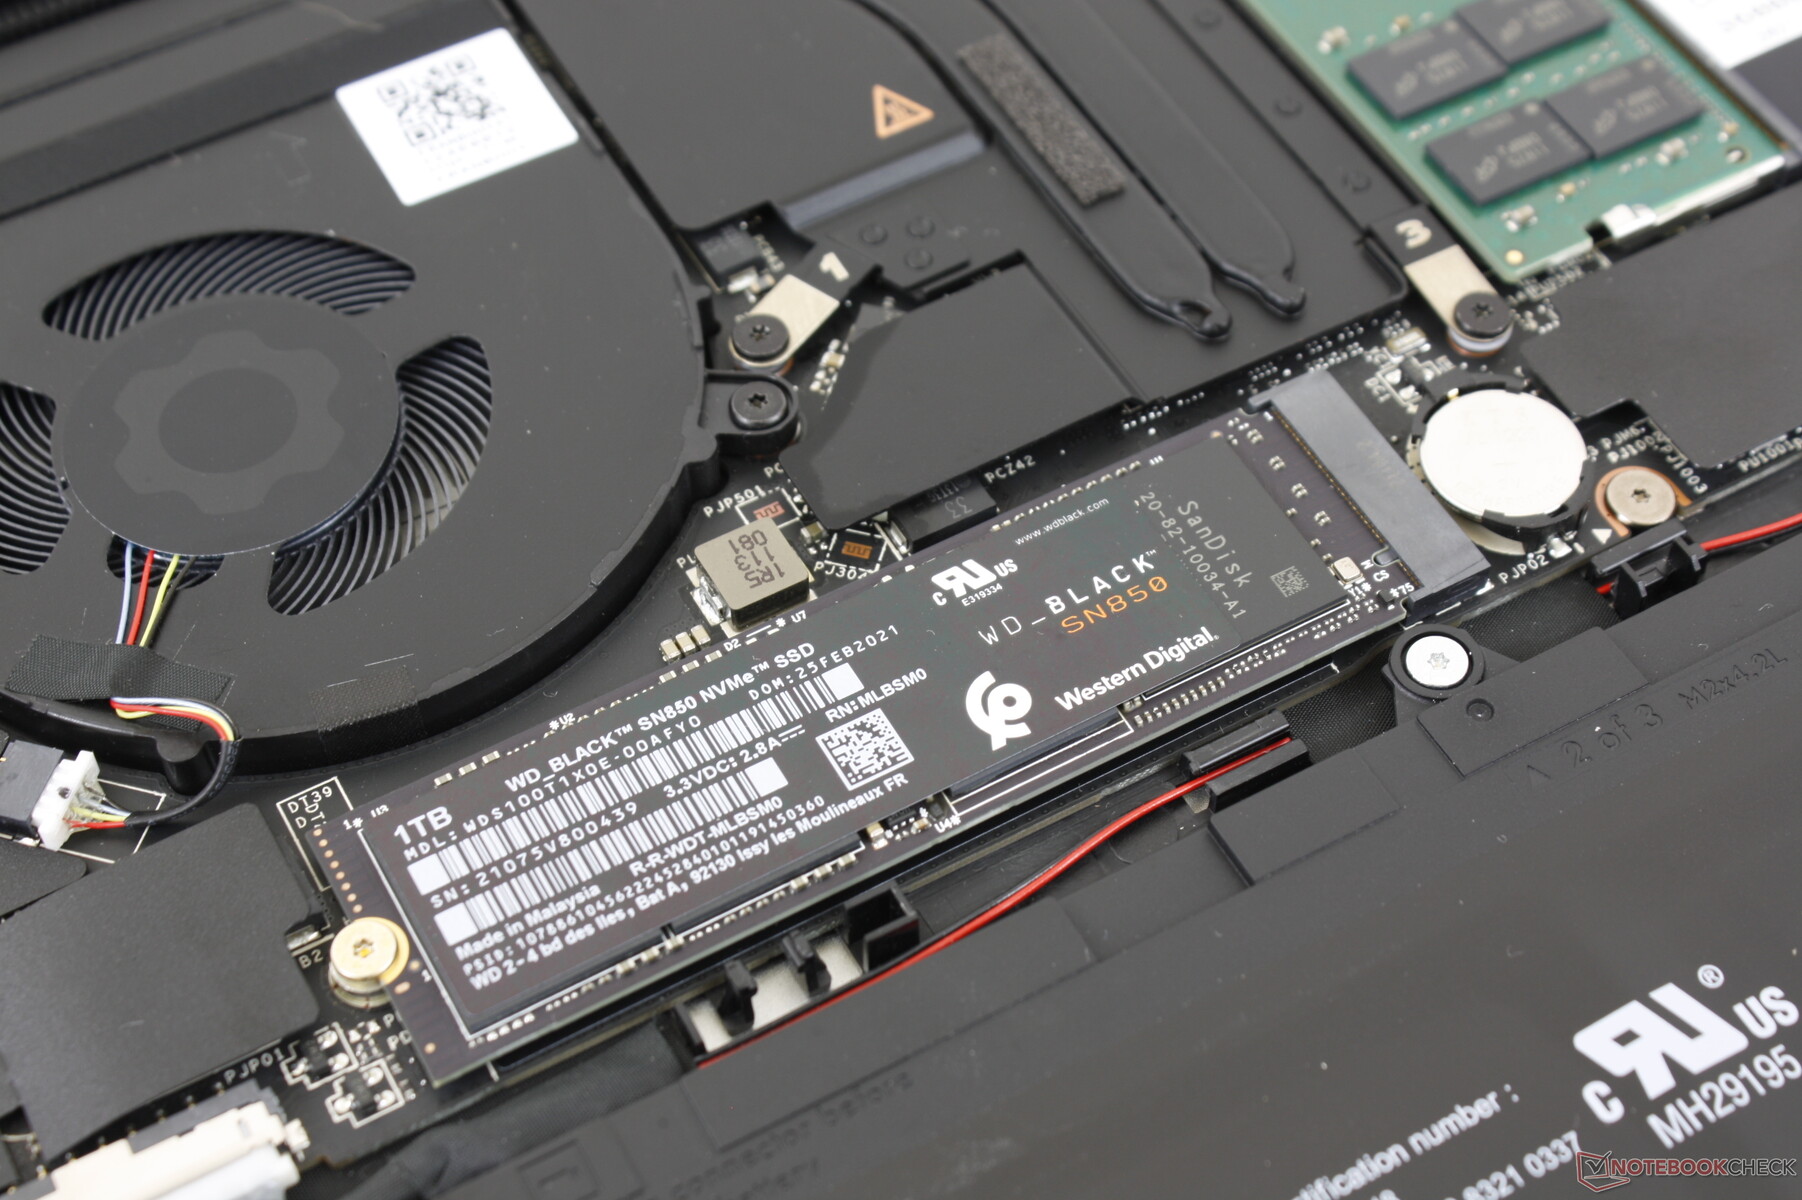
存储设备
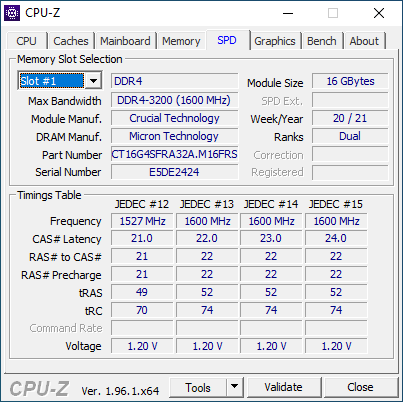
用户可以安装自己的M.2 NVMe固态硬盘,最高可达PCIe 4部分。Framework将提供的固态硬盘都是西部数据的黑色硬盘,从250GB的SN750到2TB的SN850。
| Framework Laptop 13.5 Western Digital WD_BLACK SN850 WDS100T1X0E | HP Spectre x360 14-ea0378ng Intel Optane Memory H10 with Solid State Storage 32GB + 1TB HBRPEKNX0203AH(L/H) | Microsoft Surface Laptop 4 13 i7 Samsung PM991 MZ9LQ512HALU | Lenovo ThinkPad X1 Titanium Yoga G1 20QA001RGE Toshiba BG4 KBG40ZNT512G | HP ProBook x360 435 G8 R7-5800U Samsung PM991 MZVLQ512HALU | Lenovo Yoga 6 13 82ND0009US WDC PC SN530 SDBPMPZ-265G | |
|---|---|---|---|---|---|---|
| AS SSD | -76% | -81% | -69% | -76% | -101% | |
| Seq Read (MB/s) | 5613 | 1343 -76% | 1821 -68% | 1898 -66% | 1936 -66% | 1860 -67% |
| Seq Write (MB/s) | 4909 | 1222 -75% | 794 -84% | 1065 -78% | 1237 -75% | 500 -90% |
| 4K Read (MB/s) | 80.6 | 63.6 -21% | 47.54 -41% | 58 -28% | 40.35 -50% | 36.26 -55% |
| 4K Write (MB/s) | 256.6 | 107.8 -58% | 141.6 -45% | 200.7 -22% | 99.5 -61% | 118.6 -54% |
| 4K-64 Read (MB/s) | 2222 | 417.5 -81% | 782 -65% | 580 -74% | 645 -71% | 419 -81% |
| 4K-64 Write (MB/s) | 2050 | 496 -76% | 766 -63% | 779 -62% | 365.8 -82% | 219 -89% |
| Access Time Read * (ms) | 0.032 | 0.103 -222% | 0.191 -497% | 0.052 -63% | 0.104 -225% | 0.102 -219% |
| Access Time Write * (ms) | 0.044 | 0.043 2% | 0.027 39% | 0.16 -264% | 0.038 14% | 0.17 -286% |
| Score Read (Points) | 2864 | 615 -79% | 1012 -65% | 828 -71% | 879 -69% | 641 -78% |
| Score Write (Points) | 2797 | 726 -74% | 987 -65% | 1087 -61% | 589 -79% | 388 -86% |
| Score Total (Points) | 7098 | 1675 -76% | 2477 -65% | 2316 -67% | 1892 -73% | 1300 -82% |
| Copy ISO MB/s (MB/s) | 1926 | 334.9 -83% | 1243 -35% | 1659 -14% | 708 -63% | 880 -54% |
| Copy Program MB/s (MB/s) | 947 | 276.3 -71% | 628 -34% | 519 -45% | 132.1 -86% | 185.3 -80% |
| Copy Game MB/s (MB/s) | 1880 | 433.2 -77% | 976 -48% | 872 -54% | 326.7 -83% | 212.7 -89% |
| CrystalDiskMark 5.2 / 6 | -42% | -67% | -49% | -67% | -68% | |
| Write 4K (MB/s) | 299.4 | 128.9 -57% | 118.2 -61% | 226.6 -24% | 86.7 -71% | 89.2 -70% |
| Read 4K (MB/s) | 87.6 | 140 60% | 37.54 -57% | 62.8 -28% | 32.45 -63% | 33.09 -62% |
| Write Seq (MB/s) | 5205 | 1422 -73% | 1017 -80% | 1296 -75% | 1235 -76% | 988 -81% |
| Read Seq (MB/s) | 4276 | 1660 -61% | 926 -78% | 1445 -66% | 1417 -67% | 1322 -69% |
| Write 4K Q32T1 (MB/s) | 846 | 475.1 -44% | 354.2 -58% | 545 -36% | 390.8 -54% | 332.6 -61% |
| Read 4K Q32T1 (MB/s) | 905 | 581 -36% | 352.6 -61% | 687 -24% | 291 -68% | 389.3 -57% |
| Write Seq Q32T1 (MB/s) | 5189 | 1793 -65% | 1174 -77% | 1483 -71% | 1384 -73% | 984 -81% |
| Read Seq Q32T1 (MB/s) | 6921 | 2536 -63% | 2261 -67% | 2334 -66% | 2350 -66% | 2461 -64% |
| Total Average (Program / Settings) | -59% /
-64% | -74% /
-76% | -59% /
-62% | -72% /
-73% | -85% /
-89% |
* ... smaller is better

Disk Throttling: DiskSpd Read Loop, Queue Depth 8
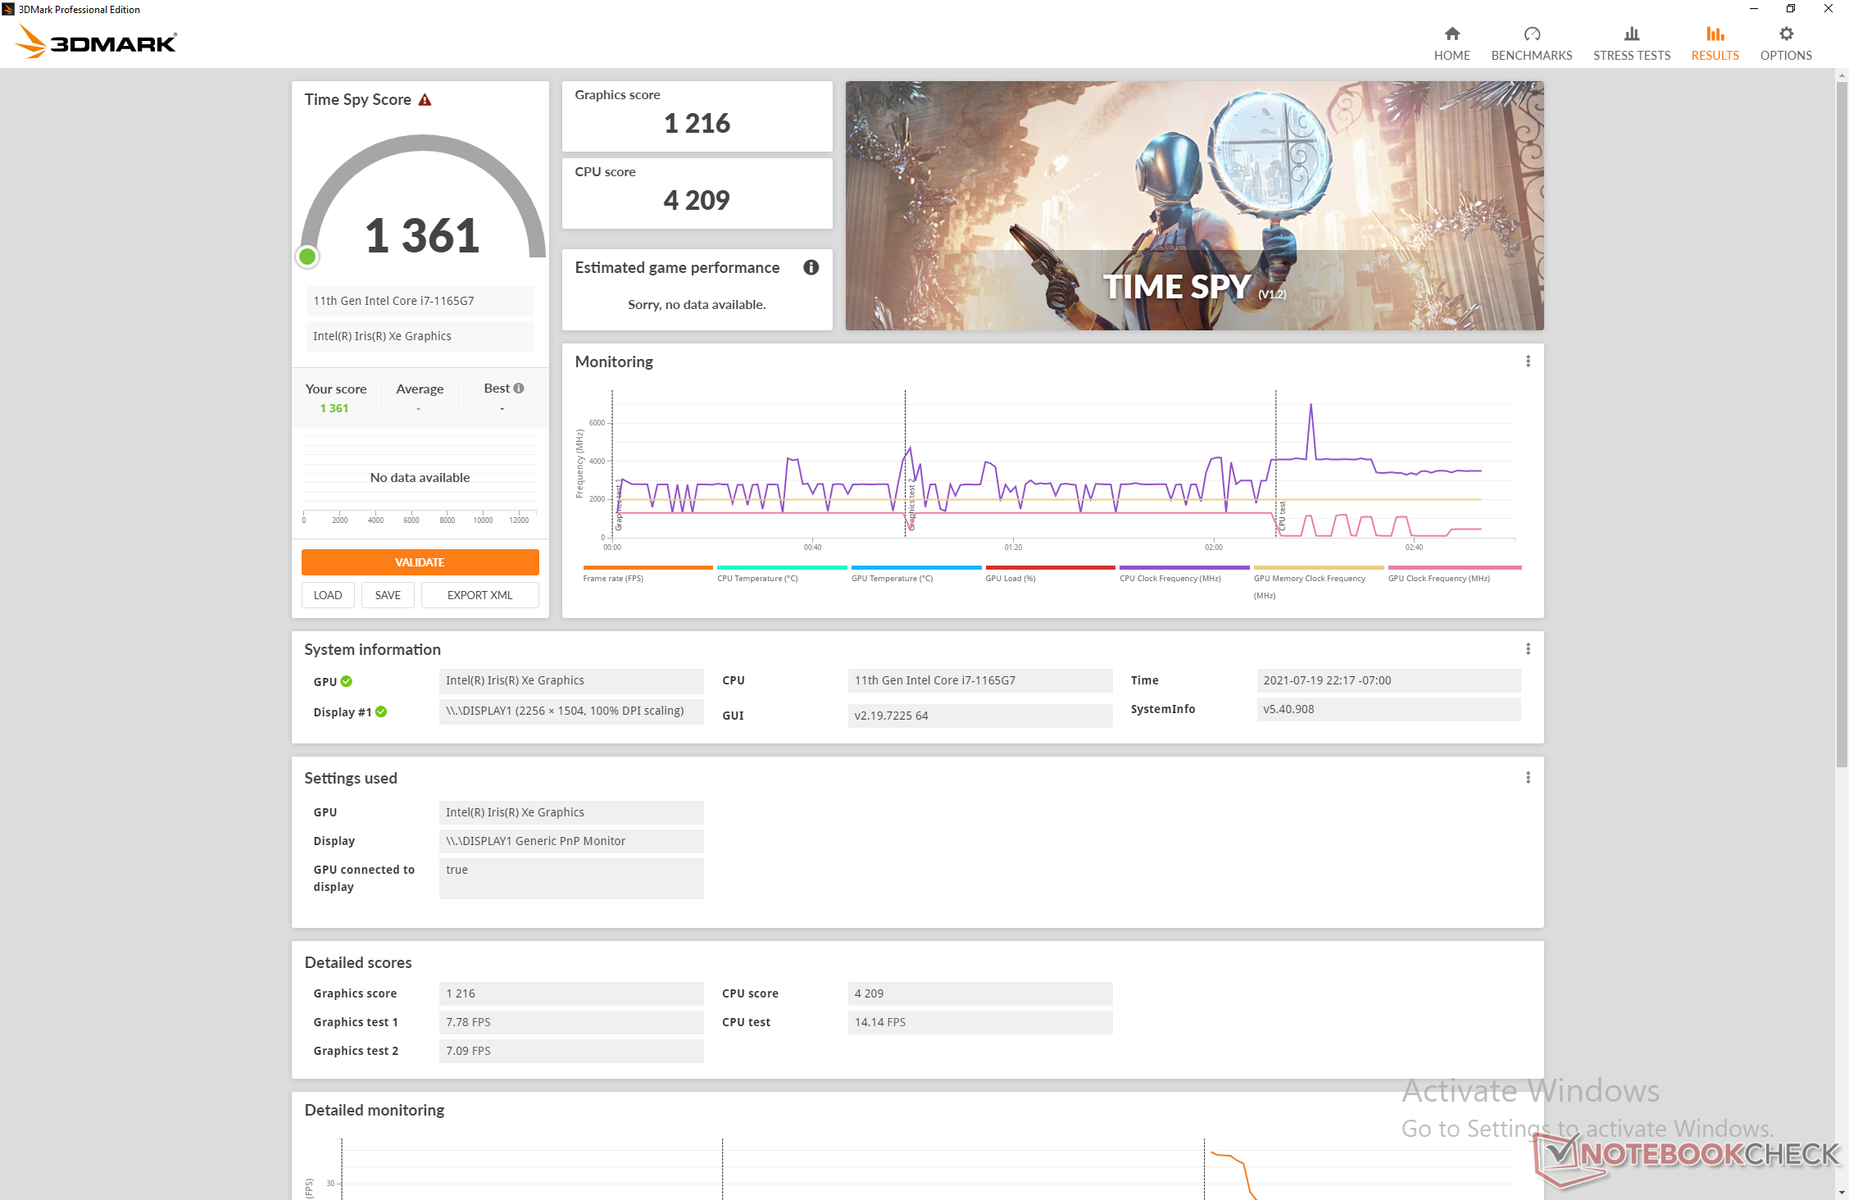
GPU性能
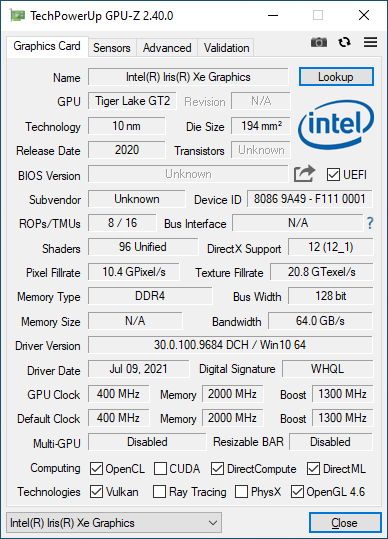
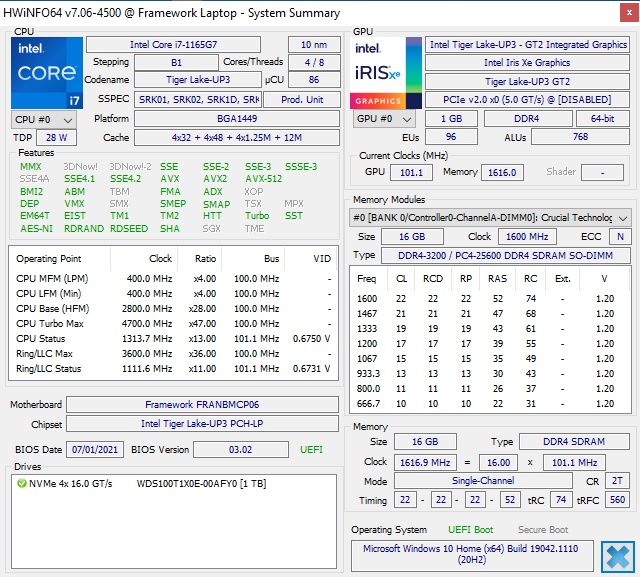
图形性能比平均水平慢15%至25%。 Iris Xe 96 EUs由于我们测试设备上的单通道内存,图形性能比我们数据库中的平均Iris Xe 96 EUs慢15%至25%。用户可以通过安装双通道内存轻松缩小这一差距。
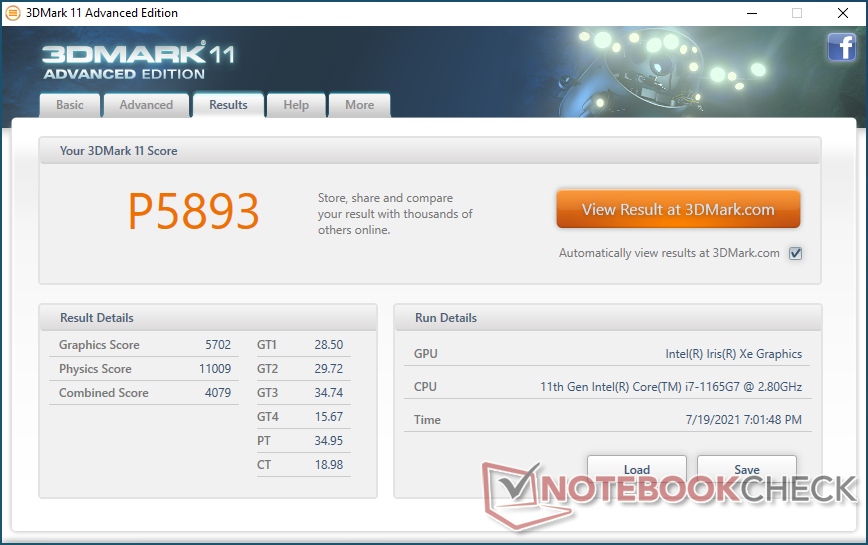
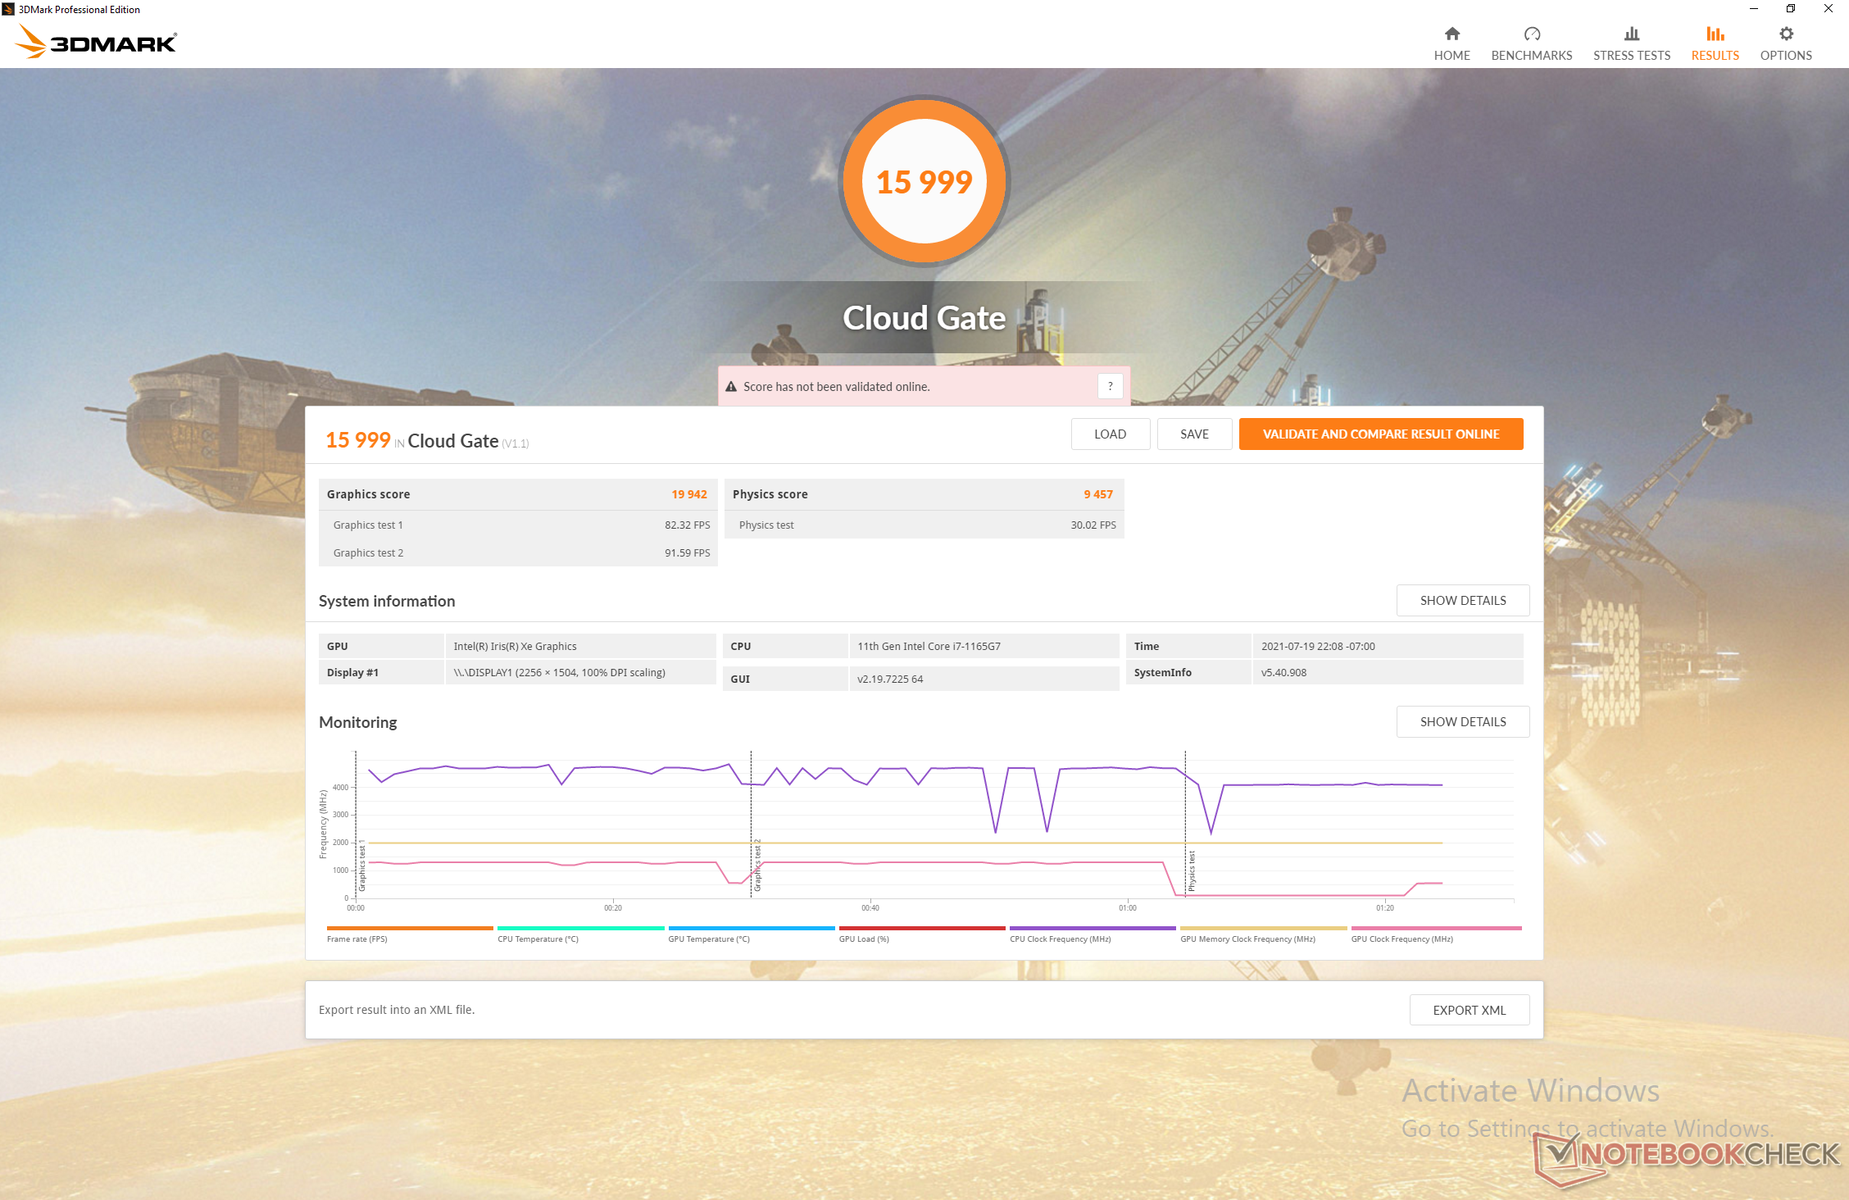
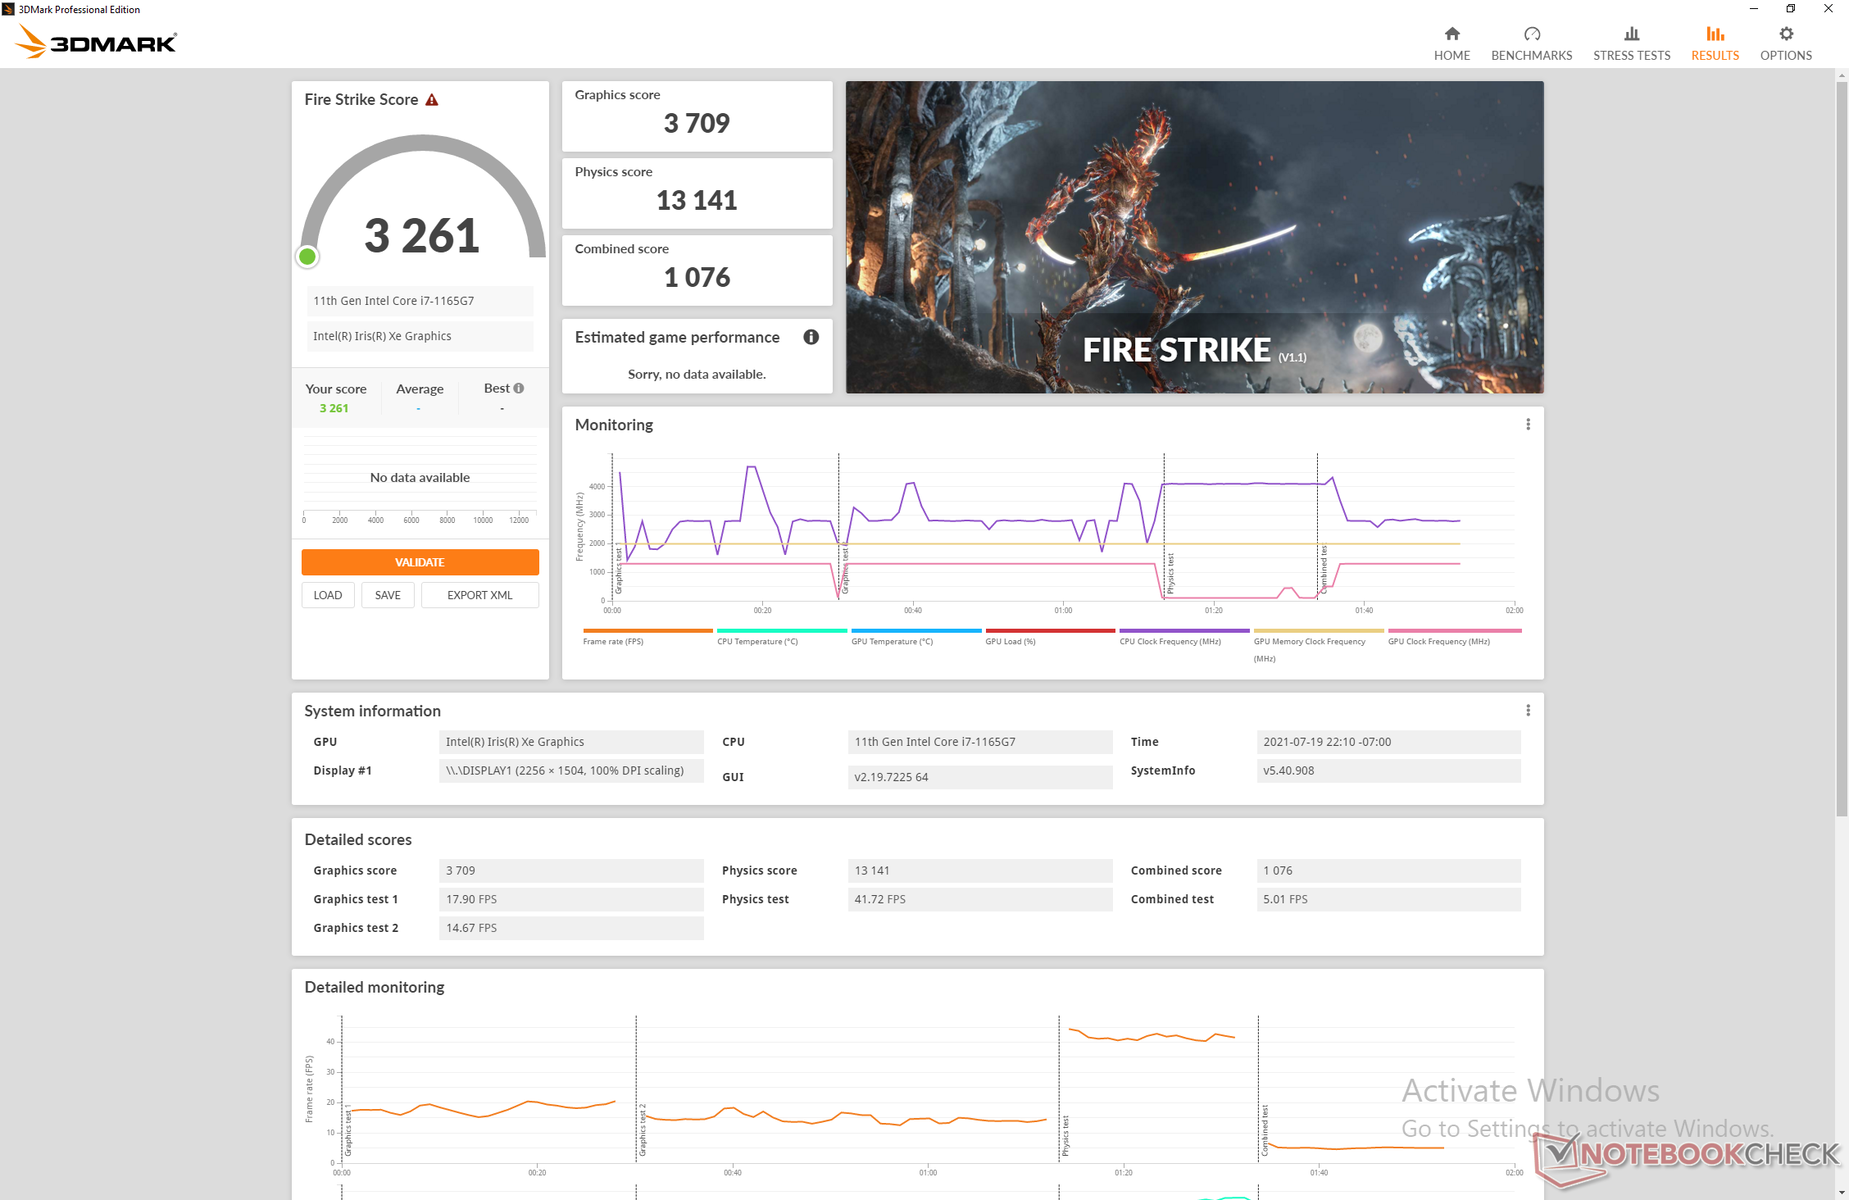
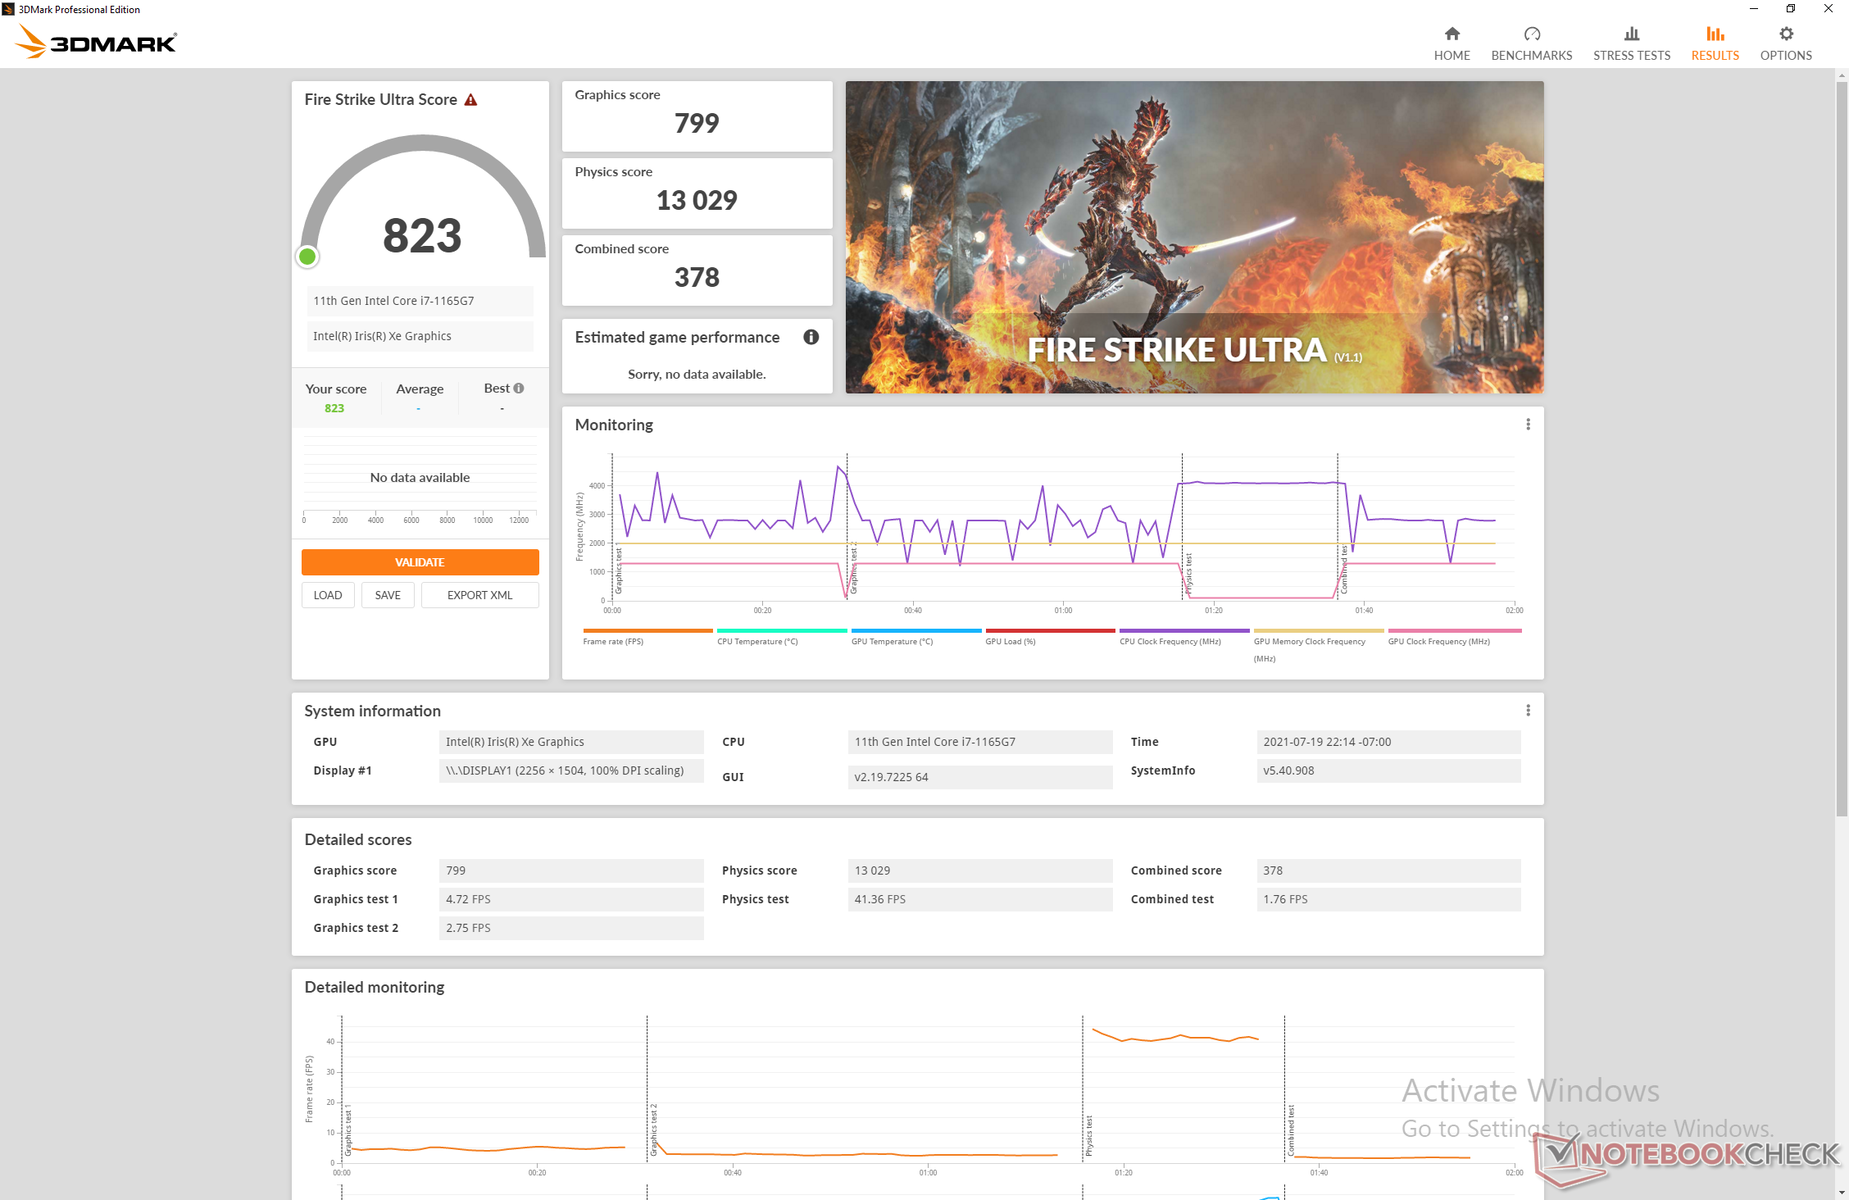
| 3DMark 11 Performance | 5893 points | |
| 3DMark Cloud Gate Standard Score | 15999 points | |
| 3DMark Fire Strike Score | 2361 points | |
| 3DMark Time Spy Score | 1361 points | |
Help | ||
| Final Fantasy XV Benchmark | |
| 1280x720 Lite Quality | |
| Average Intel Iris Xe Graphics G7 96EUs (14.9 - 56.5, n=189) | |
| Lenovo ThinkPad X13 G2 20WK0024GE | |
| HP Spectre x360 13-aw2003dx | |
| Asus ZenBook 13 OLED UM325UA | |
| Huawei MateBook X Pro 2021 | |
| Lenovo Yoga 6 13 82ND0009US | |
| Framework Laptop 13.5 | |
| HP ProBook x360 435 G8 R7-5800U | |
| Asus VivoBook S13 S333JA-DS51 | |
| 1920x1080 Standard Quality | |
| Average Intel Iris Xe Graphics G7 96EUs (10.5 - 31.2, n=185) | |
| Lenovo ThinkPad X13 G2 20WK0024GE | |
| HP Spectre x360 13-aw2003dx | |
| Huawei MateBook X Pro 2021 | |
| Asus ZenBook 13 OLED UM325UA | |
| Framework Laptop 13.5 | |
| Lenovo Yoga 6 13 82ND0009US | |
| HP ProBook x360 435 G8 R7-5800U | |
| Asus VivoBook S13 S333JA-DS51 | |
| 1920x1080 High Quality | |
| HP Spectre x360 13-aw2003dx | |
| Average Intel Iris Xe Graphics G7 96EUs (8.15 - 27.8, n=178) | |
| Lenovo ThinkPad X13 G2 20WK0024GE | |
| Huawei MateBook X Pro 2021 | |
| Framework Laptop 13.5 | |
| Asus ZenBook 13 OLED UM325UA | |
| Lenovo Yoga 6 13 82ND0009US | |
| HP ProBook x360 435 G8 R7-5800U | |
| Asus VivoBook S13 S333JA-DS51 | |
Witcher 3 FPS Chart
| low | med. | high | ultra | |
|---|---|---|---|---|
| The Witcher 3 (2015) | 75.9 | 45.1 | 22.1 | 12 |
| Dota 2 Reborn (2015) | 109 | 66.1 | 41.2 | 38.2 |
| Final Fantasy XV Benchmark (2018) | 29.4 | 15.7 | 12.1 | |
| X-Plane 11.11 (2018) | 41.3 | 36.5 | 29.5 |
Emissions
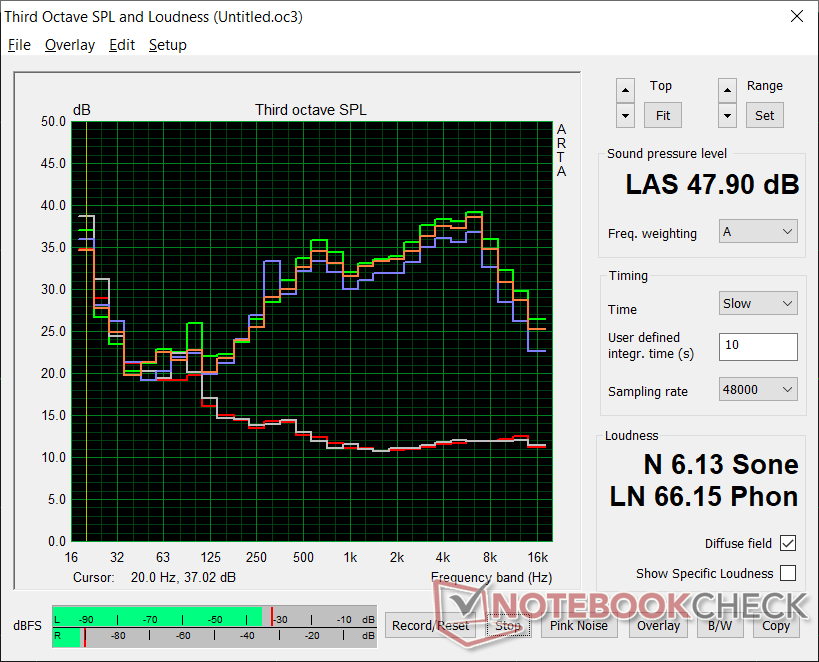
系统噪音
虽然在简单的浏览或文字处理时很安静,但框架中的风扇会比其他大多数超极本更快地变响。运行3DMark 06的第一个90秒的基准场景会导致风扇上升到45.6分贝(A),而惠普Spectre x360的风扇只有37.5分贝(A)或39.5分贝(A)。 HP Spectre x360 14或Surface Laptop 4 13上分别只有37.5分贝(A)或39.5分贝(A)。运行游戏时,风扇的声音会更大。
| Framework Laptop 13.5 Iris Xe G7 96EUs, i7-1165G7, Western Digital WD_BLACK SN850 WDS100T1X0E | HP Spectre x360 14-ea0378ng Iris Xe G7 96EUs, i7-1165G7, Intel Optane Memory H10 with Solid State Storage 32GB + 1TB HBRPEKNX0203AH(L/H) | Microsoft Surface Laptop 4 13 i7 Iris Xe G7 96EUs, i7-1185G7, Samsung PM991 MZ9LQ512HALU | Lenovo ThinkPad X1 Titanium Yoga G1 20QA001RGE Iris Xe G7 96EUs, i7-1160G7, Toshiba BG4 KBG40ZNT512G | Lenovo Yoga 6 13 82ND0009US Vega 7, R5 5500U, WDC PC SN530 SDBPMPZ-265G | Asus Zenbook 14 UX433FN-A6023T GeForce MX150, i7-8565U, Intel SSD 660p SSDPEKNW512G8 | |
|---|---|---|---|---|---|---|
| Noise | 1% | 5% | 8% | 4% | -13% | |
| off / environment * (dB) | 23.9 | 26 -9% | 24.2 -1% | 25.1 -5% | 25.1 -5% | 30.7 -28% |
| Idle Minimum * (dB) | 23.9 | 26 -9% | 24.2 -1% | 25.1 -5% | 25.1 -5% | 30.7 -28% |
| Idle Average * (dB) | 23.9 | 26 -9% | 24.2 -1% | 25.1 -5% | 25.1 -5% | 30.7 -28% |
| Idle Maximum * (dB) | 23.9 | 26 -9% | 24.2 -1% | 27.1 -13% | 25.1 -5% | 30.7 -28% |
| Load Average * (dB) | 45.6 | 37.5 18% | 39.5 13% | 32.7 28% | 41 10% | 38.8 15% |
| Witcher 3 ultra * (dB) | 47.1 | 32.7 31% | 38.6 18% | |||
| Load Maximum * (dB) | 47.9 | 36.3 24% | 39.5 18% | 35.8 25% | 38.7 19% | 39.3 18% |
* ... smaller is better
Noise level
| Idle |
| 23.9 / 23.9 / 23.9 dB(A) |
| Load |
| 45.6 / 47.9 dB(A) |
 | ||
30 dB silent 40 dB(A) audible 50 dB(A) loud |
||
min: | ||
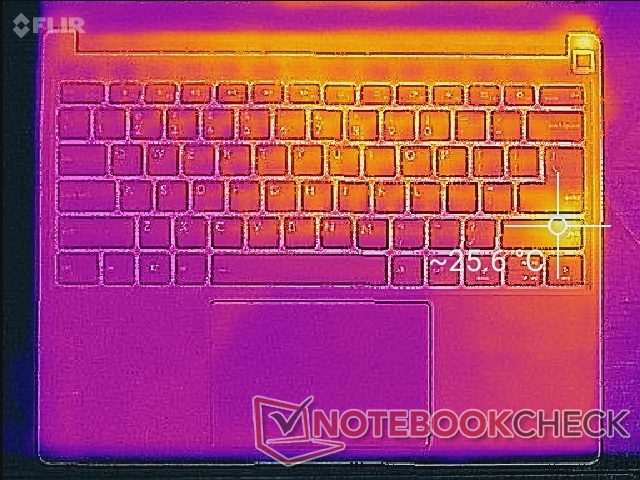
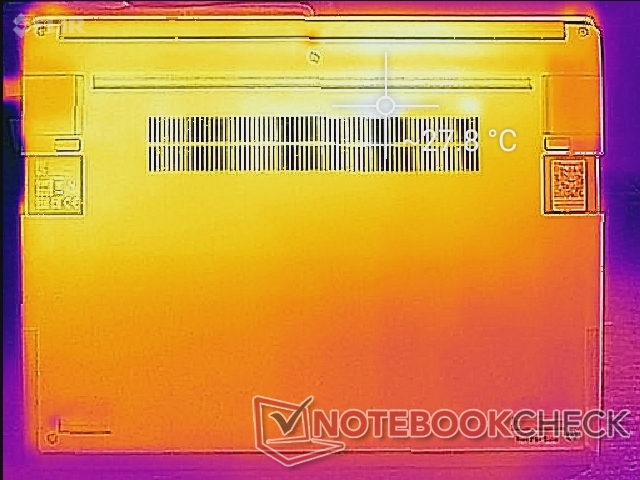
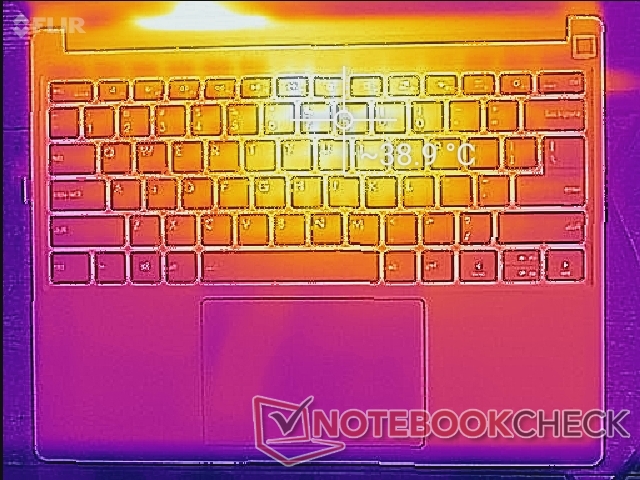
温度
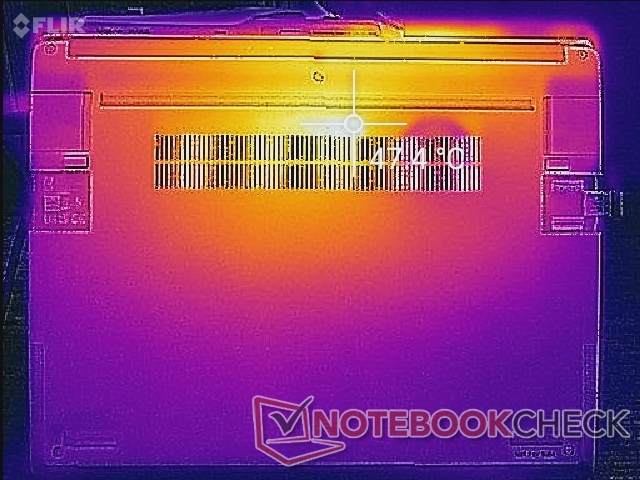
热点最靠近机箱的中央后部,如下面的温度图所示,那里的温度最高可达39摄氏度,底部最高可达48摄氏度。掌托区域保持凉爽,无论负载如何,都能舒适地使用。
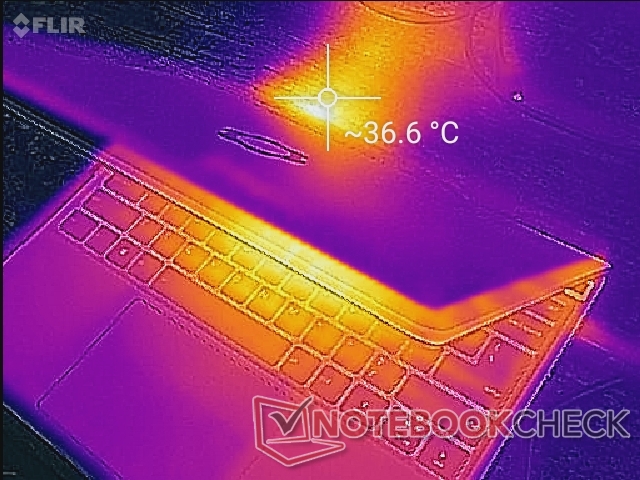
(-) The maximum temperature on the upper side is 47.2 °C / 117 F, compared to the average of 34.3 °C / 94 F, ranging from 21.2 to 62.5 °C for the class Office.
(+) The bottom heats up to a maximum of 39.4 °C / 103 F, compared to the average of 36.8 °C / 98 F
(+) In idle usage, the average temperature for the upper side is 23.5 °C / 74 F, compared to the device average of 29.5 °C / 85 F.
(+) The palmrests and touchpad are cooler than skin temperature with a maximum of 28.2 °C / 82.8 F and are therefore cool to the touch.
(±) The average temperature of the palmrest area of similar devices was 27.5 °C / 81.5 F (-0.7 °C / -1.3 F).
压力测试
运行Prime95导致CPU提升到4.1 GHz,只有几秒钟的时间,直到达到101 C的核心温度,然后时钟频率将下降并稳定在3.0 GHz左右,以保持82 C的较低核心温度。 ADATA XPG Xenia 14在威刚XPG Xenia 14上进行同样的测试,使用完全相同的Core i7 CPU,结果是更高的核心时钟速率和更高的温度。
用电池供电运行会稍微限制性能。在电池上进行3DMark 11测试,物理和图形分数分别为10095和5563分,而在主电源上则为11009和5702分。
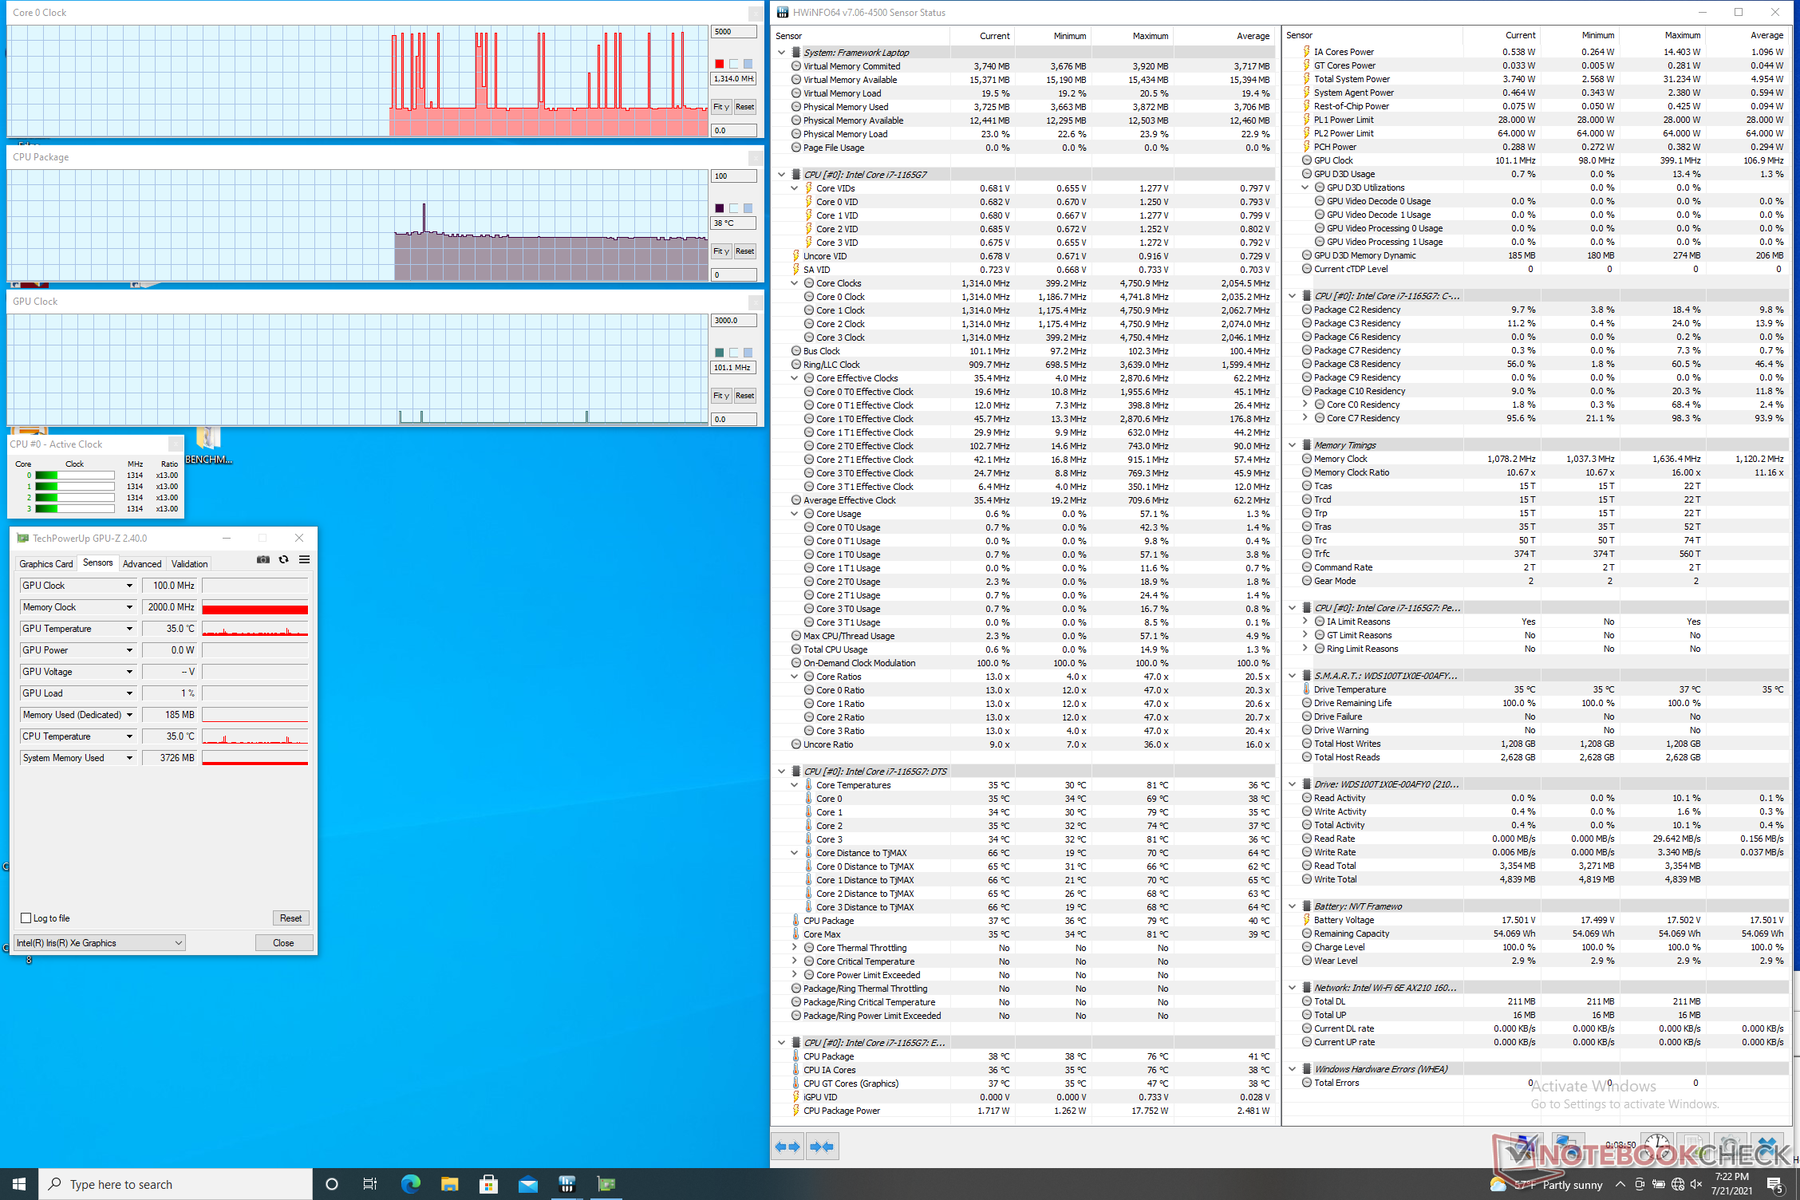
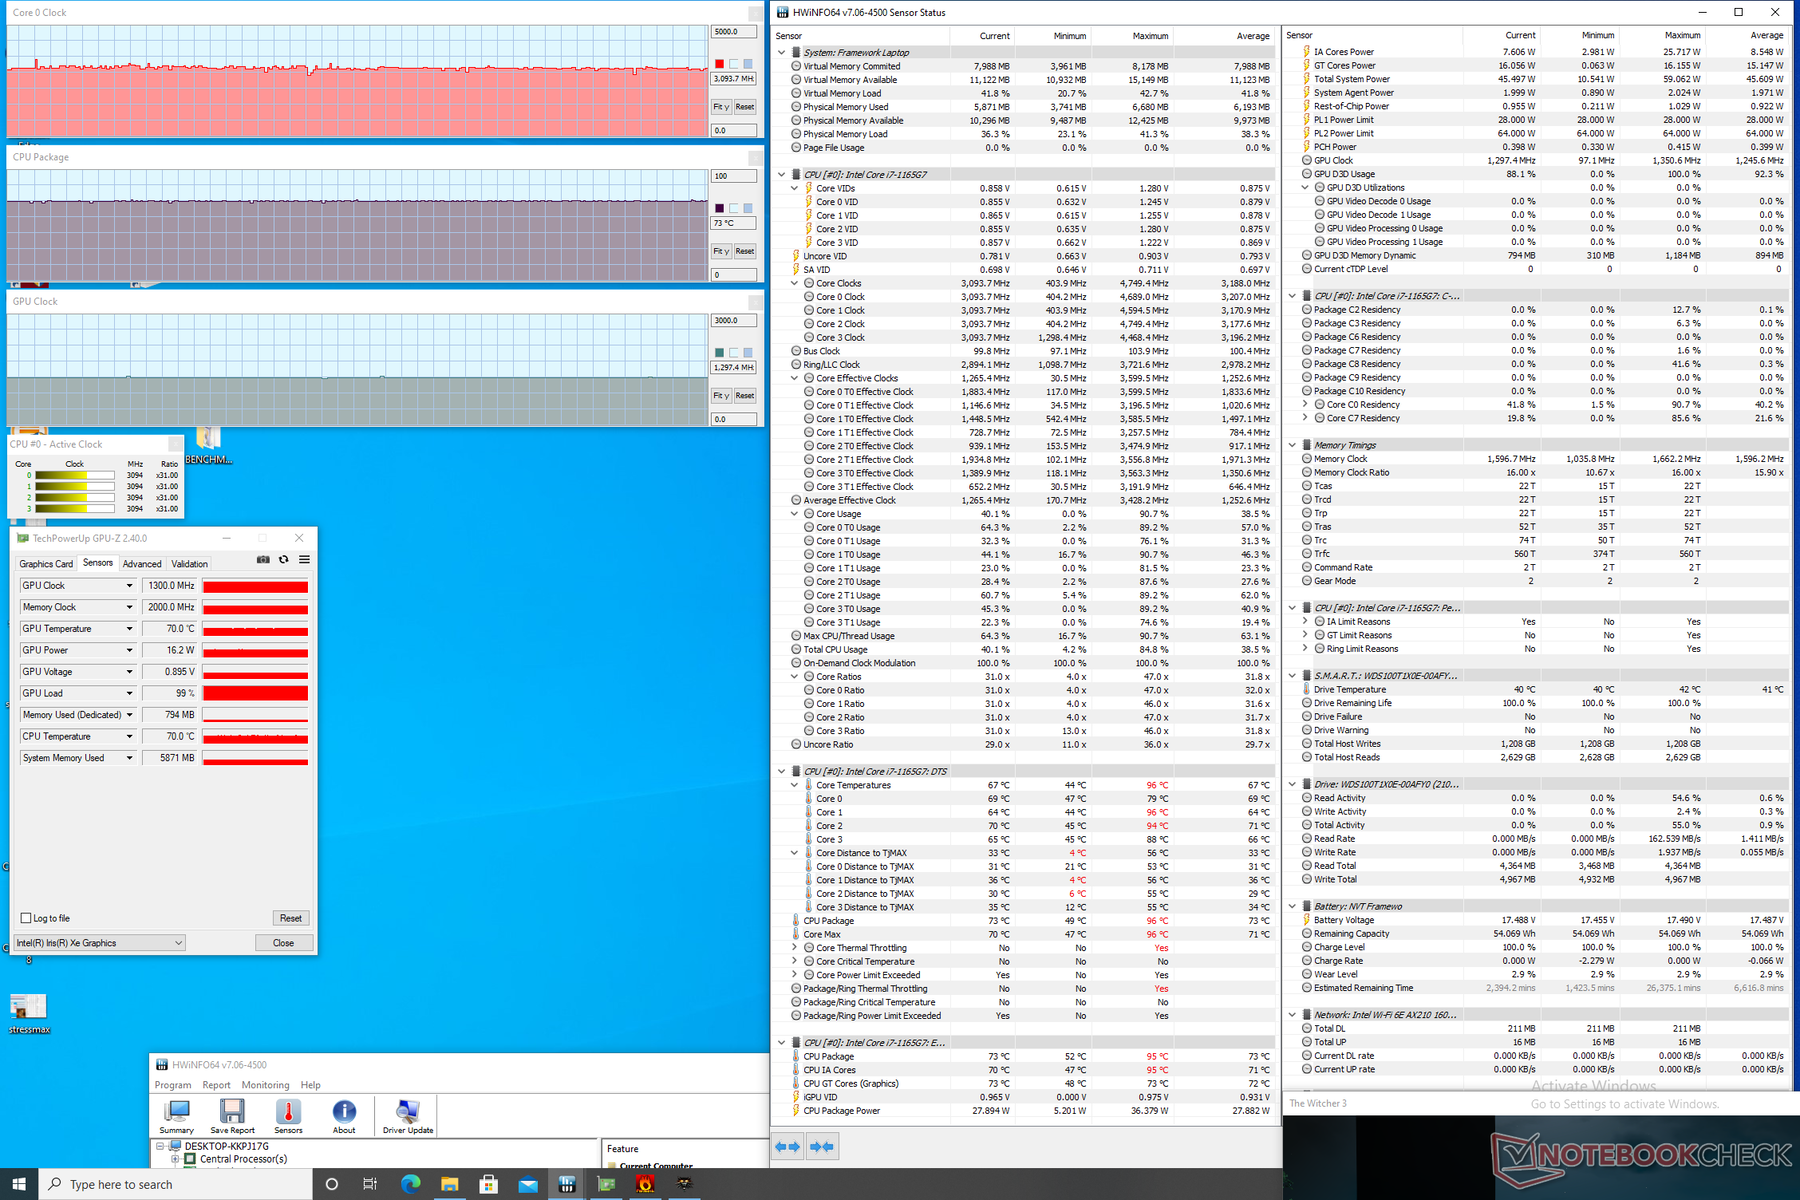
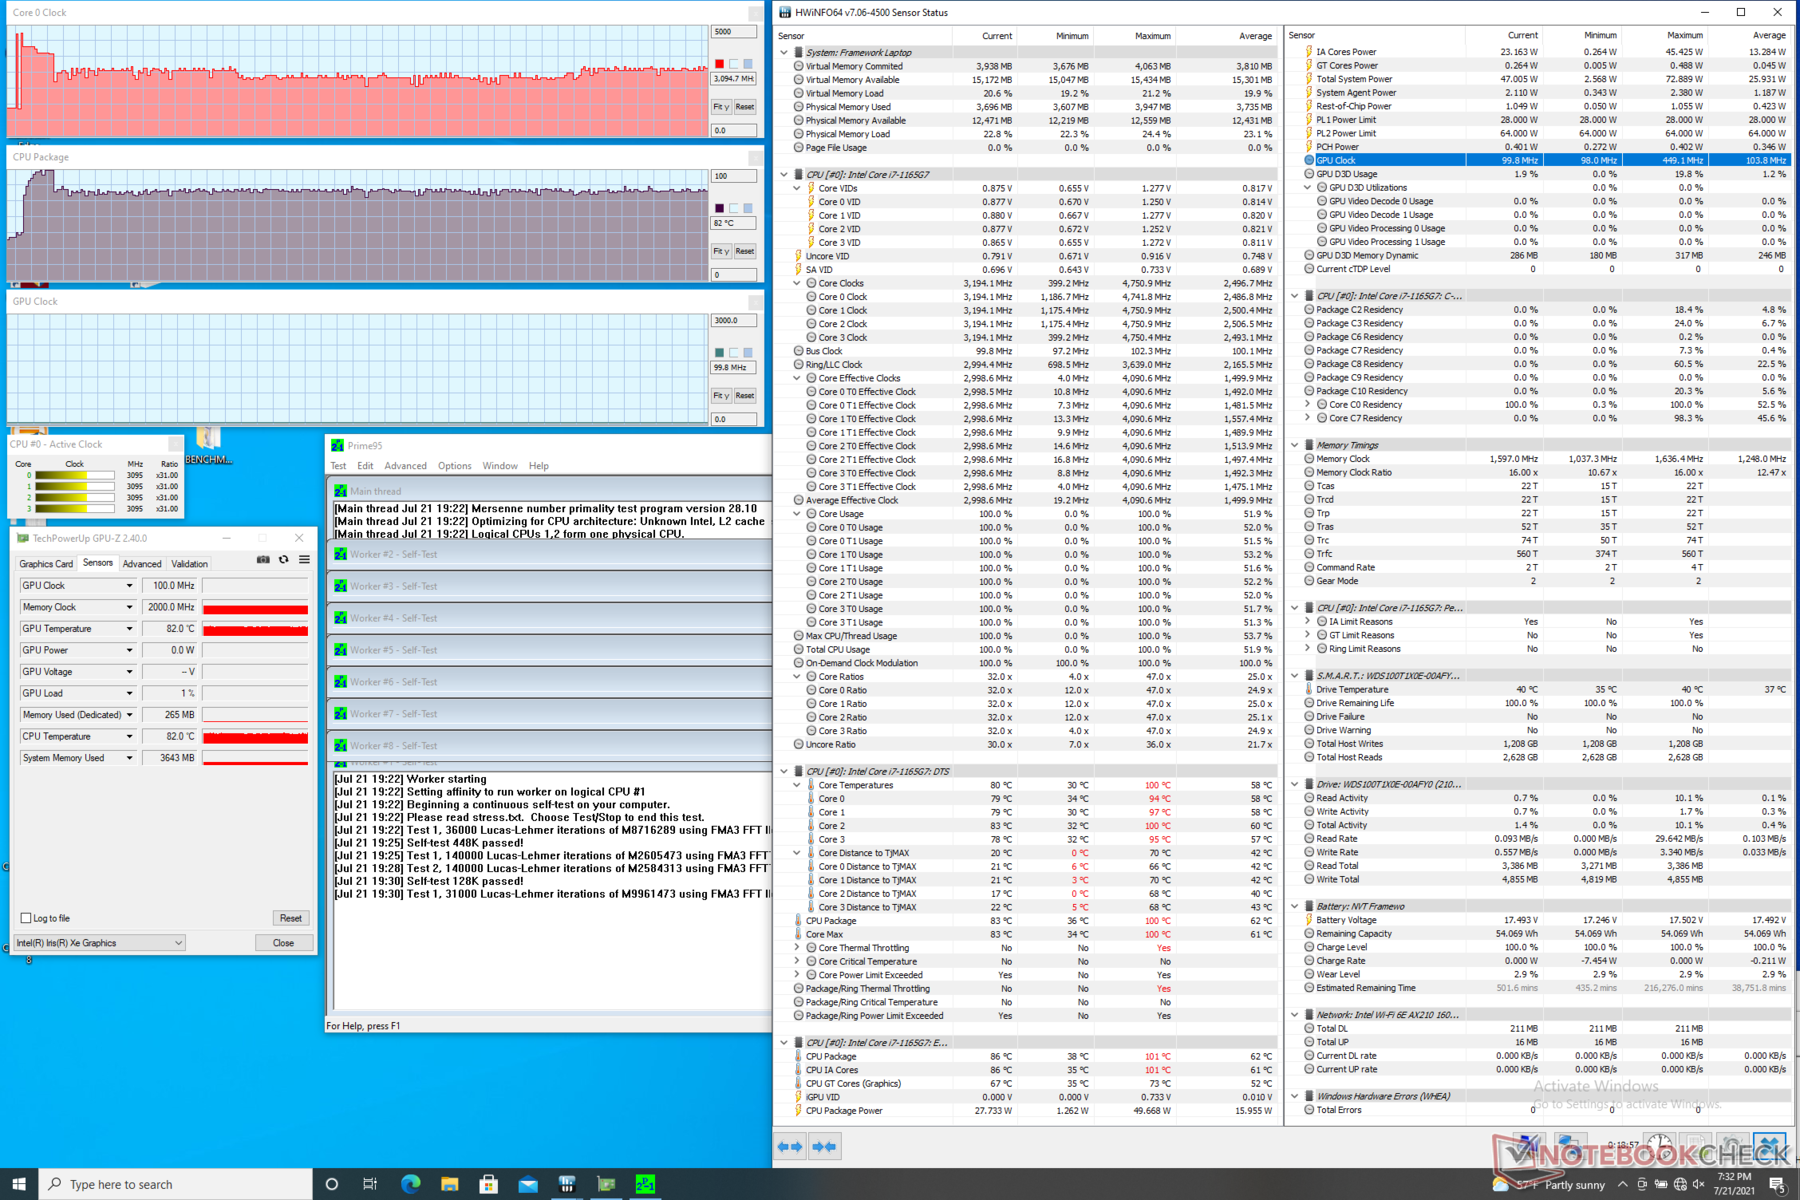
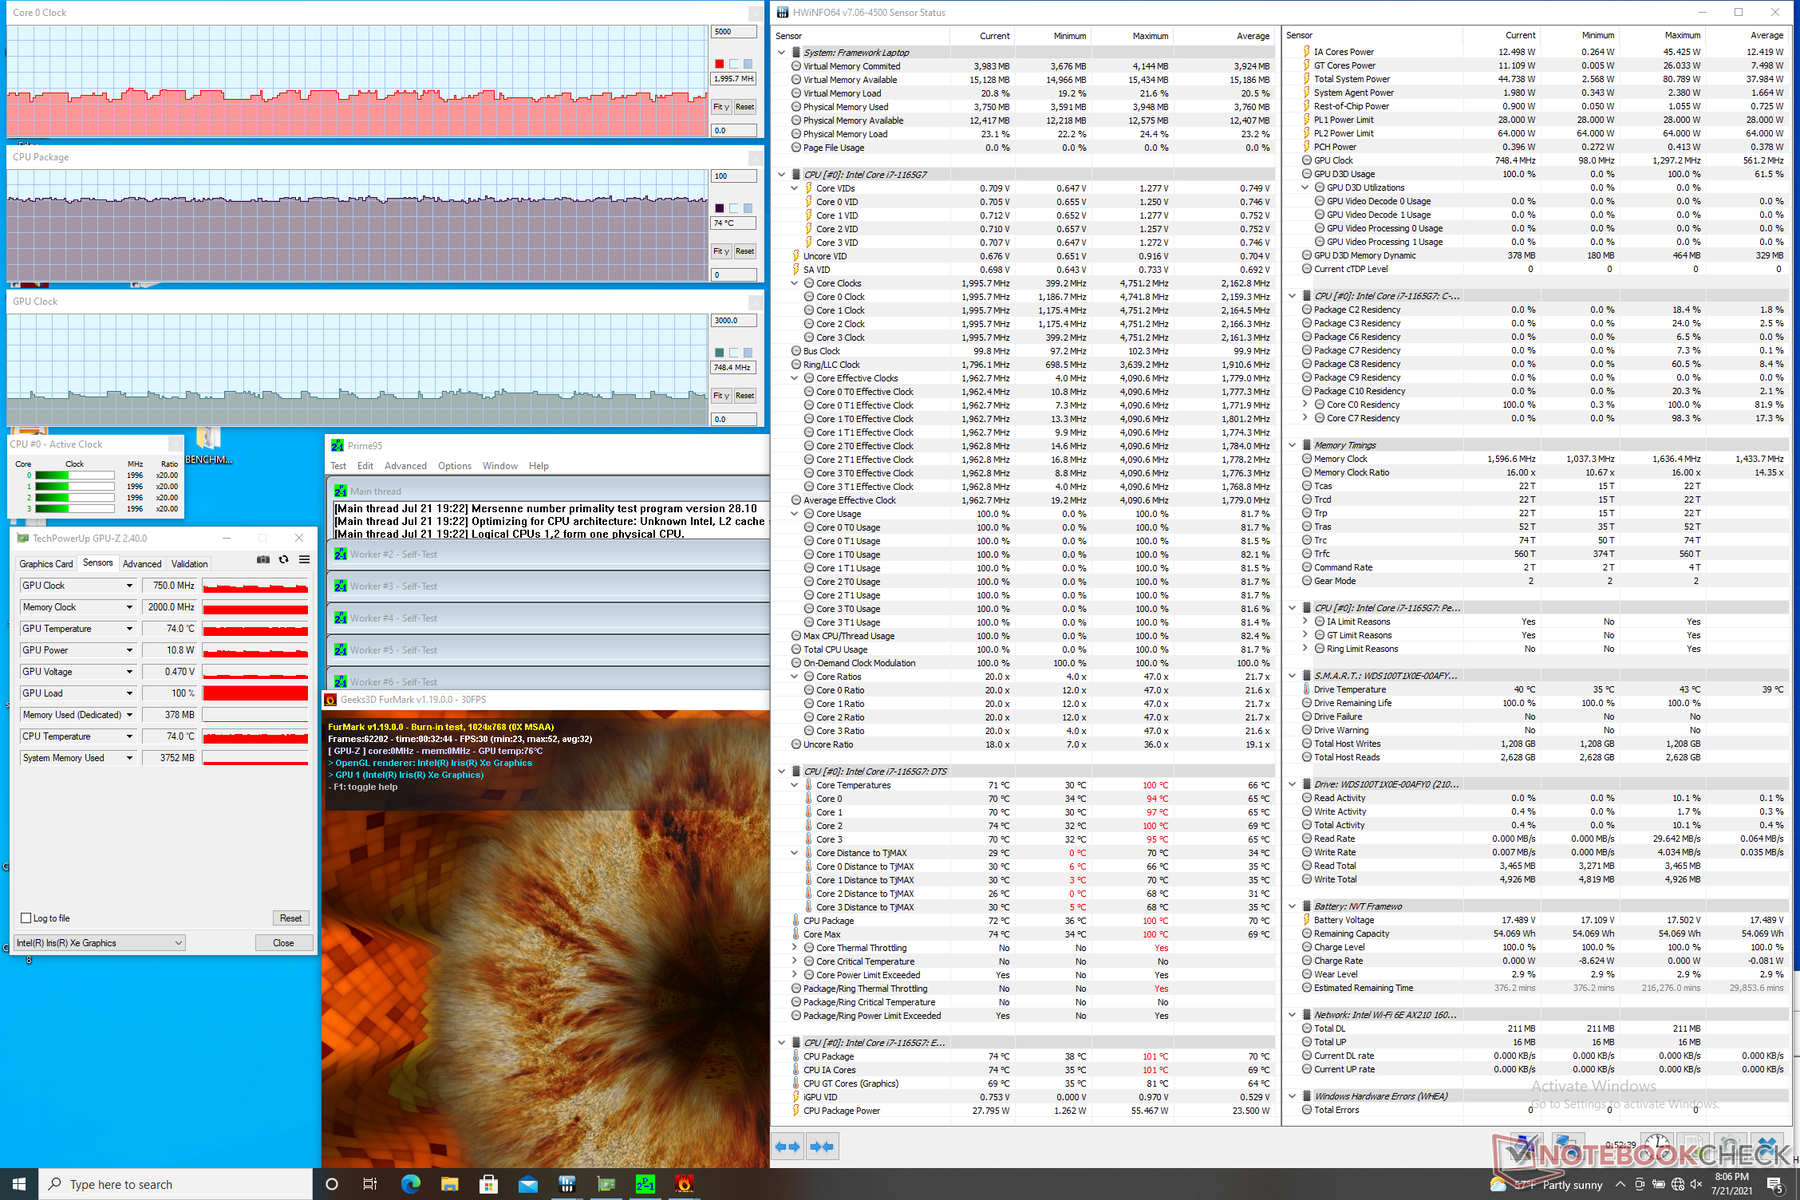
| CPU时钟(GHz) | GPU时钟(MHz) | CPU平均温度(℃) | |
| 系统空闲 | -- | -- | 38 |
| Prime95压力 | ~3.0 | -- | 82 |
| Prime95 + FurMark压力 | 1.6 - 2.0 | 750 - 1000 | 74 |
| Witcher 3 Stress | 3.1 | 1300 | 73 |
发言人

Framework Laptop 13.5 audio analysis
(±) | speaker loudness is average but good (78.2 dB)
Bass 100 - 315 Hz
(±) | reduced bass - on average 13.9% lower than median
(±) | linearity of bass is average (10.1% delta to prev. frequency)
Mids 400 - 2000 Hz
(+) | balanced mids - only 4% away from median
(+) | mids are linear (6% delta to prev. frequency)
Highs 2 - 16 kHz
(±) | higher highs - on average 5.2% higher than median
(+) | highs are linear (6.1% delta to prev. frequency)
Overall 100 - 16.000 Hz
(±) | linearity of overall sound is average (17.3% difference to median)
Compared to same class
» 26% of all tested devices in this class were better, 7% similar, 67% worse
» The best had a delta of 7%, average was 21%, worst was 53%
Compared to all devices tested
» 32% of all tested devices were better, 8% similar, 59% worse
» The best had a delta of 4%, average was 23%, worst was 134%
Apple MacBook 12 (Early 2016) 1.1 GHz audio analysis
(+) | speakers can play relatively loud (83.6 dB)
Bass 100 - 315 Hz
(±) | reduced bass - on average 11.3% lower than median
(±) | linearity of bass is average (14.2% delta to prev. frequency)
Mids 400 - 2000 Hz
(+) | balanced mids - only 2.4% away from median
(+) | mids are linear (5.5% delta to prev. frequency)
Highs 2 - 16 kHz
(+) | balanced highs - only 2% away from median
(+) | highs are linear (4.5% delta to prev. frequency)
Overall 100 - 16.000 Hz
(+) | overall sound is linear (10.2% difference to median)
Compared to same class
» 7% of all tested devices in this class were better, 2% similar, 90% worse
» The best had a delta of 5%, average was 18%, worst was 53%
Compared to all devices tested
» 5% of all tested devices were better, 1% similar, 94% worse
» The best had a delta of 4%, average was 23%, worst was 134%
Energy Management
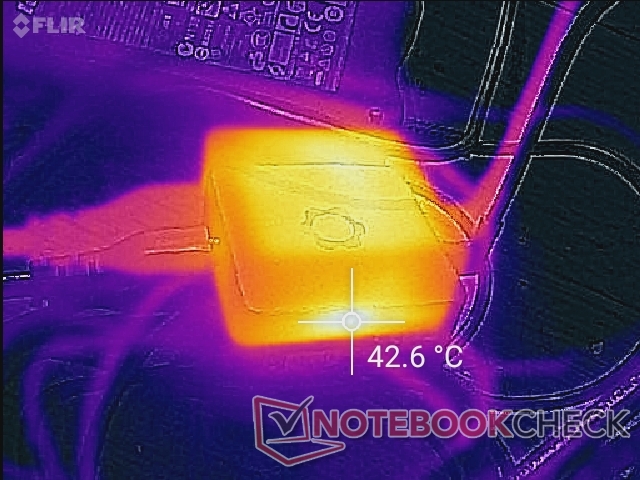
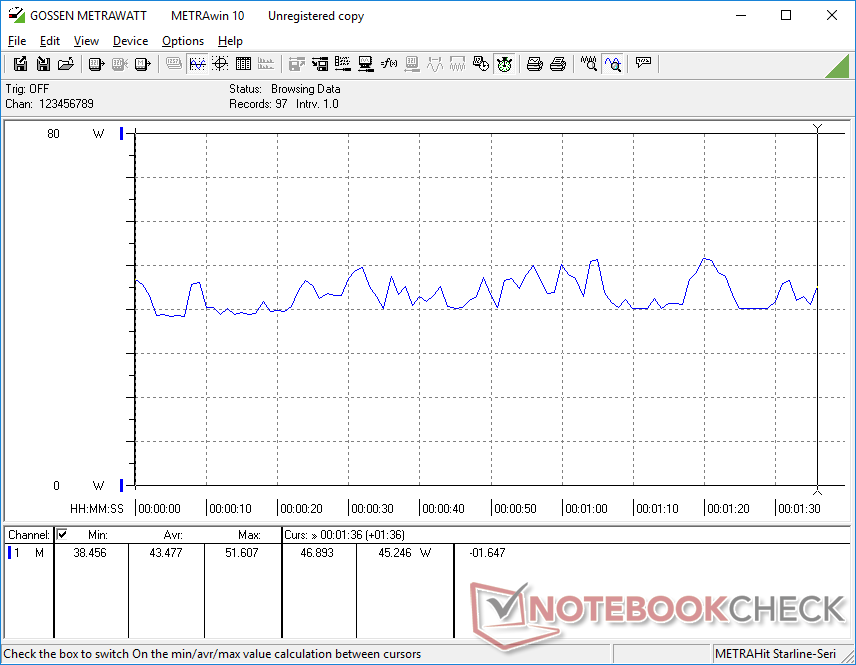
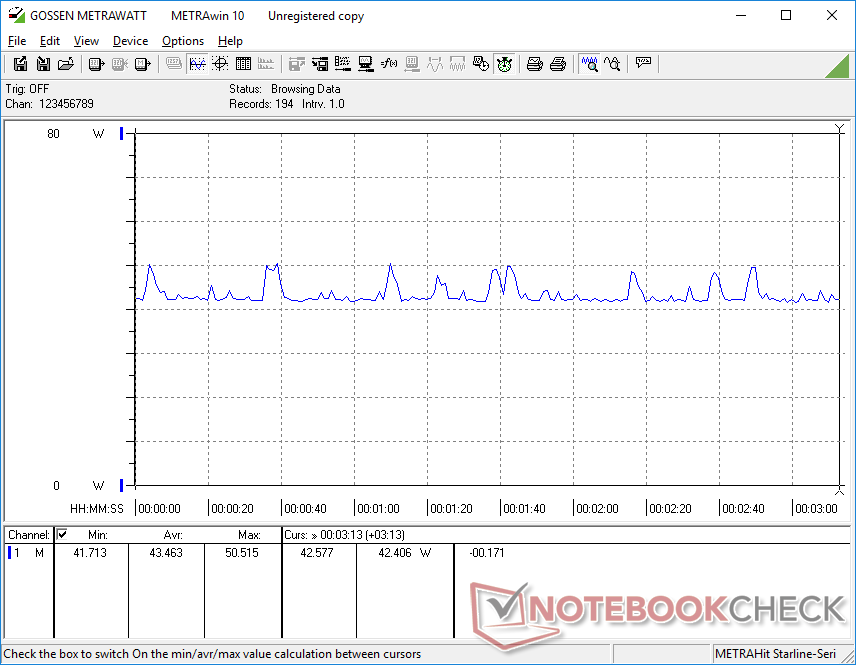
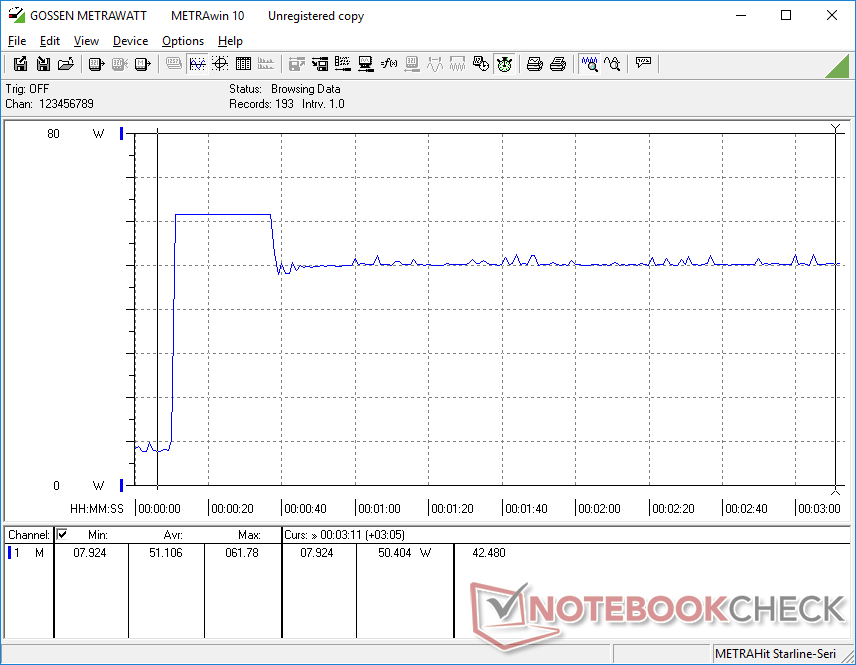
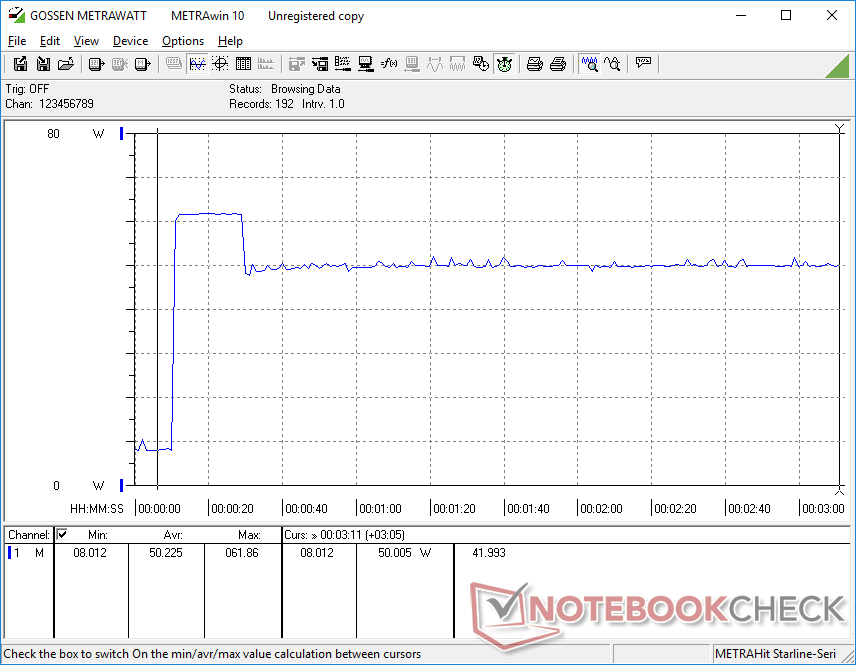
消耗功率
耗电量与 笔记本电脑4 13因为它们拥有类似的处理器和显示屏尺寸。
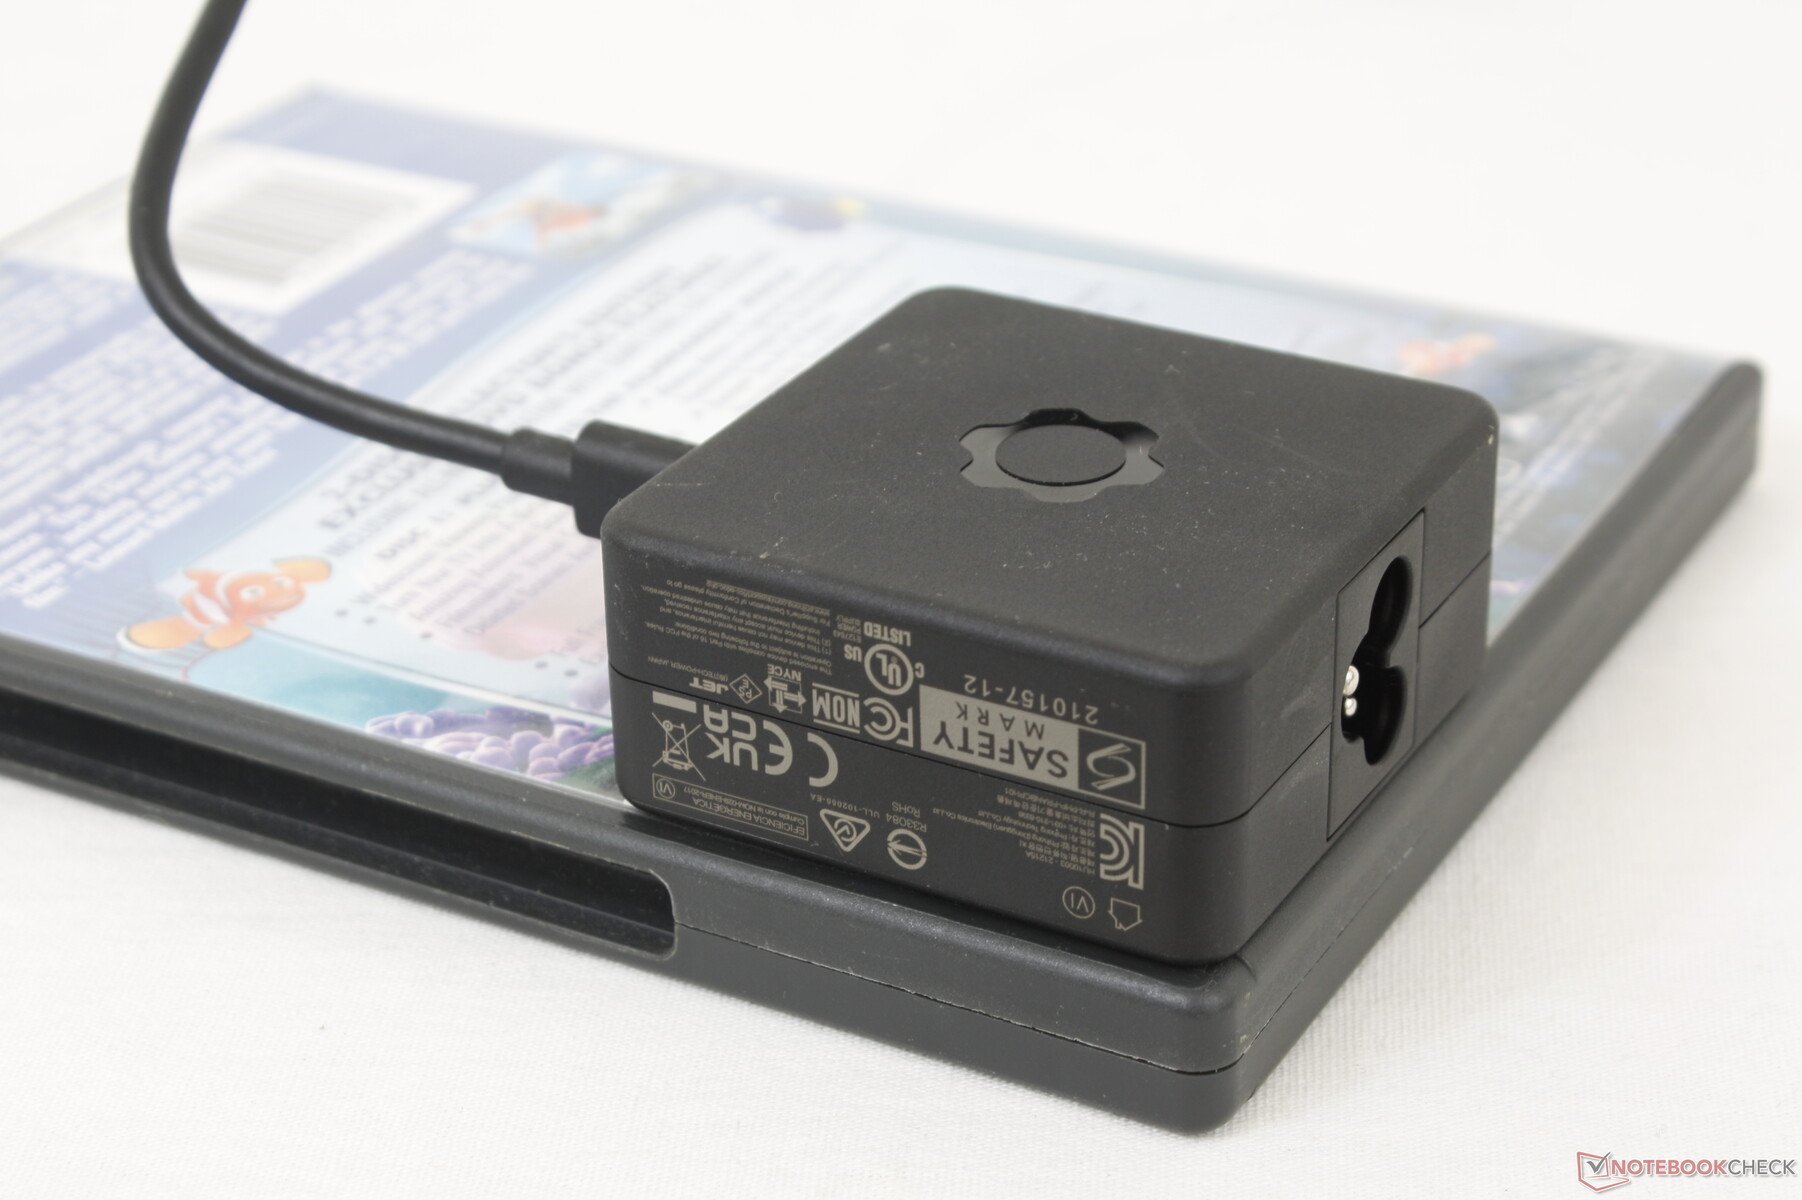
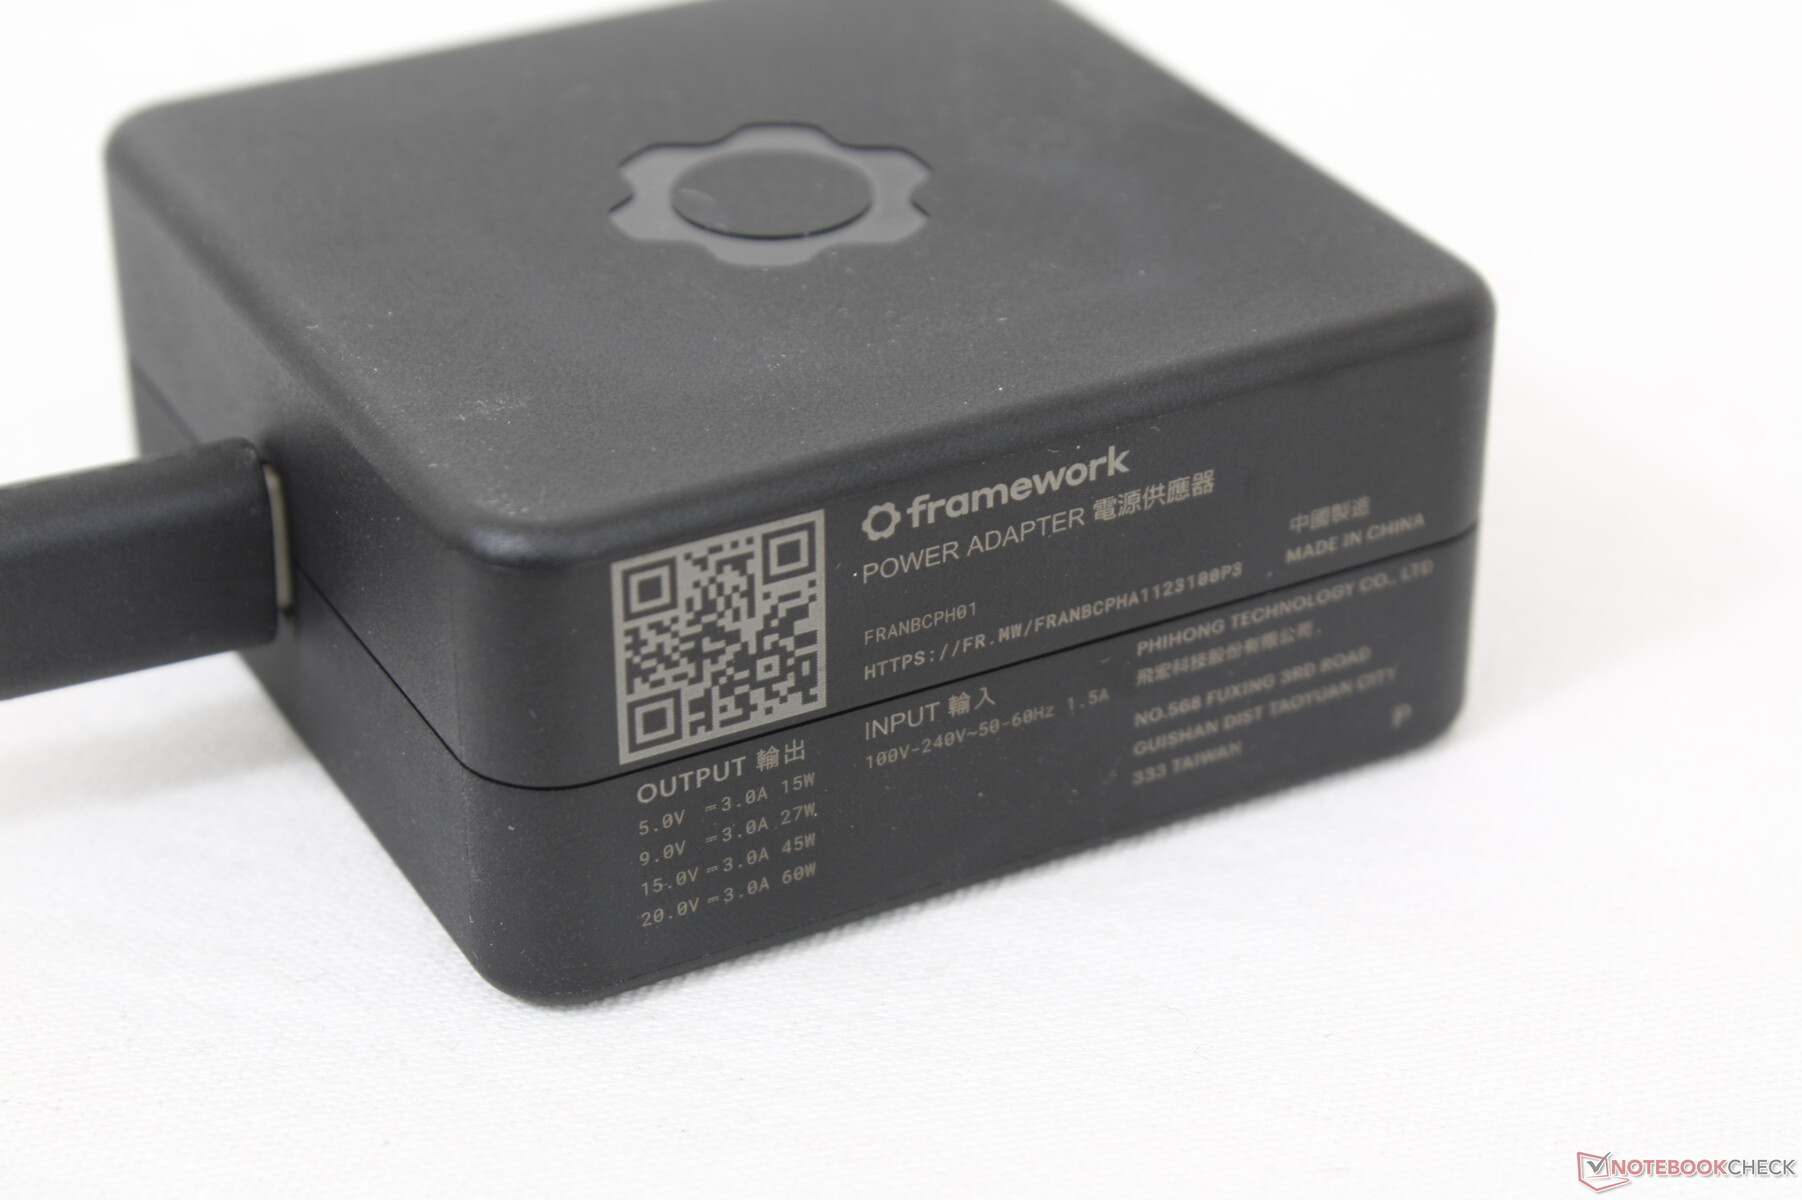
我们能够从小型(约5.8 x 5.8 x 2.7厘米)的60瓦交流适配器测量到61.8瓦的最大消耗。由于机箱的Turbo Boost功能有限,这个比率只是暂时的。
| Off / Standby | |
| Idle | |
| Load |
|
Key:
min: | |
| Framework Laptop 13.5 i7-1165G7, Iris Xe G7 96EUs, Western Digital WD_BLACK SN850 WDS100T1X0E, IPS, 2256x1504, 13.5" | HP Spectre x360 14-ea0378ng i7-1165G7, Iris Xe G7 96EUs, Intel Optane Memory H10 with Solid State Storage 32GB + 1TB HBRPEKNX0203AH(L/H), OLED, 3000x2000, 13.5" | Microsoft Surface Laptop 4 13 i7 i7-1185G7, Iris Xe G7 96EUs, Samsung PM991 MZ9LQ512HALU, IPS, 2256x1504, 13.5" | Lenovo ThinkPad X1 Titanium Yoga G1 20QA001RGE i7-1160G7, Iris Xe G7 96EUs, Toshiba BG4 KBG40ZNT512G, IPS, 2256x1504, 13.5" | HP ProBook x360 435 G8 R7-5800U R7 5800U, Vega 8, Samsung PM991 MZVLQ512HALU, IPS, 1920x1080, 13.3" | Lenovo Yoga 6 13 82ND0009US R5 5500U, Vega 7, WDC PC SN530 SDBPMPZ-265G, IPS, 1920x1080, 13.3" | |
|---|---|---|---|---|---|---|
| Power Consumption | -14% | 15% | 14% | 24% | 14% | |
| Idle Minimum * (Watt) | 4.3 | 6.3 -47% | 2.6 40% | 3.9 9% | 3.2 26% | 5 -16% |
| Idle Average * (Watt) | 8.2 | 11.2 -37% | 6 27% | 7.3 11% | 5.5 33% | 6.3 23% |
| Idle Maximum * (Watt) | 8.7 | 13.3 -53% | 8.2 6% | 10.3 -18% | 6.4 26% | 6.9 21% |
| Load Average * (Watt) | 43.5 | 32 26% | 41.4 5% | 30.6 30% | 35.5 18% | 41.5 5% |
| Witcher 3 ultra * (Watt) | 43.5 | 25.5 41% | 36.4 16% | 33.2 24% | ||
| Load Maximum * (Watt) | 61.8 | 35.6 42% | 64.1 -4% | 57.1 8% | 47.5 23% | 46.5 25% |
* ... smaller is better
Power Consumption Witcher 3 / Stresstest
电池寿命
WLAN运行时间与Spectre x360 14或Surface Laptop 4 13相当,实际浏览时间接近8小时。
从空电到满电只需要不到2小时。充电是通过USB-C完成的,这意味着如果你决定将所有四个端口变成USB-C以外的其他端口,系统就不能再充电。
| Framework Laptop 13.5 i7-1165G7, Iris Xe G7 96EUs, 55 Wh | HP Spectre x360 14-ea0378ng i7-1165G7, Iris Xe G7 96EUs, 66 Wh | Microsoft Surface Laptop 4 13 i7 i7-1185G7, Iris Xe G7 96EUs, 47.4 Wh | Lenovo ThinkPad X1 Titanium Yoga G1 20QA001RGE i7-1160G7, Iris Xe G7 96EUs, 44.5 Wh | HP ProBook x360 435 G8 R7-5800U R7 5800U, Vega 8, 45 Wh | Lenovo Yoga 6 13 82ND0009US R5 5500U, Vega 7, 60 Wh | |
|---|---|---|---|---|---|---|
| Battery runtime | -2% | -5% | 5% | 19% | 65% | |
| WiFi v1.3 (h) | 8 | 7.8 -2% | 7.6 -5% | 8.4 5% | 9.5 19% | 13.2 65% |
| Reader / Idle (h) | 13.4 | 17.5 | ||||
| Load (h) | 2.6 | 1.4 | 1.9 | 1.1 | 2 |
Pros
Cons
判决书
很多时候,制造商会设计出薄而有吸引力的笔记本电脑,如果不是无法维修,也是令人讨厌的困难。即使是简单的升级,如内存或存储,通常也不被鼓励。框架笔记本电脑证明了轻薄型产品不一定要牺牲终端用户的可维修性,也不一定要为了便携性或尺寸而牺牲可更换的端口等独特功能。
框架笔记本电脑在自己的游戏中击败了Surface Laptop。它设法在不牺牲性能或便携性的情况下,变得更小,明显更容易维修,并且有更多的集成端口。
框架笔记本电脑的一些东西可以改进。特别是盖子和铰链比竞争对手的XPS 13更弱。 戴尔XPS 13, 惠普Spectre x360 14, 微软Surface Laptop, 或 联想ThinkBook型号。此外,在运行更高的负载时,风扇的噪音也更大。这些都不是问题,但更硬的铰链、更大和更安静的冷却解决方案,以及显示屏的边缘到边缘玻璃加固,将使框架更加完美。
价格和可用性
Framework目前正在向消费者提供其笔记本电脑向消费者提供,酷睿i5配置的起价为749美元。
Framework Laptop 13.5
- 07/26/2021 v7 (old)
Allen Ngo
Price comparison

