Notebookcheck Logo

Apple M3 Pro 18-Core GPU

Apple M3 Pro 18-Core GPU

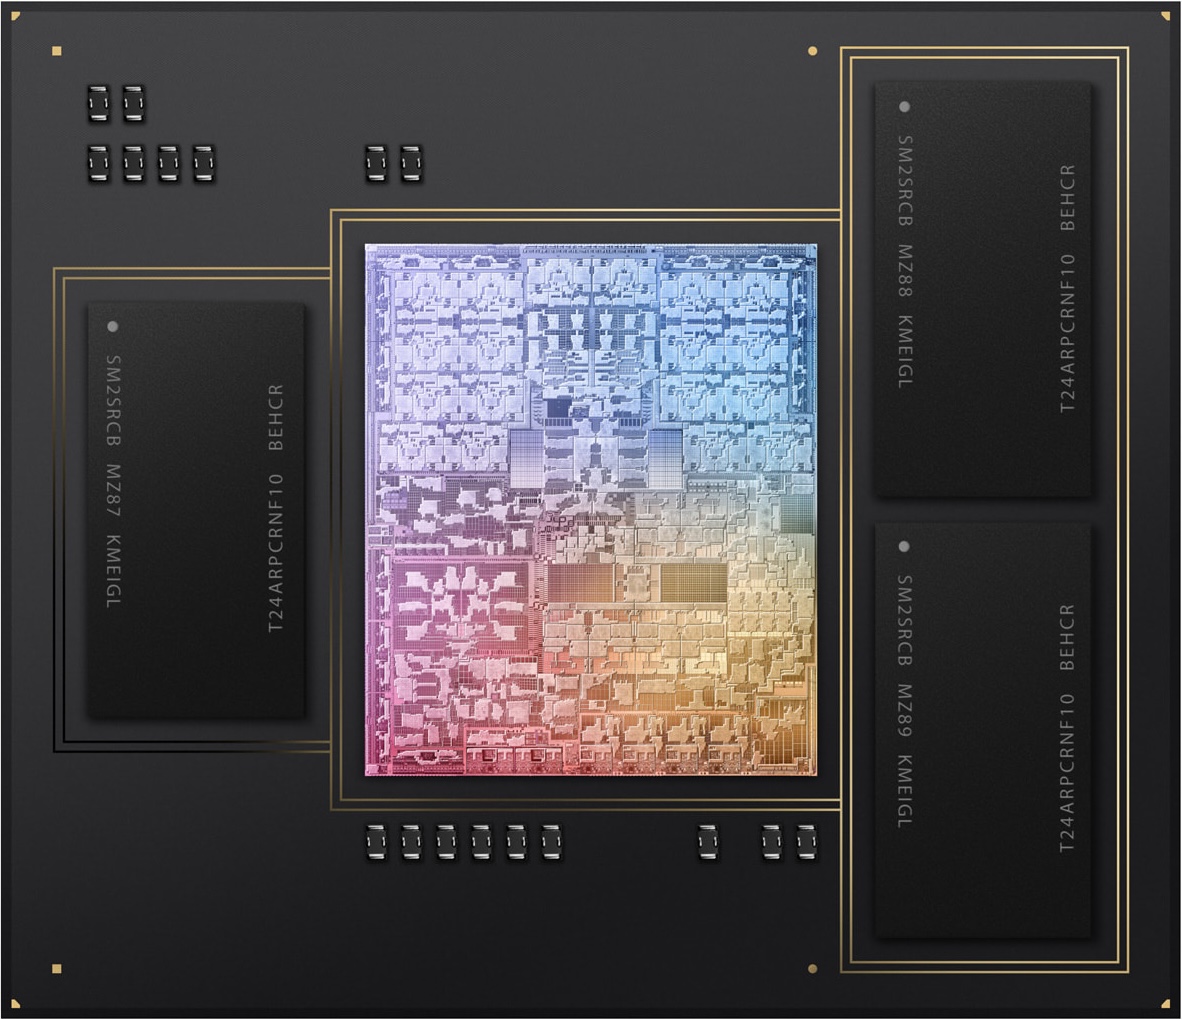
Apple M2 Max 38-Core-GPU 是Apple 的一款集成显卡,提供 M2 Max 芯片中的全部 38 个内核。M2 Max 芯片.

该显卡没有专用显存,但可以使用具有 512 位总线(高达 400 GBit/s)的快速 LPDDR5-6400 统一显存。

由于增加了内核和架构上的改进,M2 Max GPU 明显优于旧的 M1 Max GPUM1 Max GPU 的 32 个内核,从而成为目前最快的 iGPU。

该 GPU 将使用Apple Metal 2 API,但仍可能基于较老的 PowerVR 架构(最后用于Apple A10)。2023 年款 MacBook Pro 14 和 16 的一个新功能是支持 HDMI 2.1 和 8k 输出。

Apple M2 Max 采用台积电第二代 5 纳米工艺制造。根据内部功耗测量工具,GPU 功耗高达 53.6 瓦(性能模式),整个芯片(包括 CPU)功耗高达 89 瓦。

Apple M3 Series

M3 Max 40-Core GPU 40
M3 Max 30-Core GPU 30
M3 Pro 18-Core GPU 18
M3 Pro 14-Core GPU 14
M3 10-Core GPU 10
M3 8-Core GPU 8
Pipelines18 - unified
Memory TypeLPDDR5-6400
Shared Memoryno
technology5 nm
Notebook Sizemedium sized
Date of Announcement31.10.2023
CPU in M3 Pro 18-Core GPUGPU Base SpeedGPU Boost / Turbo
Apple M3 Pro 12-Core12 x 2748 MHz, 27 W? MHz? MHz

Benchmarks

Blender - Blender 3.3 Classroom METAL *
69 Seconds (7%)
GFXBench - GFXBench 5.0 Aztec Ruins High Tier Offscreen
219.7 fps (40%)
3.3 -98%
...
NVIDIA Quadro RTX 5000 Max-Q
153 -30%
161.4 -27%
Apple M1 Pro 16-Core GPU
166 -24%
178.7 -19%
181.1 -18%
185.4 -16%
187 -15%
208 -5%
210.6 -4%
Apple M3 Pro 18-Core GPU
219.7
Apple M1 Max 24-Core GPU
240 9%
242.3 10%
248.5 13%
261.5 19%
288.5 31%
Apple M1 Max 32-Core GPU
309.4 41%
326.1 48%
397.6 81%
431 96%
...
536 144%
0%
100%
GFXBench - GFXBench 5.0 Aztec Ruins Normal Tier Offscreen
580 fps (43%)
GFXBench - GFXBench Car Chase Offscreen
436 fps (49%)
GFXBench 3.1 - GFXBench Manhattan ES 3.1 Offscreen
670 fps (14%)
GFXBench 3.0 - GFXBench 3.0 Manhattan Offscreen
936 fps (55%)
GFXBench (DX / GLBenchmark) 2.7
GFXBench T-Rex HD Offscreen C24Z16 +
GFXBench (DX / GLBenchmark) 2.7 - GFXBench T-Rex HD Offscreen C24Z16
1480 fps (12%)
Geekbench 6.2 - Geekbench 6.2 GPU Metal
78324 points (50%)
Power Consumption - The Witcher 3 Power Consumption - external Monitor *
40 Watt (6%)
0510152025303540Tooltip
Power Consumption - Witcher 3 Power Consumption *
52.1 Watt (11%)
05101520253035404550Tooltip
Power Consumption - Witcher 3 ultra Power Efficiency - external Monitor
min: 1.075     avg: 1.1     median: 1.1 (89%)     max: 1.207 fps per Watt
Emissions Witcher 3 Fan Noise +
Emissions - Witcher 3 Fan Noise
25.1 dB(A) (40%)
- Range of benchmark values for this graphics card
- Average benchmark values for this graphics card
* Smaller numbers mean a higher performance

Game Benchmarks

The following benchmarks stem from our benchmarks of review laptops. The performance depends on the used graphics memory, clock rate, processor, system settings, drivers, and operating systems. So the results don't have to be representative for all laptops with this GPU. For detailed information on the benchmark results, click on the fps number.

Total War Pharaoh

Total War Pharaoh

2023
low 1920x1080
212  fps    + Compare
med. 1920x1080
140  fps    + Compare
high 1920x1080
77  fps    + Compare
ultra 1920x1080
58  fps    + Compare
QHD 2560x1440
42  fps    + Compare
» With all tested laptops playable in detail settings ultra.
Cyberpunk 2077 2.0 Phantom Liberty

Cyberpunk 2077 2.0 Phantom Liberty

2023
low 1920x1080
53  fps    + Compare
med. 1920x1080
42.6  fps    + Compare
high 1920x1080
35  fps    + Compare
ultra 1920x1080
30.8  fps    + Compare
» With all tested laptops playable in detail settings med..
high 1920x1080
53  fps    + Compare
ultra 1920x1080
43  fps    + Compare
» With all tested laptops playable in detail settings ultra.
high 1920x1080
30  fps    + Compare
ultra 1920x1080
26  fps    + Compare
QHD 2560x1440
17  fps    + Compare
» The benchmarks indicate that the game is not playable in the tested settings.
med. 1920x1080
87  fps    + Compare
high 1920x1080
56  fps    + Compare
ultra 1920x1080
41  fps    + Compare
QHD 2560x1440
25  fps    + Compare
» With all tested laptops playable in detail settings ultra.
med. 1920x1080
71  fps    + Compare
high 1920x1080
65  fps    + Compare
ultra 1920x1080
57  fps    + Compare
QHD 2560x1440
37  fps    + Compare
» With all tested laptops playable in detail settings ultra.
ultra 1920x1080
43  fps    + Compare
» With all tested laptops playable in detail settings ultra.
GTA V

GTA V

2015
med. 1366x768
90  fps    + Compare
high 1920x1080
79  fps    + Compare
ultra 1920x1080
52  fps    + Compare
QHD 2560x1440
49  fps    + Compare
» With all tested laptops playable in detail settings ultra.
lowmed.highultraQHD4K
Total War Pharaoh212140775842
Cyberpunk 2077 2.0 Phantom Liberty5342.63530.8
Baldur's Gate 35343
Star Wars Jedi Survivor302617
Total War: Three Kingdoms87564125
Shadow of the Tomb Raider71655737
The Witcher 343
GTA V90795249
< 30 fps
< 60 fps
< 120 fps
≥ 120 fps

1

1

1
3
1

4
3
1
7

2
3


For more games that might be playable and a list of all games and graphics cards visit our Gaming List

v1.26
log 24. 12:02:17

#0 no ids found in url (should be separated by "_") +0s ... 0s

#1 not redirecting to Ajax server +0s ... 0s

#2 did not recreate cache, as it is less than 5 days old! Created at Mon, 22 Apr 2024 05:40:21 +0200 +0.001s ... 0.001s

#3 no comparison url found in template nbc.compare_page_1 needed +0.051s ... 0.053s

#4 no comparison url found in template nbc.compare_page_1 needed +0s ... 0.053s

#5 no comparison url found in template nbc.compare_page_1 needed +0s ... 0.053s

#6 no comparison url found in template nbc.compare_page_1 needed +0s ... 0.053s

#7 no comparison url found in template nbc.compare_page_1 needed +0s ... 0.053s

#8 composed specs +0s ... 0.053s

#9 did output specs +0s ... 0.053s

#10 start showIntegratedCPUs +0s ... 0.054s

#11 getting avg benchmarks for device 11638 +0.021s ... 0.075s

#12 got single benchmarks 11638 +0.01s ... 0.085s

#13 got avg benchmarks for devices +0s ... 0.085s

#14 min, max, avg, median took s +0.254s ... 0.339s

#15 before gaming benchmark output +0s ... 0.339s

#16 Got 27 rows for game benchmarks. +0.007s ... 0.345s

#17 composed SQL query for gamebenchmarks +0s ... 0.345s

#18 got data and put it in $dataArray +0.006s ... 0.352s

#19 benchmarks composed for output. +0.332s ... 0.684s

#20 no comparison url found in template nbc.compare_page_1 needed +0.002s ... 0.686s

#21 return log +0s ... 0.686s

Please share our article, every link counts!

» Comparison of GPUs
Detailed list of all laptop GPUs sorted by class and performance.

» Benchmark List
Sort and restrict laptop GPUs based on performance in synthetic benchmarks.

» Notebook Gaming List
Playable games for each graphics card and their average FPS results.

Class 1

GeForce RTX 2080 Super Mobile

Class 2

M1 Max 32-Core GPU *
GeForce RTX 2070 Super Mobile
M1 Max 24-Core GPU *
Quadro RTX 5000 Max-Q
Radeon RX 5700M *
GeForce GTX 1080 Mobile
Quadro RTX 4000 (Laptop)
M1 Pro 16-Core GPU *
Radeon PRO W6600M *
GeForce RTX 2070 Super Max-Q
Quadro RTX 4000 Max-Q *
M1 Pro 14-Core GPU *
Quadro P5200
Quadro RTX 3000 Max-Q *
Quadro P4200
Quadro P5000 Max-Q *
GeForce GTX 980 (Laptop)
Quadro P4000
Quadro P4000 Max-Q
Quadro P3200
Radeon RX 580X (Laptop) *
Radeon RX 580 (Laptop)
Radeon Pro 5300M
Radeon RX 5300M
Quadro P3000 Max-Q *
Quadro T2000 Max-Q *
Radeon Pro WX 7100 *
Radeon RX 570X (Laptop) *
Radeon RX 570 (Laptop) *
Radeon RX 470 (Laptop) *
Quadro T1000 Max-Q *

Class 3

Vega M GH
Quadro M5000M
GeForce GTX 1050 Ti Mobile
Radeon 680M
Quadro P2000
Quadro P2000 Max-Q
Quadro M4000M
T500 Laptop GPU *
Radeon R9 M395X
GeForce GTX 1050 Ti Max-Q *
Radeon Pro Vega 16
WX Vega M GL
Radeon R9 M485X
Quadro M3000M
FirePro W7170M
Radeon R9 M395
GeForce GTX 1050 Max-Q *
Radeon 660M
Radeon Pro WX 4150 *
Radeon RX 560X (Laptop)
Radeon RX 560 (Laptop)
Radeon RX 460 (Laptop)
Quadro P1000
Radeon R9 M390
Xe MAX
Radeon Pro 560X
Radeon Pro 560
Radeon Pro 460
Radeon Pro WX 4130 *
GeForce GTX 960M
Quadro P620 *
Radeon RX 550X (Laptop)
Radeon Pro WX 3200 *
Radeon Pro 555X
Radeon Pro 555
Radeon Pro 455
Quadro P600
Quadro M2000M
Radeon RX 540X *
Radeon Pro WX 2100 *
Radeon Pro WX 3100 *
GeForce GTX 950M
Radeon Pro 450
Radeon 630
Radeon 540X *
Radeon R9 M385X
Quadro P520
Quadro M1000M
GeForce 945M
Quadro P500 *
Iris Plus Graphics G7 (Ice Lake 64 EU) *
Vega 10 *
Iris Pro Graphics 580
FirePro W5170M *
Radeon R9 M370X
Vega 9
FirePro W5130M
UHD Graphics Xe G4 48EUs *
UHD Graphics 32EUs
UHD Graphics Xe 32EUs (Tiger Lake-H) *
UHD Graphics 750
Vega 7
Radeon R7 M465
Iris Pro Graphics 6200
Vega 8
GeForce 940M
Iris Plus Graphics G4 (Ice Lake 48 EU)
Quadro M600M
FirePro W4190M
Radeon R9 M375
Radeon R7 M445
Iris Plus Graphics 650
Iris Graphics 550
Radeon 625
Vega 6 *
Iris Plus Graphics 640
Iris Graphics 540
UHD Graphics 24EUs (Alder Lake-N) *
Radeon R7 M360
GeForce 920M
Radeon 620
Radeon R7 M340
Radeon 610
Radeon 610M *
Vega 6 *
UHD Graphics G1 (Ice Lake 32 EU)
UHD Graphics Xe 16EUs (Tiger Lake-H) *
HD Graphics 530
Radeon R5 (Bristol Ridge)
Adreno 690 *
Adreno 685 *
Adreno 680 *
Radeon R5 M330
GeForce 910M
HD Graphics 520

Class 4

UHD Graphics 730
Radeon R5 M320 *
Radeon R5 M315 *
Radeon R5 M420 *
Vega 2 *
UHD Graphics 617
UHD Graphics 615
HD Graphics 515
UHD Graphics 610
HD Graphics 510
UHD Graphics 605
Radeon R4 (Stoney Ridge)
Radeon R2 (Stoney Ridge)
HD Graphics (Broadwell)
UHD Graphics 600
HD Graphics (Braswell)

Class 5

* Approximate position of the graphics adapter