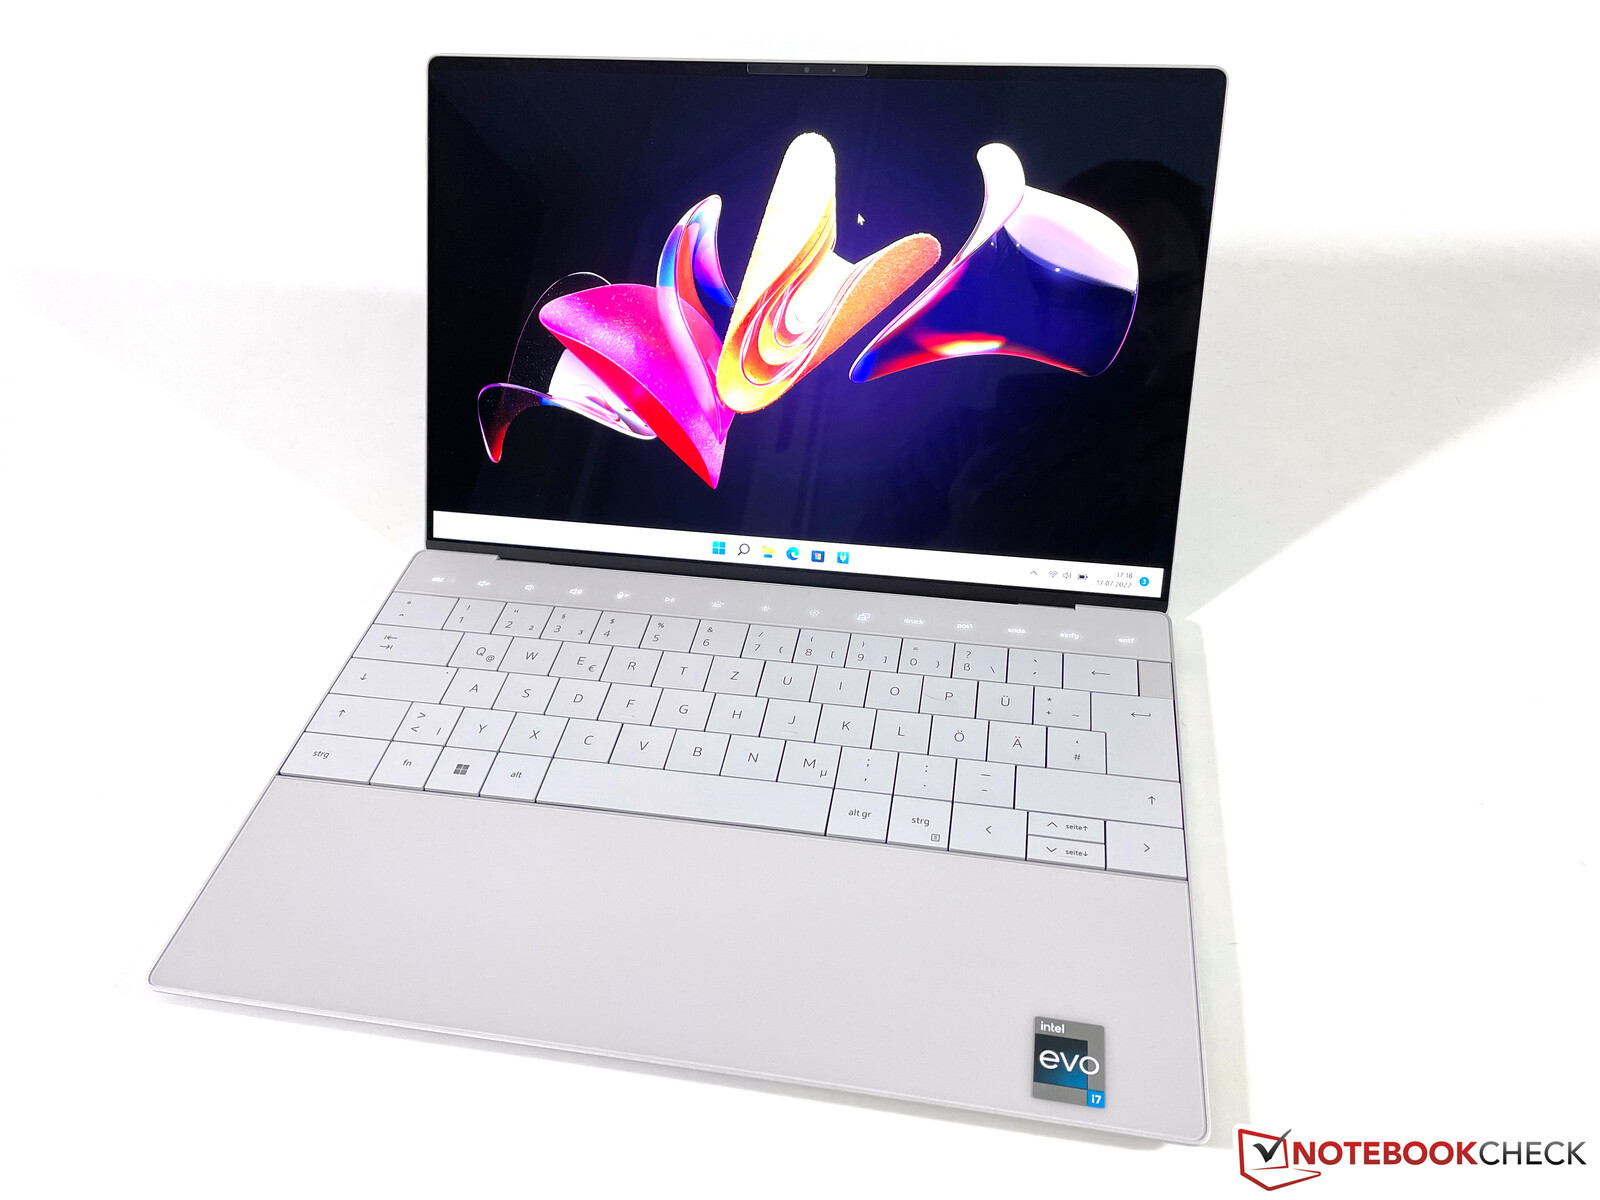
戴尔XPS 13 Plus 9320笔记本电脑评测--XPS 13现在有了触摸条
戴尔从现在开始提供两个版本的紧凑型XPS 13;采用Alder Lake U系列CPU的普通XPS 13,起价999美元,以及采用更强大的Alder Lake P系列芯片的新XPS 13 Plus,起价1299美元。这两款机型都使用了全新的外壳,与之前的机型相比有很大的变化XPS 13 9310几年来基本没有变化。
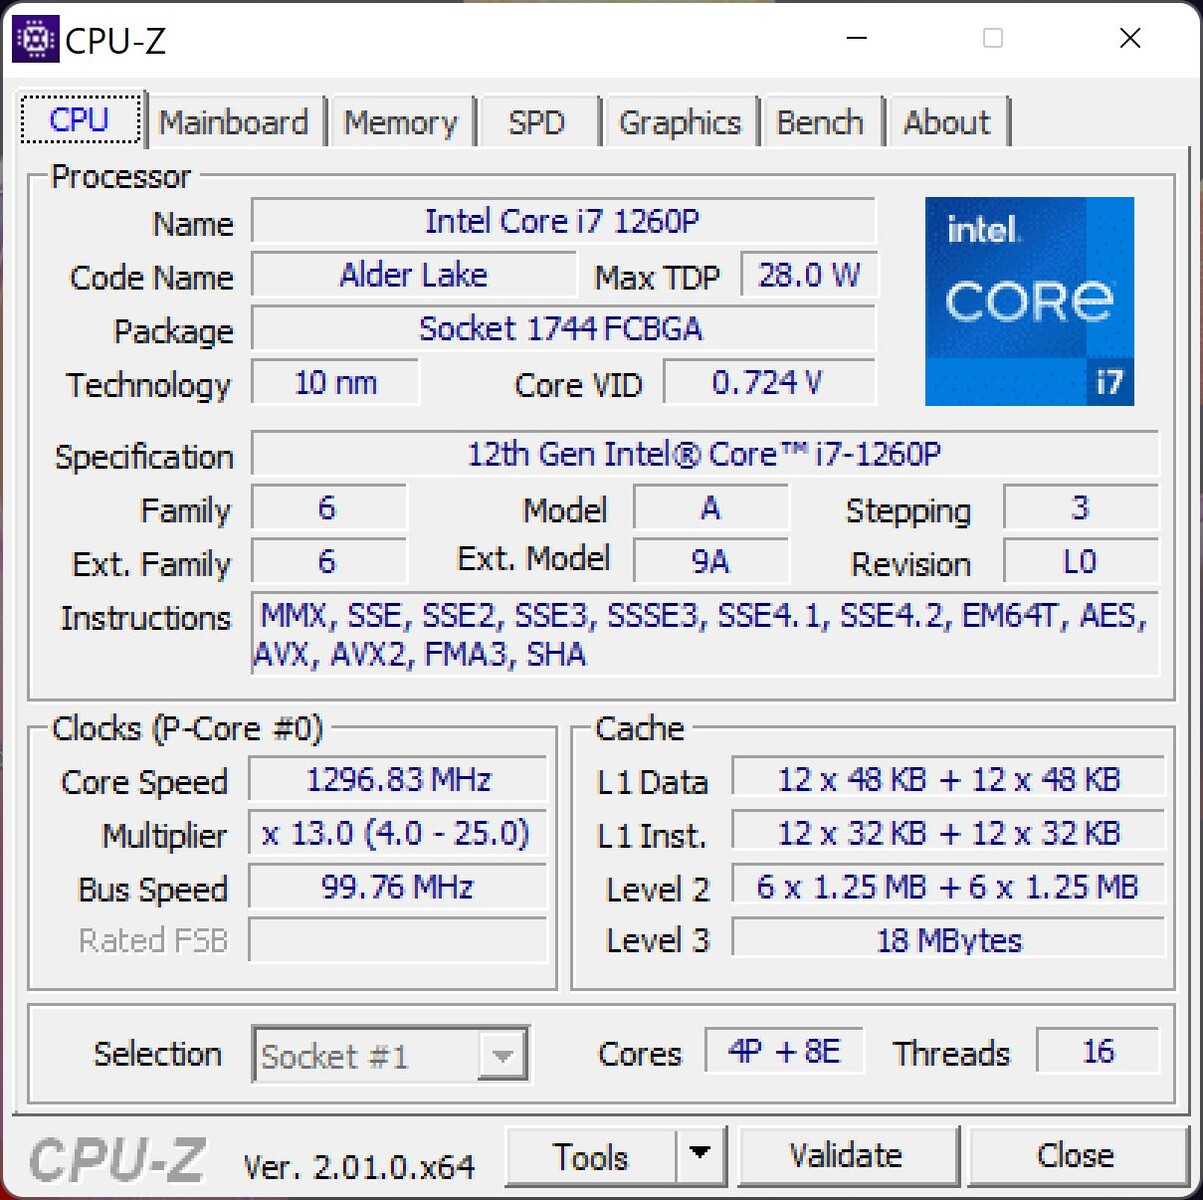
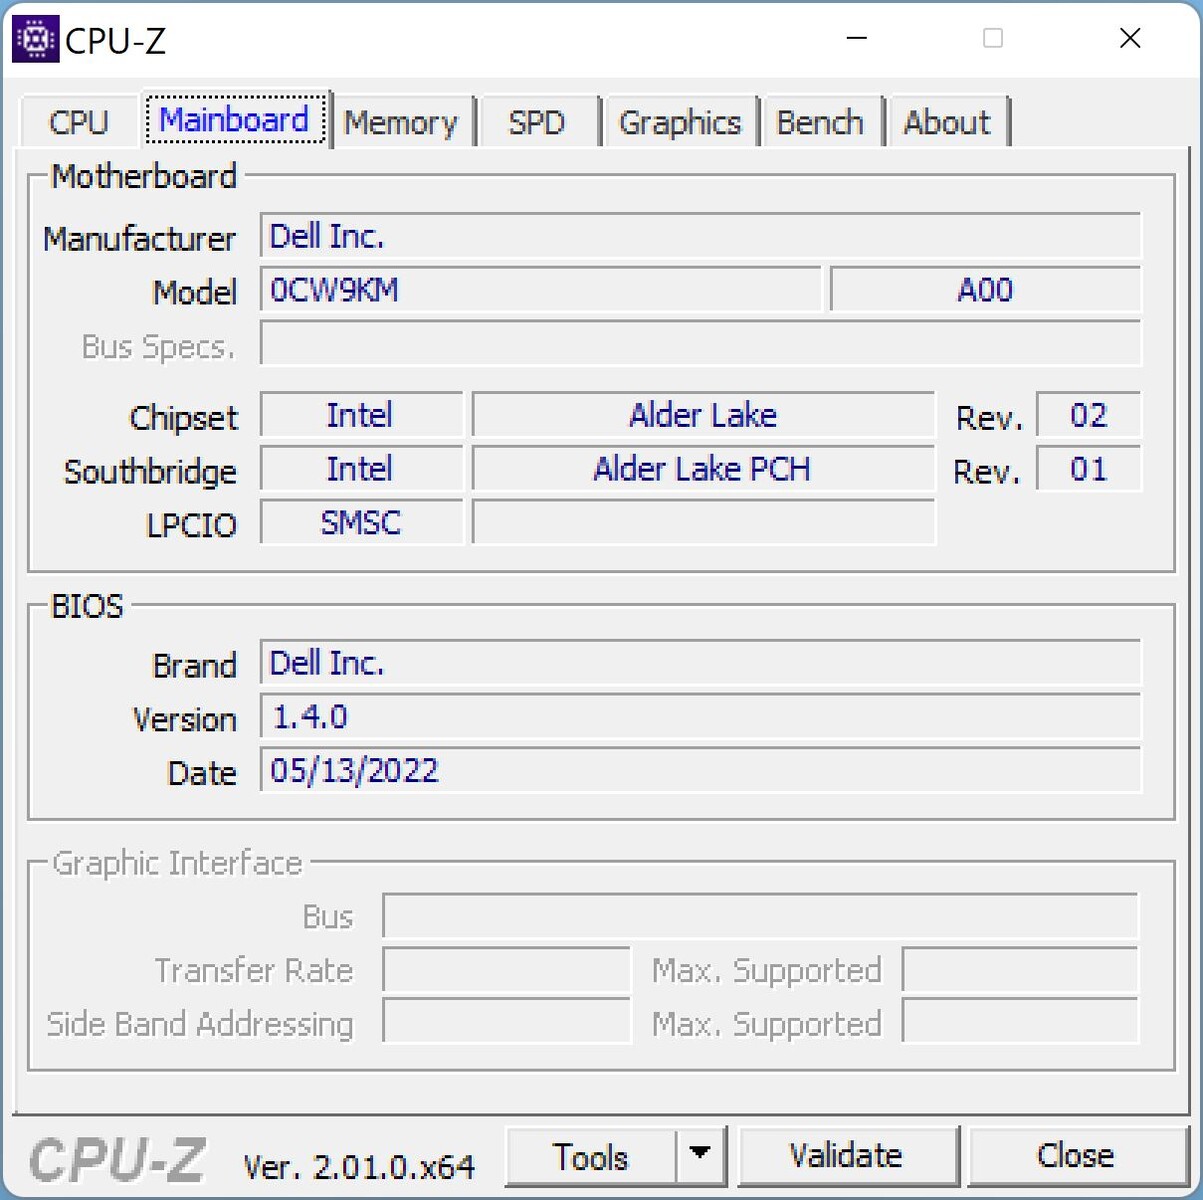
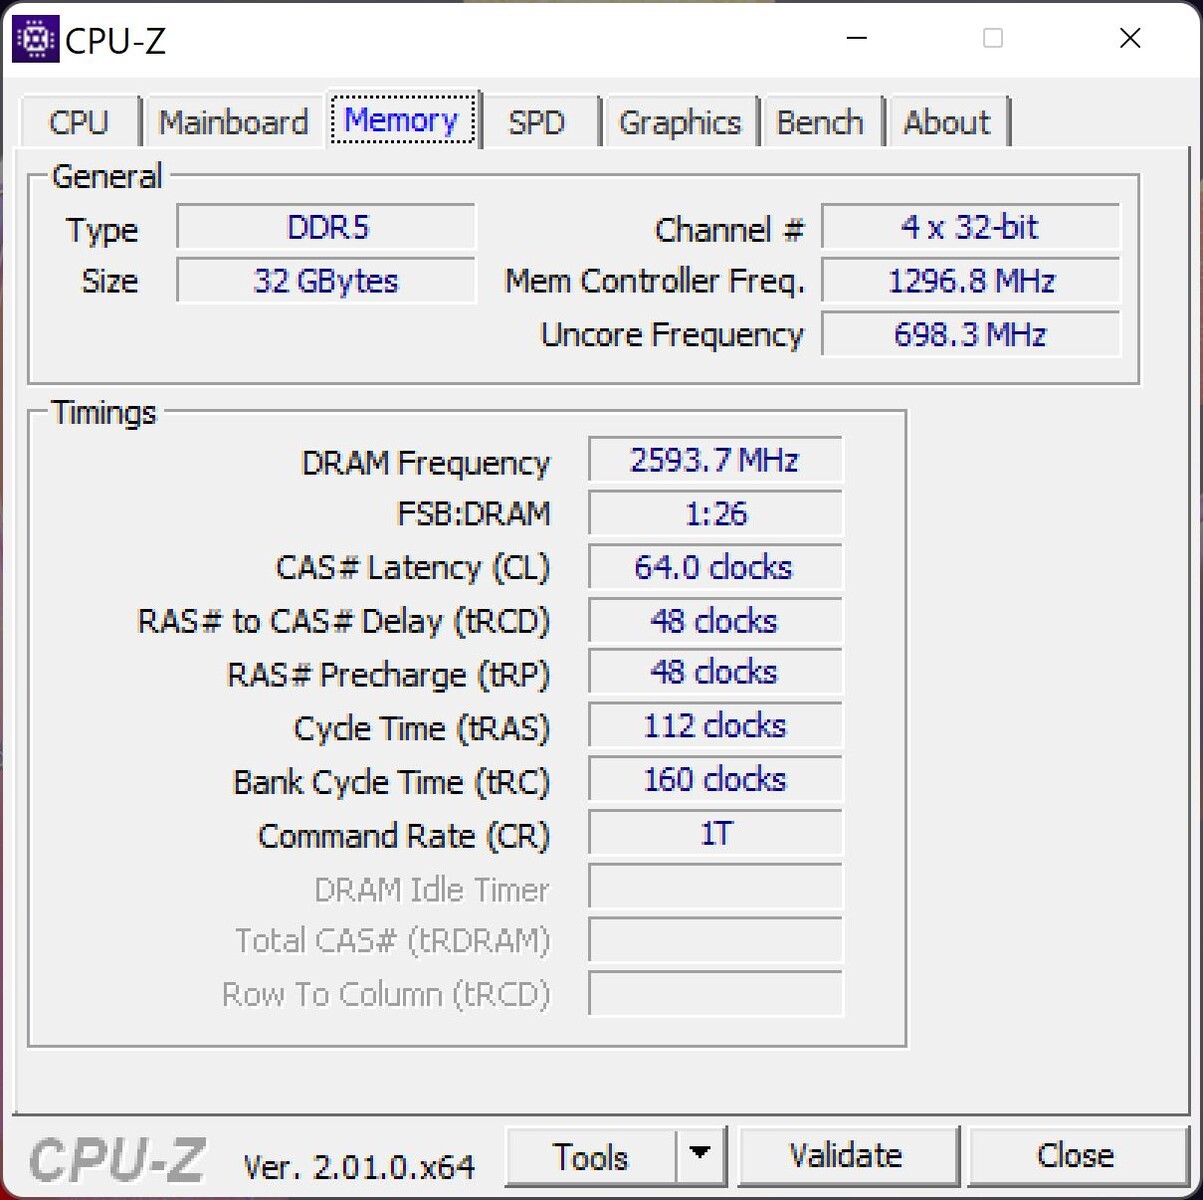
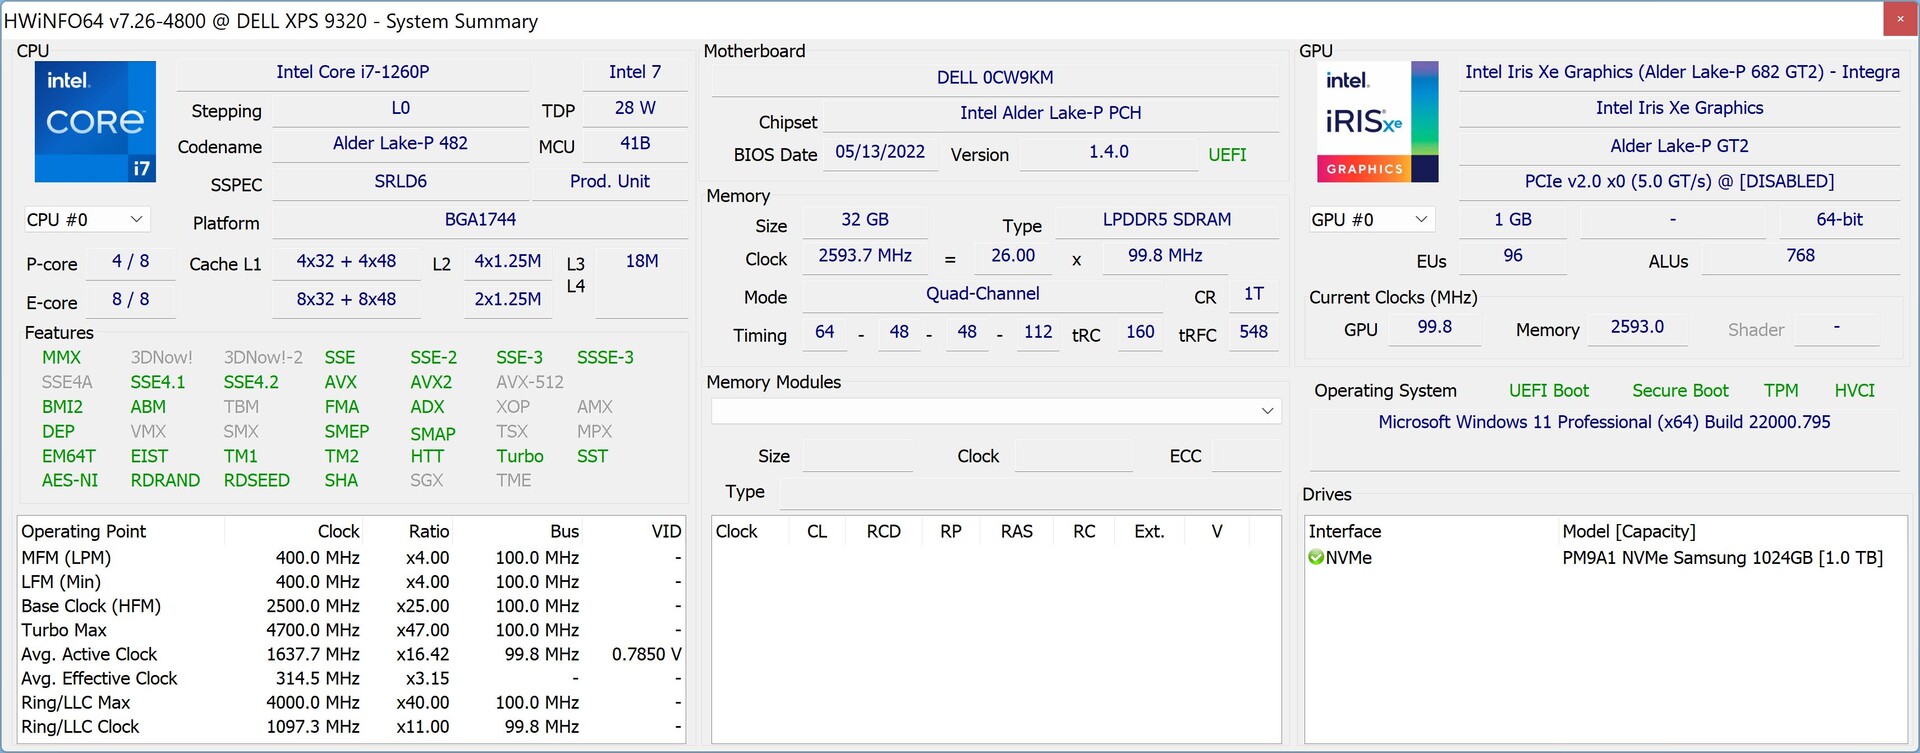
我们的新XPS 13 Plus的评测单元配备了英特尔酷睿i7-1260P,32GB LPDDR5-5200内存和1TB PCIe 4.0 SSD。显示屏是熟悉的4K面板,长宽比为16:10,还具有触摸屏。与普通的XPS 13 9320相反,XPS 13 Plus也可以配置一个3.5K的OLED屏幕。我们的评测单元的建议零售价为2099美元,戴尔再次提供带有Linux的开发者版本。
潜在的竞争对手比较
Rating | Date | Model | Weight | Height | Size | Resolution | Price |
|---|---|---|---|---|---|---|---|
| 86.9 % v7 (old) | 07 / 2022 | Dell XPS 13 Plus 9320 4K i7-1260P, Iris Xe G7 96EUs | 1.2 kg | 15.3 mm | 13.40" | 3840x2400 | |
| 90.1 % v7 (old) | 07 / 2022 | Asus Zenbook S 13 OLED R7 6800U, Radeon 680M | 1.1 kg | 14.9 mm | 13.30" | 2880x1800 | |
| 89.8 % v7 (old) | 02 / 2021 | Lenovo ThinkPad X1 Nano-20UN002UGE i7-1160G7, Iris Xe G7 96EUs | 946 g | 16 mm | 13.00" | 2160x1350 | |
| 91.1 % v7 (old) | 12 / 2020 | Apple MacBook Air 2020 M1 Entry M1, M1 7-Core GPU | 1.3 kg | 16.1 mm | 13.30" | 2560x1600 | |
| 88.8 % v7 (old) | 02 / 2022 | Huawei MateBook 13s i5 11300H i5-11300H, Iris Xe G7 80EUs | 1.3 kg | 16.5 mm | 13.40" | 2520x1680 | |
| 87.4 % v7 (old) | 12 / 2021 | Dell XPS 13 9310 Core i7 4K i7-1185G7, Iris Xe G7 96EUs | 1.3 kg | 14.8 mm | 13.40" | 3840x2400 |
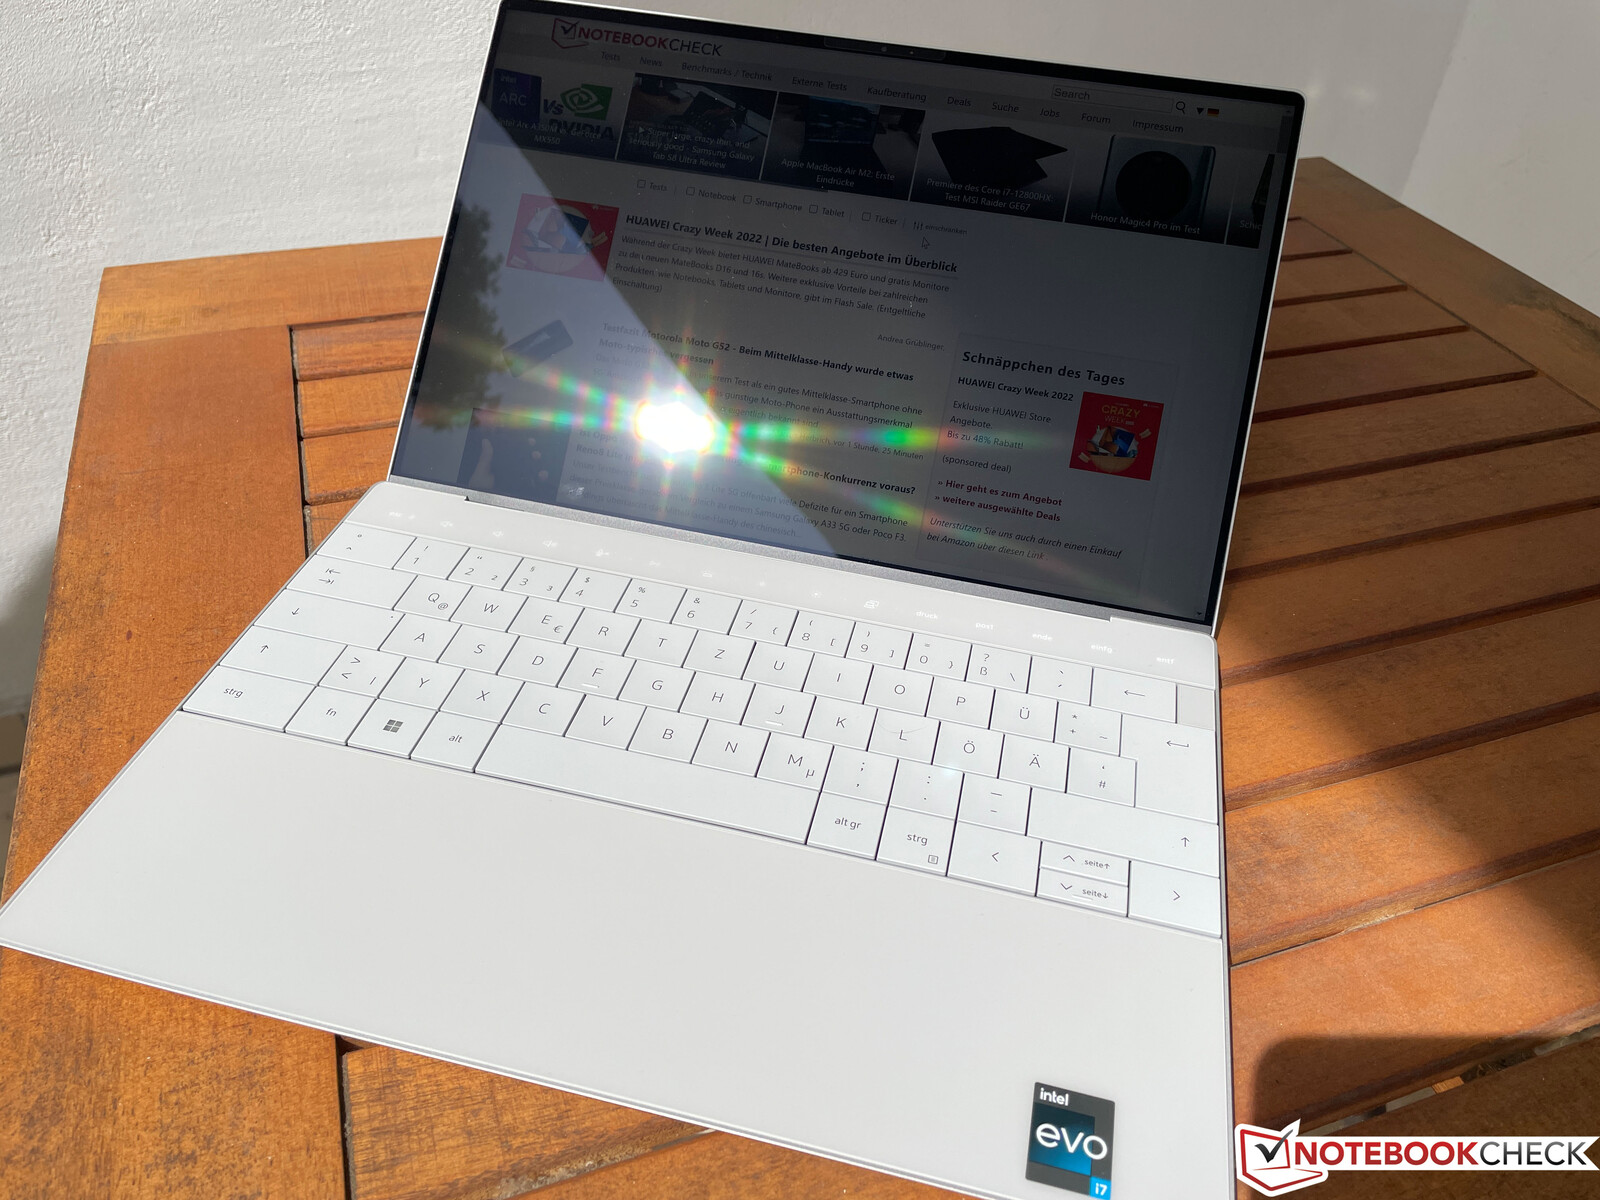
外壳 - XPS 13的新设计
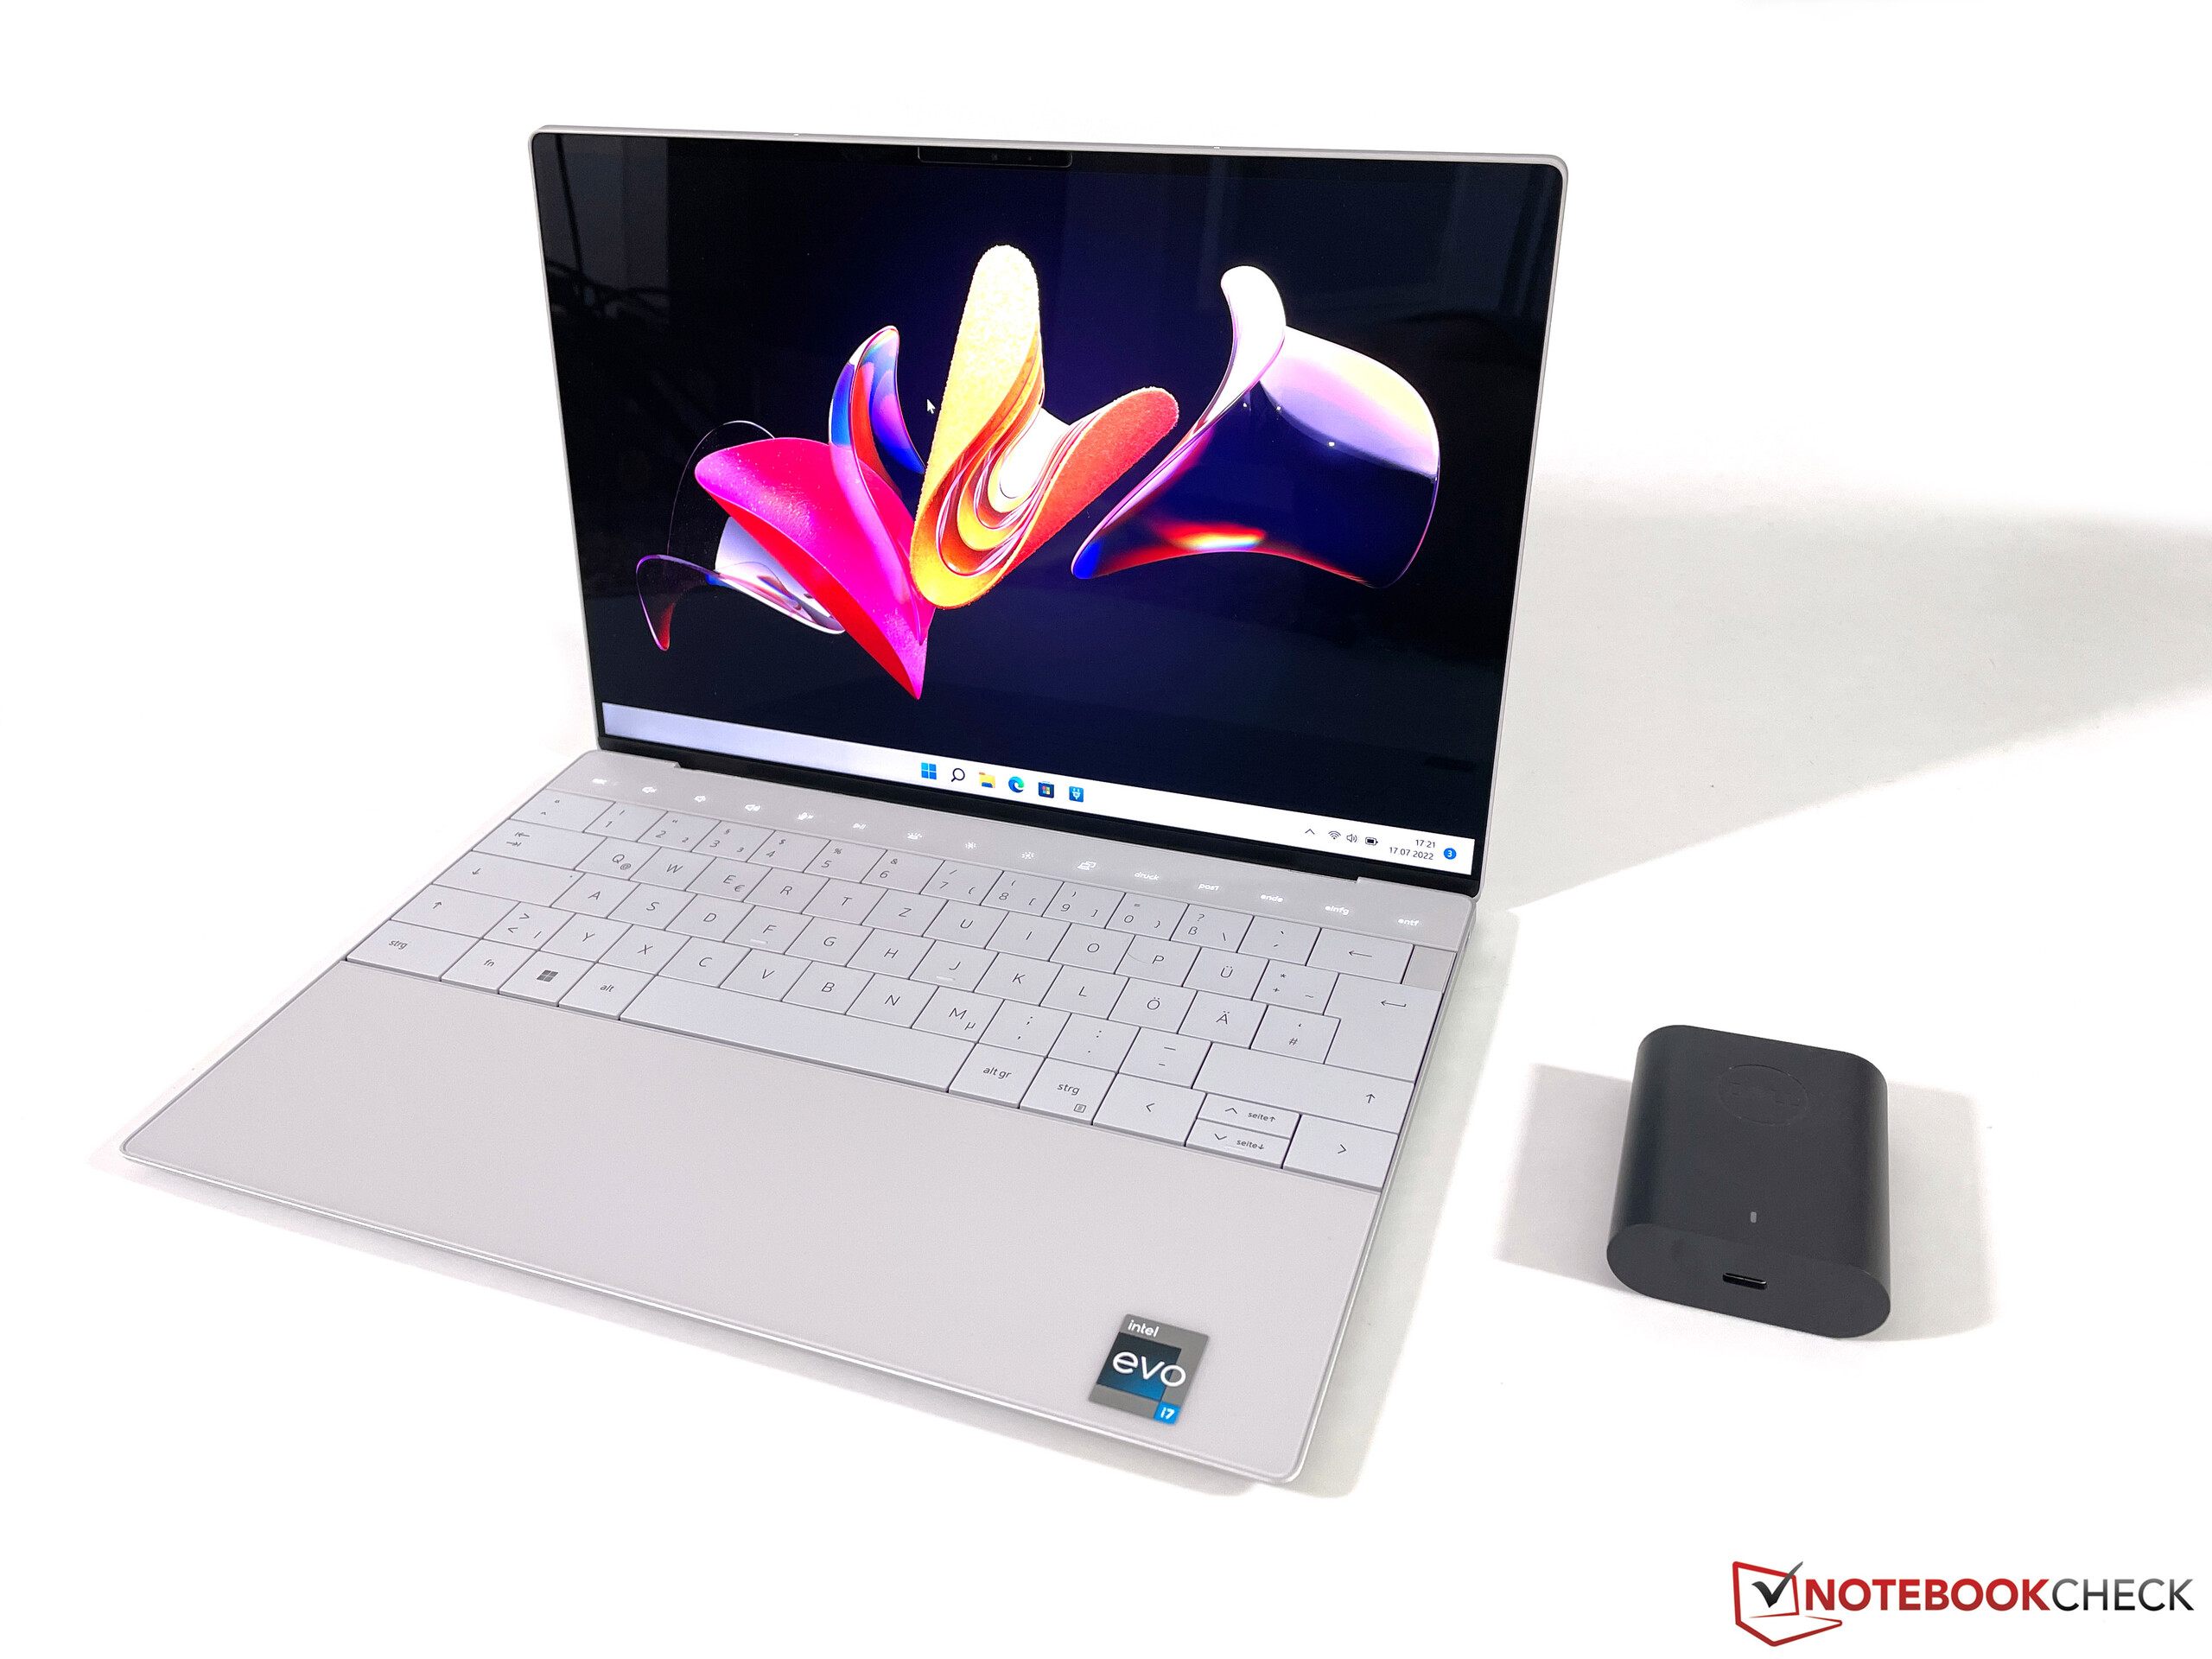
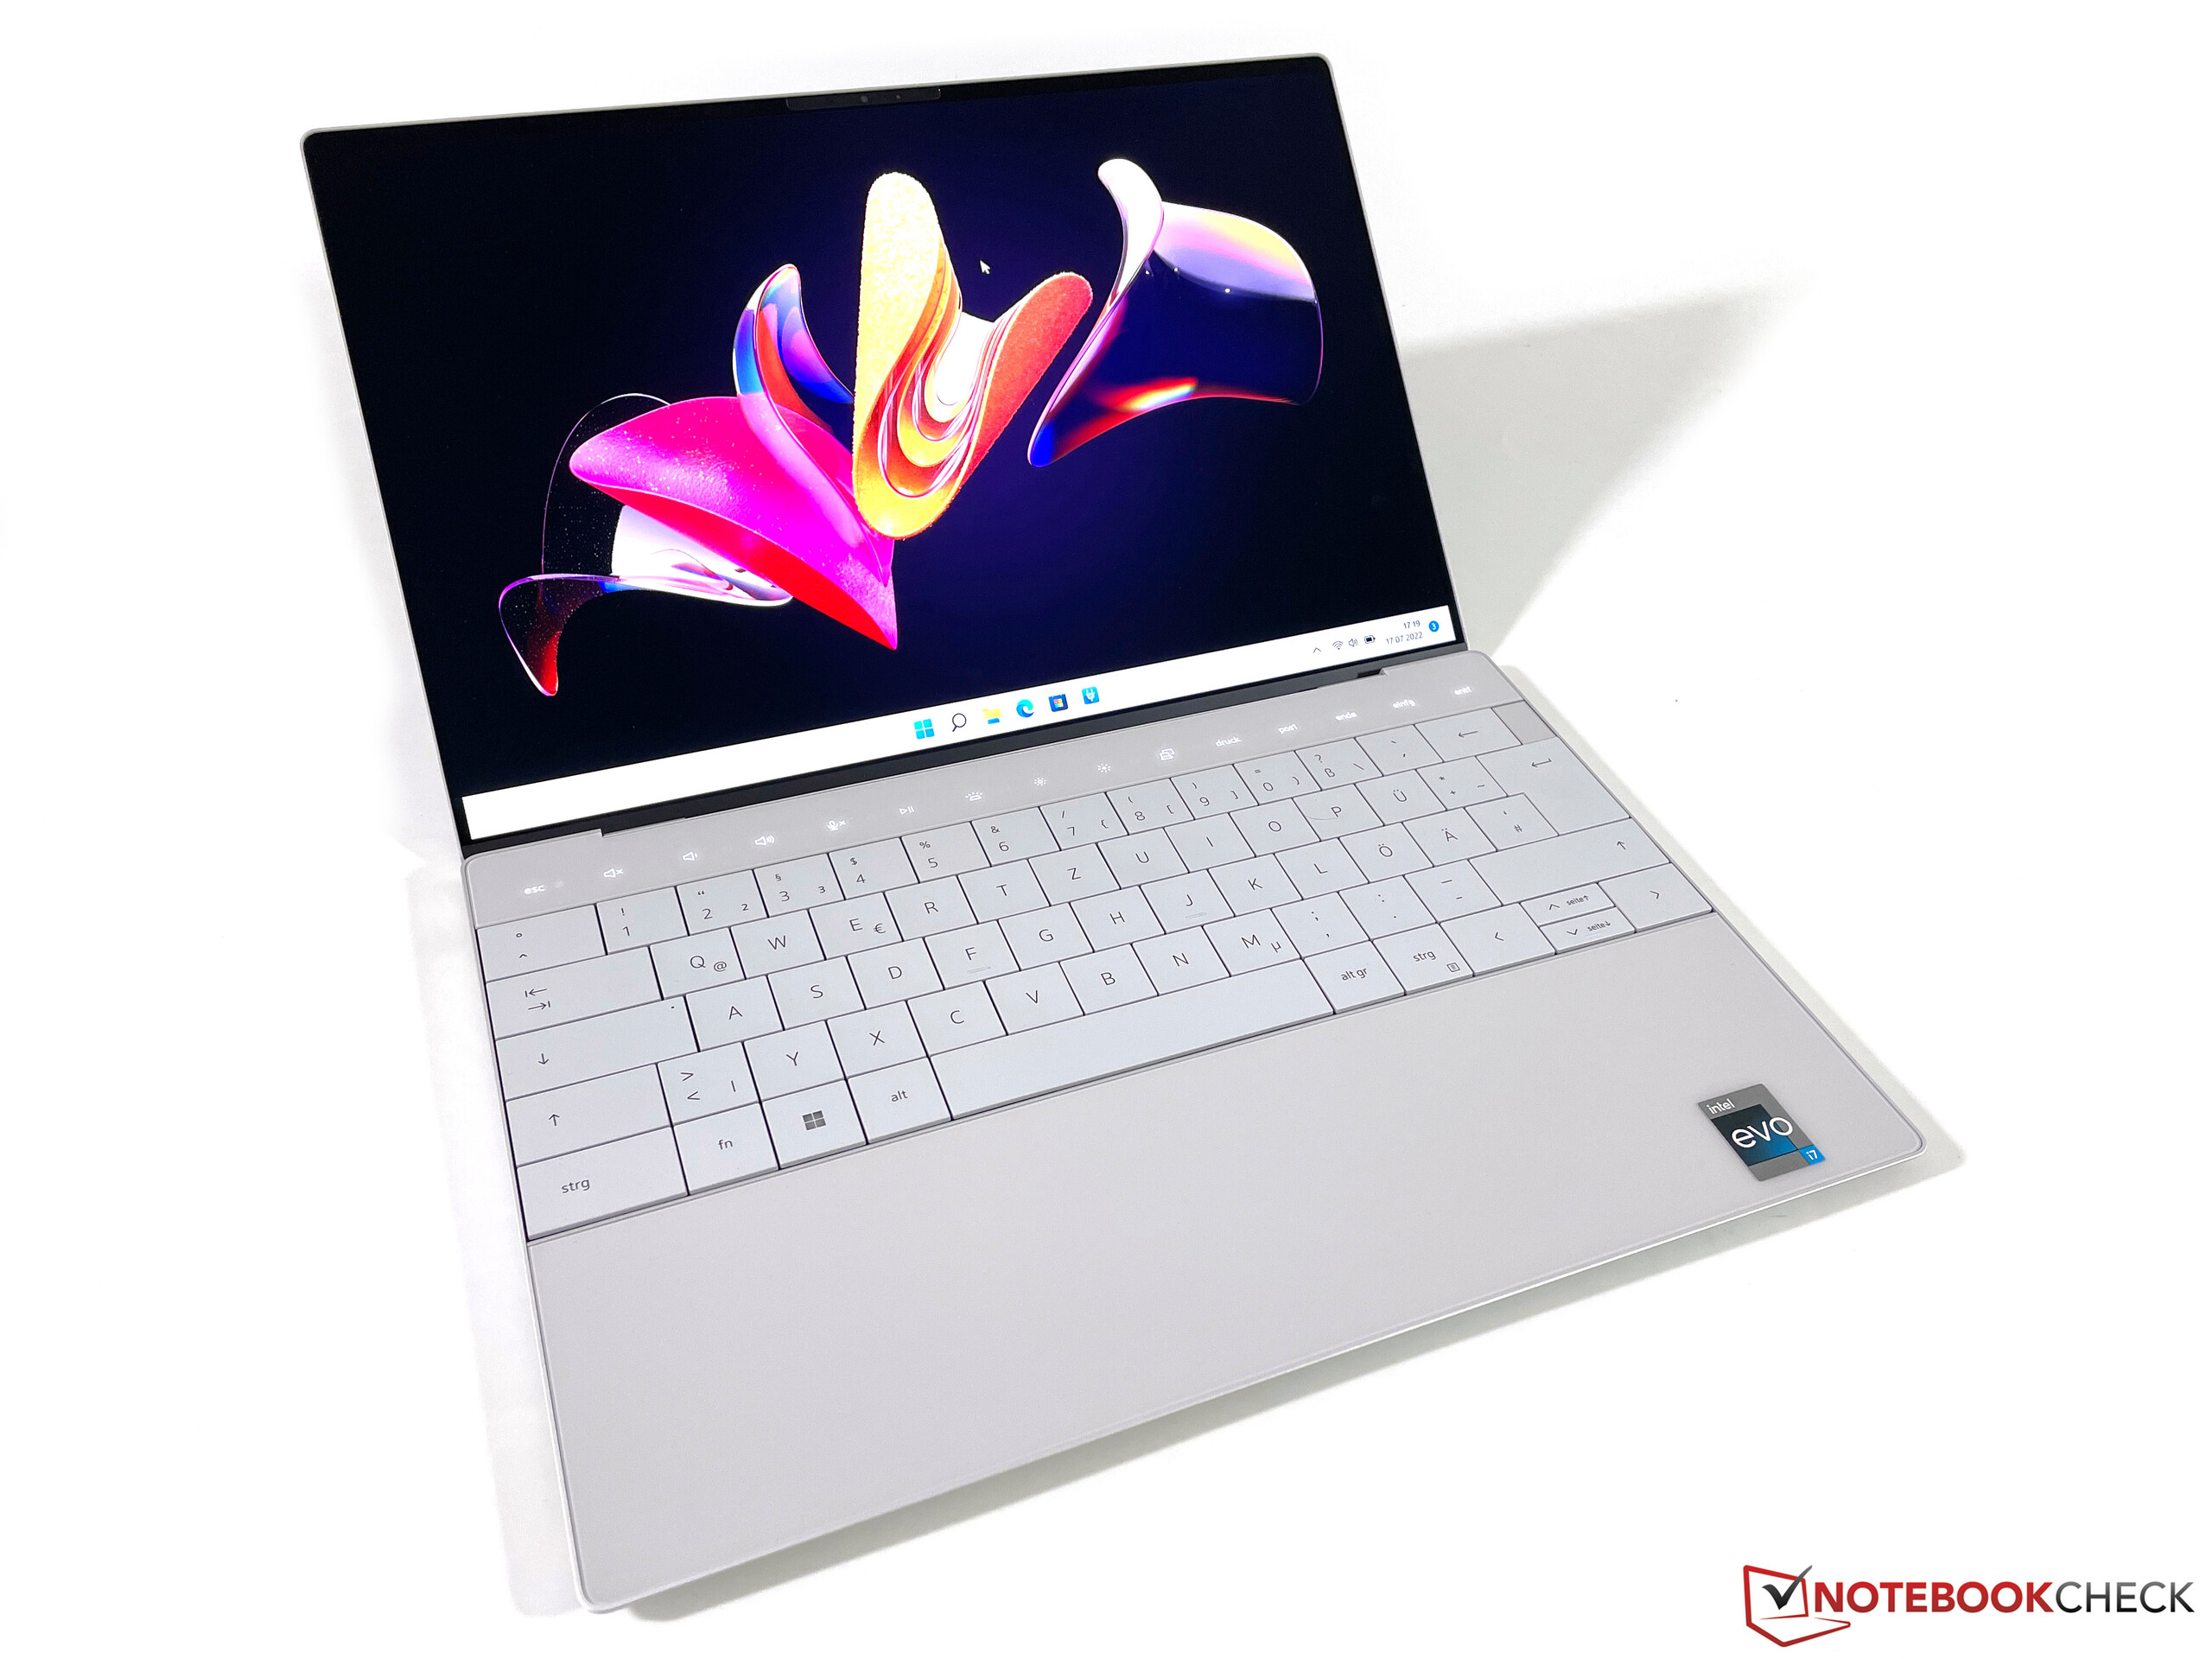
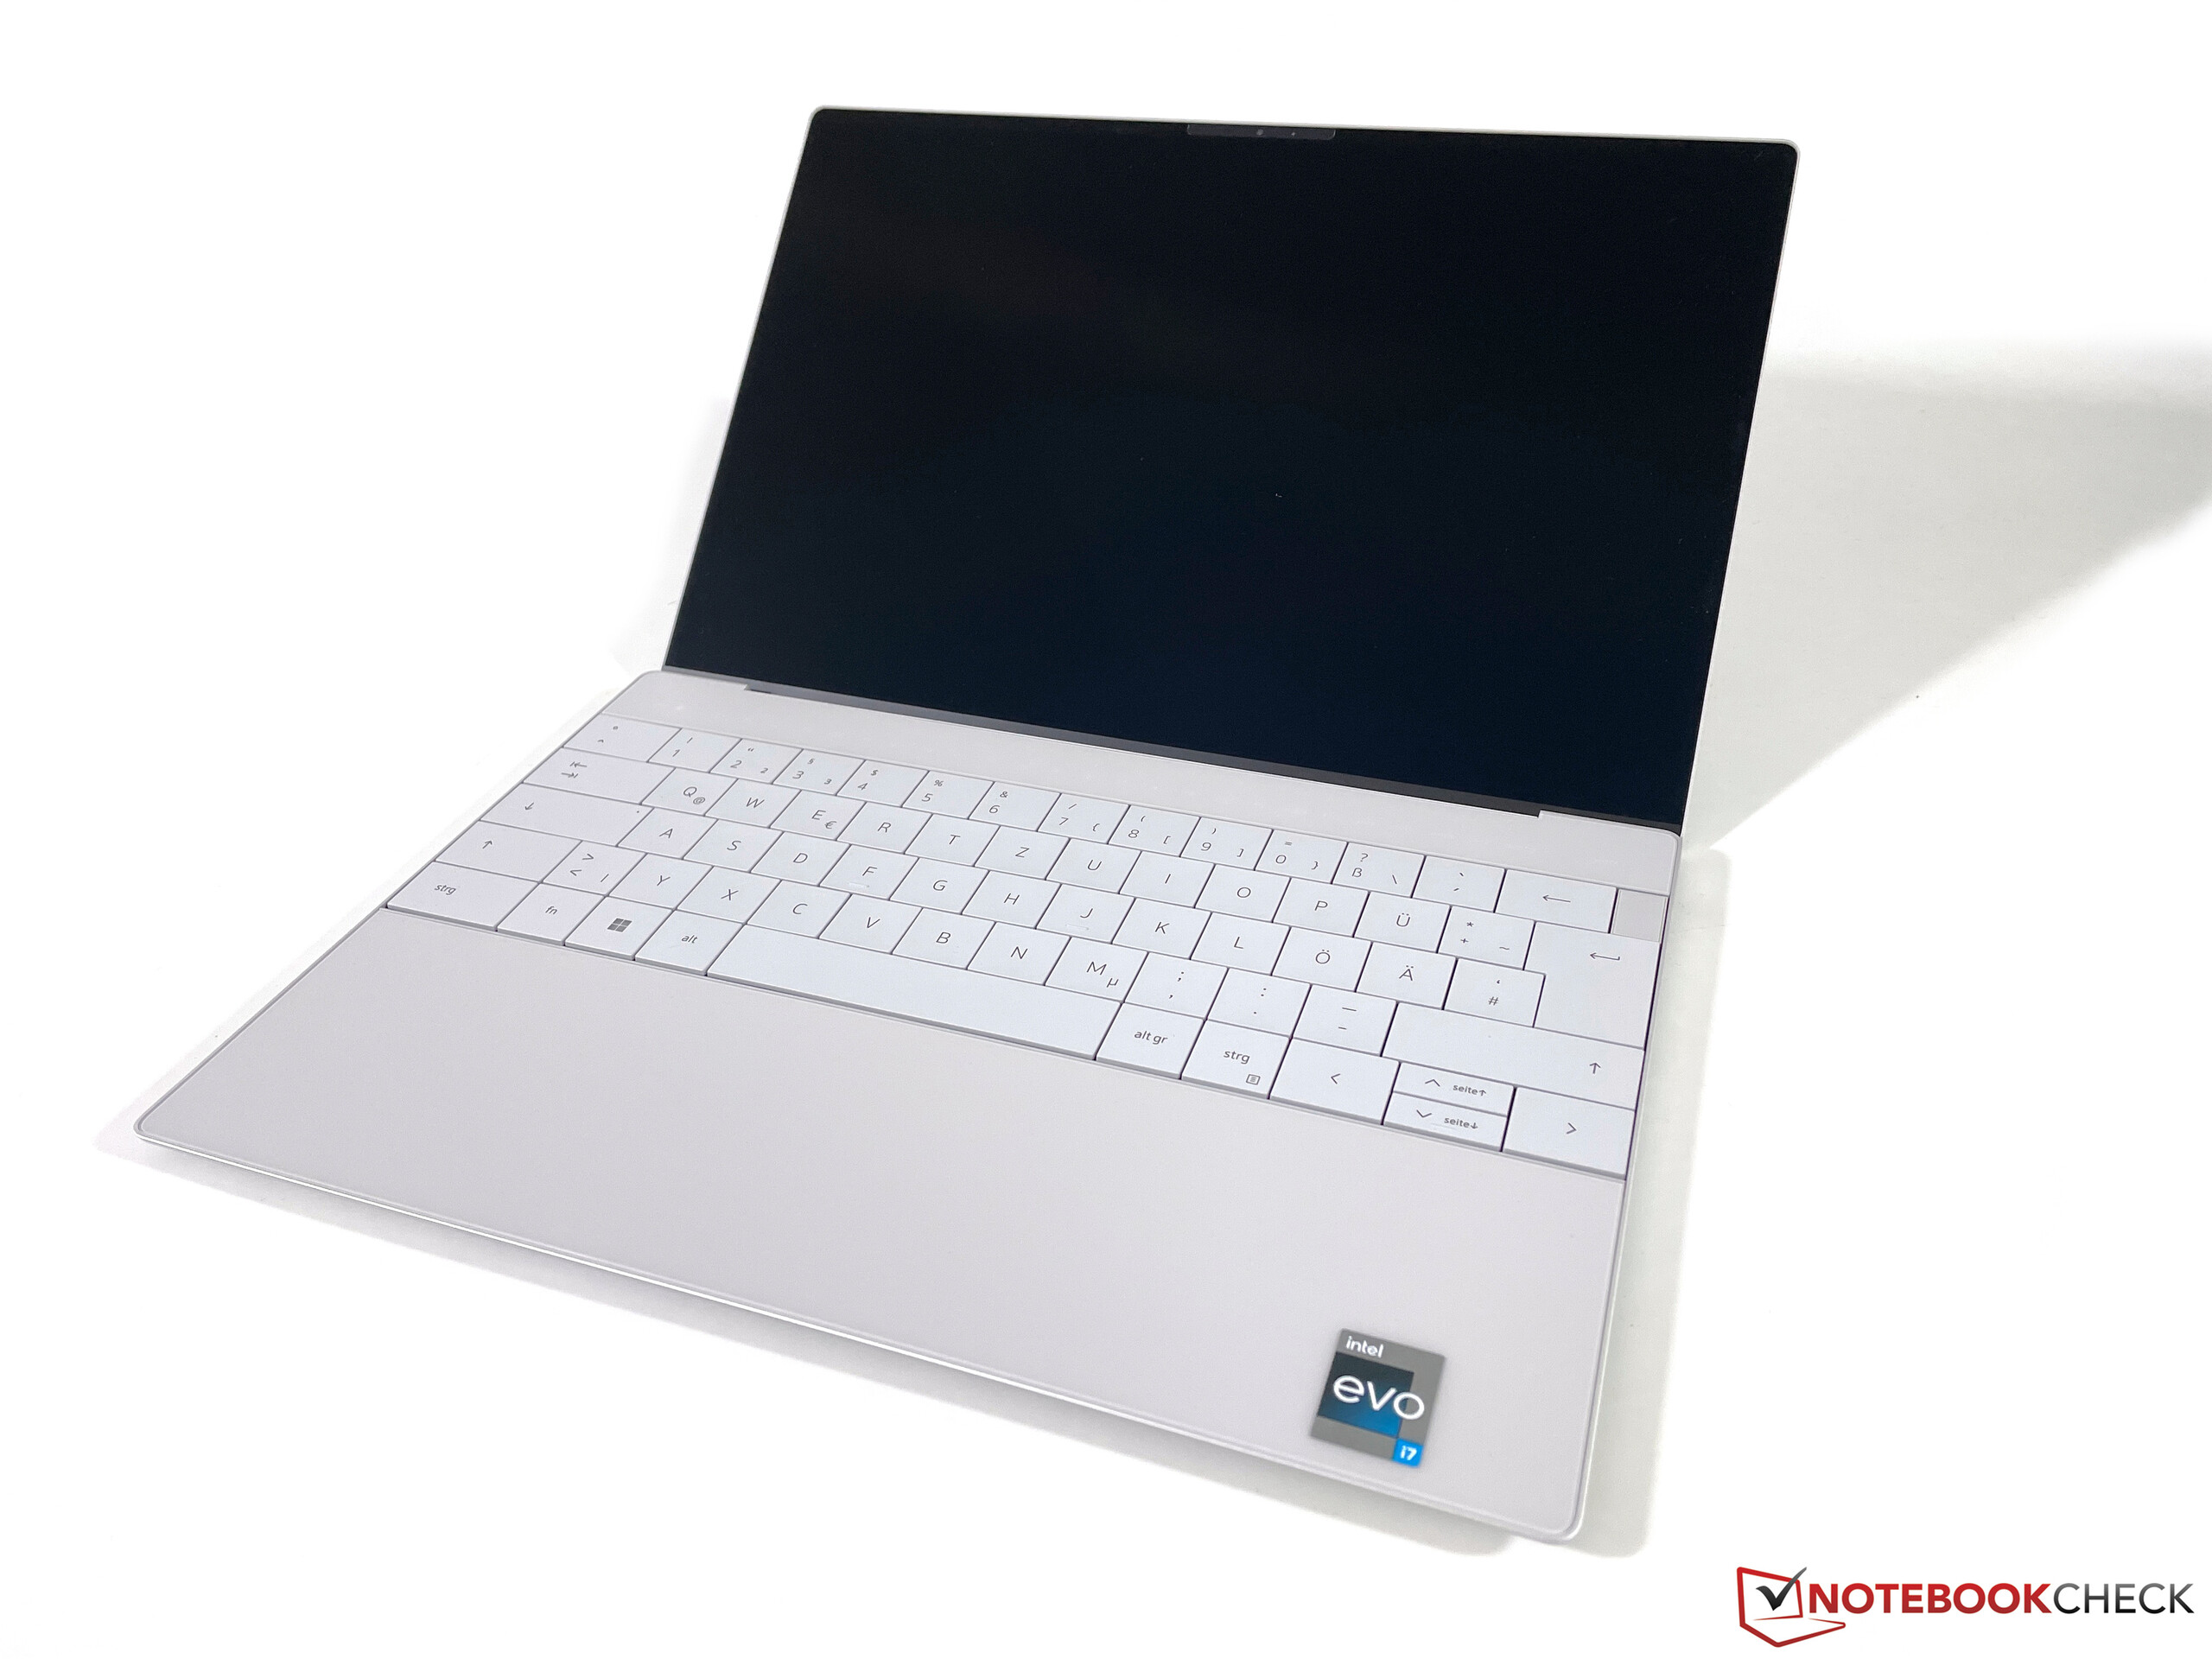
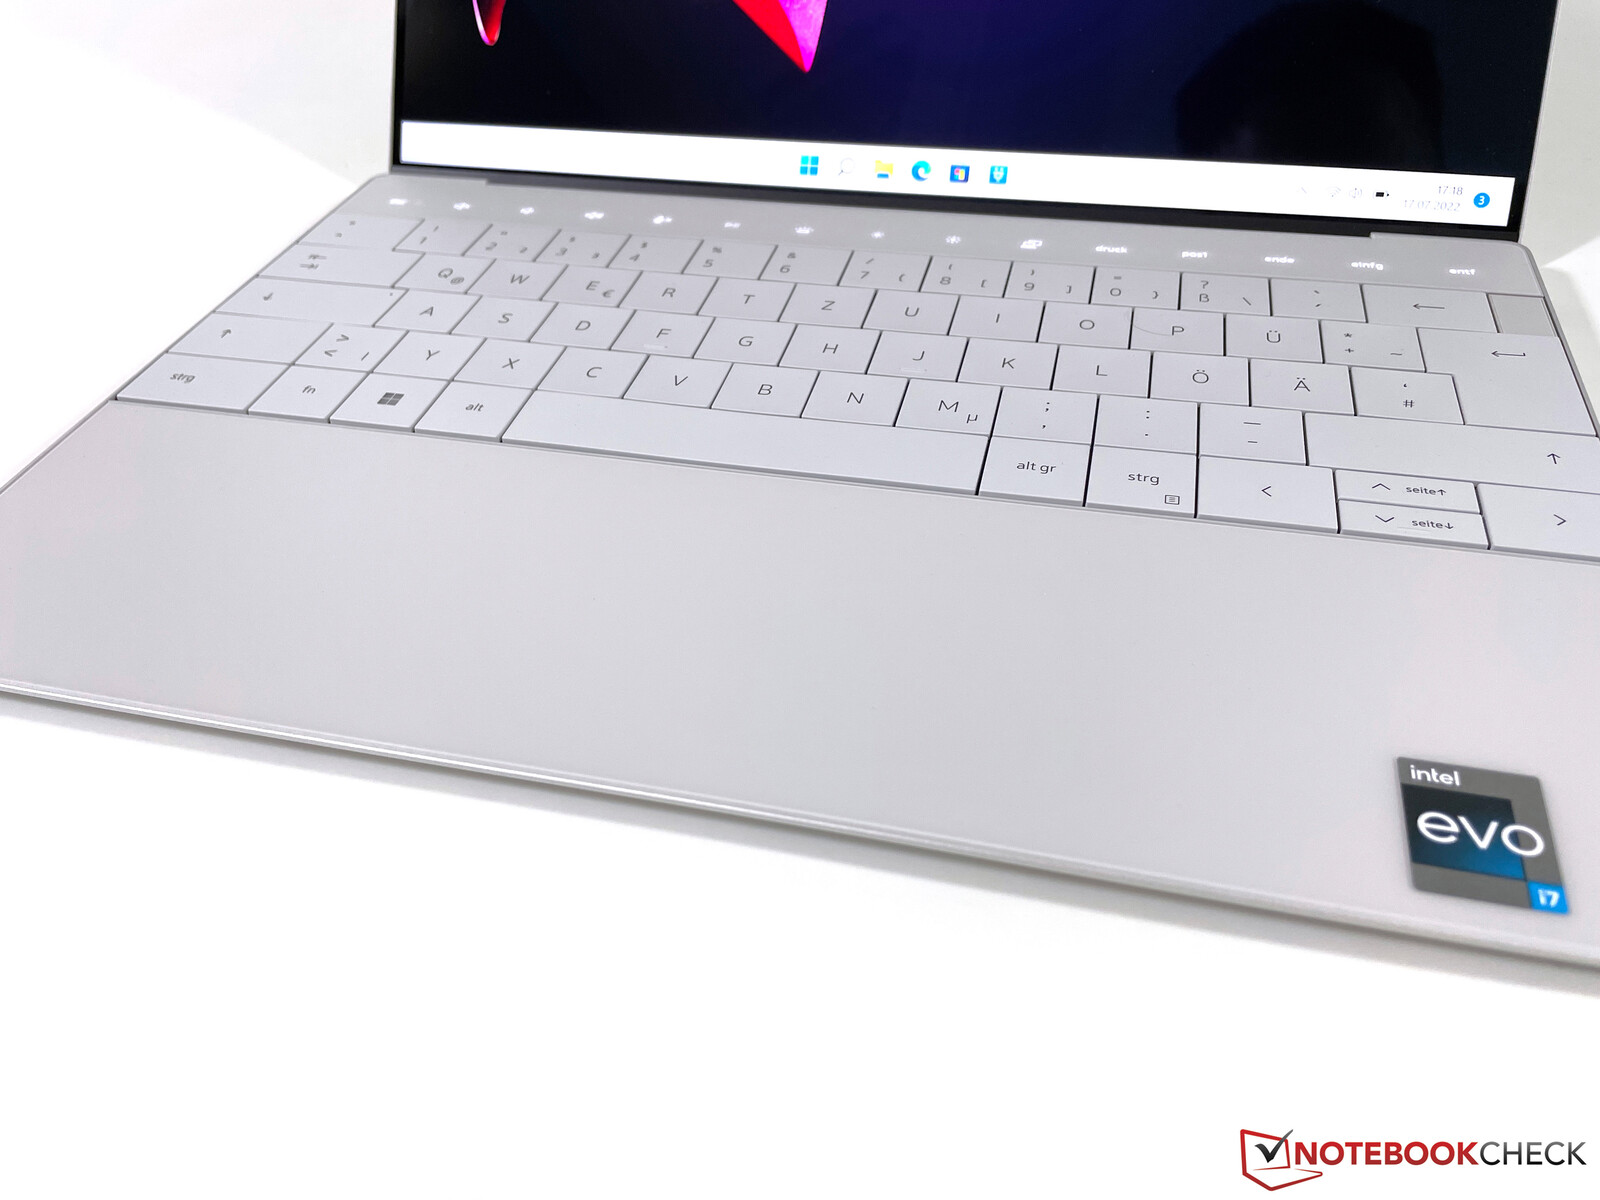
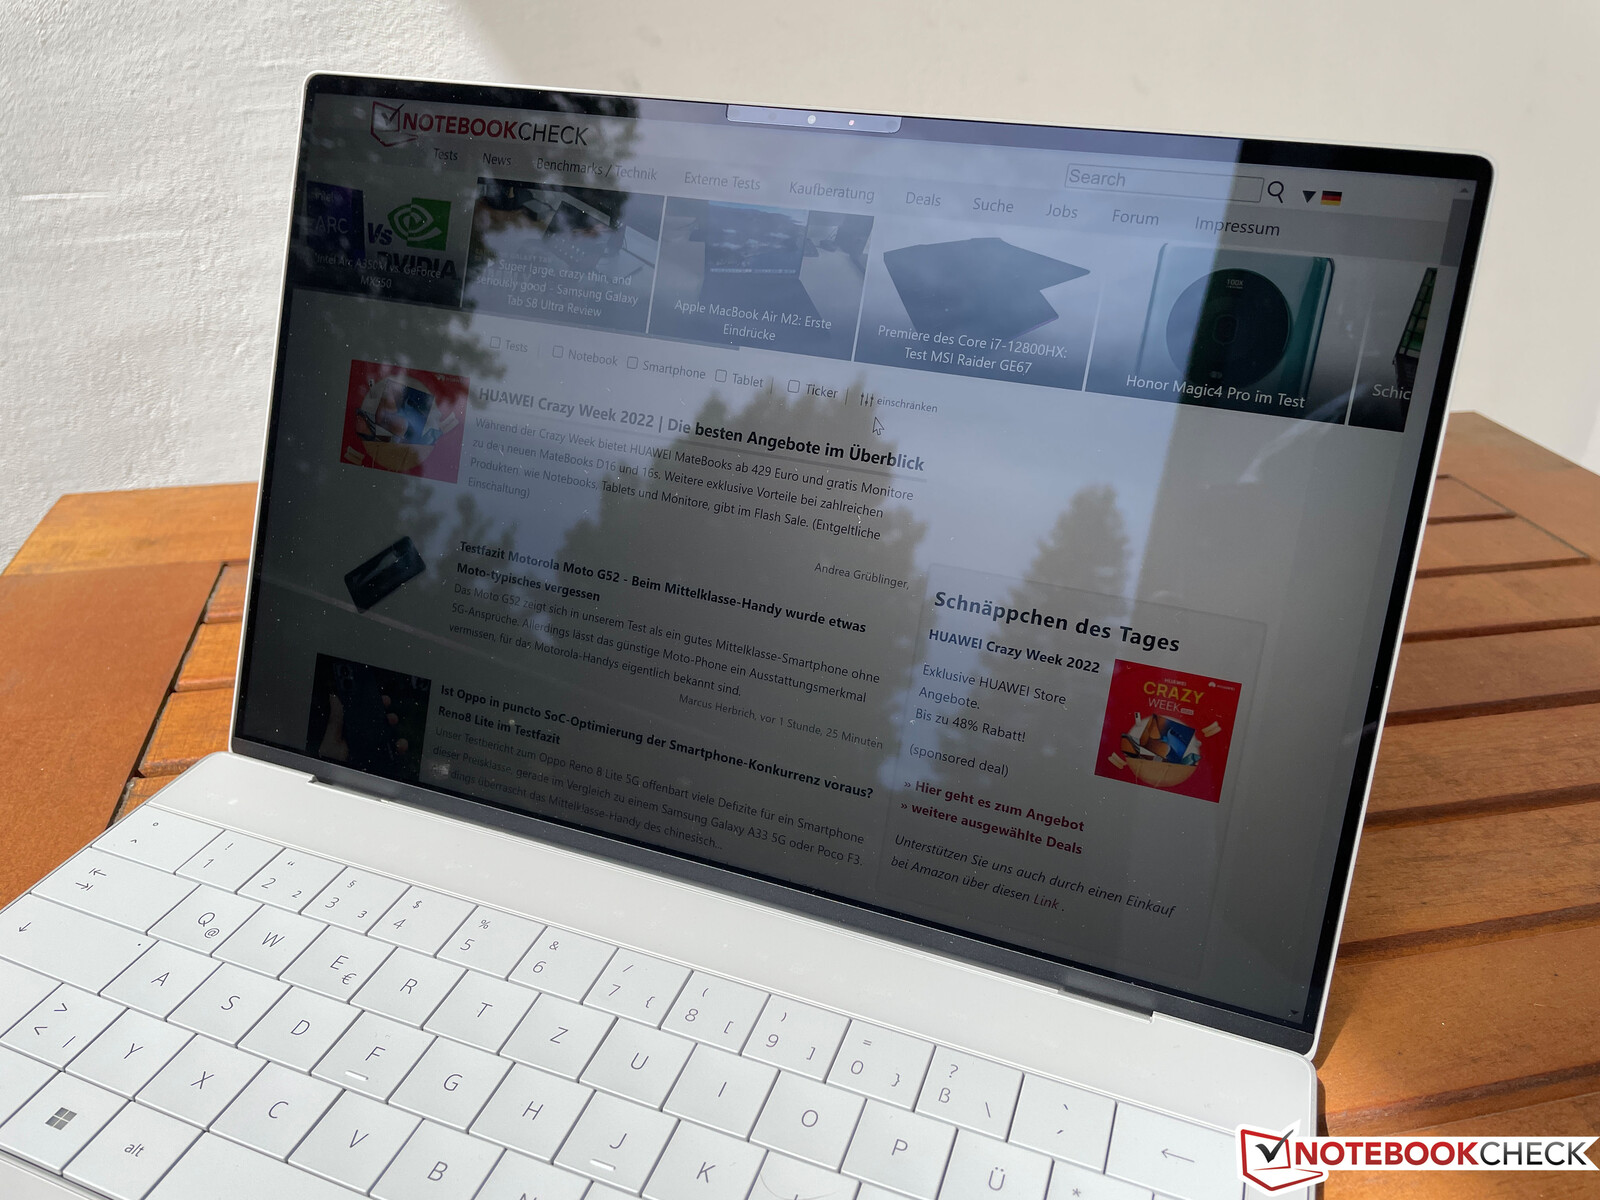
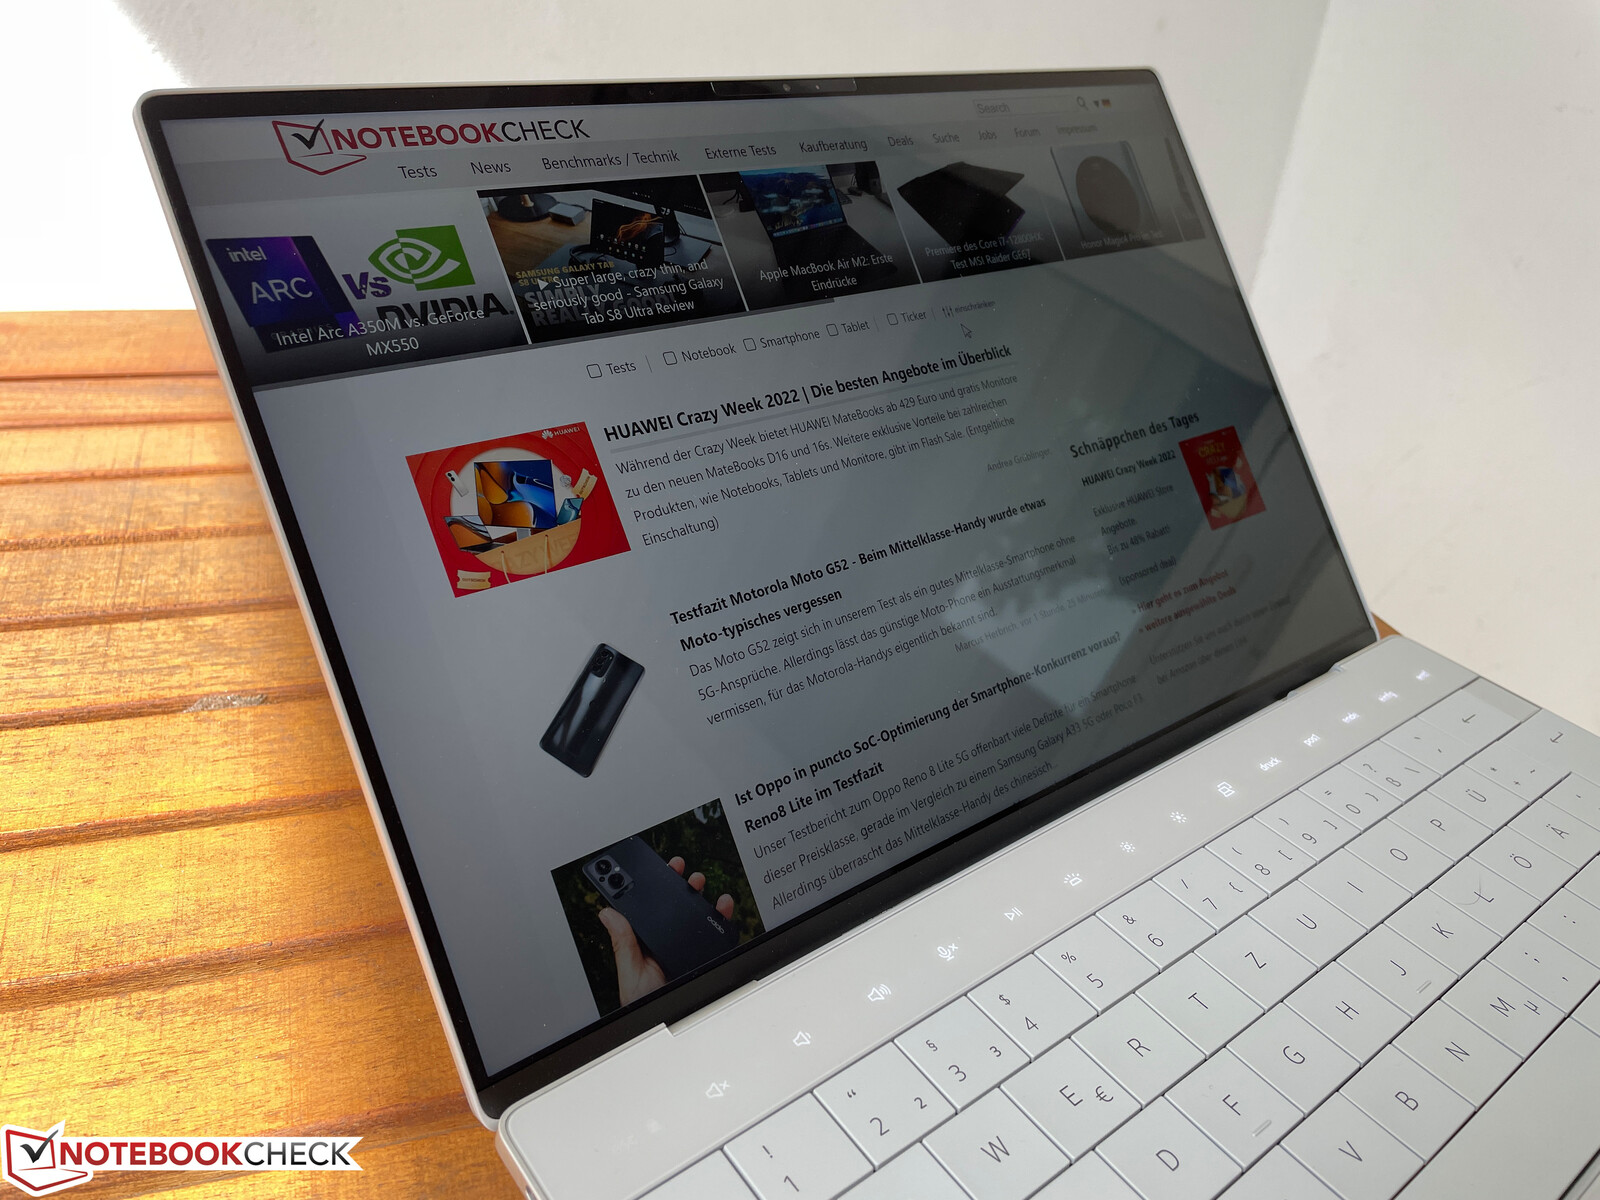
要将新的XPS 13 Plus与它的前任区分开来并不容易。 前辈当盖子被关闭时,特别是在我们的铂金色选项中。你也可以得到深灰色(石墨色)的XPS 13 Plus。倾斜的后部和楔形底座的基本设计仍然是相同的,但当你打开盖子时,你会立即看到主要的区别。戴尔扔掉了Chiclet键盘,采用了一个更传统的、按键之间没有缝隙的单元。没有典型的功能键,相反,你现在得到了一个电容式触摸条(后面会有更多介绍)。我们特别喜欢新的掌托区,它使用一块玻璃,指纹完全不是问题。尤其是以前版本的深色机型,很快就被指纹覆盖。显示屏边框非常窄,导致89%的屏占比非常好。
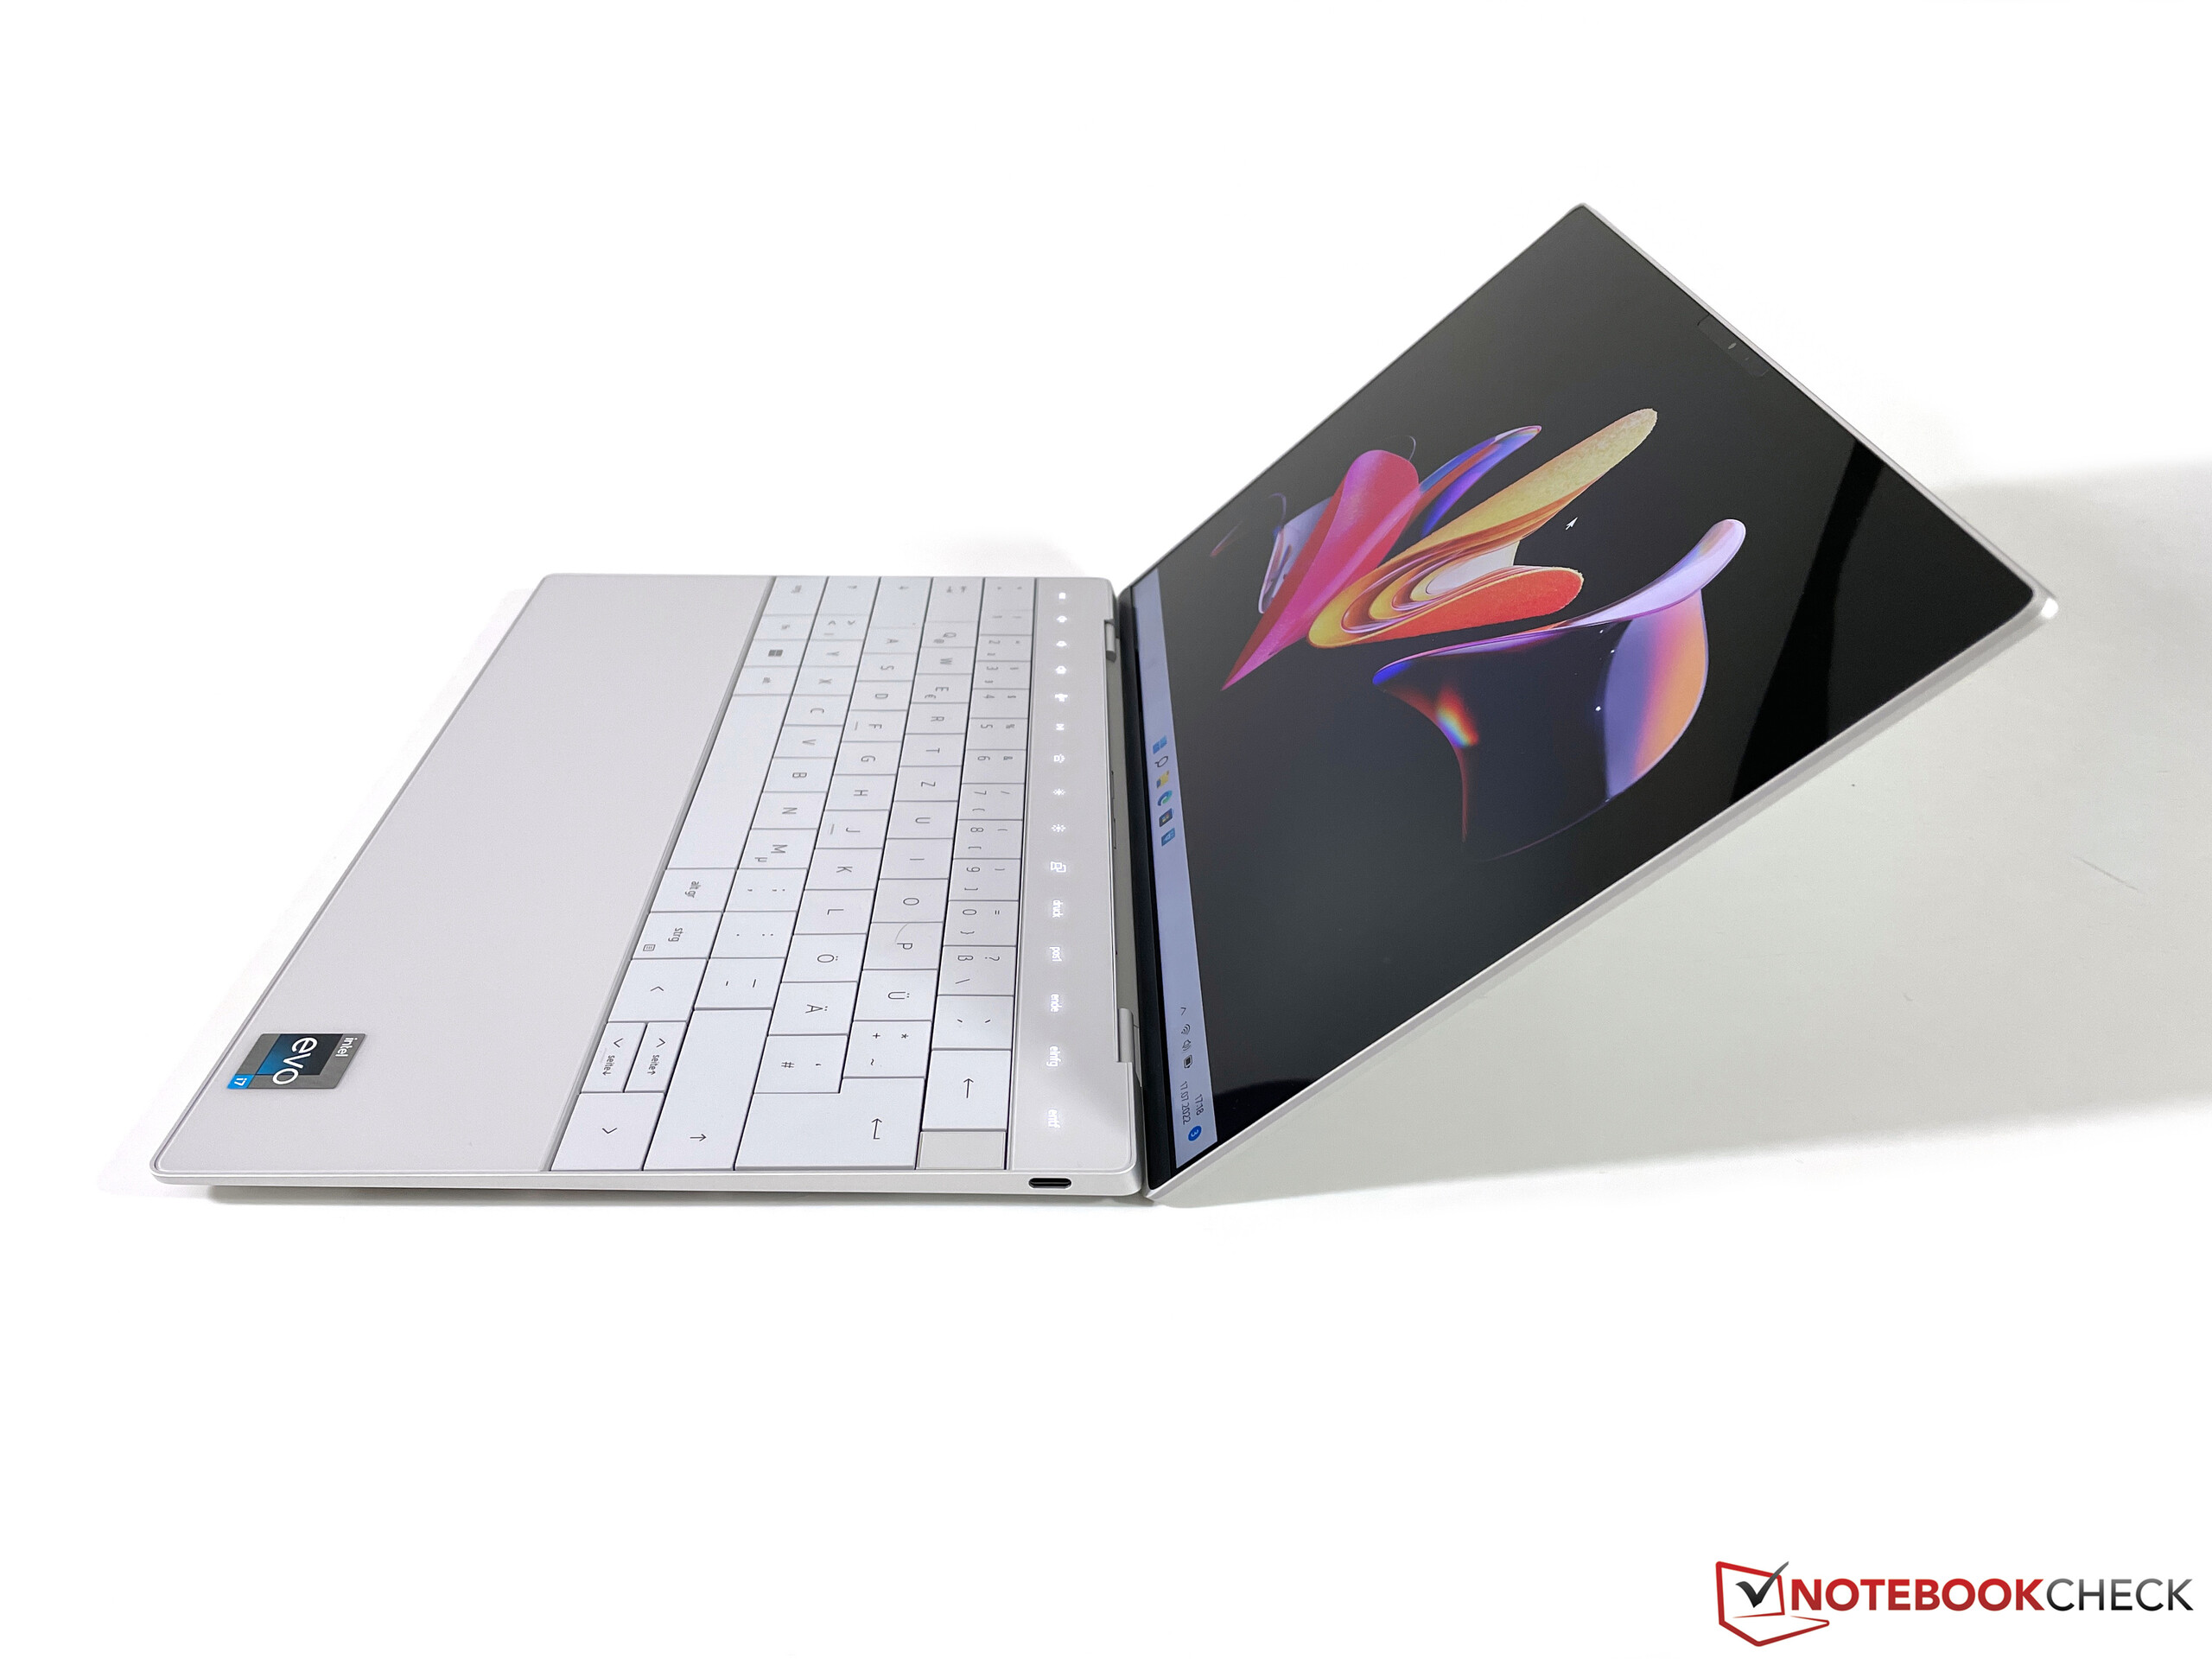
XPS 13 Plus的稳定性非常好,整个设备主要由铝制造,也给人留下非常坚固的印象。无论是底座,还是盖子都不能被推入或扭曲。我们也喜欢铰链的调整,但用一只手打开盖子并不容易,因为在底座单元的前面没有压痕。最大的打开角度是135度。
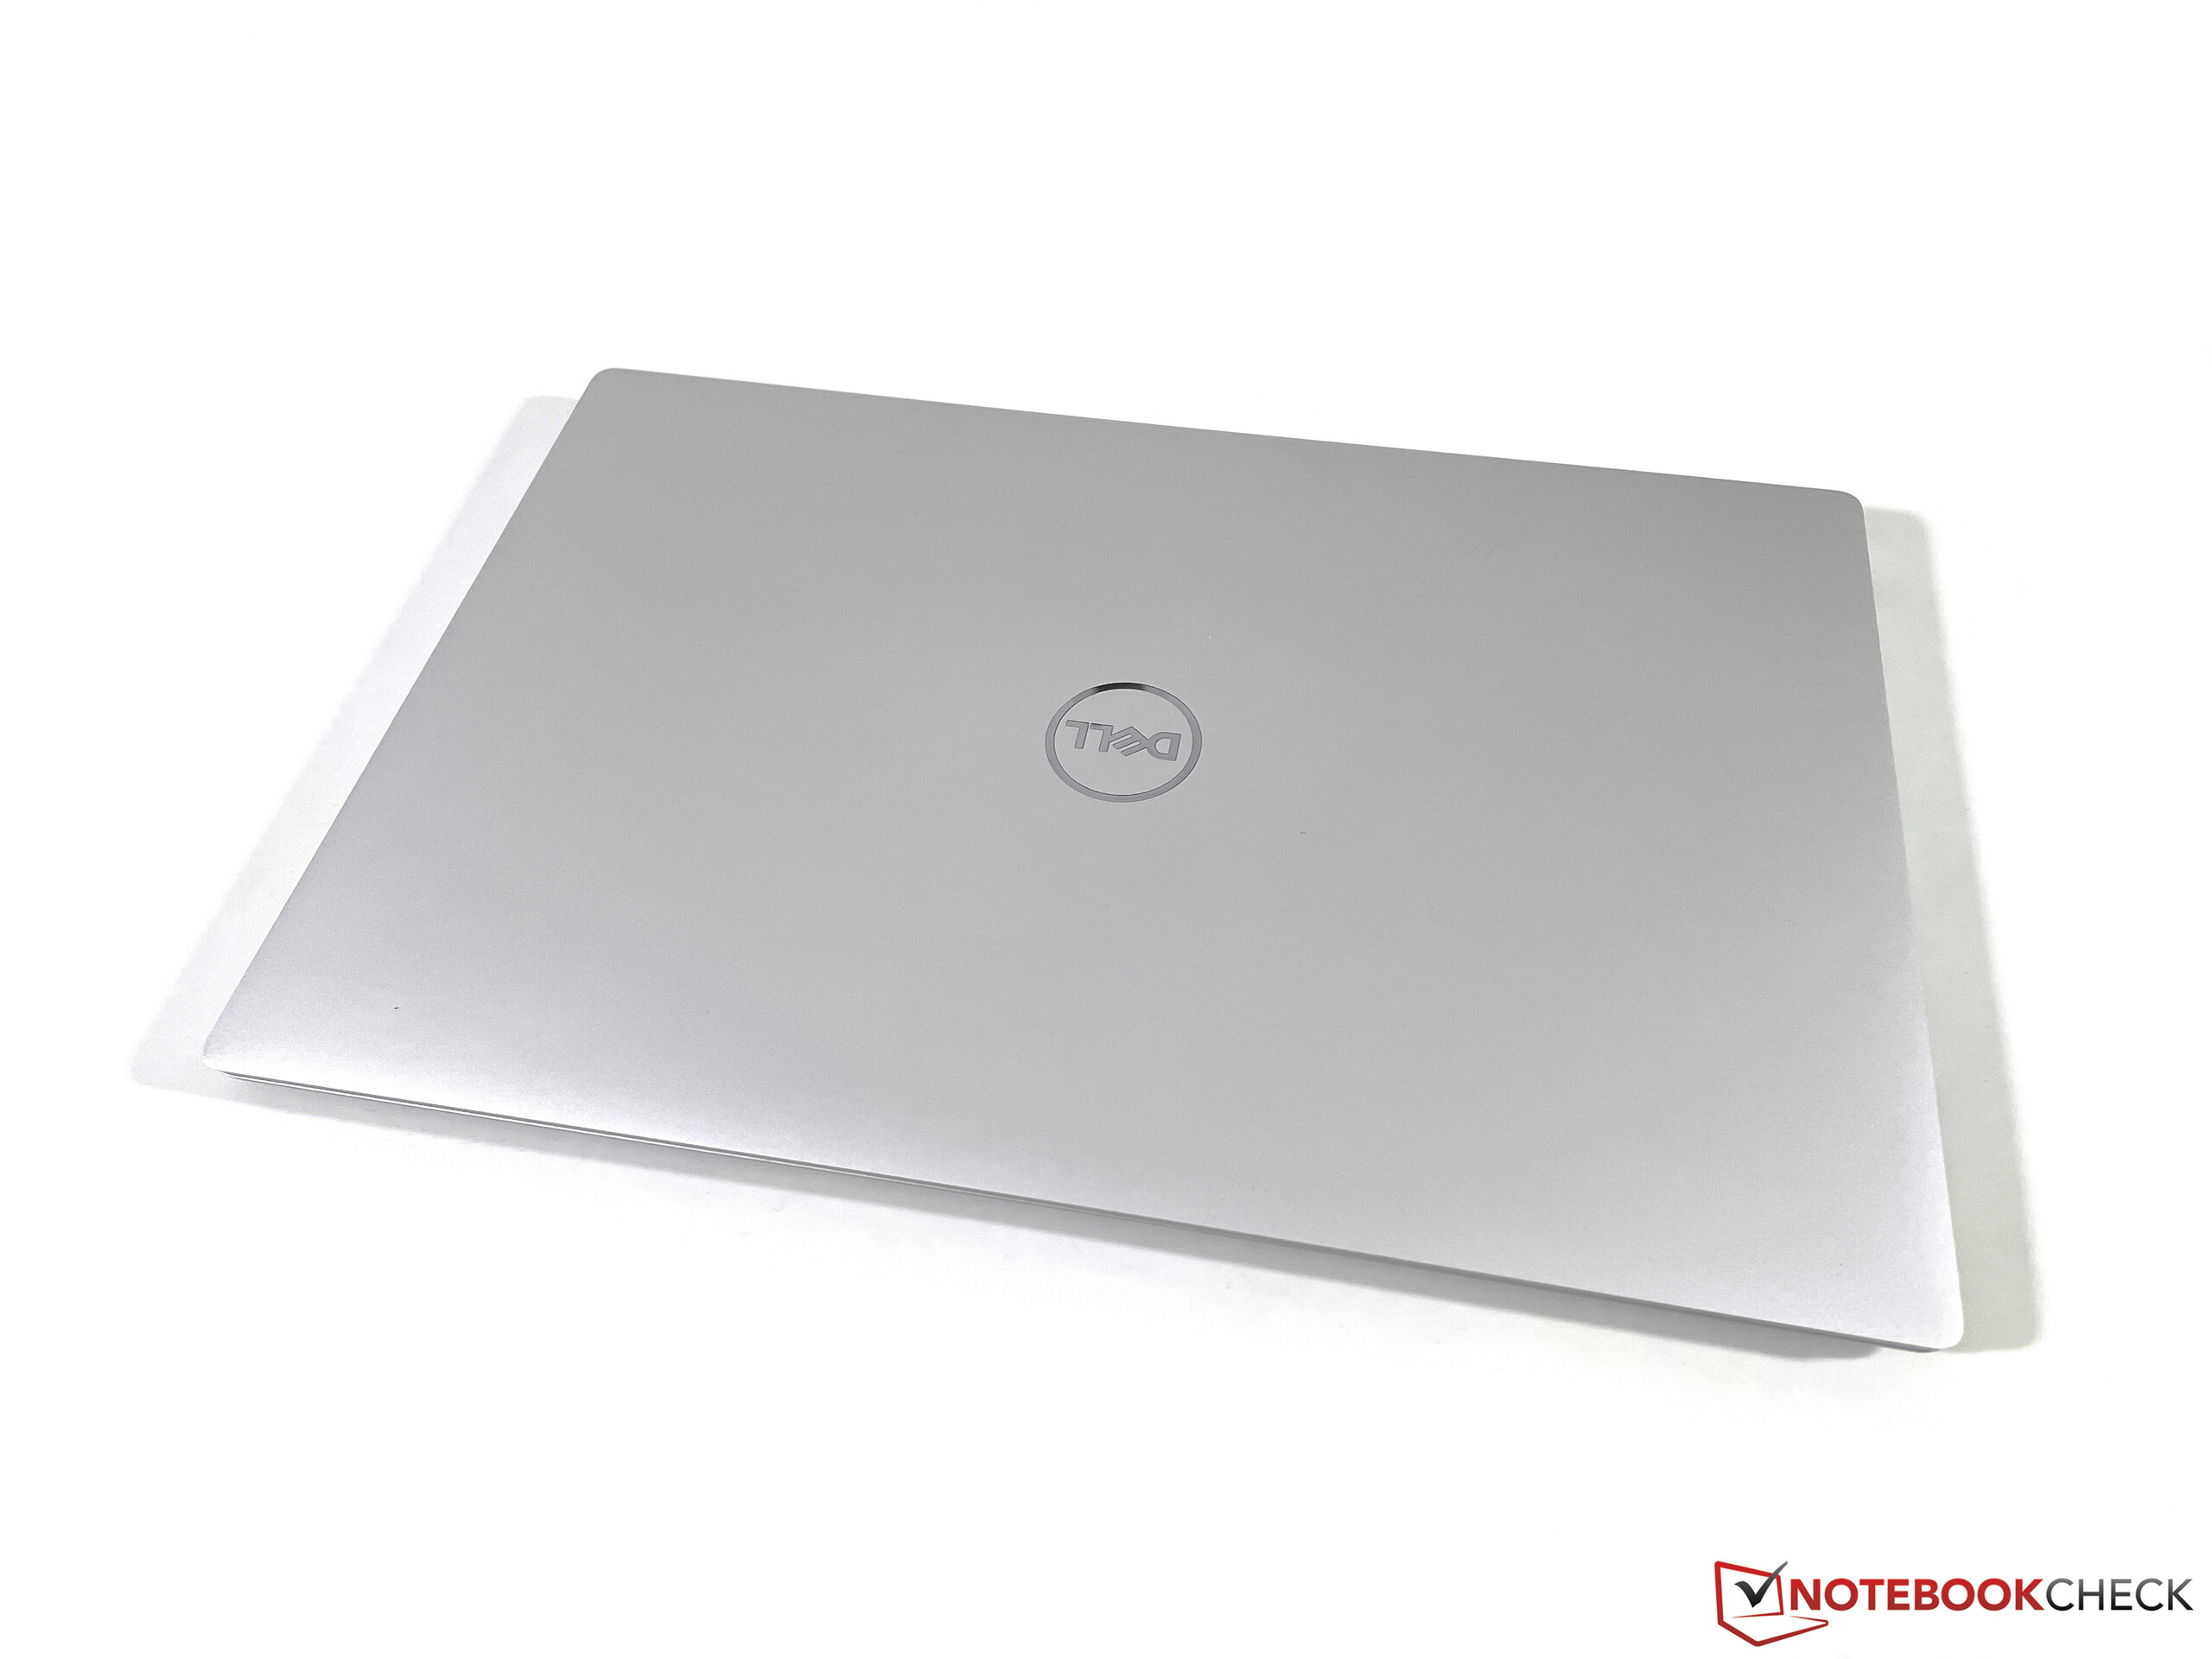
无论是旧的戴尔XPS 13 9310新的XPS 13 Plus是我们比较组中最紧凑的设备,把XPS 13放在袋子/背包里是没有问题的。另一方面,重量是一般的,而且这两款产品都是华硕Zenbook S 13以及ThinkPad X1 Nano都明显要轻一些。60W的电源适配器非常紧凑,但长的连接线仍然使整体重量增加到254克。
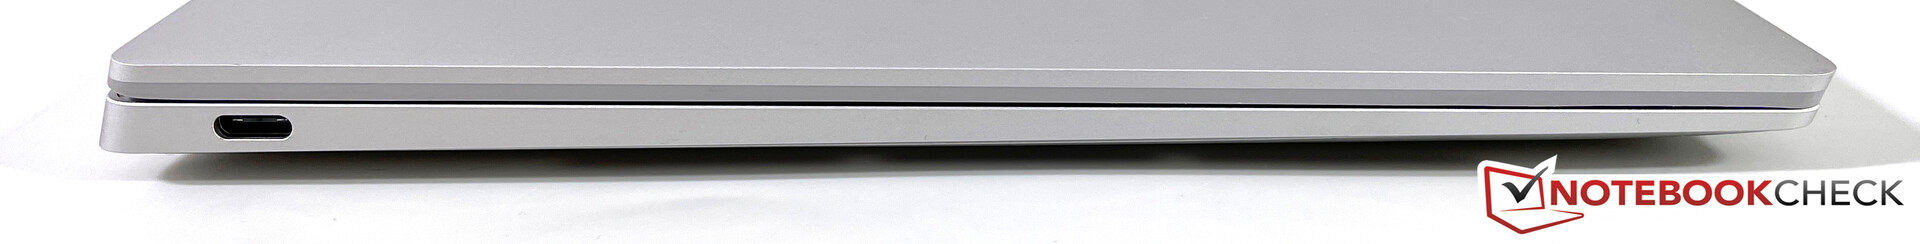
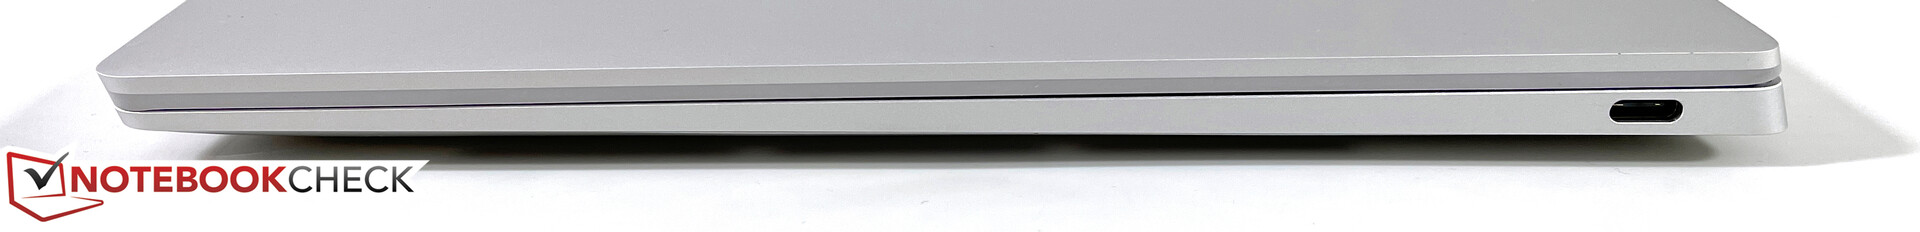
连接性--戴尔扔掉了3.5毫米的立体声插孔
不断减少的端口数量在XPS 13在过去的几年里,这种趋势不幸地在新的XPS 13 Plus(还有普通的XPS 13)上继续。当Apple 开始包括更多的端口时(例如在新的MacBook Air M2上),戴尔甚至更进一步,取消了3.5毫米立体声插孔。每侧只有一个完全支持Thunderbolt 4的USB-C端口。戴尔至少在默认情况下包括两个适配器(用于USB-A和3.5毫米),但我们希望在设备上有更多的端口。前代产品的读卡器也被移除。
沟通
网络摄像头
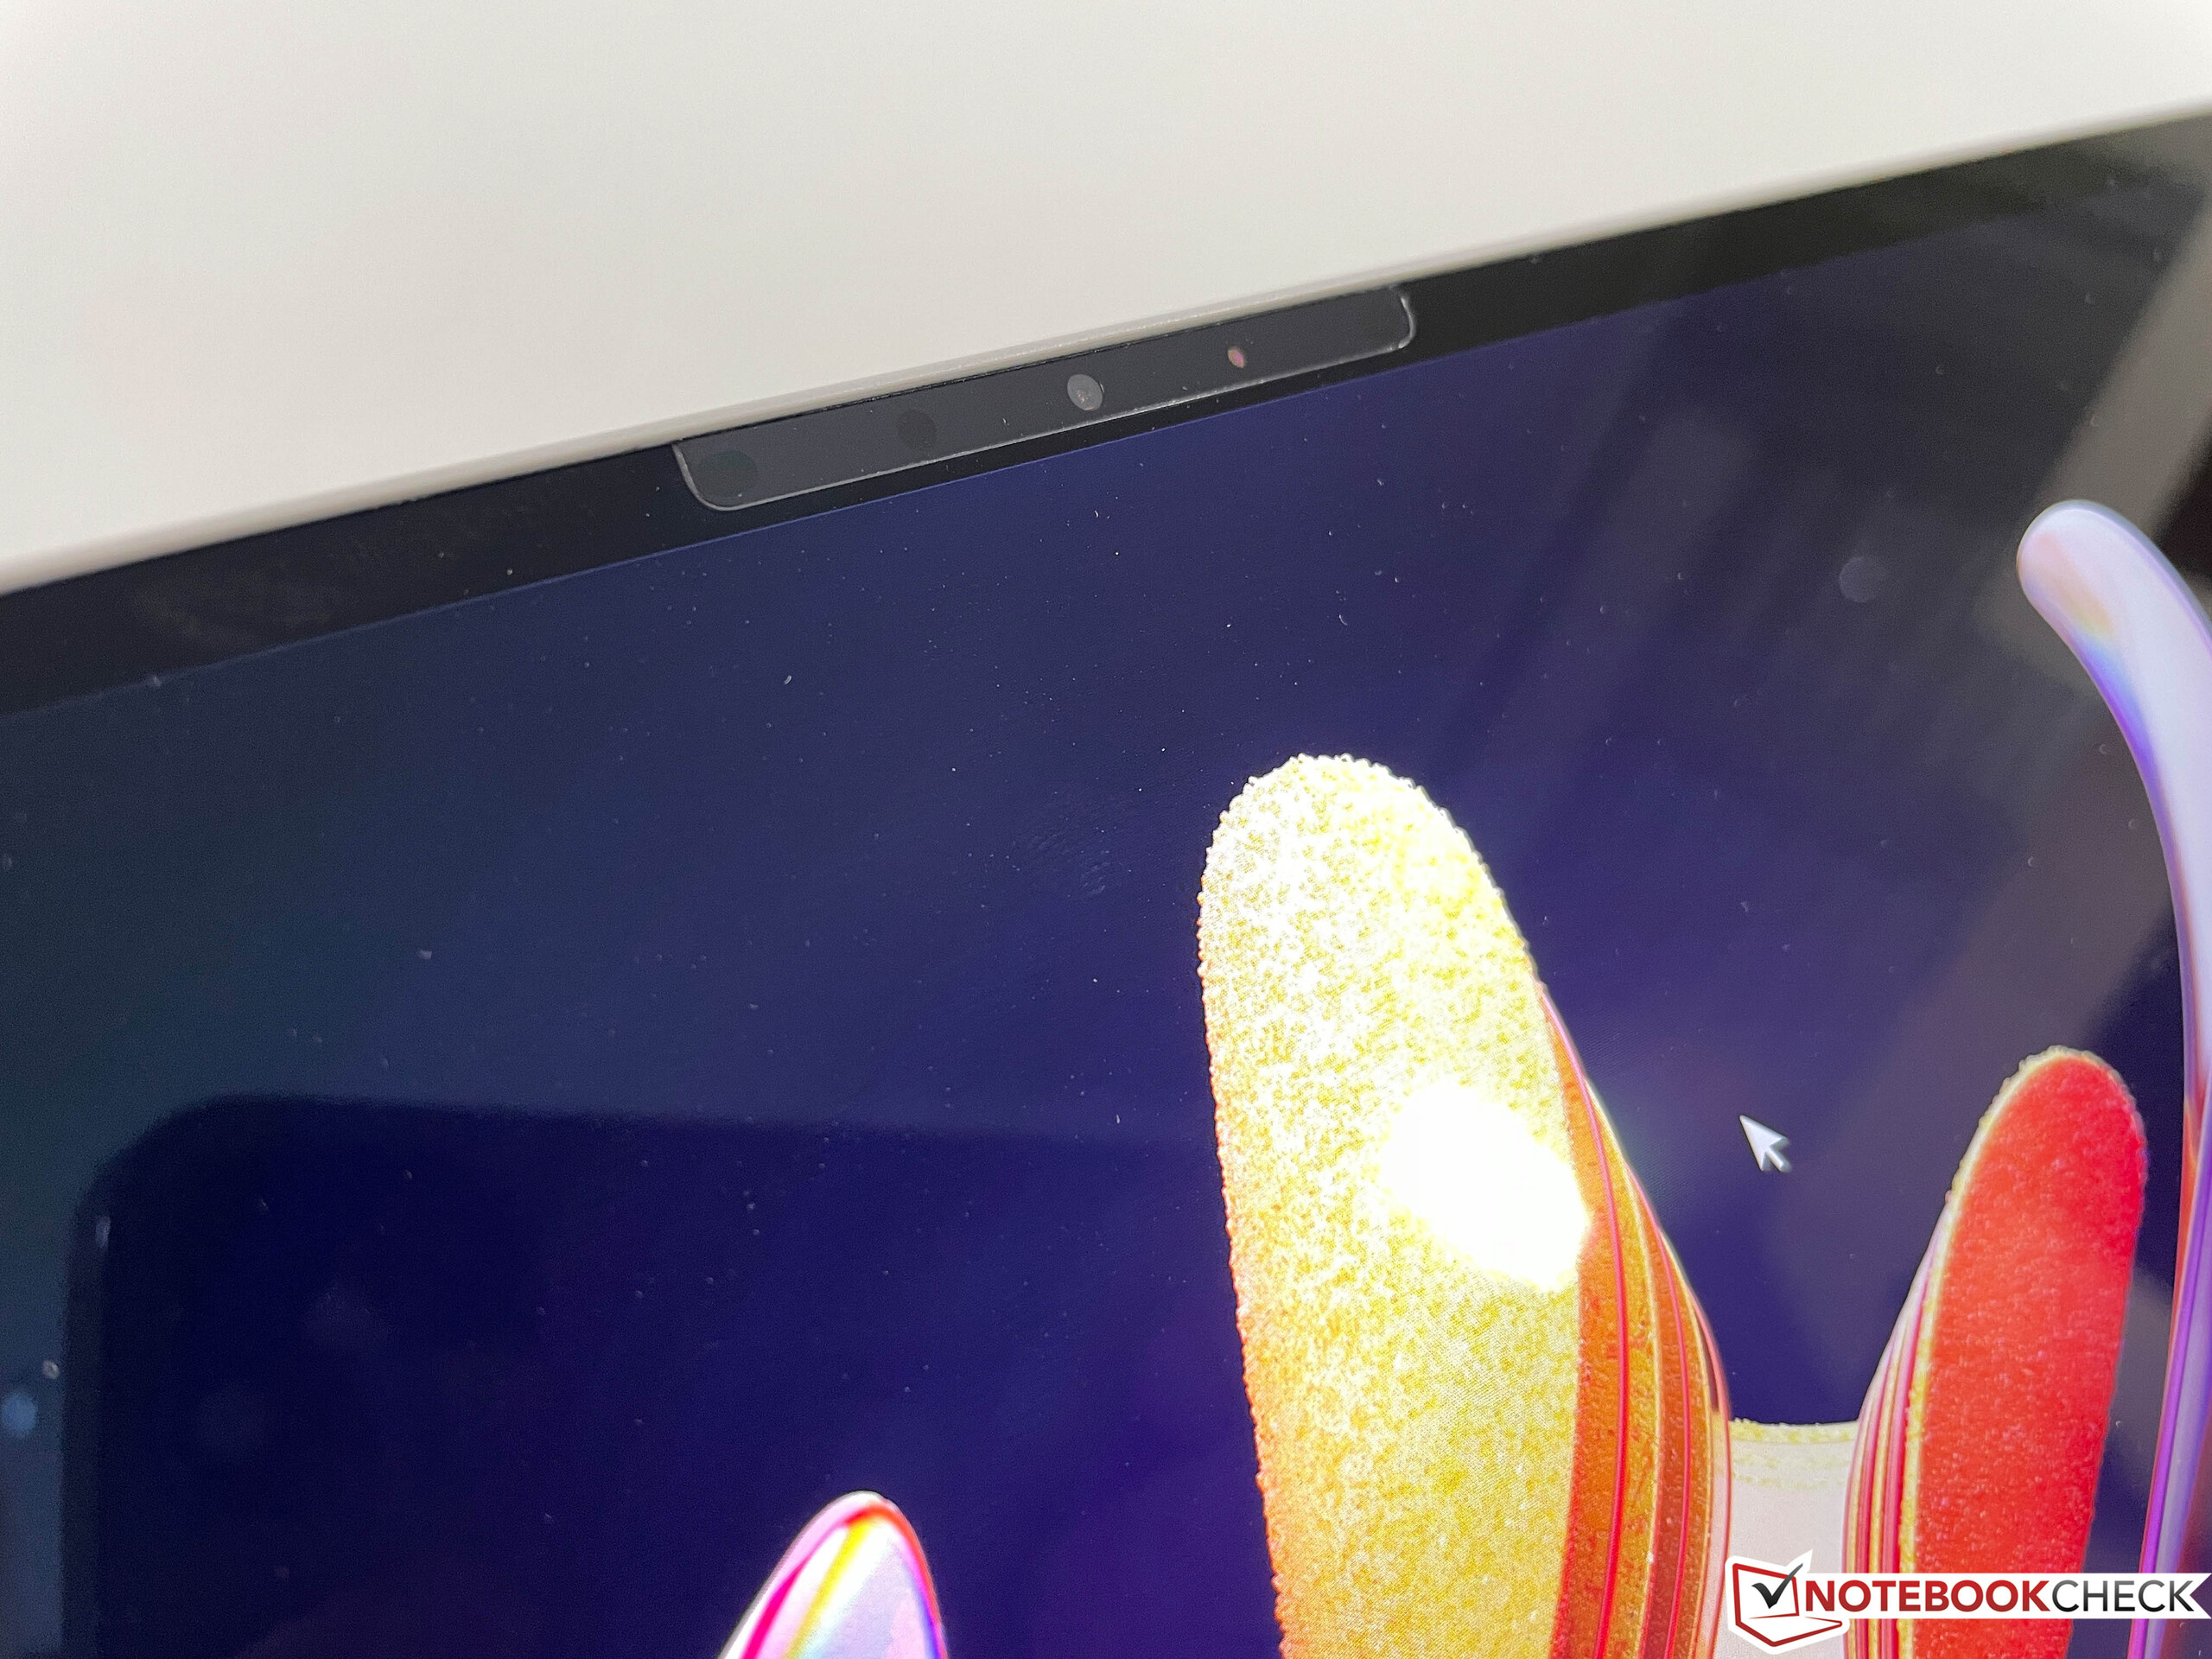
戴尔仍然使用720p的网络摄像头,但画质还可以,至少在良好的照明条件下。不过,考虑到视频会议的数量越来越多,一个1080p的传感器会更加充分,许多制造商都承认这一点。


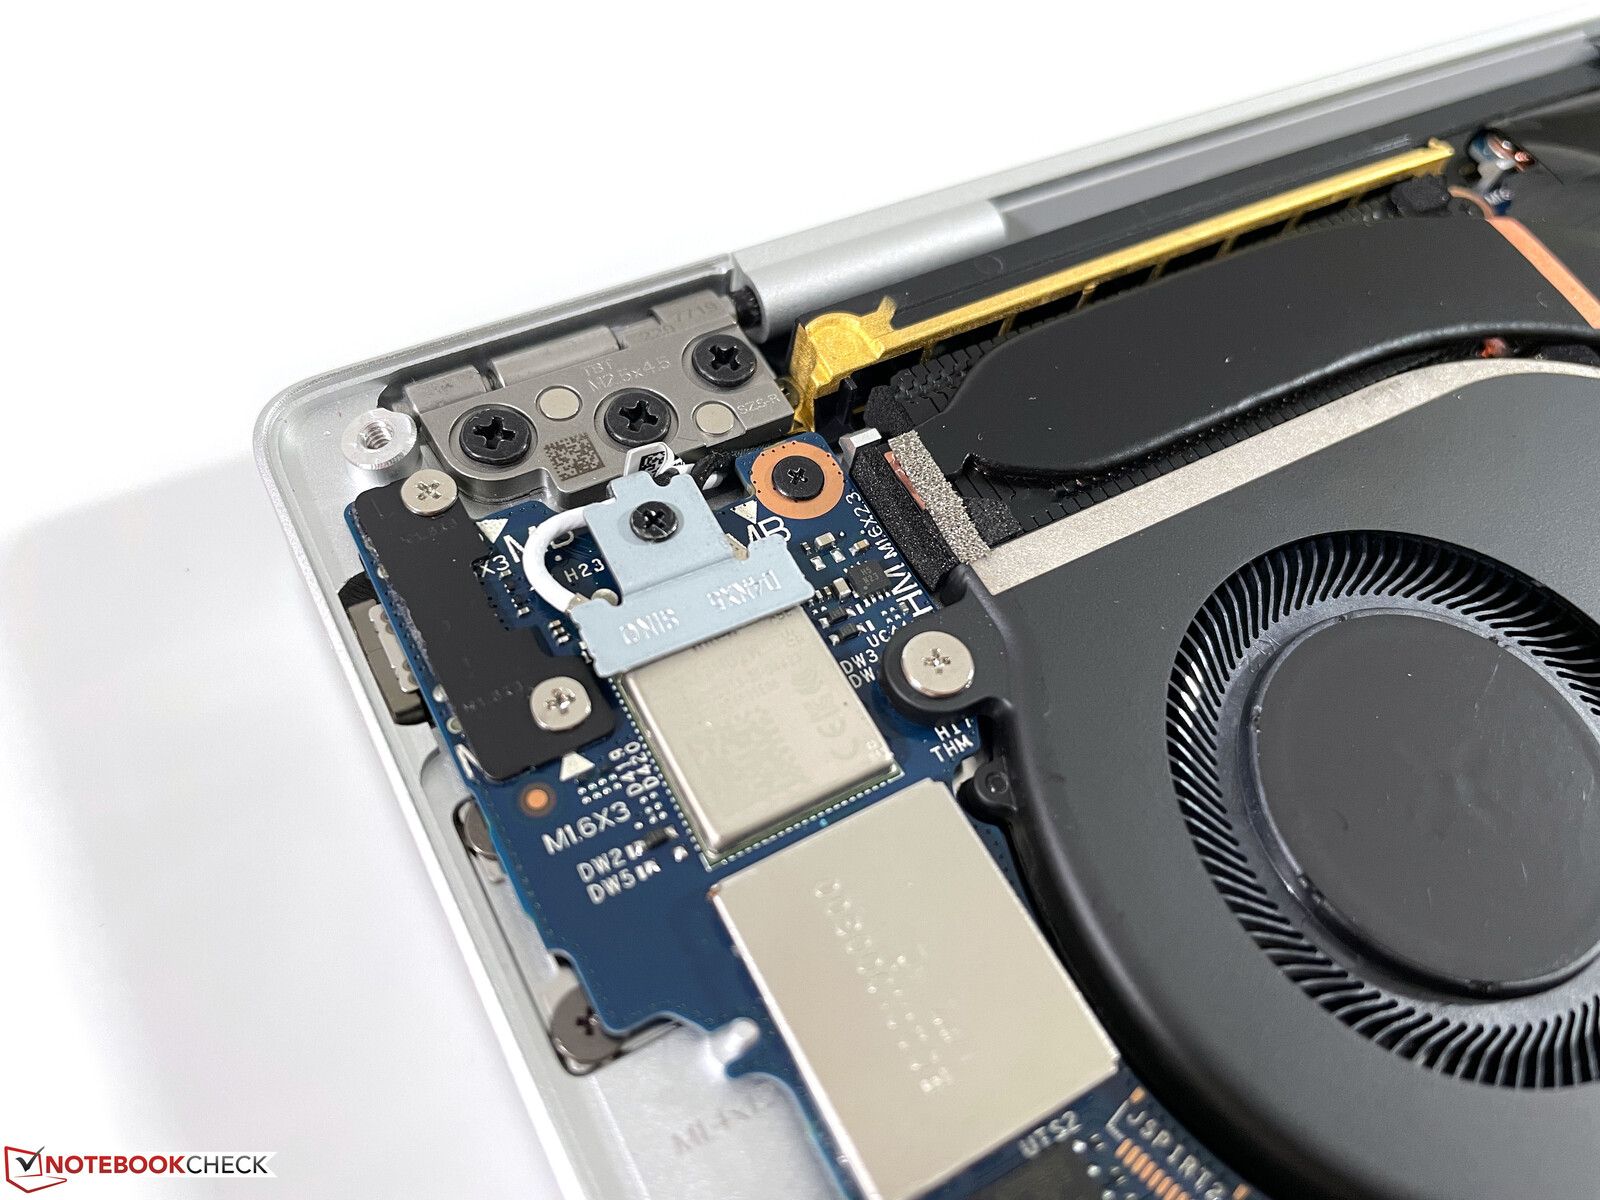
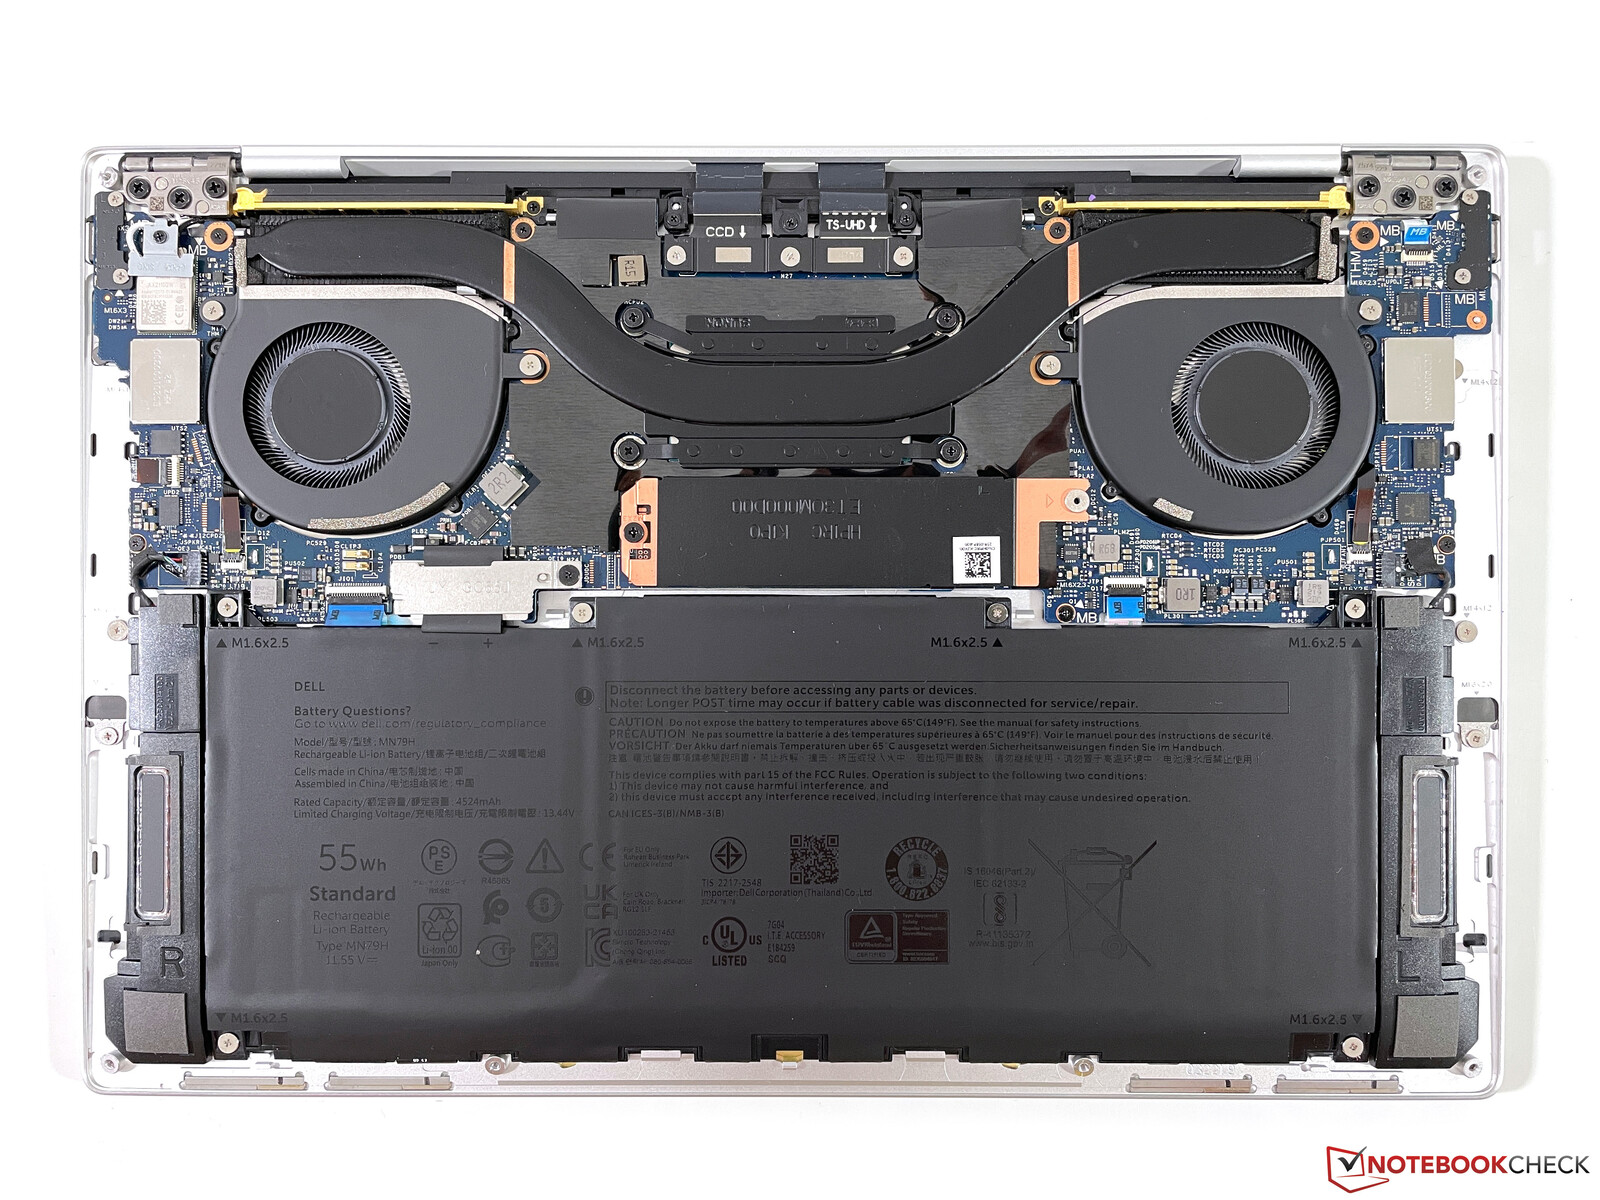
维护
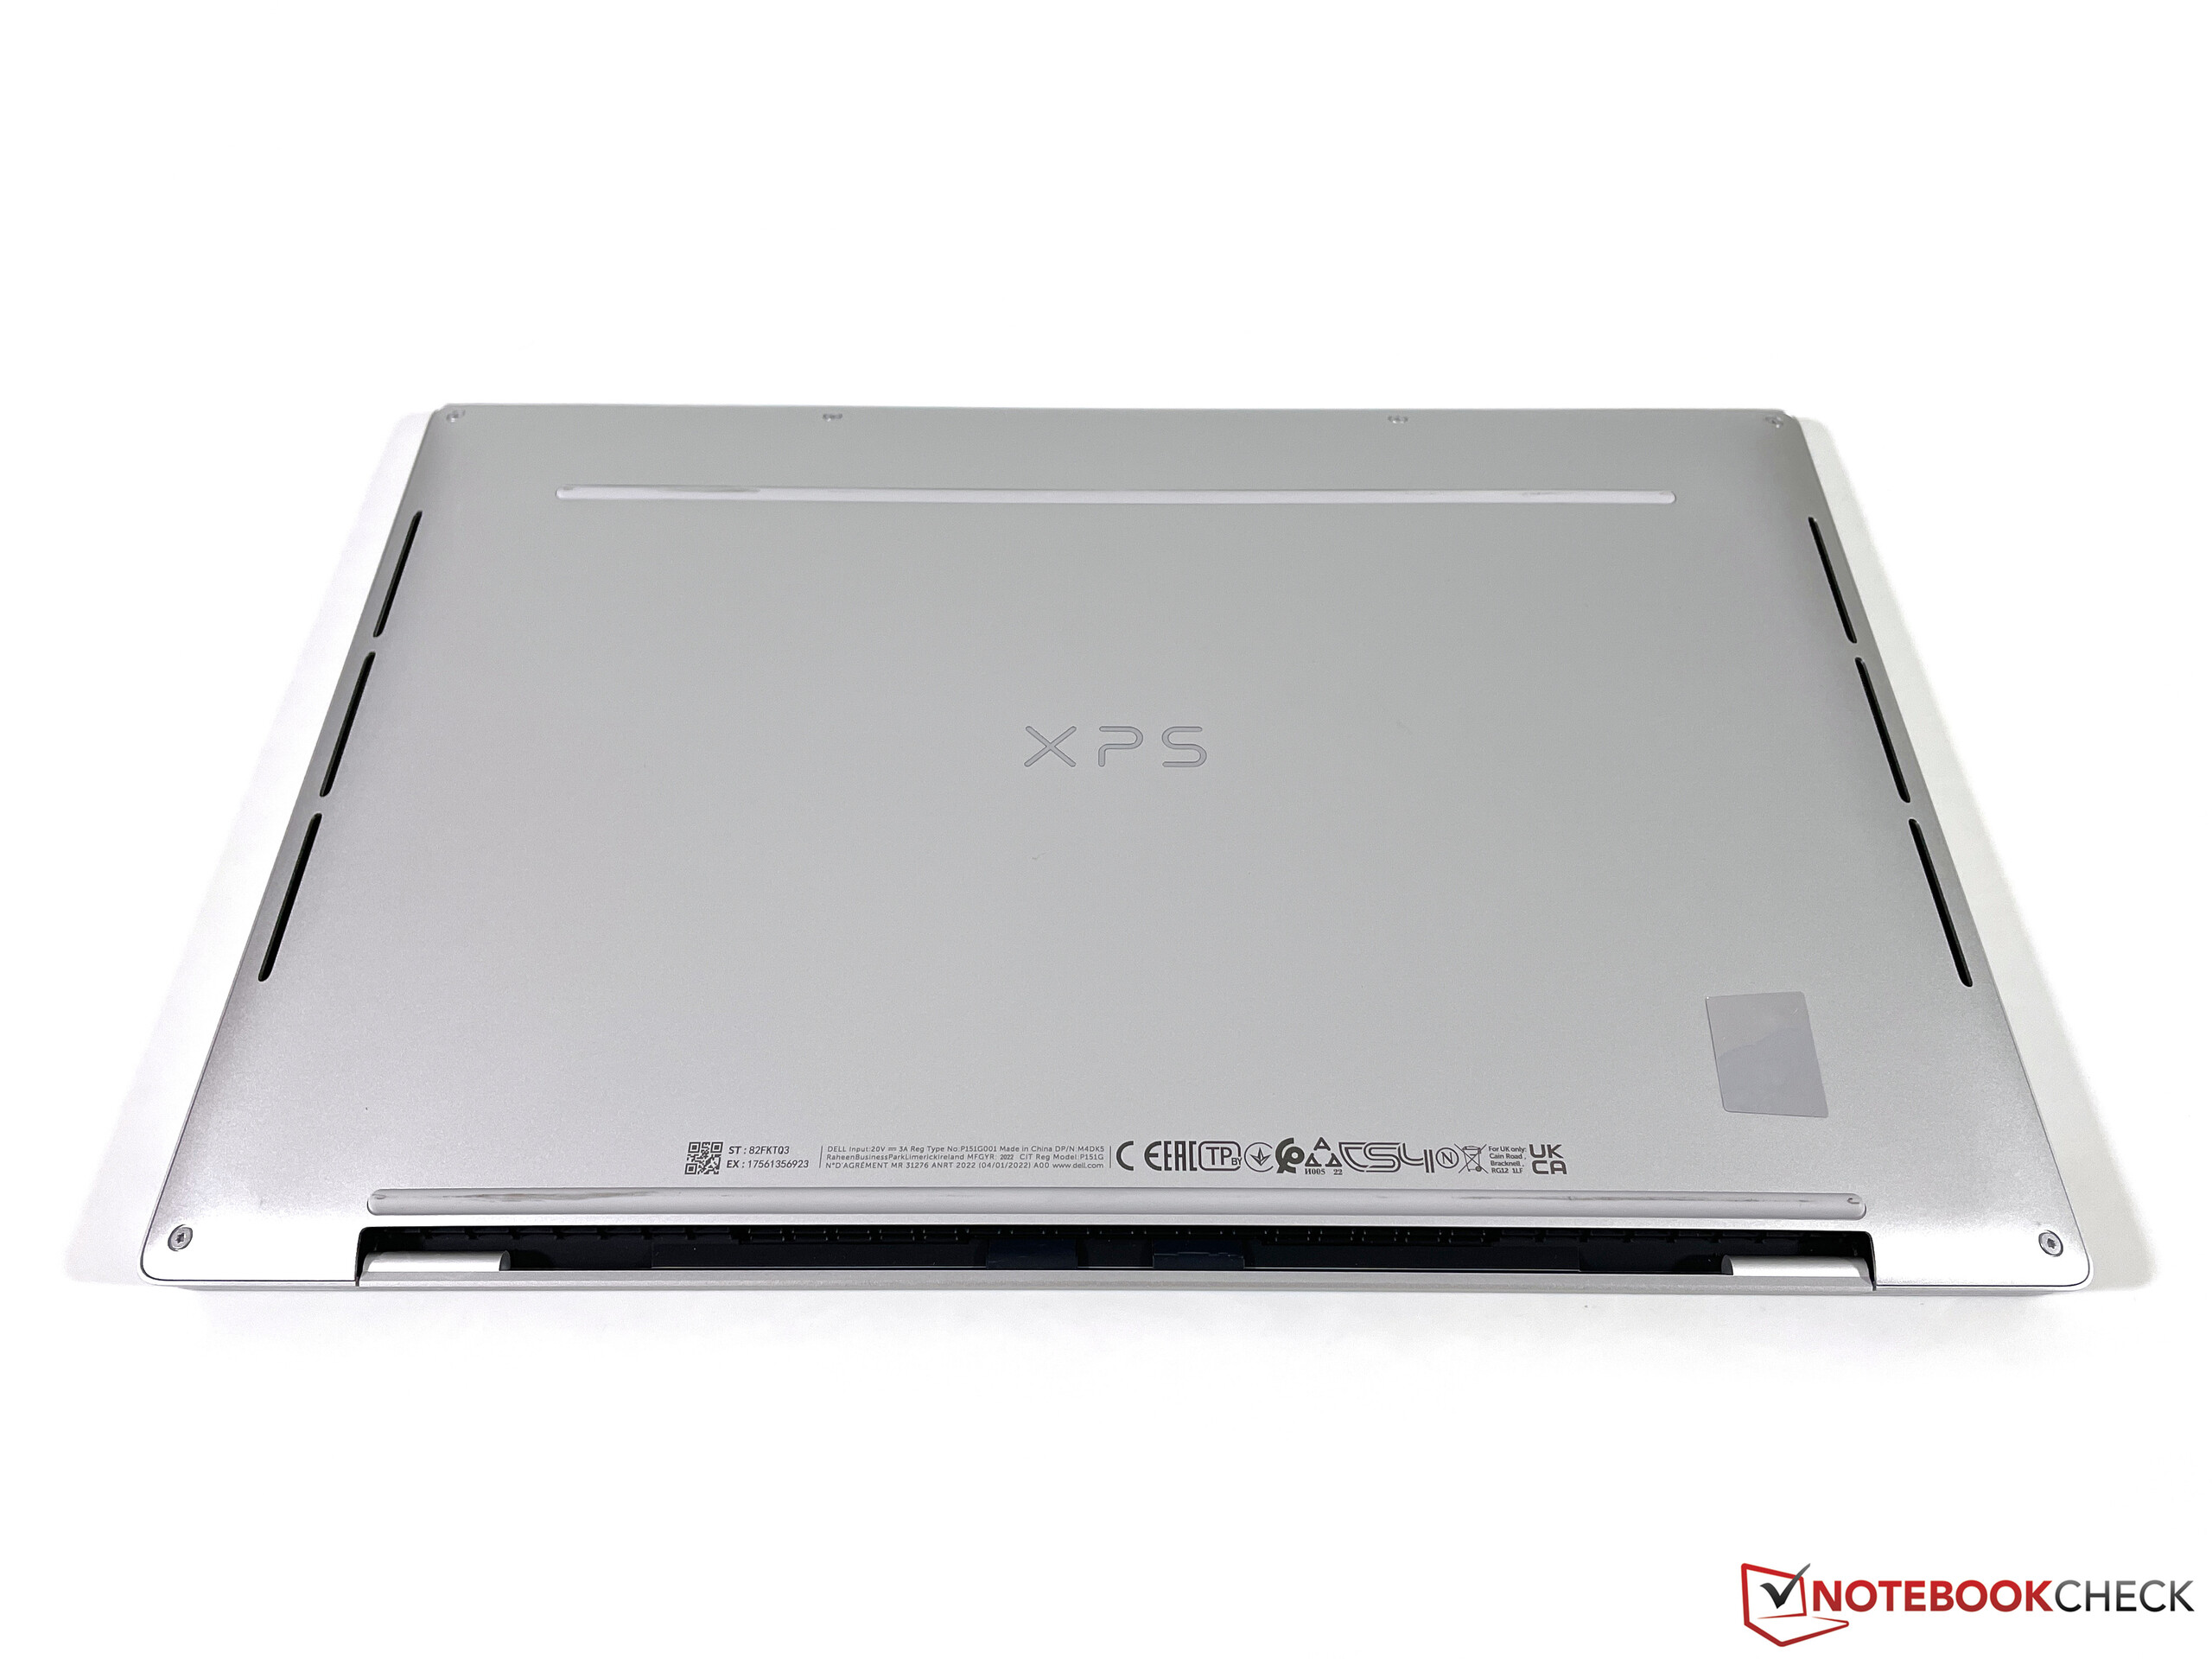
拆卸底板很容易,它只由6颗Torx螺丝(T5)固定。内部布局非常整洁,但你的维护行动仅限于清洁风扇和更换M.2-2280固态硬盘(如有必要)。
输入设备 - XPS 13采用了新的键盘设计
键盘
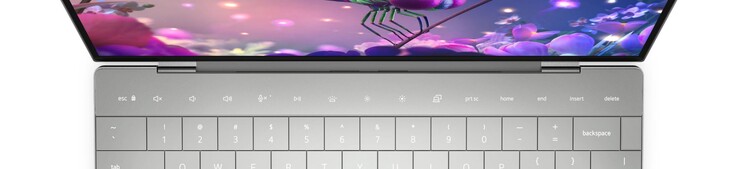
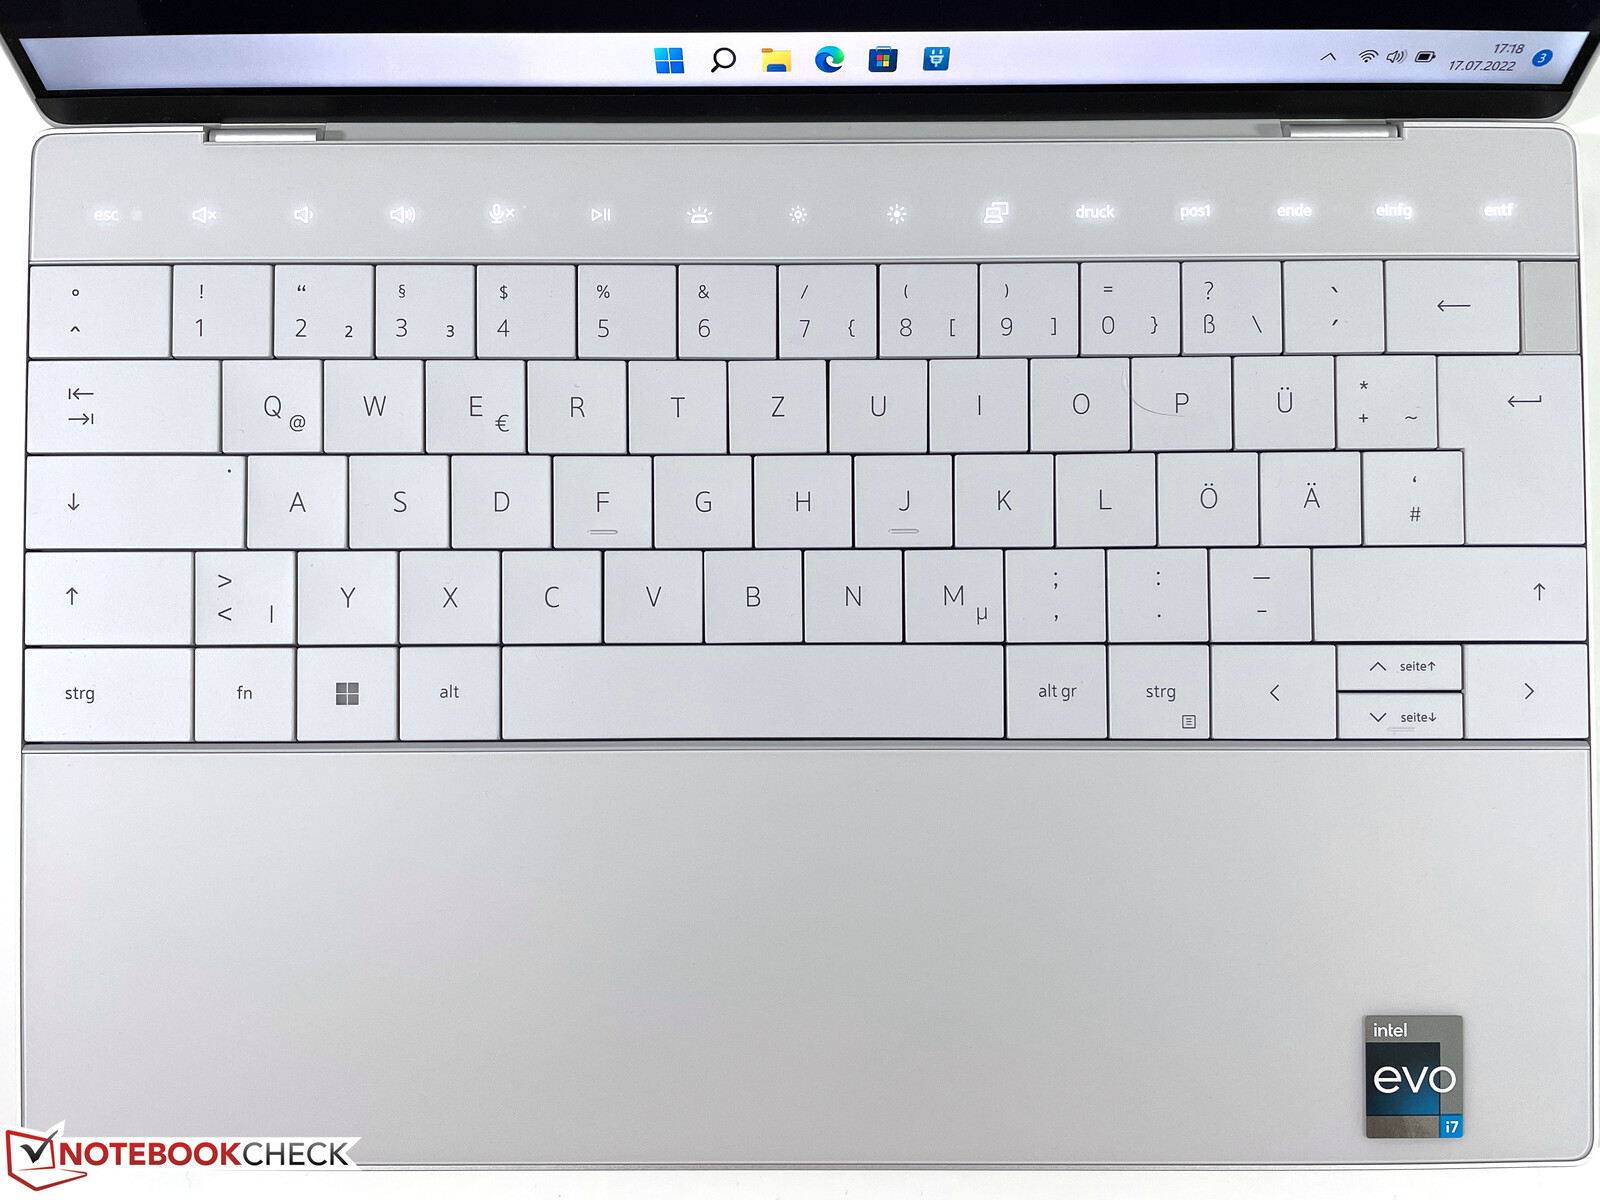
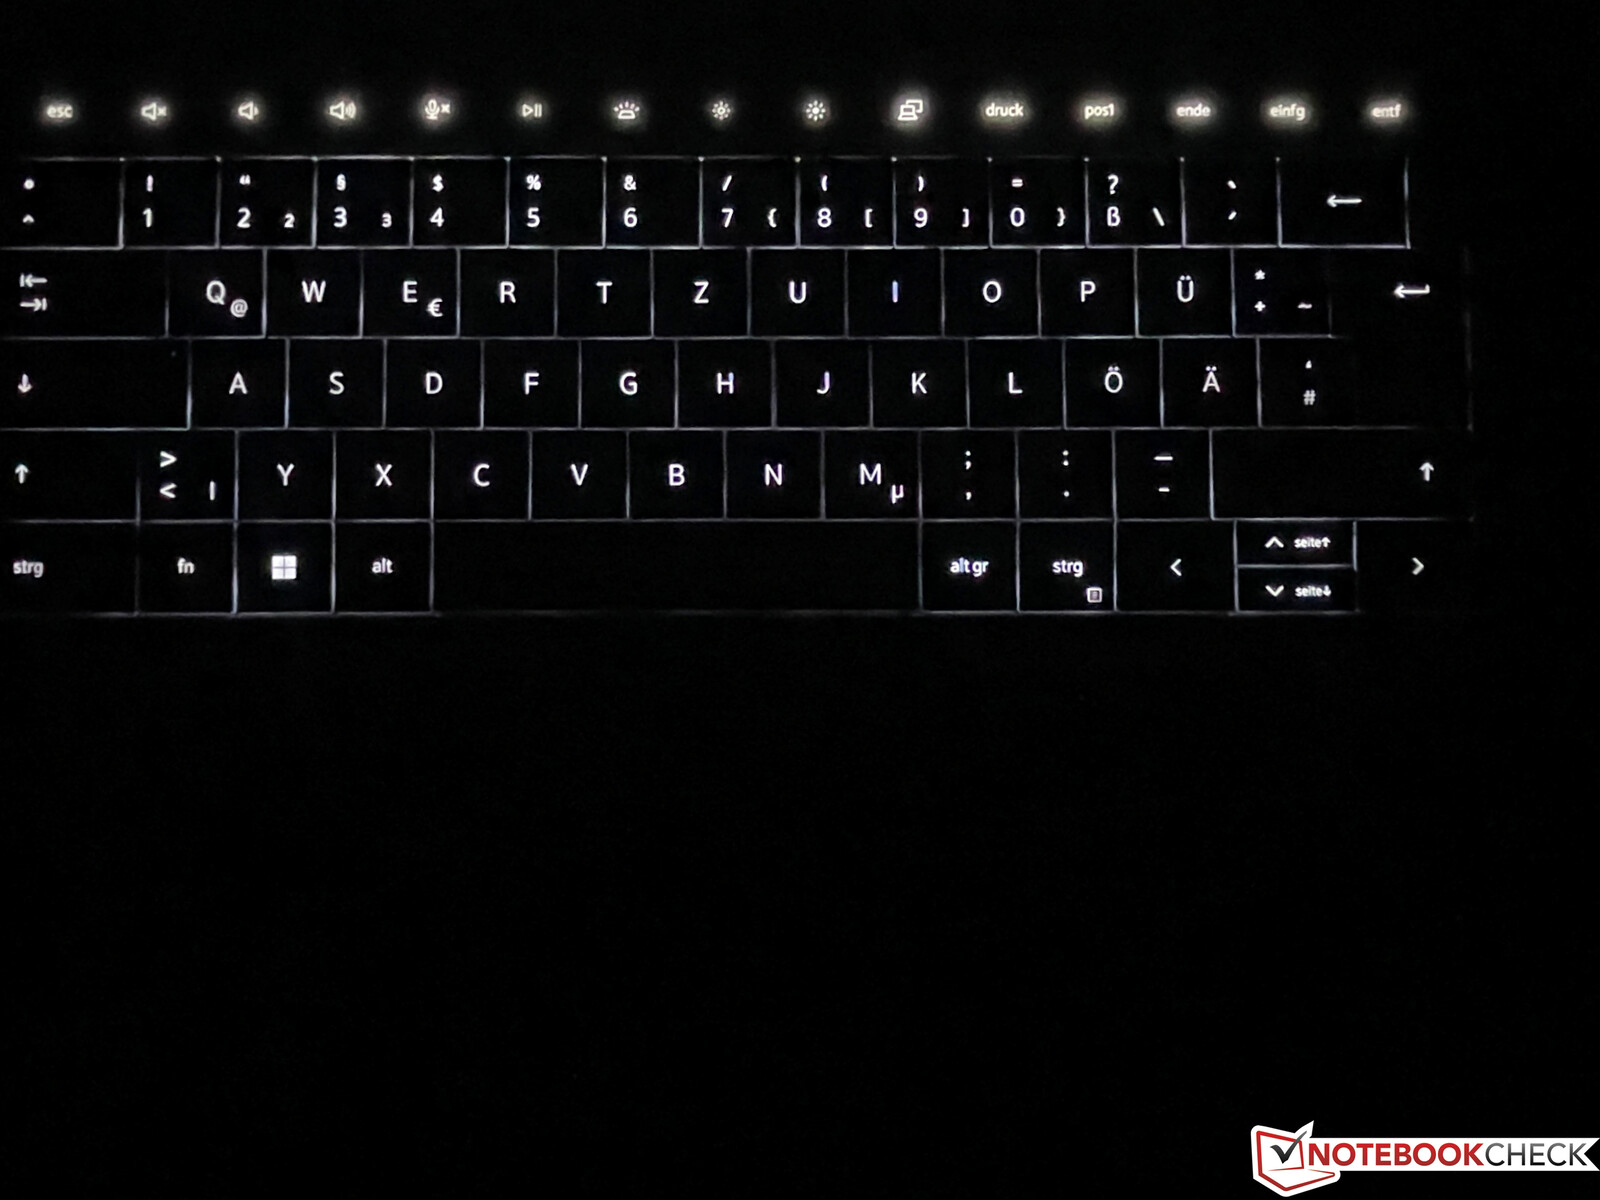
输入设备进行了一次大修,XPS 13 Plus也与普通的XPS 13不同。戴尔放弃了Plus型号的Chiclet键盘,现在使用更传统的布局,各个按键之间没有缝隙。制造商使用了机箱的整个宽度,按键也很方便大。尽管按键行程有限(1.0毫米),但流畅的打字体验和精确的反馈也让我们感到惊喜。总而言之,这是一个好的键盘,我们更喜欢它而不是旧的。然而,如果你只习惯于小键盘,可能需要一点时间来适应这种布局,因为它更难感觉到按键之间的过渡。电源键位于右上角,非常窄,所以在打字时不会受到干扰。它也是一个指纹扫描仪。
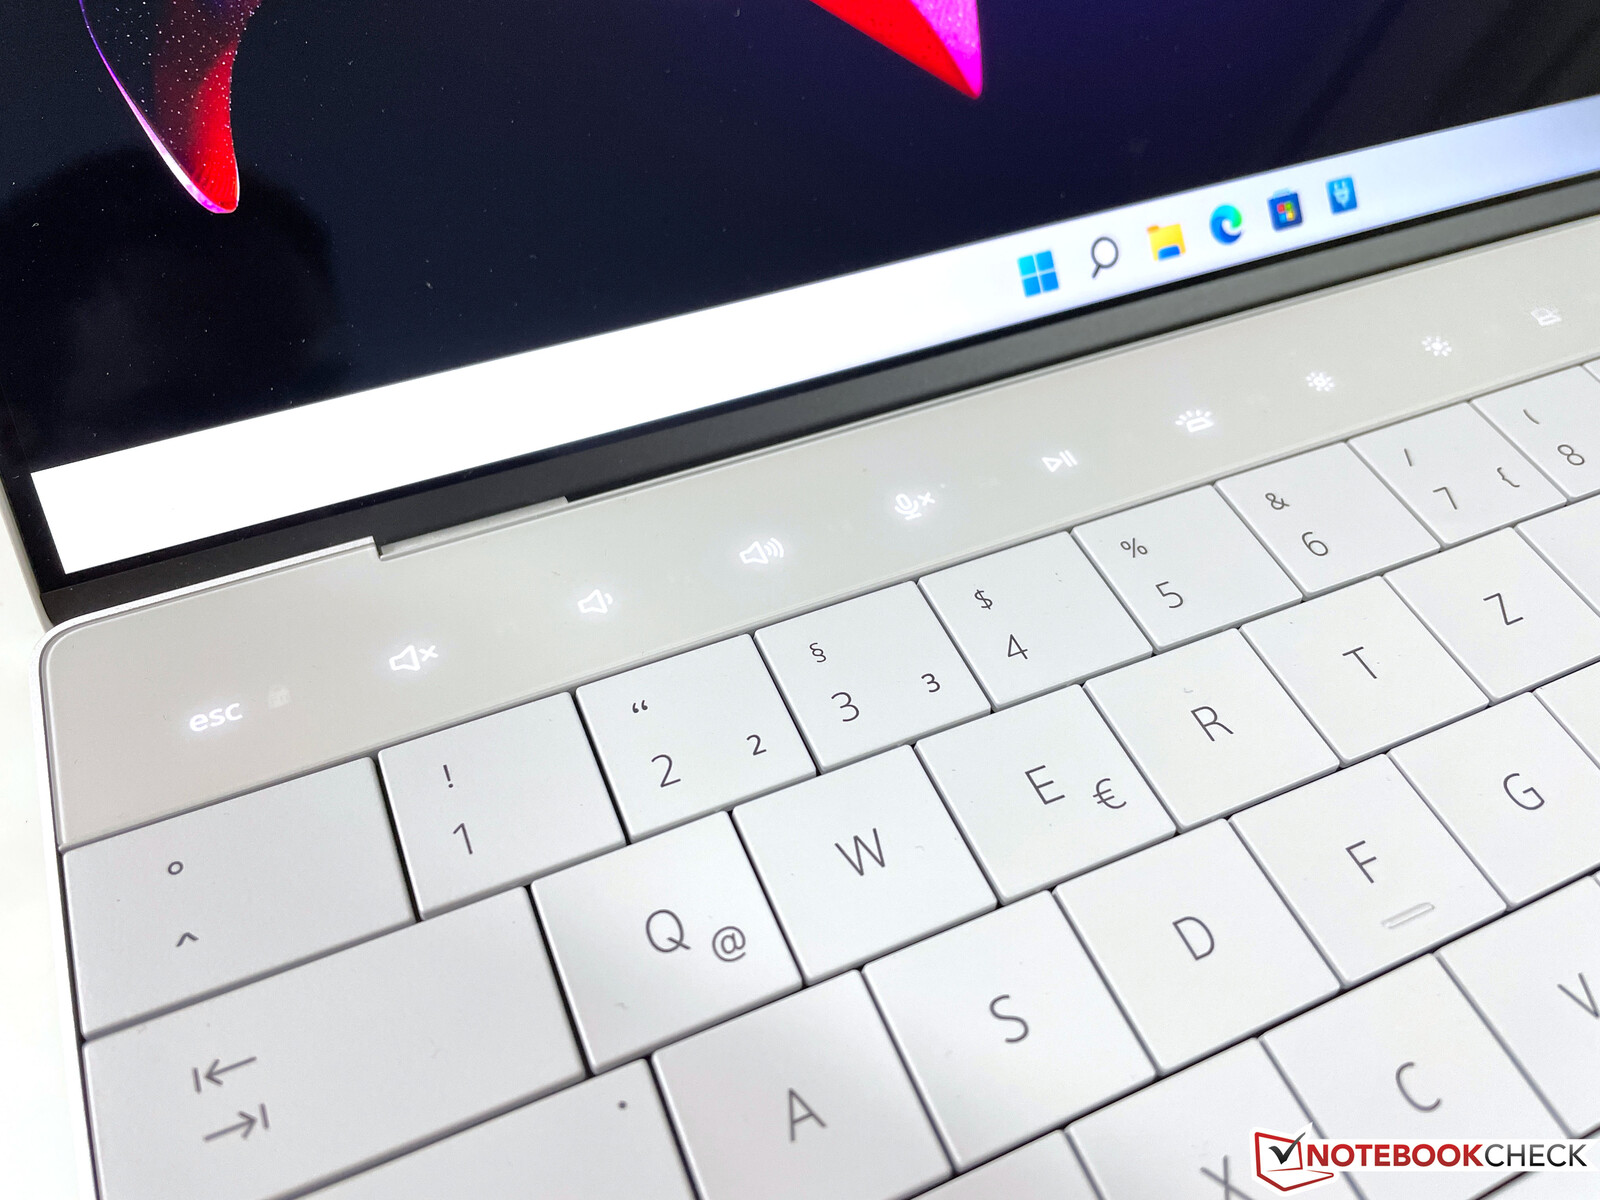
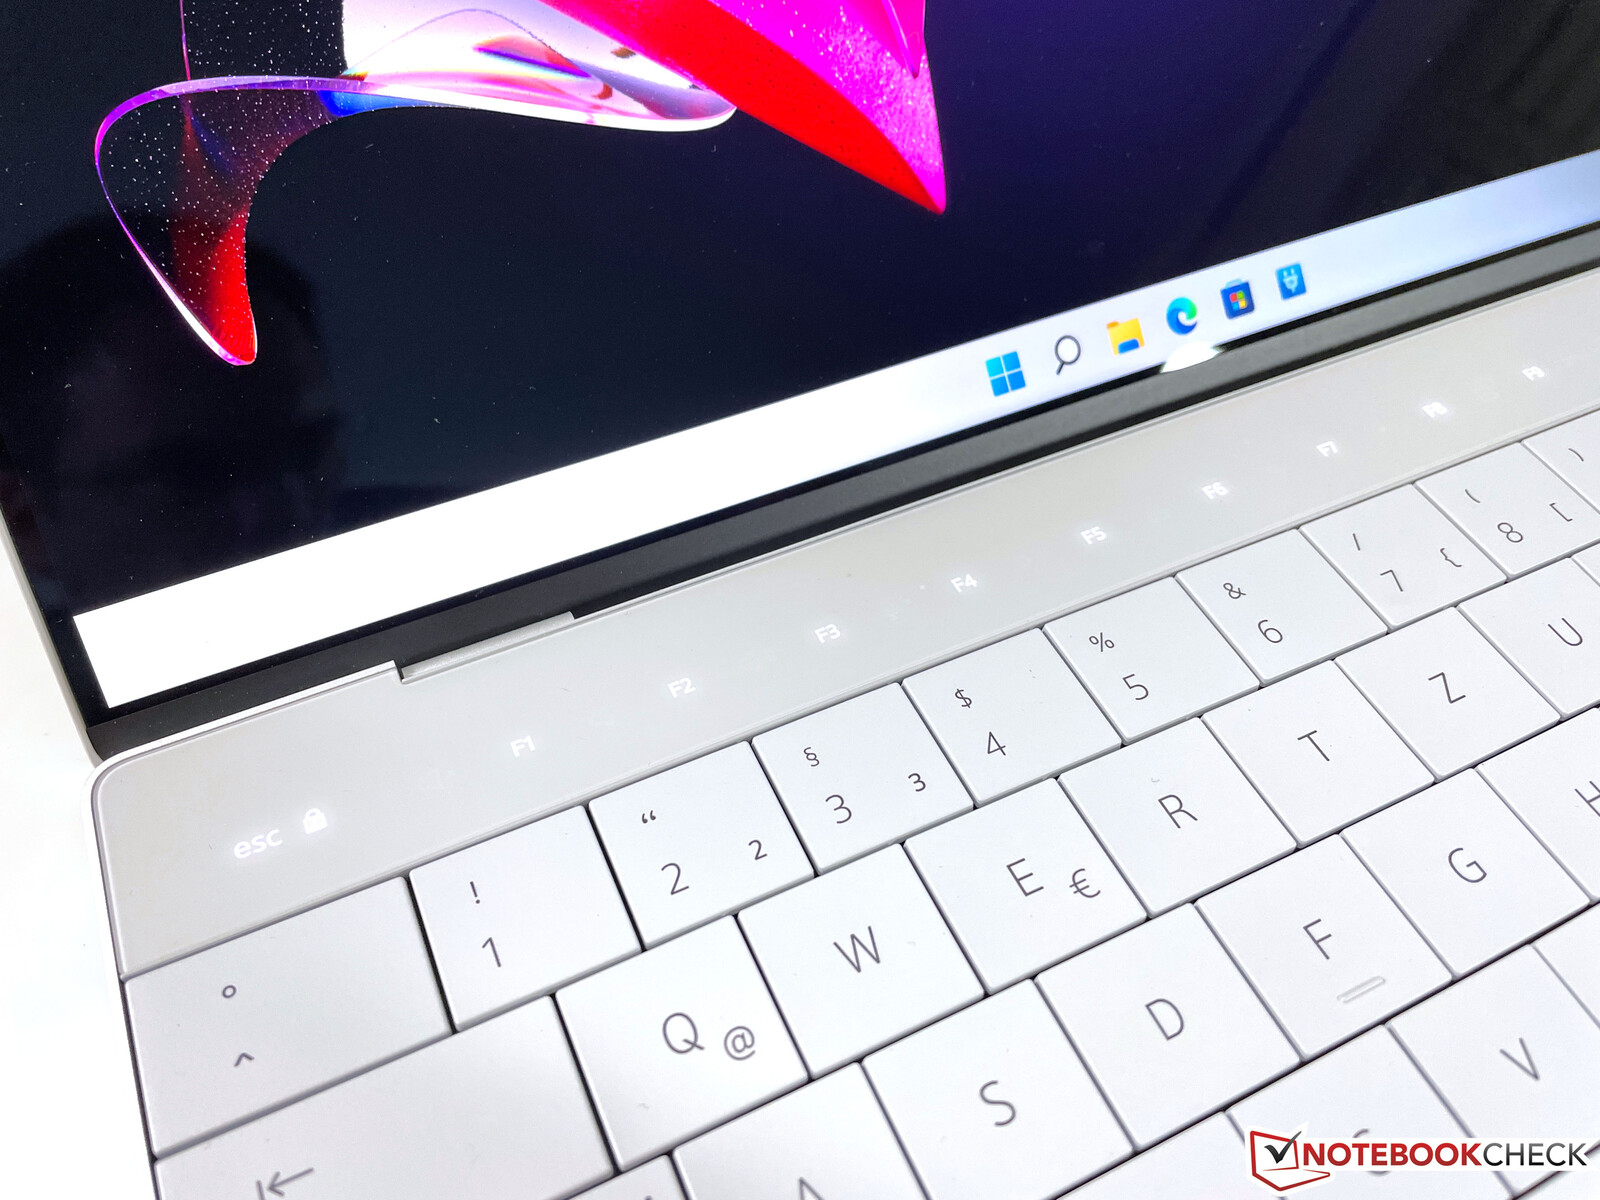
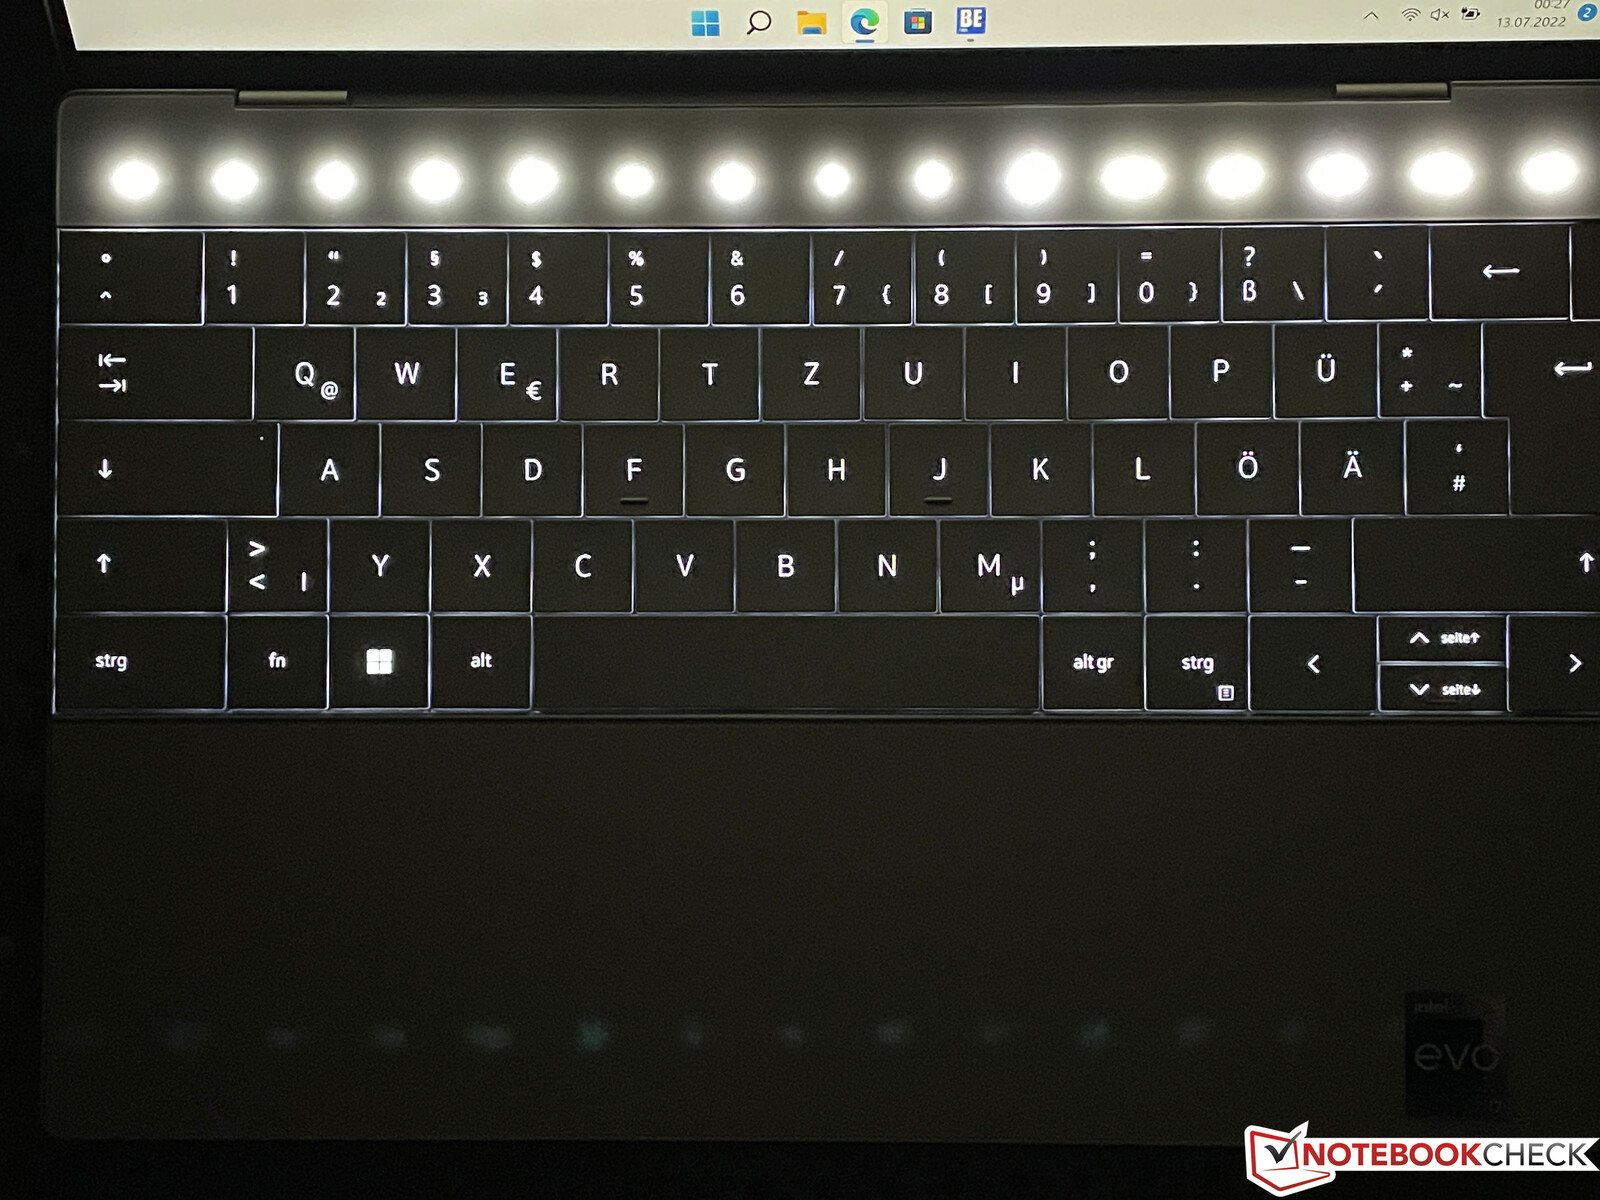
然后是带有功能键的触摸感应条,它总是被照亮,它要么显示特殊功能,如亮度或音量控制,要么显示常规的F键。一般来说,它工作得很好,但在较暗的环境中,照明可能会很烦人,而且你不能调整它。有两种不同的强度,但自动调节在我们的设备上并不总是可靠地工作。如果你在晚上看视频,即使是在较低的亮度设置下,照明也会成为一个问题。总而言之,触摸条更像是一个噱头,我们看不出它比普通按钮有什么优势。键盘照明不能通过传感器控制,在最高设置下也不是很亮。
触摸板和触摸屏
戴尔将点击板隐藏在掌托下面,你无法看到任何边界或过渡。输入区域从空格键的左边缘开始,在Alt Gr键的右边缘结束。我们很快就习惯了,并没有因为缺少过渡而产生任何问题,但如果你想在右下角触发右键,就会变得有点复杂。我们建议你用两个手指简单地点击一下,以实现右键。你可以在整个表面上点击垫子,而且点击的声音也不会太大。在审查期间,我们非常喜欢玻璃表面良好的滑行能力。
你也可以使用电容式触摸屏,它的工作原理与预期一致。然而,当你触摸它时,显示屏总是有点晃动。
显示器 - 戴尔提供IPS和OLED面板
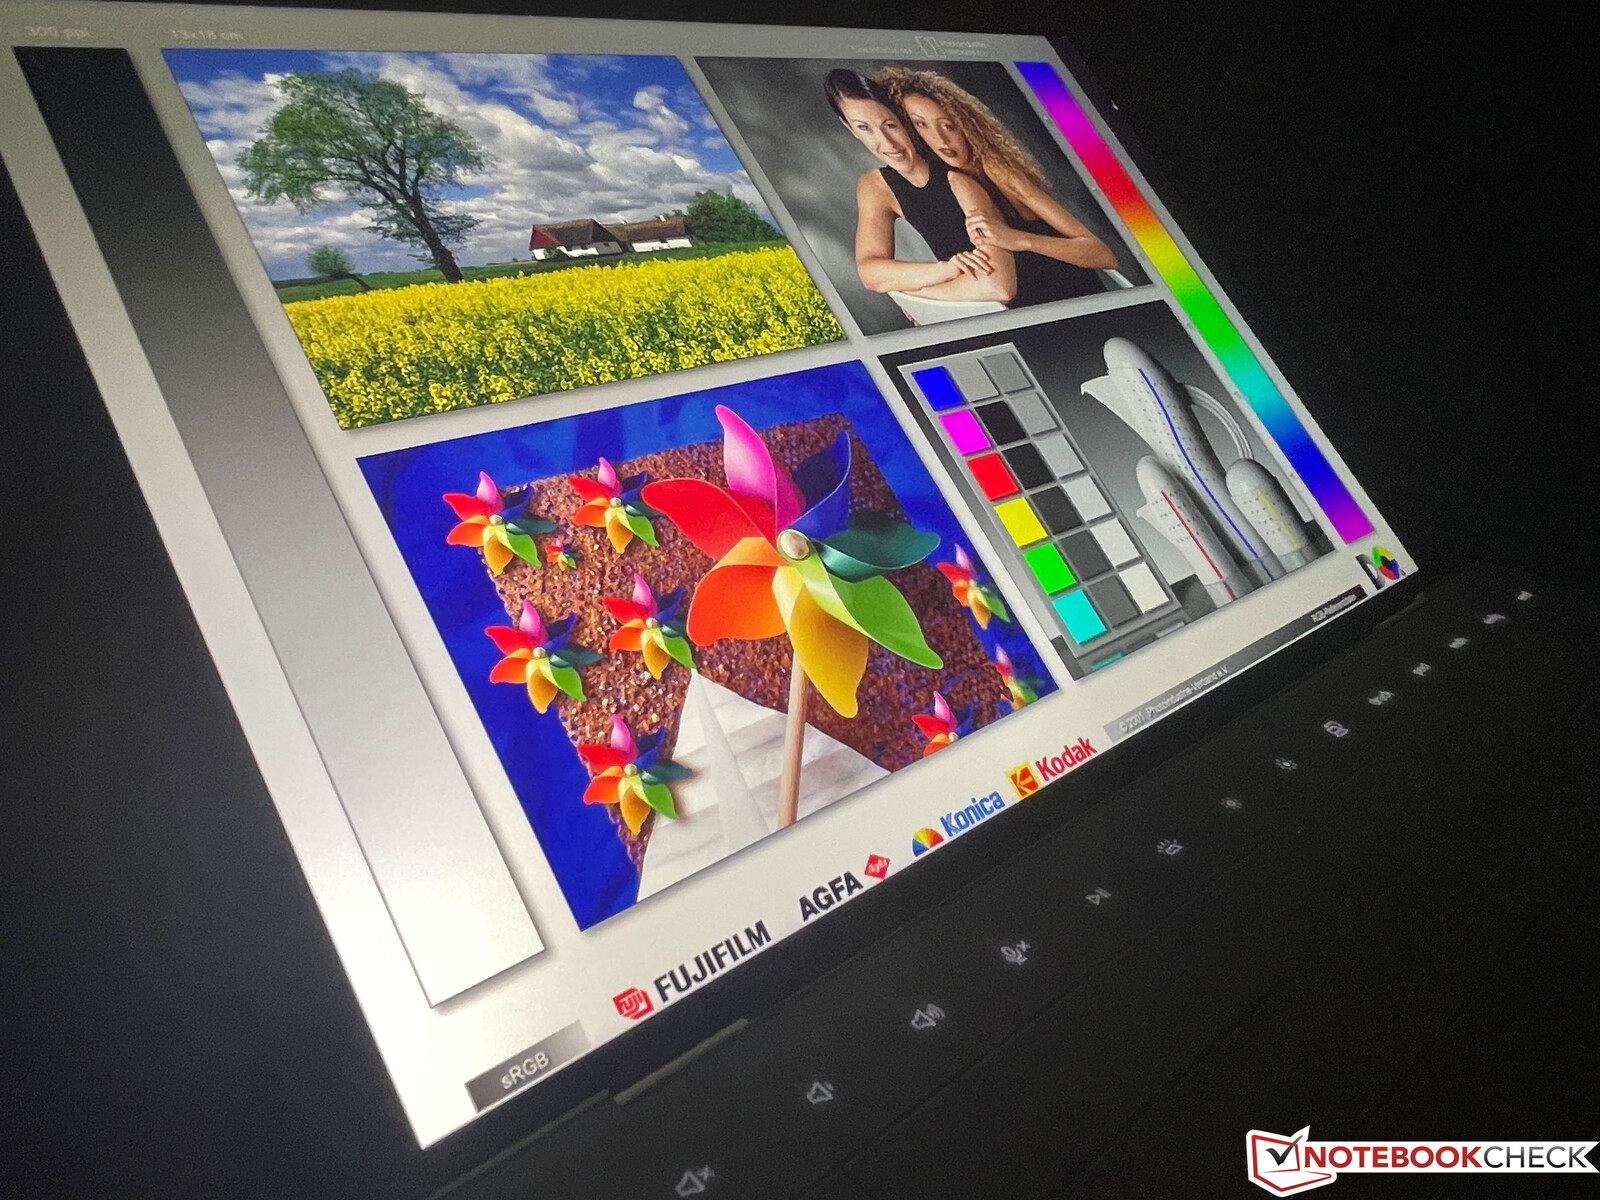
戴尔为XPS 13 Plus提供四种不同的面板。除了两个带和不带触摸屏的FHD型号(非触摸单元也有玻璃层,没有哑光选项),还有一个3.5K OLED屏幕,以及我们评测单元的4K IPS屏幕。该面板再次由夏普提供,型号也与之前的型号相同 以前的型号但我们注意到一些差异。主观的画质仍然很好,但在一些应用程序中仍然会有缩放问题。
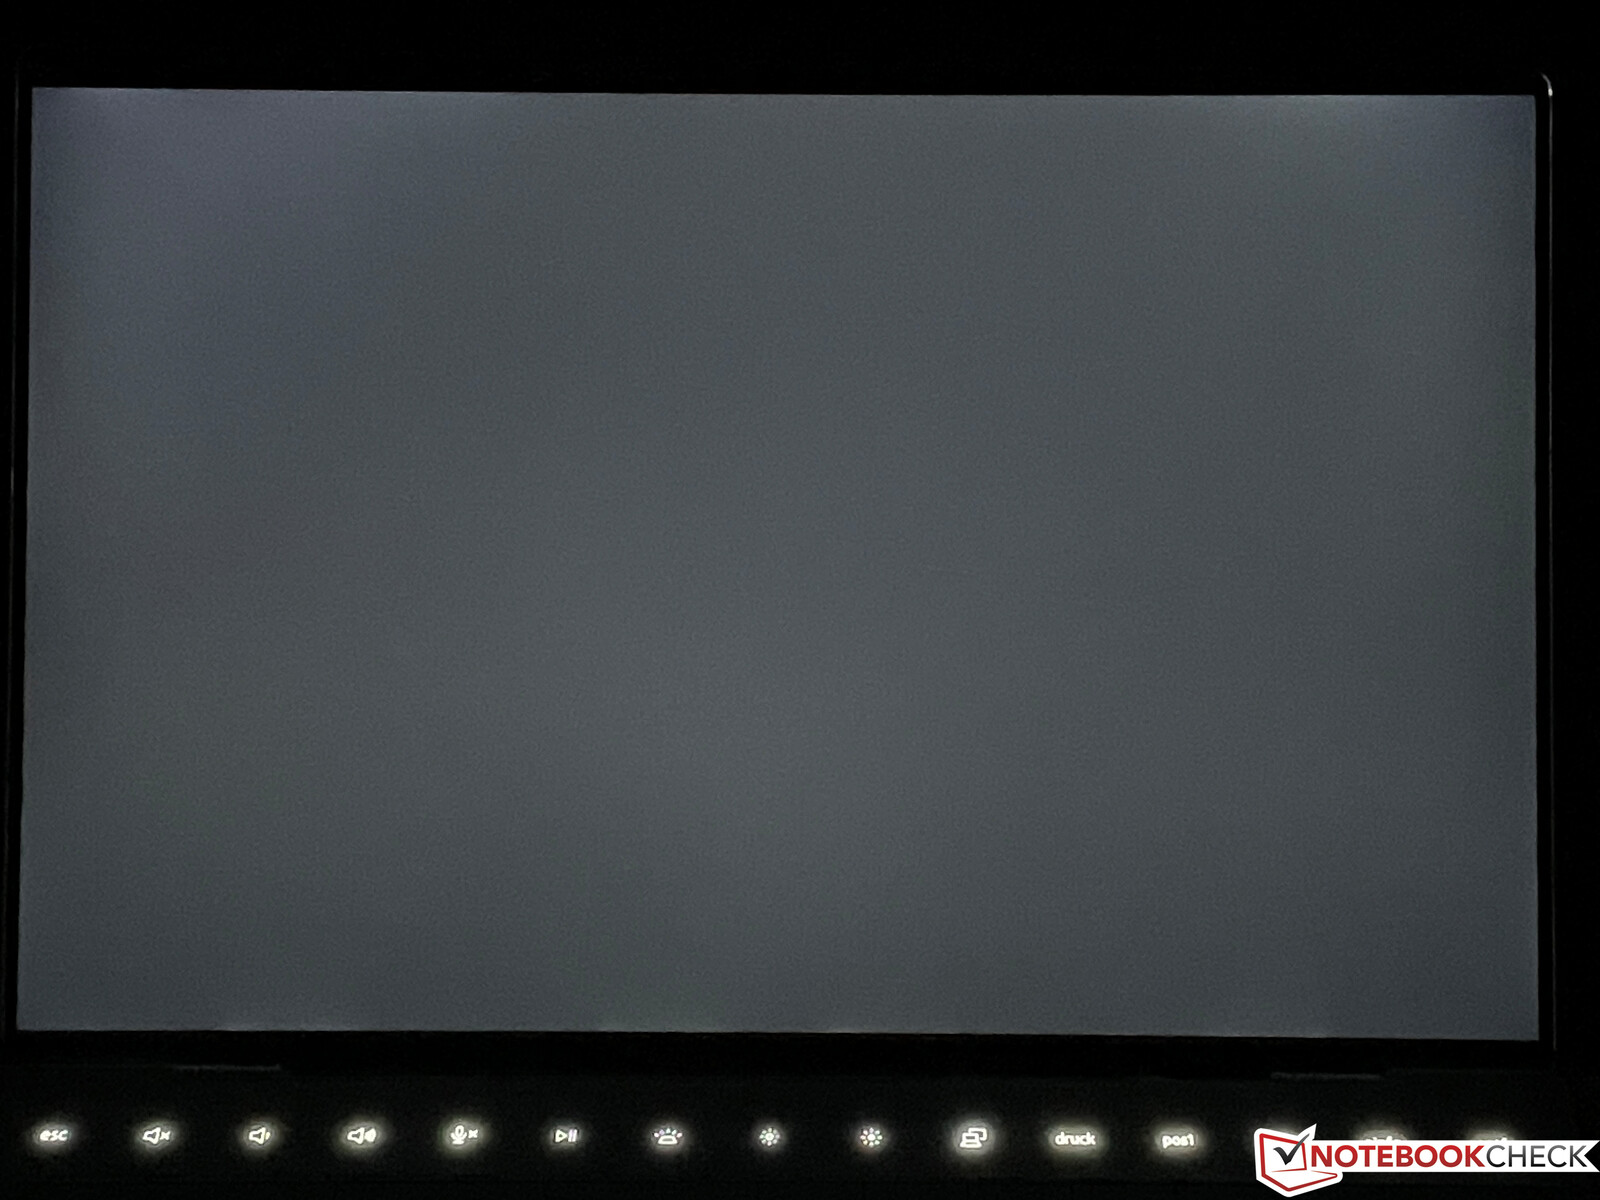
戴尔宣传的亮度为500cd/m²,但我们的评测设备平均只能达到474尼特。考虑到亮度,黑值(0.28)还是可以的,对比度也非常好,达到了~1700:1。不过,~30尼特的最低亮度可能是一个问题,特别是如果你在非常黑暗的环境中使用它。这显然不符合人体工程学,但它发生了。
虽然XPS 13的可选OLED屏幕受到PWM闪烁的影响,但我们这次在IPS显示屏上没有发现任何闪烁。与之前的XPS 13 9310的4K屏幕相比,响应时间也明显更好,而且没有出现重影的大问题。当你使用全亮度时,背光渗漏只是上边缘的一个小问题,但这在实践中几乎不明显。IPS屏幕的可视角度稳定性也非常好。
| |||||||||||||||||||||||||
Brightness Distribution: 89 %
Center on Battery: 493 cd/m²
Contrast: 1764:1 (Black: 0.28 cd/m²)
ΔE ColorChecker Calman: 3.1 | ∀{0.5-29.43 Ø4.73}
calibrated: 1.5
ΔE Greyscale Calman: 3.2 | ∀{0.09-98 Ø4.97}
76% AdobeRGB 1998 (Argyll 3D)
100% sRGB (Argyll 3D)
76.5% Display P3 (Argyll 3D)
Gamma: 2.41
CCT: 6189 K
| Dell XPS 13 Plus 9320 4K LQ134R1, IPS, 3840x2400, 13.4" | Asus Zenbook S 13 OLED SDC4172, OLED, 2880x1800, 13.3" | Lenovo ThinkPad X1 Nano-20UN002UGE MND007ZA1-2, IPS, 2160x1350, 13" | Apple MacBook Air 2020 M1 Entry IPS, 2560x1600, 13.3" | Huawei MateBook 13s i5 11300H TL134GDXP02-0, LTPS, 2520x1680, 13.4" | Dell XPS 13 9310 Core i7 4K Sharp LQ134R1, IPS, 3840x2400, 13.4" | Dell XPS 13 9310 OLED Samsung 134XK01, OLED, 3456x2160, 13.4" | |
|---|---|---|---|---|---|---|---|
| Display | 20% | -4% | 14% | -11% | 3% | 20% | |
| Display P3 Coverage (%) | 76.5 | 99.8 30% | 70.4 -8% | 98.6 29% | 65.2 -15% | 80.2 5% | 99.7 30% |
| sRGB Coverage (%) | 100 | 100 0% | 99.9 0% | 100 0% | 92 -8% | 100 0% | 100 0% |
| AdobeRGB 1998 Coverage (%) | 76 | 97.8 29% | 72 -5% | 85.9 13% | 67.5 -11% | 78.9 4% | 97.7 29% |
| Response Times | 94% | -24% | 1% | -10% | -68% | 92% | |
| Response Time Grey 50% / Grey 80% * (ms) | 38.9 ? | 2.1 ? 95% | 46.8 ? -20% | 31 ? 20% | 44.8 ? -15% | 59.2 ? -52% | 2.2 ? 94% |
| Response Time Black / White * (ms) | 21.9 ? | 1.68 ? 92% | 28 ? -28% | 26.1 ? -19% | 22.8 ? -4% | 40.4 ? -84% | 2.2 ? 90% |
| PWM Frequency (Hz) | 240.4 ? | 118000 ? | 9804 ? | 2137 ? | 240.4 ? | ||
| Screen | 111% | 14% | 10% | 5% | -5% | -43% | |
| Brightness middle (cd/m²) | 494 | 336 -32% | 460 -7% | 417 -16% | 468 -5% | 508.7 3% | 384 -22% |
| Brightness (cd/m²) | 474 | 338 -29% | 434 -8% | 395 -17% | 450 -5% | 479 1% | 387 -18% |
| Brightness Distribution (%) | 89 | 99 11% | 92 3% | 91 2% | 92 3% | 84 -6% | 97 9% |
| Black Level * (cd/m²) | 0.28 | 0.02 93% | 0.27 4% | 0.39 -39% | 0.23 18% | 0.3 -7% | |
| Contrast (:1) | 1764 | 16800 852% | 1704 -3% | 1069 -39% | 2035 15% | 1696 -4% | |
| Colorchecker dE 2000 * | 3.1 | 1.8 42% | 1.1 65% | 1.12 64% | 2 35% | 2.72 12% | 4.56 -47% |
| Colorchecker dE 2000 max. * | 4.2 | 3.8 10% | 4.5 -7% | 2.71 35% | 5.5 -31% | 4.7 -12% | 7.27 -73% |
| Colorchecker dE 2000 calibrated * | 1.5 | 1.8 -20% | 1 33% | 0.77 49% | 1.5 -0% | 1.92 -28% | 4.52 -201% |
| Greyscale dE 2000 * | 3.2 | 0.9 72% | 1.6 50% | 1.7 47% | 2.6 19% | 3.4 -6% | 1.5 53% |
| Gamma | 2.41 91% | 2.22 99% | 2.2 100% | 2207 0% | 2.17 101% | 2.11 104% | 2.26 97% |
| CCT | 6189 105% | 6580 99% | 6475 100% | 6870 95% | 6511 100% | 6245 104% | 6219 105% |
| Color Space (Percent of AdobeRGB 1998) (%) | 65.7 | 70.7 | 87.1 | ||||
| Color Space (Percent of sRGB) (%) | 99.9 | 100 | 100 | ||||
| Total Average (Program / Settings) | 75% /
89% | -5% /
5% | 8% /
9% | -5% /
-0% | -23% /
-12% | 23% /
-5% |
* ... smaller is better
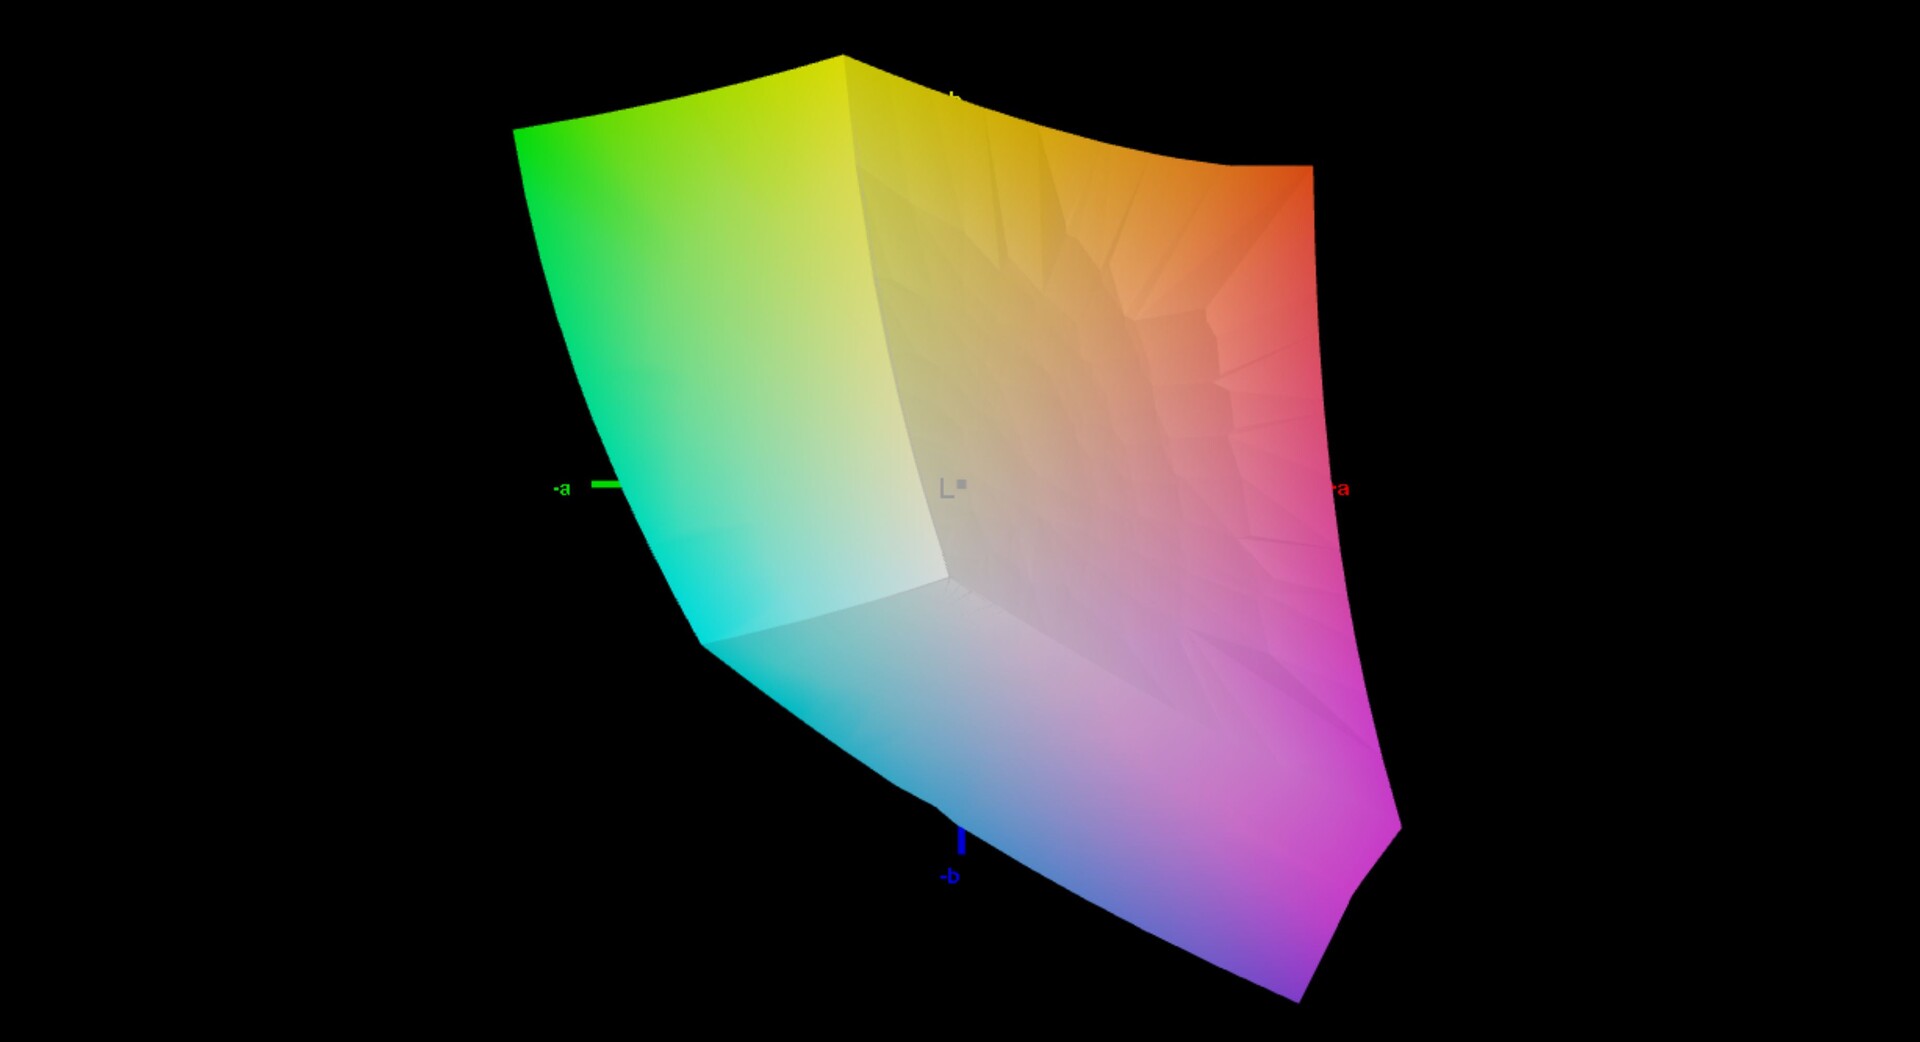
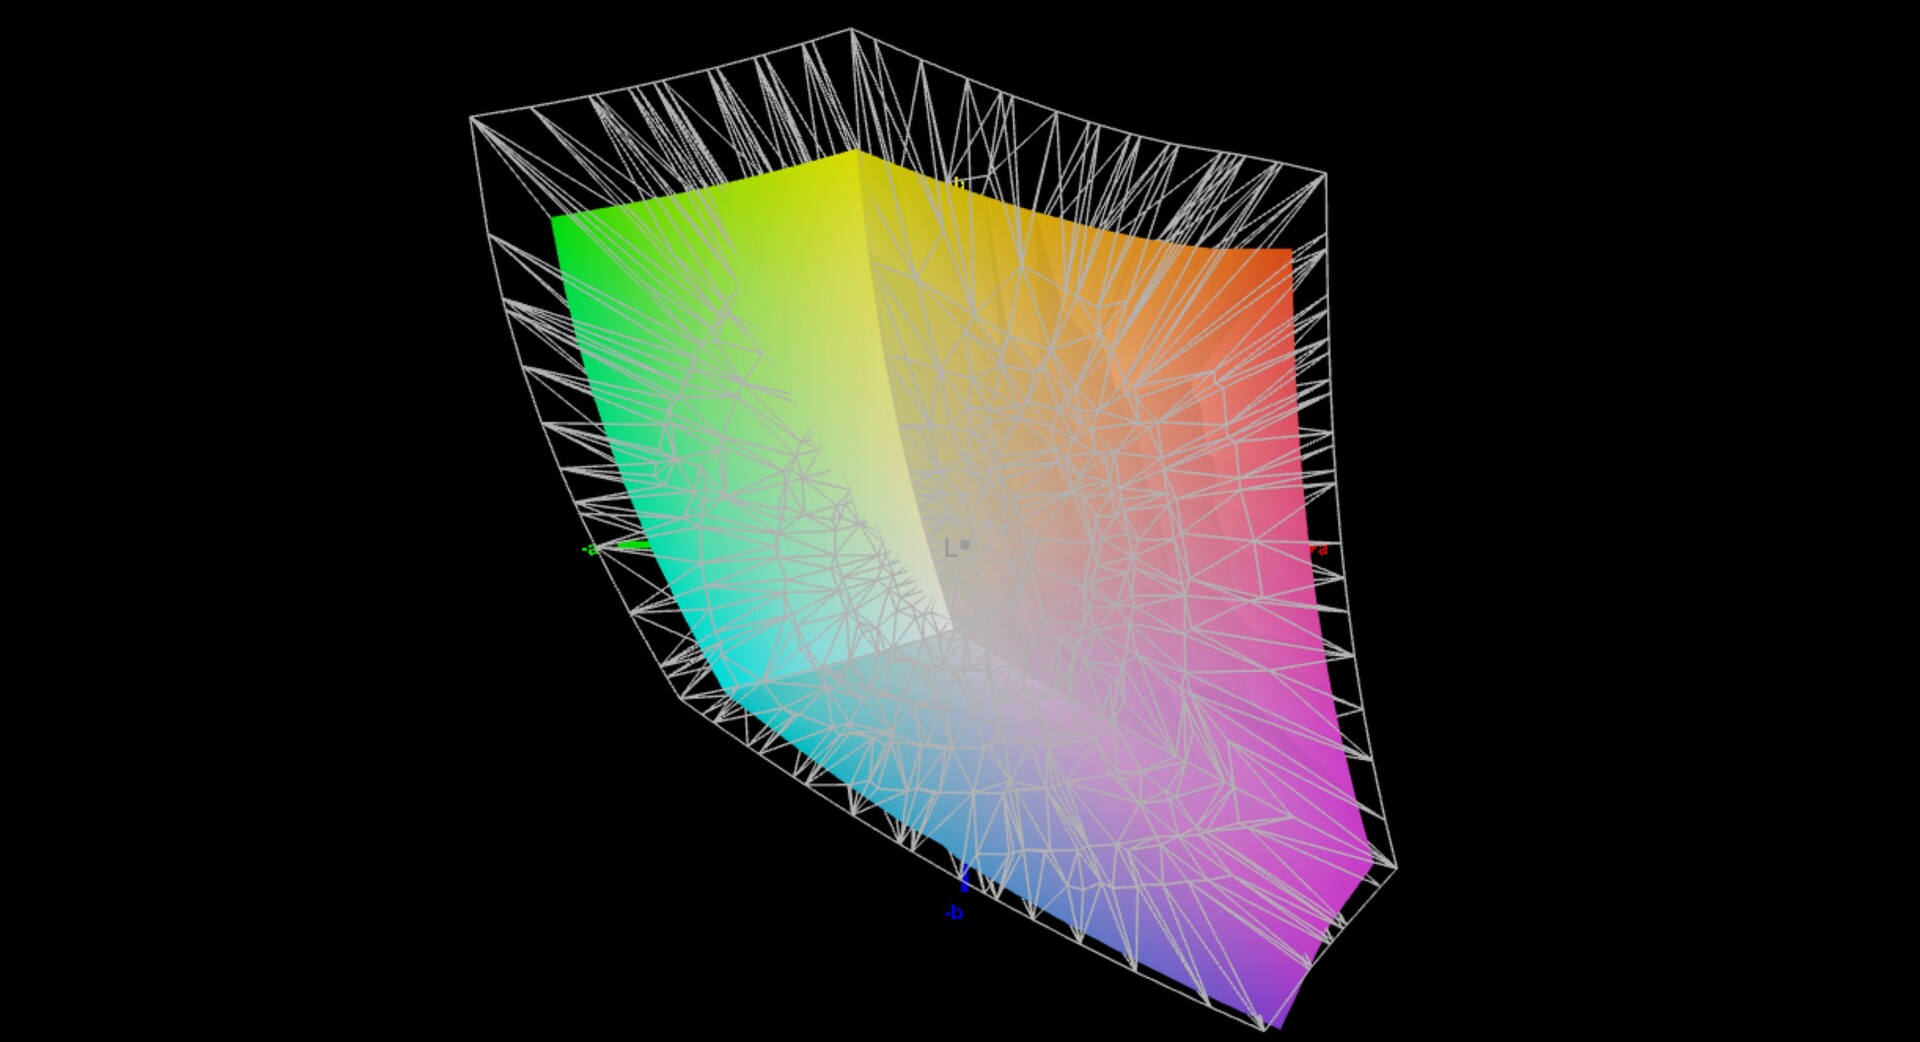
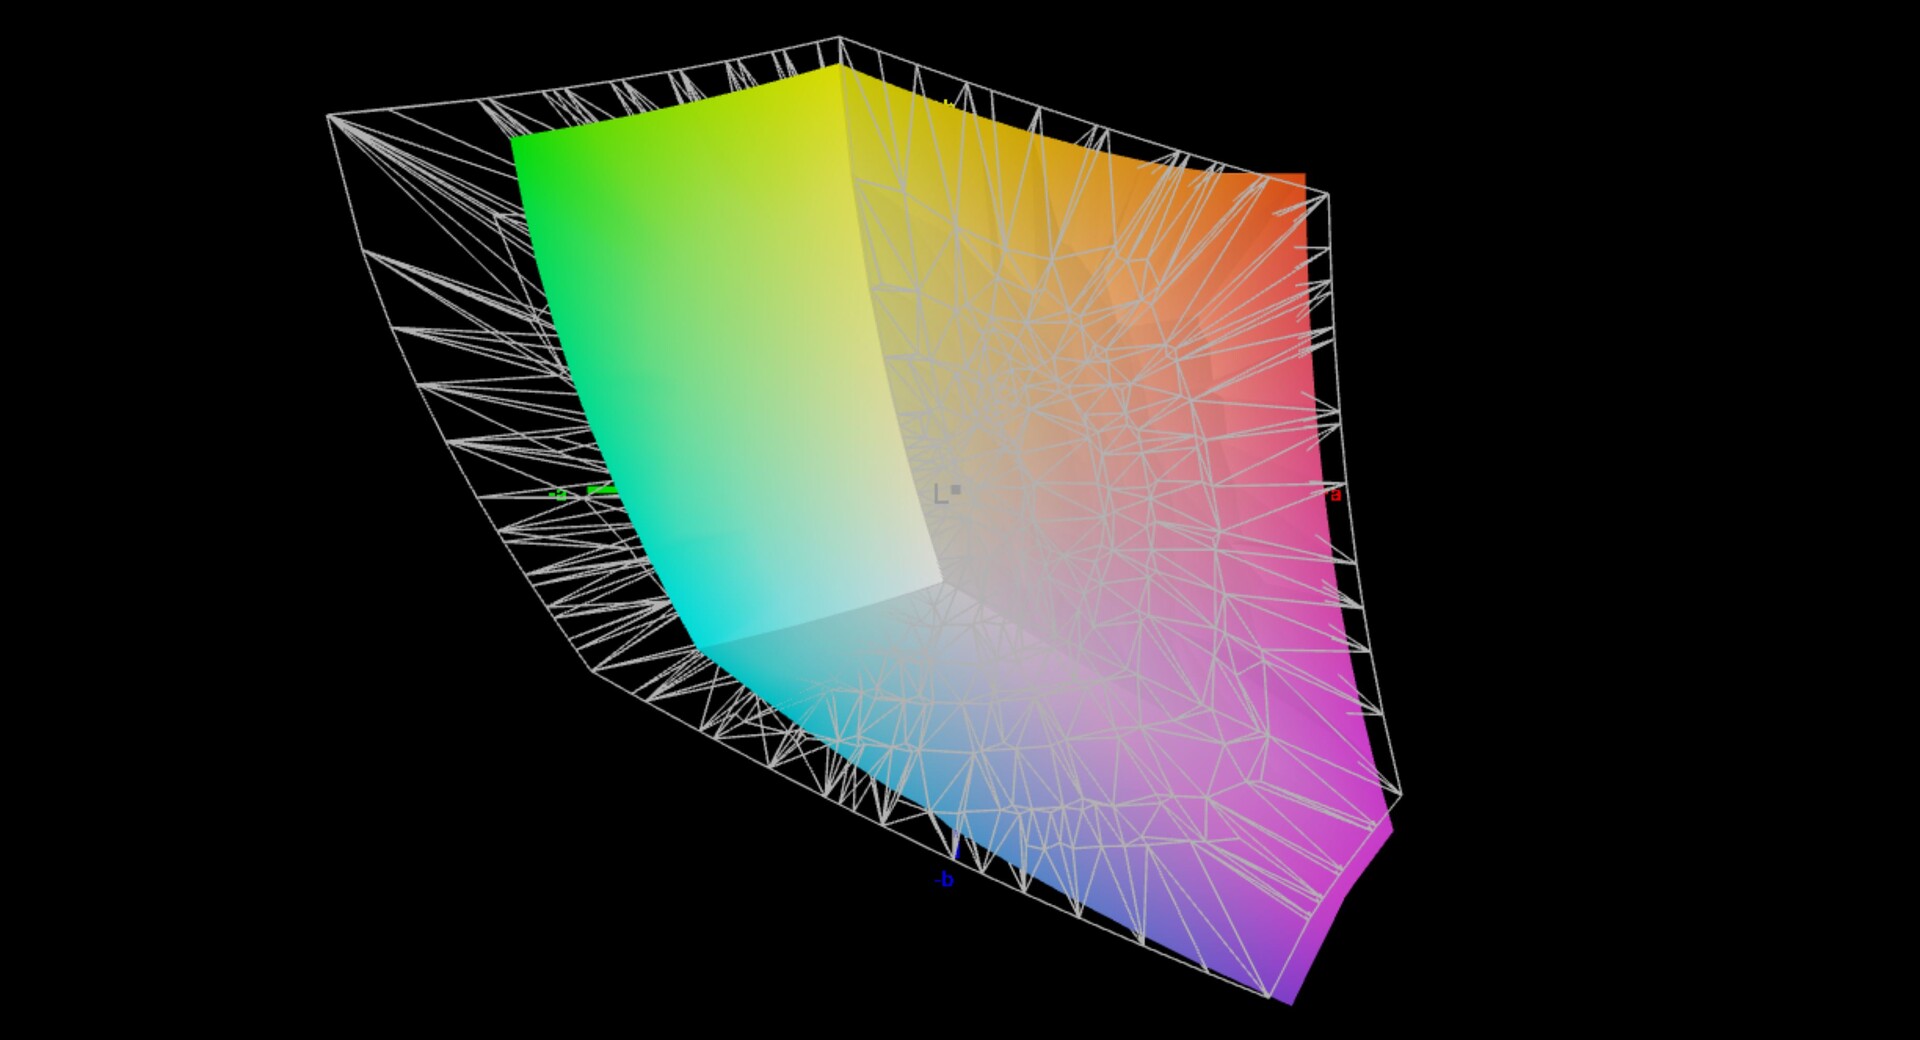
在我们用专业的CalMAN软件(X-Rite i1 Pro 2)进行分析时,我们注意到该面板只覆盖了小的sRGB色彩参考,尽管戴尔宣传说对更广泛的P3色域有90%的覆盖。我们无法支持这一说法,并已与制造商取得联系。以前的型号 之前的型号在这方面也没有好多少。
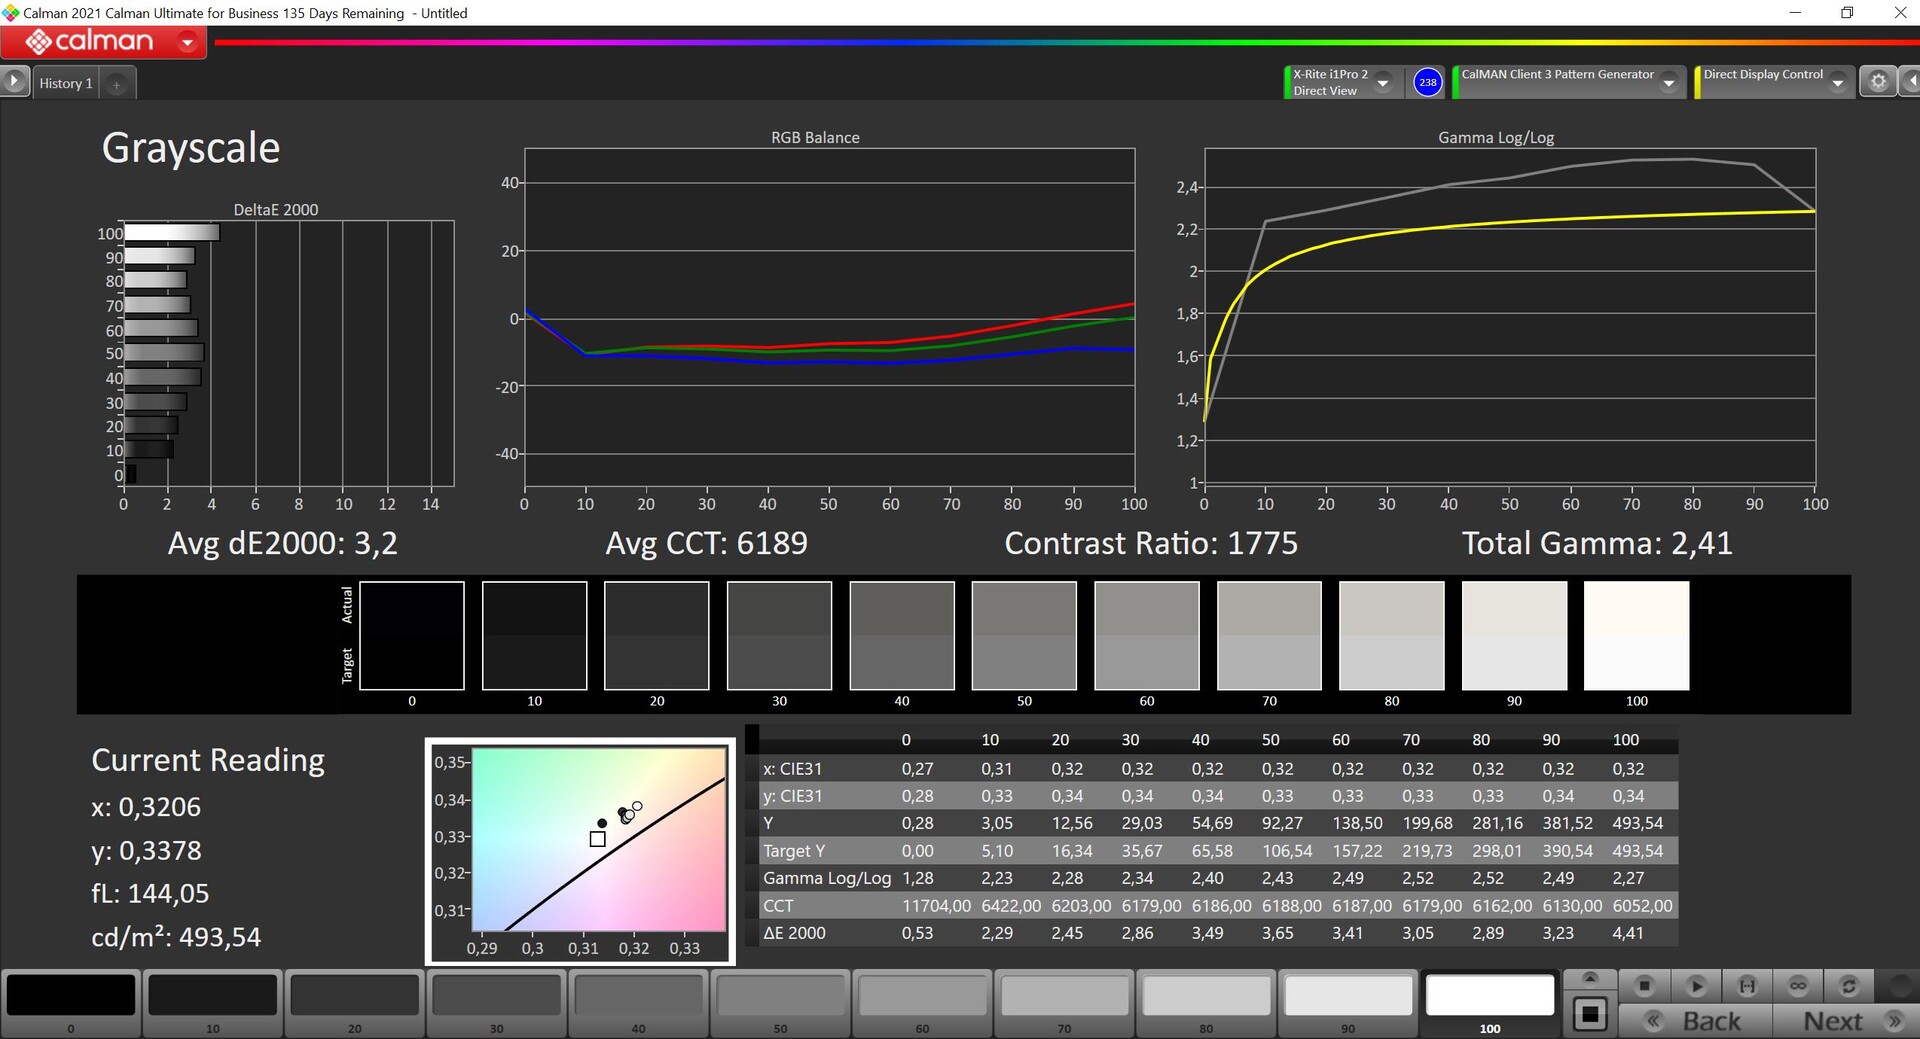
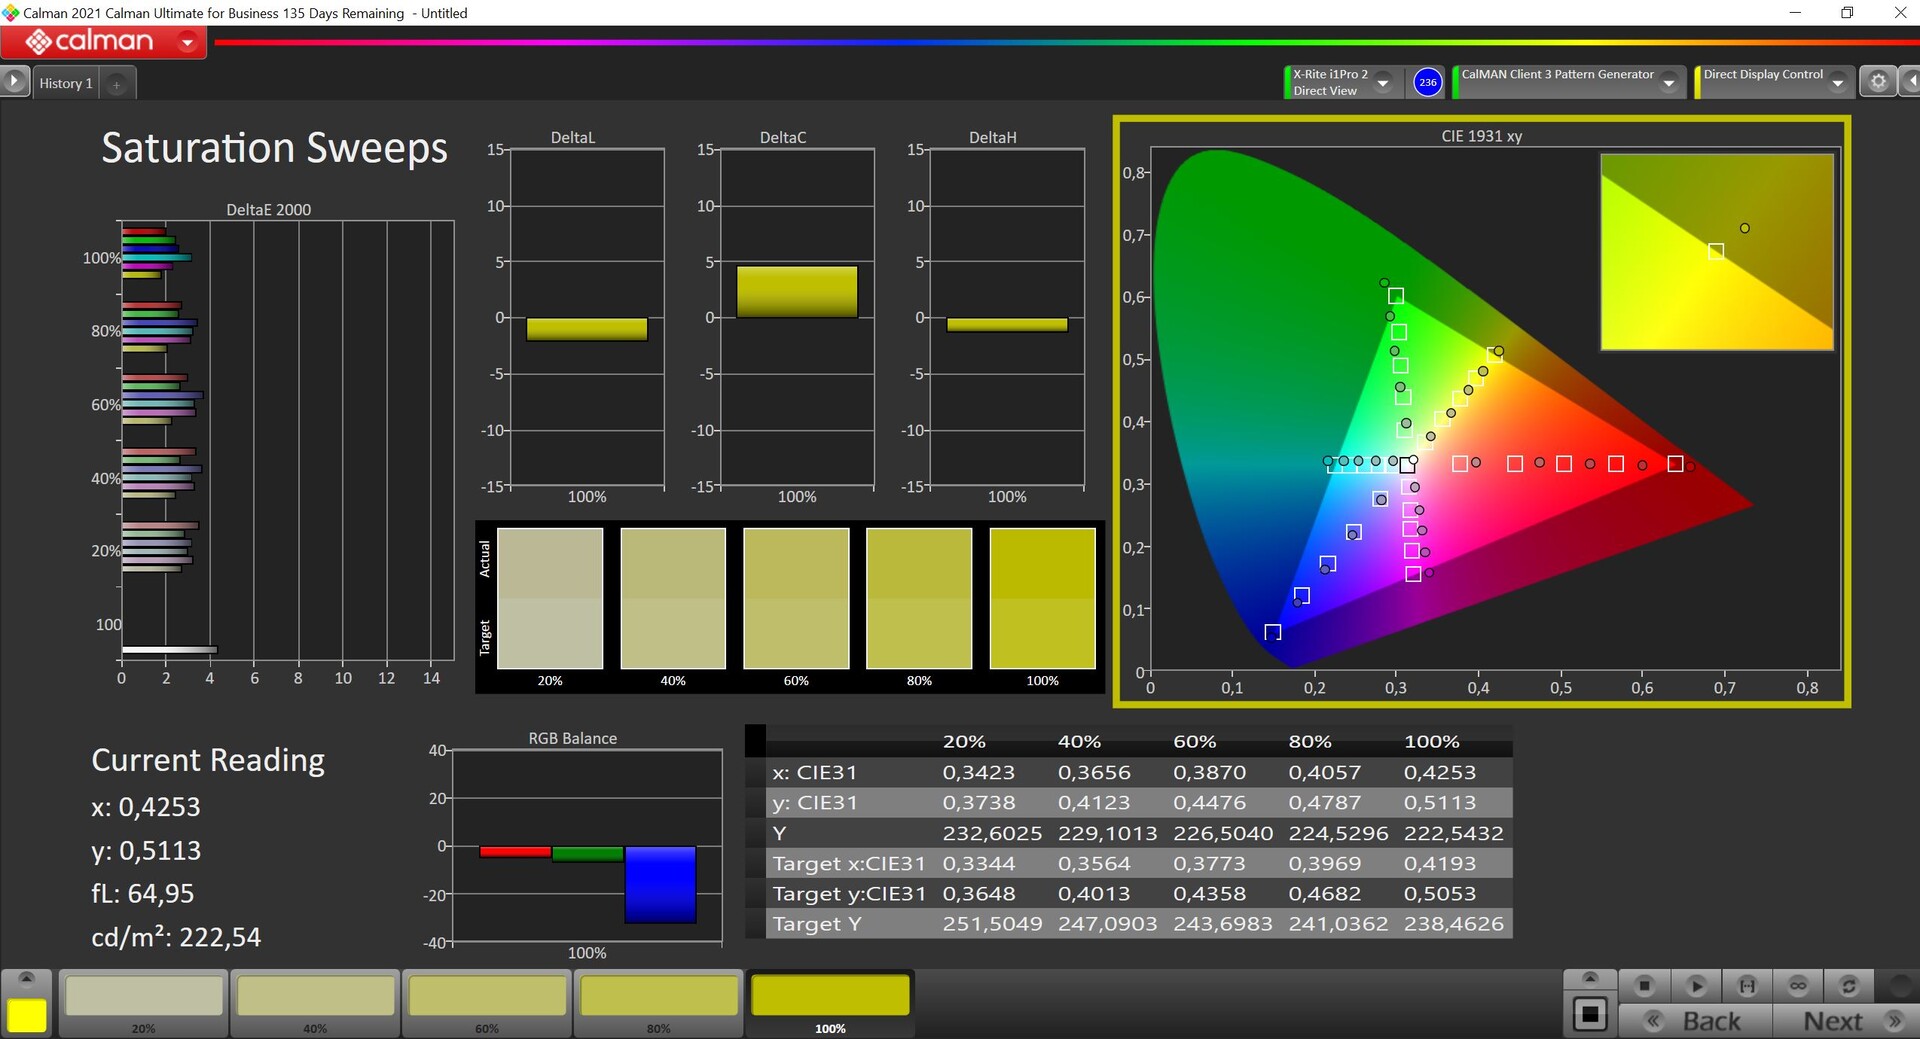
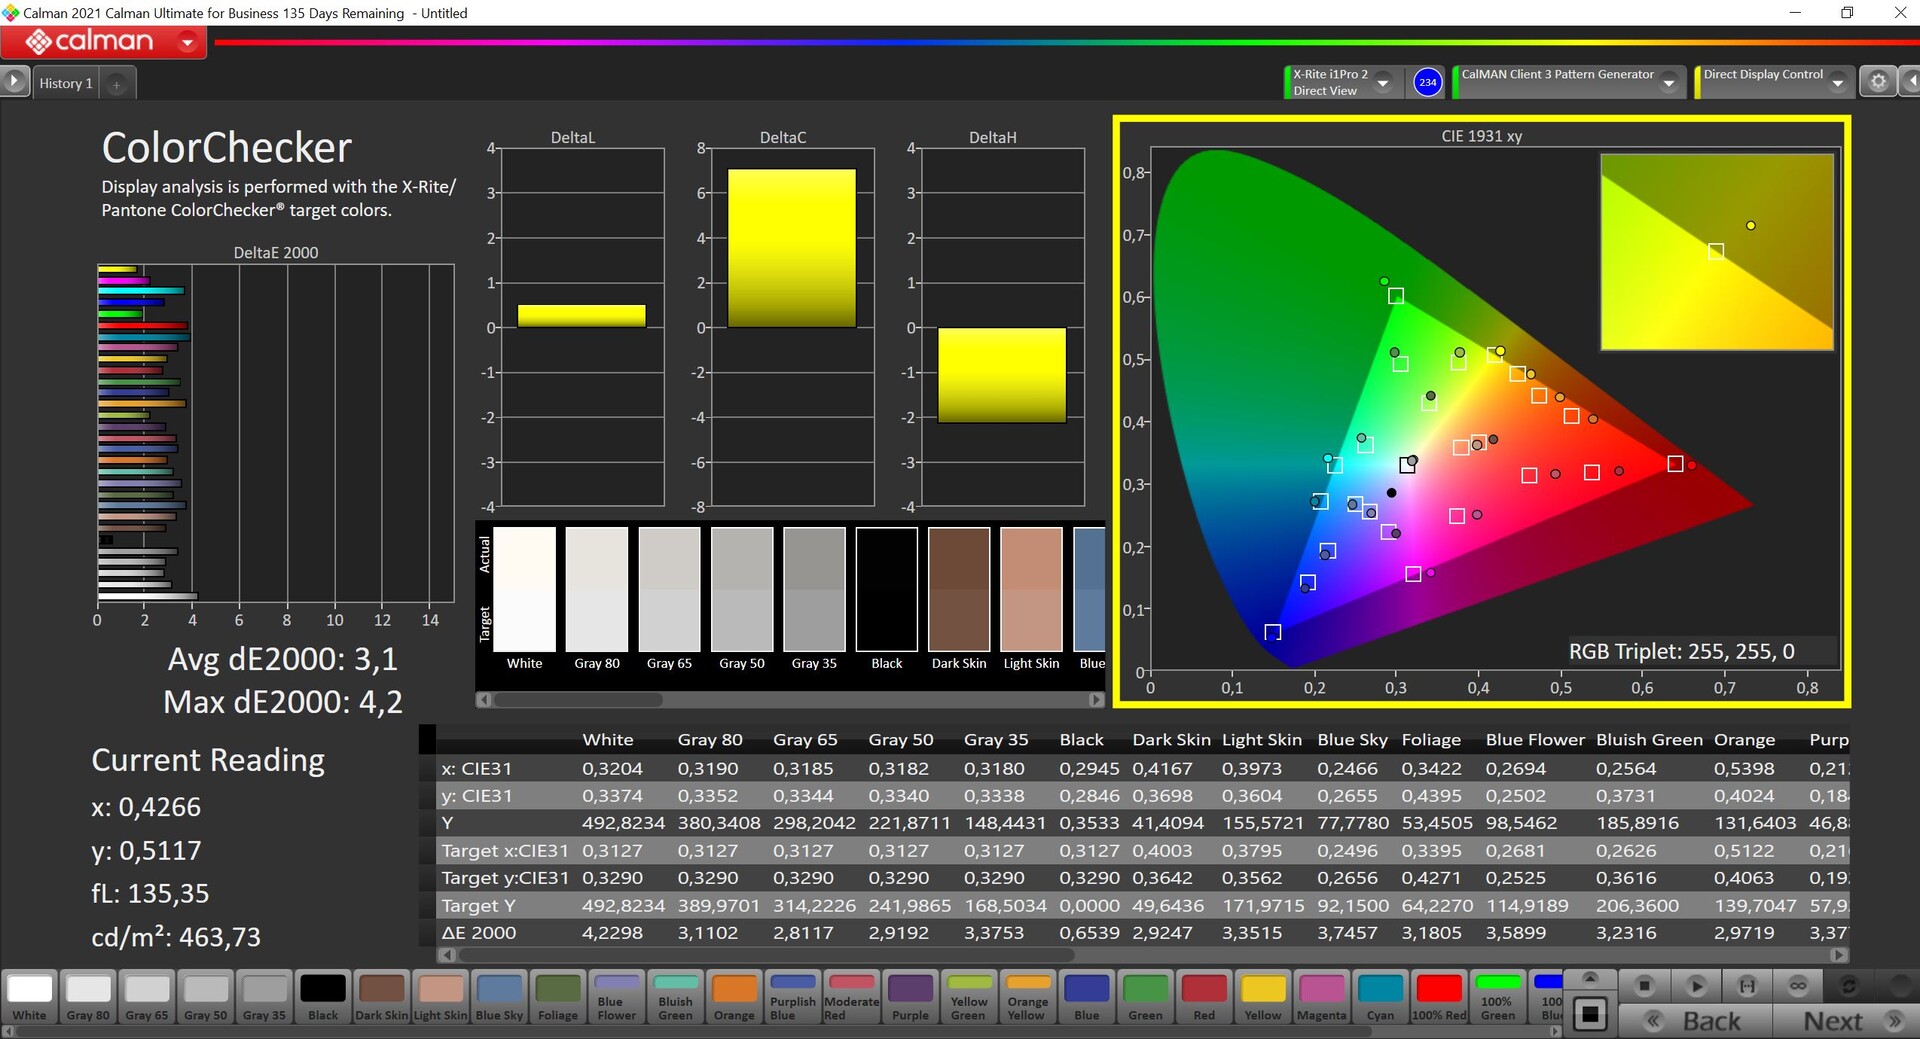

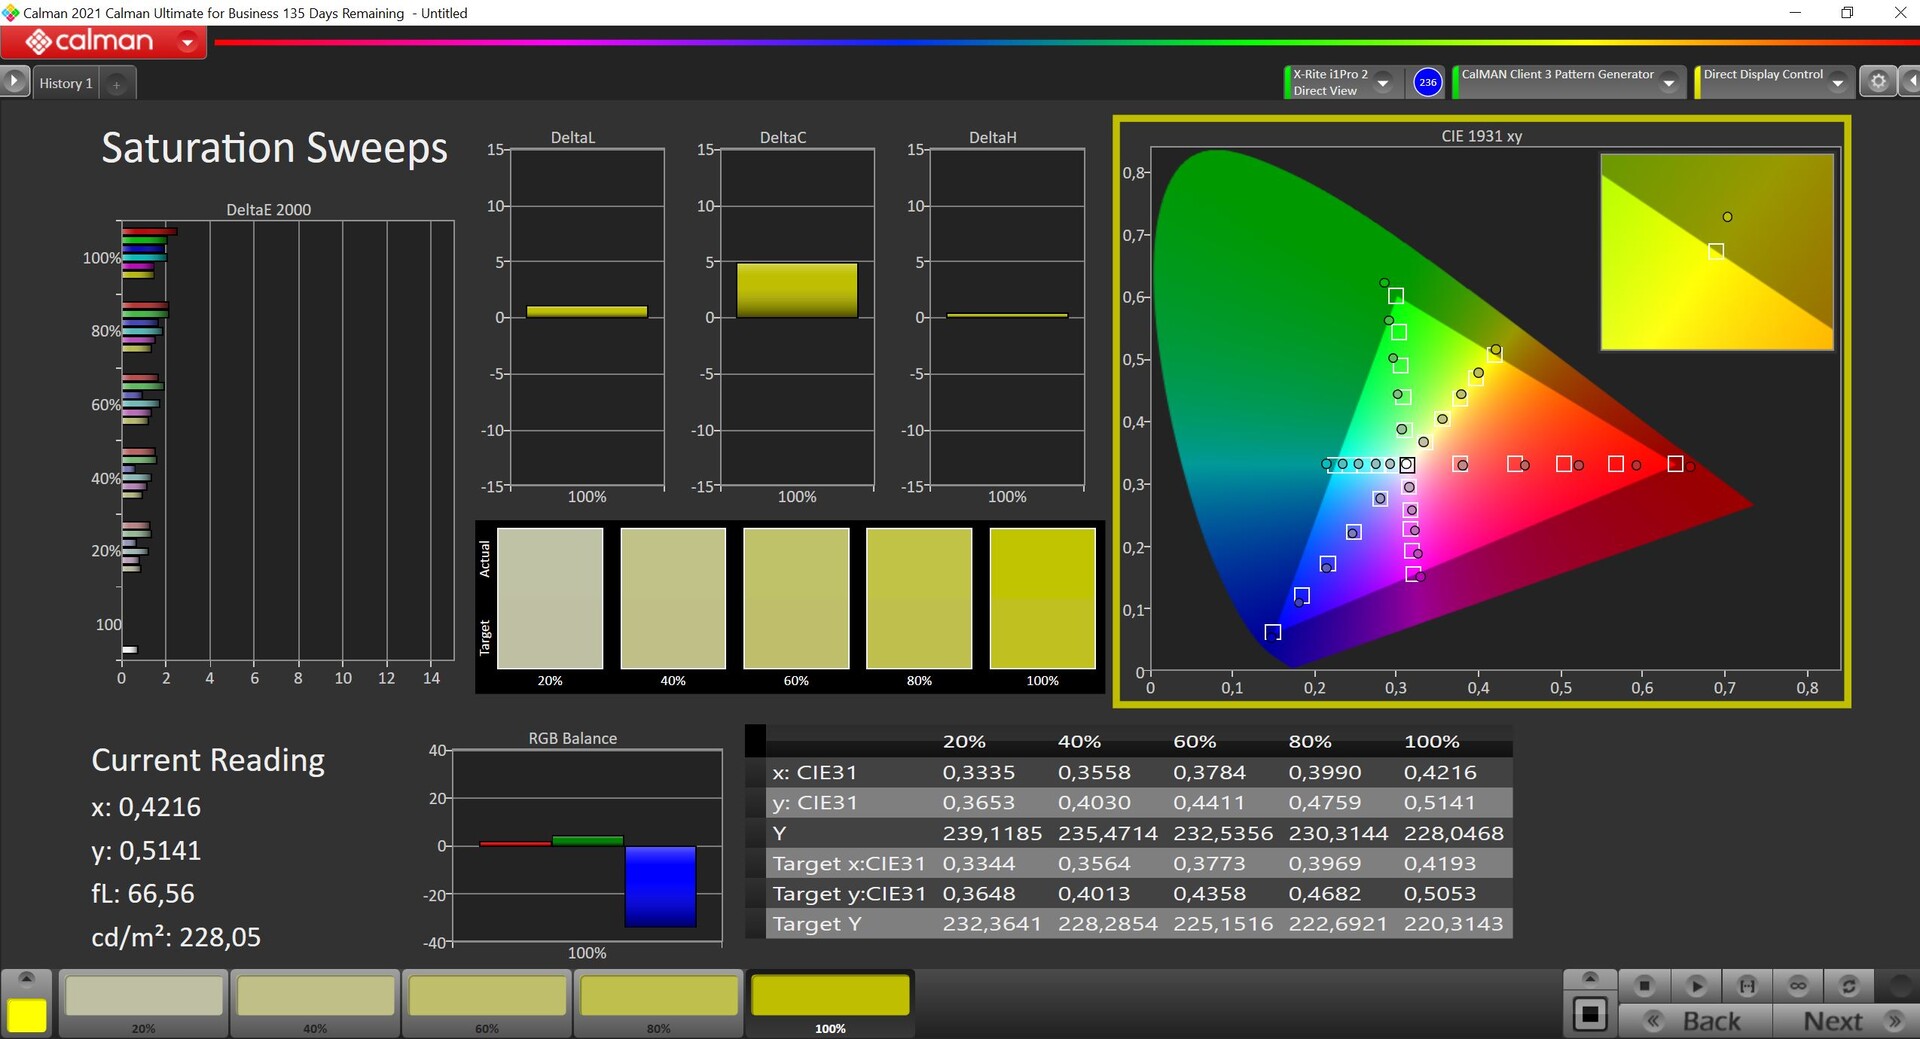

图像开箱后有点偏暖,有轻微的黄色色调,这很明显。与sRGB参考值相比,颜色偏差在3-4之间,没有任何异常值,这对日常使用场景来说完全没有问题。我们自己的校准(配置文件可在上面的方框中免费下载)摆脱了偏色,颜色偏差也更好,只有100%的红色仍然略高于3的重要标志。 我们的校准改善了画面,但最大亮度也下降了约35尼特。我们已经提到,该面板只覆盖了小的sRGB色域和P3,以及AdobeRGB的76%。如果你需要更广的色域,你就不得不购买带有可选的OLED屏幕的XPS 13。
Display Response Times
| ↔ Response Time Black to White | ||
|---|---|---|
| 21.9 ms ... rise ↗ and fall ↘ combined | ↗ 11.9 ms rise | 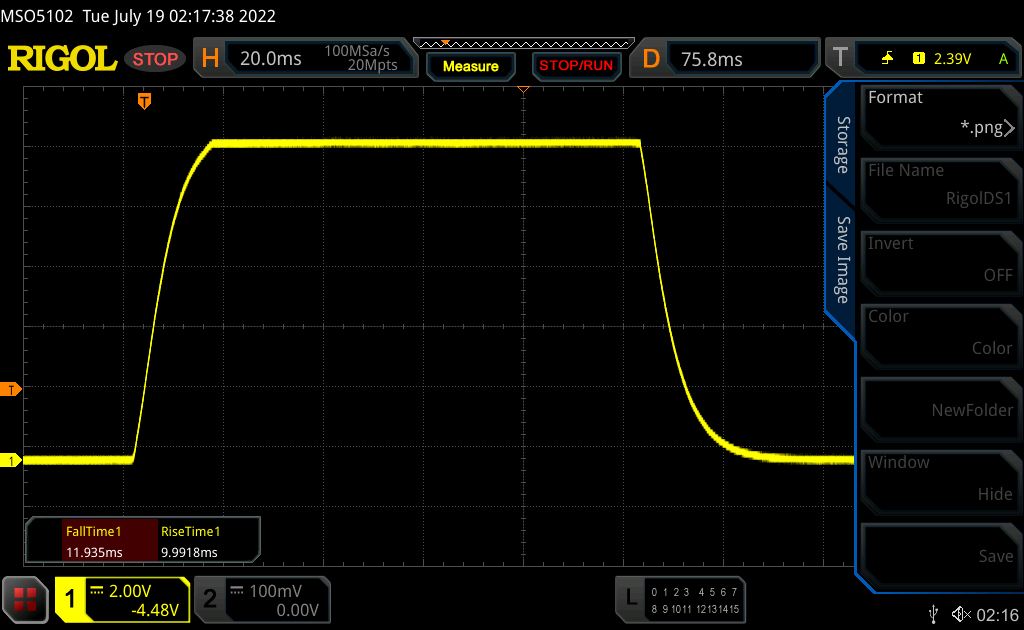 |
| ↘ 10 ms fall | ||
| The screen shows good response rates in our tests, but may be too slow for competitive gamers. In comparison, all tested devices range from 0.1 (minimum) to 240 (maximum) ms. » 48 % of all devices are better. This means that the measured response time is worse than the average of all tested devices (19.9 ms). | ||
| ↔ Response Time 50% Grey to 80% Grey | ||
| 38.9 ms ... rise ↗ and fall ↘ combined | ↗ 21.4 ms rise | 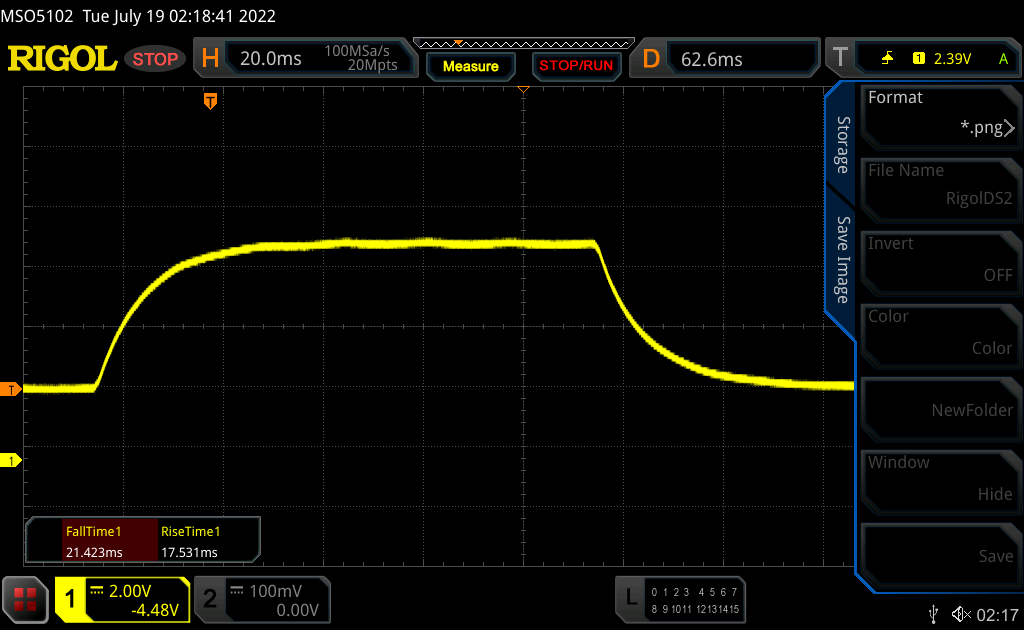 |
| ↘ 17.5 ms fall | ||
| The screen shows slow response rates in our tests and will be unsatisfactory for gamers. In comparison, all tested devices range from 0.165 (minimum) to 636 (maximum) ms. » 59 % of all devices are better. This means that the measured response time is worse than the average of all tested devices (31.1 ms). | ||
Screen Flickering / PWM (Pulse-Width Modulation)
| Screen flickering / PWM not detected | 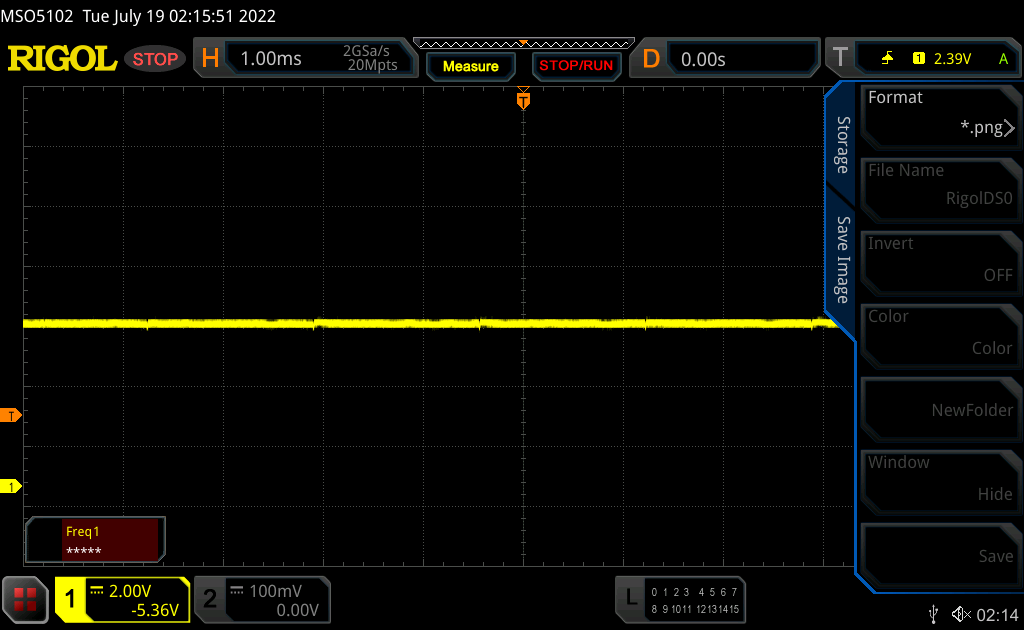 | ||
In comparison: 52 % of all tested devices do not use PWM to dim the display. If PWM was detected, an average of 7794 (minimum: 5 - maximum: 343500) Hz was measured. | |||
在非常明亮的环境中,要防止反光并不容易,但亮度很好,你应该能在阴凉处找到一个地方,可以很舒服地看到显示内容。

性能 - Alder Lake-P和PCIe 4.0
新的XPS 13 Plus只提供桤木湖-P的CPU,首先是酷睿i5-1240P和酷睿i7-1260P(各有4个性能核心和8个效率核心),一直到酷睿i7-1280P含有两个额外的性能核心(配置类似于酷睿i7-12700H).用户还可以选择8、16或32GB内存(LPDDR5-5200),但32GB选项仅适用于i7 CPU。
审查设置
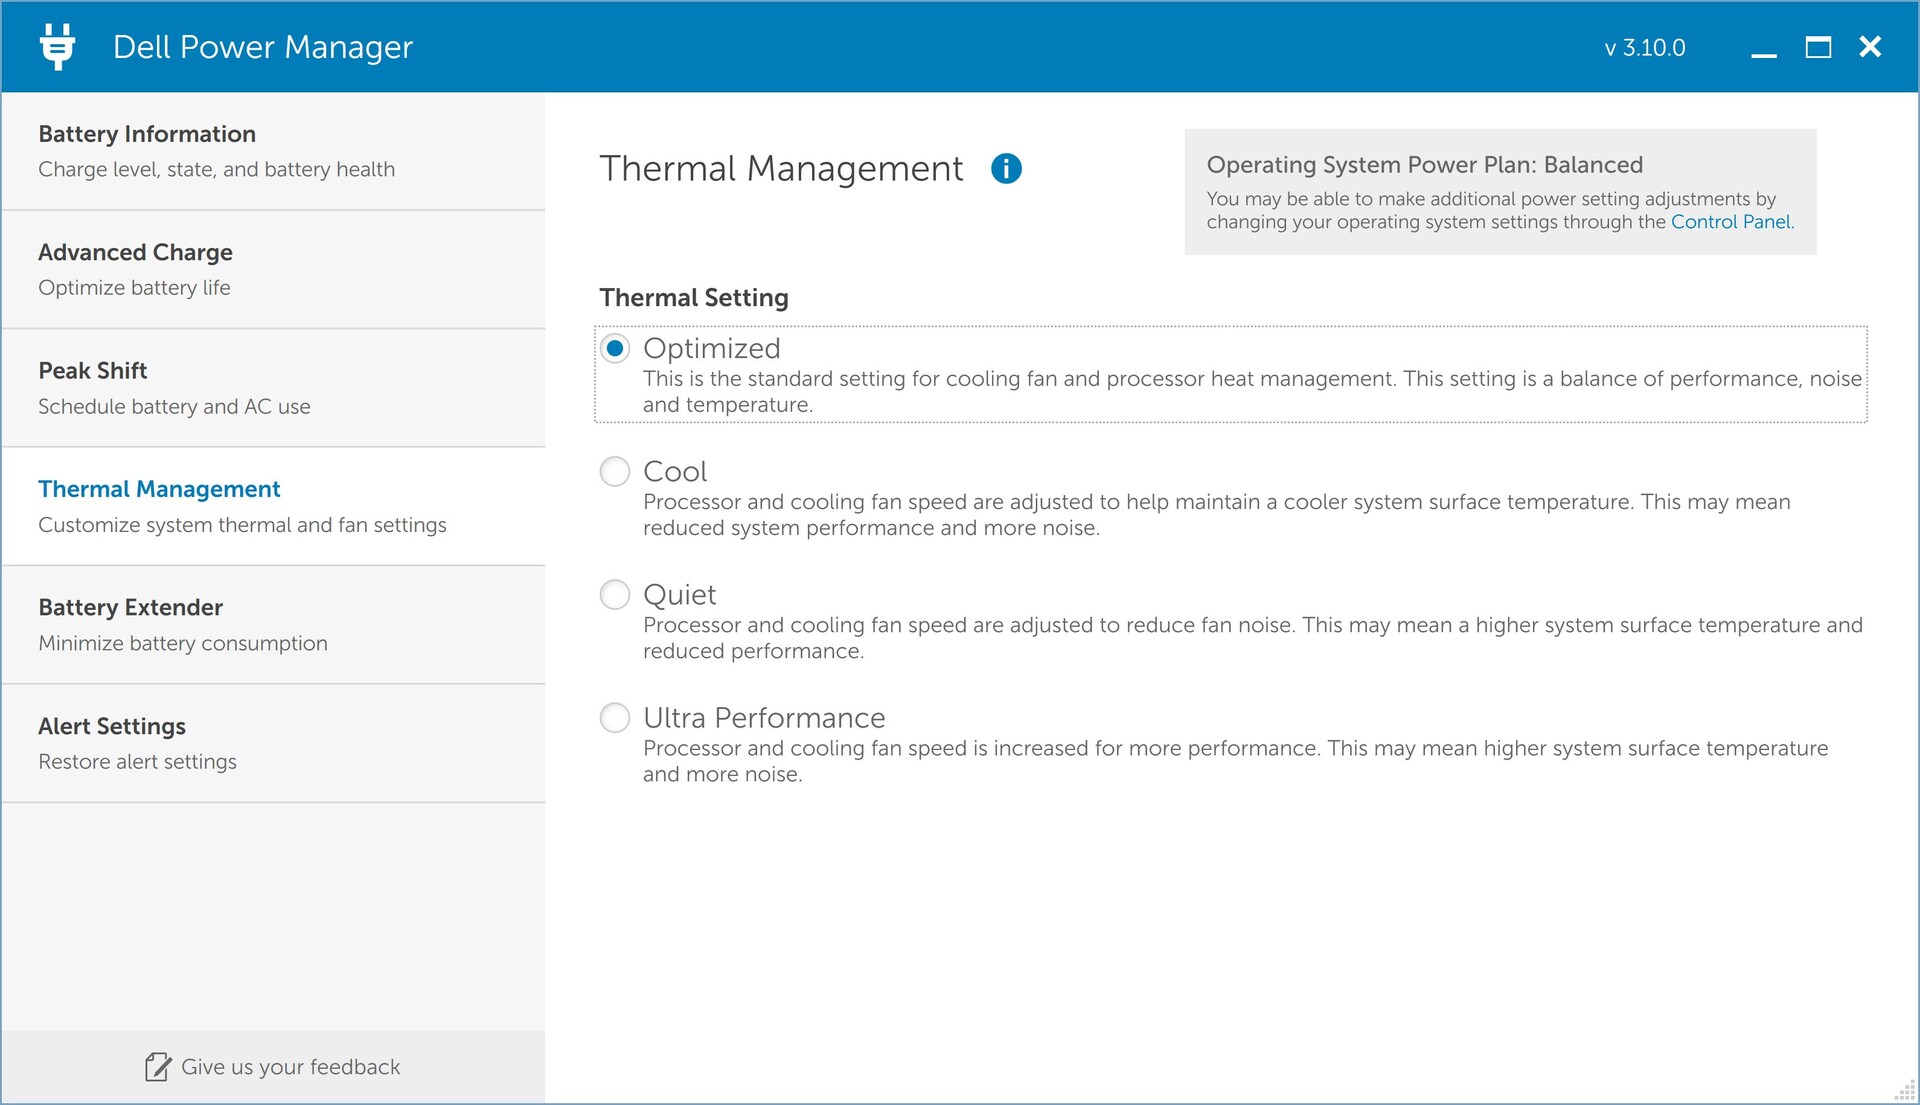
戴尔在预装的电源管理器软件中提供了四种不同的性能配置文件(优化、安静、超性能和冷却),但我们没有仔细研究冷却配置文件。其他配置文件的TDP设置列在下面的表格中。
| 静音 | 优化 | 超强性能 | |
|---|---|---|---|
| TDP CPU负载 | 64 -> 13 Watts | 64 -> 20 Watts | 64 -> 34 Watts |
| TDP压力测试 | 64 -> 13 瓦特 | 64 -> 20 瓦特 | 64 -> 64 瓦特 |
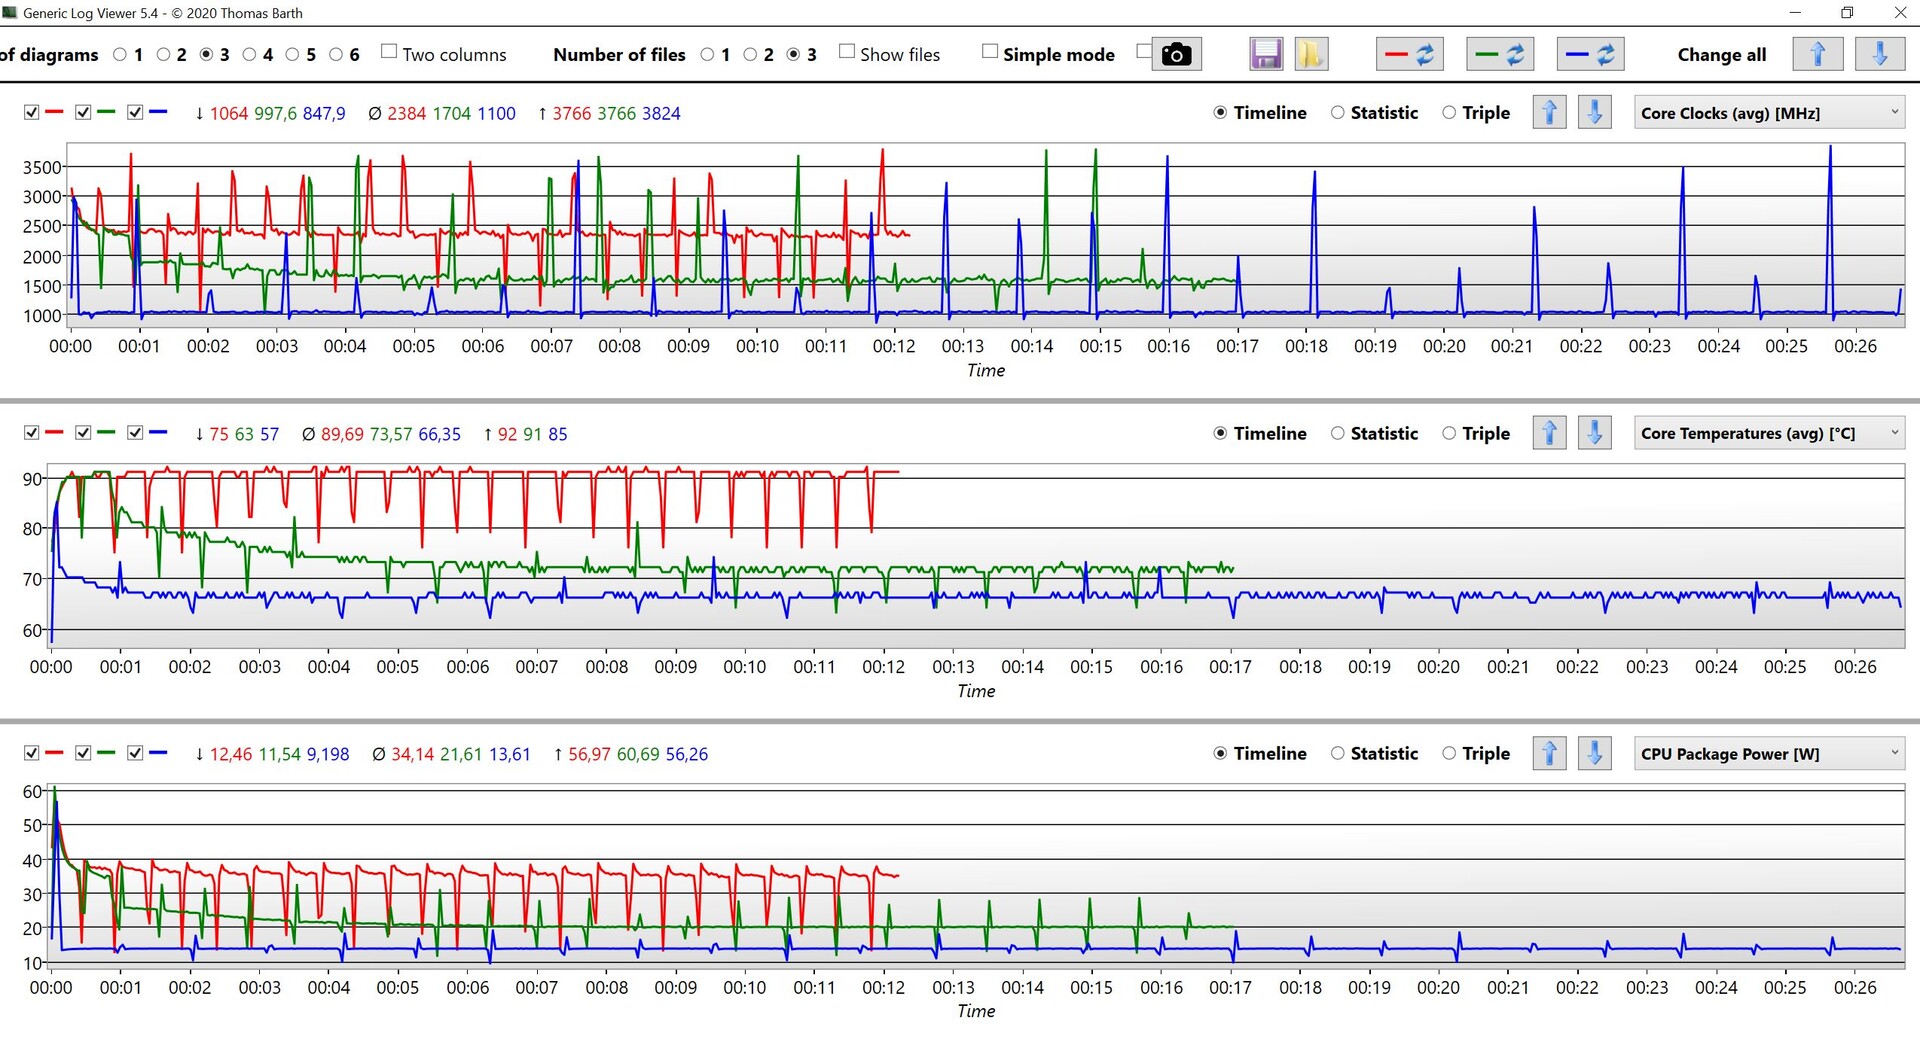
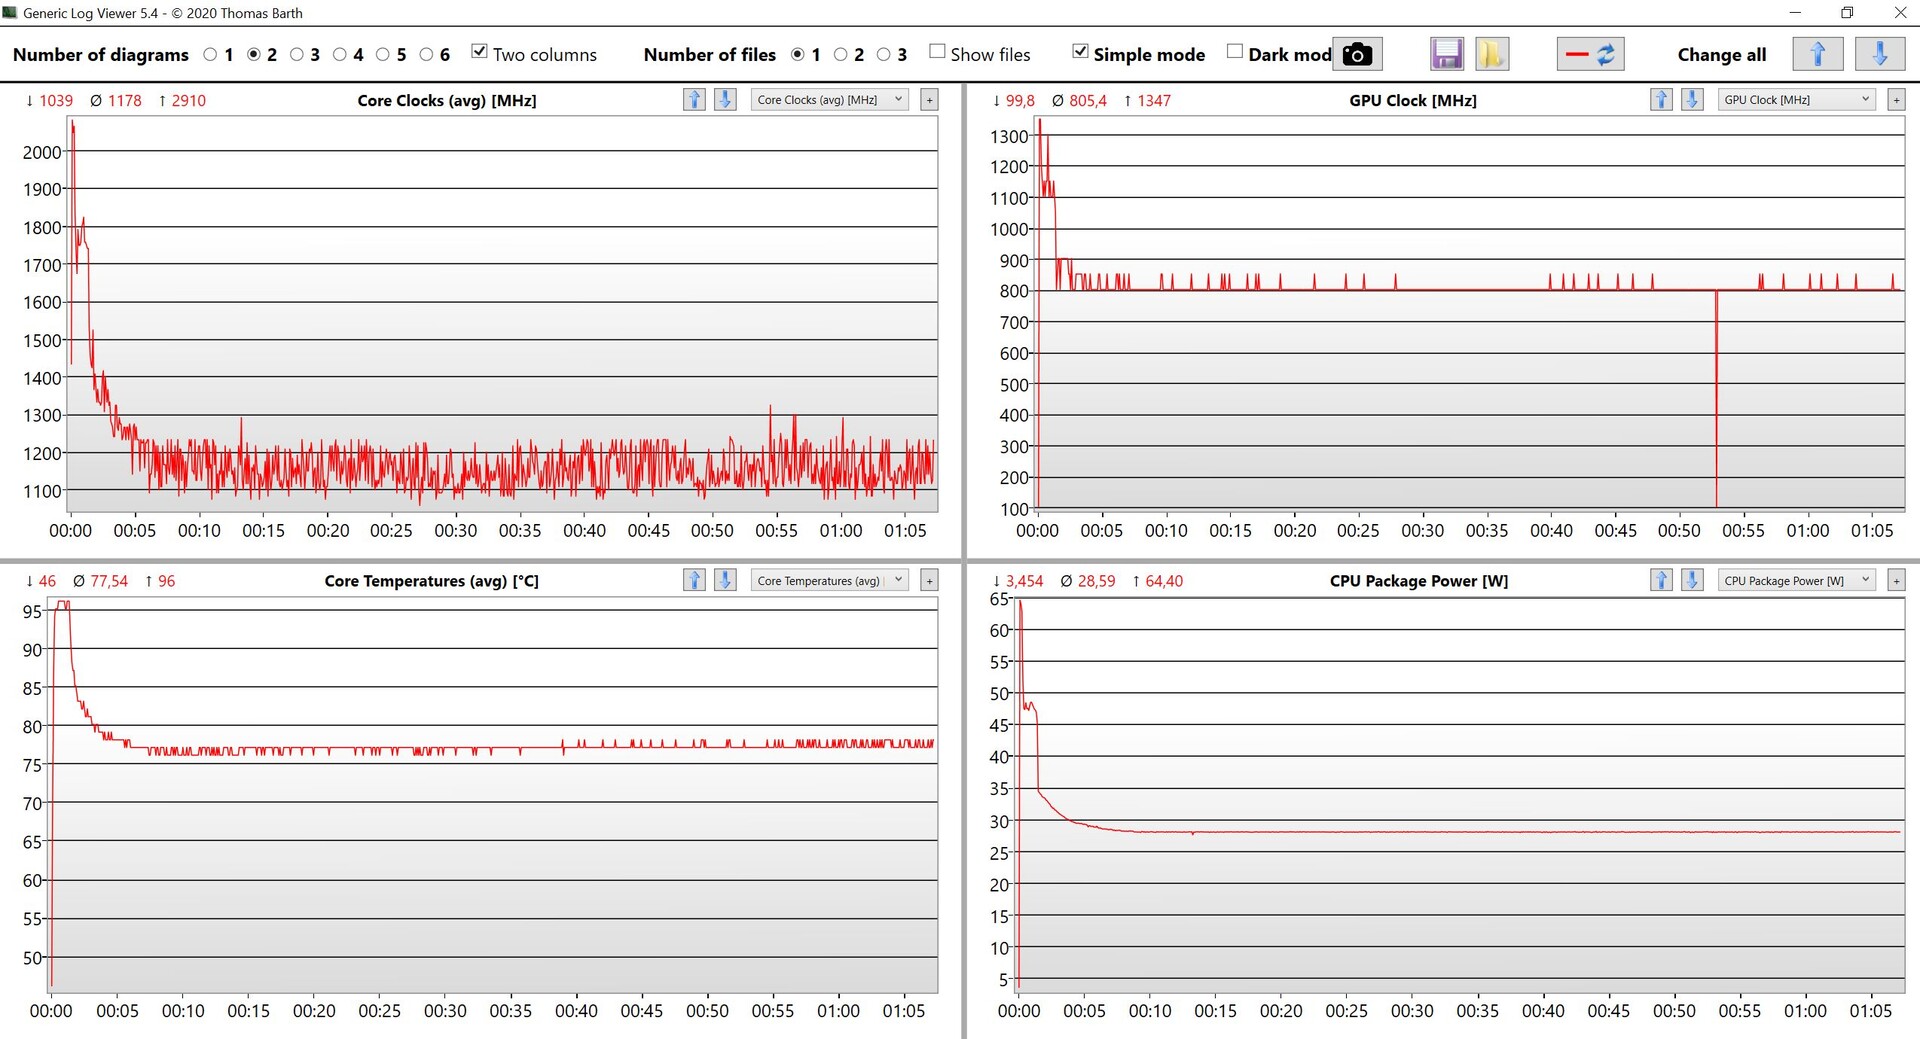
在默认的优化设置下,CPU性能下降得相当快,因此我们在下面的基准测试和测量中使用了超性能配置文件。新的XPS 13 Plus的冷却性能对于一个紧凑的设备来说实际上是非常好的,在日常情况下或在短时峰值负载情况下,风扇通常是安静的。在持续的工作负荷下,两个风扇在这种设置下会变得有些吵闹,但性能也是相当不错的回报。处理器在所有三种模式下最多可以使用64W,但这个数值通常只达到一秒钟。
处理器 - 酷睿i7-1260P
芯片酷睿i7-1260P目前是昂贵的次笔记本的一个非常流行的选择,其混合配置(4个性能和8个效率核心)的性能潜力非常高。与旧的XPS 13 9310与Tiger Lake 酷睿i7-1185G7相比,在合成基准测试中,性能高出约50%(平均)。
Cinebench R15 Multi Loop
我们的Cinebench多循环证实了目前英特尔Alder Lake处理器的问题。多核性能基本与目前的AMD Ryzen 7 6800U起初,但Ryzen的功耗只有30W。在测试过程中,XPS 13 Plus中的i7稳定在34W,与配备6800U的Zenbook S 13的25W相比,性能略低。
优化性能配置文件也证实了Alder Lake-P在较低的功率限制下没有竞争力,因为XPS 13 Plus在20W时只是略微领先于老式的Tiger Lake 四核CPU。Quietprofile将TDP进一步降低到13W,这导致CB R15多循环中的650-700分。
单核性能(这对日常场景很重要)无疑是非常好的,但代价是高消耗数字。
由于功率限制略低(54/27W),多核性能在电池电量上略低(-6 %)。更多的CPU基准测试可在 这里.
Cinebench R23: Multi Core | Single Core
Cinebench R20: CPU (Multi Core) | CPU (Single Core)
Cinebench R15: CPU Multi 64Bit | CPU Single 64Bit
Blender: v2.79 BMW27 CPU
7-Zip 18.03: 7z b 4 | 7z b 4 -mmt1
Geekbench 5.5: Multi-Core | Single-Core
HWBOT x265 Benchmark v2.2: 4k Preset
LibreOffice : 20 Documents To PDF
R Benchmark 2.5: Overall mean
| CPU Performance rating | |
| Average of class Subnotebook | |
| Dell XPS 13 Plus 9320 4K | |
| Asus Zenbook S 13 OLED | |
| Average Intel Core i7-1260P | |
| Apple MacBook Pro 13 2022 M2 -5! | |
| Apple MacBook Air 2020 M1 Entry -1! | |
| Dell XPS 13 9310 Core i7 4K | |
| Huawei MateBook 13s i5 11300H | |
| Lenovo ThinkPad X1 Nano-20UN002UGE -1! | |
| Cinebench R23 / Multi Core | |
| Average of class Subnotebook (1555 - 21812, n=60, last 2 years) | |
| Asus Zenbook S 13 OLED | |
| Dell XPS 13 Plus 9320 4K | |
| Average Intel Core i7-1260P (3173 - 12150, n=27) | |
| Apple MacBook Pro 13 2022 M2 | |
| Apple MacBook Air 2020 M1 Entry | |
| Lenovo ThinkPad X1 Nano-20UN002UGE | |
| Huawei MateBook 13s i5 11300H | |
| Dell XPS 13 9310 Core i7 4K | |
| Cinebench R23 / Single Core | |
| Average of class Subnotebook (358 - 2213, n=61, last 2 years) | |
| Dell XPS 13 Plus 9320 4K | |
| Average Intel Core i7-1260P (1155 - 1812, n=25) | |
| Apple MacBook Pro 13 2022 M2 | |
| Apple MacBook Air 2020 M1 Entry | |
| Asus Zenbook S 13 OLED | |
| Dell XPS 13 9310 Core i7 4K | |
| Huawei MateBook 13s i5 11300H | |
| Cinebench R20 / CPU (Multi Core) | |
| Average of class Subnotebook (579 - 8541, n=57, last 2 years) | |
| Asus Zenbook S 13 OLED | |
| Dell XPS 13 Plus 9320 4K | |
| Average Intel Core i7-1260P (1234 - 4748, n=25) | |
| Apple MacBook Pro 13 2022 M2 | |
| Huawei MateBook 13s i5 11300H | |
| Dell XPS 13 9310 Core i7 4K | |
| Apple MacBook Air 2020 M1 Entry | |
| Lenovo ThinkPad X1 Nano-20UN002UGE | |
| Cinebench R20 / CPU (Single Core) | |
| Average of class Subnotebook (128 - 832, n=57, last 2 years) | |
| Dell XPS 13 Plus 9320 4K | |
| Average Intel Core i7-1260P (448 - 698, n=25) | |
| Dell XPS 13 9310 Core i7 4K | |
| Asus Zenbook S 13 OLED | |
| Lenovo ThinkPad X1 Nano-20UN002UGE | |
| Huawei MateBook 13s i5 11300H | |
| Apple MacBook Air 2020 M1 Entry | |
| Apple MacBook Pro 13 2022 M2 | |
| Cinebench R15 / CPU Multi 64Bit | |
| Average of class Subnotebook (327 - 3345, n=57, last 2 years) | |
| Asus Zenbook S 13 OLED | |
| Dell XPS 13 Plus 9320 4K | |
| Dell XPS 13 Plus 9320 4K | |
| Average Intel Core i7-1260P (549 - 2034, n=29) | |
| Apple MacBook Pro 13 2022 M2 | |
| Apple MacBook Air 2020 M1 Entry | |
| Huawei MateBook 13s i5 11300H | |
| Huawei MateBook 13s i5 11300H | |
| Dell XPS 13 9310 Core i7 4K | |
| Lenovo ThinkPad X1 Nano-20UN002UGE | |
| Cinebench R15 / CPU Single 64Bit | |
| Average of class Subnotebook (72.4 - 322, n=57, last 2 years) | |
| Dell XPS 13 Plus 9320 4K | |
| Asus Zenbook S 13 OLED | |
| Average Intel Core i7-1260P (165.4 - 260, n=27) | |
| Apple MacBook Pro 13 2022 M2 | |
| Dell XPS 13 9310 Core i7 4K | |
| Apple MacBook Air 2020 M1 Entry | |
| Lenovo ThinkPad X1 Nano-20UN002UGE | |
| Huawei MateBook 13s i5 11300H | |
| Blender / v2.79 BMW27 CPU | |
| Apple MacBook Air 2020 M1 Entry | |
| Dell XPS 13 9310 Core i7 4K | |
| Lenovo ThinkPad X1 Nano-20UN002UGE | |
| Apple MacBook Pro 13 2022 M2 | |
| Huawei MateBook 13s i5 11300H | |
| Average of class Subnotebook (159 - 2271, n=58, last 2 years) | |
| Average Intel Core i7-1260P (264 - 906, n=26) | |
| Dell XPS 13 Plus 9320 4K | |
| Asus Zenbook S 13 OLED | |
| 7-Zip 18.03 / 7z b 4 | |
| Asus Zenbook S 13 OLED | |
| Average of class Subnotebook (11668 - 77867, n=57, last 2 years) | |
| Dell XPS 13 Plus 9320 4K | |
| Average Intel Core i7-1260P (16146 - 47064, n=25) | |
| Apple MacBook Air 2020 M1 Entry | |
| Huawei MateBook 13s i5 11300H | |
| Lenovo ThinkPad X1 Nano-20UN002UGE | |
| Dell XPS 13 9310 Core i7 4K | |
| 7-Zip 18.03 / 7z b 4 -mmt1 | |
| Average of class Subnotebook (2643 - 6699, n=59, last 2 years) | |
| Apple MacBook Air 2020 M1 Entry | |
| Asus Zenbook S 13 OLED | |
| Dell XPS 13 Plus 9320 4K | |
| Average Intel Core i7-1260P (4064 - 5791, n=25) | |
| Dell XPS 13 9310 Core i7 4K | |
| Huawei MateBook 13s i5 11300H | |
| Lenovo ThinkPad X1 Nano-20UN002UGE | |
| Geekbench 5.5 / Multi-Core | |
| Average of class Subnotebook (2557 - 17218, n=48, last 2 years) | |
| Dell XPS 13 Plus 9320 4K | |
| Apple MacBook Pro 13 2022 M2 | |
| Average Intel Core i7-1260P (3866 - 10570, n=25) | |
| Asus Zenbook S 13 OLED | |
| Apple MacBook Air 2020 M1 Entry | |
| Dell XPS 13 9310 Core i7 4K | |
| Huawei MateBook 13s i5 11300H | |
| Lenovo ThinkPad X1 Nano-20UN002UGE | |
| Geekbench 5.5 / Single-Core | |
| Apple MacBook Pro 13 2022 M2 | |
| Average of class Subnotebook (726 - 2224, n=48, last 2 years) | |
| Apple MacBook Air 2020 M1 Entry | |
| Dell XPS 13 Plus 9320 4K | |
| Average Intel Core i7-1260P (1436 - 1786, n=25) | |
| Dell XPS 13 9310 Core i7 4K | |
| Asus Zenbook S 13 OLED | |
| Huawei MateBook 13s i5 11300H | |
| Lenovo ThinkPad X1 Nano-20UN002UGE | |
| HWBOT x265 Benchmark v2.2 / 4k Preset | |
| Average of class Subnotebook (0.97 - 25.1, n=57, last 2 years) | |
| Asus Zenbook S 13 OLED | |
| Dell XPS 13 Plus 9320 4K | |
| Average Intel Core i7-1260P (3.45 - 13.6, n=26) | |
| Huawei MateBook 13s i5 11300H | |
| Lenovo ThinkPad X1 Nano-20UN002UGE | |
| Dell XPS 13 9310 Core i7 4K | |
| LibreOffice / 20 Documents To PDF | |
| Average of class Subnotebook (39.9 - 220, n=56, last 2 years) | |
| Asus Zenbook S 13 OLED | |
| Lenovo ThinkPad X1 Nano-20UN002UGE | |
| Huawei MateBook 13s i5 11300H | |
| Average Intel Core i7-1260P (40.2 - 65.7, n=25) | |
| Dell XPS 13 9310 Core i7 4K | |
| Dell XPS 13 Plus 9320 4K | |
| Apple MacBook Air 2020 M1 Entry | |
| R Benchmark 2.5 / Overall mean | |
| Apple MacBook Air 2020 M1 Entry | |
| Lenovo ThinkPad X1 Nano-20UN002UGE | |
| Huawei MateBook 13s i5 11300H | |
| Dell XPS 13 9310 Core i7 4K | |
| Average of class Subnotebook (0.4024 - 1.456, n=58, last 2 years) | |
| Asus Zenbook S 13 OLED | |
| Average Intel Core i7-1260P (0.4559 - 0.727, n=25) | |
| Dell XPS 13 Plus 9320 4K | |
* ... smaller is better
| Power Consumption - Cinebench R15 Multi Efficiency (external Monitor) | |
| Apple MacBook Pro 13 2022 M2 | |
| Asus Zenbook S 13 OLED | |
| Apple MacBook Air 2020 M1 Entry | |
| Dell XPS 13 Plus 9320 4K | |
| Huawei MateBook 13s i5 11300H | |
AIDA64: FP32 Ray-Trace | FPU Julia | CPU SHA3 | CPU Queen | FPU SinJulia | FPU Mandel | CPU AES | CPU ZLib | FP64 Ray-Trace | CPU PhotoWorxx
| Performance rating | |
| Asus Zenbook S 13 OLED | |
| Average of class Subnotebook | |
| Huawei MateBook 13s i5 11300H | |
| Average Intel Core i7-1260P | |
| Dell XPS 13 Plus 9320 4K | |
| Lenovo ThinkPad X1 Nano-20UN002UGE | |
| AIDA64 / FP32 Ray-Trace | |
| Average of class Subnotebook (1135 - 32888, n=58, last 2 years) | |
| Asus Zenbook S 13 OLED | |
| Huawei MateBook 13s i5 11300H | |
| Lenovo ThinkPad X1 Nano-20UN002UGE | |
| Average Intel Core i7-1260P (2176 - 10898, n=26) | |
| Dell XPS 13 Plus 9320 4K | |
| AIDA64 / FPU Julia | |
| Asus Zenbook S 13 OLED | |
| Average of class Subnotebook (5218 - 123315, n=58, last 2 years) | |
| Huawei MateBook 13s i5 11300H | |
| Average Intel Core i7-1260P (11015 - 56906, n=26) | |
| Lenovo ThinkPad X1 Nano-20UN002UGE | |
| Dell XPS 13 Plus 9320 4K | |
| AIDA64 / CPU SHA3 | |
| Average of class Subnotebook (444 - 5287, n=58, last 2 years) | |
| Asus Zenbook S 13 OLED | |
| Huawei MateBook 13s i5 11300H | |
| Lenovo ThinkPad X1 Nano-20UN002UGE | |
| Average Intel Core i7-1260P (669 - 2709, n=26) | |
| Dell XPS 13 Plus 9320 4K | |
| AIDA64 / CPU Queen | |
| Asus Zenbook S 13 OLED | |
| Dell XPS 13 Plus 9320 4K | |
| Average Intel Core i7-1260P (42571 - 82493, n=26) | |
| Average of class Subnotebook (10579 - 95002, n=51, last 2 years) | |
| Huawei MateBook 13s i5 11300H | |
| Lenovo ThinkPad X1 Nano-20UN002UGE | |
| AIDA64 / FPU SinJulia | |
| Asus Zenbook S 13 OLED | |
| Average of class Subnotebook (744 - 18418, n=58, last 2 years) | |
| Dell XPS 13 Plus 9320 4K | |
| Average Intel Core i7-1260P (2901 - 6975, n=26) | |
| Huawei MateBook 13s i5 11300H | |
| Lenovo ThinkPad X1 Nano-20UN002UGE | |
| AIDA64 / FPU Mandel | |
| Asus Zenbook S 13 OLED | |
| Average of class Subnotebook (3341 - 65433, n=58, last 2 years) | |
| Huawei MateBook 13s i5 11300H | |
| Lenovo ThinkPad X1 Nano-20UN002UGE | |
| Average Intel Core i7-1260P (5950 - 26376, n=26) | |
| Dell XPS 13 Plus 9320 4K | |
| AIDA64 / CPU AES | |
| Asus Zenbook S 13 OLED | |
| Huawei MateBook 13s i5 11300H | |
| Lenovo ThinkPad X1 Nano-20UN002UGE | |
| Average of class Subnotebook (638 - 96917, n=58, last 2 years) | |
| Average Intel Core i7-1260P (16041 - 92356, n=26) | |
| Dell XPS 13 Plus 9320 4K | |
| AIDA64 / CPU ZLib | |
| Average of class Subnotebook (164.9 - 1379, n=58, last 2 years) | |
| Dell XPS 13 Plus 9320 4K | |
| Asus Zenbook S 13 OLED | |
| Average Intel Core i7-1260P (259 - 771, n=26) | |
| Huawei MateBook 13s i5 11300H | |
| Lenovo ThinkPad X1 Nano-20UN002UGE | |
| AIDA64 / FP64 Ray-Trace | |
| Average of class Subnotebook (610 - 17495, n=58, last 2 years) | |
| Asus Zenbook S 13 OLED | |
| Huawei MateBook 13s i5 11300H | |
| Lenovo ThinkPad X1 Nano-20UN002UGE | |
| Average Intel Core i7-1260P (1237 - 5858, n=26) | |
| Dell XPS 13 Plus 9320 4K | |
| AIDA64 / CPU PhotoWorxx | |
| Average of class Subnotebook (6569 - 85600, n=58, last 2 years) | |
| Dell XPS 13 Plus 9320 4K | |
| Lenovo ThinkPad X1 Nano-20UN002UGE | |
| Huawei MateBook 13s i5 11300H | |
| Average Intel Core i7-1260P (13261 - 43652, n=26) | |
| Asus Zenbook S 13 OLED | |
系统性能
新的XPS 13 Plus是一个反应非常快的设备,这也得到了良好的基准分数的支持。我们在审查期间没有遇到任何停顿或崩溃。
CrossMark: Overall | Productivity | Creativity | Responsiveness
| PCMark 10 / Score | |
| Average of class Subnotebook (4920 - 9939, n=44, last 2 years) | |
| Asus Zenbook S 13 OLED | |
| Dell XPS 13 Plus 9320 4K | |
| Average Intel Core i7-1260P, Intel Iris Xe Graphics G7 96EUs (4796 - 6068, n=17) | |
| Huawei MateBook 13s i5 11300H | |
| Dell XPS 13 9310 Core i7 4K | |
| Lenovo ThinkPad X1 Nano-20UN002UGE | |
| PCMark 10 / Essentials | |
| Asus Zenbook S 13 OLED | |
| Dell XPS 13 Plus 9320 4K | |
| Average of class Subnotebook (8552 - 11646, n=44, last 2 years) | |
| Average Intel Core i7-1260P, Intel Iris Xe Graphics G7 96EUs (9260 - 11251, n=17) | |
| Huawei MateBook 13s i5 11300H | |
| Dell XPS 13 9310 Core i7 4K | |
| Lenovo ThinkPad X1 Nano-20UN002UGE | |
| PCMark 10 / Productivity | |
| Average of class Subnotebook (5435 - 16606, n=44, last 2 years) | |
| Asus Zenbook S 13 OLED | |
| Average Intel Core i7-1260P, Intel Iris Xe Graphics G7 96EUs (6167 - 8629, n=17) | |
| Dell XPS 13 Plus 9320 4K | |
| Dell XPS 13 9310 Core i7 4K | |
| Huawei MateBook 13s i5 11300H | |
| Lenovo ThinkPad X1 Nano-20UN002UGE | |
| PCMark 10 / Digital Content Creation | |
| Average of class Subnotebook (5722 - 13779, n=44, last 2 years) | |
| Asus Zenbook S 13 OLED | |
| Dell XPS 13 Plus 9320 4K | |
| Average Intel Core i7-1260P, Intel Iris Xe Graphics G7 96EUs (5231 - 6908, n=17) | |
| Huawei MateBook 13s i5 11300H | |
| Dell XPS 13 9310 Core i7 4K | |
| Lenovo ThinkPad X1 Nano-20UN002UGE | |
| CrossMark / Overall | |
| Dell XPS 13 Plus 9320 4K | |
| Average of class Subnotebook (365 - 2356, n=60, last 2 years) | |
| Average Intel Core i7-1260P, Intel Iris Xe Graphics G7 96EUs (1484 - 1811, n=16) | |
| Asus Zenbook S 13 OLED | |
| Apple MacBook Air 2020 M1 Entry | |
| Huawei MateBook 13s i5 11300H | |
| CrossMark / Productivity | |
| Average Intel Core i7-1260P, Intel Iris Xe Graphics G7 96EUs (1486 - 1755, n=16) | |
| Dell XPS 13 Plus 9320 4K | |
| Average of class Subnotebook (364 - 2277, n=60, last 2 years) | |
| Asus Zenbook S 13 OLED | |
| Huawei MateBook 13s i5 11300H | |
| Apple MacBook Air 2020 M1 Entry | |
| CrossMark / Creativity | |
| Dell XPS 13 Plus 9320 4K | |
| Average of class Subnotebook (372 - 2743, n=60, last 2 years) | |
| Average Intel Core i7-1260P, Intel Iris Xe Graphics G7 96EUs (1451 - 1872, n=16) | |
| Apple MacBook Air 2020 M1 Entry | |
| Asus Zenbook S 13 OLED | |
| Huawei MateBook 13s i5 11300H | |
| CrossMark / Responsiveness | |
| Average Intel Core i7-1260P, Intel Iris Xe Graphics G7 96EUs (1253 - 1807, n=16) | |
| Huawei MateBook 13s i5 11300H | |
| Dell XPS 13 Plus 9320 4K | |
| Average of class Subnotebook (312 - 1854, n=60, last 2 years) | |
| Asus Zenbook S 13 OLED | |
| Apple MacBook Air 2020 M1 Entry | |
| PCMark 10 Score | 5558 points | |
Help | ||
| AIDA64 / Memory Copy | |
| Average of class Subnotebook (14554 - 131023, n=58, last 2 years) | |
| Dell XPS 13 Plus 9320 4K | |
| Average Intel Core i7-1260P (25125 - 71544, n=25) | |
| Huawei MateBook 13s i5 11300H | |
| Asus Zenbook S 13 OLED | |
| Lenovo ThinkPad X1 Nano-20UN002UGE | |
| AIDA64 / Memory Read | |
| Average of class Subnotebook (15948 - 127174, n=58, last 2 years) | |
| Dell XPS 13 Plus 9320 4K | |
| Huawei MateBook 13s i5 11300H | |
| Average Intel Core i7-1260P (24983 - 72065, n=25) | |
| Lenovo ThinkPad X1 Nano-20UN002UGE | |
| Asus Zenbook S 13 OLED | |
| AIDA64 / Memory Write | |
| Average of class Subnotebook (15709 - 135141, n=58, last 2 years) | |
| Dell XPS 13 Plus 9320 4K | |
| Huawei MateBook 13s i5 11300H | |
| Average Intel Core i7-1260P (23512 - 66799, n=25) | |
| Lenovo ThinkPad X1 Nano-20UN002UGE | |
| Asus Zenbook S 13 OLED | |
| AIDA64 / Memory Latency | |
| Asus Zenbook S 13 OLED | |
| Lenovo ThinkPad X1 Nano-20UN002UGE | |
| Average of class Subnotebook (6.1 - 159.9, n=56, last 2 years) | |
| Huawei MateBook 13s i5 11300H | |
| Average Intel Core i7-1260P (77.9 - 118.4, n=21) | |
* ... smaller is better
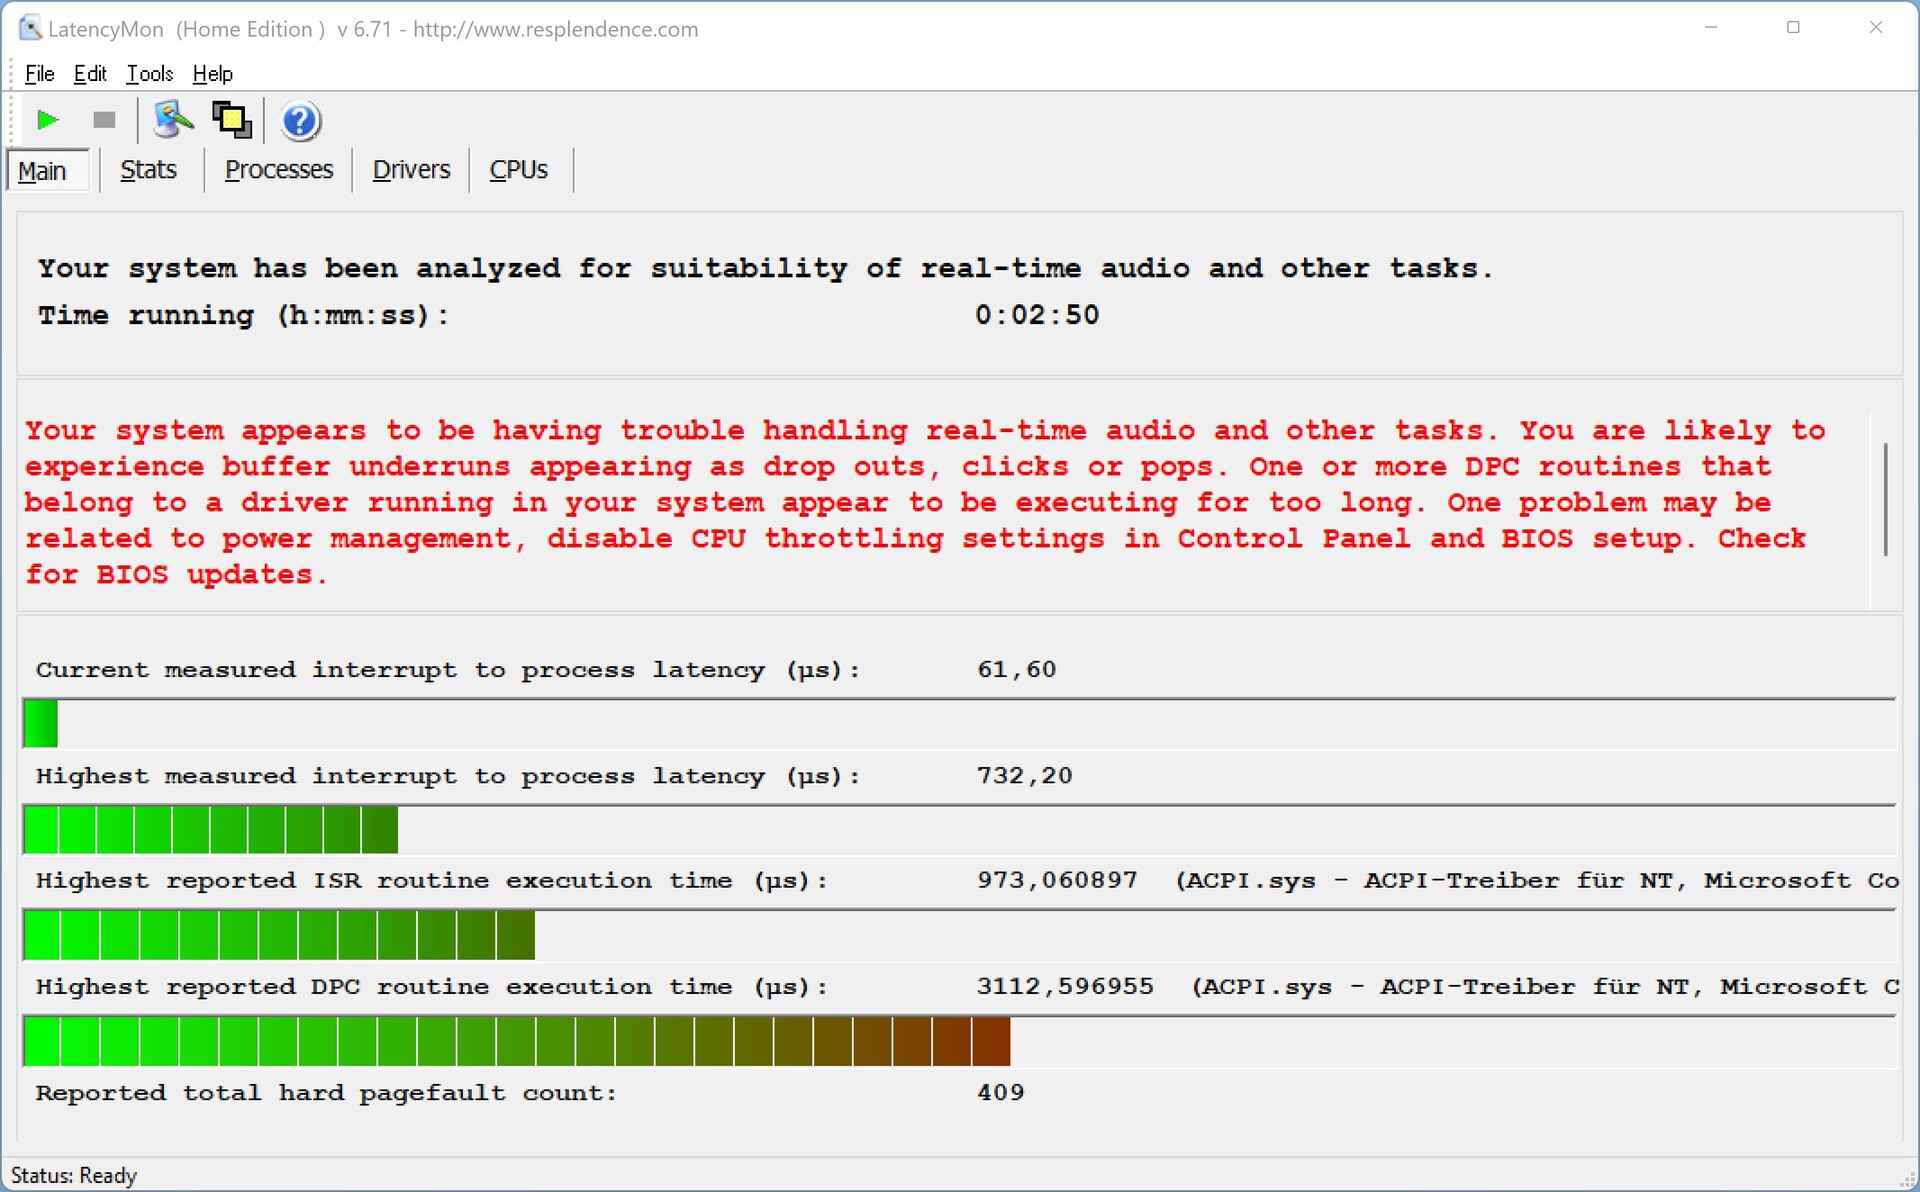
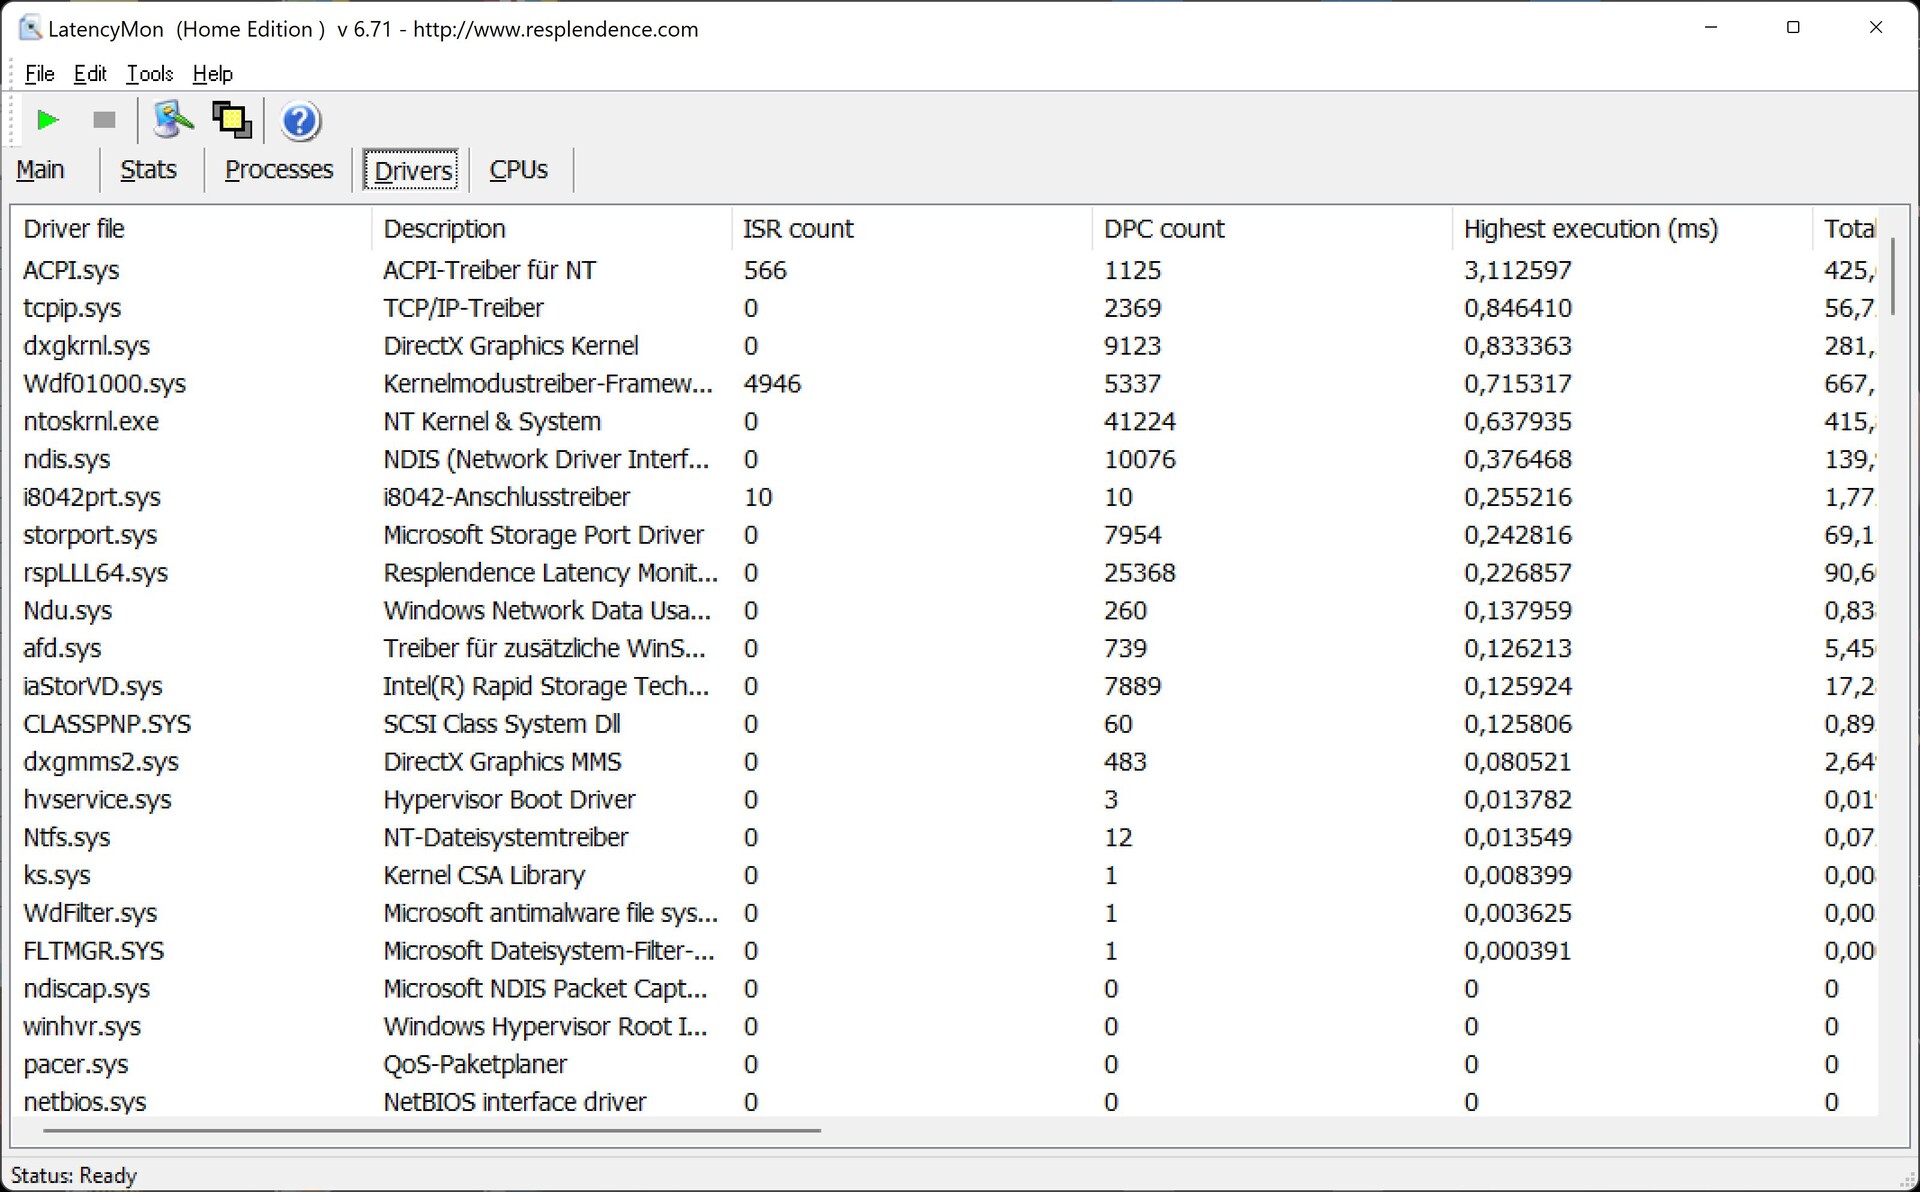
DPC延时
我们的标准化延迟测试(网页浏览、YouTube 4K、CPU负载)没有显示任何基本问题,但有一个驱动程序会出现一些问题。这意味着在目前的BIOS版本下,XPS 13 Plus并不是实时音频应用的理想选择。
| DPC Latencies / LatencyMon - interrupt to process latency (max), Web, Youtube, Prime95 | |
| Lenovo ThinkPad X1 Nano-20UN002UGE | |
| Dell XPS 13 9310 Core i7 4K | |
| Huawei MateBook 13s i5 11300H | |
| Dell XPS 13 Plus 9320 4K | |
| Asus Zenbook S 13 OLED | |
* ... smaller is better
存储设备
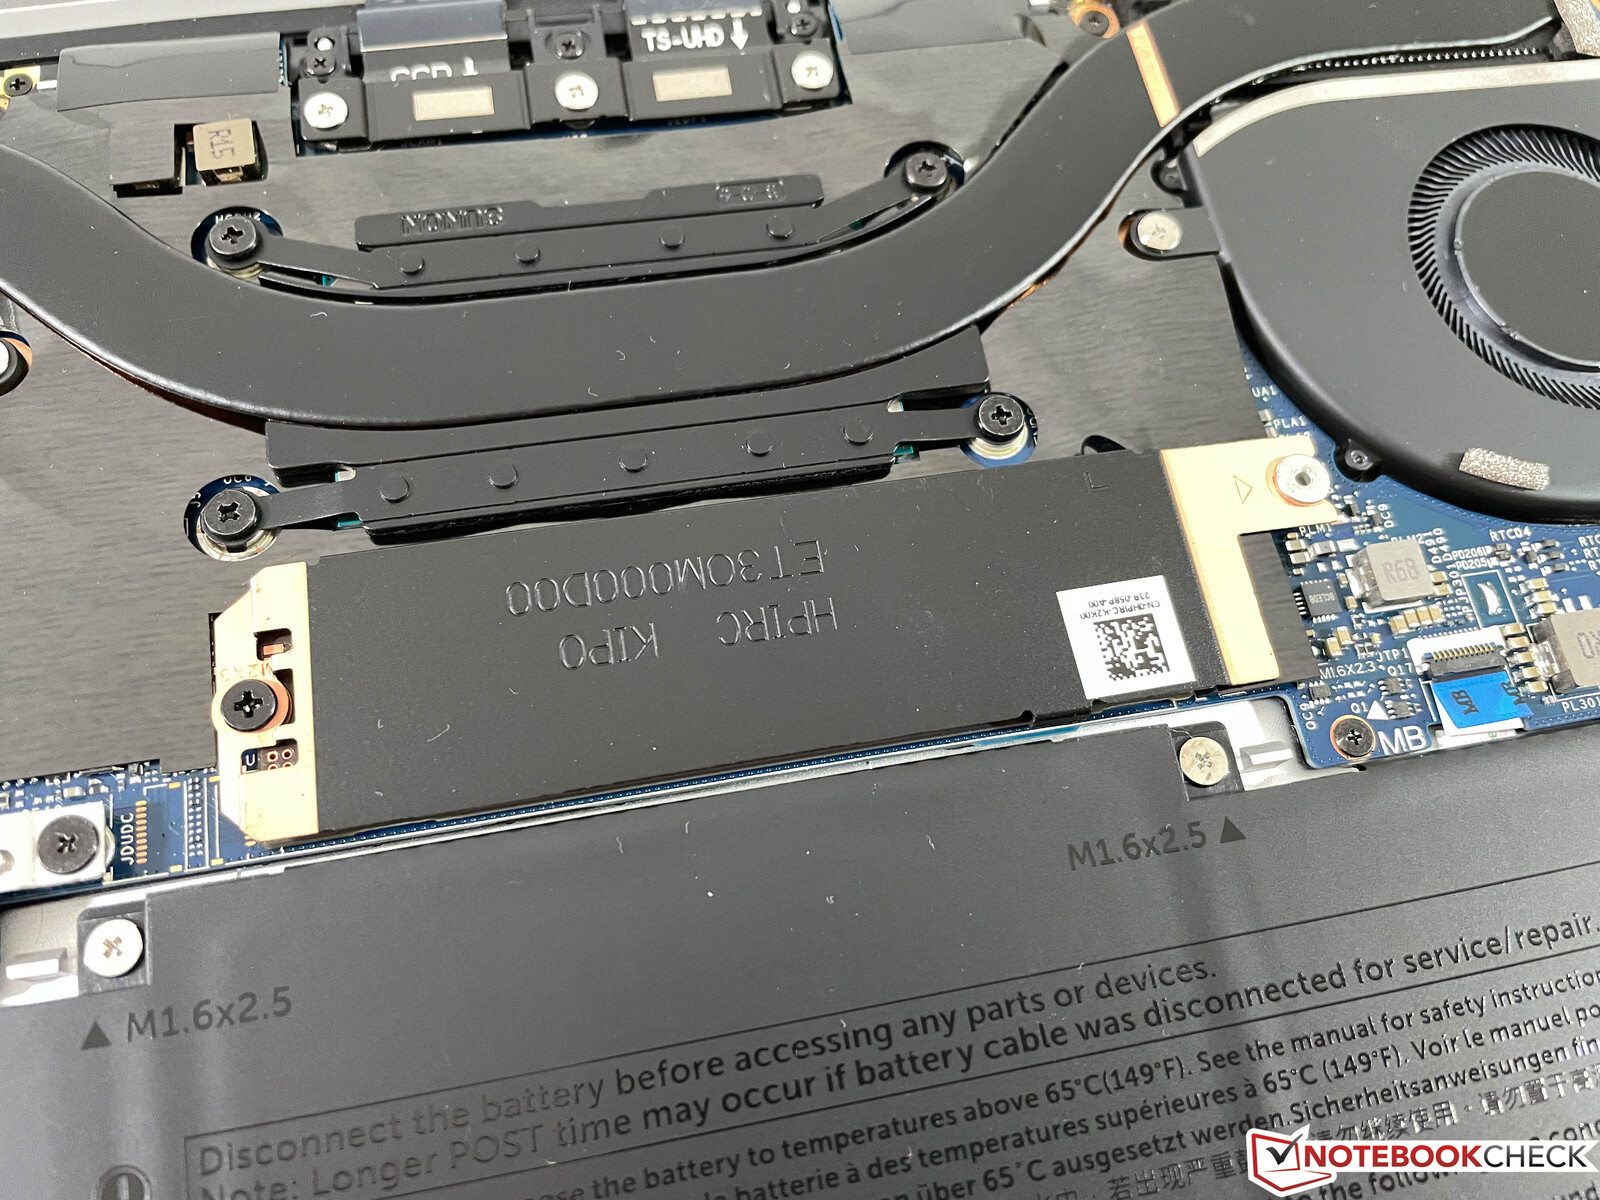
戴尔在新的XPS 13 Plus上使用了快速的PCIe-4.0固态硬盘。我们的评测单元配备了1TB驱动器,但在初始设置后,你只能为自己的文件使用813GB。Windows笔记本电脑通常提供约900GB(配备1TB驱动器)。三星固态硬盘(PM9A1)的性能非常好,在持续的工作负荷下很稳定,考虑到紧靠冷却装置和热管的位置,这并不是一个问题。更多的SSD基准测试被列在 这里.

* ... smaller is better
Disk Throttling: DiskSpd Read Loop, Queue Depth 8
GPU性能
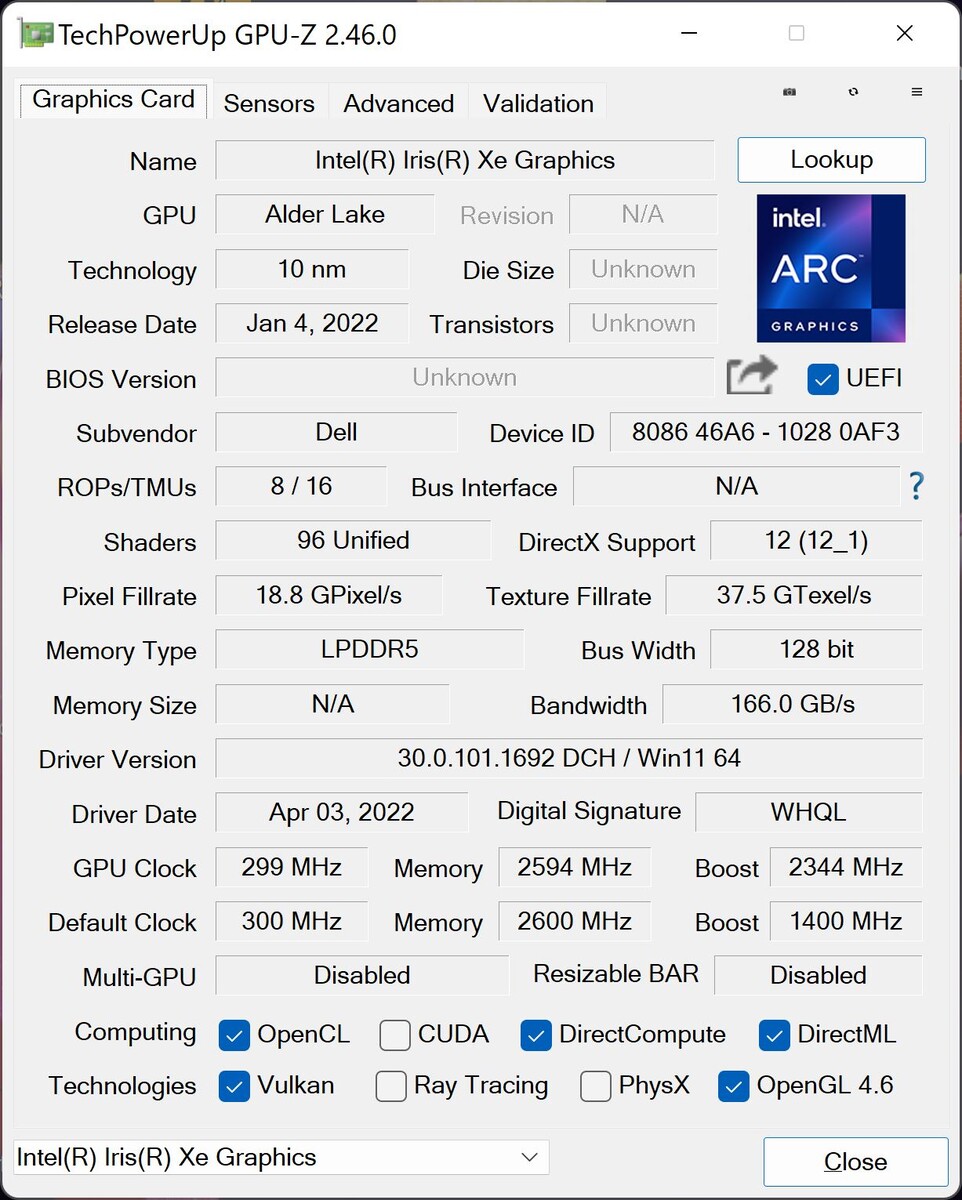
由于Alder Lake CPU仍然使用相同的GPU,我们可以保持简短。Iris Xe Graphics G7我们已经从以前的XPS 13 9310的Tiger Lake 代知道。新的XPS 13 Plus略微受益于更快的内存模块,但整体的GPU性能与旧型号相当。AMD的新Radeon 680M iGPU在合成和游戏基准测试中都明显更快。当你在XPS 13 Plus上游戏时,你通常被限制在简单标题的中/高细节。
XPS没有通过3DMarkTime Spy 压力测试,即使使用超性能配置文件,尽管性能下降非常小(96.4%),而且你在游戏中不会注意到它。我们的Witcher 3 循环也显示了稳定的性能(尽管这个标题中的CPU负载相对较低)。
英特尔的Iris Xe Graphics G7仍然是多媒体用途的一个不错的选择,包括高分辨率的视频播放,图形性能只是在电池电量上略微慢一些。更多的GPU基准测试可在我们的 技术部分.
| Power Consumption - Witcher 3 ultra Efficiency (external Monitor) | |
| Average of class Subnotebook (0.4806 - 0.882, n=3, last 2 years) | |
| Asus Zenbook S 13 OLED | |
| Average Intel Iris Xe Graphics G7 96EUs (0.2055 - 0.842, n=110) | |
| Huawei MateBook 13s i5 11300H | |
| Dell XPS 13 Plus 9320 4K | |
| 3DMark 11 Performance | 7499 points | |
| 3DMark Cloud Gate Standard Score | 22229 points | |
| 3DMark Fire Strike Score | 4985 points | |
| 3DMark Time Spy Score | 1974 points | |
Help | ||
Witcher 3 FPS Chart
| low | med. | high | ultra | QHD | 4K | |
|---|---|---|---|---|---|---|
| GTA V (2015) | 115.1 | 102.1 | 26.2 | 11 | ||
| The Witcher 3 (2015) | 99 | 62 | 34 | 14.3 | ||
| Dota 2 Reborn (2015) | 109.9 | 85.2 | 68.2 | 60.6 | 26.7 | |
| Final Fantasy XV Benchmark (2018) | 44.7 | 25.3 | 25.3 | 13.9 | ||
| X-Plane 11.11 (2018) | 55.5 | 42.9 | 36.9 | 19.1 | ||
| Far Cry 5 (2018) | 59 | 32 | 29 | 26 | ||
| Strange Brigade (2018) | 95.2 | 45.9 | 36.4 | 29.5 | ||
| F1 2021 (2021) | 112.6 | 53.1 | 42.4 | 29.7 | ||
| Farming Simulator 22 (2021) | 103 | 46 | 34 | 31 |
排放--XPS 13 Plus配备更响亮的风扇
系统噪音
新款XPS 13 Plus的两个风扇在轻度工作负荷下通常是停用或以最低速度运行(只有在静音环境下才能听到)。当你给系统施加压力时,它很快就会变得很吵,无论是使用优化版还是超性能版,这都是Alder Lake处理器的高功率限制的结果。在压力测试和CPU高负荷时,我们可以测量到高达45 dB(A),这显然是可以听到的,但没有来自风扇的恼人的频率。优化配置文件的结果是高达40.4 dB(A)。如果你想让它尽可能安静,在高工作负荷下可达35分贝(A),你应该使用静音配置文件。
| 静音 | 优化 | 超强性能 | |
|---|---|---|---|
| 3DMark 06 | 33.1 dB(A) | 40.4 dB(A) | 40.4 dB(A) |
| CB R23 Single | 33.1 dB(A) | 40.4 dB(A) | 40.4 dB(A) |
| CB R23 Multi | 35 dB(A) | 40.4 dB(A) | 45.5 dB(A) |
| Witcher 3 | 35 dB(A) | 40.4 dB(A) | 45.5 dB(A) |
| 压力测试 | 35 dB(A) | 40.4 dB(A) | 45.5 dB(A) |
总而言之,新的XPS 13 Plus的声音明显比旧型号大,也是对比组内最吵的一个。在我们的基准测试中,我们注意到来自SSD的一些电子噪音,但这是唯一的情况。
Noise level
| Idle |
| 24.4 / 24.4 / 25.5 dB(A) |
| Load |
| 40.4 / 45.5 dB(A) |
 | ||
30 dB silent 40 dB(A) audible 50 dB(A) loud |
||
min: | ||
| Dell XPS 13 Plus 9320 4K Iris Xe G7 96EUs, i7-1260P, Samsung PM9A1 MZVL21T0HCLR | Asus Zenbook S 13 OLED Radeon 680M, R7 6800U, Samsung PM9A1 MZVL21T0HCLR | Lenovo ThinkPad X1 Nano-20UN002UGE Iris Xe G7 96EUs, i7-1160G7, WDC PC SN530 SDBPNPZ-512G | Huawei MateBook 13s i5 11300H Iris Xe G7 80EUs, i5-11300H, Phison Electronics PS5012 | Dell XPS 13 9310 Core i7 4K Iris Xe G7 96EUs, i7-1185G7, Micron 2300 512GB MTFDHBA512TDV | |
|---|---|---|---|---|---|
| Noise | 7% | 3% | 5% | 4% | |
| off / environment * (dB) | 24.4 | 24 2% | 24.9 -2% | 24.5 -0% | 27.7 -14% |
| Idle Minimum * (dB) | 24.4 | 24 2% | 24.9 -2% | 24.5 -0% | 27.8 -14% |
| Idle Average * (dB) | 24.4 | 24 2% | 26.3 -8% | 24.5 -0% | 27.8 -14% |
| Idle Maximum * (dB) | 25.5 | 24 6% | 31.8 -25% | 28 -10% | 27.8 -9% |
| Load Average * (dB) | 40.4 | 33.1 18% | 34.3 15% | 35.9 11% | 27.9 31% |
| Witcher 3 ultra * (dB) | 45.5 | 40.2 12% | 34.3 25% | 35.9 21% | 32.8 28% |
| Load Maximum * (dB) | 45.5 | 41.7 8% | 37.5 18% | 38.6 15% | 37 19% |
* ... smaller is better
温度
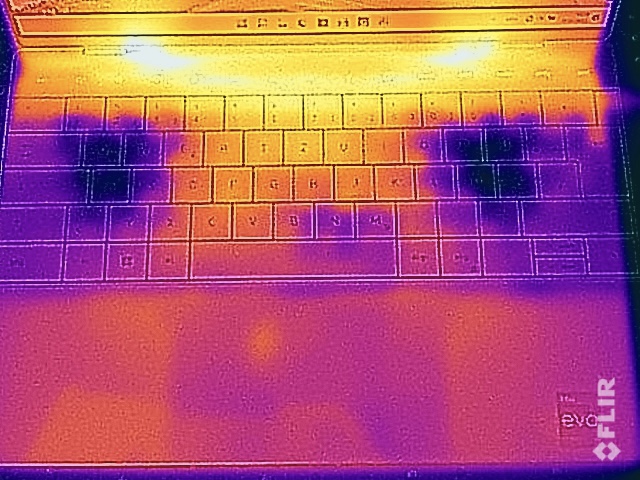
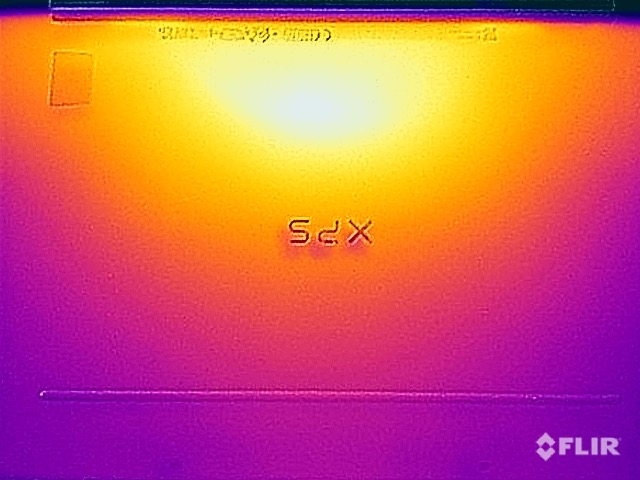
XPS 13 Plus的机箱在日常工作中保持舒适的温度,你也可以把它放在腿上,没有任何问题。另一方面,持续的高工作负荷或游戏会导致键盘区域的底部和顶部(沿着大热管)的表面温度升高,我们建议使用固体表面。紧凑的电源适配器在高达47°C的温度下不会过热。
在压力测试中,处理器的消耗最终平息在27W,我们没有注意到在压力测试后立即出现任何性能缺陷。
(±) The maximum temperature on the upper side is 41.1 °C / 106 F, compared to the average of 35.9 °C / 97 F, ranging from 21.4 to 59 °C for the class Subnotebook.
(-) The bottom heats up to a maximum of 48.8 °C / 120 F, compared to the average of 39.2 °C / 103 F
(+) In idle usage, the average temperature for the upper side is 26.8 °C / 80 F, compared to the device average of 30.8 °C / 87 F.
(±) Playing The Witcher 3, the average temperature for the upper side is 34.4 °C / 94 F, compared to the device average of 30.8 °C / 87 F.
(+) The palmrests and touchpad are reaching skin temperature as a maximum (33 °C / 91.4 F) and are therefore not hot.
(-) The average temperature of the palmrest area of similar devices was 28.2 °C / 82.8 F (-4.8 °C / -8.6 F).
| Dell XPS 13 Plus 9320 4K Intel Core i7-1260P, Intel Iris Xe Graphics G7 96EUs | Asus Zenbook S 13 OLED AMD Ryzen 7 6800U, AMD Radeon 680M | Lenovo ThinkPad X1 Nano-20UN002UGE Intel Core i7-1160G7, Intel Iris Xe Graphics G7 96EUs | Apple MacBook Air 2020 M1 Entry Apple M1, Apple M1 7-Core GPU | Huawei MateBook 13s i5 11300H Intel Core i5-11300H, Intel Iris Xe Graphics G7 80EUs | Dell XPS 13 9310 Core i7 4K Intel Core i7-1185G7, Intel Iris Xe Graphics G7 96EUs | |
|---|---|---|---|---|---|---|
| Heat | -5% | 7% | 4% | 5% | -1% | |
| Maximum Upper Side * (°C) | 41.1 | 47.9 -17% | 42.2 -3% | 44 -7% | 42.8 -4% | 47 -14% |
| Maximum Bottom * (°C) | 48.8 | 56.1 -15% | 47.5 3% | 44 10% | 46.9 4% | 45 8% |
| Idle Upper Side * (°C) | 28 | 26.8 4% | 24.3 13% | 27 4% | 25.2 10% | 27.8 1% |
| Idle Bottom * (°C) | 29.3 | 27.3 7% | 25.3 14% | 27 8% | 26 11% | 28.6 2% |
* ... smaller is better
发言人
戴尔为XPS 13 Plus使用了一个新的四扬声器系统,与旧的相比,质量更好。XPS 13 9310并与MacBook Air M1.声音非常丰富,视频或一些背景音乐绝对让人享受。
Dell XPS 13 Plus 9320 4K audio analysis
(±) | speaker loudness is average but good (79 dB)
Bass 100 - 315 Hz
(±) | reduced bass - on average 7.3% lower than median
(±) | linearity of bass is average (9.4% delta to prev. frequency)
Mids 400 - 2000 Hz
(+) | balanced mids - only 3.7% away from median
(+) | mids are linear (5.7% delta to prev. frequency)
Highs 2 - 16 kHz
(+) | balanced highs - only 3.4% away from median
(+) | highs are linear (4.3% delta to prev. frequency)
Overall 100 - 16.000 Hz
(+) | overall sound is linear (10.7% difference to median)
Compared to same class
» 9% of all tested devices in this class were better, 3% similar, 88% worse
» The best had a delta of 5%, average was 18%, worst was 53%
Compared to all devices tested
» 6% of all tested devices were better, 2% similar, 93% worse
» The best had a delta of 4%, average was 24%, worst was 134%
Apple MacBook Air 2020 M1 Entry audio analysis
(±) | speaker loudness is average but good (79.6 dB)
Bass 100 - 315 Hz
(±) | reduced bass - on average 7.1% lower than median
(±) | linearity of bass is average (9.5% delta to prev. frequency)
Mids 400 - 2000 Hz
(+) | balanced mids - only 2.2% away from median
(+) | mids are linear (5.3% delta to prev. frequency)
Highs 2 - 16 kHz
(+) | balanced highs - only 2.3% away from median
(+) | highs are linear (4% delta to prev. frequency)
Overall 100 - 16.000 Hz
(+) | overall sound is linear (8.7% difference to median)
Compared to same class
» 3% of all tested devices in this class were better, 1% similar, 96% worse
» The best had a delta of 5%, average was 18%, worst was 53%
Compared to all devices tested
» 3% of all tested devices were better, 1% similar, 97% worse
» The best had a delta of 4%, average was 24%, worst was 134%
Dell XPS 13 9310 Core i7 4K audio analysis
(+) | speakers can play relatively loud (84.6 dB)
Bass 100 - 315 Hz
(±) | reduced bass - on average 13.1% lower than median
(±) | linearity of bass is average (11.1% delta to prev. frequency)
Mids 400 - 2000 Hz
(+) | balanced mids - only 4.3% away from median
(+) | mids are linear (4.2% delta to prev. frequency)
Highs 2 - 16 kHz
(+) | balanced highs - only 1.5% away from median
(+) | highs are linear (3.8% delta to prev. frequency)
Overall 100 - 16.000 Hz
(+) | overall sound is linear (10.9% difference to median)
Compared to same class
» 9% of all tested devices in this class were better, 3% similar, 88% worse
» The best had a delta of 5%, average was 18%, worst was 53%
Compared to all devices tested
» 6% of all tested devices were better, 2% similar, 92% worse
» The best had a delta of 4%, average was 24%, worst was 134%
能源管理 - 4K和Alder Lake影响电池运行时间
消耗功率
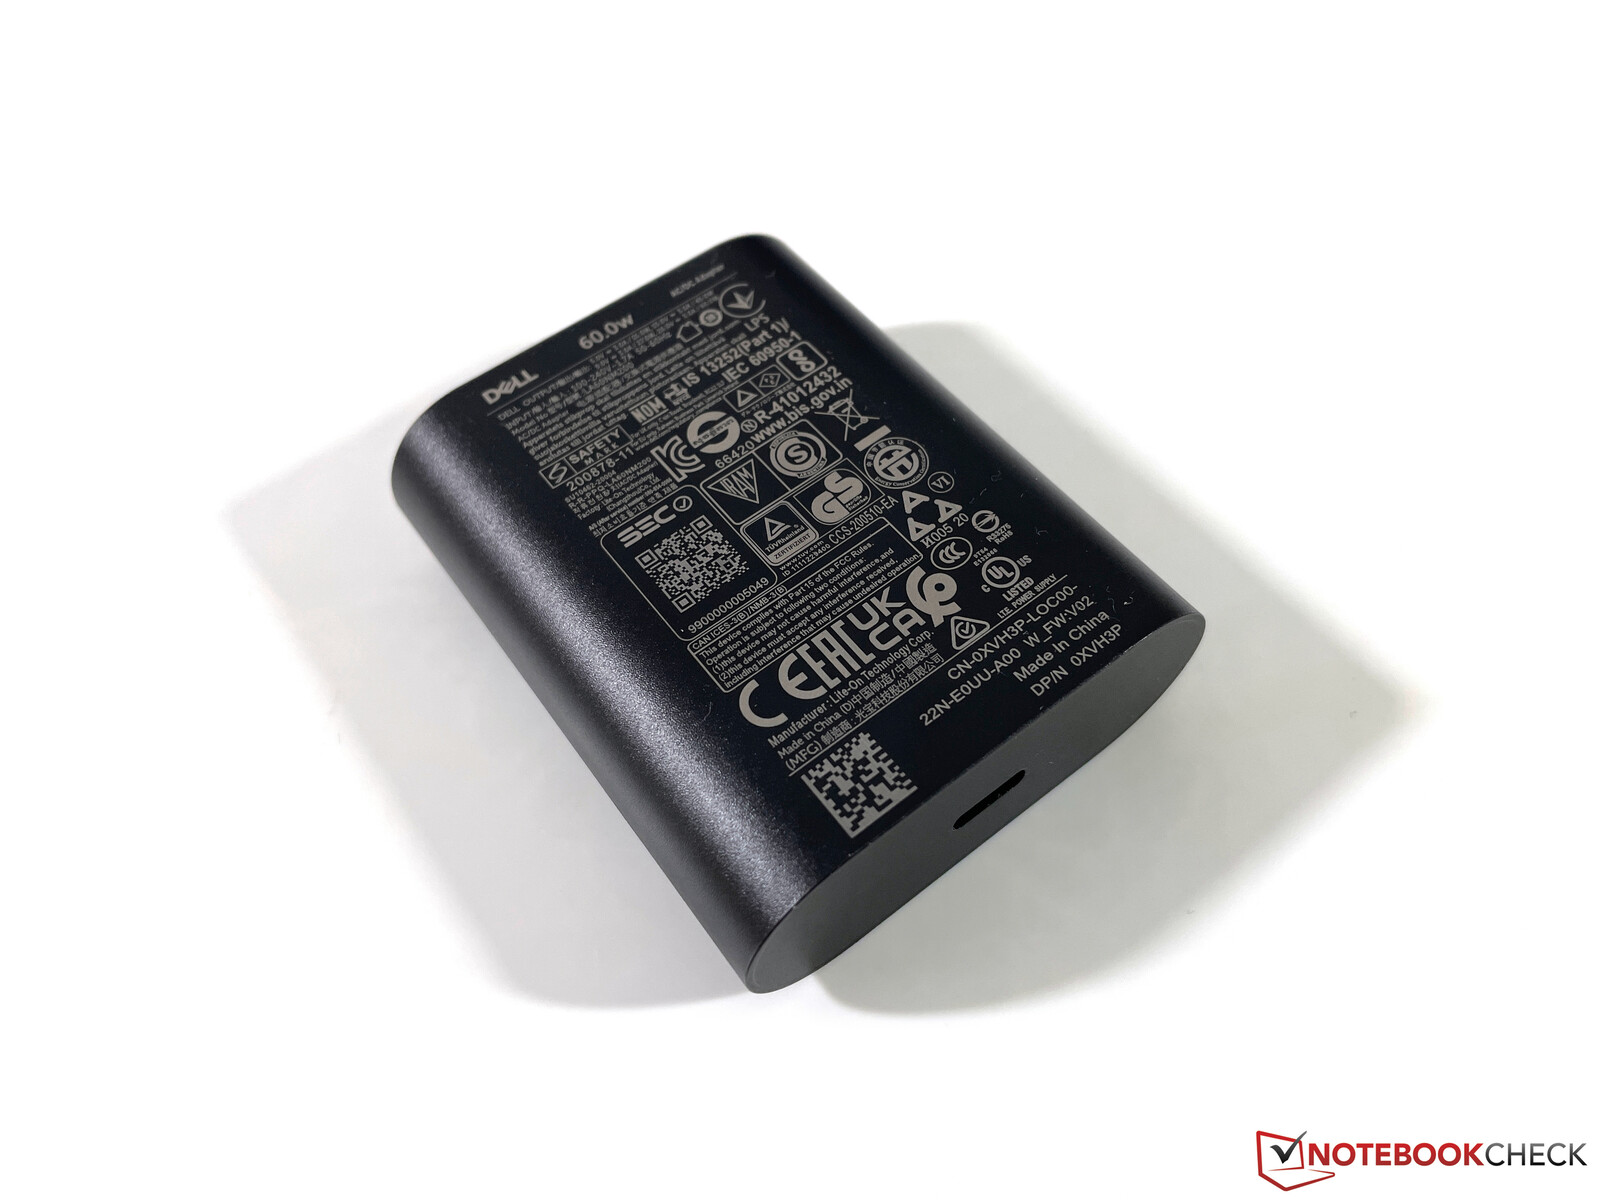
我们已经看到,CPU可以在短时间内消耗超过50W的功率,所以在这些情况下,附带的60W电源适配器不够用也就不奇怪了。目前我们可以在许多紧凑的Alder Lake系统上观察到这个问题。然而,在这种情况下,峰值负载的持续时间非常有限,所以在实践中这不是一个大问题,电池不会放电。
不过,当你给设备施加压力时,给电池充电会非常慢。我们的空闲测量结果也显示,与之前的型号相比,消耗数字有所增加。 前一个型号消耗量增加,因为它也配备了4K显示屏。
| Off / Standby | |
| Idle | |
| Load |
|
Key:
min: | |
| Dell XPS 13 Plus 9320 4K i7-1260P, Iris Xe G7 96EUs, Samsung PM9A1 MZVL21T0HCLR, IPS, 3840x2400, 13.4" | Asus Zenbook S 13 OLED R7 6800U, Radeon 680M, Samsung PM9A1 MZVL21T0HCLR, OLED, 2880x1800, 13.3" | Lenovo ThinkPad X1 Nano-20UN002UGE i7-1160G7, Iris Xe G7 96EUs, WDC PC SN530 SDBPNPZ-512G, IPS, 2160x1350, 13" | Apple MacBook Air 2020 M1 Entry M1, M1 7-Core GPU, Apple SSD AP0256Q, IPS, 2560x1600, 13.3" | Huawei MateBook 13s i5 11300H i5-11300H, Iris Xe G7 80EUs, Phison Electronics PS5012, LTPS, 2520x1680, 13.4" | Dell XPS 13 9310 Core i7 4K i7-1185G7, Iris Xe G7 96EUs, Micron 2300 512GB MTFDHBA512TDV, IPS, 3840x2400, 13.4" | Dell XPS 13 9310 OLED i7-1185G7, Iris Xe G7 96EUs, Toshiba XG6 KXG60ZNV512G, OLED, 3456x2160, 13.4" | Average Intel Iris Xe Graphics G7 96EUs | Average of class Subnotebook | |
|---|---|---|---|---|---|---|---|---|---|
| Power Consumption | 20% | 38% | 53% | 21% | 25% | 22% | 12% | 29% | |
| Idle Minimum * (Watt) | 7 | 4.8 31% | 3.3 53% | 1.9 73% | 4.2 40% | 4.3 39% | 5.7 19% | 5.51 ? 21% | 3.82 ? 45% |
| Idle Average * (Watt) | 11 | 8.7 21% | 5.7 48% | 6.4 42% | 8.1 26% | 8.3 25% | 6 45% | 8.66 ? 21% | 6.61 ? 40% |
| Idle Maximum * (Watt) | 11.4 | 10.1 11% | 9.1 20% | 7 39% | 9 21% | 8.8 23% | 12.3 -8% | 10.9 ? 4% | 7.99 ? 30% |
| Load Average * (Watt) | 59.7 | 45.6 24% | 29.6 50% | 25 58% | 41.7 30% | 46.2 23% | 44.4 26% | 45.6 ? 24% | 41.9 ? 30% |
| Witcher 3 ultra * (Watt) | 49.4 | 42.4 14% | 27.7 44% | 40.1 19% | 42.2 15% | 36.5 26% | |||
| Load Maximum * (Watt) | 63 | 49.5 21% | 55.1 13% | 30.3 52% | 68 -8% | 47.3 25% | 47.8 24% | 67.8 ? -8% | 64.1 ? -2% |
* ... smaller is better
Power Consumption Witcher 3 / Stress test
Power Consumption with external screen
电池运行时间
戴尔将电池容量从52Wh增加到55Wh,但由于消耗数字较高,电池运行时间与4K前代产品相比仍然有所下降。在150尼特(占我们评测设备最大亮度的47%)下,我们的Wi-Fi测试只运行了7个小时,在最大亮度下只运行了约5.5小时。在150尼特下,视频测试的差异特别明显,几乎可以运行11小时。这是Alder Lake CPU的结果,它在单核负载情况下也会消耗大量的电力。
旧XPS的 旧版XPS 13 9310的OLED面板在电池电量方面比其4K IPS对应产品略差,因此我们预计这一代产品也是如此。如果你正在寻找电池运行时间最好的XPS 13 Plus,我们绝对推荐标准的1200p面板(1920 x 1200像素)。
戴尔为电池的充电提供了不同的设置,你也可以设置手动限制。在默认设置下,需要大约160分钟,在设备开启时,电池才会被完全充满。快速模式可减少25分钟,100W PSU可再减少10分钟。
| Dell XPS 13 Plus 9320 4K i7-1260P, Iris Xe G7 96EUs, 55 Wh | Asus Zenbook S 13 OLED R7 6800U, Radeon 680M, 67 Wh | Lenovo ThinkPad X1 Nano-20UN002UGE i7-1160G7, Iris Xe G7 96EUs, 48.2 Wh | Apple MacBook Air 2020 M1 Entry M1, M1 7-Core GPU, 49.9 Wh | Huawei MateBook 13s i5 11300H i5-11300H, Iris Xe G7 80EUs, 60 Wh | Dell XPS 13 9310 Core i7 4K i7-1185G7, Iris Xe G7 96EUs, 52 Wh | Dell XPS 13 9310 OLED i7-1185G7, Iris Xe G7 96EUs, 52 Wh | Average of class Subnotebook | |
|---|---|---|---|---|---|---|---|---|
| Battery runtime | 52% | 35% | 132% | 20% | 4% | -6% | 65% | |
| H.264 (h) | 11 | 15.2 38% | 15.4 40% | 11 0% | 15.6 ? 42% | |||
| WiFi v1.3 (h) | 6.9 | 9.2 33% | 9.9 43% | 16 132% | 9.4 36% | 7.2 4% | 6.5 -6% | 14 ? 103% |
| Load (h) | 1.3 | 2.4 85% | 1.6 23% | 1.6 23% | 1.946 ? 50% |
Pros
Cons
结论 - XPS 13 Plus功能强大,但有其缺点
在我们对新的XPS 13 Plus进行评测之后,有很多话题我们必须要谈。戴尔不仅更新了一代处理器,而且还决定从现在开始提供两种完全不同的型号。XPS 13 Plus获得更快的英特尔Alder Lake-P芯片,以及酷睿i7-1260P在我们的审查单元中提供了良好的性能数据。然而,该设备再次显示了当前英特尔CPU的问题,因为高性能需要大量的电力。这影响了电池的运行时间以及温度,所以新的模型(即使有优化的电源配置文件)比旧的更响亮。 XPS 13 9310.GPU的性能也没有改变,AMD的Ryzen 6000 CPU就像Zenbook S 13中的一样,提供了更多的性能,也更有效率。
戴尔还延续了极简主义的趋势,因为XPS 13 Plus没有得到读卡器,甚至没有3.5毫米立体声插孔了,这意味着只剩下两个USB-C接口。由于支持Thunderbolt 4,它们的用途非常广泛,但在实践中就是不方便。在实验失败后,我们也对电容式触摸条感到惊讶,Apple 。带功能键的触摸条总体上运行良好,但这里没有附加价值,而且自动亮度控制并不总是可靠地工作。新的键盘给人留下了体面的印象,但我们非常喜欢由玻璃制成的一体式掌托区,这意味着指纹没有问题,而且很容易使用。新的声音系统也非常好,比旧型号有了改进。
新的戴尔XPS 13提供了足够的性能,但代价是风扇的声音更大,电池运行时间更短。还有一些设计决定,如键盘上方的电容式触摸条和端口方面的极简主义,会让人感到厌烦。
戴尔还必须注意不要在显示器方面与对手失之交臂,因为可选的4K屏幕只覆盖小的sRGB色域。如果你想要P3,目前你不得不获得可选的3.5K OLED面板,这在旧款中受到PWM闪烁的影响。虽然4K屏幕的主观画质仍然非常好。然而,高分辨率也影响了电池运行时间,在我们的Wi-Fi测试中,5.5-7小时的电池运行时间并不是记录制动。如果你需要更长的运行时间,你肯定应该买一个全高清面板(带和不带触摸支持)。较小的问题,如缺乏6GHz的Wi-Fi支持或720p的网络摄像头也有点影响整体印象。
XPS 13 Plus必须与非常好的对手竞争。对于初学者来说,我们很想评测采用Alder Lake-U CPU和没有触摸条的标准XPS 13(我们期待几天后的评测单元)。目前的华硕笔记本S 13配有AMD Ryzen 6000 CPU,在许多方面都很出色,而XPS 13 Plus甚至难以跟上旧的Apple MacBook Air M1在某些方面,XPS 13 Plus甚至难以赶上老款MacBook Air M1,后者要便宜得多。而且我们认为,面对目前也在评测中的新MacBook Air M2,情况也不会改变。
价格和可用性
你可以从戴尔的网上商店订购XPS 13 Plus。起价为1299美元。我们的评测单元配备了酷睿i7,32GB内存,1TB固态硬盘存储和4K屏幕,价格为2099美元,可从百思买购买。,例如。
Dell XPS 13 Plus 9320 4K
- 07/19/2022 v7 (old)
Andreas Osthoff
Price comparison

