


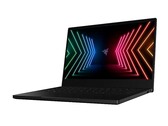
RazerBlade Stealth 13 2021年的回顾。采用OLED面板的移动游戏机
Razer提供了其紧凑的Blade Stealth 13,除了熟悉的IPS显示屏外,还有一个OLED屏幕。这提供了像极快的响应时间和伟大的画面这样的优势,但也有像PWM闪烁以及电池寿命明显缩短这样的劣势。
Intel Core i7-1165G7, NVIDIA GeForce GTX 1650 Ti Max-Q, 13.3", 1.5 kg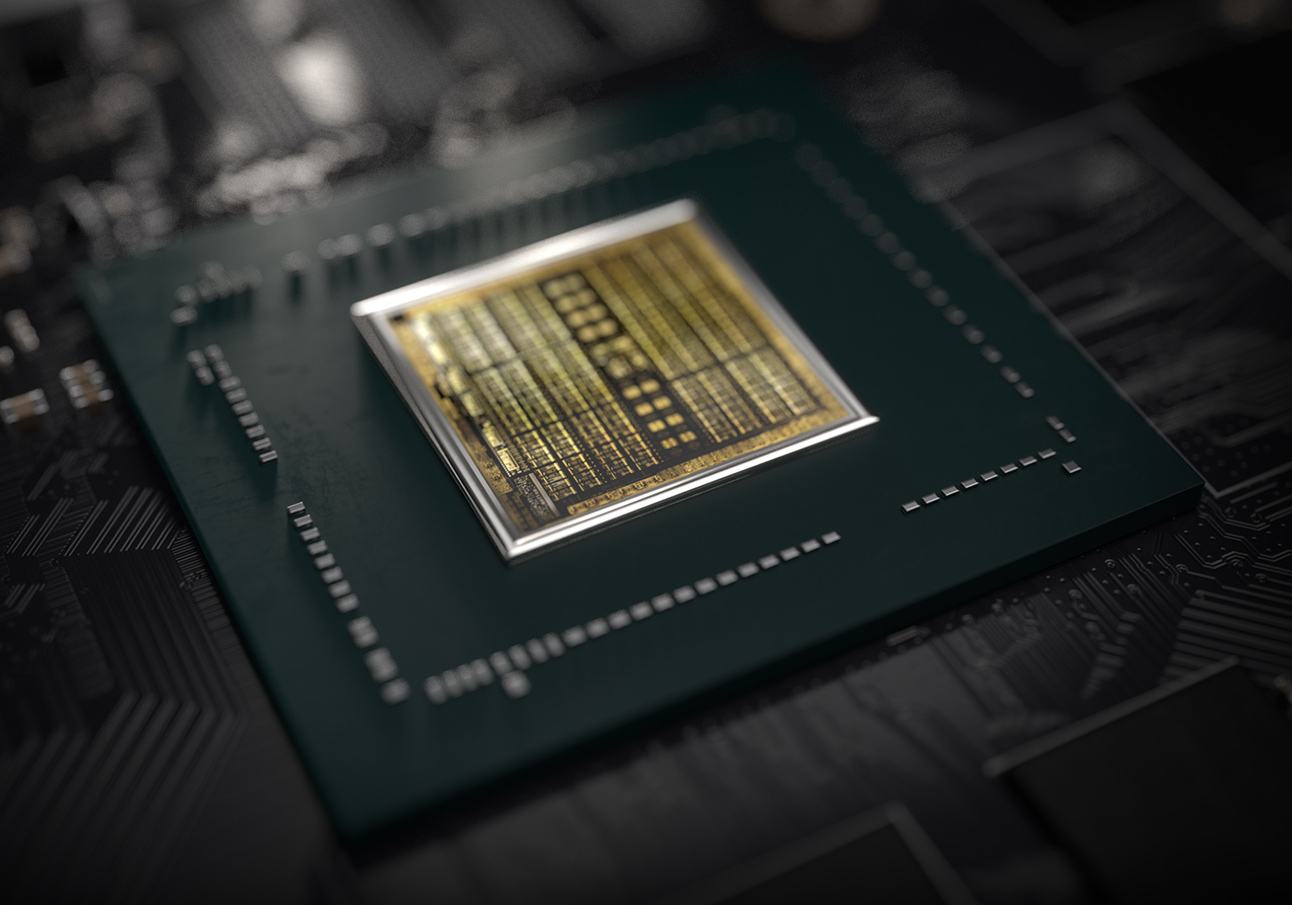
Nvidia GeForce GTX 1650 Ti Max-Q(N18P-G62)是基于Turing架构的笔记本电脑的中端图形卡。 Max-Q是移动GTX 1650Ti的节能版本,具有降低的频率,性能以及功耗。它使用的是带有1024个着色器的TU117芯片。因此,它适用于轻薄游戏笔记本电脑。与性能更强的RTX 2000 GPU(例如RTX 2060)相比,1650 Ti没有集成光线追踪或Tensor内核。
1650Ti Max-Q有两种型号,一种具有35瓦和1035-1200 MHz的频率,另一种具有40瓦的更强版本,其时钟速度为1200-1365 MHz。但是,两者的频率都明显低于具有50/55瓦和1350-1385 MHz频率的正常Max-P版本。在大多数笔记本电脑中,内存的时钟频率很有可能是1250 MHz = 10,000 MHz有效(Gbps),也有可能是1500 MHz = 12,000 Gbps的版本。
Turing一代不仅为RTX卡引入了光线追踪,而且还优化了内核和缓存的体系结构。根据Nvidia的说法,CUDA内核现在可提供浮点和整数运算的并发执行,以提高现代游戏的性能。此外,对缓存进行了重新设计(新的统一内存体系结构的缓存是Pascal的两倍)。与Pascal相比,这导致IPC增加50%,能耗比提高40%。
与较大的Turing芯片(例如GTX 1660 Ti的TU116和RTX系列)相比,TU117不包括新的NVENC编码器,而是较旧的类似于Pascal和Volta中使用的编码器。
Nvidia将1650 Ti Max-Q笔记本电脑的功耗指定为35瓦TGP(总图形功率),因此比同一包装中的移动GTX 1650 Ti低25瓦(其他型号最高可达80瓦)。
GeForce GTX 1600 Series
| ||||||||||||||||||||||||||||||||||
| Codename | N18P-G62 Max-Q | |||||||||||||||||||||||||||||||||
| Architecture | Turing | |||||||||||||||||||||||||||||||||
| Pipelines | 1024 - unified | |||||||||||||||||||||||||||||||||
| Core Speed | 1035 - 1200 (Boost) MHz | |||||||||||||||||||||||||||||||||
| Memory Speed | 10000 MHz | |||||||||||||||||||||||||||||||||
| Memory Bus Width | 128 Bit | |||||||||||||||||||||||||||||||||
| Memory Type | GDDR6 | |||||||||||||||||||||||||||||||||
| Max. Amount of Memory | 4 GB | |||||||||||||||||||||||||||||||||
| Shared Memory | no | |||||||||||||||||||||||||||||||||
| API | DirectX 12_1, OpenGL 4.6 | |||||||||||||||||||||||||||||||||
| Power Consumption | 35 Watt | |||||||||||||||||||||||||||||||||
| Man. Technology | 12 nm | |||||||||||||||||||||||||||||||||
| Notebook Size | medium sized | |||||||||||||||||||||||||||||||||
| Date of Announcement | 02.04.2020 | |||||||||||||||||||||||||||||||||
| Link to Manufacturer Page | www.nvidia.com | |||||||||||||||||||||||||||||||||
The following benchmarks stem from our benchmarks of review laptops. The performance depends on the used graphics memory, clock rate, processor, system settings, drivers, and operating systems. So the results don't have to be representative for all laptops with this GPU. For detailed information on the benchmark results, click on the fps number.


| low | med. | high | ultra | QHD | 4K | |
|---|---|---|---|---|---|---|
| Cyberpunk 2077 1.0 | 63.7 | 33 | 26.8 | 22.2 | ||
| Immortals Fenyx Rising | 74 | 47 | 35 | 29 | 24 | 14 |
| Yakuza Like a Dragon | 101 | 45 | 43 | 38 | 25.4 | 12.4 |
| Call of Duty Black Ops Cold War | 100 | 55.6 | 44.1 | 40.2 | 25.8 | 10.6 |
| Assassin´s Creed Valhalla | 61 | 38 | 25 | 10 | 12 | 5 |
| Watch Dogs Legion | 80 | 49 | 41 | 16 | 14 | |
| FIFA 21 | 210 | 202 | 192.9 | 165.2 | 129.6 | 79.6 |
| Star Wars Squadrons | 222 | 124 | 112.9 | 103.4 | 70 | 30.7 |
| Mafia Definitive Edition | 93.9 | 46.2 | 43 | 27.9 | 14.1 | |
| Serious Sam 4 | 105 | 50 | 39 | 26 | 22.3 | |
| Crysis Remastered | 154.1 | 59.8 | 31.9 | 23.6 | ||
| Horizon Zero Dawn | 90 | 50 | 40 | 36 | 30 | 8 |
| Death Stranding | 93 | 57 | 54 | 52 | 35.9 | 16.8 |
| F1 2020 | 211 | 107 | 82 | 57 | 41 | 22 |
| Gears Tactics | 162.9 | 73.7 | 44.4 | 33.4 | 23.5 | 13.5 |
| Doom Eternal | 145.1 | 91.2 | 52.6 | |||
| Hunt Showdown | 115.7 | 50.1 | 41.8 | |||
| Escape from Tarkov | 120.7 | 71.2 | 52.8 | 47 | ||
| Star Wars Jedi Fallen Order | 63.3 | 53.2 | 46 | |||
| Need for Speed Heat | 61.8 | 49.3 | 45.8 | 33.9 | ||
| GRID 2019 | 114 | 76.9 | 64.3 | 27.5 | ||
| Ghost Recon Breakpoint | 74 | 45 | 34 | 22 | ||
| Borderlands 3 | 102.8 | 52.6 | 34.7 | 26.1 | ||
| Control | 104.7 | 39.2 | 29.1 | |||
| F1 2019 | 171 | 89 | 71 | 62 | ||
| Total War: Three Kingdoms | 165 | 58 | 35 | 24 | ||
| Anno 1800 | 89.4 | 65.8 | 41.1 | 21.5 | ||
| The Division 2 | 93 | 51 | 41 | 30 | ||
| Dirt Rally 2.0 | 195.9 | 63.1 | 55.1 | 38.1 | ||
| Far Cry New Dawn | 89 | 56 | 53 | 49 | ||
| Metro Exodus | 83.1 | 40.1 | 29.8 | 23.2 | ||
| Apex Legends | 143.7 | 86.2 | 68.7 | 62.9 | ||
| Assassin´s Creed Odyssey | 63 | 49 | 41 | 19 | ||
| Shadow of the Tomb Raider | 106 | 57 | 48 | 40 | 15 | |
| Strange Brigade | 184 | 76 | 61 | 52 | 35 | 21.4 |
| Far Cry 5 | 102 | 55 | 51 | 48 | 33 | 16 |
| X-Plane 11.11 | 90 | 78 | 67 | 47 | ||
| Final Fantasy XV Benchmark | 85 | 44 | 31 | 19.3 | 10.1 | |
| Rise of the Tomb Raider | 127 | 96 | 59 | 49 | 21 | |
| Dota 2 Reborn | 137 | 120 | 113 | 106 | 50 | |
| The Witcher 3 | 168 | 102 | 55 | 32 | 20 | |
| GTA V | 165 | 155 | 84 | 43 | 26 | 24.8 |
| low | med. | high | ultra | QHD | 4K | < 30 fps < 60 fps < 120 fps ≥ 120 fps | 25 16 | 24 14 4 | 4 28 9 1 | 13 18 4 1 | 10 5 1 1 | 16 3 1 |
For more games that might be playable and a list of all games and graphics cards visit our Gaming List

HP Envy 14-eb0021tx: Intel Core i7-1165G7, 14.00", 1.5 kg
External Review » HP Envy 14-eb0021tx
Razer Blade Stealth 13 2021 OLED: Intel Core i7-1165G7, 13.30", 1.5 kg
External Review » Razer Blade Stealth 13 2021 OLED
MSI Summit E14 A11SCS: Intel Core i7-1185G7, 14.00", 1.3 kg
External Review » MSI Summit E14 A11SCS
MSI Prestige 14 A11SCS-036DC: Intel Core i7-1185G7, 14.00", 1.3 kg
External Review » MSI Prestige 14 A11SCS-036DC
MSI GF63 Thin 10SCSR-1051XES: Intel Core i7-10750H, 15.60", 1.9 kg
External Review » MSI GF63 Thin 10SCSR-1051XES
Asus ROG Flow X13 GV301QH-K6200T: AMD Ryzen 9 5900HS, 13.40", 1.3 kg
External Review » Asus ROG Flow X13 GV301QH-K6200T
HP Envy 14-eb0003ns: Intel Core i7-1165G7, 14.00", 1.5 kg
External Review » HP Envy 14-eb0003ns
MSI Summit E15 A11SCS-091AU: Intel Core i7-1185G7, 15.60", 1.7 kg
External Review » MSI Summit E15 A11SCS-091AU
MSI GF63 Thin 10SCSR-876XES: Intel Core i7-10750H, 15.60", 1.9 kg
External Review » MSI GF63 Thin 10SCSR-876XES
MSI Prestige 15 A11SCS-033XES: Intel Core i7-1185G7, 15.60", 1.7 kg
External Review » MSI Prestige 15 A11SCS-033XES
HP Envy 14-eb0775ng: Intel Core i7-1165G7, 14.00", 1.5 kg
External Review » HP Envy 14-eb0775ng
Razer Blade Stealth i7-1165G7 GTX 1650 Ti Max-Q: Intel Core i7-1165G7, 13.30", 1.4 kg
External Review » Razer Blade Stealth i7-1165G7 GTX 1650 Ti Max-Q
MSI Summit E15 A11SCST-067RU: Intel Core i7-1185G7, 15.60", 1.8 kg
External Review » MSI Summit E15 A11SCST-067RU
Acer ConceptD 3 Ezel CC314-72G-7513: Intel Core i7-10750H, 14.00", 1.8 kg
External Review » Acer ConceptD 3 Ezel CC314-72G-7513
MSI Summit E15 A11SCST-227ID: Intel Core i7-1185G7, 15.60"
External Review » MSI Summit E15 A11SCST-227ID
Lenovo ThinkBook 15p IMH-20V30009GE: Intel Core i7-10750H, 15.60", 1.9 kg
External Review » Lenovo ThinkBook 15p IMH-20V30009GE
MSI Summit E15 A11SCST: Intel Core i7-1185G7, 15.60", 1.8 kg
External Review » MSI Summit E15 A11SCST
HP Envy 14-eb0010nr: Intel Core i5-1135G7, 14.00", 1.6 kg
External Review » HP Envy 14-eb0010nr
Lenovo ThinkPad X1 Extreme G3, i7-10850H, 1650 Ti Max-Q: Intel Core i7-10850H, 15.60", 1.7 kg
External Review » Lenovo ThinkPad X1 Extreme G3, i7-1850H, 1650 Ti Max-Q
Lenovo ThinkPad X1 Extreme G3-20TK000NGE: Intel Core i9-10885H, 15.60", 1.7 kg
External Review » Lenovo ThinkPad X1 Extreme G3-20TK000NGE
Asus ZenBook Pro 15 UX535LI-E3089T: Intel Core i7-10750H, 15.60", 1.8 kg
External Review » Asus ZenBook Pro 15 UX535LI-E3089T
HP Spectre x360 15-eb0036ng: Intel Core i7-10750H, 15.60", 1.9 kg
External Review » HP Spectre x360 15-eb0036ng
Acer ConceptD 3 Ezel: Intel Core i7-10750H, 15.60", 2 kg
External Review » Acer ConceptD 3 Ezel
MSI GF63 10SCSR-243: Intel Core i7-10750H, 15.60", 1.9 kg
External Review » MSI GF63 10SCSR-243
Dell XPS 15 9500 i7-10750H, 1650 Ti Max-Q: Intel Core i7-10750H, 15.60", 2.1 kg
External Review » Dell XPS 15 9500 i7-10750H, 1650 Ti Max-Q
Razer Blade Stealth 2020, i7-1065G7, GTX 1650 Ti Max-Q: Intel Core i7-1065G7, 13.30", 1.4 kg
External Review » Razer Blade Stealth 2020, i7-1065G7, GTX 1650 Ti Max-Q
» Comparison of GPUs
Detailed list of all laptop GPUs sorted by class and performance.
» Benchmark List
Sort and restrict laptop GPUs based on performance in synthetic benchmarks.
» Notebook Gaming List
Playable games for each graphics card and their average FPS results.
* Approximate position of the graphics adapter
» Notebookcheck多媒体笔记本电脑Top 10排名
» Notebookcheck游戏笔记本电脑Top 10排名
» Notebookcheck低价办公/商务笔记本电脑Top 10排名
» Notebookcheck高端办公/商务笔记本电脑Top 10排名
» Notebookcheck工作站笔记本电脑Top 10排名
» Notebookcheck亚笔记本电脑Top 10排名
» Notebookcheck超级本产品Top 10排名
» Notebookcheck变形本产品Top 10排名
» Notebookcheck平板电脑Top 10排名
» Notebookcheck智能手机Top 10排名
» Notebookcheck评测过最出色的笔记本电脑屏幕
» Notebookcheck售价500欧元以下笔记本电脑Top 10排名
» Notebookcheck售价300欧元以下笔记本电脑Top 10排名