Notebookcheck Logo

NVIDIA GeForce RTX 4080 Laptop GPU

NVIDIA NVIDIA GeForce RTX 4080 Laptop GPU

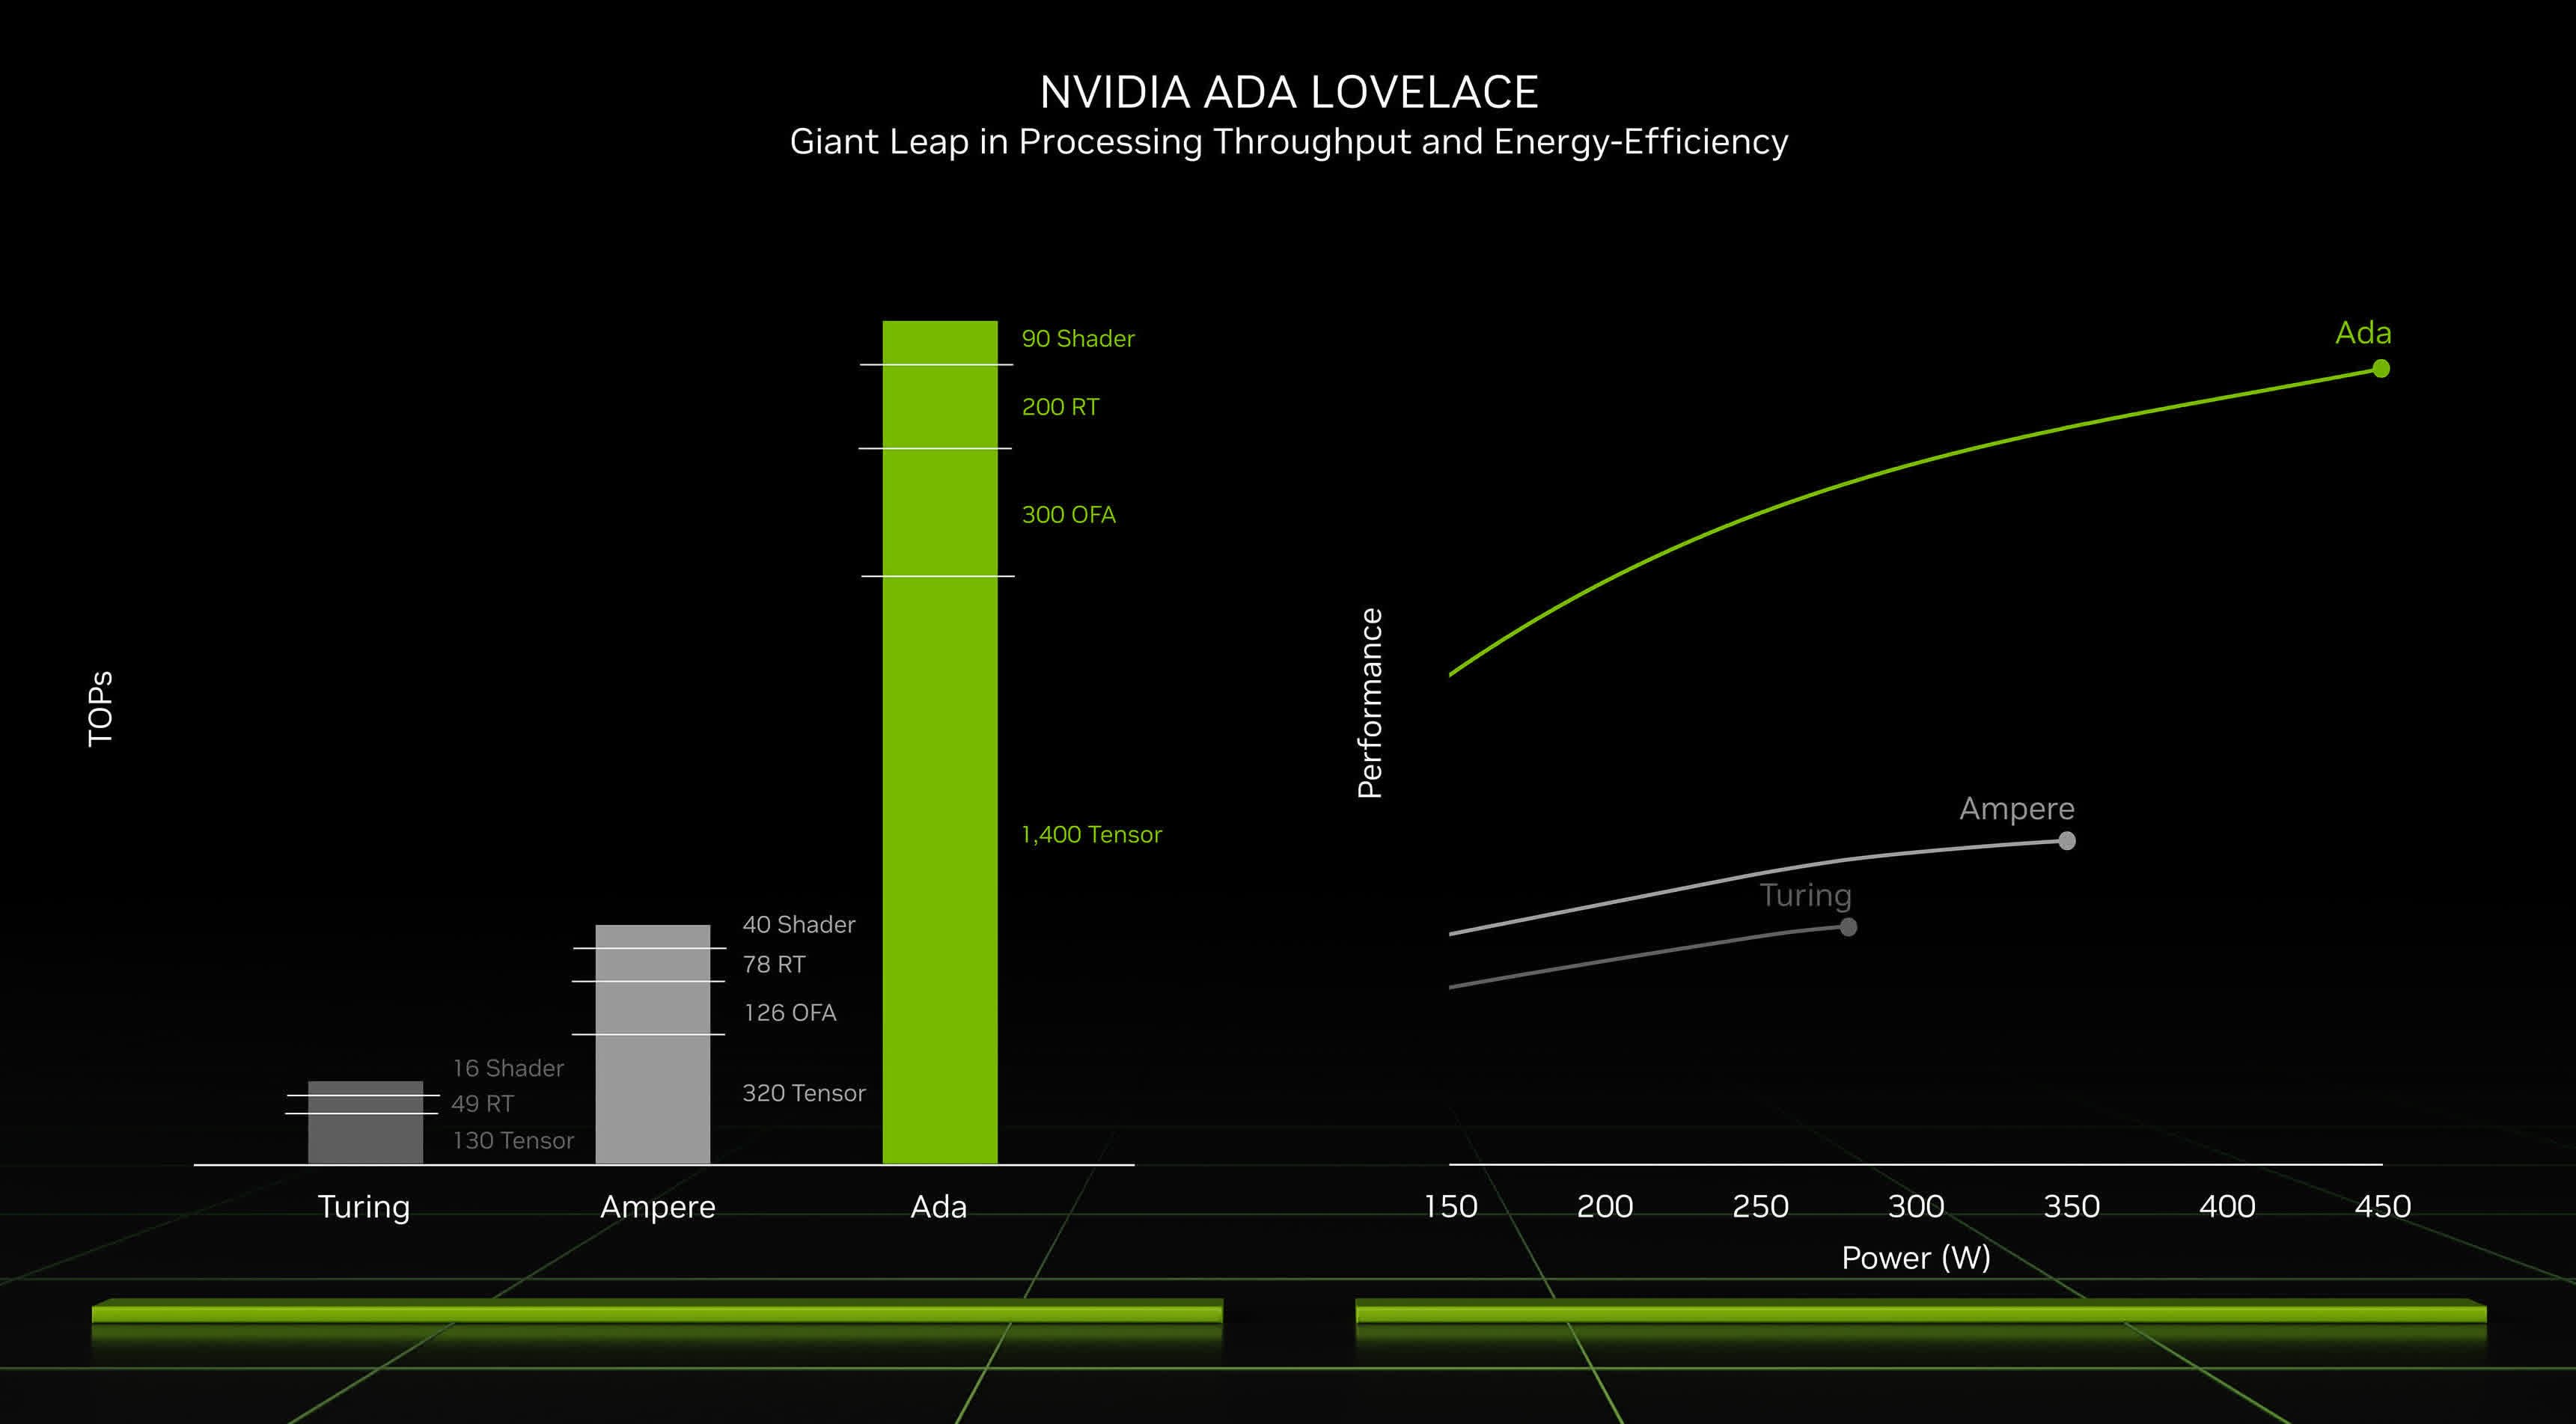
NVIDIA GeForce RTX 4080 笔记本电脑 GPU(代号 GN21-X9)是一款高端笔记本电脑 GPU。它与桌面RTX 4070 Ti一样基于AD104芯片,并使用Ada Lovelace架构。 AD104 芯片最多提供 7.680 个着色器(例如 RTX 4070 Ti 台式机),RTX 4080 笔记本电脑使用 7.424 个着色器和 192 位内存总线。 RTX 4080 移动版使用 12 GB GDDR6 专用显卡内存,时钟速度为 16 或 20 Gbps(有效)。 TGP(总显卡功率)可配置为 60 至 150 瓦(+ CPU 的 25 瓦动态升压),从而实现不同的性能级别(桌面 RTX 4070 Ti 使用 285 瓦进行比较)。升压时钟速度范围为 1350 MHz(60 瓦 TGP 时)至 2280 MHz(150W)。因此,性能也很大程度上取决于笔记本电脑中 RTX 4080 移动设备使用的电源设置。

在我们的测试中,RTX 4080 的综合性能明显高于移动 RTX 3080 Ti,只有移动 RTX 4090 才能超越。在实际游戏中,我们发现即使是启用光线追踪的要求较高的游戏(例如 F1 23)也可以在 QHD 和最大设置。像《博德之门 3》这样要求不高的游戏可以在 4k 分辨率下流畅运行(参见下面的结果)。

RTX 4080 提供 232 个张量核心(第四代),支持 DLSS 3,包括支持游戏的帧生成。此外,58 个光线追踪核心(第 4 代)可用于支持的游戏中的光线追踪效果。

AD103芯片由台积电5nm工艺制造(4N工艺)。

GeForce RTX 4000 Laptop GPU Series

NVIDIA GeForce RTX 4090 Laptop GPU 9728 @ 2.04 GHz256 Bit @ 20000 MHz
NVIDIA GeForce RTX 4080 Laptop GPU 7424 @ 1.86 - 2.28 GHz192 Bit @ 20000 MHz
NVIDIA GeForce RTX 4070 Laptop GPU 4608 @ 1.61 - 2.18 GHz128 Bit @ 16000 MHz
NVIDIA GeForce RTX 4060 Laptop GPU 3072 @ 2.37 GHz128 Bit @ 16000 MHz
NVIDIA GeForce RTX 4050 Laptop GPU 2560 @ 2.37 GHz96 Bit @ 16000 MHz
CodenameGN21-X9
ArchitectureAda Lovelace
Pipelines7424 - unified
TMUs232
ROPs80
Raytracing Cores58
Tensor / AI Cores232
Core Speed1860 - 2280 (Boost) MHz
CacheL2: 48 MB
Memory Speed20000 effective = 2250 MHz
Memory Bus Width192 Bit
Memory TypeGDDR6X
Max. Amount of Memory12 GB
Shared Memoryno
APIDirectX 12 Ultimate, Shader 6.7, OpenGL 4.6, OpenCL 3.0, Vulkan 1.3
Power Consumption150 Watt (60 - 150 Watt TGP)
Transistor Count76.3 Billion
technology5 nm
PCIe4.0 x16
Displays4 Displays (max.), HDMI 2.1, DisplayPort 1.4a
Notebook Sizelarge
Date of Announcement03.01.2023
Link to Manufacturer Pagewww.nvidia.com
PredecessorGeForce RTX 3080 Laptop GPU

Benchmarks

Performance Rating - 3DMark 11 + Fire Strike + Time Spy
18.7 pt (56%)
3DMark - 3DMark Time Spy Score
min: 13636     avg: 17113     median: 17382.5 (50%)     max: 19518 Points
3DMark - 3DMark Time Spy Graphics
min: 13282     avg: 17657     median: 18429 (49%)     max: 19663 Points
3DMark - 3DMark Ice Storm Unlimited Graphics
703825 Points (80%)
3DMark - 3DMark Ice Storm Extreme Graphics
609033 Points (78%)
3DMark - 3DMark Cloud Gate Score
min: 51266     avg: 61338     median: 61168 (65%)     max: 72794 Points
3DMark - 3DMark Cloud Gate Graphics
min: 92134     avg: 133526     median: 131005 (34%)     max: 167815 Points
3DMark - 3DMark Fire Strike Standard Score
min: 27191     avg: 32028     median: 32187 (57%)     max: 36245 Points
3DMark - 3DMark Fire Strike Standard Graphics
min: 33058     avg: 40733     median: 41117.5 (46%)     max: 45220 Points
3DMark - 3DMark Ice Storm Graphics
min: 299645     avg: 551719     median: 662599 (79%)     max: 692914 Points
3DMark - 3DMark Night Raid
min: 46491     avg: 66926     median: 74909 (71%)     max: 79377 Points
3DMark - 3DMark Night Raid Graphics Score
min: 70607     avg: 145723     median: 180680 (70%)     max: 185882 Points
3DMark 11 - 3DM11 Performance Score
min: 33542     avg: 41557     median: 42156.5 (58%)     max: 46847 Points
3DMark 11 - 3DM11 Performance GPU
min: 45199     avg: 56546     median: 57701.5 (50%)     max: 63128 Points
3DMark Vantage
3DM Vant. Perf. total +
3DMark Vantage - 3DM Vant. Perf. total
111294 Points (32%)
3DM Vant. Perf. GPU no PhysX +
3DMark 06 3DMark 06 - Standard 1280x1024 +
3DMark 06
min: 57725     avg: 58652     median: 58651.5 (77%)     max: 59578 Points
Blender - Blender 3.3 Classroom CUDA *
min: 21     avg: 23     median: 22 (3%)     max: 28 Seconds
Blender - Blender 3.3 Classroom OPTIX *
min: 13     avg: 15.3     median: 15 (6%)     max: 20 Seconds
SPECviewperf 12
specvp12 sw-03 +
SPECviewperf 12 - specvp12 sw-03
88.8 fps (22%)
specvp12 snx-02 +
SPECviewperf 12 - specvp12 snx-02
27.2 fps (4%)
specvp12 showcase-01 +
specvp12 mediacal-01 +
SPECviewperf 12 - specvp12 mediacal-01
104.1 fps (27%)
specvp12 maya-04 +
SPECviewperf 12 - specvp12 maya-04
231.8 fps (63%)
specvp12 energy-01 +
SPECviewperf 12 - specvp12 energy-01
28.3 fps (25%)
specvp12 creo-01 +
SPECviewperf 12 - specvp12 creo-01
86.9 fps (35%)
specvp12 catia-04 +
SPECviewperf 12 - specvp12 catia-04
152.6 fps (25%)
SPECviewperf 13 specvp13 sw-04 +
SPECviewperf 13 - specvp13 sw-04
min: 131.36     avg: 132.9     median: 132.9 (36%)     max: 134.49 fps
specvp13 snx-03 +
SPECviewperf 13 - specvp13 snx-03
min: 28.76     avg: 38.8     median: 38.8 (4%)     max: 48.87 fps
specvp13 showcase-02 +
SPECviewperf 13 - specvp13 showcase-02
min: 157.24     avg: 180.3     median: 180.3 (39%)     max: 203.33 fps
specvp13 medical-02 +
SPECviewperf 13 - specvp13 medical-02
min: 90.1     avg: 99     median: 99 (21%)     max: 107.84 fps
specvp13 maya-05 +
SPECviewperf 13 - specvp13 maya-05
min: 449.44     avg: 472.2     median: 472.2 (54%)     max: 494.88 fps
specvp13 energy-02 +
SPECviewperf 13 - specvp13 energy-02
min: 51.45     avg: 56.4     median: 56.4 (18%)     max: 61.32 fps
specvp13 creo-02 +
SPECviewperf 13 - specvp13 creo-02
min: 348.81     avg: 363.2     median: 363.2 (53%)     max: 377.58 fps
specvp13 catia-05 +
SPECviewperf 13 - specvp13 catia-05
min: 223.45     avg: 228.4     median: 228.4 (25%)     max: 233.27 fps
specvp13 3dsmax-06 +
SPECviewperf 13 - specvp13 3dsmax-06
min: 284.41     avg: 315.3     median: 315.3 (55%)     max: 346.23 fps
SPECviewperf 2020 specvp2020 solidworks-07 1080p +
SPECviewperf 2020 - specvp2020 solidworks-07 1080p
369.5 fps (99%)
specvp2020 solidworks-05 1080p +
SPECviewperf 2020 - specvp2020 solidworks-05 1080p
min: 343.3     avg: 380.5     median: 391 (76%)     max: 420.83 fps
specvp2020 snx-04 1080p +
SPECviewperf 2020 - specvp2020 snx-04 1080p
min: 30     avg: 34.5     median: 30.8 (5%)     max: 48.5 fps
specvp2020 medical-03 1080p +
SPECviewperf 2020 - specvp2020 medical-03 1080p
min: 41.9     avg: 45.4     median: 45 (32%)     max: 49.97 fps
specvp2020 maya-06 1080p +
SPECviewperf 2020 - specvp2020 maya-06 1080p
min: 448.27     avg: 516     median: 511.8 (75%)     max: 556.6 fps
specvp2020 energy-03 1080p +
SPECviewperf 2020 - specvp2020 energy-03 1080p
min: 50.3     avg: 57.8     median: 60.2 (49%)     max: 64.1 fps
specvp2020 creo-03 1080p +
SPECviewperf 2020 - specvp2020 creo-03 1080p
min: 110.1     avg: 121.9     median: 122.1 (60%)     max: 132.8 fps
specvp2020 catia-06 1080p +
SPECviewperf 2020 - specvp2020 catia-06 1080p
min: 85.39     avg: 91.9     median: 92.6 (60%)     max: 98.79 fps
specvp2020 3dsmax-07 1080p +
SPECviewperf 2020 - specvp2020 3dsmax-07 1080p
min: 148.7     avg: 163     median: 159.4 (72%)     max: 177.9 fps
specvp2020 solidworks-05 4k +
SPECviewperf 2020 - specvp2020 solidworks-05 4k
min: 160.12     avg: 162.2     median: 162.2 (48%)     max: 164.32 fps
specvp2020 snx-04 4k +
SPECviewperf 2020 - specvp2020 snx-04 4k
min: 23.93     avg: 29.2     median: 29.1 (3%)     max: 34.36 fps
specvp2020 medical-03 4k +
SPECviewperf 2020 - specvp2020 medical-03 4k
min: 17.83     avg: 18.6     median: 18.6 (18%)     max: 19.3 fps
specvp2020 maya-06 4k +
SPECviewperf 2020 - specvp2020 maya-06 4k
min: 263.3     avg: 283.1     median: 283.1 (46%)     max: 302.82 fps
specvp2020 energy-03 4k +
SPECviewperf 2020 - specvp2020 energy-03 4k
min: 30.03     avg: 39.6     median: 39.6 (9%)     max: 49.12 fps
specvp2020 creo-03 4k +
SPECviewperf 2020 - specvp2020 creo-03 4k
min: 99.16     avg: 102.2     median: 102.2 (48%)     max: 105.26 fps
specvp2020 catia-06 4k +
SPECviewperf 2020 - specvp2020 catia-06 4k
min: 46.58     avg: 49.5     median: 49.5 (32%)     max: 52.5 fps
specvp2020 3dsmax-07 4k +
SPECviewperf 2020 - specvp2020 3dsmax-07 4k
min: 99.53     avg: 108.6     median: 108.6 (45%)     max: 117.66 fps
Cinebench R10 Cinebench R10 Shading (32bit) +
Cinebench R10 - Cinebench R10 Shading (32bit)
24367 points (17%)
Cinebench R11.5 Cinebench R11.5 OpenGL 64 Bit +
Cinebench R11.5 - Cinebench R11.5 OpenGL 64 Bit
188.4 fps (65%)
Cinebench R15
Cinebench R15 OpenGL 64 Bit +
Cinebench R15 - Cinebench R15 OpenGL 64 Bit
min: 165.3     avg: 260.1     median: 271 (16%)     max: 327 fps
Cinebench R15 OpenGL Ref. Match 64 Bit +
Cinebench R15 - Cinebench R15 OpenGL Ref. Match 64 Bit
99.6 % (100%)
GFXBench - GFXBench 5.0 4K Aztec Ruins High Tier Offscreen
min: 197.2     avg: 204.6     median: 204.6 (83%)     max: 212 fps
GFXBench - GFXBench 5.0 Aztec Ruins High Tier Offscreen
min: 446.1     avg: 465.6     median: 465.6 (85%)     max: 485 fps
3.3 -99%
...
Apple M1 Max 24-Core GPU
240 -48%
242.3 -48%
248.5 -47%
261.5 -44%
288.5 -38%
Apple M1 Max 32-Core GPU
309.4 -34%
326.1 -30%
397.6 -15%
431 -7%
NVIDIA GeForce RTX 4080 Laptop GPU
465.6
536 15%
0%
100%
GFXBench - GFXBench 5.0 Aztec Ruins Normal Tier Offscreen
1017 fps (75%)
Basemark GPU 1.2 - Basemark GPU 1.2 Vulkan Official Medium Offscreen 1080
min: 104.6     avg: 904     median: 253 (2%)     max: 2066 fps
Basemark GPU 1.2 - Basemark GPU 1.2 Vulkan Official High Offscreen 2160
min: 3.64     avg: 5.9     median: 3.6 (1%)     max: 19.6 fps
Geekbench 6.2 - Geekbench 6.2 GPU OpenCL
min: 136770     avg: 161434     median: 162744 (47%)     max: 181484 points
Geekbench 6.2 - Geekbench 6.2 GPU Vulkan
min: 6750     avg: 90366     median: 109438 (36%)     max: 151861 points
LuxMark v2.0 64Bit - LuxMark v2.0 Room GPU
min: 5882     avg: 6685     median: 6684.5 (30%)     max: 7487 Samples/s
LuxMark v2.0 64Bit - LuxMark v2.0 Sala GPU
min: 12572     avg: 14842     median: 14841.5 (26%)     max: 17111 Samples/s
Power Consumption - Furmark Stress Test Power Consumption - external Monitor *
min: 69.9     avg: 210.2     median: 234 (33%)     max: 266 Watt
0153045607590105120135150165180195210225240255270Tooltip
Power Consumption - The Witcher 3 Power Consumption - external Monitor *
min: 143.5     avg: 231.1     median: 244 (34%)     max: 283 Watt
020406080100120140160180200220240260280300Tooltip
Power Consumption - Witcher 3 Power Consumption *
min: 144     avg: 236.6     median: 247 (54%)     max: 289 Watt
020406080100120140160180200220240260280300Tooltip
Power Consumption - Witcher 3 ultra Power Efficiency
min: 0.595     avg: 0.7     median: 0.7 (62%)     max: 0.942 fps per Watt
Power Consumption - Witcher 3 ultra Power Efficiency - external Monitor
min: 0.619     avg: 0.7     median: 0.7 (59%)     max: 0.99 fps per Watt
Emissions Witcher 3 Fan Noise +
Emissions - Witcher 3 Fan Noise
min: 45     avg: 52.8     median: 52.8 (85%)     max: 62 dB(A)
Clock Speed - GPU Clock Witcher 3 ultra
min: 1665     avg: 2183     median: 2332.5 (91%)     max: 2400 MHz
- Range of benchmark values for this graphics card
- Average benchmark values for this graphics card
* Smaller numbers mean a higher performance

Game Benchmarks

The following benchmarks stem from our benchmarks of review laptops. The performance depends on the used graphics memory, clock rate, processor, system settings, drivers, and operating systems. So the results don't have to be representative for all laptops with this GPU. For detailed information on the benchmark results, click on the fps number.

med. 1920x1080
140.7  fps    + Compare + 📈 Graph
high 1920x1080
118.8  fps    + Compare + 📈 Graph
ultra 1920x1080
95.1  fps    + Compare + 📈 Graph
QHD 2560x1440
61  fps    + Compare + 📈 Graph
4K 3840x2160
31.9  fps    + Compare + 📈 Graph
3840x2160
35  fps    + Compare + 📈 Graph
» With all tested laptops playable in detail settings ultra.
F1 24

F1 24

2024
low 1920x1080
226 227 ~ 227 fps    + Compare
med. 1920x1080
228 236 283 ~ 249 fps    + Compare
high 1920x1080
210 242 ~ 226 fps    + Compare
ultra 1920x1080
85.3 96 ~ 91 fps    + Compare
QHD 2560x1440
59.1 65 ~ 62 fps    + Compare
4K 3840x2160
33  fps    + Compare
3840x2160
54  fps    + Compare
» With all tested laptops playable in detail settings ultra.
Additional Benchmarks
Ultra High Preset + Quality DLSS 16xAF 2560x1440
86.3
Ultra High Preset + Quality FSR 16xAF 2560x1440
92.5
low 1920x1080
96.9  fps    + Compare + 📈 Graph
med. 1920x1080
81.5  fps    + Compare + 📈 Graph
high 1920x1080
62.3  fps    + Compare + 📈 Graph
QHD 2560x1440
44.7  fps    + Compare + 📈 Graph
4K 3840x2160
24.9  fps    + Compare + 📈 Graph
3840x2160
42.8  fps    + Compare + 📈 Graph
» With all tested laptops playable in detail settings high.
med. 1920x1080
100.2  fps    + Compare + 📈 Graph
high 1920x1080
97.8  fps    + Compare + 📈 Graph
ultra 1920x1080
82.7  fps    + Compare + 📈 Graph
QHD 2560x1440
64.5  fps    + Compare + 📈 Graph
4K 3840x2160
39.8  fps    + Compare + 📈 Graph
3840x2160
59.7  fps    + Compare + 📈 Graph
» With all tested laptops playable in detail settings ultra.
low 1920x1080
70.5  fps    + Compare + 📈 Graph
high 1920x1080
68.5  fps    + Compare + 📈 Graph
QHD 2560x1440
67.7  fps    + Compare + 📈 Graph
4K 3840x2160
49.1  fps    + Compare + 📈 Graph
3840x2160
56.7  fps    + Compare + 📈 Graph
» With all tested laptops playable in detail settings high.
low 1920x1080
153.3  fps    + Compare + 📈 Graph
med. 1920x1080
103.5 145.5 ~ 125 fps    + Compare + 📈 Graph
high 1920x1080
91.3 108.1 ~ 100 fps    + Compare + 📈 Graph
ultra 1920x1080
89.2 103.5 ~ 96 fps    + Compare + 📈 Graph
QHD 2560x1440
71 83.7 ~ 77 fps    + Compare + 📈 Graph
4K 3840x2160
39.5 45.8 ~ 43 fps    + Compare + 📈 Graph
3840x2160
56.1 61.2 ~ 59 fps    + Compare + 📈 Graph
3840x2160
54.8  fps    + Compare + 📈 Graph
» With all tested laptops playable in detail settings ultra.
Additional Benchmarks
Very Low Preset 1280x720
168
low 1920x1080
202 249 ~ 226 fps    + Compare + 📈 Graph
med. 1920x1080
199 230 ~ 215 fps    + Compare + 📈 Graph
high 1920x1080
194 214 ~ 204 fps    + Compare + 📈 Graph
ultra 1920x1080
120 176.4 ~ 148 fps    + Compare + 📈 Graph
QHD 2560x1440
86 91.6 ~ 89 fps    + Compare + 📈 Graph
4K 3840x2160
25  fps    + Compare
3840x2160
74  fps    + Compare
» With all tested laptops playable in detail settings ultra.
Additional Benchmarks
Low Preset 1280x720
263
low 1920x1080
248  fps    + Compare + 📈 Graph
med. 1920x1080
163.5 237 ~ 200 fps    + Compare + 📈 Graph
high 1920x1080
159.2 229 ~ 194 fps    + Compare + 📈 Graph
ultra 1920x1080
156.5 204 ~ 180 fps    + Compare + 📈 Graph
QHD 2560x1440
127.4 139 ~ 133 fps    + Compare + 📈 Graph
4K 3840x2160
60  fps    + Compare + 📈 Graph
» With all tested laptops playable in detail settings ultra.
Additional Benchmarks
Very Low Preset 1280x720
272
low 1920x1080
155 161 ~ 158 fps    + Compare
med. 1920x1080
117 151 168 ~ 145 fps    + Compare
high 1920x1080
115 135 144 ~ 131 fps    + Compare
ultra 1920x1080
96 112 115 ~ 108 fps    + Compare
QHD 2560x1440
76 89 91 ~ 85 fps    + Compare
4K 3840x2160
49 50 ~ 50 fps    + Compare
3840x2160
70  fps    + Compare
» With all tested laptops playable in detail settings ultra.
Additional Benchmarks
Low Preset TAA 1280x720
179
175
low 1920x1080
110.6 114.3 ~ 112 fps    + Compare + 📈 Graph
med. 1920x1080
109.5 110.4 ~ 110 fps    + Compare + 📈 Graph
high 1920x1080
103.9 106.5 ~ 105 fps    + Compare + 📈 Graph
ultra 1920x1080
100.8 106.4 132.3 ~ 113 fps    + Compare + 📈 Graph
QHD 2560x1440
85.7 96.8 106 ~ 96 fps    + Compare + 📈 Graph
4K 3840x2160
59.6  fps    + Compare + 📈 Graph
» With all tested laptops playable in detail settings ultra.
Additional Benchmarks
Low Preset 1280x720
115.1
low 1920x1080
103.3  fps    + Compare + 📈 Graph
med. 1920x1080
90.9 104.4 ~ 98 fps    + Compare + 📈 Graph
high 1920x1080
77.7 87.6 ~ 83 fps    + Compare + 📈 Graph
ultra 1920x1080
67.6 72.2 82.6 ~ 74 fps    + Compare + 📈 Graph
QHD 2560x1440
52.8 55.4 64.5 ~ 58 fps    + Compare + 📈 Graph
4K 3840x2160
32.6  fps    + Compare + 📈 Graph
3840x2160
52  fps    + Compare + 📈 Graph
» With all tested laptops playable in detail settings ultra.
Additional Benchmarks
Max. Performance 1280x720
162.9
Palworld

Palworld

2024
med. 1920x1080
162.3  fps    + Compare + 📈 Graph
high 1920x1080
133.5  fps    + Compare + 📈 Graph
ultra 1920x1080
130.8  fps    + Compare + 📈 Graph
QHD 2560x1440
106.7  fps    + Compare + 📈 Graph
4K 3840x2160
61  fps    + Compare + 📈 Graph
3840x2160
83  fps    + Compare + 📈 Graph
» With all tested laptops playable in detail settings ultra.
med. 1920x1080
357  fps    + Compare + 📈 Graph
high 1920x1080
356  fps    + Compare + 📈 Graph
ultra 1920x1080
356  fps    + Compare + 📈 Graph
QHD 2560x1440
355  fps    + Compare + 📈 Graph
4K 3840x2160
289  fps    + Compare + 📈 Graph
» With all tested laptops playable in detail settings ultra.
low 1920x1080
267  fps    + Compare + 📈 Graph
med. 1920x1080
127.6 226 ~ 177 fps    + Compare + 📈 Graph
high 1920x1080
121.5 219 ~ 170 fps    + Compare + 📈 Graph
ultra 1920x1080
118.6 135.1 202 ~ 152 fps    + Compare + 📈 Graph
QHD 2560x1440
102.1 112.5 128 ~ 114 fps    + Compare + 📈 Graph
4K 3840x2160
60.4  fps    + Compare + 📈 Graph
3840x2160
119.2  fps    + Compare + 📈 Graph
» With all tested laptops playable in detail settings ultra.
low 1920x1080
188.9  fps    + Compare + 📈 Graph
med. 1920x1080
175.5 179.3 ~ 177 fps    + Compare + 📈 Graph
high 1920x1080
170.7 174.8 ~ 173 fps    + Compare + 📈 Graph
ultra 1920x1080
143.9 171.4 192.5 ~ 169 fps    + Compare + 📈 Graph
QHD 2560x1440
104.7 125.5 128.5 ~ 120 fps    + Compare + 📈 Graph
4K 3840x2160
60.3  fps    + Compare + 📈 Graph
3840x2160
102.5  fps    + Compare + 📈 Graph
» With all tested laptops playable in detail settings ultra.
Additional Benchmarks
Low Preset 1280x720
209
Epic Preset + Epic RTX Global Illumination 1920x1080
158.9
147.8
181.5
low 1920x1080
141 141.4 ~ 141 fps    + Compare + 📈 Graph
med. 1920x1080
126 130 131.6 ~ 129 fps    + Compare + 📈 Graph
high 1920x1080
111 114 115.2 ~ 113 fps    + Compare + 📈 Graph
ultra 1920x1080
87 88.3 89 ~ 88 fps    + Compare + 📈 Graph
QHD 2560x1440
59 59 59.3 ~ 59 fps    + Compare + 📈 Graph
4K 3840x2160
30  fps    + Compare
3840x2160
53  fps    + Compare
» With all tested laptops playable in detail settings ultra.
Additional Benchmarks
Low Preset TAA 1280x720
195
199.3
low 1920x1080
224  fps    + Compare
med. 1920x1080
193 205 ~ 199 fps    + Compare
high 1920x1080
164 167 ~ 166 fps    + Compare
ultra 1920x1080
153 161 ~ 157 fps    + Compare
QHD 2560x1440
110 121 ~ 116 fps    + Compare
4K 3840x2160
77  fps    + Compare
3840x2160
87  fps    + Compare
» With all tested laptops playable in detail settings ultra.
Additional Benchmarks
Minimum Preset 1280x720
283
med. 1920x1080
115.1  fps    + Compare + 📈 Graph
high 1920x1080
107.3  fps    + Compare + 📈 Graph
ultra 1920x1080
97.8  fps    + Compare + 📈 Graph
QHD 2560x1440
94.3  fps    + Compare + 📈 Graph
4K 3840x2160
57.3  fps    + Compare + 📈 Graph
3840x2160
81.2  fps    + Compare + 📈 Graph
» With all tested laptops playable in detail settings ultra.
low 1920x1080
110.7  fps    + Compare + 📈 Graph
med. 1920x1080
107.1  fps    + Compare + 📈 Graph
high 1920x1080
76.7 100.7 100.8 ~ 93 fps    + Compare + 📈 Graph
QHD 2560x1440
66.8 70.4 71 ~ 69 fps    + Compare + 📈 Graph
4K 3840x2160
34.9 37.8 ~ 36 fps    + Compare + 📈 Graph
3840x2160
34.3 39.8 ~ 37 fps    + Compare + 📈 Graph
» With all tested laptops playable in detail settings high.
Additional Benchmarks
High Preset + High Ray Tracing 1920x1080
52.3
42.9
med. 1920x1080
121.6  fps    + Compare + 📈 Graph
high 1920x1080
91.2  fps    + Compare + 📈 Graph
ultra 1920x1080
65.8  fps    + Compare + 📈 Graph
QHD 2560x1440
45.9  fps    + Compare + 📈 Graph
4K 3840x2160
23.9  fps    + Compare + 📈 Graph
3840x2160
44.6  fps    + Compare + 📈 Graph
» With all tested laptops playable in detail settings ultra.
med. 1920x1080
281  fps    + Compare
high 1920x1080
192  fps    + Compare
ultra 1920x1080
154  fps    + Compare
QHD 2560x1440
136  fps    + Compare
4K 3840x2160
74.5  fps    + Compare
» With all tested laptops playable in detail settings ultra.
low 1920x1080
208  fps    + Compare
med. 1920x1080
183 207 ~ 195 fps    + Compare
high 1920x1080
176 199 ~ 188 fps    + Compare
ultra 1920x1080
129 157 ~ 143 fps    + Compare
QHD 2560x1440
112 136 ~ 124 fps    + Compare
4K 3840x2160
68  fps    + Compare
3840x2160
92  fps    + Compare
» With all tested laptops playable in detail settings ultra.
Additional Benchmarks
Low Preset (Adaptive Quality Off) 1280x720
229
med. 1920x1080
216  fps    + Compare + 📈 Graph
high 1920x1080
177.9  fps    + Compare + 📈 Graph
ultra 1920x1080
167.2  fps    + Compare + 📈 Graph
QHD 2560x1440
163.4  fps    + Compare + 📈 Graph
4K 3840x2160
125.2  fps    + Compare + 📈 Graph
» With all tested laptops playable in detail settings ultra.
med. 1920x1080
215  fps    + Compare + 📈 Graph
high 1920x1080
207  fps    + Compare + 📈 Graph
ultra 1920x1080
184.6  fps    + Compare + 📈 Graph
QHD 2560x1440
148.5  fps    + Compare + 📈 Graph
4K 3840x2160
89.7  fps    + Compare + 📈 Graph
» With all tested laptops playable in detail settings ultra.
low 1920x1080
111.3 121.5 143.4 152.3 170.4 ~ 140 fps    + Compare
med. 1920x1080
96.4 118.7 131 135.3 137.2 159.8 ~ 130 fps    + Compare
high 1920x1080
94.1 103.8 109 121 126.7 127.1 141.3 ~ 118 fps    + Compare
ultra 1920x1080
83.9 90.9 99.7 107.9 109.2 113 118.3 118.6 123.1 127.1 ~ 109 fps    + Compare
QHD 2560x1440
56.2 59.9 71.3 71.4 75.4 77 77.6 79.1 79.4 86.3 ~ 73 fps    + Compare
4K 3840x2160
25.8 30.9 32.5 36.6 39.8 ~ 33 fps    + Compare
3840x2160
48.4 52.5 53.7 ~ 52 fps    + Compare
» With all tested laptops playable in detail settings ultra.
Additional Benchmarks
Low Preset (FSR off) 1280x720
161.7
122.5
161.4
173.8
126.6
Ray Tracing Ultra Preset (DLSS off) 1920x1080
62.1
54.4
46.4
45.9
64.4
43.8
54.9
65.4
62.4
58.4
Steam Deck 1280x720
160.4
93.8
157.8
122.7
Ultra Preset (FSR on) 1920x1080
107.9
105.5
121.1
94.6
117.7
125.5
103.2
Ray Tracing Ultra Preset (DLSS off, no Path Tracing) 3840x2160
19.3
16
30min Start Ultra Preset (FSR off) 1920x1080
84.5
Lies of P

Lies of P

2023
med. 1920x1080
246  fps    + Compare + 📈 Graph
high 1920x1080
226  fps    + Compare + 📈 Graph
ultra 1920x1080
209  fps    + Compare + 📈 Graph
QHD 2560x1440
150.6  fps    + Compare + 📈 Graph
4K 3840x2160
76.3  fps    + Compare + 📈 Graph
3840x2160
117.9  fps    + Compare + 📈 Graph
» With all tested laptops playable in detail settings ultra.
med. 1920x1080
60  fps    + Compare
high 1920x1080
60  fps    + Compare
ultra 1920x1080
60  fps    + Compare
QHD 2560x1440
60  fps    + Compare
4K 3840x2160
57  fps    + Compare
» With all tested laptops playable in detail settings ultra.
Starfield

Starfield

2023
med. 1920x1080
90.5  fps    + Compare + 📈 Graph
high 1920x1080
75.1  fps    + Compare + 📈 Graph
ultra 1920x1080
67.1  fps    + Compare + 📈 Graph
QHD 2560x1440
56.3  fps    + Compare + 📈 Graph
4K 3840x2160
38.4  fps    + Compare + 📈 Graph
» With all tested laptops playable in detail settings ultra.
med. 1920x1080
111.7  fps    + Compare + 📈 Graph
high 1920x1080
112.1  fps    + Compare + 📈 Graph
ultra 1920x1080
111.2  fps    + Compare + 📈 Graph
QHD 2560x1440
107.1  fps    + Compare + 📈 Graph
4K 3840x2160
70.2  fps    + Compare + 📈 Graph
» With all tested laptops playable in detail settings ultra.
high 1920x1080
83.5  fps    + Compare + 📈 Graph
ultra 1920x1080
70  fps    + Compare + 📈 Graph
QHD 2560x1440
52.7  fps    + Compare + 📈 Graph
4K 3840x2160
30.9  fps    + Compare + 📈 Graph
3840x2160
63.9  fps    + Compare + 📈 Graph
» With all tested laptops playable in detail settings ultra.
med. 1920x1080
127.8  fps    + Compare + 📈 Graph
high 1920x1080
115.2  fps    + Compare + 📈 Graph
ultra 1920x1080
113.7  fps    + Compare + 📈 Graph
QHD 2560x1440
109.6  fps    + Compare + 📈 Graph
4K 3840x2160
80.8  fps    + Compare + 📈 Graph
» With all tested laptops playable in detail settings ultra.
low 1920x1080
186.8 228.5 ~ 208 fps    + Compare
med. 1920x1080
172.9 178.4 204.3 ~ 185 fps    + Compare + 📈 Graph
high 1920x1080
158.6 161.2 183.5 ~ 168 fps    + Compare + 📈 Graph
ultra 1920x1080
124.8 149.7 159.4 181.2 ~ 154 fps    + Compare + 📈 Graph
QHD 2560x1440
88.7 111.5 124.3 129.3 ~ 113 fps    + Compare + 📈 Graph
4K 3840x2160
48.8 55.7 65 68.4 ~ 59 fps    + Compare + 📈 Graph
3840x2160
90.9 104.4 ~ 98 fps    + Compare + 📈 Graph
» With all tested laptops playable in detail settings ultra.
med. 1920x1080
151.8  fps    + Compare + 📈 Graph
high 1920x1080
124  fps    + Compare + 📈 Graph
ultra 1920x1080
107.3  fps    + Compare + 📈 Graph
QHD 2560x1440
91.1  fps    + Compare + 📈 Graph
4K 3840x2160
57.9  fps    + Compare + 📈 Graph
» With all tested laptops playable in detail settings ultra.
Additional Benchmarks
Very High Preset + Very High Raytracing TAA 1920x1080
75.8
Very High Preset + Very High Raytracing + DLSS Quality + FG 3840x2160
36.6
F1 23

F1 23

2023
low 1920x1080
236 310 329 ~ 292 fps    + Compare
med. 1920x1080
238 281 326 329 ~ 294 fps    + Compare
high 1920x1080
227 265 295 304 ~ 273 fps    + Compare
ultra 1920x1080
90.8 101 111 111.3 ~ 104 fps    + Compare
QHD 2560x1440
60 70 71 73 ~ 69 fps    + Compare
4K 3840x2160
35 65.1 ~ 50 fps    + Compare
3840x2160
60  fps    + Compare
» With all tested laptops playable in detail settings ultra.
Additional Benchmarks
Ultra Low Preset TAA 1280x720
300
218
277
Diablo 4

Diablo 4

2023
low 1920x1080
345  fps    + Compare + 📈 Graph
med. 1920x1080
339  fps    + Compare + 📈 Graph
high 1920x1080
322  fps    + Compare + 📈 Graph
ultra 1920x1080
280  fps    + Compare + 📈 Graph
QHD 2560x1440
187.7  fps    + Compare + 📈 Graph
4K 3840x2160
99.3  fps    + Compare + 📈 Graph
3840x2160
133.4  fps    + Compare + 📈 Graph
» With all tested laptops playable in detail settings ultra.
med. 1920x1080
108.7  fps    + Compare + 📈 Graph
high 1920x1080
105.7  fps    + Compare + 📈 Graph
ultra 1920x1080
102.2  fps    + Compare + 📈 Graph
QHD 2560x1440
72.5  fps    + Compare + 📈 Graph
4K 3840x2160
35.3  fps    + Compare + 📈 Graph
» With all tested laptops playable in detail settings ultra.
Additional Benchmarks
Epic Preset + Ray Tracing 1920x1080
76.9
med. 1920x1080
219  fps    + Compare + 📈 Graph
high 1920x1080
206  fps    + Compare + 📈 Graph
ultra 1920x1080
201  fps    + Compare + 📈 Graph
QHD 2560x1440
172.1  fps    + Compare + 📈 Graph
4K 3840x2160
82.1  fps    + Compare + 📈 Graph
» With all tested laptops playable in detail settings ultra.
med. 1920x1080
126.8  fps    + Compare + 📈 Graph
high 1920x1080
117.9  fps    + Compare + 📈 Graph
ultra 1920x1080
107.6  fps    + Compare + 📈 Graph
QHD 2560x1440
76.3  fps    + Compare + 📈 Graph
4K 3840x2160
33.6  fps    + Compare + 📈 Graph
» With all tested laptops playable in detail settings ultra.
med. 1920x1080
192.8  fps    + Compare + 📈 Graph
high 1920x1080
182.1  fps    + Compare + 📈 Graph
ultra 1920x1080
130.8  fps    + Compare + 📈 Graph
QHD 2560x1440
96.4  fps    + Compare + 📈 Graph
4K 3840x2160
55.1  fps    + Compare + 📈 Graph
» With all tested laptops playable in detail settings ultra.
low 1920x1080
275  fps    + Compare
med. 1920x1080
244.6  fps    + Compare
high 1920x1080
206.5  fps    + Compare
ultra 1920x1080
205.3  fps    + Compare
QHD 2560x1440
153.8  fps    + Compare
» With all tested laptops playable in detail settings ultra.
Additional Benchmarks
Minimum Settings 1280x720
313.9
low 1920x1080
78.1  fps    + Compare + 📈 Graph
med. 1920x1080
75  fps    + Compare + 📈 Graph
high 1920x1080
74.6  fps    + Compare + 📈 Graph
ultra 1920x1080
69.7  fps    + Compare + 📈 Graph
QHD 2560x1440
66.8  fps    + Compare + 📈 Graph
» With all tested laptops playable in detail settings ultra.
Additional Benchmarks
Ultra Low Preset 1280x720
78.6
low 1920x1080
170.8  fps    + Compare + 📈 Graph
med. 1920x1080
142.3  fps    + Compare + 📈 Graph
high 1920x1080
121.1  fps    + Compare + 📈 Graph
ultra 1920x1080
100.3  fps    + Compare + 📈 Graph
QHD 2560x1440
79.2  fps    + Compare + 📈 Graph
» With all tested laptops playable in detail settings ultra.
Additional Benchmarks
Low Preset 1280x720
174.5
Returnal

Returnal

2023
low 1920x1080
116 128 148 150 ~ 136 fps    + Compare
med. 1920x1080
117 122 147 148 ~ 134 fps    + Compare
high 1920x1080
114 117 136 137 ~ 126 fps    + Compare
ultra 1920x1080
107 107 109 121 ~ 111 fps    + Compare
QHD 2560x1440
79 80 91 92 ~ 86 fps    + Compare
4K 3840x2160
43 44 53 ~ 47 fps    + Compare
» With all tested laptops playable in detail settings ultra.
Additional Benchmarks
Low Preset 1280x720
161
Epic Preset + Epic Ray-Tracing 1920x1080
102
low 1920x1080
173 207 ~ 190 fps    + Compare
med. 1920x1080
157 178.5 ~ 168 fps    + Compare
high 1920x1080
134 137 161.6 ~ 144 fps    + Compare
ultra 1920x1080
108 116 131 ~ 118 fps    + Compare
QHD 2560x1440
76 81 102 ~ 86 fps    + Compare
4K 3840x2160
43  fps    + Compare
» With all tested laptops playable in detail settings ultra.
Additional Benchmarks
Low Preset Low TAA 1280x720
172
Ultra Preset + Full Ray Tracing High TAA 1920x1080
53
66
med. 1920x1080
121.5  fps    + Compare + 📈 Graph
high 1920x1080
113.3  fps    + Compare + 📈 Graph
ultra 1920x1080
109.3  fps    + Compare + 📈 Graph
QHD 2560x1440
81.8  fps    + Compare + 📈 Graph
4K 3840x2160
41.3  fps    + Compare + 📈 Graph
» With all tested laptops playable in detail settings ultra.
med. 1920x1080
161.4  fps    + Compare + 📈 Graph
high 1920x1080
144  fps    + Compare + 📈 Graph
ultra 1920x1080
125.3  fps    + Compare + 📈 Graph
QHD 2560x1440
81.1  fps    + Compare + 📈 Graph
4K 3840x2160
42.8  fps    + Compare + 📈 Graph
» With all tested laptops playable in detail settings ultra.
Additional Benchmarks
RT Ultra Preset / On FXAA 1920x1080
55.2
med. 1920x1080
214  fps    + Compare + 📈 Graph
high 1920x1080
162.8  fps    + Compare + 📈 Graph
ultra 1920x1080
148.4  fps    + Compare + 📈 Graph
QHD 2560x1440
100.6  fps    + Compare + 📈 Graph
4K 3840x2160
42.6  fps    + Compare + 📈 Graph
» With all tested laptops playable in detail settings ultra.
low 1920x1080
167.6 177.8 ~ 173 fps    + Compare
med. 1920x1080
153.7 159.8 ~ 157 fps    + Compare
high 1920x1080
119.9 148.3 ~ 134 fps    + Compare
ultra 1920x1080
111.5 120.4 ~ 116 fps    + Compare
QHD 2560x1440
83.7 93.1 ~ 88 fps    + Compare
4K 3840x2160
55.3  fps    + Compare
» With all tested laptops playable in detail settings ultra.
Additional Benchmarks
Low Preset (without FSR Upscaling) 1280x720
174.5
Ultra Preset (without FSR Upscaling) + Full Ray-Tracing 1920x1080
62.2
med. 1920x1080
101.2  fps    + Compare + 📈 Graph
high 1920x1080
94.7  fps    + Compare + 📈 Graph
ultra 1920x1080
83  fps    + Compare + 📈 Graph
QHD 2560x1440
79.7  fps    + Compare + 📈 Graph
4K 3840x2160
63.6  fps    + Compare + 📈 Graph
» With all tested laptops playable in detail settings ultra.
med. 1920x1080
115.2  fps    + Compare + 📈 Graph
high 1920x1080
103.3  fps    + Compare + 📈 Graph
ultra 1920x1080
101.3  fps    + Compare + 📈 Graph
QHD 2560x1440
94.8  fps    + Compare + 📈 Graph
4K 3840x2160
68.5  fps    + Compare + 📈 Graph
» With all tested laptops playable in detail settings ultra.
Additional Benchmarks
Very High Preset + Ray-Tracing TAA 1920x0180
85.9
med. 1920x1080
182  fps    + Compare
high 1920x1080
149 154 ~ 152 fps    + Compare
ultra 1920x1080
126 139 140 145 148 167 ~ 144 fps    + Compare
QHD 2560x1440
93 104 108 108 110 124 ~ 108 fps    + Compare
4K 3840x2160
55 65 67 67 ~ 64 fps    + Compare
» With all tested laptops playable in detail settings ultra.
med. 1920x1080
102.3  fps    + Compare + 📈 Graph
high 1920x1080
100.3  fps    + Compare + 📈 Graph
ultra 1920x1080
99.5  fps    + Compare + 📈 Graph
QHD 2560x1440
86.5  fps    + Compare + 📈 Graph
4K 3840x2160
54.1  fps    + Compare + 📈 Graph
» With all tested laptops playable in detail settings ultra.
med. 1920x1080
110.9  fps    + Compare + 📈 Graph
high 1920x1080
97.7  fps    + Compare + 📈 Graph
ultra 1920x1080
86  fps    + Compare + 📈 Graph
QHD 2560x1440
63.4  fps    + Compare + 📈 Graph
4K 3840x2160
36.1  fps    + Compare + 📈 Graph
» With all tested laptops playable in detail settings ultra.
FIFA 23

FIFA 23

2022
med. 1920x1080
165  fps    + Compare
high 1920x1080
158  fps    + Compare
ultra 1920x1080
160  fps    + Compare
QHD 2560x1440
155  fps    + Compare
» With all tested laptops playable in detail settings ultra.
med. 1920x1080
206  fps    + Compare + 📈 Graph
high 1920x1080
174.1  fps    + Compare + 📈 Graph
ultra 1920x1080
142  fps    + Compare + 📈 Graph
QHD 2560x1440
102.5  fps    + Compare + 📈 Graph
4K 3840x2160
48.7  fps    + Compare + 📈 Graph
» With all tested laptops playable in detail settings ultra.
F1 22

F1 22

2022
low 1920x1080
219 237 251 (!) 255 261 265 312 323 323 339 ~ 279 fps    + Compare
med. 1920x1080
211 235 245 (!) 247 248 259 260 294 296 324 334 ~ 268 fps    + Compare
high 1920x1080
185.7 202 203 204 (!) 222 228 231 244 245 263 285 287 297 ~ 238 fps    + Compare
ultra 1920x1080
72.3 (!) 81.2 81.5 91.1 97.5 98.3 100.7 101 108.5 110 115.4 117 117.1 124.2 ~ 101 fps    + Compare
QHD 2560x1440
55.4 60.4 65.6 67.6 69.5 70.7 72 76.6 76.9 77.4 78.1 79 ~ 71 fps    + Compare
4K 3840x2160
25.8 29.7 35.5 36.6 38 39 39 39.5 39.6 ~ 36 fps    + Compare
» With all tested laptops playable in detail settings ultra.
Additional Benchmarks
Ultra Low Preset 16xAF TAA 1280x720
313
291 (!)
282
314
304
374
408
408
279
med. 1920x1080
266  fps    + Compare + 📈 Graph
high 1920x1080
239  fps    + Compare + 📈 Graph
ultra 1920x1080
221  fps    + Compare + 📈 Graph
QHD 2560x1440
195.5  fps    + Compare + 📈 Graph
4K 3840x2160
124.6  fps    + Compare + 📈 Graph
» With all tested laptops playable in detail settings ultra.
low 1920x1080
198.7  fps    + Compare
med. 1920x1080
159.6  fps    + Compare
high 1920x1080
154  fps    + Compare
ultra 1920x1080
145  fps    + Compare
QHD 2560x1440
135.9  fps    + Compare
4K 3840x2160
73.1  fps    + Compare
» With all tested laptops playable in detail settings ultra.
Additional Benchmarks
Lowest Settings 1280x720
205.8
Highest Settings + Maximum Ray Tracing 1920x1080
97
low 1920x1080
220.8 256.6 260.2 317.1 344 ~ 280 fps    + Compare
med. 1920x1080
199.6 217.3 232.5 265.9 297.1 ~ 242 fps    + Compare
high 1920x1080
166.7 177.1 183.3 201.1 212.8 ~ 188 fps    + Compare
ultra 1920x1080
112.9 118.6 144.5 144.9 145.2 156.4 160.8 167.1 ~ 144 fps    + Compare
QHD 2560x1440
85 89.3 99 102.6 105.3 111.1 112.9 114.8 ~ 102 fps    + Compare
4K 3840x2160
46.4 47.9 50.1 54.4 55.7 58.6 59 60.3 ~ 54 fps    + Compare
» With all tested laptops playable in detail settings ultra.
Additional Benchmarks
Lowest Preset (DX12) 1280x720
240.6
low 1920x1080
121.1 132.3 149.2 154 158 ~ 143 fps    + Compare
med. 1920x1080
118.1 127.1 142.6 150.9 151.4 ~ 138 fps    + Compare
high 1920x1080
105.2 113.8 123.5 124.4 136.8 137.5 141.2 ~ 126 fps    + Compare
ultra 1920x1080
94.9 106.2 116.7 121.4 128.3 133.6 135.8 ~ 120 fps    + Compare
QHD 2560x1440
63.4 77.6 81.2 82 84.4 84.5 88.6 ~ 80 fps    + Compare
4K 3840x2160
29 35.3 38.5 39.7 40 40.2 ~ 37 fps    + Compare
» With all tested laptops playable in detail settings ultra.
Additional Benchmarks
Low Preset 1280x720
121.4
Ray Tracing Ultra Preset (DLSS off) 1920x1080
65.3
50.7
Ray Tracing Ultra Preset (DLSS off) 3840x2160
19.3
14.4
Elex 2

Elex 2

2022
med. 1920x1080
118.7  fps    + Compare + 📈 Graph
high 1920x1080
118.7  fps    + Compare + 📈 Graph
ultra 1920x1080
118.5  fps    + Compare + 📈 Graph
QHD 2560x1440
114.5  fps    + Compare + 📈 Graph
4K 3840x2160
63  fps    + Compare + 📈 Graph
» With all tested laptops playable in detail settings ultra.
low 1920x1080
241  fps    + Compare
med. 1920x1080
220  fps    + Compare
high 1920x1080
199  fps    + Compare
ultra 1920x1080
187  fps    + Compare
QHD 2560x1440
158  fps    + Compare
» With all tested laptops playable in detail settings ultra.
med. 1920x1080
59.9  fps    + Compare + 📈 Graph
high 1920x1080
59.8  fps    + Compare + 📈 Graph
ultra 1920x1080
59.8  fps    + Compare + 📈 Graph
QHD 2560x1440
59.6  fps    + Compare + 📈 Graph
4K 3840x2160
59.3  fps    + Compare + 📈 Graph
» With all tested laptops playable in detail settings ultra.
low 1920x1080
184.1  fps    + Compare
med. 1920x1080
160.4  fps    + Compare
high 1920x1080
140.9  fps    + Compare
QHD 2560x1440
97.8  fps    + Compare
4K 3840x2160
48.6  fps    + Compare
» With all tested laptops playable in detail settings high.
Additional Benchmarks
Low Quality 1280x720
255.8
High Quality Raytracing 1920x1080
83.9
med. 1920x1080
278  fps    + Compare
high 1920x1080
272  fps    + Compare
ultra 1920x1080
221  fps    + Compare
QHD 2560x1440
172  fps    + Compare
4K 3840x2160
88  fps    + Compare
» With all tested laptops playable in detail settings ultra.
med. 1920x1080
160.6  fps    + Compare + 📈 Graph
high 1920x1080
137.7  fps    + Compare + 📈 Graph
ultra 1920x1080
101.4  fps    + Compare + 📈 Graph
QHD 2560x1440
86.7  fps    + Compare + 📈 Graph
4K 3840x2160
60  fps    + Compare + 📈 Graph
» With all tested laptops playable in detail settings ultra.
med. 1920x1080
239  fps    + Compare + 📈 Graph
high 1920x1080
209  fps    + Compare + 📈 Graph
ultra 1920x1080
197.5  fps    + Compare + 📈 Graph
QHD 2560x1440
150.7  fps    + Compare + 📈 Graph
4K 3840x2160
88.6  fps    + Compare + 📈 Graph
» With all tested laptops playable in detail settings ultra.
med. 1920x1080
263  fps    + Compare + 📈 Graph
high 1920x1080
217  fps    + Compare + 📈 Graph
ultra 1920x1080
194.4  fps    + Compare + 📈 Graph
QHD 2560x1440
191.6  fps    + Compare + 📈 Graph
4K 3840x2160
145.2  fps    + Compare + 📈 Graph
» With all tested laptops playable in detail settings ultra.
med. 1920x1080
172  fps    + Compare
high 1920x1080
169  fps    + Compare
ultra 1920x1080
168  fps    + Compare
QHD 2560x1440
133  fps    + Compare
4K 3840x2160
76  fps    + Compare
» With all tested laptops playable in detail settings ultra.
med. 1920x1080
165  fps    + Compare
high 1920x1080
165  fps    + Compare
ultra 1920x1080
163  fps    + Compare
QHD 2560x1440
146  fps    + Compare
4K 3840x2160
96  fps    + Compare
» With all tested laptops playable in detail settings ultra.
Additional Benchmarks
Ultra Preset + Ultra Ray-Tracing 1920x1080
124
med. 1920x1080
345  fps    + Compare + 📈 Graph
high 1920x1080
295  fps    + Compare + 📈 Graph
ultra 1920x1080
276  fps    + Compare + 📈 Graph
QHD 2560x1440
188.4  fps    + Compare + 📈 Graph
4K 3840x2160
112  fps    + Compare + 📈 Graph
» With all tested laptops playable in detail settings ultra.
Far Cry 6

Far Cry 6

2021
low 1280x720
181  fps    + Compare
med. 1920x1080
149  fps    + Compare
high 1920x1080
134  fps    + Compare
ultra 1920x1080
118 121 125 130 ~ 124 fps    + Compare
QHD 2560x1440
100 110 112 115 ~ 109 fps    + Compare
4K 3840x2160
61 70 71 73 ~ 69 fps    + Compare
» With all tested laptops playable in detail settings ultra.
Additional Benchmarks
Low Graphics Quality 1920x1080
167
Ultra Graphics Quality + HD Textures + DXR TAA 1920x1080
119
Deathloop

Deathloop

2021
med. 1920x1080
130.5  fps    + Compare + 📈 Graph
high 1920x1080
129.4  fps    + Compare + 📈 Graph
ultra 1920x1080
123.5  fps    + Compare + 📈 Graph
QHD 2560x1440
112.8  fps    + Compare + 📈 Graph
4K 3840x2160
60.7  fps    + Compare + 📈 Graph
» With all tested laptops playable in detail settings ultra.
Days Gone

Days Gone

2021
med. 1920x1080
243  fps    + Compare + 📈 Graph
high 1920x1080
215  fps    + Compare + 📈 Graph
ultra 1920x1080
171.3  fps    + Compare + 📈 Graph
QHD 2560x1440
125.1  fps    + Compare + 📈 Graph
4K 3840x2160
70.9  fps    + Compare + 📈 Graph
» With all tested laptops playable in detail settings ultra.
med. 1920x1080
239  fps    + Compare + 📈 Graph
high 1920x1080
239  fps    + Compare + 📈 Graph
ultra 1920x1080
239  fps    + Compare + 📈 Graph
QHD 2560x1440
193.7  fps    + Compare + 📈 Graph
4K 3840x2160
100.5  fps    + Compare + 📈 Graph
» With all tested laptops playable in detail settings ultra.
Additional Benchmarks
Ray Tracing Preset 1920x1080
179
Outriders

Outriders

2021
med. 1920x1080
157.7  fps    + Compare + 📈 Graph
high 1920x1080
151.1  fps    + Compare + 📈 Graph
ultra 1920x1080
149.9  fps    + Compare + 📈 Graph
QHD 2560x1440
130.5  fps    + Compare + 📈 Graph
4K 3840x2160
72.3  fps    + Compare + 📈 Graph
» With all tested laptops playable in detail settings ultra.
ultra 1920x1080
118  fps    + Compare
QHD 2560x1440
93  fps    + Compare
4K 3840x2160
55  fps    + Compare
» With all tested laptops playable in detail settings ultra.
low 1280x720
140  fps    + Compare
med. 1920x1080
129  fps    + Compare
high 1920x1080
121  fps    + Compare
ultra 1920x1080
110  fps    + Compare
QHD 2560x1440
93  fps    + Compare
4K 3840x2160
56  fps    + Compare
» With all tested laptops playable in detail settings ultra.
Additional Benchmarks
Ultra Preset + Ultra Ray Tracing (DX12) 1920x1080
80
low 1280x720
280.3  fps    + Compare
med. 1920x1080
184  fps    + Compare
high 1920x1080
171.3  fps    + Compare
QHD 2560x1440
121.6  fps    + Compare
4K 3840x2160
70.4  fps    + Compare
» With all tested laptops playable in detail settings high.
ultra 1920x1080
113 128 ~ 121 fps    + Compare
QHD 2560x1440
106 112 ~ 109 fps    + Compare
4K 3840x2160
62  fps    + Compare
3840x2160
86  fps    + Compare
» With all tested laptops playable in detail settings ultra.
Valorant

Valorant

2020
4K 3840x2160
336  fps    + Compare + 📈 Graph
low 1280x720
207.7  fps    + Compare
med. 1920x1080
176.6  fps    + Compare
high 1920x1080
158.1  fps    + Compare
ultra 1920x1080
133.5  fps    + Compare
QHD 2560x1440
108.7  fps    + Compare
4K 3840x2160
59.8  fps    + Compare
» With all tested laptops playable in detail settings ultra.
Additional Benchmarks
Very Low Overall Quality (DX11) 1920x1080
205.4
Control

Control

2019
low 1280x720
239.1  fps    + Compare
med. 1920x1080
204.7  fps    + Compare
high 1920x1080
157  fps    + Compare
QHD 2560x1440
102  fps    + Compare
4K 3840x2160
50.1  fps    + Compare
» With all tested laptops playable in detail settings high.
Additional Benchmarks
High Quality Preset & High Ray Tracing Preset (DX12) 1920x1080
104.7
low 1280x720
197  fps    + Compare
med. 1920x1080
170.4  fps    + Compare
high 1920x1080
145  fps    + Compare
ultra 1920x1080
121.7  fps    + Compare
QHD 2560x1440
102  fps    + Compare
4K 3840x2160
67  fps    + Compare
» With all tested laptops playable in detail settings ultra.
Additional Benchmarks
Ultra Quality DXR 16xAF 1920x1080
104.4
low 1280x720
228  fps    + Compare
med. 1920x1080
201  fps    + Compare
high 1920x1080
196  fps    + Compare
ultra 1920x1080
165 176 176 ~ 172 fps    + Compare
QHD 2560x1440
142 143 154 ~ 146 fps    + Compare
4K 3840x2160
79 84 84 ~ 82 fps    + Compare
» With all tested laptops playable in detail settings ultra.
Additional Benchmarks
Lowest Preset 1920x1080
220
Strange Brigade

Strange Brigade

2018
low 1280x720
324 382 388 413 427 438 444 469 497 499 505 538 562 572 ~ 461 fps    + Compare
med. 1920x1080
272 300 307 334 336 349 365 373 392 399 402 405 446 448 461 ~ 373 fps    + Compare
high 1920x1080
263 267 290 301 317 320 324 350 351 351 369 373 377 378 382 400 ~ 338 fps    + Compare
ultra 1920x1080
239 258 269 276 293 297 299 303 305 318 323 325 330 337 338 339 339 349 357 ~ 310 fps    + Compare
QHD 2560x1440
179.5 192.2 208 221 223 225 226 232 237 237 237 237 238 240 241 243 248 248 ~ 228 fps    + Compare
4K 3840x2160
100.9 103.1 112.9 116.7 120.5 121.5 122.3 123.1 123.2 144.3 ~ 119 fps    + Compare
» With all tested laptops playable in detail settings ultra.
Far Cry 5

Far Cry 5

2018
low 1280x720
137 160 160 183 199 ~ 168 fps    + Compare + 📈 Graph
med. 1920x1080
127 132 145 168 175 179 180 ~ 158 fps    + Compare + 📈 Graph
high 1920x1080
122 129 141 158 158 164 167 168 ~ 151 fps    + Compare + 📈 Graph
ultra 1920x1080
114 126 136 136 149 156 157 158 161 ~ 144 fps    + Compare + 📈 Graph
QHD 2560x1440
114 116 124 126 131 154 155 157 ~ 135 fps    + Compare + 📈 Graph
4K 3840x2160
71 75 91 91 97 ~ 85 fps    + Compare + 📈 Graph
» With all tested laptops playable in detail settings ultra.
Additional Benchmarks
Low Preset TAA 1920x1080
148
190
low 1280x720
134 137.7 138.1 145.3 169 171.1 171.1 172 172.4 174.1 177.3 185.6 192.2 196.4 198.2 199 201 204 211 ~ 176 fps    + Compare
med. 1920x1080
117.4 122 122.3 134.5 146.9 149 150.8 151.2 153.6 156.2 157.4 162.3 163.8 167.9 173.3 177.4 177.7 181 183.5 184.3 ~ 157 fps    + Compare
high 1920x1080
89.3 95.3 95.8 104.2 106.1 113.1 118.5 118.6 119.4 123.5 126.8 126.9 127.5 130.5 131.8 137 137.7 138.8 139.2 139.5 141.3 ~ 122 fps    + Compare
4K 3840x2160
78 82.8 90 90.5 95 102.3 103 110 117.5 118.1 143.7 ~ 103 fps    + Compare
» With all tested laptops playable in detail settings high.
low 1280x720
180.4 183.9 188 192.4 195.8 201 208 211 224 228 230 232 232 234 ~ 210 fps    + Compare
med. 1920x1080
152.8 166.9 169.3 173 180.1 184.1 192.1 194.9 195.5 201 207 211 218 219 225 ~ 193 fps    + Compare
high 1920x1080
129 134 135.3 139.8 145.4 148.5 152.9 153.9 157.8 160 162.4 163.1 163.4 164.2 167.6 168.1 173.1 178 178.8 182.1 ~ 158 fps    + Compare
QHD 2560x1440
98 102.6 105.8 117.5 118.7 119.6 120.1 120.6 120.8 123.3 124.3 128.3 131.6 131.6 132.4 136.6 138.1 139.3 142 ~ 124 fps    + Compare
4K 3840x2160
60.8 61.5 70.2 71.6 74.1 74.2 76.1 76.2 76.2 79.4 79.5 ~ 73 fps    + Compare
» With all tested laptops playable in detail settings high.
low 1280x720
155.7 176.2 178.8 180.4 187.4 191.8 206 208 213 215 215 217 218 229 229 233 234 247 ~ 207 fps    + Compare
med. 1366x768
142 152.4 161.7 164 169 173 180.5 188.9 189.1 191.6 191.8 193.2 194.8 204 205 206 211 211 216 ~ 187 fps    + Compare
high 1920x1080
139.2 140 146 154.8 155.8 159.7 164.2 167.2 173.8 177 177.7 180.4 181.1 186.7 192.7 193.9 194.4 196 197.3 202 ~ 174 fps    + Compare
ultra 1920x1080
133 136.2 138.3 145.6 146.8 147.3 153.7 155.3 163.4 164.7 165.2 165.9 169.4 175 177.4 179 180.7 183.5 186.4 194.7 ~ 163 fps    + Compare
4K 3840x2160
116.7 127.9 129.4 131 138.7 142.6 144.6 145.7 161 168.4 176.7 182.6 ~ 147 fps    + Compare
» With all tested laptops playable in detail settings ultra.
low 1024x768
364.4 425.6 453.2 459.7 485 573.1 581 605.7 609.6 628.4 640 642 ~ 539 fps    + Compare + 📈 Graph
med. 1366x768
340.7 352.7 384 400.5 407 452.2 462.7 509 513 513.3 518.3 539.8 568 ~ 459 fps    + Compare + 📈 Graph
high 1920x1080
246 274 287.8 292.1 296.5 306.5 325 342.2 349.3 353.5 365 368 382.9 384.6 ~ 327 fps    + Compare + 📈 Graph
ultra 1920x1080
130.4 142 145 160.2 163.4 164 164 166.3 169.7 172.2 172.4 174.9 175 175 175.9 176.8 178 183.3 185.6 186.1 ~ 168 fps    + Compare + 📈 Graph
QHD 2560x1440
102.5 131.4 140.1 142.6 153 ~ 134 fps    + Compare + 📈 Graph
4K 3840x2160
66 78.5 113.1 114.2 115 118.5 120.6 121.2 121.5 129.4 ~ 110 fps    + Compare
» With all tested laptops playable in detail settings ultra.
Additional Benchmarks
Ultra Graphics & Postprocessing (HBAO+) 3840x2160
80.8
74.5
Medium Graphics & Postprocessing 1920x1080
447
422
GTA V

GTA V

2015
low 1024x768
172.9 183.8 184.2 184.4 184.7 185.8 186.6 186.9 186.9 187.1 187.2 187.3 187.3 ~ 185 fps    + Compare
med. 1366x768
170 176.8 180.4 181.1 183.1 184.2 185.2 185.7 186.4 186.6 186.6 186.6 187.1 187.6 187.6 ~ 184 fps    + Compare
high 1920x1080
164.7 168.4 171.6 173.8 175.5 176.4 180.2 181.9 182.6 183 183.4 185.1 186.5 186.7 ~ 179 fps    + Compare
ultra 1920x1080
102.9 109.7 114 120.3 120.3 121.1 122.7 125.7 128.1 132.1 135.9 136.5 139 140.7 145.5 146.1 152 152.7 ~ 130 fps    + Compare
QHD 2560x1440
100 103.7 105.9 106.4 108.6 115.3 115.4 116 120.8 123.9 124.6 125.2 128.8 130.1 131.4 135.3 140.7 ~ 120 fps    + Compare
4K 3840x2160
120.3 123.9 142.8 142.9 143.7 144.6 158.6 159.7 ~ 142 fps    + Compare
» With all tested laptops playable in detail settings ultra.
Additional Benchmarks
Highest Settings possible 16xAF 4xMSAA + FXAA 3840x2160
62.1
58.5
63.3
67.5
65.1
52.3
51.6
67.3
Normal/Off 4xAF 1920x1080
180.4
185.7
187.1
180.4
185.3
185.3
186.4
169.3
181.8
176.8
187.1
186.9
185.4
184.7
180.9
187.3
187.7
Lowest Settings possible 1920x1080
184.5
187
185.7
187.2
187.2
174.9
186.4
179.8
187.7
185.8
184.3
187.4
187.8
lowmed.highultraQHD4K
The First Descendant140.7118.895.16131.9
F1 24227249226916233
Senua's Saga Hellblade 296.981.562.344.724.9
Ghost of Tsushima100.297.882.764.539.8
Dragon's Dogma 270.568.567.749.1
Horizon Forbidden West153.3125100967743
Alone in the Dark2262152041488925
Last Epoch24820019418013360
Skull & Bones1581451311088550
Helldivers 21121101051139659.6
Enshrouded103.39883745832.6
Palworld162.3133.5130.8106.761
Prince of Persia The Lost Crown357356356355289
Ready or Not26717717015211460.4
The Finals188.917717316912060.3
Avatar Frontiers of Pandora141129113885930
Call of Duty Modern Warfare 3 202322419916615711677
EA Sports WRC115.1107.397.894.357.3
Alan Wake 2110.7107.1936936
Lords of the Fallen121.691.265.845.923.9
Total War Pharaoh28119215413674.5
Assassin's Creed Mirage20819518814312468
EA Sports FC 24216177.9167.2163.4125.2
Counter-Strike 2215207184.6148.589.7
Cyberpunk 2077 2.1 Phantom Liberty1401301181097333
Lies of P246226209150.676.3
The Crew Motorfest6060606057
Starfield90.575.167.156.338.4
Armored Core 6111.7112.1111.2107.170.2
Immortals of Aveum83.57052.730.9
Atlas Fallen127.8115.2113.7109.680.8
Baldur's Gate 320818516815411359
Ratchet & Clank Rift Apart151.8124107.391.157.9
F1 232922942731046950
Diablo 4345339322280187.799.3
Star Wars Jedi Survivor108.7105.7102.272.535.3
Dead Island 2219206201172.182.1
The Last of Us126.8117.9107.676.333.6
Resident Evil 4 Remake192.8182.1130.896.455.1
Company of Heroes 3275244.6206.5205.31153.8
Sons of the Forest78.17574.669.766.8
Atomic Heart170.8142.3121.1100.379.2
Returnal1361341261118647
Hogwarts Legacy1901681441188643
Dead Space Remake121.5113.3109.381.841.3
The Witcher 3 v4.00161.4144125.381.142.8
High On Life214162.8148.4100.642.6
The Callisto Protocol1731571341168855.3
Need for Speed Unbound101.294.78379.763.6
Spider-Man Miles Morales115.2103.3101.394.868.5
Call of Duty Modern Warfare 2 202218215214410864
Uncharted Legacy of Thieves Collection102.3100.399.586.554.1
A Plague Tale Requiem110.997.78663.436.1
FIFA 23165158160155
The Quarry206174.1142102.548.7
F1 222792682381017136
Vampire Bloodhunt266239221195.5124.6
Ghostwire Tokyo198.7159.6154145135.973.1
Tiny Tina's Wonderlands28024218814410254
Cyberpunk 2077 1.61431381261208037
Elex 2118.7118.7118.5114.563
GRID Legends241220199187158
Elden Ring59.959.859.859.659.3
Dying Light 2184.1160.4140.997.848.6
Rainbow Six Extraction27827222117288
God of War160.6137.7101.486.760
Halo Infinite239209197.5150.788.6
Farming Simulator 22263217194.4191.6145.2
Riders Republic17216916813376
Guardians of the Galaxy16516516314696
Back 4 Blood345295276188.4112
Far Cry 618114913412410969
Deathloop130.5129.4123.5112.860.7
Days Gone243215171.3125.170.9
Resident Evil Village239239239193.7100.5
Outriders157.7151.1149.9130.572.3
Assassin´s Creed Valhalla1189355
Watch Dogs Legion1401291211109356
Mafia Definitive Edition280.3184171.3121.670.4
Horizon Zero Dawn12110962
Valorant336
Borderlands 3207.7176.6158.1133.5108.759.8
Control239.1204.715710250.1
Metro Exodus197170.4145121.710267
Shadow of the Tomb Raider22820119617214682
Strange Brigade461373338310228119
Far Cry 516815815114413585
X-Plane 11.11176157122103
Final Fantasy XV Benchmark21019315812473
Dota 2 Reborn207187174163147
The Witcher 3539459327168134110
GTA V185184179130120142
< 30 fps
< 60 fps
< 120 fps
≥ 120 fps


6
39

1
16
70

1
26
62

1
35
47

7
51
31
3
39
38
7

For more games that might be playable and a list of all games and graphics cards visit our Gaming List

v1.28
log 25. 10:58:57

#0 no ids found in url (should be separated by "_") +0s ... 0s

#1 not redirecting to Ajax server +0s ... 0s

#2 did not recreate cache, as it is less than 5 days old! Created at Thu, 25 Jul 2024 05:29:35 +0200 +0.001s ... 0.001s

#3 no comparison url found in template nbc.compare_page_1 needed +0.032s ... 0.033s

#4 no comparison url found in template nbc.compare_page_1 needed +0s ... 0.034s

#5 no comparison url found in template nbc.compare_page_1 needed +0s ... 0.034s

#6 no comparison url found in template nbc.compare_page_1 needed +0s ... 0.034s

#7 composed specs +0.001s ... 0.035s

#8 did output specs +0s ... 0.035s

#9 start showIntegratedCPUs +0s ... 0.035s

#10 getting avg benchmarks for device 11438 +0.024s ... 0.059s

#11 got single benchmarks 11438 +0.085s ... 0.144s

#12 got avg benchmarks for devices +0s ... 0.144s

#13 min, max, avg, median took s +1.136s ... 1.28s

#14 before gaming benchmark output +0.001s ... 1.28s

#15 Got 1444 rows for game benchmarks. +0.575s ... 1.855s

#16 composed SQL query for gamebenchmarks +0s ... 1.855s

#17 got data and put it in $dataArray +0.076s ... 1.931s

#18 benchmarks composed for output. +4.807s ... 6.738s

#19 no comparison url found in template nbc.compare_page_1 needed +0.01s ... 6.748s

#20 return log +0s ... 6.748s

Notebook reviews with NVIDIA GeForce RTX 4080 Laptop GPU graphics card

Alienware x16 R2 笔记本电脑评测:比 x16 R1 更进一步

Alienware x16 R2 笔记本电脑评测:比 x16 R1 更进一步

最新的 Alienware x16 R2 配备了新的集成式 NPU,用于 Windows AI 加速,但遗憾的是,这是以游戏性能为代价的。用户可能还是会因此考虑 2023 年的 Alienware x16 R1。...
Intel Core Ultra 9 185H | NVIDIA GeForce RTX 4080 Laptop GPU | 16.00" | 2.7 kg
华硕 ROG Strix Scar 16(2024)评测

华硕 ROG Strix Scar 16 (2024) 笔记本电脑评测:炽热性能和迷你 LED 光彩,价格合理

华硕 ROG Strix Scar 16 (2024) 是去年机型的迭代升级版,现在配备了酷睿 i9-14900HX 和 175 W RTX 4080 笔记本 GPU。Scar 16 继续秉承了华硕巅峰游戏性能的传统。不过,它也有一些不足之处,而且面临着同样性能的竞争对手,它们都在争夺你的血汗钱。...
Intel Core i9-14900HX | NVIDIA GeForce RTX 4080 Laptop GPU | 16.00" | 2.7 kg
联想Legion Pro 7 16 (2024) 评测:RTX 4080 笔记本电脑中的佼佼者

联想Legion Pro 7 16 (2024) 评测:RTX 4080 笔记本电脑中的佼佼者

16 英寸机型并不缺乏动力:GeForce RTX 4080 和酷睿 i9-14900HX 在我们的一些测试中取得了新的最佳成绩。其他规格同样引人注目:32 GB 内存、Thunderbolt 4、明亮的 QHD 显示屏(杜比视界、G-Sync、240Hz、DCI-P3 覆盖范围)。对于游戏玩家和创作者来说,这是一款完...
Intel Core i9-14900HX | NVIDIA GeForce RTX 4080 Laptop GPU | 16.00" | 2.7 kg
惠普 Omen 16 (2024) 评测:配备酷睿 i9 和 RTX 4080 的 QHD 游戏笔记本,售价 3,200 欧元

惠普 Omen 16 (2024) 评测:配备酷睿 i9 和 RTX 4080 的 QHD 游戏笔记本,售价 3,200 欧元

惠普的这款游戏笔记本电脑配备了酷睿 i9、RTX 4080、PCIe 4.0 固态硬盘(1 TB)、32 GB 内存、两个雷电 4 端口和 QHD 显示屏(G-Sync,240Hz),规格非常合适。尽管拥有强大的组件,但在正确设置的情况下,这款笔记本只会产生适量的噪音。...
Intel Core i9-14900HX | NVIDIA GeForce RTX 4080 Laptop GPU | 16.10" | 2.4 kg
微星 Vector 16 HX 笔记本电脑评测:泰坦性能而非泰坦价格

微星 Vector 16 HX 笔记本电脑评测:泰坦性能而非泰坦价格

轻薄型游戏笔记本电脑固然不错,但为了达到一定的尺寸和重量,它们往往会削减一些 GPU 性能。微星 Vector 16 HX 毫不掩饰地采用了大尺寸设计,以尽可能保留和提高图形处理性能。...
Intel Core i9-14900HX | NVIDIA GeForce RTX 4080 Laptop GPU | 16.00" | 2.7 kg

Lenovo ThinkPad P1 G6 21FV001KUS: Intel Core i7-13800H, 16.00", 1.9 kg
  Review » 联想 ThinkPad P1 G6 评测:80 瓦GeForce RTX 4080 超薄工作站

Asus Zenbook Pro 16X UX7602BZ-MY005W: Intel Core i9-13905H, 16.00", 2.4 kg
  Review » Zenbook Pro 16X (2023) 评测:华硕旗舰机的最强动力

Acer Predator Helios 18 N23Q2: Intel Core i9-13900HX, 18.00", 3.2 kg
  Review » 宏碁掠夺者 Helios 18 笔记本电脑评测:配备 MiniLED 显示屏的 RTX 4080 玩家,亮度超过 1,000 尼特

Alienware m16 R1 AMD: AMD Ryzen 9 7845HX, 16.00", 3.1 kg
  Review » AMD Ryzen 9 7845HX 性能首次亮相:Alienware m16 R1 笔记本电脑评测

HP Omen 16-wf000: Intel Core i7-13700HX, 16.10", 2.4 kg
  Review » 惠普Omen 16 2023笔记本电脑回顾:145 WGeForce RTX 4080性能

Alienware x16 R1: Intel Core i9-13900HK, 16.00", 2.6 kg
  Review » 英特尔酷睿i9-13900HK性能首次亮相:艾丽华x16 R1笔记本电脑评测

MSI Stealth 17 Studio A13VH-014: Intel Core i9-13900H, 17.30", 3 kg
  Review » MSI Stealth 17 Studio回顾:一个拥有安静的RTX4080的笔记本电脑,几乎适用于各种场合

HP Omen 17-ck2097ng: Intel Core i9-13900HX, 17.30", 2.8 kg
  Review » HP Omen 17 (2023)回顾:游戏笔记本使用RTX 4080

MSI GE78HX 13VH-070US: Intel Core i9-13950HX, 17.00", 3 kg
  Review » MSI Raider GE78 HX 13VH笔记本电脑评测。13代酷睿i9-13950HX和GeForce RTX 4080的升级版

Asus ROG Strix G16 G614JZ: Intel Core i9-13980HX, 16.00", 2.4 kg
  Review » 华硕ROG Strix G16 G614JZ笔记本电脑回顾。为RTX 4080清除舞台

Lenovo Legion Pro 7 16IRX8H: Intel Core i9-13900HX, 16.00", 2.7 kg
  Review » 联想Legion Pro 7 16IRX8H评论。高端的RTX4080性能强者

Razer Blade 16 Early 2023: Intel Core i9-13950HX, 16.00", 2.4 kg
  Review » Nvidia Ada RTX 40笔记本GPU分析:175W RTX 4090笔记本GPU在性能和功率效率方面超过了350W RTX 3090

  Review » 移动GeForce RTX 4080首次亮相。Razer Blade 16 Early 2023笔记本电脑评测

Acer Predator Helios 18 PH18-72: Intel Core i9-14900HX, 18.00", 3.3 kg
  External Review » Acer Predator Helios 18 PH18-72

MSI Vector 16 HX A14V: Intel Core i9-14900HX, 16.00", 2.7 kg
  External Review » MSI Vector 16 HX A14V

MSI Stealth 18 A1VHG: Intel Core Ultra 9 185H, 18.40", 2.8 kg
  External Review » MSI Stealth 18 A1VHG

Acer Predator Helios 16 PH16-72: Intel Core i9-14900HX, 16.00", 2.7 kg
  External Review » Acer Predator Helios 16 PH16-72

Alienware x16 R2 P120F: Intel Core Ultra 9 185H, 16.00", 2.7 kg
  External Review » Alienware x16 R2 P120F

MSI Raider GE78 HX 14VHG: Intel Core i9-14900HX, 17.30", 3.1 kg
  External Review » MSI Raider GE78 HX 14VHG

MSI Raider GE68 HX 14VHG: Intel Core i9-14900HX, 17.30", 3.1 kg
  External Review » MSI Raider GE68 HX 14VHG

Alienware x16 R2: Intel Core Ultra 9 185H, 16.00", 2.7 kg
  External Review » Alienware x16 R2

MSI Stealth 16 AI Studio A1VHG: Intel Core Ultra 9 185H, 16.00", 2 kg
  External Review » MSI Stealth 16 AI Studio A1VHG

MSI Vector 16 HX A13VHG: Intel Core i9-13980HX, 15.60", 2.7 kg
  External Review » MSI Vector 16 HX A13VHG

Asus ROG Strix Scar 16 G634JYR, RTX 4080: Intel Core i9-14900HX, 16.00", 2.7 kg
  External Review » Asus ROG Strix Scar 16 G634JYR, RTX 4080

HP Omen 16 (2024): Intel Core i9-14900HX, 16.10", 2.4 kg
  External Review » HP Omen 16 (2024)

Asus ROG Zephyrus G16 GU605MZ: Intel Core Ultra 9 185H, 16.00", 2 kg
  External Review » Asus ROG Zephyrus G16 GU605MZ

Lenovo Legion Pro 7 16IRX9H: Intel Core i9-14900HX, 16.00", 2.7 kg
  External Review » Lenovo Legion Pro 7 16IRX9H

MSI Vector GP68 HX 13VH: Intel Core i9-13950HX, 16.00", 2.7 kg
  External Review » MSI Vector GP68 HX 13VH

Lenovo Legion 9 16IRX8, RTX 4080: Intel Core i9-13980HX, 16.00", 2.6 kg
  External Review » Lenovo Legion 9 16IRX8, RTX 4080

MSI Vector GP68 HX 12VH: Intel Core i9-12900HX, 16.00", 2.7 kg
  External Review » MSI Vector GP68 HX 12VH

Asus ROG Zephyrus Duo 16 GX650PZ: AMD Ryzen 9 7945HX, 16.00", 2.7 kg
  External Review » Asus ROG Zephyrus Duo 16 GX650PZ

Asus ZenBook Pro 16X OLED UX7602: Intel Core i9-13905H, 16.00", 2.2 kg
  External Review » Asus ZenBook Pro 16X OLED UX7602

Acer Predator Helios 3D 15 SpatialLabs Edition: Intel Core i9-13900HX, 15.60", 3 kg
  External Review » Acer Predator Helios 3D 15 SpatialLabs Edition

Lenovo ThinkPad P1 G6, i7-13800H RTX 4080: Intel Core i7-13800H, 16.00", 1.8 kg
  External Review » Lenovo ThinkPad P1 G6, i7-13800H RTX 4080

MSI Vector GP78 HX 13VH: Intel Core i9-13980HX, 17.00", 3 kg
  External Review » MSI Vector GP78 HX 13VH

Asus ZenBook Pro 16X OLED UX7602BZ: Intel Core i9-13900H, 16.00", 2.2 kg
  External Review » Asus ZenBook Pro 16X OLED UX7602BZ

Alienware m16 R1 AMD: AMD Ryzen 9 7845HX, 16.00", 3.1 kg
  External Review » Alienware m16 R1 AMD

Asus ROG Zephyrus G14 GA402XZ: AMD Ryzen 9 7940HS, 14.00", 1.7 kg
  External Review » Asus ROG Zephyrus G14 GA402XZ

HP Omen 16-wf000: Intel Core i7-13700HX, 16.10", 2.4 kg
  External Review » HP Omen 16-wf000

Asus ROG Strix Scar 18 G834JZ: Intel Core i9-13980HX, 18.00", 3.1 kg
  External Review » Asus ROG Strix Scar 18 G834JZ

Asus ROG Strix G16 G614JZ: Intel Core i9-13980HX, 16.00", 2.4 kg
  External Review » Asus ROG Strix G16 G614JZ

Acer Predator Triton 14 PT14-51, i7-13700H RTX 4080: Intel Core i7-13700H, 14.00", 1.7 kg
  External Review » Acer Predator Triton 14 PT14-51, i7-13700H RTX 4080

HP Omen 17-ck2940nz: Intel Core i9-13900HX, 17.30", 2.8 kg
  External Review » HP Omen 17-ck2940nz

Lenovo Legion Pro 7 16IRX8H, i7-13700HX RTX 4080: Intel Core i7-13700HX, 16.00", 2.8 kg
  External Review » Lenovo Legion Pro 7 16IRX8H, i7-13700H RTX 4080

HP Omen 17-ck2000: Intel Core i7-13700HX, 17.30", 2.8 kg
  External Review » HP Omen 17-ck2000

Asus ROG Zephyrus M16 GU604VZ: Intel Core i9-13900H, 16.00", 2.3 kg
  External Review » Asus ROG Zephyrus M16 GU604VZ

HP Omen 17-ck2004TX: Intel Core i9-13900HX, 17.30", 2.8 kg
  External Review » HP Omen 17-ck2004TX

Alienware x16 R1: Intel Core i9-13900HK, 16.00", 2.6 kg
  External Review » Alienware x16 R1

MSI GE78 HX 13VH: Intel Core i7-13700HX, 17.30", 3.1 kg
  External Review » MSI GE78 HX 13VH

Asus ROG Strix Scar 17 G733PZ: AMD Ryzen 9 7945HX, 17.30", 3 kg
  External Review » Asus ROG Strix Scar 17 G733PZ

HP Omen 17-ck2097ng: Intel Core i9-13900HX, 17.30", 2.8 kg
  External Review » HP Omen 17-ck2097ng

Alienware m16 R1: Intel Core i9-13900HX, 16.00", 3.3 kg
  External Review » Alienware m16 R1

Asus ROG Strix Scar 16 G634JZ: Intel Core i9-13980HX, 16.00", 2.5 kg
  External Review » Asus ROG Strix Scar 16 G634JZ

MSI Stealth 17 Studio A13VH-053US: Intel Core i9-13900H, 17.30", 2.8 kg
  External Review » MSI Stealth 17 Studio A13VH-053US

Alienware x16 R1, i9-13900HK RTX 4080: Intel Core i9-13900HK, 16.00", 2.7 kg
  External Review » Alienware x16 R1, i9-13900HK RTX 4080

MSI GE78HX 13VH-070US: Intel Core i9-13950HX, 17.00", 3 kg
  External Review » MSI GE78HX 13VH-070US

Lenovo Legion Pro 7 16IRX8H: Intel Core i9-13900HX, 16.00", 2.7 kg
  External Review » Lenovo Legion Pro 7 16IRX8H

Razer Blade 18 2023, RTX 4080: Intel Core i9-13950HX, 18.00", 3.2 kg
  External Review » Razer Blade 18 2023, RTX 4080

Acer Predator Helios 16 2023 PH16-71-9705: Intel Core i9-13900HX, 16.00", 2.7 kg
  External Review » Acer Predator Helios 16 2023 PH16-71-9705

Acer Predator Helios 18 2023 PH18-71-91U5: Intel Core i9-13900HX, 18.00", 3.3 kg
  External Review » Acer Predator Helios 18 2023 PH18-71-91U5

Aorus 17H BXF: Intel Core i7-13700H, 17.30", 2.7 kg
  External Review » Aorus 17H BXF

Razer Blade 16 Early 2023: Intel Core i9-13950HX, 16.00", 2.4 kg
  External Review » Razer Blade 16 Early 2023

Asus Zenbook Pro 16X UX7602BZ-MY005W: Intel Core i9-13905H, 16.00", 2.4 kg
   » 性能明显强于前代产品:全新华硕 Zenbook Pro 16X 达到游戏笔记本电脑的性能水平

Razer Blade 16 Early 2023: Intel Core i9-13950HX, 16.00", 2.4 kg
   » 移动GeForce RTX 4080比桌面RTX 4080慢35%,这对消费者来说可能是个问题

Please share our article, every link counts!

» Comparison of GPUs
Detailed list of all laptop GPUs sorted by class and performance.

» Benchmark List
Sort and restrict laptop GPUs based on performance in synthetic benchmarks.

» Notebook Gaming List
Playable games for each graphics card and their average FPS results.

Class 1

GeForce RTX 2080 Super Mobile

Class 2

M1 Max 32-Core GPU *
GeForce RTX 2070 Super Mobile
M1 Max 24-Core GPU *
Quadro RTX 5000 Max-Q
Radeon RX 5700M *
GeForce GTX 1080 Mobile
Quadro RTX 4000 (Laptop)
M1 Pro 16-Core GPU *
Radeon PRO W6600M *
GeForce RTX 2070 Super Max-Q
Quadro RTX 4000 Max-Q *
M1 Pro 14-Core GPU *
Quadro P5200
Quadro RTX 3000 Max-Q *
Quadro P4200
Quadro P5000 Max-Q *
GeForce GTX 980 (Laptop)
Quadro P4000
Quadro P4000 Max-Q
Quadro P3200
Radeon RX 580X (Laptop) *
Radeon RX 580 (Laptop)
Arc 130V *
Radeon Pro 5300M
Radeon RX 5300M
Quadro P3000 Max-Q *
Quadro T2000 Max-Q *
Radeon Pro WX 7100 *
Radeon RX 570X (Laptop) *
Radeon RX 570 (Laptop) *
Radeon RX 470 (Laptop) *
Quadro T1000 Max-Q *

Class 3

Vega M GH
Quadro M5000M
GeForce GTX 1050 Ti Mobile
Radeon 680M
Quadro P2000
Quadro P2000 Max-Q
Quadro M4000M
T500 Laptop GPU *
Radeon R9 M395X
GeForce GTX 1050 Ti Max-Q *
Radeon Pro Vega 16
WX Vega M GL
Radeon R9 M485X
Quadro M3000M
FirePro W7170M
Radeon R9 M395
GeForce GTX 1050 Max-Q *
Radeon 660M
Radeon Pro WX 4150 *
Radeon RX 560X (Laptop)
Radeon RX 560 (Laptop)
Radeon RX 460 (Laptop)
Quadro P1000
Radeon R9 M390
Xe MAX
Radeon Pro 560X
Radeon Pro 560
Radeon Pro 460
Radeon Pro WX 4130 *
GeForce GTX 960M
Quadro P620 *
Radeon RX 550X (Laptop)
Radeon Pro WX 3200 *
Radeon Pro 555X
Radeon Pro 555
Radeon Pro 455
Quadro P600
Quadro M2000M
Radeon RX 540X *
Radeon Pro WX 2100 *
Radeon Pro WX 3100 *
GeForce GTX 950M
Radeon Pro 450
Radeon 630
Radeon 540X *
Radeon R9 M385X
Quadro P520
Quadro M1000M
GeForce 945M
Quadro P500 *
Iris Plus Graphics G7 (Ice Lake 64 EU) *
Vega 10 *
Iris Pro Graphics 580
FirePro W5170M *
Radeon R9 M370X
Vega 9
FirePro W5130M
UHD Graphics Xe G4 48EUs *
UHD Graphics 32EUs
UHD Graphics Xe 32EUs (Tiger Lake-H) *
UHD Graphics 750
UHD Graphics 730
Vega 7
Radeon R7 M465
Iris Pro Graphics 6200
Vega 8
GeForce 940M
Iris Plus Graphics G4 (Ice Lake 48 EU)
Quadro M600M
FirePro W4190M
Radeon R9 M375
Radeon R7 M445
Iris Plus Graphics 650
Iris Graphics 550
Radeon 625
Vega 6 *
Iris Plus Graphics 640
Iris Graphics 540
UHD Graphics 24EUs (Alder Lake-N) *
Radeon R7 M360
GeForce 920M
Radeon 620
Radeon R7 M340
Radeon 610
Radeon 610M *
Vega 6 *
UHD Graphics G1 (Ice Lake 32 EU)
UHD Graphics Xe 16EUs (Tiger Lake-H) *
HD Graphics 530
Radeon R5 (Bristol Ridge)
Adreno 690 *
Adreno 685 *
Adreno 680 *
Radeon R5 M330
GeForce 910M
HD Graphics 520

Class 4

Radeon R5 M320 *
Radeon R5 M315 *
Radeon R5 M420 *
Vega 2 *
UHD Graphics 617
UHD Graphics 615
HD Graphics 515
UHD Graphics 610
HD Graphics 510
UHD Graphics 605
Radeon R4 (Stoney Ridge)
Radeon R2 (Stoney Ridge)
HD Graphics (Broadwell)
UHD Graphics 600
HD Graphics (Braswell)

Class 5

* Approximate position of the graphics adapter

> Notebookcheck中文版(NBC中国) > FAQ / 小提示/ 技术参数 > 移动显示芯片——基准测试成绩列表 > NVIDIA NVIDIA GeForce RTX 4080 Laptop GPU
Klaus Hinum (Update: 2023-11-23)