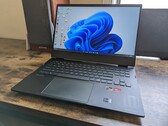
Notebookcheck Logo

AMD Radeon RX 6650M

AMD Radeon RX 6650M

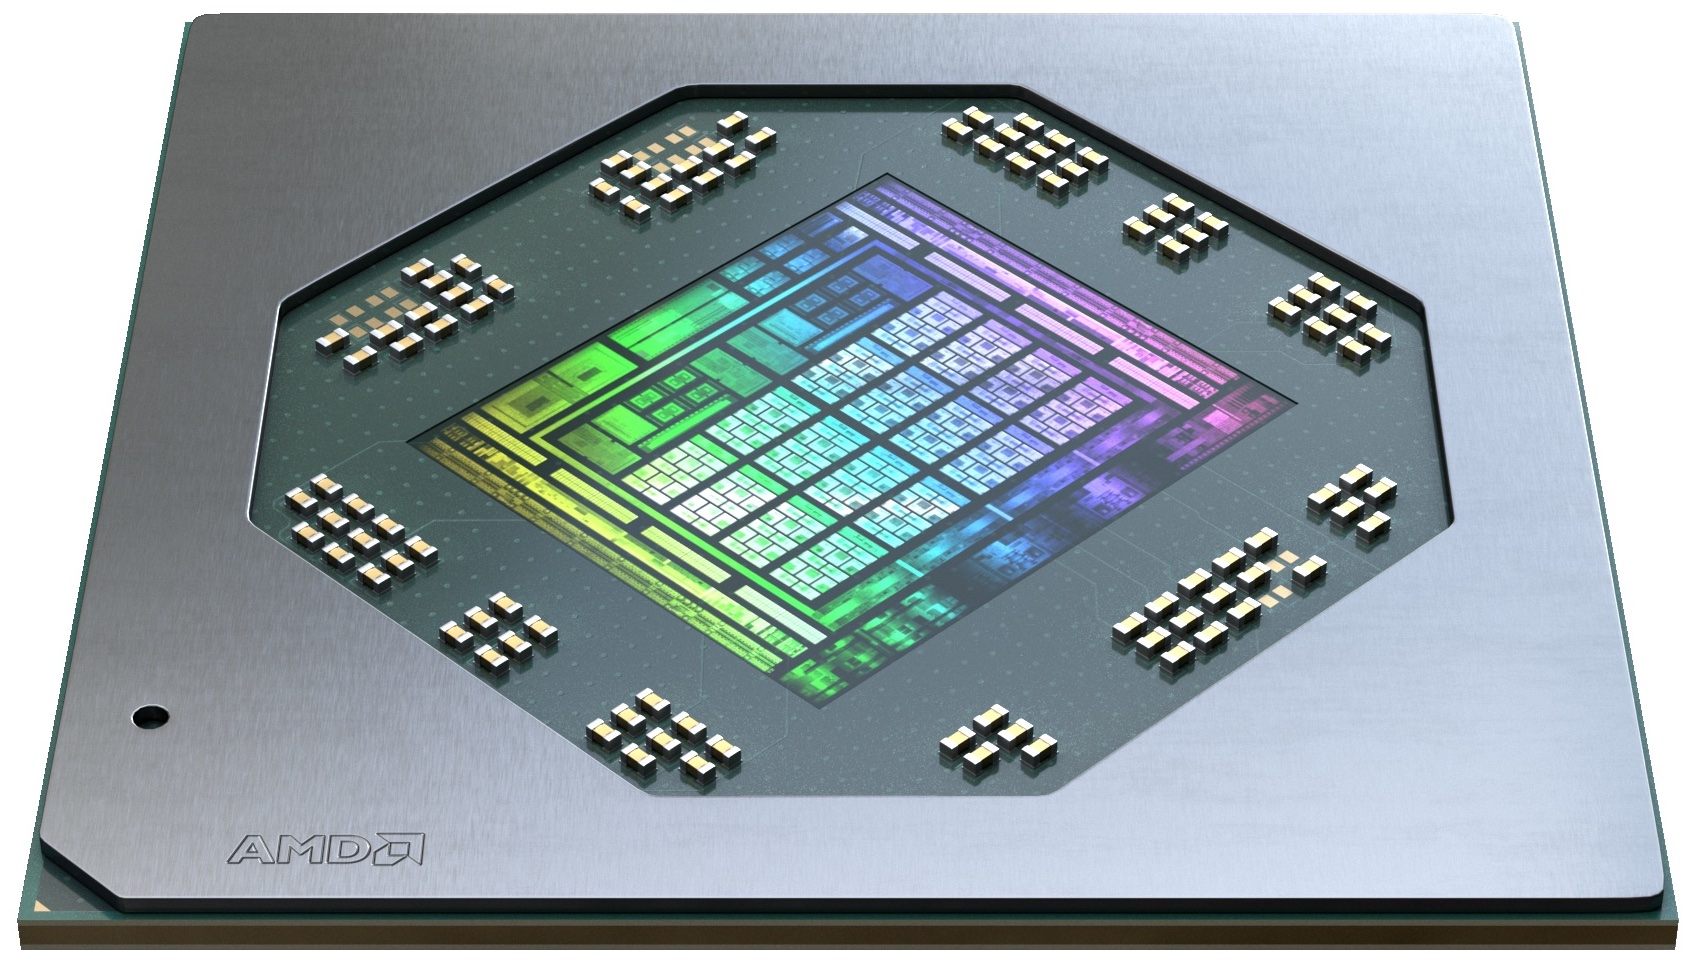
AMD Radeon RX 6650M 是一款移动中端显卡,基于Navi23 芯片(RDNA 2 架构),采用现代 7 纳米工艺制造。它拥有 1,792 个内核(28 个 CU - 计算单元)和 8 GB 快速 GDDR6 显存,通过 128 位内存总线连接。芯片还包括 32 MB Infinity 高速缓存。AMD 表示,内核的时钟速度取决于笔记本电脑。指定的游戏时钟速度为 2222 MHz,因此仅略高于 RX 6600M。功耗(TDP 设置)范围为 100 - 120 瓦(与 Nvidia 相似)。

AMD 将其性能与 RTX 3060 笔记本电脑RX 6600M.当激活 Raytracing 效果时,它的性能会落后于GeForce GPU。

Navi 21 芯片由台积电采用现代 7 纳米工艺制造。

Radeon RX 6000M Series

Radeon RX 6850M XT 2560 @ 2.46 GHz192 Bit @ 18000 MHz
Radeon RX 6800M 2560 @ 2.12 - 2.3 GHz192 Bit @ 16000 MHz
Radeon RX 6800S 2048 @ 1.8 - 1.98 GHz128 Bit @ 16000 MHz
Radeon RX 6700M 2304 @ 2.3 GHz160 Bit @ 16000 MHz
Radeon RX 6650M XT 2048 @ 2.16 GHz128 Bit @ 18000 MHz
Radeon RX 6650M 1792 @ 2.22 GHz128 Bit @ 18000 MHz
Radeon RX 6600M 1792 @ 2.07 - 2.18 GHz128 Bit @ 14000 MHz
Radeon RX 6700S 1792 @ 1.7 - 1.89 GHz128 Bit @ 14000 MHz
Radeon PRO W6600M 1792 128 Bit @ 14000 MHz
Radeon RX 6600S 1792 @ 1.88 GHz128 Bit @ 16000 MHz
Radeon RX 6550M 1024 @ 2 - 2.56 GHz64 Bit @ 18000 MHz
Radeon RX 6500M 1024 @ 2.19 GHz64 Bit @ 18000 MHz
Radeon RX 6550S 1024 @ 2.17 GHz64 Bit @ 16000 MHz
Radeon RX 6450M 768 @ 2 - 2.22 GHz64 Bit @ 18000 MHz
Radeon RX 6300M 768 @ 1.51 GHz128 Bit @ 18000 MHz
ArchitectureRDNA 2
Pipelines1792 - unified
Core Speed2222 (Boost) MHz
Memory Speed18000 MHz
Memory Bus Width128 Bit
Memory TypeGDDR6
Max. Amount of Memory8 GB
Shared Memoryno
APIDirectX 12, Shader 6.4, OpenGL 4.6
Power Consumption120 Watt
Transistor Count11.1 Billion
technology7 nm
FeaturesDisplayPort 1.4 w/DFSC, HDMI 2.0b, Radeon Media Engine (H.264 4K150 decode, 4K90 encode / H.265 4K90 decode, 4K60 encode / VP9 4K90 decode)
Notebook Sizelarge
Date of Announcement04.01.2022
Link to Manufacturer Pagewww.amd.com

Benchmarks

3DMark - 3DMark Speed Way Score
1418 Points (10%)
3DMark - 3DMark Fire Strike Standard Score
22516 Points (34%)
3DMark - 3DMark Fire Strike Standard Graphics
25739 Points (24%)
3DMark - 3DMark Time Spy Score
8869 Points (23%)
3DMark - 3DMark Time Spy Graphics
8700 Points (18%)
Intel UHD Graphics 600
107.5 -99%
...
7688 -12%
7864 -10%
7903 -9%
8057 -7%
8189 -6%
8210 -6%
NVIDIA GeForce RTX 2070 Super Mobile
8238 -5%
8316 -4%
8689 0%
AMD Radeon RX 6650M
8700
8798 1%
8989 3%
9020 4%
9033 4%
9097 5%
9164 5%
9300 7%
9332 7%
NVIDIA RTX PRO 2000 Blackwell Generation Laptop
9448 9%
...
Nvidia RTX PRO 5000 Blackwell Generation Laptop
23277 168%
max:
NVIDIA GeForce RTX 5090
44789 415%
0%
100%
Restrict / Search: Model: Max. age: years
3DMark 11 - 3DM11 Performance Score
26153 Points (32%)
3DMark 11 - 3DM11 Performance GPU
32846 Points (25%)
171.8 -99%
...
28692 -13%
NVIDIA GeForce RTX 2070 Super Mobile
29416 -10%
29447 -10%
29663 -10%
29975 -9%
30499 -7%
31142 -5%
32331 -2%
32662 -1%
AMD Radeon RX 6650M
32846
33169 1%
33497 2%
34188 4%
34860 6%
35101 7%
NVIDIA GeForce RTX 2080 Super Mobile
35153 7%
35286 7%
35743 9%
35944 9%
...
Nvidia RTX PRO 5000 Blackwell Generation Laptop
68271 108%
max:
NVIDIA GeForce RTX 5090
129772 295%
0%
100%
Restrict / Search: Model: Max. age: years
Cinebench R15
Cinebench R15 OpenGL 64 Bit +
Cinebench R15 - Cinebench R15 OpenGL 64 Bit
175.8 fps (10%)
Cinebench R15 OpenGL Ref. Match 64 Bit +
Cinebench R15 - Cinebench R15 OpenGL Ref. Match 64 Bit
98 % (98%)
Power Consumption - Furmark Stress Test Power Consumption - external Monitor *
199.8 Watt (27%)
0153045607590105120135150165180195210Tooltip
Power Consumption - The Witcher 3 Power Consumption - external Monitor *
205 Watt (29%)
0153045607590105120135150165180195210Tooltip
Power Consumption - Witcher 3 Power Consumption *
206 Watt (45%)
0153045607590105120135150165180195210Tooltip
Emissions Witcher 3 Fan Noise +
Emissions - Witcher 3 Fan Noise
54.1 dB(A) (77%)
- Range of benchmark values
red legend - Average benchmark values
* Smaller numbers mean a higher performance

Game Benchmarks

The following benchmarks stem from our benchmarks of review laptops. The performance depends on the used graphics memory, clock rate, processor, system settings, drivers, and operating systems. So the results don't have to be representative for all laptops with this GPU. For detailed information on the benchmark results, click on the fps number.

F1 22

F1 22

2022
low 1920x1080
217  fps    + Compare
med. 1920x1080
215  fps    + Compare
high 1920x1080
178.2  fps    + Compare
ultra 1920x1080
40.6  fps    + Compare
» With all tested laptops playable in detail settings ultra.
Additional Benchmarks
Ultra Low Preset 16xAF TAA 1280x720
264
low 1920x1080
126.8  fps    + Compare
med. 1920x1080
106.3  fps    + Compare
high 1920x1080
78.9  fps    + Compare
ultra 1920x1080
63.8  fps    + Compare
» With all tested laptops playable in detail settings ultra.
low 1920x1080
69.3  fps    + Compare
med. 1920x1080
68.4  fps    + Compare
high 1920x1080
64.3  fps    + Compare
ultra 1920x1080
51.5  fps    + Compare
» With all tested laptops playable in detail settings ultra.
Additional Benchmarks
Low Preset 1280x720
76.9
low 1280x720
117  fps    + Compare
med. 1920x1080
110  fps    + Compare
high 1920x1080
111  fps    + Compare
ultra 1920x1080
105  fps    + Compare
» With all tested laptops playable in detail settings ultra.
Additional Benchmarks
Low Preset 1920x1080
111
Far Cry 6

Far Cry 6

2021
low 1280x720
111  fps    + Compare
med. 1920x1080
105  fps    + Compare
high 1920x1080
96  fps    + Compare
ultra 1920x1080
88  fps    + Compare
» With all tested laptops playable in detail settings ultra.
Additional Benchmarks
Low Graphics Quality 1920x1080
118
F1 2021

F1 2021

2021
low 1280x720
315  fps    + Compare
med. 1920x1080
247  fps    + Compare
high 1920x1080
216  fps    + Compare
ultra 1920x1080
100  fps    + Compare
» With all tested laptops playable in detail settings ultra.
Additional Benchmarks
Ultra Low Preset 1920x1080
263
Hitman 3

Hitman 3

2021
low 1280x720
224.8  fps    + Compare
med. 1920x1080
178.8  fps    + Compare
high 1920x1080
165.5  fps    + Compare
ultra 1920x1080
156.3  fps    + Compare
» With all tested laptops playable in detail settings ultra.
Additional Benchmarks
Minimum Settings 1920x1080
212.4
Dirt 5

Dirt 5

2020
low 1280x720
236.6  fps    + Compare
med. 1920x1080
135.4  fps    + Compare
high 1920x1080
109.1  fps    + Compare
ultra 1920x1080
83.6  fps    + Compare
» With all tested laptops playable in detail settings ultra.
low 1280x720
109  fps    + Compare
med. 1920x1080
104  fps    + Compare
high 1920x1080
94  fps    + Compare
ultra 1920x1080
62  fps    + Compare
» With all tested laptops playable in detail settings ultra.
Additional Benchmarks
Ultra Preset + Ultra Ray Tracing (DX12) 1920x1080
14
low 1280x720
162.8  fps    + Compare
med. 1920x1080
205.9  fps    + Compare
high 1920x1080
124.2  fps    + Compare
ultra 1920x1080
100.4  fps    + Compare
» With all tested laptops playable in detail settings ultra.
low 1280x720
110.4  fps    + Compare
med. 1920x1080
95.9  fps    + Compare
high 1920x1080
85.2  fps    + Compare
ultra 1920x1080
67.4  fps    + Compare
» With all tested laptops playable in detail settings ultra.
Additional Benchmarks
Very Low Overall Quality (DX11) 1920x1080
108.5
low 1280x720
138.8  fps    + Compare
med. 1920x1080
111.5  fps    + Compare
high 1920x1080
81  fps    + Compare
ultra 1920x1080
65.8  fps    + Compare
» With all tested laptops playable in detail settings ultra.
Strange Brigade

Strange Brigade

2018
low 1280x720
337  fps    + Compare
med. 1920x1080
222  fps    + Compare
high 1920x1080
190  fps    + Compare
ultra 1920x1080
167.2  fps    + Compare
» With all tested laptops playable in detail settings ultra.
low 1280x720
66.4  fps    + Compare
med. 1920x1080
52.7  fps    + Compare
high 1920x1080
46.4  fps    + Compare
» With all tested laptops playable in detail settings high.
low 1280x720
164.7  fps    + Compare
med. 1920x1080
113.3  fps    + Compare
high 1920x1080
83.2  fps    + Compare
» With all tested laptops playable in detail settings high.
Fortnite

Fortnite

2018
low 1280x720
95.5  fps    + Compare
med. 1920x1080
54.1  fps    + Compare
high 1920x1080
46  fps    + Compare
ultra 1920x1080
40.4  fps    + Compare
» With all tested laptops playable in detail settings ultra.
Overwatch

Overwatch

2016
low 1280x720
507.9  fps    + Compare
med. 1366x768
481.9  fps    + Compare
high 1920x1080
350.9  fps    + Compare
ultra 1920x1080
150  fps    + Compare
» With all tested laptops playable in detail settings ultra.
Additional Benchmarks
Medium (Render Scale 100 %) 2xAF FXAA 1920x1080
403.2
low 1280x720
141  fps    + Compare
med. 1366x768
130.7  fps    + Compare
high 1920x1080
118  fps    + Compare
ultra 1920x1080
100  fps    + Compare
» With all tested laptops playable in detail settings ultra.
low 1024x768
276.5  fps    + Compare
med. 1366x768
217.4  fps    + Compare
high 1920x1080
167  fps    + Compare
ultra 1920x1080
90.1  fps    + Compare + 📈 Graph
» With all tested laptops playable in detail settings ultra.
lowmed.highultraQHD4K
F1 22217215178.240.6
Cyberpunk 2077 1.6126.8106.378.963.8
God of War69.368.464.351.5
Guardians of the Galaxy117110111105
Far Cry 61111059688
F1 2021315247216100
Hitman 3224.8178.8165.5156.3
Dirt 5236.6135.4109.183.6
Watch Dogs Legion1091049462
Gears Tactics162.8205.9124.2100.4
Borderlands 3110.495.985.267.4
Metro Exodus138.8111.58165.8
Strange Brigade337222190167.2
X-Plane 11.1166.452.746.4
Final Fantasy XV Benchmark164.7113.383.2
Fortnite95.554.14640.4
Overwatch507.9481.9350.9150
Dota 2 Reborn141130.7118100
The Witcher 3276.5217.416790.1
lowmed.highultraQHD4K
< 30 fps
< 60 fps
< 120 fps
≥ 120 fps


7
12

2
8
9

2
10
7

3
11
3


For more games that might be playable and a list of all games and graphics cards visit our Gaming List

Amazon Logo
  • $671.80
    XFX Speedster MERC308 Radeon RX 6650XT Black Gaming Graphics Card with 8GB GDDR6 HDMI 3xDP, AMD RDNA 2 RX-665X8TBDY
  • $319.99
    XFX Speedster SWFT210 Radeon RX 7600 Graphics Card with 8GB GDDR6 HDMI 3xDP, AMD RDNA 3 RX-76PSWFTFY
  • $704.00
    HP Victus 15 Gaming Laptop, 15.6" FHD 144Hz IPS (AMD Ryzen 5 7535HS, 16GB DDR5 RAM, 512GB PCle SSD, Radeon RX 6550M 4GB (Beat RTX3050)) Backlit KB, Wi-Fi 6, Webcam, Ethernet, Win 11 Home
  • $198.45
    PowerColor AMD Radeon RX 6500 XT ITX Gaming Graphics Card with 4GB GDDR6 Memory
  • $499.99
    GIGABYTE Radeon RX 7700 XT Gaming OC 12G Graphics Card, 3X WINDFORCE Fans 12GB 192-bit GDDR6, GV-R77XTGAMING OC-12GD Video Card

v1.35
log 27. 12:52:24

#0 ran 0s before starting gpusingle class +0s ... 0s

#1 no ids found in url (should be separated by "_") +0s ... 0s

#2 not redirecting to Ajax server +0s ... 0s

#3 did not recreate cache, as it is less than 5 days old! Created at Mon, 26 Jan 2026 12:25:57 +0100 +0.001s ... 0.001s

#4 no comparison url found in template nbc.compare_page_1 needed +0.038s ... 0.039s

#5 no comparison url found in template nbc.compare_page_1 needed +0s ... 0.039s

#6 no comparison url found in template nbc.compare_page_1 needed +0s ... 0.039s

#7 no comparison url found in template nbc.compare_page_1 needed +0s ... 0.04s

#8 no comparison url found in template nbc.compare_page_1 needed +0s ... 0.04s

#9 no comparison url found in template nbc.compare_page_1 needed +0s ... 0.04s

#10 no comparison url found in template nbc.compare_page_1 needed +0s ... 0.04s

#11 no comparison url found in template nbc.compare_page_1 needed +0s ... 0.04s

#12 no comparison url found in template nbc.compare_page_1 needed +0s ... 0.041s

#13 no comparison url found in template nbc.compare_page_1 needed +0s ... 0.041s

#14 no comparison url found in template nbc.compare_page_1 needed +0s ... 0.041s

#15 no comparison url found in template nbc.compare_page_1 needed +0s ... 0.042s

#16 no comparison url found in template nbc.compare_page_1 needed +0s ... 0.042s

#17 no comparison url found in template nbc.compare_page_1 needed +0s ... 0.042s

#18 composed specs +0s ... 0.042s

#19 did output specs +0s ... 0.042s

#20 start showIntegratedCPUs +0s ... 0.042s

#21 getting avg benchmarks for device 11134 +0.016s ... 0.058s

#22 got single benchmarks 11134 +0.009s ... 0.067s

#23 got avg benchmarks for devices +0s ... 0.067s

#24 min, max, avg, median took s +0.33s ... 0.397s

#25 before gaming benchmark output +0s ... 0.397s

#26 Got 74 rows for game benchmarks. +0.026s ... 0.423s

#27 composed SQL query for gamebenchmarks +0s ... 0.423s

#28 got data and put it in $dataArray +0.014s ... 0.436s

#29 benchmarks composed for output. +0.166s ... 0.603s

#30 no comparison url found in template nbc.compare_page_1 needed +0.734s ... 1.337s

#31 return log +0s ... 1.337s

Please share our article, every link counts!
Mail Logo

» Comparison of GPUs
Detailed list of all laptop GPUs sorted by class and performance.

» Benchmark List
Sort and restrict laptop GPUs based on performance in synthetic benchmarks.

» Notebook Gaming List
Playable games for each graphics card and their average FPS results.

Class 1

Class 2

GeForce RTX 2080 Super Mobile
RTX PRO 2000 Blackwell Generation Laptop *
M1 Max 32-Core GPU *
GeForce RTX 2070 Super Mobile
M1 Max 24-Core GPU *
Radeon 8050S
Quadro RTX 5000 Max-Q
Radeon RX 5700M *
GeForce GTX 1080 Mobile
Quadro RTX 4000 (Laptop)
M1 Pro 16-Core GPU *
Radeon PRO W6600M *
GeForce RTX 2070 Super Max-Q
Quadro RTX 4000 Max-Q *
M1 Pro 14-Core GPU *
Quadro P5200
RTX PRO 1000 Blackwell Generation Laptop *
Quadro RTX 3000 Max-Q *
Quadro P4200
Radeon 8040S *
Pro A60M *

Class 3

Quadro P5000 Max-Q *
Quadro P4000
Arc 140T *
Pro A30M *
Quadro P4000 Max-Q
Quadro P3200
Radeon RX 580X (Laptop) *
Radeon RX 580 (Laptop)
Radeon Pro 5300M
Radeon RX 5300M
Quadro P3000 Max-Q *
Quadro T2000 Max-Q *
Radeon RX 570X (Laptop) *
Radeon RX 570 (Laptop) *
Quadro T1000 Max-Q *
Vega M GH
GeForce GTX 1050 Ti Mobile
Radeon 680M
Quadro P2000
Quadro P2000 Max-Q
T500 Laptop GPU *
Arc 130T
GeForce GTX 1050 Ti Max-Q *
Radeon Pro Vega 16
WX Vega M GL
GeForce GTX 1050 Max-Q *
Radeon 660M
Radeon Pro WX 4150 *
Radeon RX 560X (Laptop)
Radeon RX 560 (Laptop)
Quadro P1000
Xe MAX
Radeon Pro 560X
Radeon Pro 560
Quadro P620 *
Radeon RX 550X (Laptop)
Radeon Pro WX 3200 *
Radeon Pro 555X
Radeon Pro 555
Quadro P600
Graphics 3-Core iGPU (Arrow Lake) *
Radeon RX 540X *
Radeon Pro WX 2100 *
Radeon Pro WX 3100 *
Graphics 2-Core iGPU (Arrow Lake) *
Radeon 630
Radeon 540X *
Quadro P520
Intel Graphics 2 Xe3
Quadro P500 *
Iris Plus Graphics G7 (Ice Lake 64 EU) *
Vega 10 *
Vega 9
UHD Graphics Xe G4 48EUs *
UHD Graphics 32EUs
UHD Graphics Xe 32EUs (Tiger Lake-H) *
UHD Graphics 750
UHD Graphics 730
Vega 7
Vega 8
Iris Plus Graphics G4 (Ice Lake 48 EU)
Iris Plus Graphics 650
Radeon 625
Vega 6 *
Iris Plus Graphics 640
UHD Graphics 24EUs (Alder Lake-N) *
GeForce 920M
Radeon 620
Radeon 610
Radeon 610M *
Vega 6 *
UHD Graphics G1 (Ice Lake 32 EU)
UHD Graphics Xe 16EUs (Tiger Lake-H) *
Adreno 690 *
Adreno 685 *
Adreno 680 *
GeForce 910M

Class 4

* Approximate position of the graphics adapter