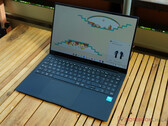
Notebookcheck Logo

Intel UHD Graphics 64EUs (Alder Lake 12th Gen)

Intel UHD Graphics 64EUs

英特尔UHD Graphics 80EUs(第12代桤木湖GPU,具有80个EU的Xe架构)是中端桤木湖CPU的一个集成显卡。它采用新的Xe架构(Gen12),应该在2020年晚些时候公布。该SoC采用改进的10纳米工艺(称为英特尔7)制造。

Gen. 12 / Xe Series

Iris Xe G7 96EUs 96 @ 0.4 - 1.35 GHz
Iris Xe G7 80EUs 80 @ 0.4 - 1.35 GHz
UHD Graphics 64EUs 64 @ 1.4 GHz
UHD Graphics Xe G4 48EUs 48 @ 0.35 - 1.45 GHz
UHD Graphics 32EUs 32 @ 1.25 GHz
UHD Graphics Xe 32EUs (Tiger Lake-H) 32 @ 0.35 - 1.45 GHz
UHD Graphics Xe 750 32EUs 32 @ 0.35 - 1.45 GHz
UHD Graphics 24EUs (Alder Lake-N) 24 @ 0.45 - 0.75 GHz
UHD Graphics Xe 16EUs (Tiger Lake-H) 16 @ 0.35 - 1.45 GHz
CodenameAlder Lake Xe
ArchitectureGen. 12
Pipelines64 - unified
Core Speed1400 (Boost) MHz
Shared Memoryyes
APIDirectX 12_1, OpenGL 4.6
technology10 nm
FeaturesQuickSync
Date of Announcement04.01.2022
CPU in UHD Graphics 64EUsGPU Base SpeedGPU Boost / Turbo
Intel Core i7-13620H10 x 1800 MHz, 45 W? MHz1500 MHz
Intel Core i7-12650H10 x 1700 MHz, 45 W? MHz1400 MHz
Intel Core i3-1220P10 x 1100 MHz, 28 W? MHz1100 MHz
min. - max.? MHz850 - 1500 MHz

Benchmarks

Performance Rating - 3DMark 11 + Fire Strike + Time Spy
1.8 pt (5%)
AMD Radeon HD 8180
0.06605 -96%
...
1.66 -6%
1.665 -6%
1.667 -6%
1.679 -5%
AMD Radeon RX 550X (Laptop)
1.68 -5%
NVIDIA GeForce GT 750M SLI
1.687 -5%
1.705 -4%
1.714 -3%
AMD FirePro M6100
1.748 -1%
Intel UHD Graphics 64EUs (Alder Lake 12th Gen)
1.772
NVIDIA GeForce GTX 860M
1.778 0%
1.827 3%
1.844 4%
NVIDIA Quadro P600
1.86 5%
NVIDIA GeForce GT 755M SLI
1.87 6%
1.887 6%
NVIDIA Quadro M2000M
1.894 7%
NVIDIA T500 Laptop GPU
1.924 9%
NVIDIA GeForce GTX 960M
1.967 11%
...
21.1 1091%
max:
33.3 1779%
0%
100%
3DMark - 3DMark Time Spy Score
min: 935     avg: 1206     median: 1243 (4%)     max: 1537 Points
3DMark - 3DMark Time Spy Graphics
min: 830     avg: 1056     median: 1106 (3%)     max: 1336 Points
Intel UHD Graphics 605
113 -89%
...
AMD Radeon Pro 450
952 -10%
AMD Radeon Pro WX 3200
956 -9%
NVIDIA GeForce GTX 950M
971 -8%
AMD Radeon RX Vega 7
991 -6%
995 -6%
NVIDIA Quadro P520
999 -5%
1008 -5%
AMD Radeon R9 M280X
1012 -4%
AMD Radeon RX 550X (Laptop)
1050 -1%
Intel UHD Graphics 64EUs (Alder Lake 12th Gen)
1056
1070 1%
AMD Radeon Pro 555
1078 2%
AMD Radeon Pro 455
1118 6%
1136 8%
NVIDIA GeForce GTX 960M
1148 9%
1156 9%
NVIDIA Quadro P600
1162 10%
1170 11%
unknown
1257 19%
...
19434 1740%
max:
36485 3355%
0%
100%
3DMark - 3DMark Ice Storm Unlimited Graphics
min: 192047     avg: 233684     median: 209544 (24%)     max: 279392 Points
3DMark - 3DMark Ice Storm Extreme Graphics
min: 44105     avg: 77363     median: 82608 (11%)     max: 92077 Points
3DMark - 3DMark Cloud Gate Score
min: 15139     avg: 18914     median: 18265 (20%)     max: 24767 Points
3DMark - 3DMark Cloud Gate Graphics
min: 19949     avg: 21951     median: 21383 (6%)     max: 27185 Points
3DMark - 3DMark Fire Strike Standard Score
min: 2275     avg: 3387     median: 3494 (6%)     max: 4318 Points
3DMark - 3DMark Fire Strike Standard Graphics
min: 2592     avg: 3635     median: 3891 (4%)     max: 4567 Points
3DMark - 3DMark Ice Storm Graphics
min: 59484     avg: 109652     median: 119715 (14%)     max: 128009 Points
3DMark - 3DMark Wild Life Unlimited
10921 Points (6%)
3DMark - 3DMark Wild Life Extreme Unlimited
min: 1719     avg: 2343     median: 2342.5 (3%)     max: 2966 Points
3DMark - 3DMark Night Raid
17836 Points (17%)
3DMark - 3DMark Night Raid Graphics Score
18555 Points (7%)
3DMark 11 - 3DM11 Performance Score
min: 4116     avg: 5210     median: 5324 (7%)     max: 6259 Points
3DMark 11 - 3DM11 Performance GPU
min: 3886     avg: 4678     median: 5030 (4%)     max: 5566 Points
171.8 -96%
...
4333 -7%
AMD Radeon Pro WX 3200
4338 -7%
NVIDIA GeForce GTX 950M
4348 -7%
AMD Radeon RX Vega 9
4380 -6%
4404 -6%
AMD Radeon Pro 450
4502 -4%
4554 -3%
NVIDIA GeForce GT 750M SLI
4634 -1%
NVIDIA Quadro P600
4655 0%
Intel UHD Graphics 64EUs (Alder Lake 12th Gen)
4678
AMD Radeon R9 M280X
4698 0%
4699 0%
4787 2%
4894 5%
NVIDIA GeForce GTX 860M
4913 5%
4957 6%
NVIDIA GeForce GTX 770M
4974 6%
AMD Radeon RX Vega 7
5054 8%
NVIDIA Quadro M2000M
5134 10%
...
59943 1181%
max:
106023 2166%
0%
100%
3DMark Vantage
3DM Vant. Perf. total +
3DMark Vantage - 3DM Vant. Perf. total
min: 15454     avg: 18595     median: 18748.5 (5%)     max: 22757 Points
3DM Vant. Perf. GPU no PhysX +
3DMark Vantage - 3DM Vant. Perf. GPU no PhysX
min: 12674     avg: 15409     median: 16126 (9%)     max: 18466 Points
ATI Radeon HD 3200
62 -100%
...
14050 -9%
14096 -9%
AMD Radeon Pro 455
14879 -3%
14884 -3%
14890 -3%
NVIDIA GeForce GTX 950M
14938 -3%
AMD Radeon RX Vega 7
15016 -3%
15029 -2%
15307 -1%
Intel UHD Graphics 64EUs (Alder Lake 12th Gen)
15409
15471 0%
NVIDIA Quadro P520
15552 1%
NVIDIA GeForce GT 750M SLI
15629 1%
15925 3%
16234 5%
16462 7%
17631 14%
AMD Radeon Pro 460
17700 15%
AMD Radeon Pro 560
17782 15%
...
132443 760%
max:
170928 1009%
0%
100%
3DMark 05 - 3DMark 05 - Standard
min: 26272     avg: 35662     median: 36705 (40%)     max: 41013 Points
Intel Graphics Media Accelerator (GMA) 500
133.4 -100%
...
29194 -18%
29690 -17%
29851 -16%
30785 -14%
31017 -13%
Intel UHD Graphics Xe 32EUs (Tiger Lake-H)
31699 -11%
32434 -9%
33386 -6%
35183 -1%
Intel UHD Graphics 64EUs (Alder Lake 12th Gen)
35662
36878 3%
NVIDIA GeForce GTX 1080 Mobile
37669 6%
AMD Radeon RX Vega 7
38073 7%
38999 9%
39066 10%
42967 20%
43138 21%
AMD Radeon 680M
43450 22%
AMD Radeon 660M
43616 22%
...
61850 73%
max:
87172 144%
0%
100%
3DMark 06 3DMark 06 - Standard 1280x1024 +
3DMark 06
min: 22825     avg: 26660     median: 25362 (33%)     max: 33042 Points
Unigine Valley 1.0 - Unigine Valley 1.0 DX
min: 10     avg: 11.2     median: 11.7 (4%)     max: 12.8 fps
SPECviewperf 12
specvp12 sw-03 +
SPECviewperf 12 - specvp12 sw-03
min: 38.3     avg: 40.7     median: 38.9 (10%)     max: 44.5 fps
specvp12 snx-02 +
SPECviewperf 12 - specvp12 snx-02
min: 2.81     avg: 3.4     median: 3.4 (1%)     max: 3.89 fps
specvp12 showcase-01 +
SPECviewperf 12 - specvp12 showcase-01
min: 13.1     avg: 14.4     median: 15.1 (3%)     max: 15.9 fps
specvp12 mediacal-01 +
SPECviewperf 12 - specvp12 mediacal-01
min: 4.98     avg: 7     median: 8.3 (2%)     max: 9.12 fps
specvp12 maya-04 +
SPECviewperf 12 - specvp12 maya-04
min: 22.8     avg: 28.4     median: 31.4 (9%)     max: 33.4 fps
specvp12 energy-01 +
SPECviewperf 12 - specvp12 energy-01
min: 0.24     avg: 0.5     median: 0.6 (1%)     max: 0.78 fps
specvp12 creo-01 +
SPECviewperf 12 - specvp12 creo-01
min: 6.44     avg: 17.5     median: 18.4 (7%)     max: 21.1 fps
specvp12 catia-04 +
SPECviewperf 12 - specvp12 catia-04
min: 22.8     avg: 27.6     median: 29.9 (5%)     max: 34.5 fps
specvp12 3dsmax-05 +
SPECviewperf 12 - specvp12 3dsmax-05
min: 29.5     avg: 32.6     median: 34.2 (6%)     max: 36.2 fps
SPECviewperf 13 specvp13 sw-04 +
SPECviewperf 13 - specvp13 sw-04
min: 46.6     avg: 49.2     median: 47.2 (13%)     max: 53.9 fps
specvp13 snx-03 +
SPECviewperf 13 - specvp13 snx-03
min: 5.06     avg: 6     median: 6.1 (1%)     max: 6.68 fps
specvp13 showcase-02 +
SPECviewperf 13 - specvp13 showcase-02
min: 13.1     avg: 14.3     median: 15 (3%)     max: 15.7 fps
specvp13 medical-02 +
SPECviewperf 13 - specvp13 medical-02
min: 4.48     avg: 7.2     median: 8.6 (2%)     max: 10.9 fps
specvp13 maya-05 +
SPECviewperf 13 - specvp13 maya-05
min: 32.1     avg: 36.8     median: 38.2 (4%)     max: 41.3 fps
specvp13 energy-02 +
SPECviewperf 13 - specvp13 energy-02
min: 0.92     avg: 1.9     median: 2.6 (1%)     max: 2.82 fps
specvp13 creo-02 +
SPECviewperf 13 - specvp13 creo-02
min: 26.5     avg: 30.3     median: 32.4 (5%)     max: 33.1 fps
specvp13 catia-05 +
SPECviewperf 13 - specvp13 catia-05
min: 32.7     avg: 39.6     median: 42.8 (5%)     max: 49.6 fps
specvp13 3dsmax-06 +
SPECviewperf 13 - specvp13 3dsmax-06
min: 29.3     avg: 32.4     median: 34.1 (6%)     max: 36 fps
SPECviewperf 2020 specvp2020 solidworks-05 4k +
SPECviewperf 2020 - specvp2020 solidworks-05 4k
min: 5.05     avg: 5.1     median: 5.1 (2%)     max: 5.1 fps
specvp2020 snx-04 4k +
specvp2020 medical-03 4k +
SPECviewperf 2020 - specvp2020 medical-03 4k
min: 0.78     avg: 1.2     median: 0.8 (1%)     max: 2.54 fps
specvp2020 maya-06 4k +
SPECviewperf 2020 - specvp2020 maya-06 4k
min: 15.3     avg: 16.8     median: 15.4 (3%)     max: 21.2 fps
specvp2020 energy-03 4k +
SPECviewperf 2020 - specvp2020 energy-03 4k
min: 0.52     avg: 1     median: 0.8 (0%)     max: 1.9 fps
specvp2020 creo-03 4k +
SPECviewperf 2020 - specvp2020 creo-03 4k
min: 9.17     avg: 10.2     median: 9.4 (4%)     max: 12.7 fps
specvp2020 catia-06 4k +
SPECviewperf 2020 - specvp2020 catia-06 4k
min: 5.24     avg: 5.8     median: 5.3 (3%)     max: 7.63 fps
specvp2020 3dsmax-07 4k +
SPECviewperf 2020 - specvp2020 3dsmax-07 4k
min: 6.95     avg: 7.4     median: 7 (3%)     max: 8.65 fps
Cinebench R10 Cinebench R10 Shading (32bit) +
Cinebench R10 - Cinebench R10 Shading (32bit)
min: 14413     avg: 17390     median: 17783 (13%)     max: 19969 points
Cinebench R11.5 Cinebench R11.5 OpenGL 64 Bit +
Cinebench R11.5 - Cinebench R11.5 OpenGL 64 Bit
min: 68.25     avg: 83.7     median: 81.5 (28%)     max: 95.55 fps
Cinebench R15
Cinebench R15 OpenGL 64 Bit +
Cinebench R15 - Cinebench R15 OpenGL 64 Bit
min: 74.5     avg: 94.5     median: 93.4 (5%)     max: 117.3 fps
Cinebench R15 OpenGL Ref. Match 64 Bit +
Cinebench R15 - Cinebench R15 OpenGL Ref. Match 64 Bit
97.8 % (98%)
GFXBench - GFXBench 5.0 4K Aztec Ruins High Tier Offscreen
17.9 fps (7%)
GFXBench - GFXBench 5.0 Aztec Ruins High Tier Offscreen
42.4 fps (8%)
3.3 -92%
...
Intel UHD Graphics Xe G4 48EUs
24 -43%
Intel UHD Graphics Xe 32EUs (Tiger Lake-H)
24.3 -43%
AMD Radeon 540X
24.9 -41%
AMD Radeon RX Vega 7
26.8 -37%
27 -36%
NVIDIA Quadro P520
29.56 -30%
33.3 -21%
AMD Radeon RX 550X (Laptop)
33.4 -21%
39.06 -8%
Intel UHD Graphics 64EUs (Alder Lake 12th Gen)
42.4
44.4 5%
44.86 6%
45 6%
NVIDIA GeForce GTX 1050 Max-Q
48.1 13%
48.6 15%
AMD Radeon 680M
49.2 16%
NVIDIA GeForce GTX 1050 Ti Max-Q
49.5 17%
AMD Radeon RX 560X (Laptop)
52.4 24%
58.3 38%
...
536 1164%
0%
100%
GFXBench - GFXBench 5.0 Aztec Ruins Normal Tier Offscreen
118.5 fps (9%)
GFXBench - GFXBench Car Chase Offscreen
101.4 fps (11%)
GFXBench 3.1 - GFXBench Manhattan ES 3.1 Offscreen
130.9 fps (3%)
GFXBench 3.0 - GFXBench 3.0 Manhattan Offscreen
234.9 fps (14%)
GFXBench (DX / GLBenchmark) 2.7
GFXBench T-Rex HD Offscreen C24Z16 +
GFXBench (DX / GLBenchmark) 2.7 - GFXBench T-Rex HD Offscreen C24Z16
320.3 fps (3%)
Basemark GPU 1.2 - Basemark GPU 1.2 Vulkan Official Medium Offscreen 1080
min: 104.6     avg: 157.9     median: 148 (1%)     max: 289 fps
Basemark GPU 1.2 - Basemark GPU 1.2 Vulkan Official High Offscreen 2160
min: 3.64     avg: 8.7     median: 9.4 (2%)     max: 11.6 fps
Geekbench 6.2 - Geekbench 6.2 GPU OpenCL
min: 8359     avg: 10212     median: 11174 (3%)     max: 12297 points
Geekbench 6.2 - Geekbench 6.2 GPU Vulkan
min: 10236     avg: 12504     median: 13760 (4%)     max: 14850 points
LuxMark v2.0 64Bit - LuxMark v2.0 Room GPU
min: 448     avg: 562     median: 558 (3%)     max: 743 Samples/s
LuxMark v2.0 64Bit - LuxMark v2.0 Sala GPU
min: 1164     avg: 1623     median: 1717 (3%)     max: 2059 Samples/s
ComputeMark v2.1 - ComputeMark v2.1 Result
min: 1724     avg: 2185     median: 2353 (3%)     max: 2657 points
Power Consumption - Furmark Stress Test Power Consumption - external Monitor *
min: 28.6     avg: 44.1     median: 42.2 (6%)     max: 62.1 Watt
051015202530354045505560657075808590Tooltip
Power Consumption - The Witcher 3 Power Consumption - external Monitor *
min: 24.4     avg: 46     median: 47.6 (7%)     max: 66.5 Watt
05101520253035404550556065707580859095Tooltip
Power Consumption - Witcher 3 Power Consumption *
min: 34.5     avg: 41.5     median: 34.9 (8%)     max: 55.2 Watt
051015202530354045505560Tooltip
Power Consumption - Witcher 3 ultra Power Efficiency
min: 0.2023     avg: 0.2     median: 0.2 (22%)     max: 0.25 fps per Watt
Power Consumption - Witcher 3 ultra Power Efficiency - external Monitor
min: 0.1789     avg: 0.2     median: 0.2 (18%)     max: 0.25 fps per Watt
Emissions Witcher 3 Fan Noise +
Emissions - Witcher 3 Fan Noise
min: 36.2     avg: 39.5     median: 38.3 (61%)     max: 45.2 dB(A)
- Range of benchmark values for this graphics card
- Average benchmark values for this graphics card
* Smaller numbers mean a higher performance

Game Benchmarks

The following benchmarks stem from our benchmarks of review laptops. The performance depends on the used graphics memory, clock rate, processor, system settings, drivers, and operating systems. So the results don't have to be representative for all laptops with this GPU. For detailed information on the benchmark results, click on the fps number.

F1 23

F1 23

2023
low 1920x1080
24.2 24.6 28.6 31.1 32.3 ~ 28 fps    + Compare
med. 1920x1080
21.6 22.1 26.2 28.3 29.2 ~ 25 fps    + Compare
high 1920x1080
14.8 15.2 18.2 19.5 19.9 ~ 18 fps    + Compare
ultra 1920x1080
14.1 15.1 15.2 ~ 15 fps    + Compare
» The benchmarks indicate that the game is not playable in the tested settings.
Additional Benchmarks
Ultra Low Preset TAA 1280x720
46
47.1
57
57.7
49.8
low 1920x1080
23.3  fps    + Compare
med. 1920x1080
21.4  fps    + Compare
high 1920x1080
16.7  fps    + Compare
» The benchmarks indicate that the game is not playable in the tested settings.
Additional Benchmarks
Minimum Settings 1280x720
48.2
low 1920x1080
12.4  fps    + Compare + 📈 Graph
» The benchmarks indicate that the game is not playable in the tested settings.
Additional Benchmarks
Ultra Low Preset 1280x720
22
low 1920x1080
24.4  fps    + Compare + 📈 Graph
med. 1920x1080
17.5  fps    + Compare + 📈 Graph
high 1920x1080
12.5  fps    + Compare + 📈 Graph
» The benchmarks indicate that the game is not playable in the tested settings.
Additional Benchmarks
Low Preset 1280x720
34.9
low 1920x1080
17.1  fps    + Compare + 📈 Graph
med. 1920x1080
11.6  fps    + Compare + 📈 Graph
» The benchmarks indicate that the game is not playable in the tested settings.
Additional Benchmarks
Low Preset Low TAA 1280x720
24.2
low 1920x1080
11.7 (!)  fps    + Compare + 📈 Graph
» The benchmarks indicate that the game is not playable in the tested settings.
Additional Benchmarks
Low Preset TAA 1280x720
18.9 (!)
low 1920x1080
33.4  fps    + Compare + 📈 Graph
med. 1920x1080
20.1  fps    + Compare + 📈 Graph
high 1920x1080
18.2  fps    + Compare + 📈 Graph
» The benchmarks indicate that the game is not playable in the tested settings.
Additional Benchmarks
Low Preset 1280x720
50.1
low 1920x1080
19.7  fps    + Compare
med. 1920x1080
13.6  fps    + Compare
» The benchmarks indicate that the game is not playable in the tested settings.
Additional Benchmarks
Low Preset (without FSR Upscaling) 1280x720
33
low 1920x1080
20.8  fps    + Compare + 📈 Graph
med. 1920x1080
17.1  fps    + Compare + 📈 Graph
high 1920x1080
14.1  fps    + Compare + 📈 Graph
» The benchmarks indicate that the game is not playable in the tested settings.
Additional Benchmarks
Low Preset 1280x720
33.1
low 1920x1080
22.4 (!)  fps    + Compare + 📈 Graph
med. 1920x1080
19.5 (!)  fps    + Compare + 📈 Graph
high 1920x1080
18.5 (!)  fps    + Compare + 📈 Graph
» The benchmarks indicate that the game is not playable in the tested settings.
Additional Benchmarks
Very Low Preset 1280x720
35.9 (!)
low 1920x1080
24  fps    + Compare
med. 1920x1080
21  fps    + Compare
high 1920x1080
18  fps    + Compare
» The benchmarks indicate that the game is not playable in the tested settings.
Additional Benchmarks
Basic Quality Preset T2X SMAA 1280x720
39
low 1920x1080
13.8  fps    + Compare + 📈 Graph
» The benchmarks indicate that the game is not playable in the tested settings.
Additional Benchmarks
Low Preset 1280x720
17.9
F1 22

F1 22

2022
low 1920x1080
27.1 27.3 27.9 31.7 34.4 35.2 37.6 ~ 32 fps    + Compare
med. 1920x1080
24.3 24.5 24.9 29.4 31.3 31.9 34 ~ 29 fps    + Compare
high 1920x1080
17.2 17.5 17.7 21.1 21.9 22.1 24.7 ~ 20 fps    + Compare
ultra 1920x1080
13.4 13.5 13.6 16.6 17.3 17.3 18.8 ~ 16 fps    + Compare
» The benchmarks indicate that the game is not playable in the tested settings.
Additional Benchmarks
Ultra Low Preset 16xAF TAA 1280x720
66.2
50.2
48.4
49.8
61.5
61.2
56.4
low 1920x1080
63.2  fps    + Compare + 📈 Graph
med. 1920x1080
38.9  fps    + Compare + 📈 Graph
high 1920x1080
31.4  fps    + Compare + 📈 Graph
ultra 1920x1080
28.1  fps    + Compare + 📈 Graph
» With all tested laptops playable in detail settings med..
Additional Benchmarks
Low Preset 1280x720
107.3
low 1920x1080
18.6  fps    + Compare + 📈 Graph
med. 1920x1080
18.6  fps    + Compare + 📈 Graph
high 1920x1080
18.4  fps    + Compare + 📈 Graph
ultra 1920x1080
18.1  fps    + Compare + 📈 Graph
» The benchmarks indicate that the game is not playable in the tested settings.
Additional Benchmarks
Lowest Settings 1280x720
35.6
low 1920x1080
16.7 17.6 19.4 22.9 25.1 25.5 ~ 21 fps    + Compare
med. 1920x1080
12.7 13.8 16.4 17.8 19.6 19.9 ~ 17 fps    + Compare
high 1920x1080
8.3 8.7 10.6 11 12.1 12.4 ~ 11 fps    + Compare
ultra 1920x1080
6 6.4 6.7 8.1 9.3 9.7 ~ 8 fps    + Compare
» The benchmarks indicate that the game is not playable in the tested settings.
Additional Benchmarks
Lowest Preset (DX12) 1280x720
48.2
46.8
32.3
29.4
43.6
27
low 1920x1080
18  fps    + Compare
med. 1920x1080
14.7  fps    + Compare
high 1920x1080
11.3  fps    + Compare
» The benchmarks indicate that the game is not playable in the tested settings.
Additional Benchmarks
Low Preset 1280x720
31.8
low 1920x1080
56.1  fps    + Compare
med. 1920x1080
41.6  fps    + Compare
high 1920x1080
34.4  fps    + Compare
ultra 1920x1080
25.3  fps    + Compare
QHD 2560x1440
20.2  fps    + Compare
» With all tested laptops playable in detail settings med..
Additional Benchmarks
Low Preset 1280x720
80.8
low 1920x1080
35.5  fps    + Compare + 📈 Graph
med. 1920x1080
29.1  fps    + Compare + 📈 Graph
high 1920x1080
24.7  fps    + Compare + 📈 Graph
ultra 1920x1080
20.3  fps    + Compare + 📈 Graph
» With all tested laptops playable in detail settings low.
Additional Benchmarks
Low Preset 1280x720
54.4
low 1920x1080
33  fps    + Compare
med. 1920x1080
25  fps    + Compare
high 1920x1080
24  fps    + Compare
» The benchmarks indicate that the game is not playable in the tested settings.
Additional Benchmarks
Ultra Low Preset (with Fixed Resolution Quality) 1280x720
66
low 1920x1080
13.1 18.8 ~ 16 fps    + Compare + 📈 Graph
med. 1920x1080
11.3 16.6 ~ 14 fps    + Compare + 📈 Graph
high 1920x1080
8.9 13.2 ~ 11 fps    + Compare + 📈 Graph
ultra 1920x1080
6.6  fps    + Compare + 📈 Graph
» The benchmarks indicate that the game is not playable in the tested settings.
Additional Benchmarks
Low Preset 1280x720
28.3
20.4
med. 1920x1080
12.1  fps    + Compare + 📈 Graph
» The benchmarks indicate that the game is not playable in the tested settings.
Additional Benchmarks
Low Preset 1920x1080
13.4
low 1280x720
55  fps    + Compare
med. 1920x1080
25  fps    + Compare
high 1920x1080
22  fps    + Compare
» With all tested laptops playable in detail settings low.
Additional Benchmarks
Low Preset 1920x1080
33
low 1280x720
30  fps    + Compare
med. 1920x1080
19  fps    + Compare
high 1920x1080
15  fps    + Compare
ultra 1920x1080
13  fps    + Compare
» The benchmarks indicate that the game is not playable in the tested settings.
Additional Benchmarks
Low Preset 1920x1080
22
Far Cry 6

Far Cry 6

2021
low 1280x720
44.8  fps    + Compare + 📈 Graph
med. 1920x1080
21.6  fps    + Compare + 📈 Graph
high 1920x1080
17.5  fps    + Compare + 📈 Graph
ultra 1920x1080
14.7  fps    + Compare + 📈 Graph
» With all tested laptops playable in detail settings low.
Additional Benchmarks
Low Graphics Quality 1920x1080
26.3
F1 2021

F1 2021

2021
low 1280x720
68.4 69.2 71.5 76.9 82.9 84.8 92.1 96.3 ~ 80 fps    + Compare
med. 1920x1080
30.4 31.1 31.4 34.8 38 39 42.6 44.1 ~ 36 fps    + Compare
high 1920x1080
24.4 24.8 25.2 27.6 30.3 30.7 33.2 35.4 ~ 29 fps    + Compare
ultra 1920x1080
16 16.1 16.2 19.7 20.7 20.9 22.5 24.1 ~ 20 fps    + Compare
» With most tested laptops playable in detail settings med..
Hitman 3

Hitman 3

2021
low 1280x720
71  fps    + Compare
med. 1920x1080
30.9  fps    + Compare
high 1920x1080
24.6  fps    + Compare
ultra 1920x1080
22.5  fps    + Compare
QHD 2560x1440
13.8  fps    + Compare
» With all tested laptops playable in detail settings low.
Additional Benchmarks
Minimum Settings 1920x1080
40.8
low 1280x720
31  fps    + Compare
med. 1920x1080
18  fps    + Compare
high 1920x1080
15  fps    + Compare
» The benchmarks indicate that the game is not playable in the tested settings.
Dirt 5

Dirt 5

2020
low 1280x720
41.4  fps    + Compare
med. 1920x1080
17.6  fps    + Compare
high 1920x1080
14.6  fps    + Compare
» With all tested laptops playable in detail settings low.
low 1280x720
27  fps    + Compare + 📈 Graph
med. 1920x1080
12.5  fps    + Compare + 📈 Graph
» The benchmarks indicate that the game is not playable in the tested settings.
Additional Benchmarks
Low-End TAAAA 1920x1080
19.2
low 1280x720
41.7  fps    + Compare + 📈 Graph
med. 1920x1080
23.8  fps    + Compare + 📈 Graph
high 1920x1080
22.3  fps    + Compare + 📈 Graph
ultra 1920x1080
21.6  fps    + Compare + 📈 Graph
» With all tested laptops playable in detail settings low.
F1 2020

F1 2020

2020
low 1280x720
58.2 60.2 67 72.1 73 78.4 ~ 68 fps    + Compare
med. 1920x1080
27.5 28.3 32.4 35.1 35.5 38.2 ~ 33 fps    + Compare
high 1920x1080
20.5 21 25.7 26.6 26.9 29 ~ 25 fps    + Compare
ultra 1920x1080
12.9 13 16.8 16.9 16.9 18.3 ~ 16 fps    + Compare
» With all tested laptops playable in detail settings low.
low 1280x720
109.9  fps    + Compare
med. 1920x1080
41.7  fps    + Compare
high 1920x1080
25.4  fps    + Compare
ultra 1920x1080
17.6  fps    + Compare
» With all tested laptops playable in detail settings med..
low 1280x720
49.8  fps    + Compare + 📈 Graph
med. 1920x1080
25  fps    + Compare + 📈 Graph
high 1920x1080
22.6  fps    + Compare + 📈 Graph
ultra 1920x1080
22.2  fps    + Compare + 📈 Graph
» With all tested laptops playable in detail settings low.
low 1280x720
57.3  fps    + Compare + 📈 Graph
med. 1920x1080
22  fps    + Compare + 📈 Graph
high 1920x1080
17.9  fps    + Compare + 📈 Graph
» With all tested laptops playable in detail settings low.
low 1280x720
31.4 32.2 32.9 36.8 42.2 43.2 46 ~ 38 fps    + Compare
med. 1920x1080
13.9 14.2 14.4 16.7 18.6 19.1 20.1 ~ 17 fps    + Compare
high 1920x1080
8.3 8.5 8.5 10.7 11.2 11.4 12.1 ~ 10 fps    + Compare
ultra 1920x1080
6 6.2 6.2 8 8.3 8.3 9 ~ 7 fps    + Compare
» With most tested laptops playable in detail settings low.
Additional Benchmarks
Very Low Overall Quality (DX11) 1920x1080
30.3
21.6
20.9
21.4
27.8
28.7
25.7
low 1280x720
45  fps    + Compare
med. 1920x1080
22  fps    + Compare
high 1920x1080
16  fps    + Compare
» With all tested laptops playable in detail settings low.
low 1280x720
33 34 34 35 44 45 48 ~ 39 fps    + Compare + 📈 Graph
med. 1920x1080
17 17 17 19 23 23 24 ~ 20 fps    + Compare + 📈 Graph
high 1920x1080
16 16 16 18 22 22 23 ~ 19 fps    + Compare + 📈 Graph
ultra 1920x1080
15 15 15 16 20 20 21 ~ 17 fps    + Compare + 📈 Graph
» With most tested laptops playable in detail settings low.
low 1280x720
22.3 27.3 27.5 33.1 33.2 37.6 ~ 30 fps    + Compare
med. 1920x1080
12.1 12.3 12.9 15.9 15.9 17 ~ 14 fps    + Compare
high 1920x1080
9.5 9.6 10 11.7 11.7 12.5 ~ 11 fps    + Compare
ultra 1920x1080
7.7 7.9 8 9.5 9.5 10.2 ~ 9 fps    + Compare
» The benchmarks indicate that the game is not playable in the tested settings.
low 1280x720
33.4 34.2 34.9 36.1 40.5 40.7 41.2 ~ 37 fps    + Compare
med. 1920x1080
15 15.3 15.5 17.7 18.8 19.2 19.9 ~ 17 fps    + Compare
high 1920x1080
14.1 14.3 16.5 17.6 17.9 18.8 ~ 17 fps    + Compare
ultra 1920x1080
11.9 14.1 15 15.2 15.7 ~ 14 fps    + Compare
» With most tested laptops playable in detail settings low.
Additional Benchmarks
Lowest Preset 1920x1080
30.2
24.7
23.9
24.3
29.1
29.8
27.2
Strange Brigade

Strange Brigade

2018
low 1280x720
47.9 61.7 63.4 67.4 76.4 77.3 78.1 84.5 89.1 ~ 72 fps    + Compare
med. 1920x1080
17.9 25.1 25.1 29.9 32.2 32.3 32.4 34.5 38.6 ~ 30 fps    + Compare
high 1920x1080
15.3 19.8 19.9 23.3 25.5 25.5 25.6 27.2 30 ~ 24 fps    + Compare
ultra 1920x1080
0 (!) 16.8 16.8 20.2 20.3 20.5 22.1 24.4 ~ 18 fps    + Compare
» With all tested laptops playable in detail settings low.
Far Cry 5

Far Cry 5

2018
low 1280x720
25 35 36 36 36 46 46 50 53 ~ 40 fps    + Compare + 📈 Graph
med. 1920x1080
13 17 17 17 18 22 22 24 25 ~ 19 fps    + Compare + 📈 Graph
high 1920x1080
16 16 16 17 21 21 22 23 ~ 19 fps    + Compare + 📈 Graph
ultra 1920x1080
14 15 15 16 19 19 21 21 ~ 18 fps    + Compare + 📈 Graph
QHD 2560x1440
14  fps    + Compare + 📈 Graph
» With most tested laptops playable in detail settings low.
Additional Benchmarks
Low Preset TAA 1920x1080
28
27
19
19
19
25
26
21
low 1280x720
29.1 34.2 36.2 36.8 41.3 43 47.6 48.1 52.6 61 ~ 43 fps    + Compare
med. 1920x1080
24.2 24.4 24.9 25.3 31.2 33.1 34.3 34.4 39.7 42.7 ~ 31 fps    + Compare
high 1920x1080
21.5 21.9 22 23.3 26 27.1 29.6 29.7 35.4 38 ~ 27 fps    + Compare
» With most tested laptops playable in detail settings low.
low 1280x720
21.9 28.1 29.3 30.6 31.8 36.1 36.2 38.2 39.6 39.9 ~ 33 fps    + Compare
med. 1920x1080
12.4 14.5 15.3 16.5 17.4 19.1 19.4 20.1 21.4 21.9 ~ 18 fps    + Compare
high 1920x1080
8.4 10.4 11 11.3 13 13.5 13.8 14.5 15.2 21.4 ~ 13 fps    + Compare
» The benchmarks indicate that the game is not playable in the tested settings.
low 1280x720
76 100.7 106.2 106.9 112.4 115.2 119.5 125.5 133.3 134.7 134.7 ~ 115 fps    + Compare
med. 1366x768
61.1 70.5 74.6 79.2 84.1 84.7 86.5 88.9 93.4 99.6 100.9 ~ 84 fps    + Compare
high 1920x1080
37.1 43.3 44.4 44.7 47.9 48.3 54.8 55 57.8 58.3 62.7 ~ 50 fps    + Compare
ultra 1920x1080
34.4 40.4 41 41.6 43.9 45.1 50.2 50.7 53.3 54 57.5 ~ 47 fps    + Compare
» With most tested laptops playable in detail settings ultra.
low 1024x768
48 51 59.5 60.8 62.4 64.3 74 77.3 78.9 80.8 85.3 ~ 67 fps    + Compare + 📈 Graph
med. 1366x768
31 36.4 37 37.5 39 41.5 48.9 49.8 52.4 56 ~ 43 fps    + Compare + 📈 Graph
high 1920x1080
15 19.2 20 20 20.2 22.7 25.7 26.2 26.9 30.1 30.2 ~ 23 fps    + Compare + 📈 Graph
ultra 1920x1080
7.1 9.6 10 10.2 10.2 11 11.4 11.4 11.9 13.1 13.8 ~ 11 fps    + Compare + 📈 Graph
» With most tested laptops playable in detail settings med..
Additional Benchmarks
Medium Graphics & Postprocessing 1920x1080
31.6
23.9
22.4
23.7
24.9
30.6
27.1
GTA V

GTA V

2015
low 1024x768
55.6 92.6 97.7 108.8 108.9 116.1 117.3 118.3 129.9 141.9 ~ 109 fps    + Compare
med. 1366x768
42.5 71.8 83 90.1 91.9 97.1 97.4 100.9 113.4 121.2 ~ 91 fps    + Compare
high 1920x1080
8.6 14.4 14.6 16.4 16.9 17.1 17.6 18.5 20.8 ~ 16 fps    + Compare
ultra 1920x1080
6.2 6.3 7.1 7.1 7.4 8 8.9 ~ 7 fps    + Compare
QHD 2560x1440
5.6  fps    + Compare
» With all tested laptops playable in detail settings med..
Additional Benchmarks
Normal/Off 4xAF 1920x1080
81.1
63.3
73.4
61.5
59.2
61.3
70.4
70
60.5
Lowest Settings possible 1920x1080
95.1
74
61.2
58.8
60.7
72.3
71.4
61.4
lowmed.highultraQHD4K
F1 2328251815
Company of Heroes 323.321.416.7
Sons of the Forest12.4
Atomic Heart24.417.512.5
Hogwarts Legacy17.111.6
Dead Space Remake11.7
High On Life33.420.118.2
The Callisto Protocol19.713.6
Need for Speed Unbound20.817.114.1
Spider-Man Miles Morales22.419.518.5
Call of Duty Modern Warfare 2 2022242118
The Quarry13.8
F1 2232292016
Vampire Bloodhunt63.238.931.428.1
Ghostwire Tokyo18.618.618.418.1
Tiny Tina's Wonderlands2117118
Cyberpunk 2077 1.61814.711.3
GRID Legends56.141.634.425.320.2
Elden Ring35.529.124.720.3
Rainbow Six Extraction332524
God of War1614116.64
Halo Infinite12.1
Forza Horizon 5552522
Riders Republic30191513
Far Cry 644.821.617.514.7
F1 202180362920
Hitman 37130.924.622.513.8
Assassin´s Creed Valhalla311815
Dirt 541.417.614.6
Flight Simulator 20202712.5
Death Stranding41.723.822.321.6
F1 202068332516
Gears Tactics109.941.725.417.6
Doom Eternal49.82522.622.2
Hunt Showdown57.32217.9
Borderlands 33817107
The Division 2452216
Far Cry New Dawn39201917
Metro Exodus3014119
Shadow of the Tomb Raider37171714
Strange Brigade72302418
Far Cry 54019191814
X-Plane 11.11433127
Final Fantasy XV Benchmark331813
Dota 2 Reborn115845047
The Witcher 367432311
GTA V109911675.61
< 30 fps
< 60 fps
< 120 fps
≥ 120 fps
16
21
9
33
9
2
37
3

24
1

4


For more games that might be playable and a list of all games and graphics cards visit our Gaming List

v1.26
log 19. 04:29:51

#0 no ids found in url (should be separated by "_") +0s ... 0s

#1 not redirecting to Ajax server +0s ... 0s

#2 did not recreate cache, as it is less than 5 days old! Created at Tue, 16 Apr 2024 05:39:00 +0200 +0.001s ... 0.001s

#3 no comparison url found in template nbc.compare_page_1 needed +0.039s ... 0.04s

#4 no comparison url found in template nbc.compare_page_1 needed +0s ... 0.04s

#5 no comparison url found in template nbc.compare_page_1 needed +0s ... 0.04s

#6 no comparison url found in template nbc.compare_page_1 needed +0s ... 0.04s

#7 no comparison url found in template nbc.compare_page_1 needed +0s ... 0.04s

#8 no comparison url found in template nbc.compare_page_1 needed +0s ... 0.04s

#9 no comparison url found in template nbc.compare_page_1 needed +0s ... 0.04s

#10 no comparison url found in template nbc.compare_page_1 needed +0s ... 0.04s

#11 composed specs +0s ... 0.04s

#12 did output specs +0s ... 0.04s

#13 start showIntegratedCPUs +0s ... 0.04s

#14 getting avg benchmarks for device 11122 +0.033s ... 0.074s

#15 got single benchmarks 11122 +0.074s ... 0.147s

#16 got avg benchmarks for devices +0s ... 0.147s

#17 min, max, avg, median took s +1.118s ... 1.266s

#18 before gaming benchmark output +0s ... 1.266s

#19 Got 583 rows for game benchmarks. +0.069s ... 1.335s

#20 composed SQL query for gamebenchmarks +0s ... 1.335s

#21 got data and put it in $dataArray +0.04s ... 1.375s

#22 benchmarks composed for output. +1.622s ... 2.996s

#23 no comparison url found in template nbc.compare_page_1 needed +0.006s ... 3.003s

#24 return log +0s ... 3.003s

Notebook reviews with Intel UHD Graphics 64EUs (Alder Lake 12th Gen) graphics card

Nipogi AD08 微型电脑评测:搭载英特尔酷睿 i7-12650H 处理器的时尚电脑,采用迷你塔式设计和三种电源模式

Nipogi AD08 微型电脑评测:搭载英特尔酷睿 i7-12650H 处理器的时尚电脑,采用迷你塔式设计和三种电源模式

NiPoGi 为 AD08 配备了英特尔酷睿 i7-12650H,其性能足以胜任日常办公任务。作为一款采用塔式设计的紧凑型游戏电脑,该制造商在设计上走了一条略有不同的路线。在本评测中,您可以了解到这一设计带来的优势,以及 NiPoGi AD08 与同类迷你 PC 相比的性能表现。...
Intel Core i7-12650H | Intel UHD Graphics 64EUs (Alder Lake 12th Gen) | | 878 g
Nipogi AD08 微型电脑评测:搭载英特尔酷睿 i7-12650H 处理器的时尚电脑,采用迷你塔式设计和三种电源模式

Nipogi AD08 微型电脑评测:搭载英特尔酷睿 i7-12650H 处理器的时尚电脑,采用迷你塔式设计和三种电源模式

NiPoGi 为 AD08 配备了英特尔酷睿 i7-12650H,其性能足以胜任日常办公任务。作为一款采用塔式设计的紧凑型游戏电脑,该制造商在设计上走了一条略有不同的路线。在本评测中,您可以了解到这一设计带来的优势,以及 NiPoGi AD08 与同类迷你 PC 相比的性能表现。...
Intel Core i7-12650H | Intel UHD Graphics 64EUs (Alder Lake 12th Gen) | | 878 g
HP 250 G9 评测--配备酷睿 i3 处理器和 IPS 面板的经济型办公笔记本电脑

HP 250 G9 评测--配备酷睿 i3 处理器和 IPS 面板的经济型办公笔记本电脑

惠普推出的 250 G9 是一款价格合理的 15.6 英寸办公笔记本电脑,配备英特尔酷睿 i3 处理器和雾面 IPS 显示屏,售价约为 390 美元。该设备的性能足以胜任基本任务,但风扇很快就会让人厌烦。 ...
Intel Core i3-1215U | Intel UHD Graphics 64EUs (Alder Lake 12th Gen) | 15.60" | 1.7 kg
Geekom 迷你 IT12

配备英特尔酷睿 i5-12450H 处理器的 Geekom Mini IT12 评测 - 性能卓越、配备两个 USB 4 端口的迷你 PC

Geekom Mini IT12 沿用了众所周知的英特尔 NUC 设计。它配备了具有 8 核 12 线程的英特尔 Alder Lake 移动 SoC,我们在这次测试中对其性能进行了全面检验,以确定它是否能超越之前领先的英特尔产品。由于配备了两个 USB 4 接口,我们深入研究了它与外置 GPU 配对后的游戏能力。...
Intel Core i5-12450H | Intel UHD Graphics 64EUs (Alder Lake 12th Gen) | | 572 g

NiPoGi CK10: Intel Core i5-12450H, 0.5 kg
  Review » NiPoGi CK10 评测--配备英特尔酷睿 i5-12450H 和 16GB 内存的迷你 PC 未达预期效果

Minisforum Venus Series UN1245: Intel Core i5-12450H, 0.5 kg
  Review » Minisforum Venus 系列 UN1245 评测:配备英特尔酷睿 i5-12450H 的强大迷你 PC,310 美元起售

GMK NucBox K3 Pro: Intel Core i7-12650H, 0.4 kg
  Review » GMK NucBox K3 Pro 迷你电脑评测:NucBox K2 更出色

Minisforum Venus Series NAB6: Intel Core i7-12650H, 0.6 kg
  Review » Minisforum Venus系列NAB6回顾:拥有快速的英特尔酷睿i7-12650H和主动式固态硬盘冷却的时尚迷你PC!

Lenovo IdeaPad Flex 5 14IAU7-82R7007TGE: Intel Core i3-1215U, 14.00", 1.6 kg
  Review » 联想IdeaPad Flex 5可转换审查。小型i3-1215U的强大入口

HP 14-ep0865no: Intel Core i3-1315U, 14.00", 2.2 kg
  External Review » HP 14-ep0865no

Infinix Y4 Max: Intel Core i3-1315U, 16.00", 1.8 kg
  External Review » Infinix Y4 Max

Asus Vivobook 14 X1404ZA: Intel Core i3-1215U, 14.00", 1.4 kg
  External Review » Asus Vivobook 14 X1404ZA

Dell Vostro 3520, i3-1215U: Intel Core i3-1215U, 15.60", 1.7 kg
  External Review » Dell Vostro 3520, i3-1215U

Dell Inspiron 15 3520, i3-1215U: Intel Core i3-1215U, 15.60", 1.9 kg
  External Review » Dell Inspiron 15 3520, i3-1215U

Lenovo IdeaPad Slim 5 14IRL8: Intel Core i7-13620H, 14.00", 1.5 kg
  External Review » Lenovo IdeaPad Slim 5 14IRL8

Lenovo IdeaPad Flex 5 14IRU8, i3-1315U: Intel Core i3-1315U, 14.00", 1.5 kg
  External Review » Lenovo IdeaPad Flex 5 14IRU8, i3-1315U

HP 14-ee0035ng: Intel Core i3-1315U, 14.00", 1.4 kg
  External Review » HP 14-ee0035ng

HP 240 G9: Intel Core i3-1215U, 14.00", 1.4 kg
  External Review » HP 240 G9

Lenovo IdeaPad Slim 3 15IRU8: Intel Core i3-1315U, 15.60", 1.6 kg
  External Review » Lenovo IdeaPad Slim 3 15IRU8

Acer Aspire 5 A514-55: Intel Core i3-1215U, 14.00", 1.7 kg
  External Review » Acer Aspire 5 A514-55

Lenovo IP Flex 5 Chrome 14IAU7 Plus: Intel Core i3-1315U, 14.00", 1.6 kg
  External Review » Lenovo IP Flex 5 Chrome 14IAU7

HP 15s-fq5000TU: Intel Core i3-1215U, 15.60", 1.7 kg
  External Review » HP 15s-fq5000TU

Acer Chromebook Plus 515 CB515-2H: Intel Core i3-1215U, 15.60", 1.7 kg
  External Review » Acer Chromebook Plus 515 CB515-2H

Asus Chromebook Plus CX3402: Intel Core i3-1215U, 14.00", 1.4 kg
  External Review » Asus Chromebook Plus CX3402

Lenovo IP 5 Chrome 16IAU7: Intel Core i3-1215U, 16.00", 1.8 kg
  External Review » Lenovo IP 5 Chrome 16IAU7

MSI Modern 15 B12M, i3-1215U: Intel Core i3-1215U, 15.60", 1.7 kg
  External Review » MSI Modern 15 B12M, i3-1215U

Lenovo V17 G4 IRU: Intel Core i3-1315U, 17.30", 2 kg
  External Review » Lenovo V17 G4 IRU

HP Chromebook x360 14c-cd000: Intel Core i3-1215U, 14.00", 1.5 kg
  External Review » HP Chromebook x360 14c-cd000

Acer Aspire 5 A515-58, i3-1315U: Intel Core i3-1315U, 15.60", 1.8 kg
  External Review » Acer Aspire 5 A515-58, i3-1315U

Lenovo IdeaPad 3 14IAU7: Intel Core i3-1215U, 14.00", 1.4 kg
  External Review » Lenovo IdeaPad 3 14IAU7

Asus ExpertBook B1 B1502CBA: Intel Core i3-1215U, 15.60", 1.7 kg
  External Review » Asus ExpertBook B1 B1502CBA

Asus Vivobook 14 A1405VA, i3-1315U: Intel Core i3-1315U, 14.00", 1.6 kg
  External Review » Asus Vivobook 14 A1405VA, i3-1315U

Asus Vivobook 14 A1405ZA: Intel Core i3-1215U, 14.00", 1.6 kg
  External Review » Asus Vivobook 14 A1405ZA

Asus VivoBook 14 F1402ZA, i3-1215U: Intel Core i3-1215U, 14.00", 1.5 kg
  External Review » Asus VivoBook 14 F1402ZA, i3-1215U

Acer Chromebook Vero 514 CBV514-1H-321H: Intel Core i3-1215U, 14.00", 1.5 kg
  External Review » Acer Chromebook Vero 514 CBV514-1H-321H

Lenovo IdeaPad Duet 5 12IAU7, i3-1215U: Intel Core i3-1215U, 12.40", 0.8 kg
  External Review » Lenovo IdeaPad Duet 5 12IAU7, i3-1215U

Nokia PureBook Pro 15, i3-1220P: Intel Core i3-1220P, 16.00", 2 kg
  External Review » Nokia PureBook Pro 15, i3-1220P

Asus Vivobook 15 X1502ZA, i3-1220P: Intel Core i3-1220P, 15.60", 1.7 kg
  External Review » Asus Vivobook 15 X1502ZA, i3-1220P

Asus Vivobook 16X X1603ZA, i3-1220P: Intel Core i3-1220P, 16.00", 1.9 kg
  External Review » Asus Vivobook 16X X1603ZA, i3-1220P

Acer Aspire 5 A515-57-335Y: Intel Core i3-1220P, 15.60", 1.8 kg
  External Review » Acer Aspire 5 A515-57-335Y

Lenovo IdeaPad Gaming Chromebook 16, i3-1215U: Intel Core i3-1215U, 16.00", 1.8 kg
  External Review » Lenovo IdeaPad Gaming Chromebook 16, i3-1215U

Lenovo Ideapad 3 15IAU7-82RK001VGE: Intel Core i3-1215U, 15.60", 1.6 kg
  External Review » Lenovo Ideapad 3 15IAU7-82RK001VGE

Acer Aspire 3 A315-59, i3-1215U: Intel Core i3-1215U, 15.60", 1.8 kg
  External Review » Acer Aspire 3 A315-59, i3-1215U

Acer Swift 3 SF314-71-79ZW: Intel Core i7-12650H, 14.00", 1.4 kg
  External Review » Acer Swift 3 SF314-71-79ZW

Acer Aspire 5 A515-57-3488: Intel Core i3-1215U, 15.60", 1.8 kg
  External Review » Acer Aspire 5 A515-57-3488

Nokia PureBook Pro 17: Intel Core i3-1220P, 17.30", 2.5 kg
  External Review » Nokia PureBook Pro 17

Please share our article, every link counts!

» Comparison of GPUs
Detailed list of all laptop GPUs sorted by class and performance.

» Benchmark List
Sort and restrict laptop GPUs based on performance in synthetic benchmarks.

» Notebook Gaming List
Playable games for each graphics card and their average FPS results.

Class 1

GeForce RTX 2080 Super Mobile

Class 2

M1 Max 32-Core GPU *
GeForce RTX 2070 Super Mobile
M1 Max 24-Core GPU *
Quadro RTX 5000 Max-Q
Radeon RX 5700M *
GeForce GTX 1080 Mobile
Quadro RTX 4000 (Laptop)
M1 Pro 16-Core GPU *
Radeon PRO W6600M *
GeForce RTX 2070 Super Max-Q
Quadro RTX 4000 Max-Q *
M1 Pro 14-Core GPU *
Quadro P5200
Quadro RTX 3000 Max-Q *
Quadro P4200
Quadro P5000 Max-Q *
GeForce GTX 980 (Laptop)
Quadro P4000
Quadro P4000 Max-Q
Quadro P3200
Radeon RX 580X (Laptop) *
Radeon RX 580 (Laptop)
Radeon Pro 5300M
Radeon RX 5300M
Quadro P3000 Max-Q *
Quadro T2000 Max-Q *
Radeon Pro WX 7100 *
Radeon RX 570X (Laptop) *
Radeon RX 570 (Laptop) *
Radeon RX 470 (Laptop) *
Quadro T1000 Max-Q *

Class 3

Vega M GH
Quadro M5000M
GeForce GTX 1050 Ti Mobile
Radeon 680M
Quadro P2000
Quadro P2000 Max-Q
Quadro M4000M
T500 Laptop GPU *
Radeon R9 M395X
GeForce GTX 1050 Ti Max-Q *
Radeon Pro Vega 16
WX Vega M GL
Radeon R9 M485X
Quadro M3000M
FirePro W7170M
Radeon R9 M395
GeForce GTX 1050 Max-Q *
Radeon 660M
Radeon Pro WX 4150 *
Radeon RX 560X (Laptop)
Radeon RX 560 (Laptop)
Radeon RX 460 (Laptop)
Quadro P1000
Radeon R9 M390
Xe MAX
Radeon Pro 560X
Radeon Pro 560
Radeon Pro 460
Radeon Pro WX 4130 *
GeForce GTX 960M
Quadro P620 *
Radeon RX 550X (Laptop)
Radeon Pro WX 3200 *
Radeon Pro 555X
Radeon Pro 555
Radeon Pro 455
Quadro P600
Quadro M2000M
Radeon RX 540X *
Radeon Pro WX 2100 *
Radeon Pro WX 3100 *
GeForce GTX 950M
Radeon Pro 450
Radeon 630
Radeon 540X *
Radeon R9 M385X
Quadro P520
Quadro M1000M
GeForce 945M
Quadro P500 *
Iris Plus Graphics G7 (Ice Lake 64 EU) *
Vega 10 *
Iris Pro Graphics 580
FirePro W5170M *
Radeon R9 M370X
Vega 9
FirePro W5130M
UHD Graphics Xe G4 48EUs *
UHD Graphics 32EUs
UHD Graphics Xe 32EUs (Tiger Lake-H) *
UHD Graphics 750
Vega 7
Radeon R7 M465
Iris Pro Graphics 6200
Vega 8
GeForce 940M
Iris Plus Graphics G4 (Ice Lake 48 EU)
Quadro M600M
FirePro W4190M
Radeon R9 M375
Radeon R7 M445
Iris Plus Graphics 650
Iris Graphics 550
Radeon 625
Vega 6 *
Iris Plus Graphics 640
Iris Graphics 540
UHD Graphics 24EUs (Alder Lake-N) *
Radeon R7 M360
GeForce 920M
Radeon 620
Radeon R7 M340
Radeon 610
Radeon 610M *
Vega 6 *
UHD Graphics G1 (Ice Lake 32 EU)
UHD Graphics Xe 16EUs (Tiger Lake-H) *
HD Graphics 530
Radeon R5 (Bristol Ridge)
Adreno 690 *
Adreno 685 *
Adreno 680 *
Radeon R5 M330
GeForce 910M
HD Graphics 520

Class 4

UHD Graphics 730
Radeon R5 M320 *
Radeon R5 M315 *
Radeon R5 M420 *
Vega 2 *
UHD Graphics 617
UHD Graphics 615
HD Graphics 515
UHD Graphics 610
HD Graphics 510
UHD Graphics 605
Radeon R4 (Stoney Ridge)
Radeon R2 (Stoney Ridge)
HD Graphics (Broadwell)
UHD Graphics 600
HD Graphics (Braswell)

Class 5

* Approximate position of the graphics adapter