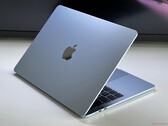
Notebookcheck Logo

Apple M4 8-Core GPU

Apple M4 8-Core GPU

8 核Apple M4 GPU 是内置在最小的M4系列 SoC 中的图形适配器。 最小的Apple M4 系列 SoC中的图形适配器。 新款 iMac.目前还不清楚这是否是 10 核 M4 GPU还是Apple 实际上现在生产的全新 M4 SoC 在设计上减少了 CPU 和 GPU 内核。一些流行的视频编解码器可以在这里进行硬件解码和硬件编码,但这些编解码器的数量远不及当前的 AMD iGPU,更不用说英特尔 iGPU 了。不过,这里提供了大量现代技术,如光线追踪技术。

与Apple M4 芯片的其他部分一样,图形适配器也是采用 "第二代 3 纳米 "台积电工艺制造的,这种工艺到 2024 年底仍是最先进的。它可以访问 16 或 24 千兆字节的 LPDDR5X-7500 统一内存(与 CPU 一起),除了 iMac 的内部显示器外,还允许连接一个分辨率 "高达 6K "的显示器,而 10 核 GPU 可以驱动 2 个这样的显示器。

其性能预计比 10 核 M4 GPU 低 15%左右。 10 核 M4 GPU.不过,它的速度至少与 Radeon 760M的速度。

Apple M4 Series

M4 Max 40-Core GPU 40 ? Bit @ 8533 MHz
M4 Max 32-Core GPU 32 ? Bit @ 8533 MHz
M4 Pro 20-Core GPU 20 ? Bit @ 8533 MHz
M4 Pro 16-Core GPU 16
M4 10-Core GPU 10
M4 8-Core GPU 8
iGPUIntegrated Graphics
Pipelines8 - unified
Memory TypeLPDDR5X-7500
Shared Memoryyes
Power Consumption4 Watt
Man. Technology3 nm
Date of Announcement28.10.2024
PredecessorM3 8-Core GPU
CPU in M4 8-Core GPUGPU Base SpeedGPU Boost / Turbo
Apple M4 8-Core8 x 2900 MHz, 5 W? MHz? MHz

Benchmarks

3DMark - 3DMark Steel Nomad
716 Points (5%)
3DMark - 3DMark Steel Nomad Light
3168 Points (7%)
3DMark - 3DMark Wild Life Extreme Unlimited
7612 Points (9%)
Blender - Blender 3.3 Classroom METAL *
110 Seconds (12%)
GFXBench - GFXBench 5.0 4K Aztec Ruins High Tier Offscreen
48.5 fps (18%)
GFXBench - GFXBench 5.0 Aztec Ruins High Tier Offscreen
106.7 fps (19%)
Restrict / Search: Model: Max. age: years
GFXBench - GFXBench 5.0 Aztec Ruins Normal Tier Offscreen
304.8 fps (23%)
GFXBench - GFXBench Car Chase Offscreen
231.4 fps (22%)
GFXBench 3.1 - GFXBench Manhattan ES 3.1 Offscreen
324.7 fps (7%)
GFXBench 3.0 - GFXBench 3.0 Manhattan Offscreen
520 fps (22%)
GFXBench (DX / GLBenchmark) 2.7
GFXBench T-Rex HD Offscreen C24Z16 +
GFXBench (DX / GLBenchmark) 2.7 - GFXBench T-Rex HD Offscreen C24Z16
810 fps (6%)
Geekbench 6.5 - Geekbench 6.5 GPU OpenCL
30872 points (8%)
Geekbench 6.5 - Geekbench 6.5 GPU Metal
48032 points (22%)
Power Consumption - Cyberpunk 2077 Power Consumption 150cd *
18.5 Watt (5%)
05101520Tooltip
Power Consumption - Cyberpunk 2077 Power Consumption - external Monitor *
21.5 Watt (3%)
0510152025Tooltip
Power Consumption - Power Efficiency - Cyberpunk 2077 ultra
0.6 fps per Watt (2%)
- Range of benchmark values
red legend - Average benchmark values
* Smaller numbers mean a higher performance

Game Benchmarks

The following benchmarks stem from our benchmarks of review laptops. The performance depends on the used graphics memory, clock rate, processor, system settings, drivers, and operating systems. So the results don't have to be representative for all laptops with this GPU. For detailed information on the benchmark results, click on the fps number.

low 1920x1080
98  fps    + Compare + 📈 Graph
med. 1920x1080
78.2  fps    + Compare + 📈 Graph
high 1920x1080
62.9  fps    + Compare + 📈 Graph
» With all tested laptops playable in detail settings high.
low 1920x1080
53.2  fps    + Compare
med. 1920x1080
46.3  fps    + Compare
high 1920x1080
40.7  fps    + Compare
ultra 1920x1080
28.7  fps    + Compare
» With all tested laptops playable in detail settings high.
low 1920x1080
25.9  fps    + Compare
med. 1920x1080
20.3  fps    + Compare
high 1920x1080
17  fps    + Compare
ultra 1920x1080
14.3  fps    + Compare
» The benchmarks indicate that the game is not playable in the tested settings.
Additional Benchmarks
30min Start Ultra Preset (FSR off) 1920x1080
13.9
low 1920x1080
39.7  fps    + Compare
med. 1920x1080
27.8  fps    + Compare
high 1920x1080
23.1  fps    + Compare
ultra 1920x1080
22.6  fps    + Compare
» With all tested laptops playable in detail settings low.
low 1280x720
103  fps    + Compare
med. 1920x1080
39  fps    + Compare
high 1920x1080
34  fps    + Compare
ultra 1920x1080
30  fps    + Compare
» With all tested laptops playable in detail settings med..
lowmed.highultraQHD4K
Civilization 79878.262.9
Total War Pharaoh53.246.340.728.7
Cyberpunk 207725.920.31714.3
Baldur's Gate 339.727.823.122.6
Shadow of the Tomb Raider103393430
lowmed.highultraQHD4K
< 30 fps
< 60 fps
< 120 fps
≥ 120 fps
1
2
2
2
2
1
2
2
1
3
1


For more games that might be playable and a list of all games and graphics cards visit our Gaming List

Amazon Logo
  • $1,645.87
    Apple 2024 MacBook Pro Laptop with M4 Pro, 12‑core CPU, 16‑core GPU: Built for Apple Intelligence, 14.2-inch Liquid Retina XDR Display, 24GB Unified Memory, 512GB SSD Storage; Silver
  • $819.00
    Apple 13.6" MacBook Air Apple M3 8-Core CPU 10-Core GPU 8GB RAM 512GB SSD - Starlight
  • $2,079.48
    Apple 2024 MacBook Pro Laptop with M4 Pro, 14‑core CPU, 20‑core GPU: Built for Apple Intelligence, 14.2-inch Liquid Retina XDR Display, 24GB Unified Memory, 1TB SSD Storage; Silver
  • $499.00
    Apple Late 2020 MacBook Pro with Apple M1 Chip, 13-inch, 8GB RAM, 512GB SSD, Space Gray (Renewed)
  • $1,699.00
    Apple 2024 MacBook Pro Laptop with M4, 10‑core CPU, 10‑core GPU: Built for Apple Intelligence, 14.2-inch Liquid Retina XDR Display, 24GB Unified Memory, 512GB SSD Storage; Space Black - Z1DS0005P

v1.35
log 13. 06:21:00

#0 ran 0s before starting gpusingle class +0s ... 0s

#1 no ids found in url (should be separated by "_") +0s ... 0s

#2 not redirecting to Ajax server +0s ... 0s

#3 did not recreate cache, as it is less than 5 days old! Created at Fri, 13 Mar 2026 05:30:33 +0100 +0.002s ... 0.002s

#4 no comparison url found in template nbc.compare_page_1 needed +0.021s ... 0.023s

#5 no comparison url found in template nbc.compare_page_1 needed +0s ... 0.024s

#6 no comparison url found in template nbc.compare_page_1 needed +0s ... 0.024s

#7 no comparison url found in template nbc.compare_page_1 needed +0s ... 0.024s

#8 no comparison url found in template nbc.compare_page_1 needed +0s ... 0.024s

#9 composed specs +0.001s ... 0.025s

#10 did output specs +0s ... 0.025s

#11 start showIntegratedCPUs +0s ... 0.025s

#12 getting avg benchmarks for device 12846 +0.013s ... 0.038s

#13 got single benchmarks 12846 +0.007s ... 0.045s

#14 got avg benchmarks for devices +0s ... 0.045s

#15 min, max, avg, median took s +0.253s ... 0.298s

#16 before gaming benchmark output +0s ... 0.298s

#17 Got 19 rows for game benchmarks. +0.003s ... 0.301s

#18 composed SQL query for gamebenchmarks +0s ... 0.301s

#19 got data and put it in $dataArray +0.004s ... 0.305s

#20 benchmarks composed for output. +0.049s ... 0.354s

#21 no comparison url found in template nbc.compare_page_1 needed +0.628s ... 0.982s

#22 return log +0s ... 0.982s

Please share our article, every link counts!
Mail Logo

» Comparison of GPUs
Detailed list of all laptop GPUs sorted by class and performance.

» Benchmark List
Sort and restrict laptop GPUs based on performance in synthetic benchmarks.

» Notebook Gaming List
Playable games for each graphics card and their average FPS results.

Class 1

Class 2

GeForce RTX 2080 Super Mobile
RTX PRO 2000 Blackwell Generation Laptop
M5 Max 32-Core GPU *
M1 Max 32-Core GPU *
M1 Max 24-Core GPU *
GeForce RTX 2070 Super Mobile
Radeon 8050S
Quadro RTX 5000 Max-Q
Radeon RX 5700M *
Quadro RTX 4000 (Laptop)
GeForce GTX 1080 Mobile
M1 Pro 16-Core GPU *
Radeon PRO W6600M *
GeForce RTX 2070 Super Max-Q
RTX PRO 1000 Blackwell Generation Laptop *
M1 Pro 14-Core GPU *
Quadro RTX 4000 Max-Q
Quadro P5200
Quadro RTX 3000 Max-Q
Quadro P4200
Radeon 8040S *
Pro A60M *

Class 3

Quadro P5000 Max-Q *
Quadro P4000
Arc 140T
Quadro P4000 Max-Q
Quadro P3200
Radeon RX 580X (Laptop) *
Radeon RX 580 (Laptop)
Pro A30M
Radeon Pro 5300M
Radeon RX 5300M
Quadro P3000 Max-Q *
Quadro T2000 Max-Q
Radeon RX 570X (Laptop) *
Radeon RX 570 (Laptop) *
Quadro T1000 Max-Q *
Vega M GH
GeForce GTX 1050 Ti Mobile
GeForce GTX 1050 Ti Max-Q
Radeon 680M
Quadro P2000
Quadro P2000 Max-Q
T500 Laptop GPU
Arc 130T
Radeon Pro Vega 16
WX Vega M GL
GeForce GTX 1050 Max-Q
Radeon 660M
Radeon Pro WX 4150 *
Radeon RX 560X (Laptop)
Radeon RX 560 (Laptop)
Quadro P1000
Xe MAX
Radeon Pro 560X
Radeon Pro 560
Quadro P620
Radeon RX 550X (Laptop)
Radeon Pro WX 3200 *
Radeon Pro 555X
Radeon Pro 555
Quadro P600
Graphics 3-Core iGPU (Arrow Lake) *
Radeon Pro WX 2100 *
Radeon Pro WX 3100 *
Graphics 2-Core iGPU (Arrow Lake) *
Radeon 630
Quadro P520
Radeon RX 540X *
Radeon 540X *
Quadro P500 *
Vega 10
Vega 9
Iris Plus Graphics G7 (Ice Lake 64 EU) *
UHD Graphics 32EUs
UHD Graphics 750
Vega 7
UHD Graphics Xe 32EUs (Tiger Lake-H)
UHD Graphics Xe G4 48EUs
Vega 8
UHD Graphics 730
Iris Plus Graphics G4 (Ice Lake 48 EU)
Iris Plus Graphics 650
Radeon 625
Vega 6 *
Iris Plus Graphics 640
UHD Graphics 24EUs (Alder Lake-N) *
GeForce 920M
Radeon 620
Radeon 610
Radeon 610M *
Vega 6 *
UHD Graphics Xe 16EUs (Tiger Lake-H) *
UHD Graphics G1 (Ice Lake 32 EU)
Adreno 690 *
Adreno 685 *
Adreno 680 *
GeForce 910M

Class 4

* Approximate position of the graphics adapter