Notebookcheck Logo

Intel Arc A770M

Intel A770M

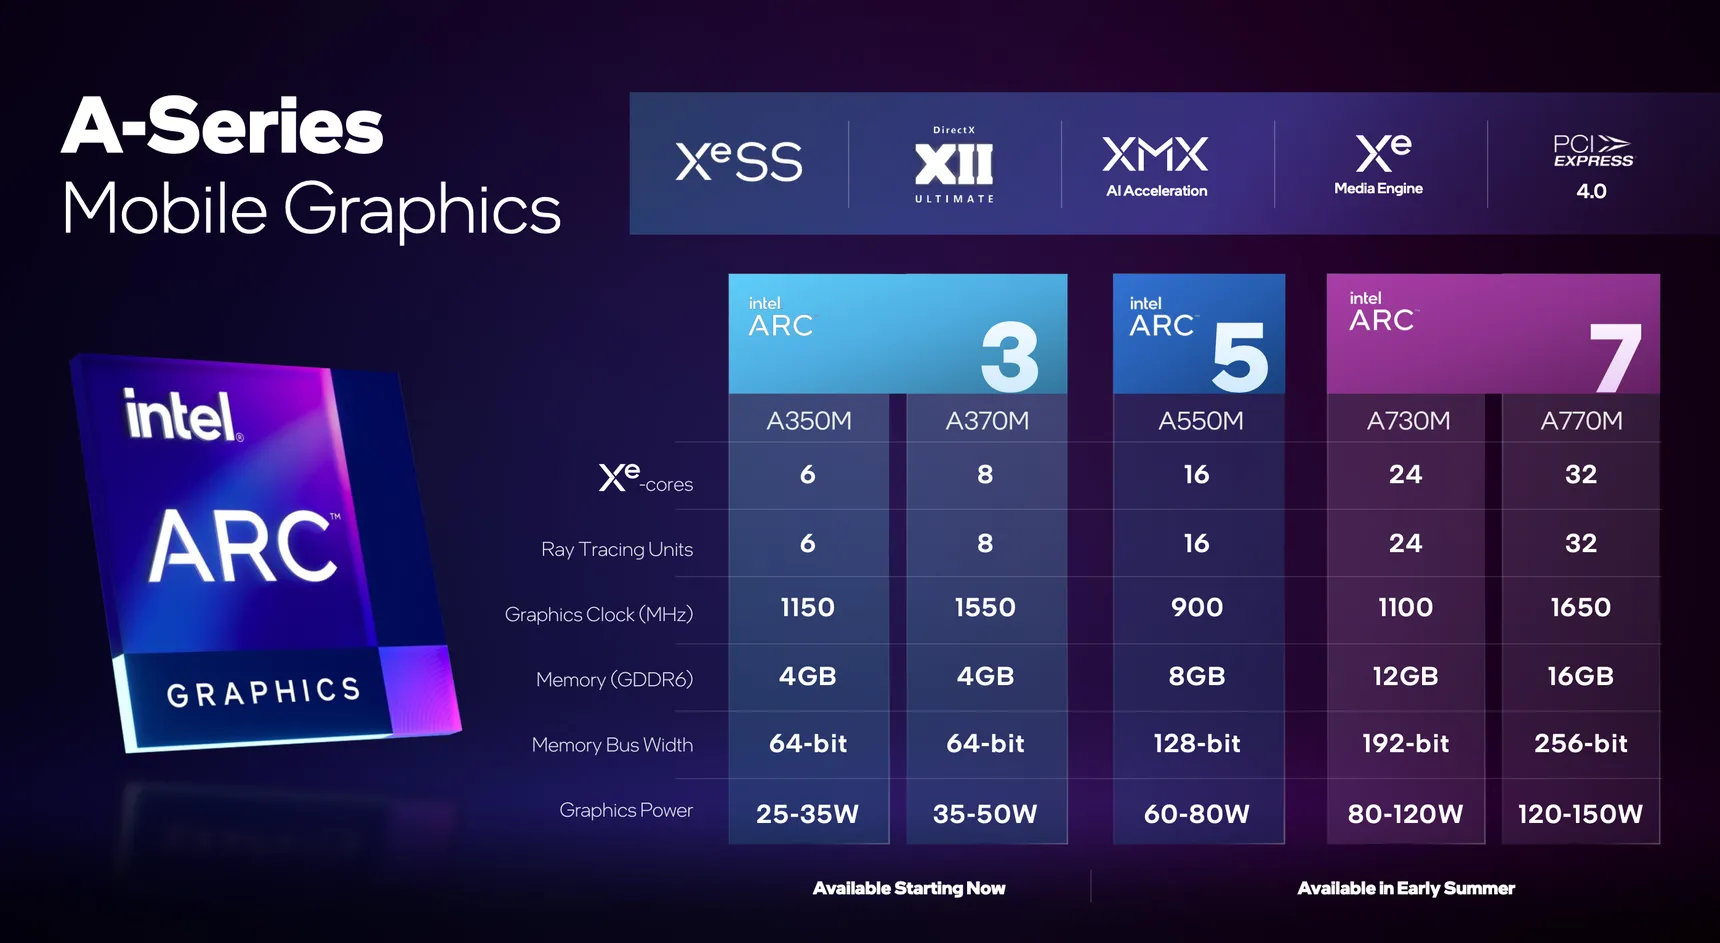
英特尔Arc A770M是一款基于Xe HPG微架构的笔记本电脑专用移动中低端显卡。它使用ACM-G10芯片,提供所有32个Xe-cores(512个ALU)、32个光线追踪单元和一个256位内存总线的12GB GDDR6图形内存。该芯片集成了217亿个晶体管,芯片尺寸为406平方毫米。

Arc A770M的性能尚不清楚。其功耗与RTX 3070相似,因此我们看到其性能略低于RTX 3070移动版。

该芯片还集成了两个媒体引擎,用于VP9、AVC、HEVC和AV1 8k en-和解码。4条显示管道通过DMI 2.0B或DisplayPort 2.0 10G支持多达4x 4k120 HDR。 

A770M在台积电的6纳米工艺(N6工艺)下生产,支持与第12代英特尔CPU(Alder Lake)的动态电源共享(使用Deep Link)。

Arc Series

Arc A770 4096 @ 2.1 - 2.4 GHz256 Bit @ 16000 MHz
Arc A750 3584 @ 2.05 - 2.4 GHz256 Bit @ 16000 MHz
Arc A580 3072 @ 1.7 - 2 GHz256 Bit @ 16000 MHz
A770M 512 @ 1.65 GHz256 Bit @ 16000 MHz
A730M 384 @ 1.1 GHz192 Bit @ 14000 MHz
A570M 16 @ 0.9 - 1.3 GHz128 Bit @ 14000 MHz
A550M 16 @ 0.9 - 2.01 GHz128 Bit @ 14000 MHz
A530M 12 @ 0.9 - 1.3 GHz128 Bit @ 14000 MHz
A370M 8 @ 1.55 GHz64 Bit @ 14000 MHz
Arc A380 1024 @ 2 GHz96 Bit @ 15500 MHz
A310 6 @ 2 GHz64 Bit @ 15500 MHz
A350M 6 @ 1.15 GHz64 Bit @ 14000 MHz
CodenameAlchemist
ArchitectureXe HPG
Pipelines512 - unified
Raytracing Cores32
Core Speed1650 MHz
CacheL1: 6 MB, L2: 16 MB
Memory Speed16000 MHz
Memory Bus Width256 Bit
Memory TypeGDDR6
Max. Amount of Memory16 GB
Shared Memoryno
Memory Bandwidth512 GB/s
APIDirectX 12_2, OpenGL 4.6, Vulkan 1.3
Power Consumption150 Watt (120 - 150 Watt TGP)
Transistor Count21.7 Billion
Die Size 406 mm²
technology6 nm
PCIe4 16x
Displays4 Displays (max.), HDMI 2.0b, DisplayPort 2.0 10G Ready
Notebook Sizelarge
Date of Announcement30.03.2022
Link to Manufacturer Pageark.intel.com

Benchmarks

Performance Rating - 3DMark 11 + Fire Strike + Time Spy
11.6 pt (35%)
3DMark - 3DMark Ice Storm Extreme Graphics
384531 Points (49%)
3DMark - 3DMark Cloud Gate Score
53345 Points (57%)
3DMark - 3DMark Cloud Gate Graphics
124487 Points (33%)
3DMark - 3DMark Fire Strike Standard Score
min: 20560     avg: 22179     median: 22178.5 (39%)     max: 23797 Points
3DMark - 3DMark Fire Strike Standard Graphics
min: 23000     avg: 25563     median: 25563 (29%)     max: 28126 Points
3DMark - 3DMark Ice Storm Graphics
426092 Points (51%)
3DMark Vantage
3DM Vant. Perf. total +
3DMark Vantage - 3DM Vant. Perf. total
77403 Points (22%)
3DM Vant. Perf. GPU no PhysX +
3DMark Vantage - 3DM Vant. Perf. GPU no PhysX
80346 Points (46%)
ATI Radeon HD 3200
62 -100%
...
NVIDIA GeForce RTX 2070 Super Max-Q
69136 -14%
69467 -14%
74008 -8%
74946 -7%
NVIDIA GeForce RTX 2070 Super Mobile
75429 -6%
76250 -5%
NVIDIA GeForce RTX 2080 Super Mobile
77180 -4%
77533 -4%
77766 -3%
Intel Arc A770M
80346
80643 0%
82368 3%
85013 6%
85672 7%
86536 8%
88394 10%
88465 10%
93680 17%
96677 20%
...
132443 65%
max:
170928 113%
0%
100%
3DMark 05 - 3DMark 05 - Standard
55811 Points (61%)
Intel Graphics Media Accelerator (GMA) 500
133.4 -100%
...
AMD Radeon 680M
43450 -22%
AMD Radeon 660M
43616 -22%
46269 -17%
48758 -13%
50571 -9%
50971 -9%
52117 -7%
53254 -5%
54967 -2%
Intel Arc A770M
55811
61850 11%
max:
87172 56%
0%
100%
3DMark 06 3DMark 06 - Standard 1280x1024 +
Unigine Valley 1.0 - Unigine Valley 1.0 DX
75.2 fps (25%)
SPECviewperf 12
specvp12 sw-03 +
SPECviewperf 12 - specvp12 sw-03
61.1 fps (15%)
specvp12 snx-02 +
SPECviewperf 12 - specvp12 snx-02
1.3 fps (0%)
specvp12 showcase-01 +
SPECviewperf 12 - specvp12 showcase-01
104 fps (23%)
specvp12 mediacal-01 +
SPECviewperf 12 - specvp12 mediacal-01
40.4 fps (10%)
specvp12 maya-04 +
SPECviewperf 12 - specvp12 maya-04
136 fps (37%)
specvp12 energy-01 +
SPECviewperf 12 - specvp12 energy-01
2.1 fps (2%)
specvp12 creo-01 +
SPECviewperf 12 - specvp12 creo-01
37.7 fps (15%)
specvp12 catia-04 +
SPECviewperf 12 - specvp12 catia-04
144 fps (24%)
specvp12 3dsmax-05 +
SPECviewperf 12 - specvp12 3dsmax-05
150 fps (26%)
SPECviewperf 13 specvp13 sw-04 +
SPECviewperf 13 - specvp13 sw-04
66.2 fps (18%)
specvp13 snx-03 +
SPECviewperf 13 - specvp13 snx-03
2.4 fps (0%)
specvp13 showcase-02 +
SPECviewperf 13 - specvp13 showcase-02
105 fps (23%)
specvp13 medical-02 +
SPECviewperf 13 - specvp13 medical-02
70.4 fps (15%)
specvp13 maya-05 +
specvp13 energy-02 +
SPECviewperf 13 - specvp13 energy-02
19.2 fps (6%)
specvp13 creo-02 +
SPECviewperf 13 - specvp13 creo-02
77.6 fps (11%)
specvp13 catia-05 +
SPECviewperf 13 - specvp13 catia-05
211 fps (23%)
specvp13 3dsmax-06 +
SPECviewperf 13 - specvp13 3dsmax-06
149 fps (26%)
SPECviewperf 2020 specvp2020 solidworks-05 4k +
specvp2020 snx-04 4k +
specvp2020 medical-03 4k +
specvp2020 maya-06 4k +
specvp2020 energy-03 4k +
specvp2020 creo-03 4k +
SPECviewperf 2020 - specvp2020 creo-03 4k
45.5 fps (22%)
specvp2020 catia-06 4k +
specvp2020 3dsmax-07 4k +
SPECviewperf 2020 - specvp2020 3dsmax-07 4k
40.1 fps (17%)
Cinebench R10 Cinebench R10 Shading (32bit) +
Cinebench R11.5 Cinebench R11.5 OpenGL 64 Bit +
Cinebench R11.5 - Cinebench R11.5 OpenGL 64 Bit
140 fps (48%)
Cinebench R15
Cinebench R15 OpenGL 64 Bit +
Cinebench R15 - Cinebench R15 OpenGL 64 Bit
216.5 fps (13%)
Cinebench R15 OpenGL Ref. Match 64 Bit +
Cinebench R15 - Cinebench R15 OpenGL Ref. Match 64 Bit
97.8 % (98%)
Power Consumption - Furmark Stress Test Power Consumption - external Monitor *
205 Watt (29%)
0153045607590105120135150165180195210Tooltip
Power Consumption - The Witcher 3 Power Consumption - external Monitor *
187.2 Watt (26%)
0153045607590105120135150165180195210Tooltip
Power Consumption - Witcher 3 ultra Power Efficiency - external Monitor
0.3 fps per Watt (22%)
- Range of benchmark values for this graphics card
- Average benchmark values for this graphics card
* Smaller numbers mean a higher performance

Game Benchmarks

The following benchmarks stem from our benchmarks of review laptops. The performance depends on the used graphics memory, clock rate, processor, system settings, drivers, and operating systems. So the results don't have to be representative for all laptops with this GPU. For detailed information on the benchmark results, click on the fps number.

low 1920x1080
51.9  fps    + Compare + 📈 Graph
med. 1920x1080
52.5  fps    + Compare + 📈 Graph
high 1920x1080
55.1  fps    + Compare + 📈 Graph
ultra 1920x1080
51.9  fps    + Compare + 📈 Graph
QHD 2560x1440
39.1  fps    + Compare + 📈 Graph
4K 3840x2160
22.2  fps    + Compare + 📈 Graph
» With all tested laptops playable in detail settings ultra.
Additional Benchmarks
Low Preset Low TAA 1280x720
57
low 1920x1080
42.2  fps    + Compare + 📈 Graph
med. 1920x1080
49.2  fps    + Compare + 📈 Graph
high 1920x1080
46.2  fps    + Compare + 📈 Graph
ultra 1920x1080
54.1  fps    + Compare + 📈 Graph
QHD 2560x1440
24.4  fps    + Compare + 📈 Graph
4K 3840x2160
15.8  fps    + Compare + 📈 Graph
» With all tested laptops playable in detail settings ultra.
Additional Benchmarks
Low Preset TAA 1280x720
89.3
low 1920x1080
143.7  fps    + Compare + 📈 Graph
med. 1920x1080
125.1  fps    + Compare + 📈 Graph
high 1920x1080
111.3  fps    + Compare + 📈 Graph
ultra 1920x1080
99.2  fps    + Compare + 📈 Graph
4K 3840x2160
44.1  fps    + Compare + 📈 Graph
» With all tested laptops playable in detail settings ultra.
Additional Benchmarks
Low Preset / Off 1280x720
145.4
RT Ultra Preset / On FXAA 1920x1080
28.1
low 1920x1080
178.5  fps    + Compare + 📈 Graph
med. 1920x1080
126.5  fps    + Compare + 📈 Graph
high 1920x1080
99.7  fps    + Compare + 📈 Graph
ultra 1920x1080
80.9  fps    + Compare + 📈 Graph
QHD 2560x1440
52.9  fps    + Compare + 📈 Graph
4K 3840x2160
24.9  fps    + Compare + 📈 Graph
» With all tested laptops playable in detail settings ultra.
Additional Benchmarks
Low Preset 1280x720
197.7
low 1920x1080
med. 1920x1080
high 1920x1080
ultra 1920x1080
QHD 2560x1440
4K 3840x2160
» With all tested laptops playable in detail settings ultra.
Additional Benchmarks
Low Preset (without FSR Upscaling) 1280x720
141.7
Ultra Preset (without FSR Upscaling) + Full Ray-Tracing 1920x1080
7.1
low 1920x1080
102.8  fps    + Compare + 📈 Graph
med. 1920x1080
100  fps    + Compare + 📈 Graph
high 1920x1080
90  fps    + Compare + 📈 Graph
ultra 1920x1080
86.4  fps    + Compare + 📈 Graph
QHD 2560x1440
67.7  fps    + Compare + 📈 Graph
4K 3840x2160
38.3  fps    + Compare + 📈 Graph
» With all tested laptops playable in detail settings ultra.
Additional Benchmarks
Very Low Preset 1280x720
112.2
Very High Preset + Ray-Tracing TAA 1920x0180
63.2
low 1920x1080
med. 1920x1080
high 1920x1080
ultra 1920x1080
QHD 2560x1440
4K 3840x2160
» With all tested laptops playable in detail settings ultra.
Additional Benchmarks
Basic Quality Preset T2X SMAA 1280x720
115
low 1920x1080
43.4  fps    + Compare + 📈 Graph
med. 1920x1080
40.8  fps    + Compare + 📈 Graph
high 1920x1080
44.2  fps    + Compare + 📈 Graph
ultra 1920x1080
43.4  fps    + Compare + 📈 Graph
QHD 2560x1440
41.1  fps    + Compare + 📈 Graph
» With all tested laptops playable in detail settings ultra.
Additional Benchmarks
Low Preset 1280x720
41.1
low 1920x1080
79.3  fps    + Compare + 📈 Graph
med. 1920x1080
71.5  fps    + Compare + 📈 Graph
high 1920x1080
55  fps    + Compare + 📈 Graph
ultra 1920x1080
42.1  fps    + Compare + 📈 Graph
QHD 2560x1440
31.9  fps    + Compare + 📈 Graph
4K 3840x2160
18.6  fps    + Compare + 📈 Graph
» With all tested laptops playable in detail settings ultra.
Additional Benchmarks
Low Preset 1280x720
77.4
low 1920x1080
108  fps    + Compare + 📈 Graph
med. 1920x1080
84.9  fps    + Compare + 📈 Graph
high 1920x1080
69.3  fps    + Compare + 📈 Graph
ultra 1920x1080
52.9  fps    + Compare + 📈 Graph
QHD 2560x1440
35.9  fps    + Compare + 📈 Graph
4K 3840x2160
18.8  fps    + Compare + 📈 Graph
» With all tested laptops playable in detail settings ultra.
Additional Benchmarks
Low Preset 1280x720
132.4
F1 22

F1 22

2022
low 1920x1080
181.5  fps    + Compare
med. 1920x1080
166  fps    + Compare
high 1920x1080
131  fps    + Compare
ultra 1920x1080
42  fps    + Compare
QHD 2560x1440
27.8  fps    + Compare
4K 3840x2160
14.6  fps    + Compare
» With all tested laptops playable in detail settings ultra.
Additional Benchmarks
Ultra Low Preset 16xAF TAA 1280x720
228
low 1920x1080
med. 1920x1080
high 1920x1080
ultra 1920x1080
QHD 2560x1440
4K 3840x2160
» With all tested laptops playable in detail settings ultra.
Additional Benchmarks
Lowest Preset (DX12) 1280x720
241
241
low 1920x1080
112.5  fps    + Compare
med. 1920x1080
95.3  fps    + Compare
high 1920x1080
77  fps    + Compare
ultra 1920x1080
66.5  fps    + Compare
QHD 2560x1440
44  fps    + Compare
4K 3840x2160
21.6  fps    + Compare
» With all tested laptops playable in detail settings ultra.
Additional Benchmarks
Low Preset 1280x720
130
Ray Tracing Ultra Preset (DLSS off) 1920x1080
27.1
Ray Tracing Ultra Preset (DLSS off) 3840x2160
7.8
low 1920x1080
143.1  fps    + Compare
med. 1920x1080
117.9  fps    + Compare
high 1920x1080
95.9  fps    + Compare
ultra 1920x1080
81.2  fps    + Compare
QHD 2560x1440
74.5  fps    + Compare
4K 3840x2160
71.9  fps    + Compare
» With all tested laptops playable in detail settings ultra.
Additional Benchmarks
Low Preset 1280x720
153.1
low 1920x1080
62.1  fps    + Compare + 📈 Graph
med. 1920x1080
62.3  fps    + Compare + 📈 Graph
high 1920x1080
59.3  fps    + Compare + 📈 Graph
ultra 1920x1080
47.3  fps    + Compare + 📈 Graph
4K 3840x2160
26.8  fps    + Compare + 📈 Graph
» With all tested laptops playable in detail settings ultra.
Additional Benchmarks
Low Preset 1280x720
59.1
low 1280x720
med. 1920x1080
high 1920x1080
ultra 1920x1080
QHD 2560x1440
4K 3840x2160
» With all tested laptops playable in detail settings ultra.
Additional Benchmarks
Low Preset 1920x1080
116
Far Cry 6

Far Cry 6

2021
low 1280x720
med. 1920x1080
high 1920x1080
ultra 1920x1080
QHD 2560x1440
4K 3840x2160
» With all tested laptops playable in detail settings ultra.
Additional Benchmarks
Low Graphics Quality 1920x1080
139.3
Ultra Graphics Quality + HD Textures + DXR TAA 1920x1080
71.5
New World

New World

2021
low 1280x720
101.9  fps    + Compare + 📈 Graph
med. 1920x1080
84.2  fps    + Compare + 📈 Graph
high 1920x1080
77.6  fps    + Compare + 📈 Graph
ultra 1920x1080
74.8  fps    + Compare + 📈 Graph
4K 3840x2160
35.2  fps    + Compare + 📈 Graph
» With all tested laptops playable in detail settings ultra.
Additional Benchmarks
Low Video Quality 1920x1080
102.8
F1 2021

F1 2021

2021
low 1280x720
355  fps    + Compare
med. 1920x1080
285  fps    + Compare
high 1920x1080
227  fps    + Compare
ultra 1920x1080
106.4  fps    + Compare
QHD 2560x1440
75.9  fps    + Compare
4K 3840x2160
43.6  fps    + Compare
» With all tested laptops playable in detail settings ultra.
low 1280x720
140.6  fps    + Compare + 📈 Graph
med. 1920x1080
123.7  fps    + Compare + 📈 Graph
high 1920x1080
116.6  fps    + Compare + 📈 Graph
ultra 1920x1080
113.7  fps    + Compare + 📈 Graph
QHD 2560x1440
85.7  fps    + Compare + 📈 Graph
4K 3840x2160
49.4  fps    + Compare + 📈 Graph
» With all tested laptops playable in detail settings ultra.
F1 2020

F1 2020

2020
low 1280x720
249  fps    + Compare
med. 1920x1080
175.9  fps    + Compare
high 1920x1080
149.9  fps    + Compare
ultra 1920x1080
104.5  fps    + Compare
QHD 2560x1440
81.6  fps    + Compare
4K 3840x2160
53.1  fps    + Compare
» With all tested laptops playable in detail settings ultra.
low 1280x720
med. 1920x1080
high 1920x1080
ultra 1920x1080
QHD 2560x1440
4K 3840x2160
» With all tested laptops playable in detail settings ultra.
low 1280x720
med. 1920x1080
high 1920x1080
ultra 1920x1080
4K 3840x2160
» With all tested laptops playable in detail settings ultra.
low 1280x720
155.1  fps    + Compare
med. 1920x1080
123.8  fps    + Compare
high 1920x1080
85.1  fps    + Compare
ultra 1920x1080
69.6  fps    + Compare
QHD 2560x1440
56.5  fps    + Compare
4K 3840x2160
37  fps    + Compare
» With all tested laptops playable in detail settings ultra.
Additional Benchmarks
Ultra Quality DXR 16xAF 1920x1080
58.2
low 1280x720
med. 1920x1080
high 1920x1080
ultra 1920x1080
QHD 2560x1440
4K 3840x2160
» With all tested laptops playable in detail settings ultra.
Additional Benchmarks
Lowest Preset 1920x1080
102.3
Strange Brigade

Strange Brigade

2018
low 1280x720
439  fps    + Compare
med. 1920x1080
256  fps    + Compare
high 1920x1080
211  fps    + Compare
ultra 1920x1080
178.7  fps    + Compare
4K 3840x2160
74.3  fps    + Compare
» With all tested laptops playable in detail settings ultra.
Far Cry 5

Far Cry 5

2018
low 1280x720
med. 1920x1080
high 1920x1080
ultra 1920x1080
QHD 2560x1440
4K 3840x2160
» With all tested laptops playable in detail settings ultra.
Additional Benchmarks
Low Preset TAA 1920x1080
118
low 1280x720
med. 1920x1080
high 1920x1080
4K 3840x2160
» With all tested laptops playable in detail settings high.
low 1280x720
med. 1920x1080
high 1920x1080
QHD 2560x1440
4K 3840x2160
» With all tested laptops playable in detail settings high.
low 1024x768
high 1920x1080
ultra 1920x1080
4K 3840x2160
» With all tested laptops playable in detail settings ultra.
Additional Benchmarks
Ultra Graphics & Postprocessing (HBAO+) 3840x2160
31.8
Medium Graphics & Postprocessing 1920x1080
197.2
GTA V

GTA V

2015
low 1024x768
174.5  fps    + Compare
med. 1366x768
165.6  fps    + Compare
high 1920x1080
119.4  fps    + Compare
ultra 1920x1080
53.3  fps    + Compare
4K 3840x2160
45.2  fps    + Compare
» With all tested laptops playable in detail settings ultra.
Additional Benchmarks
Highest Settings possible 16xAF 4xMSAA + FXAA 3840x2160
18.5
Normal/Off 4xAF 1920x1080
166.6
Lowest Settings possible 1920x1080
174.2
lowmed.highultraQHD4K
Hogwarts Legacy51.952.555.151.939.122.2
Dead Space Remake42.249.246.254.124.415.8
The Witcher 3 v4.00143.7125.1111.399.244.1
High On Life178.5126.599.780.952.924.9
The Callisto Protocol122.590.664.16447.528.1
Spider-Man Miles Morales102.81009086.467.738.3
Call of Duty Modern Warfare 2 2022958671685132
Uncharted Legacy of Thieves Collection43.440.844.243.441.1
A Plague Tale Requiem79.371.55542.131.918.6
The Quarry10884.969.352.935.918.8
F1 22181.51661314227.814.6
Tiny Tina's Wonderlands192.2138.595.176.852.427.4
Cyberpunk 2077 1.6112.595.37766.54421.6
GRID Legends143.1117.995.981.274.571.9
God of War62.162.359.347.326.8
Guardians of the Galaxy1241121101057945
Far Cry 6143.2119.9103.38867.740.2
New World101.984.277.674.835.2
F1 2021355285227106.475.943.6
Death Stranding140.6123.7116.6113.785.749.4
F1 2020249175.9149.9104.581.653.1
Borderlands 399.48778.969.253.529.1
Far Cry New Dawn115100958550
Metro Exodus155.1123.885.169.656.537
Shadow of the Tomb Raider100.974.27368.557.638.6
Strange Brigade439256211178.774.3
Far Cry 512710699958145
X-Plane 11.1167.559.455.538.5
Final Fantasy XV Benchmark132.491.350.741.628.6
The Witcher 3274.7172.750.761.5
GTA V174.5165.6119.453.345.2
< 30 fps
< 60 fps
< 120 fps
≥ 120 fps

3
11
17

4
16
10

7
19
5

9
19
1
2
13
8
12
15
3

For more games that might be playable and a list of all games and graphics cards visit our Gaming List

v1.26
log 24. 06:03:29

#0 no ids found in url (should be separated by "_") +0s ... 0s

#1 not redirecting to Ajax server +0s ... 0s

#2 did not recreate cache, as it is less than 5 days old! Created at Mon, 22 Apr 2024 05:40:21 +0200 +0.001s ... 0.001s

#3 no comparison url found in template nbc.compare_page_1 needed +0.088s ... 0.089s

#4 no comparison url found in template nbc.compare_page_1 needed +0s ... 0.09s

#5 no comparison url found in template nbc.compare_page_1 needed +0.001s ... 0.09s

#6 no comparison url found in template nbc.compare_page_1 needed +0s ... 0.091s

#7 no comparison url found in template nbc.compare_page_1 needed +0s ... 0.091s

#8 no comparison url found in template nbc.compare_page_1 needed +0s ... 0.091s

#9 no comparison url found in template nbc.compare_page_1 needed +0s ... 0.092s

#10 no comparison url found in template nbc.compare_page_1 needed +0s ... 0.092s

#11 no comparison url found in template nbc.compare_page_1 needed +0s ... 0.092s

#12 no comparison url found in template nbc.compare_page_1 needed +0s ... 0.093s

#13 no comparison url found in template nbc.compare_page_1 needed +0s ... 0.093s

#14 composed specs +0s ... 0.093s

#15 did output specs +0s ... 0.093s

#16 start showIntegratedCPUs +0s ... 0.093s

#17 getting avg benchmarks for device 11313 +0.046s ... 0.139s

#18 got single benchmarks 11313 +0.02s ... 0.159s

#19 got avg benchmarks for devices +0s ... 0.16s

#20 min, max, avg, median took s +1.396s ... 1.555s

#21 before gaming benchmark output +0s ... 1.555s

#22 Got 174 rows for game benchmarks. +0.071s ... 1.626s

#23 composed SQL query for gamebenchmarks +0s ... 1.626s

#24 got data and put it in $dataArray +0.035s ... 1.662s

#25 benchmarks composed for output. +2.619s ... 4.28s

#26 no comparison url found in template nbc.compare_page_1 needed +0.005s ... 4.286s

#27 return log +0s ... 4.286s

Please share our article, every link counts!

» Comparison of GPUs
Detailed list of all laptop GPUs sorted by class and performance.

» Benchmark List
Sort and restrict laptop GPUs based on performance in synthetic benchmarks.

» Notebook Gaming List
Playable games for each graphics card and their average FPS results.

Class 1

GeForce RTX 2080 Super Mobile

Class 2

M1 Max 32-Core GPU *
GeForce RTX 2070 Super Mobile
M1 Max 24-Core GPU *
Quadro RTX 5000 Max-Q
Radeon RX 5700M *
GeForce GTX 1080 Mobile
Quadro RTX 4000 (Laptop)
M1 Pro 16-Core GPU *
Radeon PRO W6600M *
GeForce RTX 2070 Super Max-Q
Quadro RTX 4000 Max-Q *
M1 Pro 14-Core GPU *
Quadro P5200
Quadro RTX 3000 Max-Q *
Quadro P4200
Quadro P5000 Max-Q *
GeForce GTX 980 (Laptop)
Quadro P4000
Quadro P4000 Max-Q
Quadro P3200
Radeon RX 580X (Laptop) *
Radeon RX 580 (Laptop)
Radeon Pro 5300M
Radeon RX 5300M
Quadro P3000 Max-Q *
Quadro T2000 Max-Q *
Radeon Pro WX 7100 *
Radeon RX 570X (Laptop) *
Radeon RX 570 (Laptop) *
Radeon RX 470 (Laptop) *
Quadro T1000 Max-Q *

Class 3

Vega M GH
Quadro M5000M
GeForce GTX 1050 Ti Mobile
Radeon 680M
Quadro P2000
Quadro P2000 Max-Q
Quadro M4000M
T500 Laptop GPU *
Radeon R9 M395X
GeForce GTX 1050 Ti Max-Q *
Radeon Pro Vega 16
WX Vega M GL
Radeon R9 M485X
Quadro M3000M
FirePro W7170M
Radeon R9 M395
GeForce GTX 1050 Max-Q *
Radeon 660M
Radeon Pro WX 4150 *
Radeon RX 560X (Laptop)
Radeon RX 560 (Laptop)
Radeon RX 460 (Laptop)
Quadro P1000
Radeon R9 M390
Xe MAX
Radeon Pro 560X
Radeon Pro 560
Radeon Pro 460
Radeon Pro WX 4130 *
GeForce GTX 960M
Quadro P620 *
Radeon RX 550X (Laptop)
Radeon Pro WX 3200 *
Radeon Pro 555X
Radeon Pro 555
Radeon Pro 455
Quadro P600
Quadro M2000M
Radeon RX 540X *
Radeon Pro WX 2100 *
Radeon Pro WX 3100 *
GeForce GTX 950M
Radeon Pro 450
Radeon 630
Radeon 540X *
Radeon R9 M385X
Quadro P520
Quadro M1000M
GeForce 945M
Quadro P500 *
Iris Plus Graphics G7 (Ice Lake 64 EU) *
Vega 10 *
Iris Pro Graphics 580
FirePro W5170M *
Radeon R9 M370X
Vega 9
FirePro W5130M
UHD Graphics Xe G4 48EUs *
UHD Graphics 32EUs
UHD Graphics Xe 32EUs (Tiger Lake-H) *
UHD Graphics 750
Vega 7
Radeon R7 M465
Iris Pro Graphics 6200
Vega 8
GeForce 940M
Iris Plus Graphics G4 (Ice Lake 48 EU)
Quadro M600M
FirePro W4190M
Radeon R9 M375
Radeon R7 M445
Iris Plus Graphics 650
Iris Graphics 550
Radeon 625
Vega 6 *
Iris Plus Graphics 640
Iris Graphics 540
UHD Graphics 24EUs (Alder Lake-N) *
Radeon R7 M360
GeForce 920M
Radeon 620
Radeon R7 M340
Radeon 610
Radeon 610M *
Vega 6 *
UHD Graphics G1 (Ice Lake 32 EU)
UHD Graphics Xe 16EUs (Tiger Lake-H) *
HD Graphics 530
Radeon R5 (Bristol Ridge)
Adreno 690 *
Adreno 685 *
Adreno 680 *
Radeon R5 M330
GeForce 910M
HD Graphics 520

Class 4

UHD Graphics 730
Radeon R5 M320 *
Radeon R5 M315 *
Radeon R5 M420 *
Vega 2 *
UHD Graphics 617
UHD Graphics 615
HD Graphics 515
UHD Graphics 610
HD Graphics 510
UHD Graphics 605
Radeon R4 (Stoney Ridge)
Radeon R2 (Stoney Ridge)
HD Graphics (Broadwell)
UHD Graphics 600
HD Graphics (Braswell)

Class 5

* Approximate position of the graphics adapter