GPD Pocket 3可转换UMPC回顾。比许多英特尔EVO笔记本电脑更快

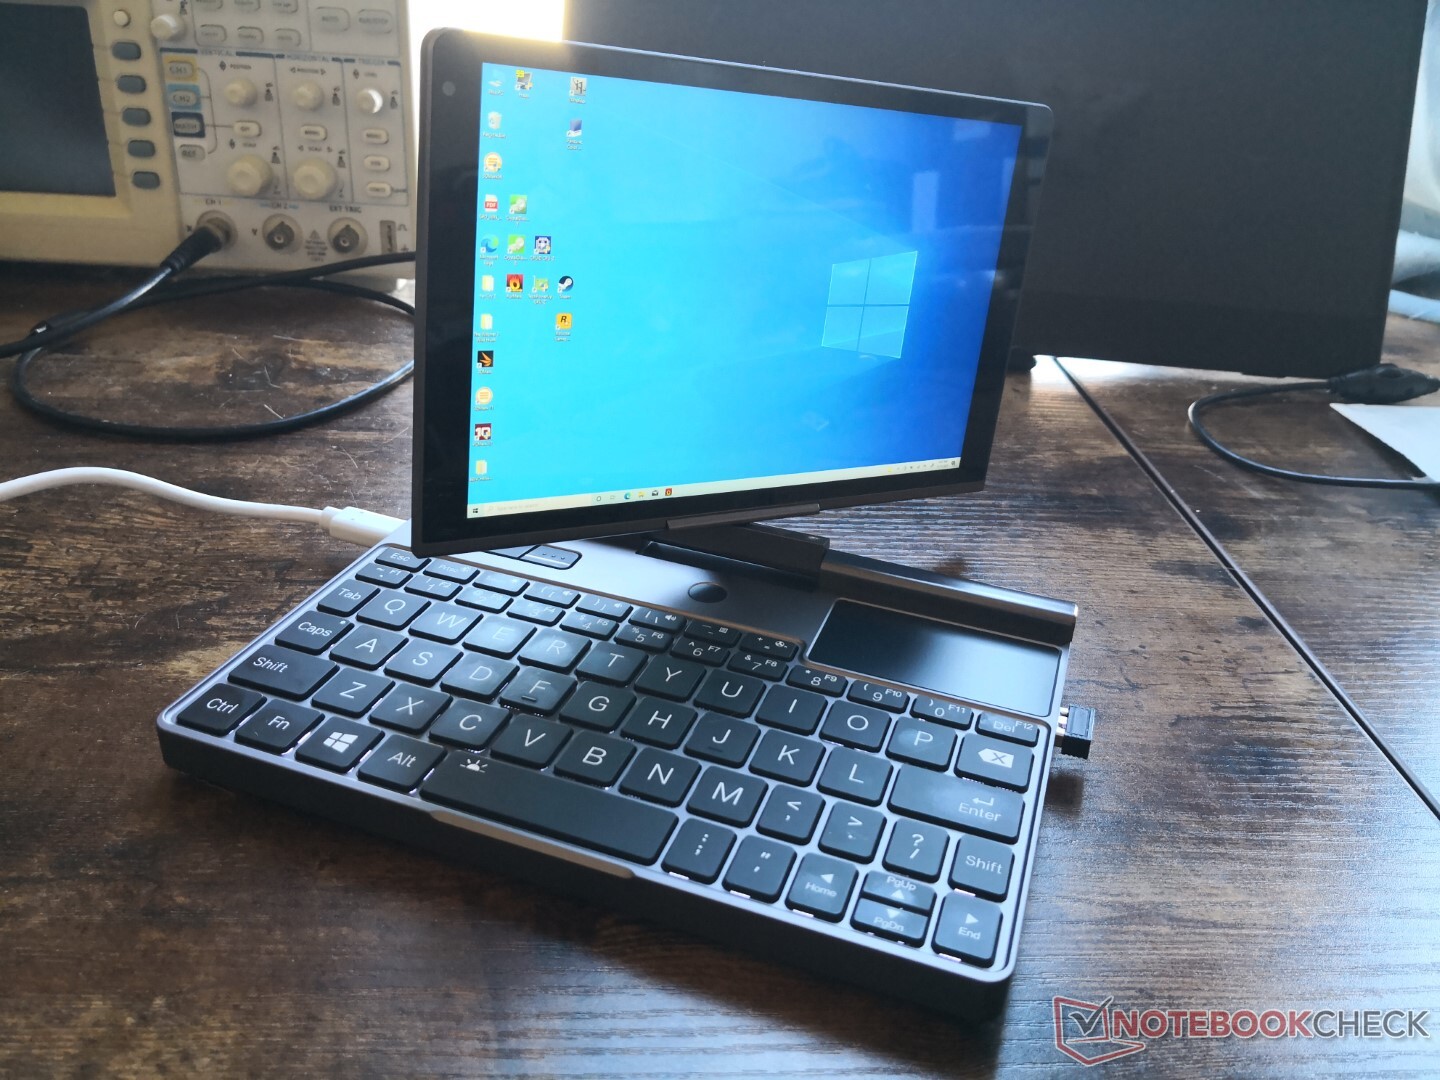
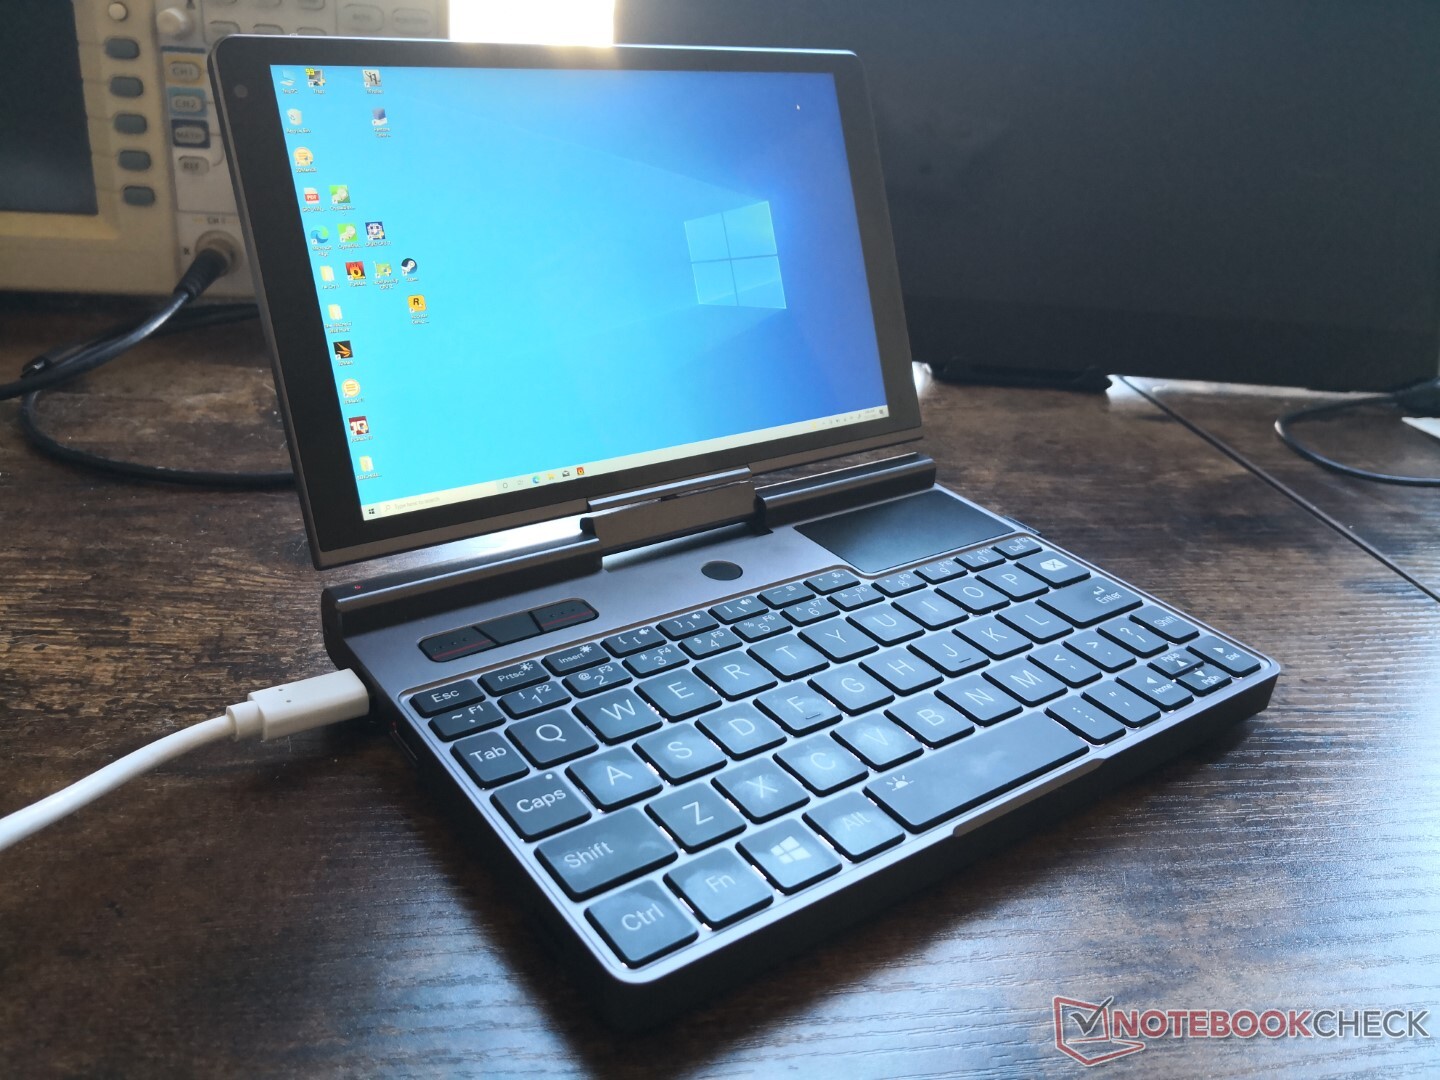
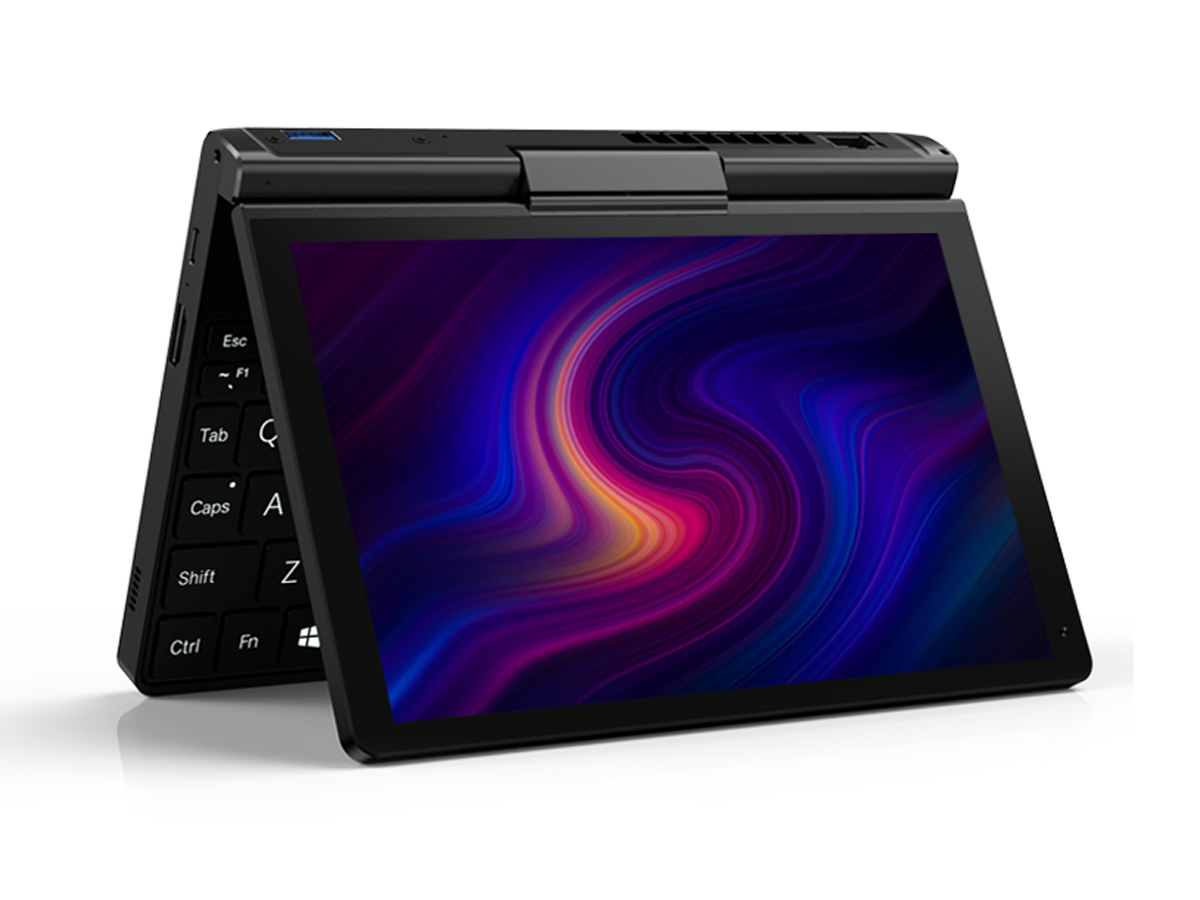
在今年早些时候令人失望的Win Max游戏混合型UMPC之后,新的GPD Pocket 3是在一个更传统的UMPC上的回归,没有任何集成的游戏手柄按钮。相反,Pocket 3具有一个可旋转的触摸屏,就像以前的惠普tx1000或联想ThinkPad Twist一样,可以在笔记本模式和平板电脑模式之间切换。
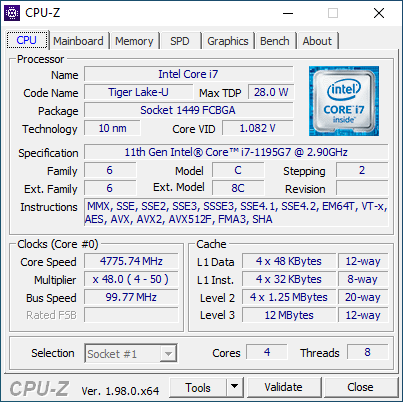
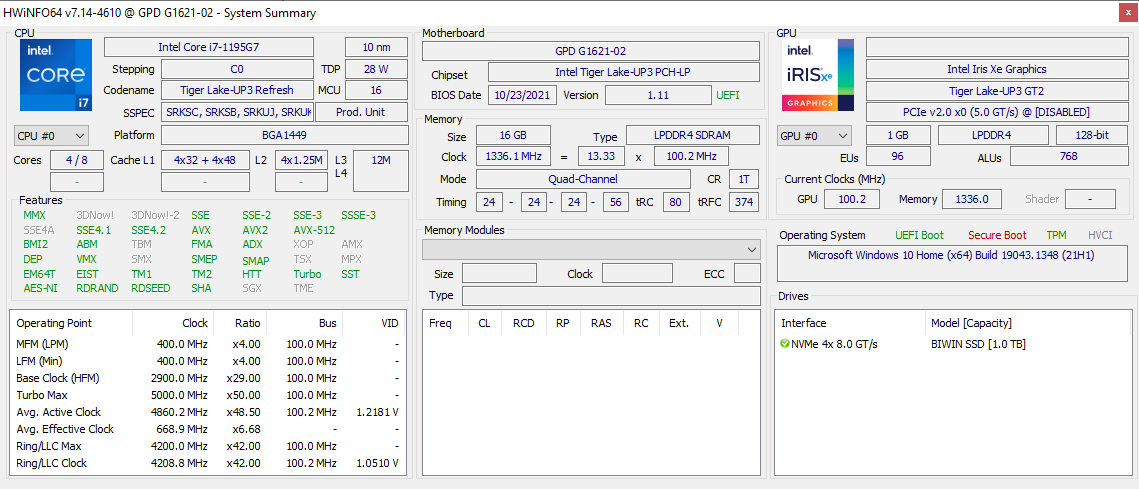
对于这样一个16:10的8英寸小尺寸来说,核心规格令人印象深刻,因为该系统由最新的英特尔Evo笔记本电脑上的相同硬件驱动。Tiger Lake-U Core i7-1195G7 CPU,Iris Xe GPU,1200p IPS显示屏,Thunderbolt 4,甚至PCIe4 NVMe SSD都可以在这里得到最高端配置。另外,低端选项则是用奔腾N6000代替。
我们的测试装置是一个更高端的酷睿i7预生产装置,它缺少最终零售型号的一些辅助功能。尽管如此,它仍然准确地代表了用户在性能和显示质量方面对最终机型的期望。用户可以查看官方的Pocket 3 Indiegogo页面了解完整的规格。
更多GPD评论。
Potential Competitors in Comparison
Rating | Date | Model | Weight | Height | Size | Resolution | Price |
|---|---|---|---|---|---|---|---|
| 86.3 % v7 (old) | 11 / 2021 | GPD Pocket 3 i7-1195G7, Iris Xe G7 96EUs | 730 g | 20 mm | 8.00" | 1920x1200 | |
| 79.3 % v7 (old) | 08 / 2021 | GPD Win Max 2021 R7 4800U, Vega 8 | 850 g | 26 mm | 8.00" | 1280x800 | |
v (old) | GPD Win 3 i5-1135G7, Iris Xe G7 80EUs | 553 g | 27 mm | 5.50" | 1280x720 | ||
| 88.5 % v7 (old) | 04 / 2021 | Lenovo ThinkPad X12 20UVS03G00 i7-1160G7, Iris Xe G7 96EUs | 1.1 kg | 14.5 mm | 12.30" | 1920x1280 | |
| 86.7 % v7 (old) | 10 / 2021 | Dell XPS 13 9310 2-in-1 i7-1165G7, Iris Xe G7 96EUs | 1.3 kg | 14.35 mm | 13.40" | 1920x1200 | |
| 89.4 % v7 (old) | 02 / 2021 | HP Spectre x360 14t-ea000 i7-1165G7, Iris Xe G7 96EUs | 1.3 kg | 17.2 mm | 13.50" | 1920x1280 |
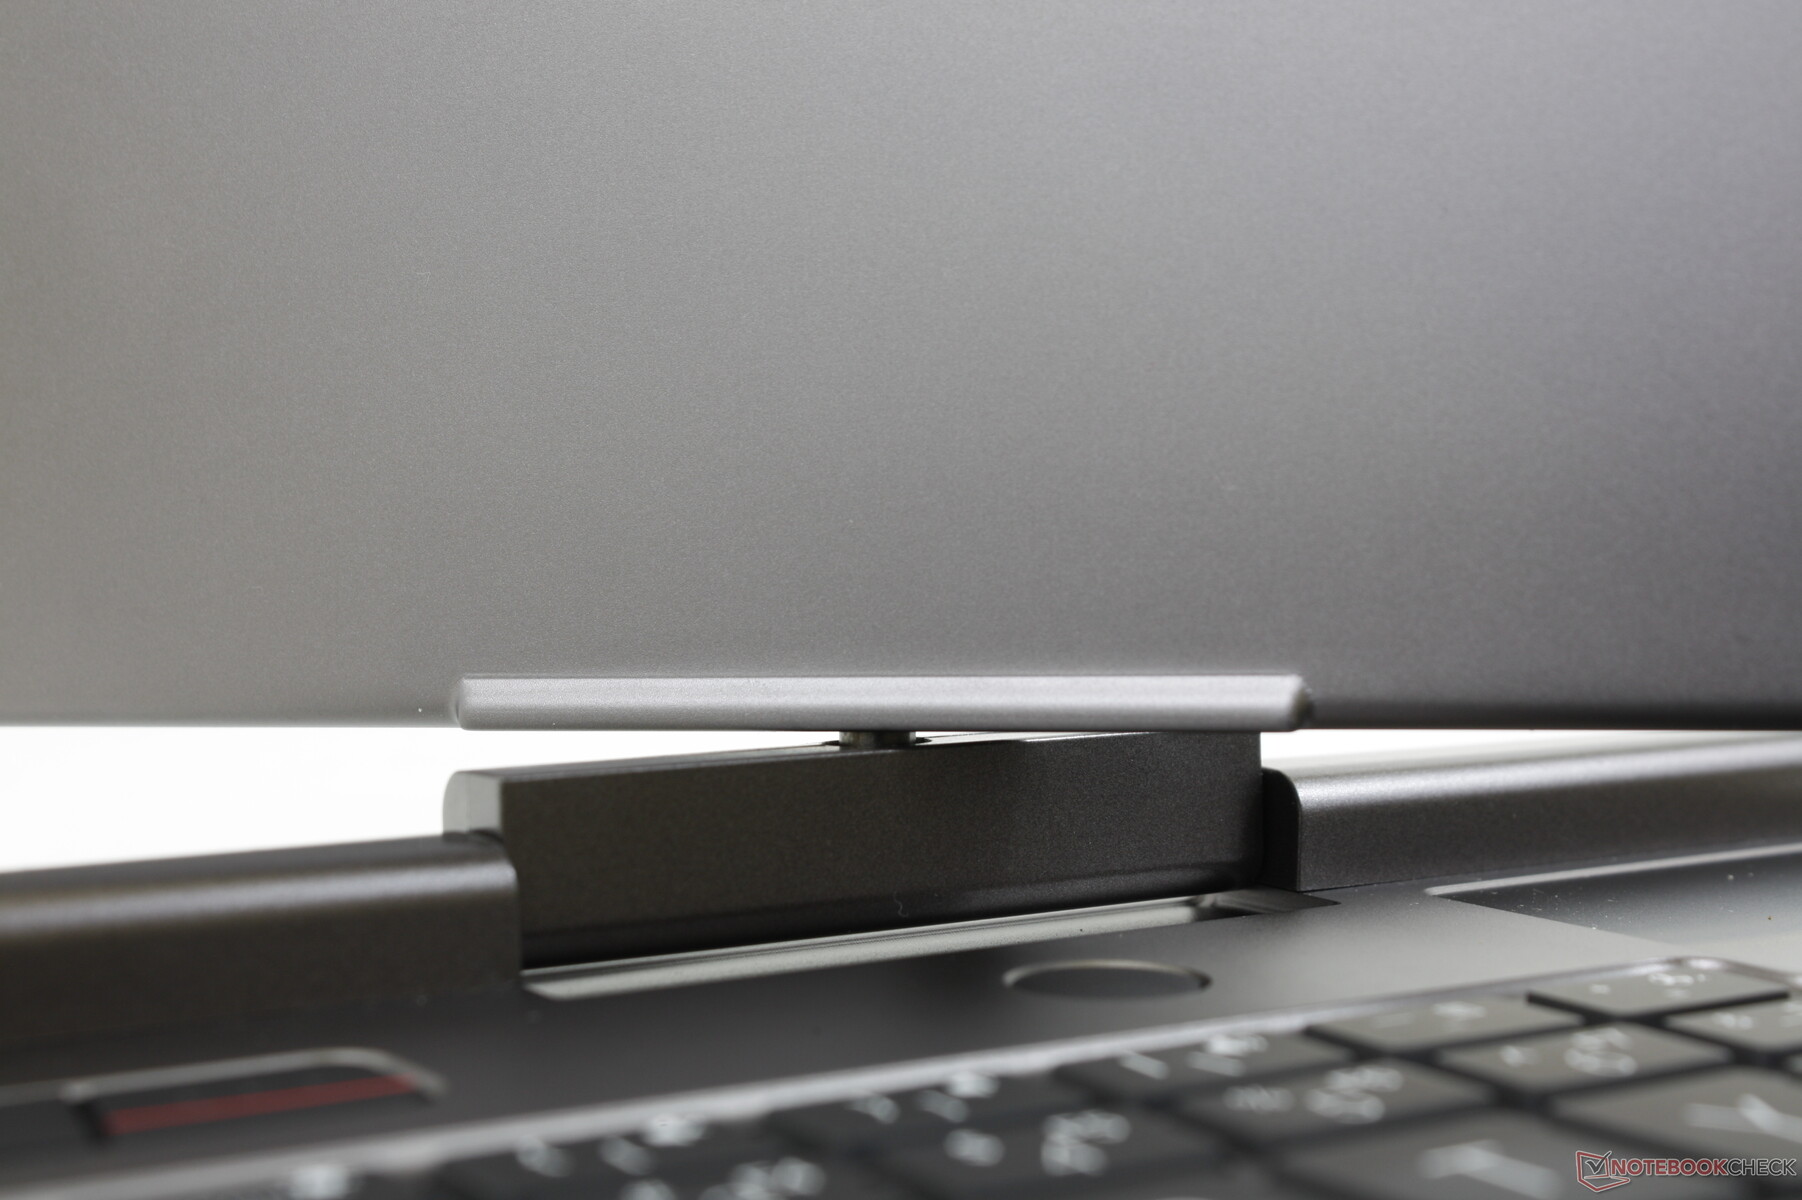
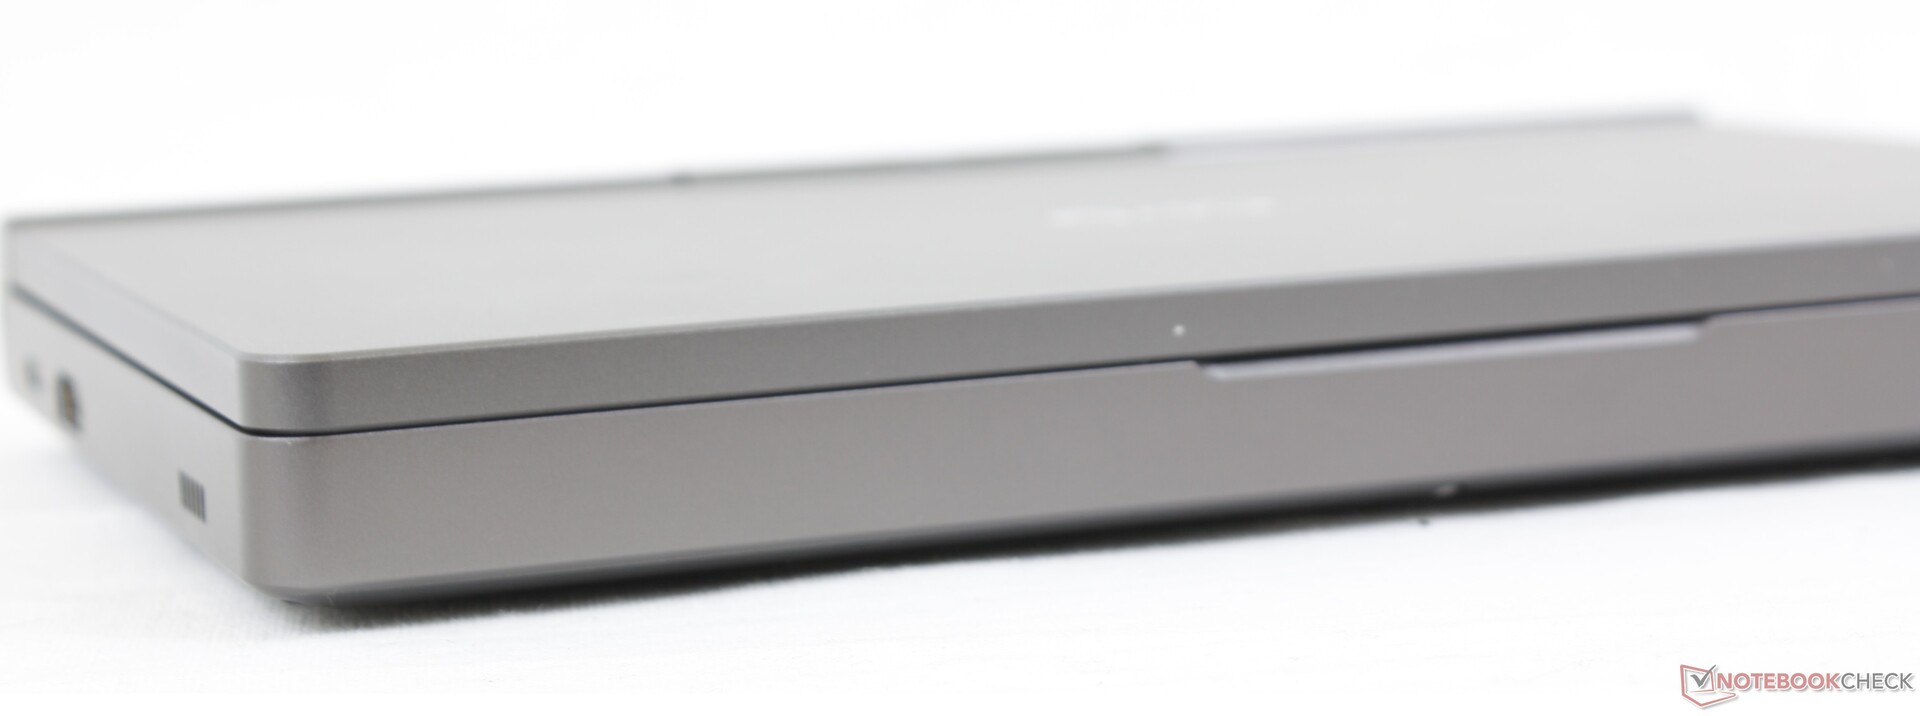
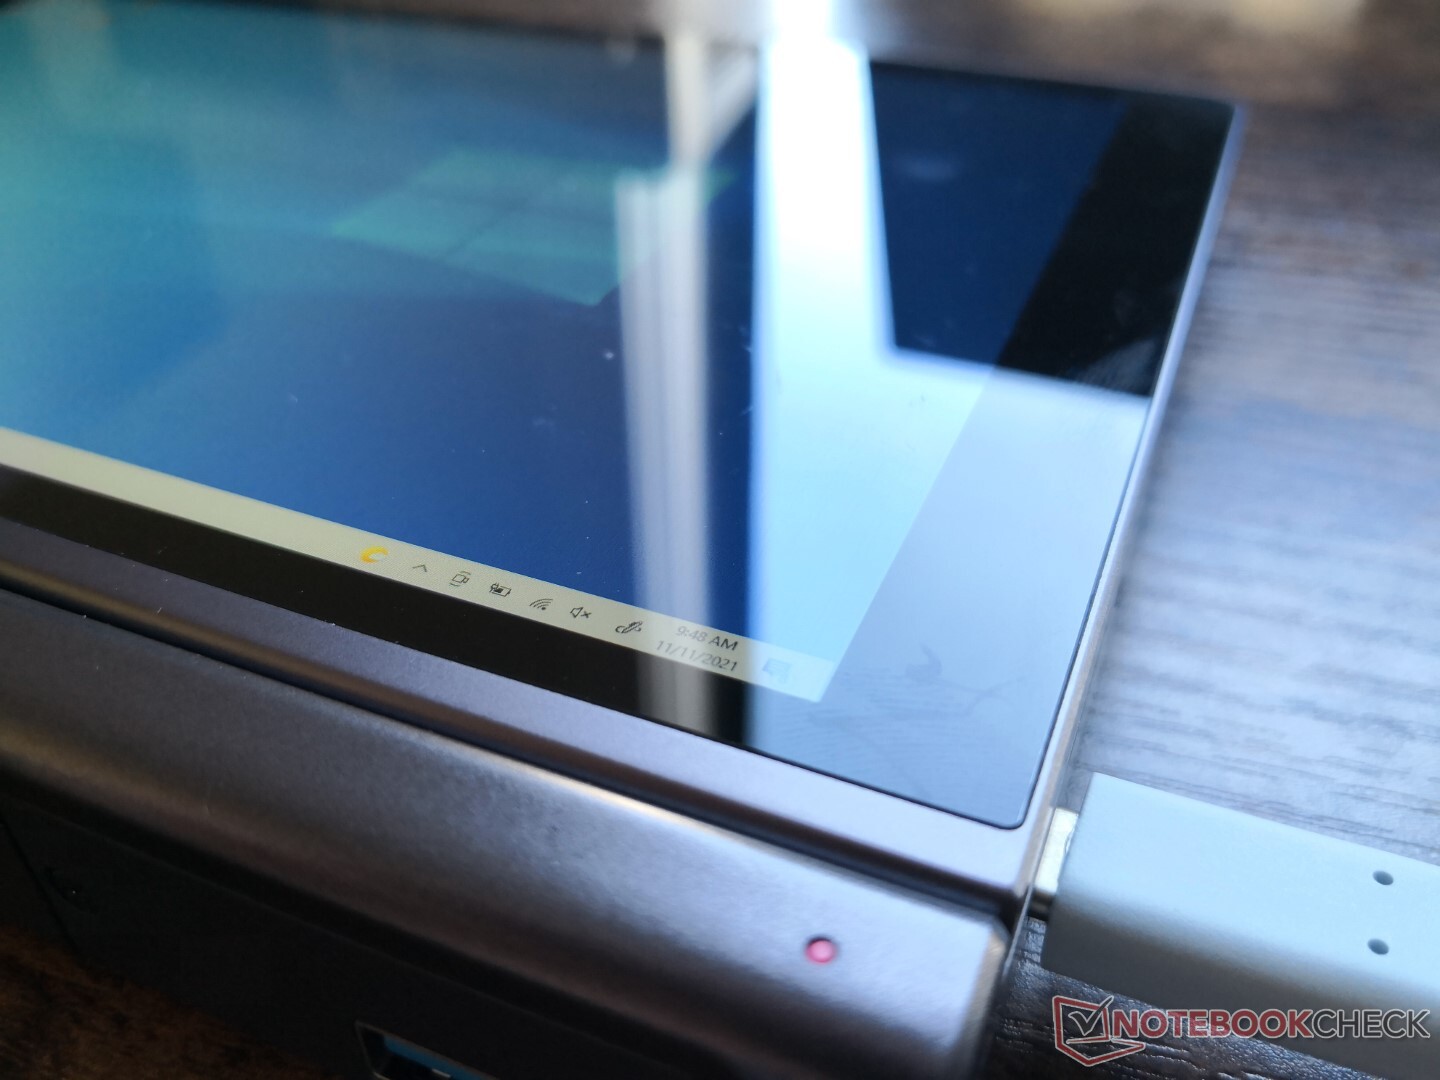
外壳 - 流线型,大部分都很坚固
GPD在Pocket 3、Win Max和Win 3之间使用相同的金属底盘材料,使该系列之间的感觉和质地相似。虽然底座很坚固,但旋转的触摸屏连接在一个非常小的关节上,随着时间的推移,感觉很容易减弱或断裂。这是我们必须在一年的时间里进行更彻底的测试,看看这个关节是否能承受住持续使用。
没有任何集成的控制器按钮,使得8英寸Pocket 3在三个方面都比8英寸Win Max更轻更小。
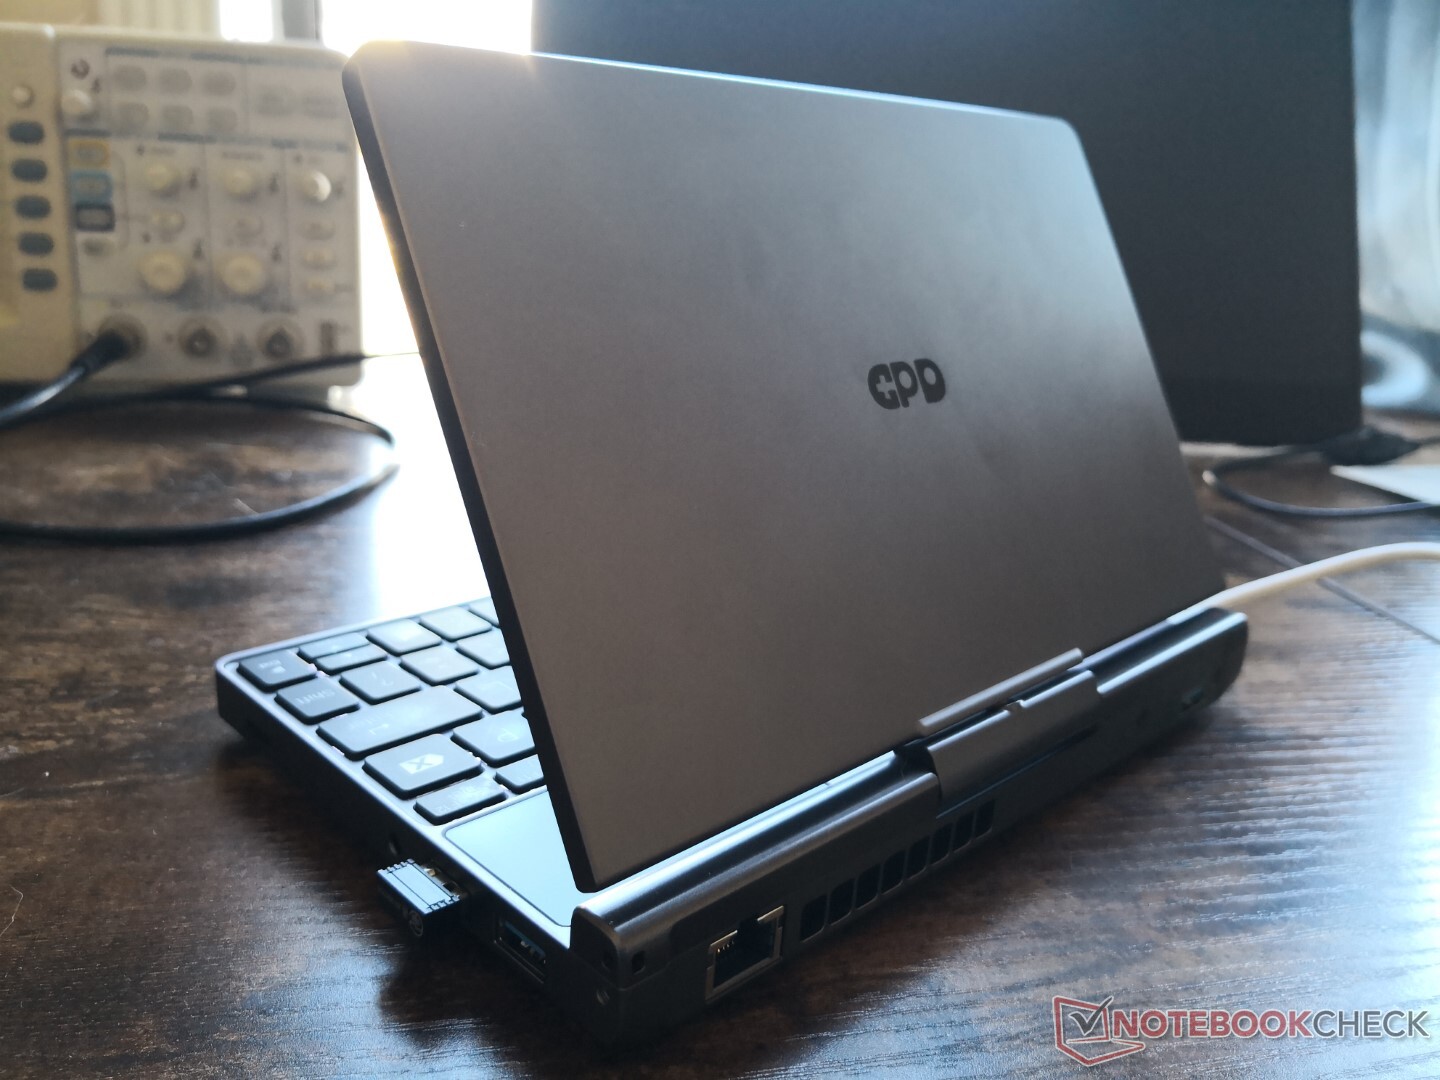
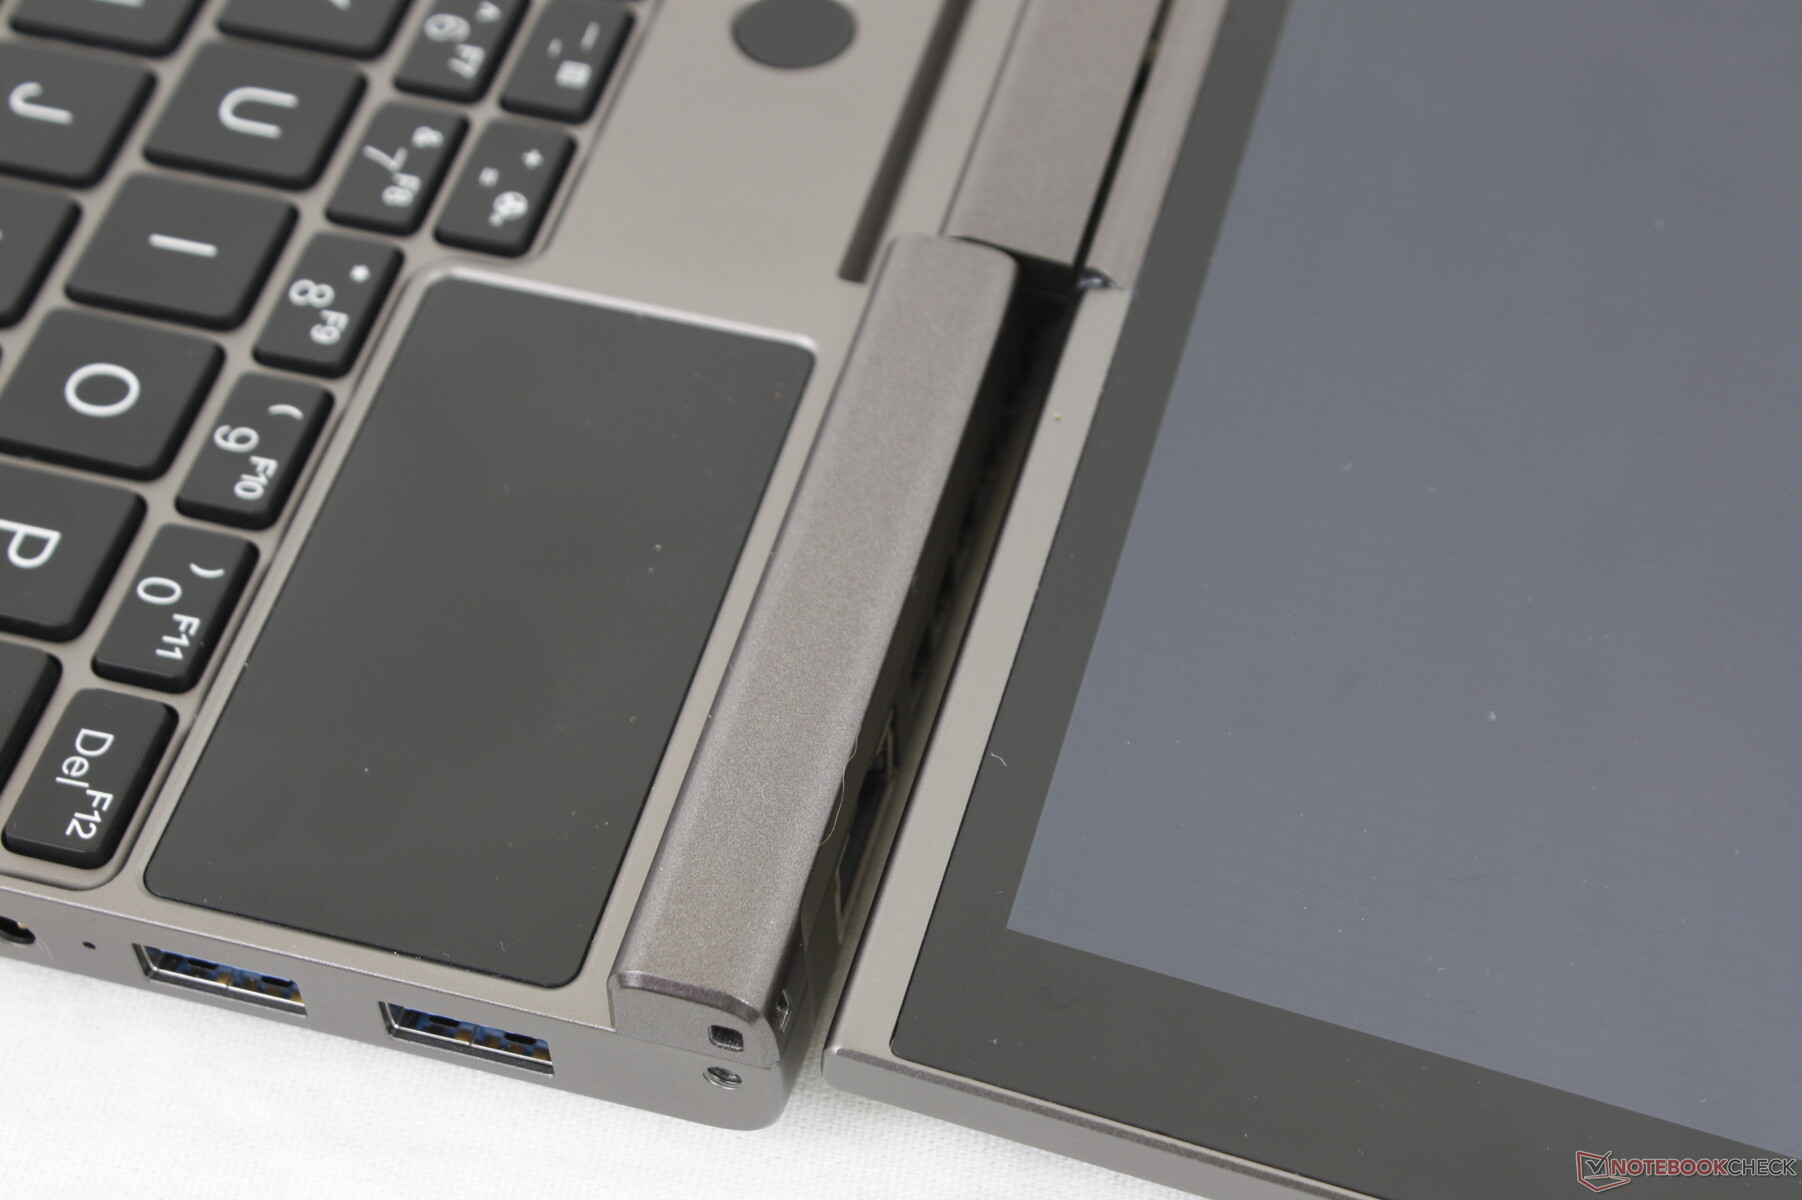
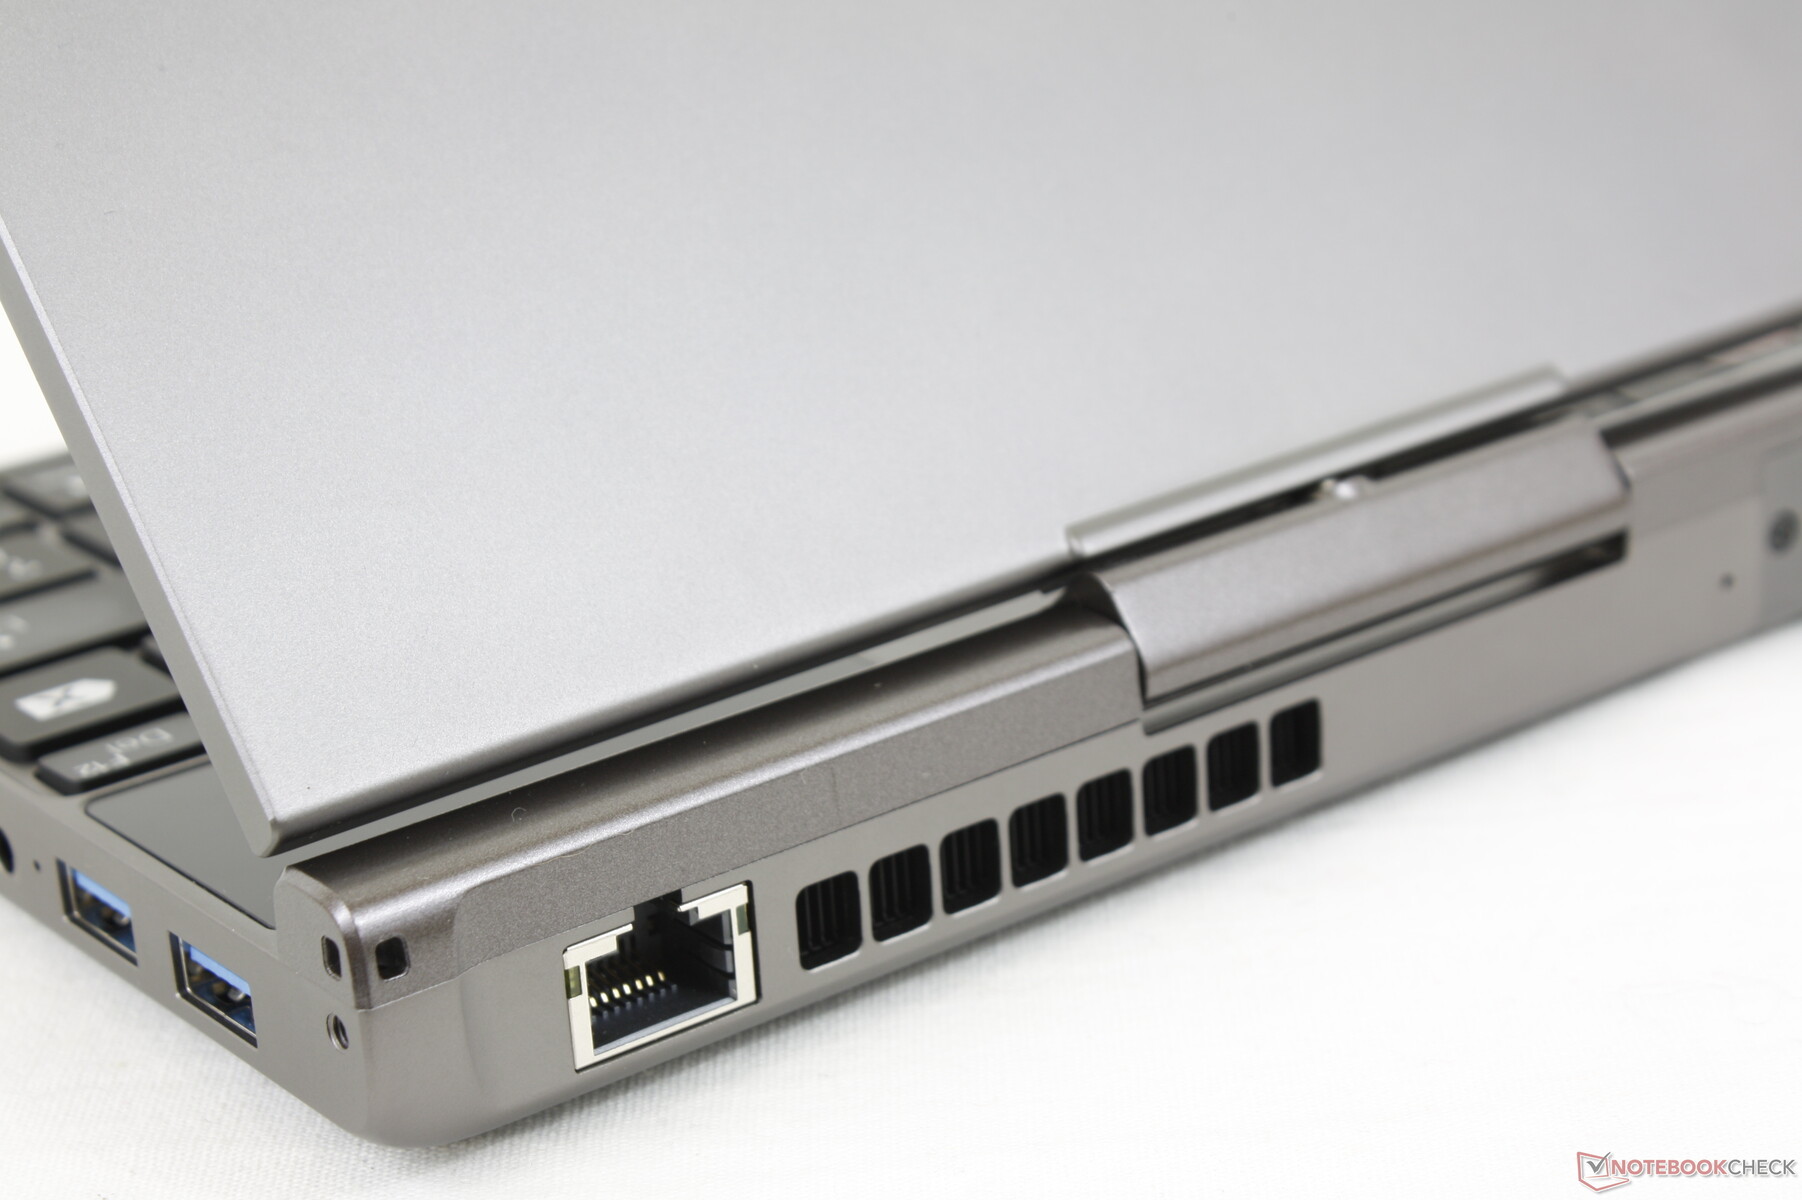
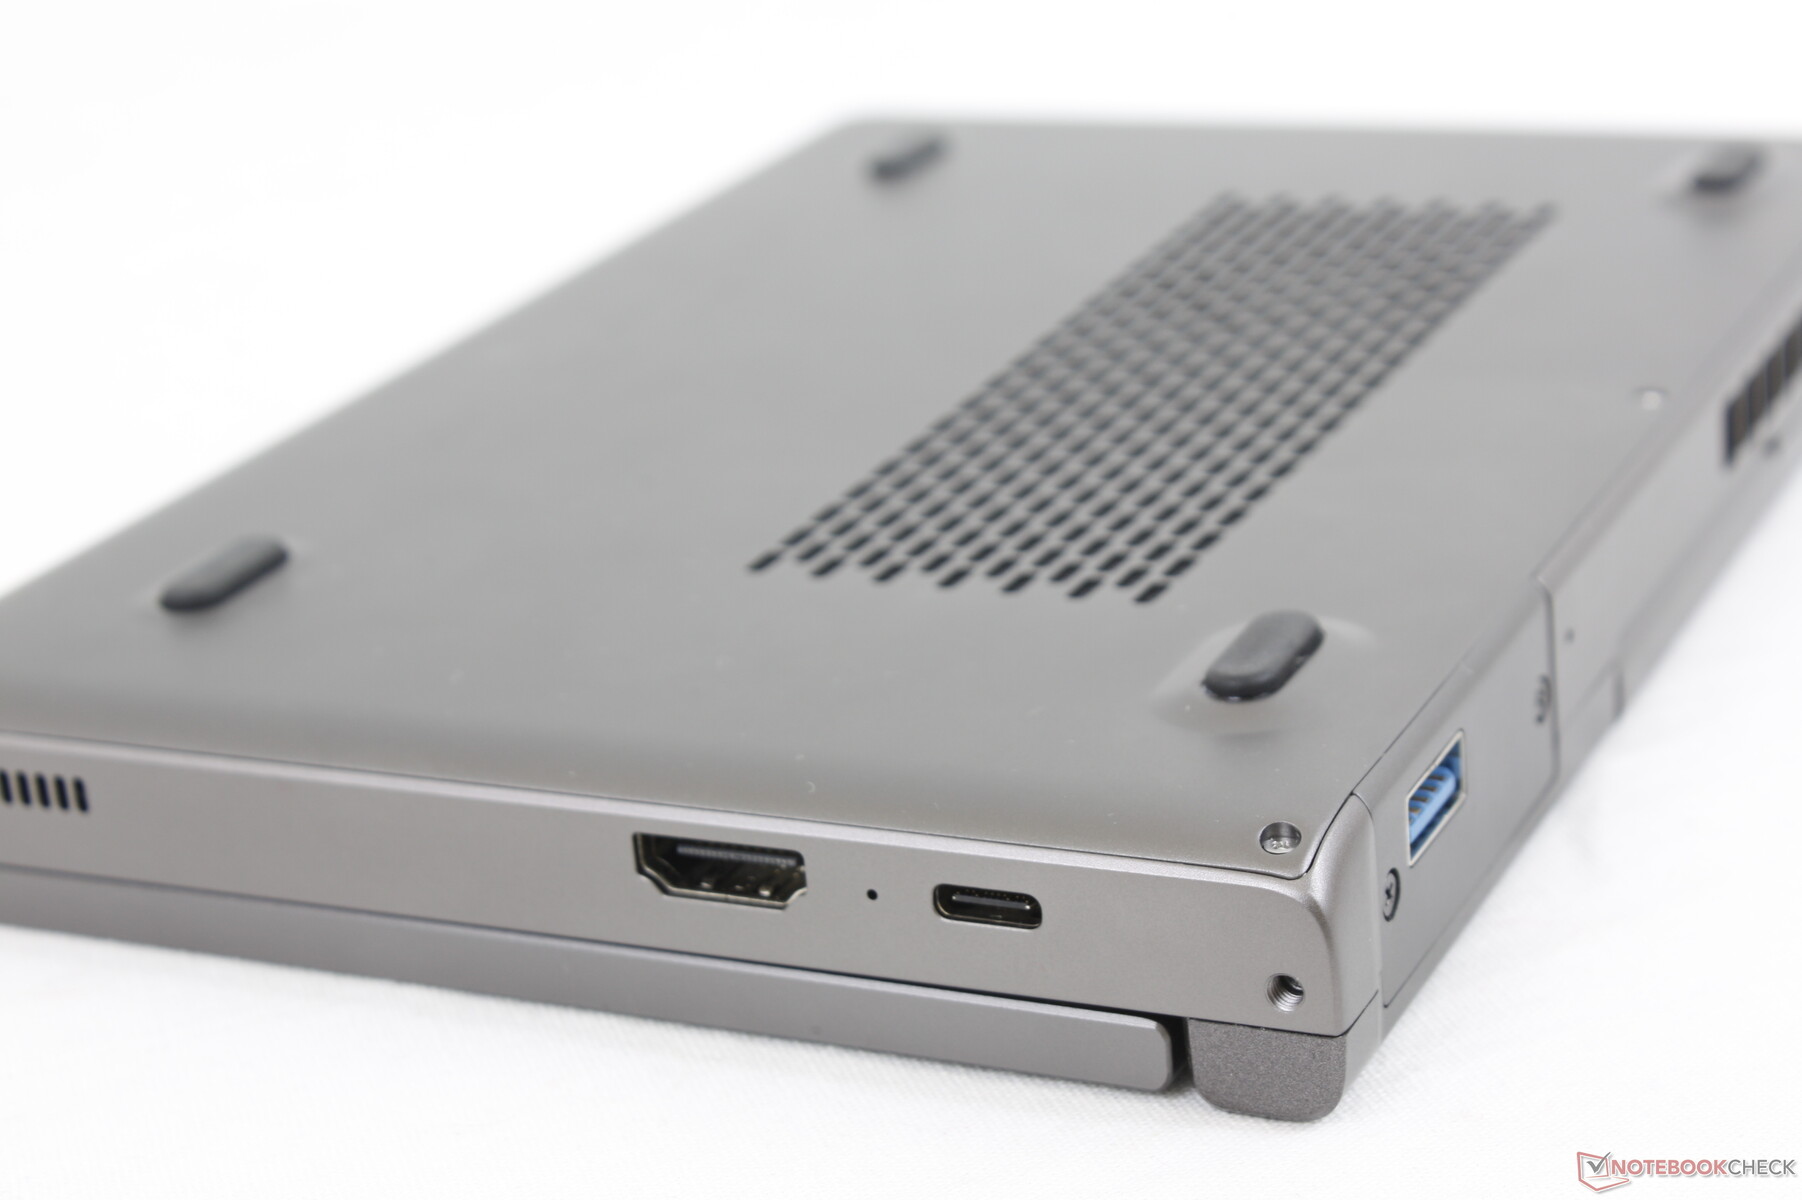
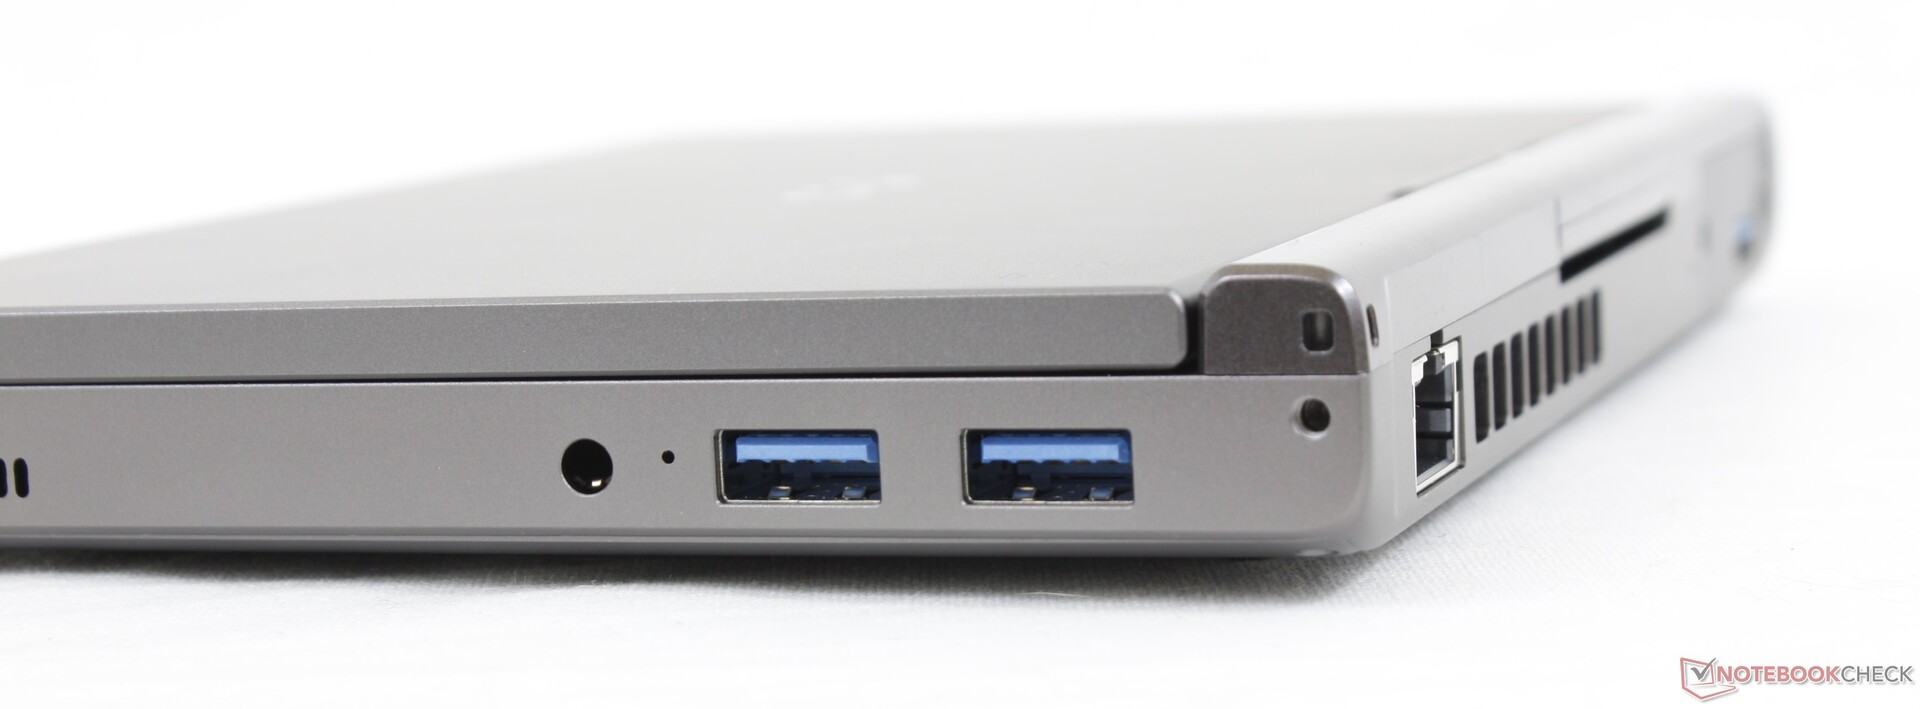
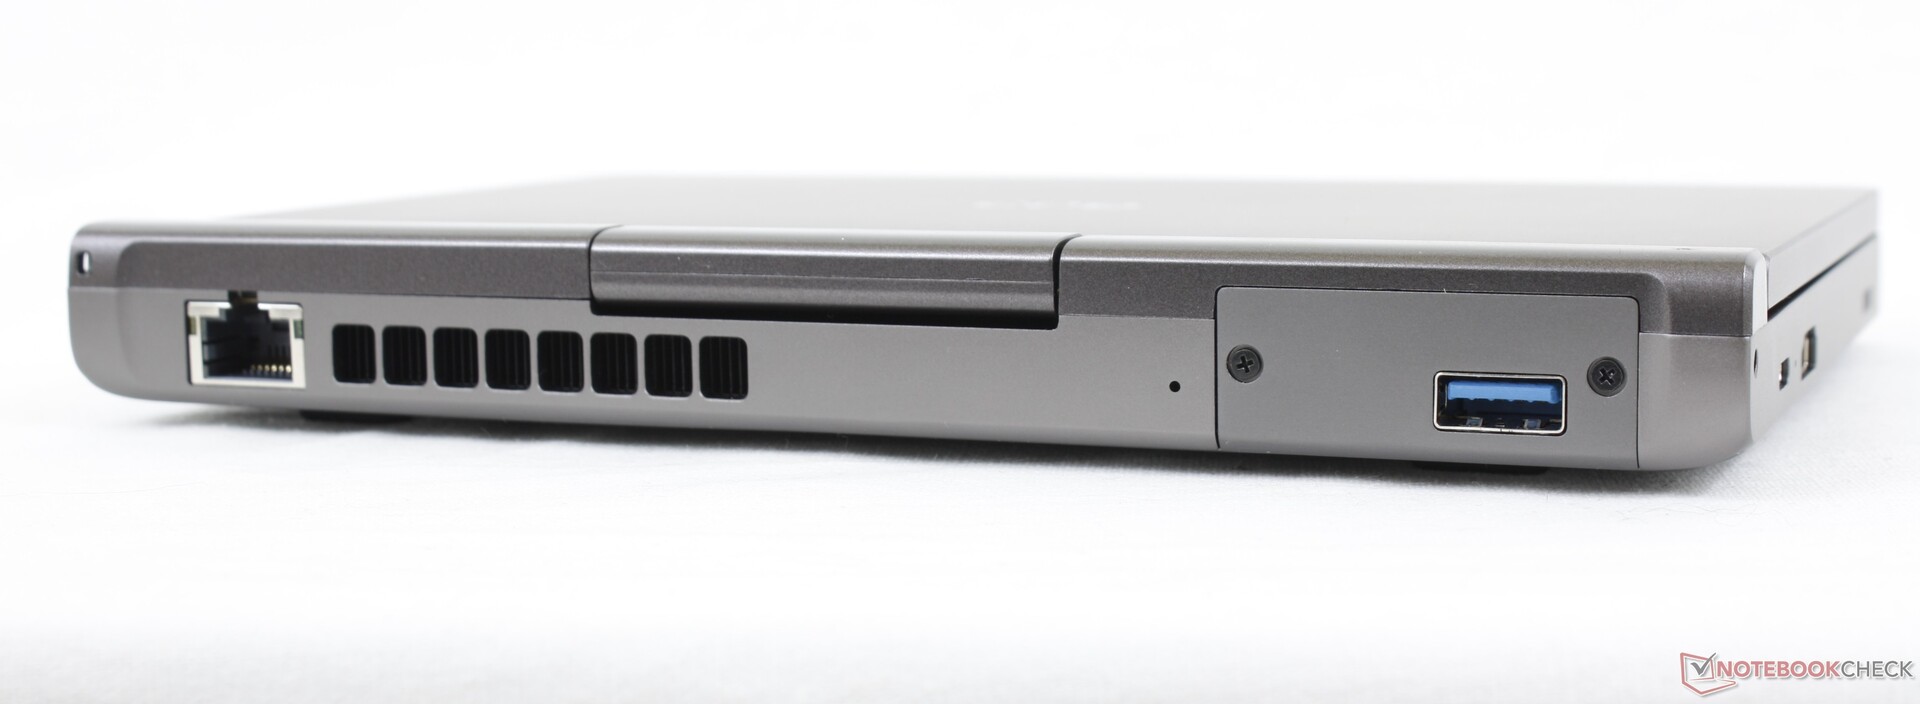
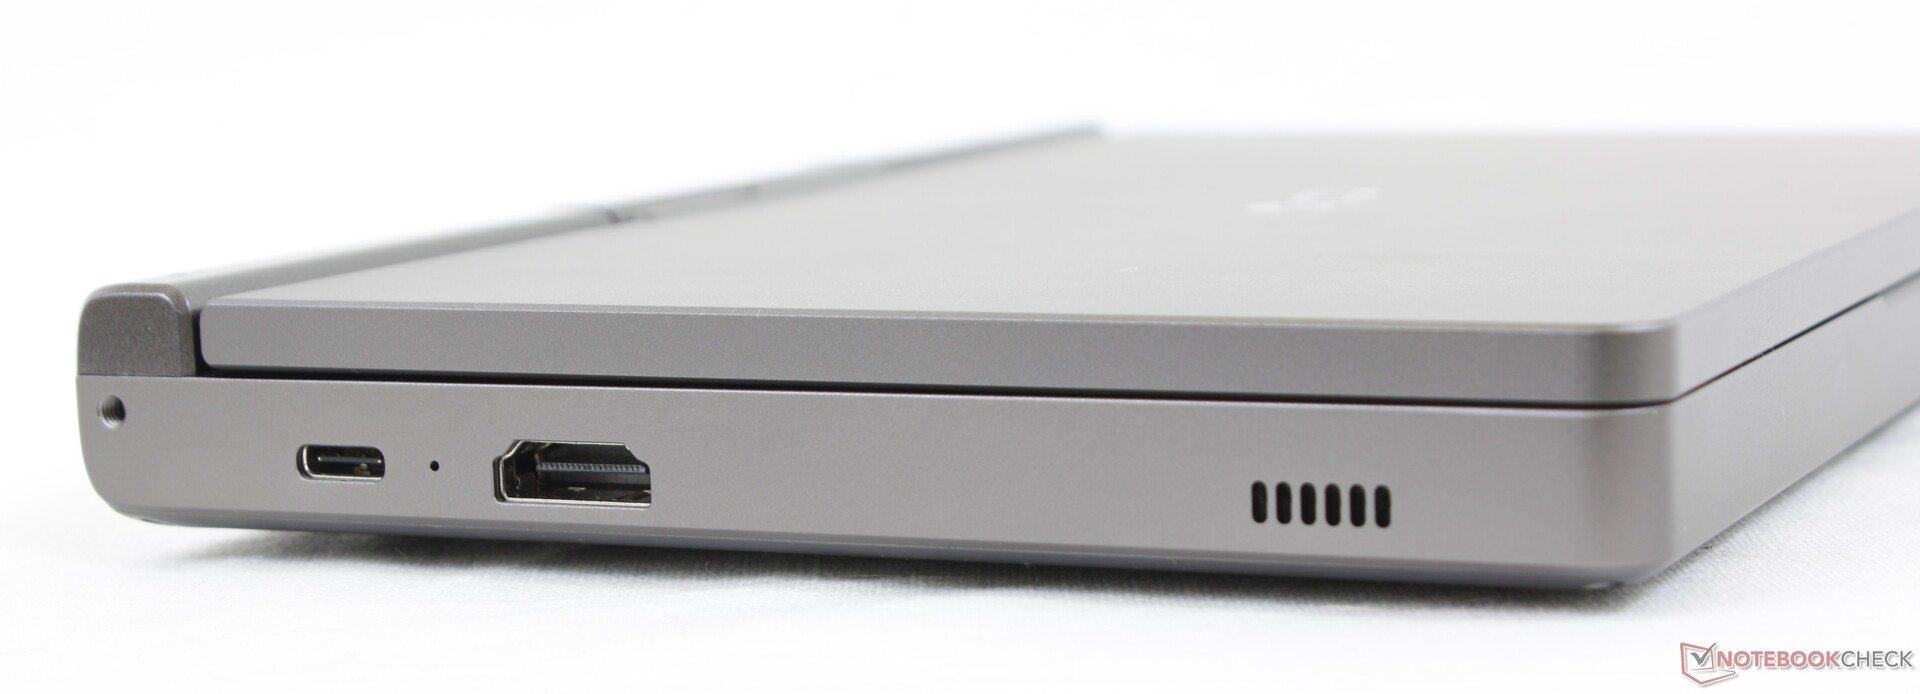
连接性 - 需要更多的USB-C端口
端口选项多种多样,只有一个恼人的限制:只有一个USB-C端口用于Thunderbolt 4和充电。因此,如果上述设备不支持USB充电直通,连接外部显示器、扩展坞或外部图形可能会妨碍你为Pocket 3充电。较小的Pentium Pocket 3 SKU不支持Thunderbolt。
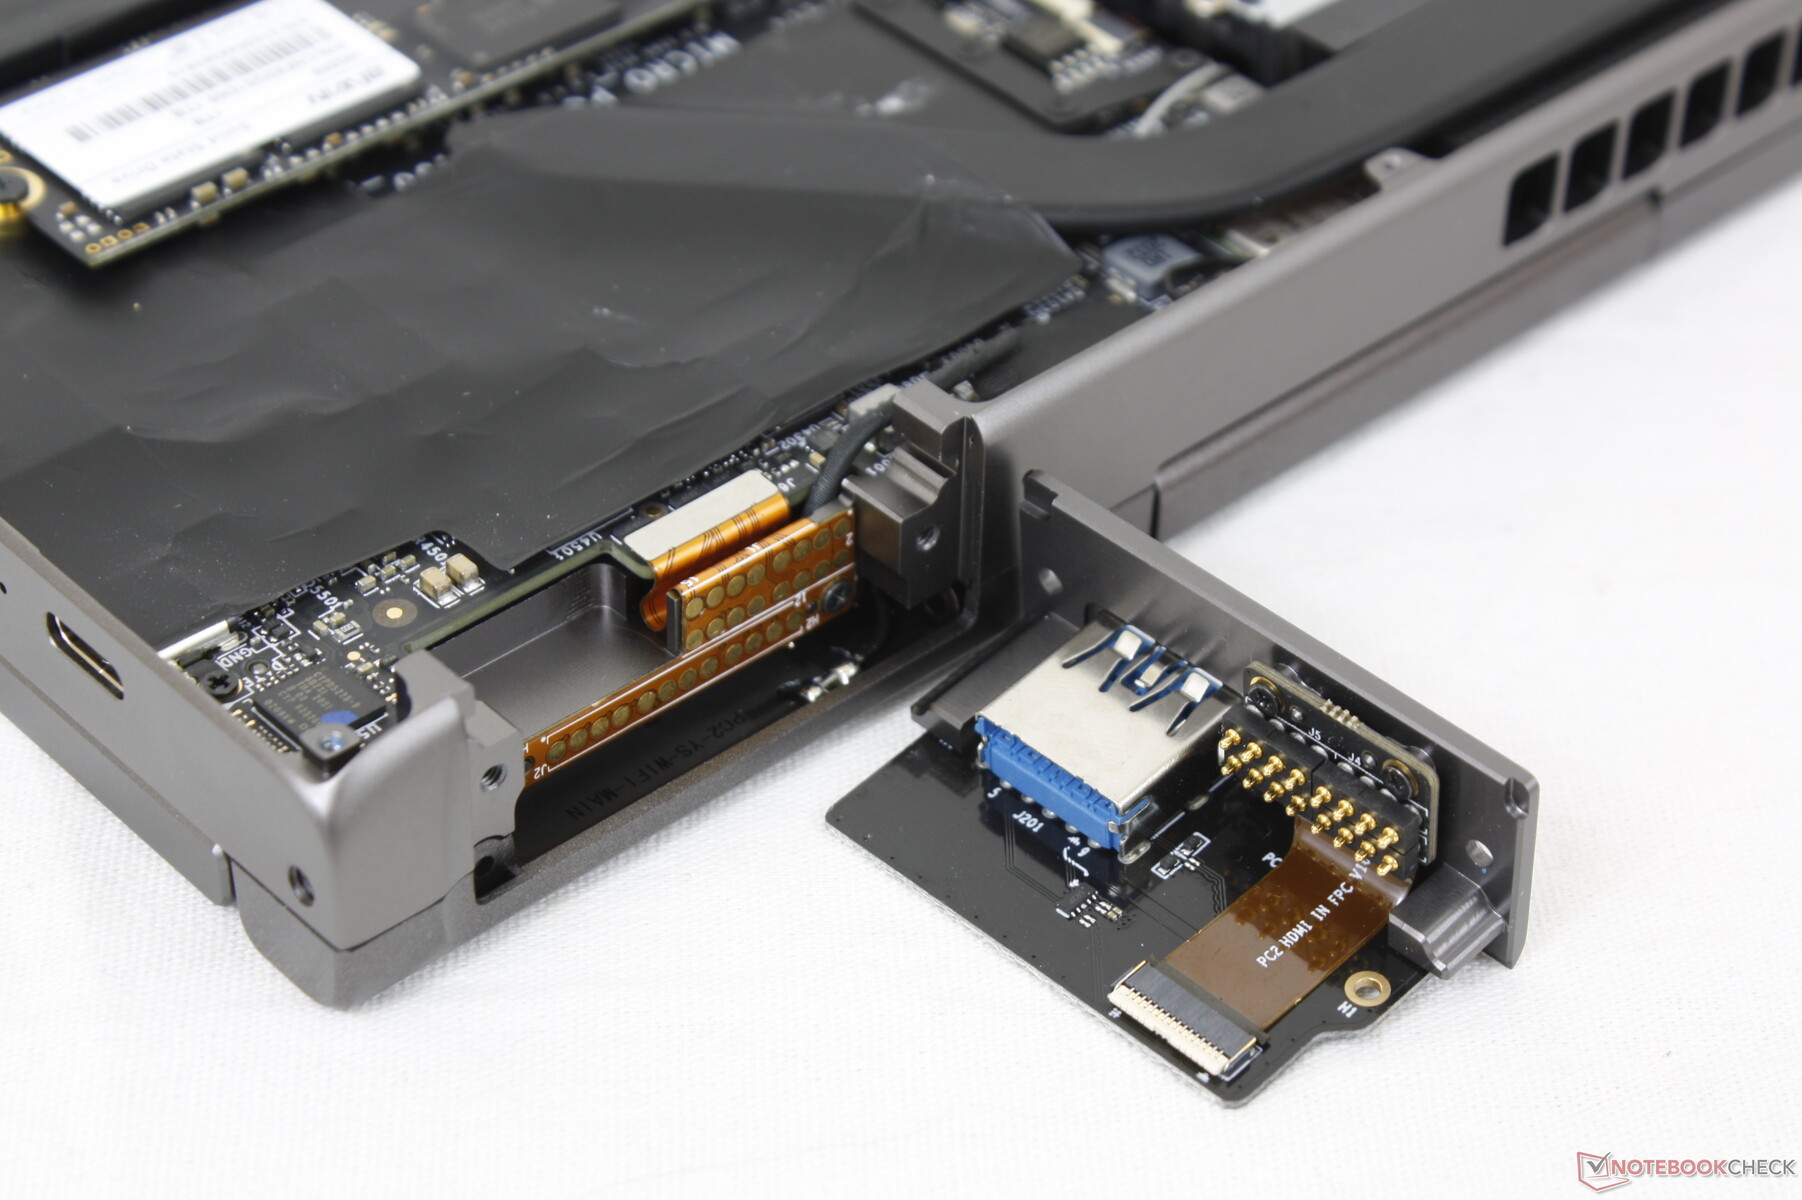
Pocket 3的独特之处在于它的KVM端口,如右图所示,可以转换为HDMI输入或USB输入。然后,用户将能够用集成的Pocket 3键盘控制外部设备,或使用内部显示器来连接外部主机。
虽然我们的预生产测试装置不包括一个,但GPD说零售型号将集成一个MicroSD读卡器。
沟通
| Networking | |
| iperf3 transmit AX12 | |
| Lenovo ThinkPad X12 20UVS03G00 | |
| GPD Win 3 | |
| HP Spectre x360 14t-ea000 | |
| GPD Pocket 3 | |
| Dell XPS 13 9310 2-in-1 | |
| GPD Win Max 2021 | |
| iperf3 receive AX12 | |
| Lenovo ThinkPad X12 20UVS03G00 | |
| Dell XPS 13 9310 2-in-1 | |
| GPD Win 3 | |
| HP Spectre x360 14t-ea000 | |
| GPD Pocket 3 | |
| GPD Win Max 2021 | |
网络摄像头 - 偏离中心
来自200万像素网络摄像头的图像质量比许多其他笔记本电脑更清晰,但色彩准确性仍然很差。网络摄像头也偏离了中心,因为它在显示屏的左上角,而不是顶部中心。也没有网络摄像头快门或红外摄像头。


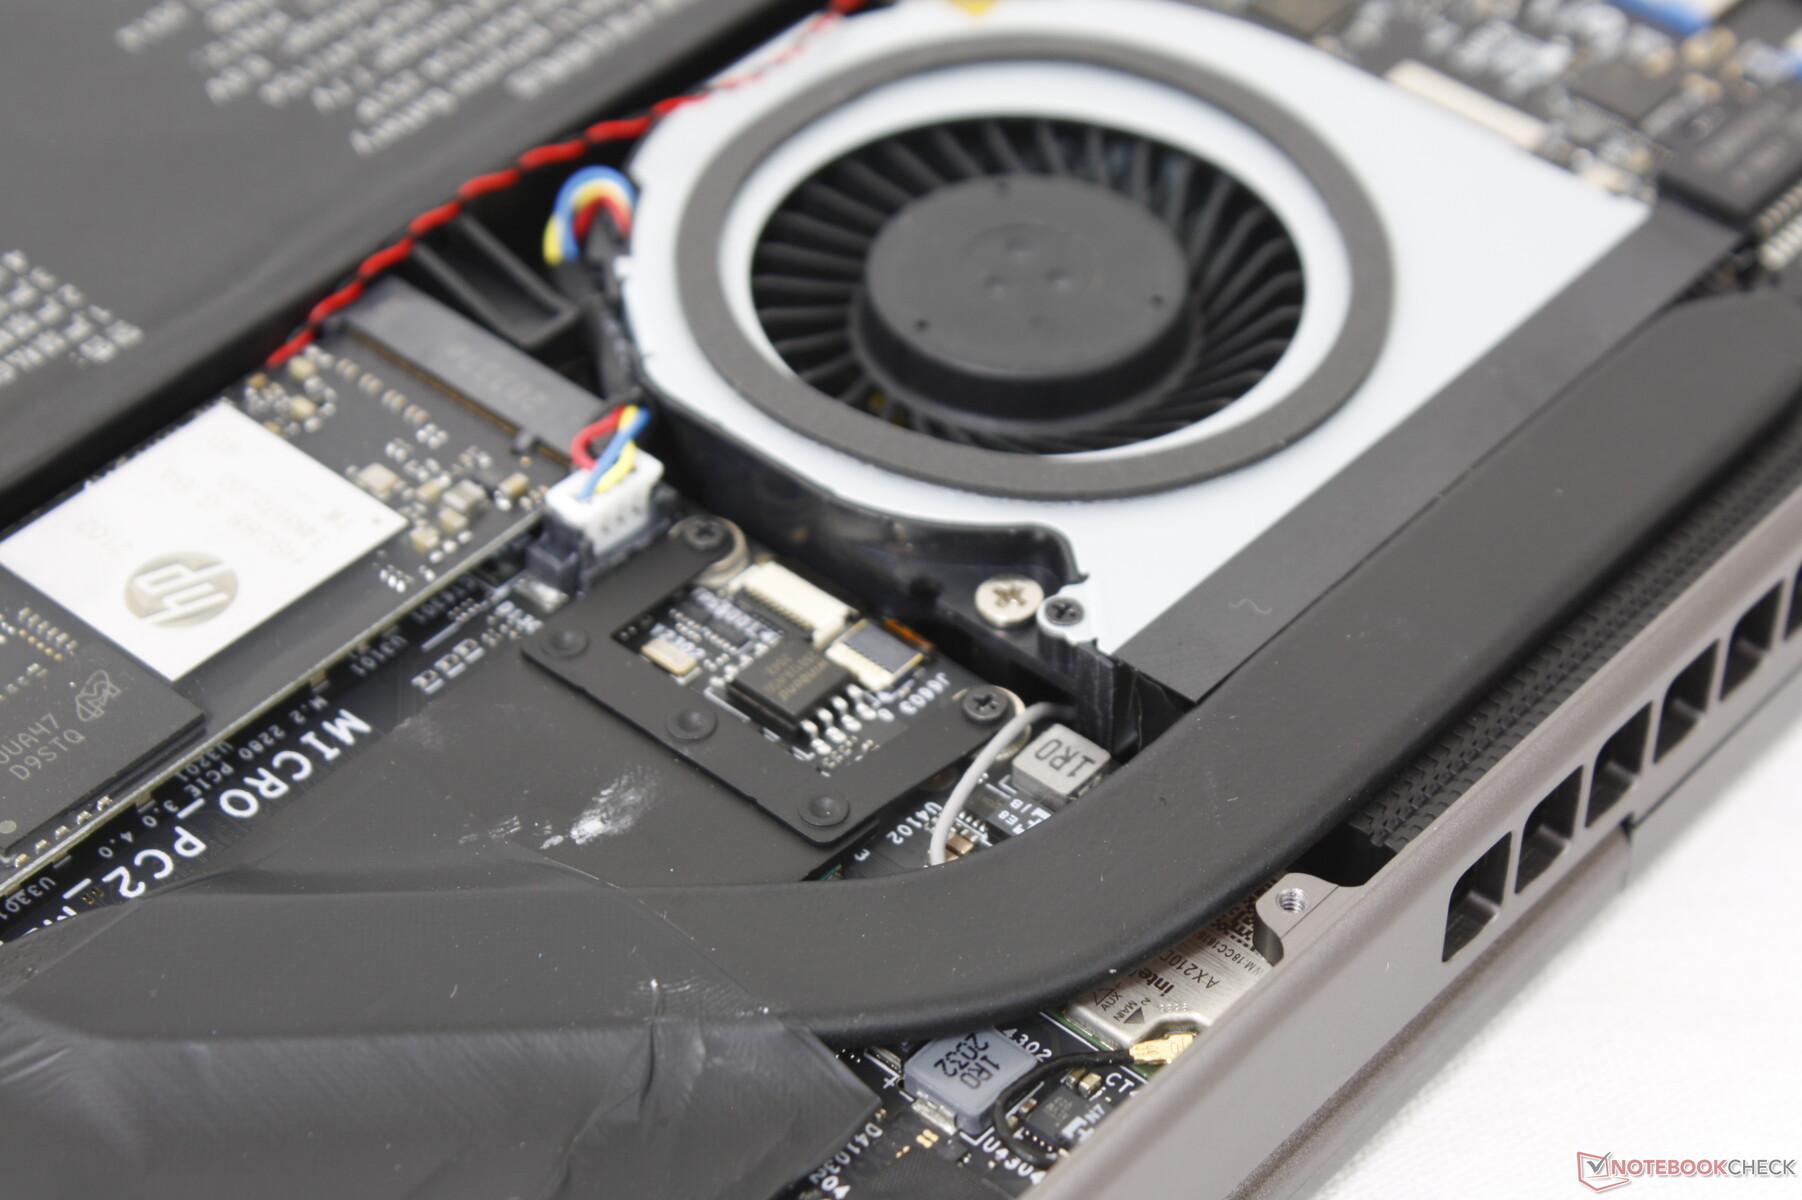
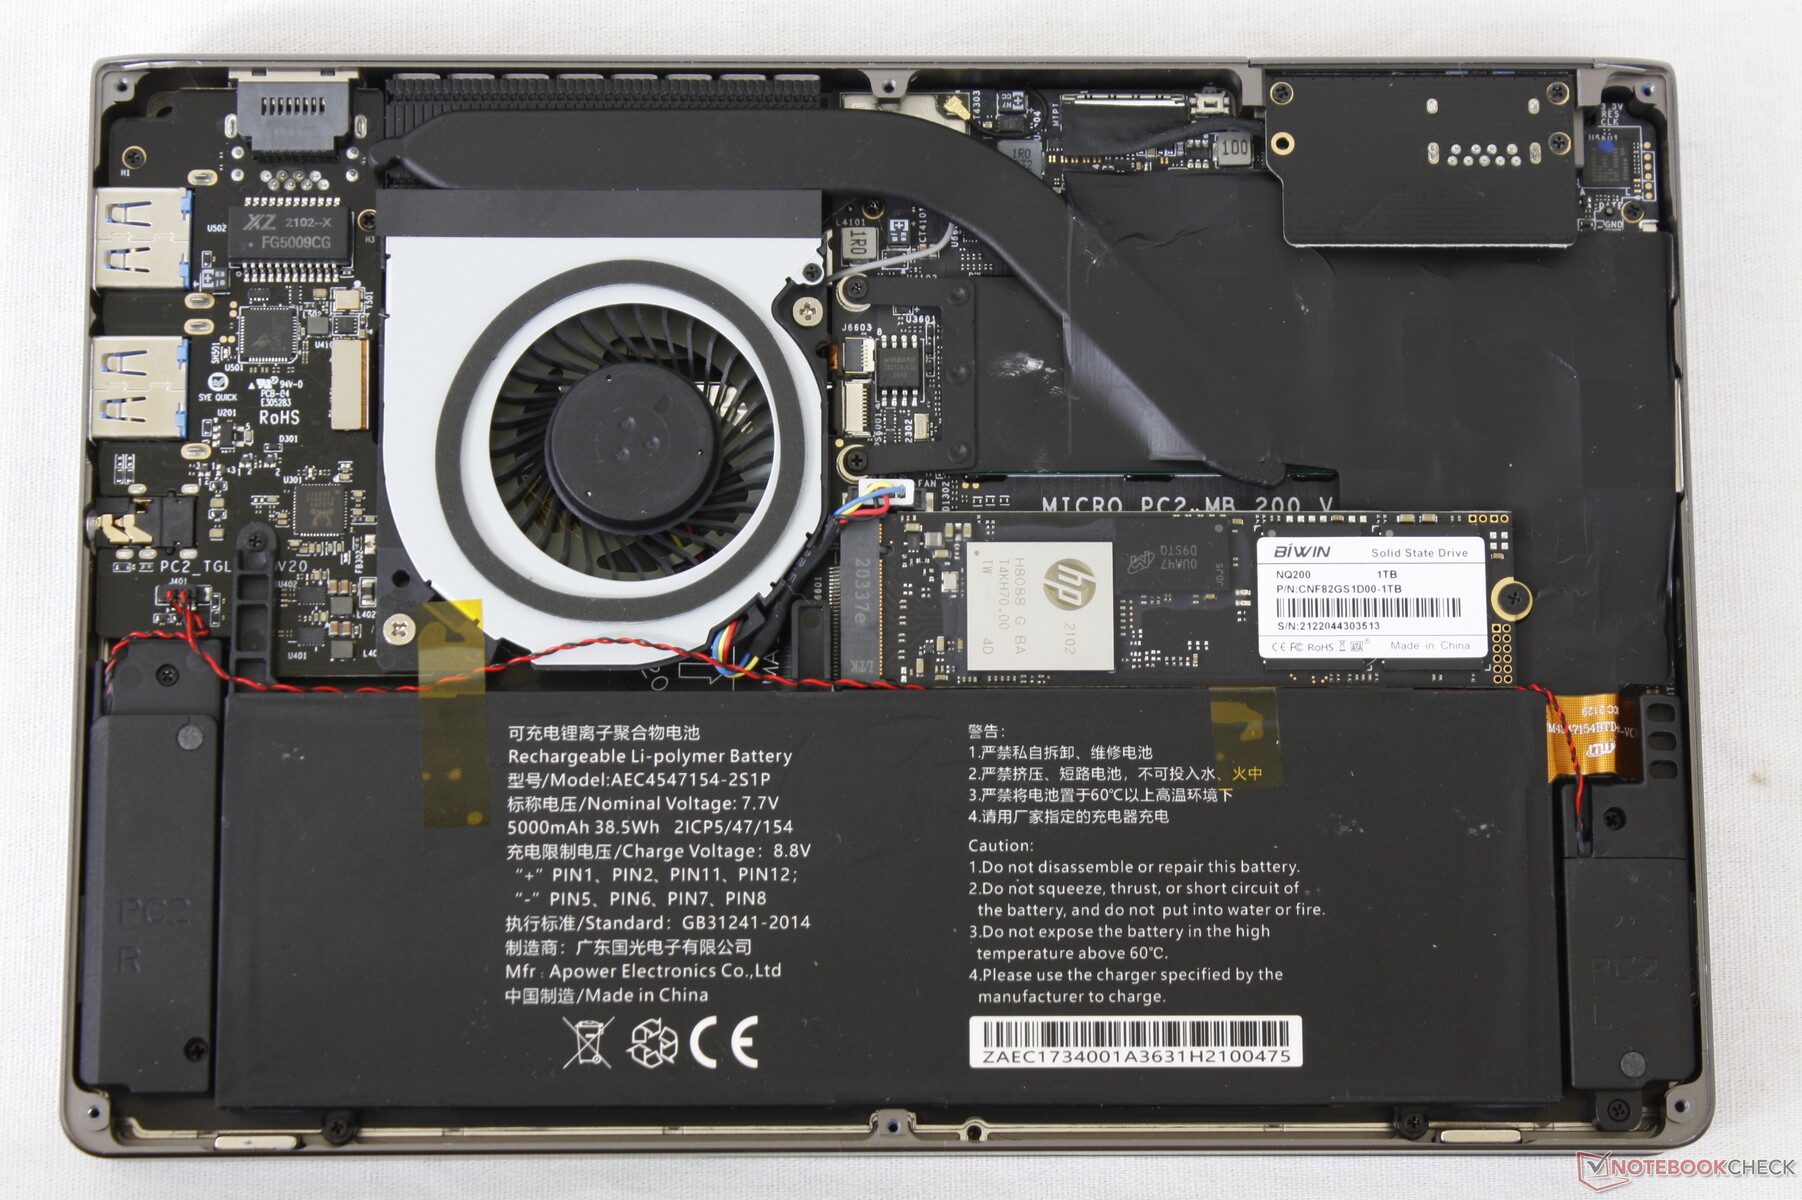
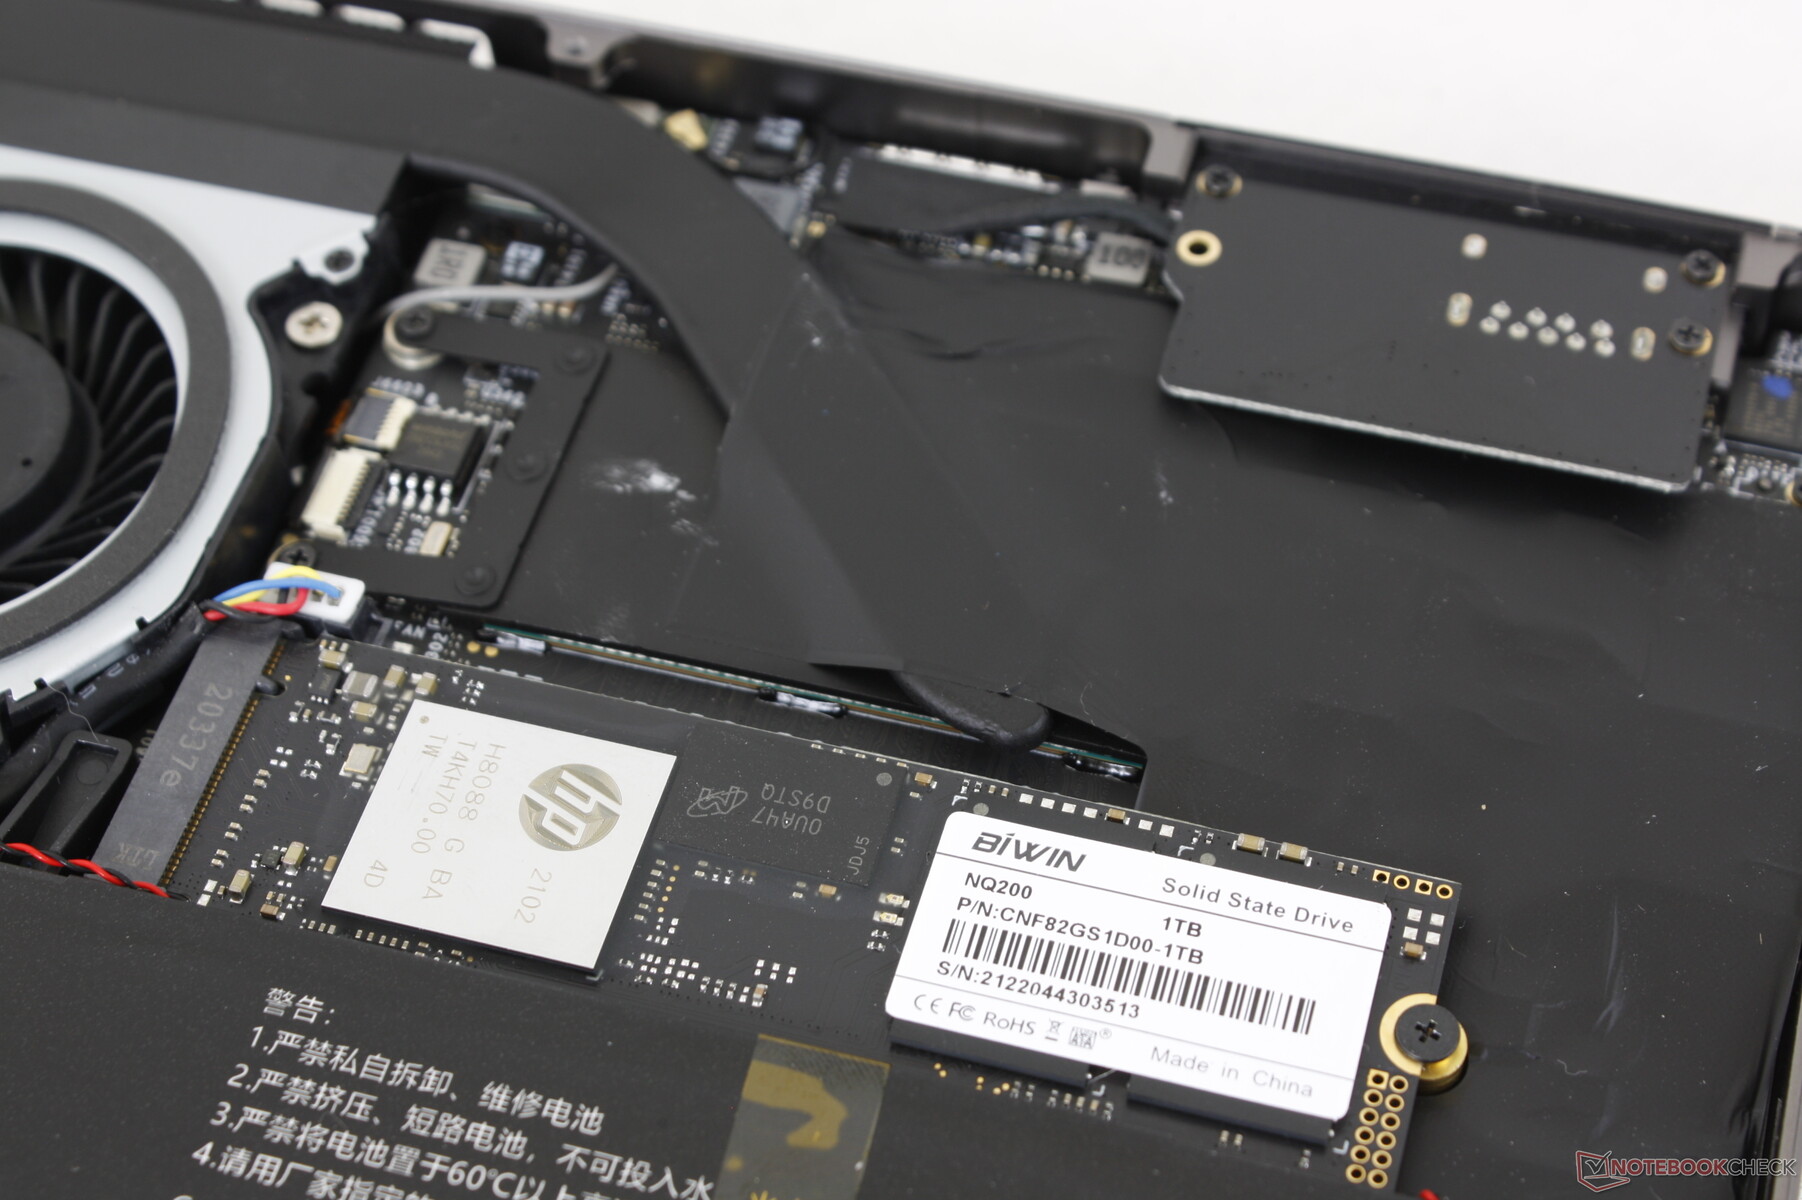
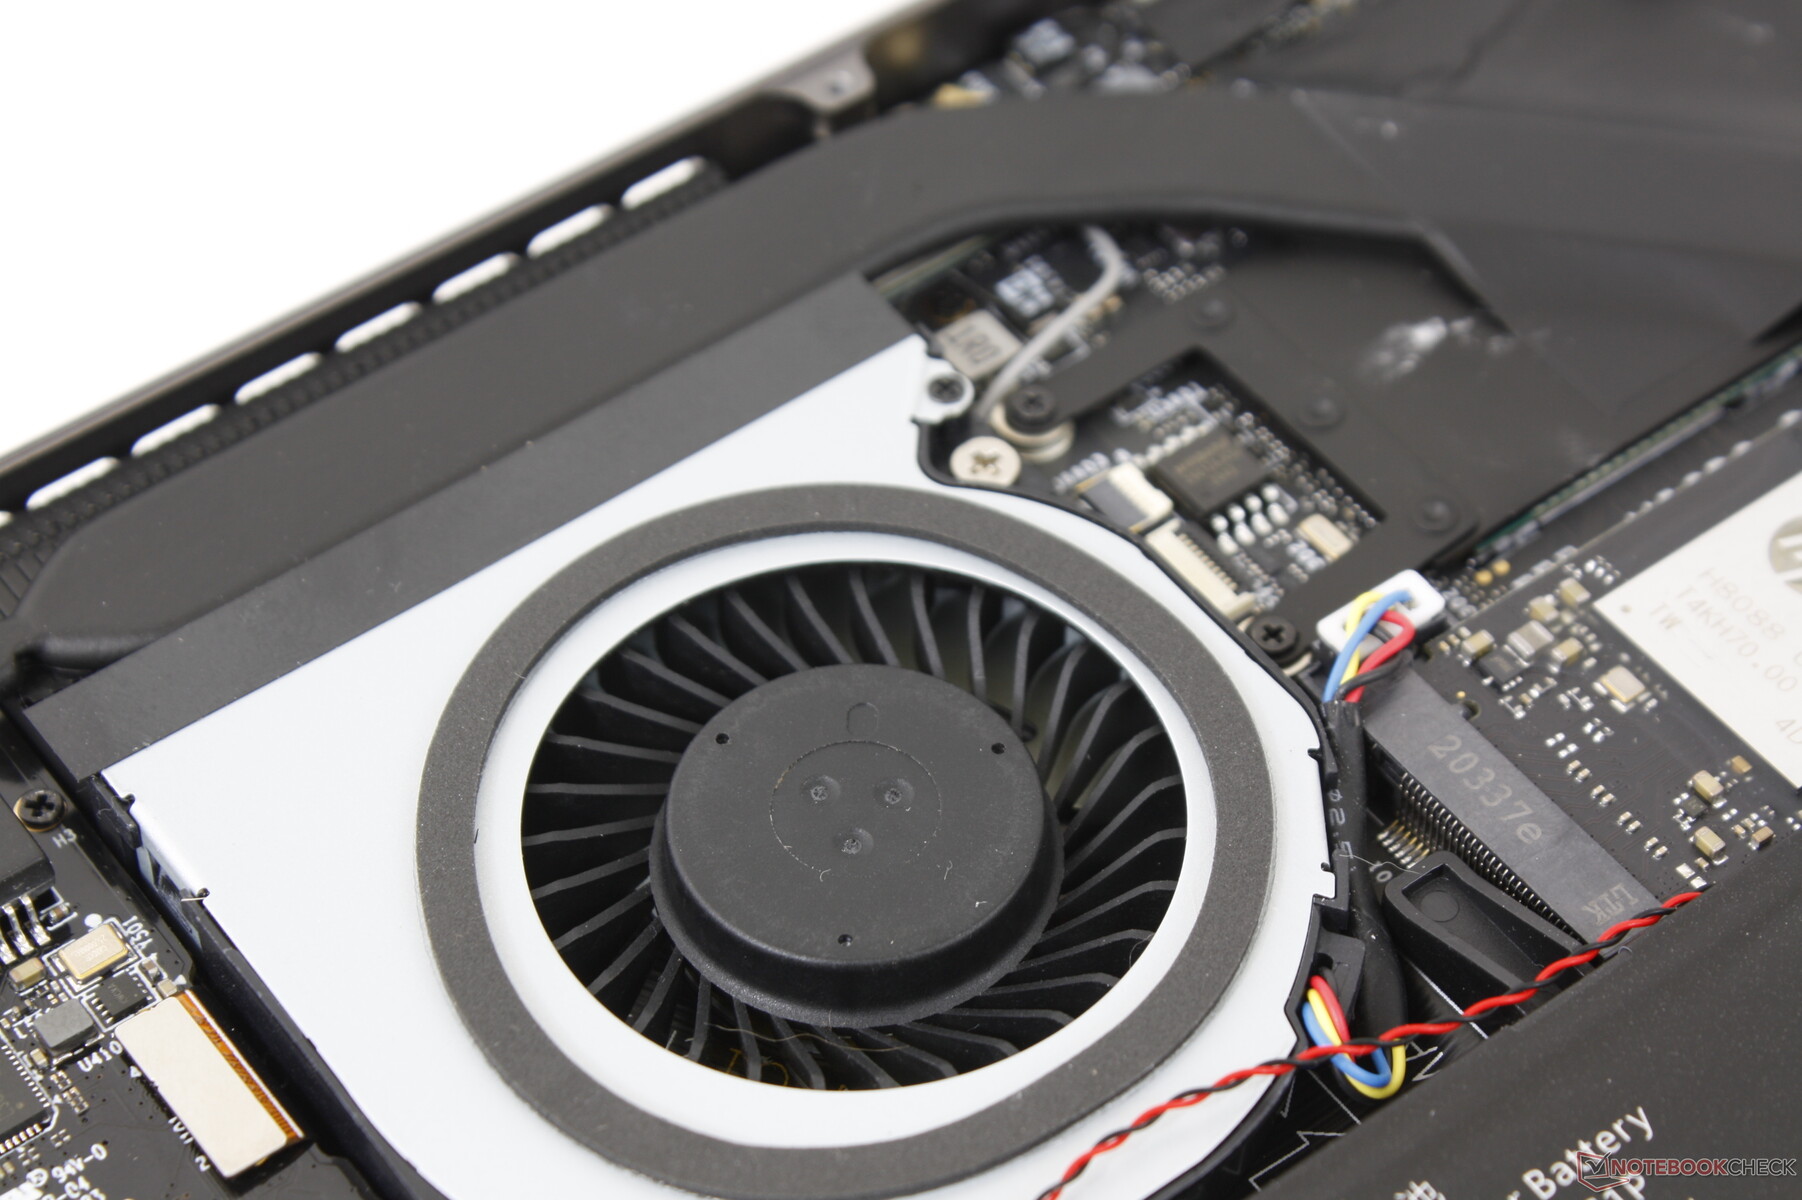
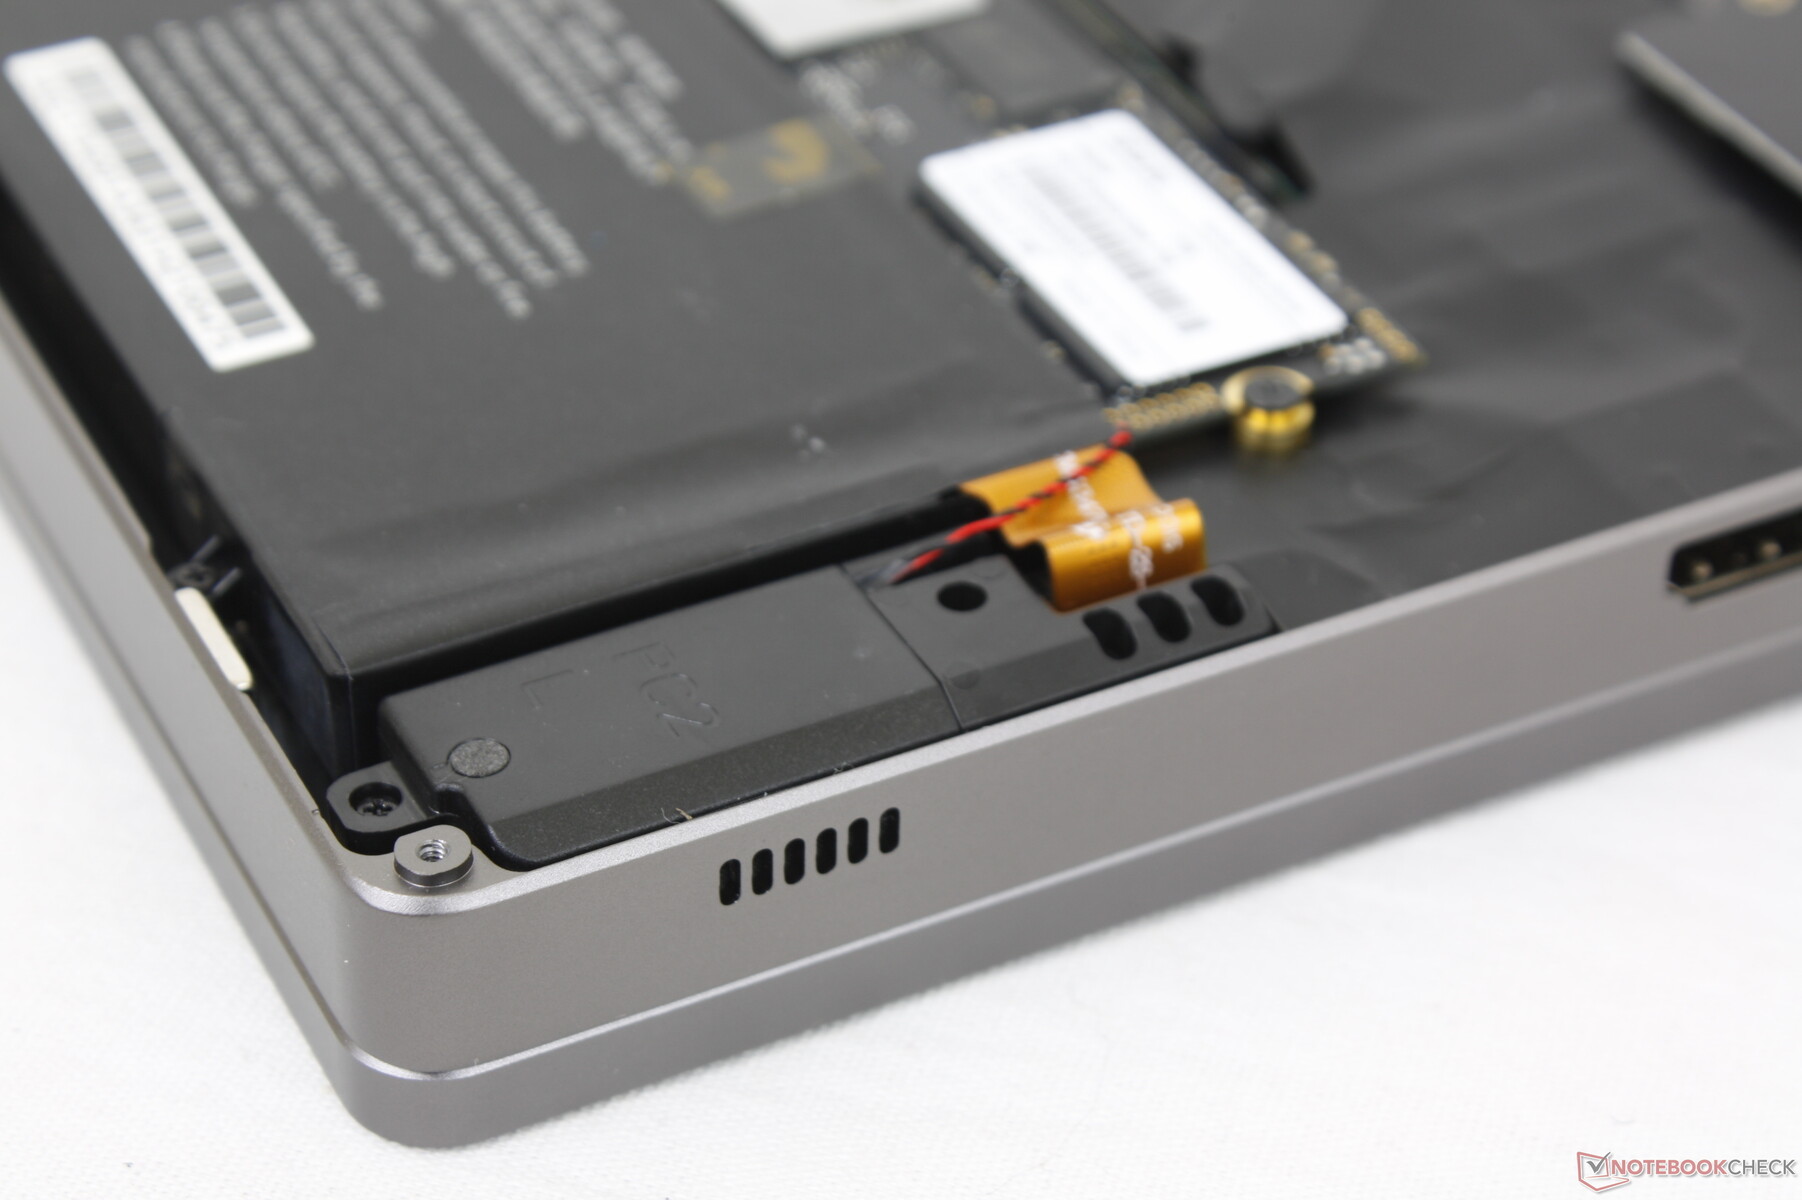
维护
只用一把飞利浦螺丝刀就可以轻松地拆除底板。只有M.2固态硬盘和电池可以被维修。
配件和保修
某些捆绑产品包括可拆卸的KVM模块和一支有源手写笔。适用一年有限保修,但用户必须支付运费。
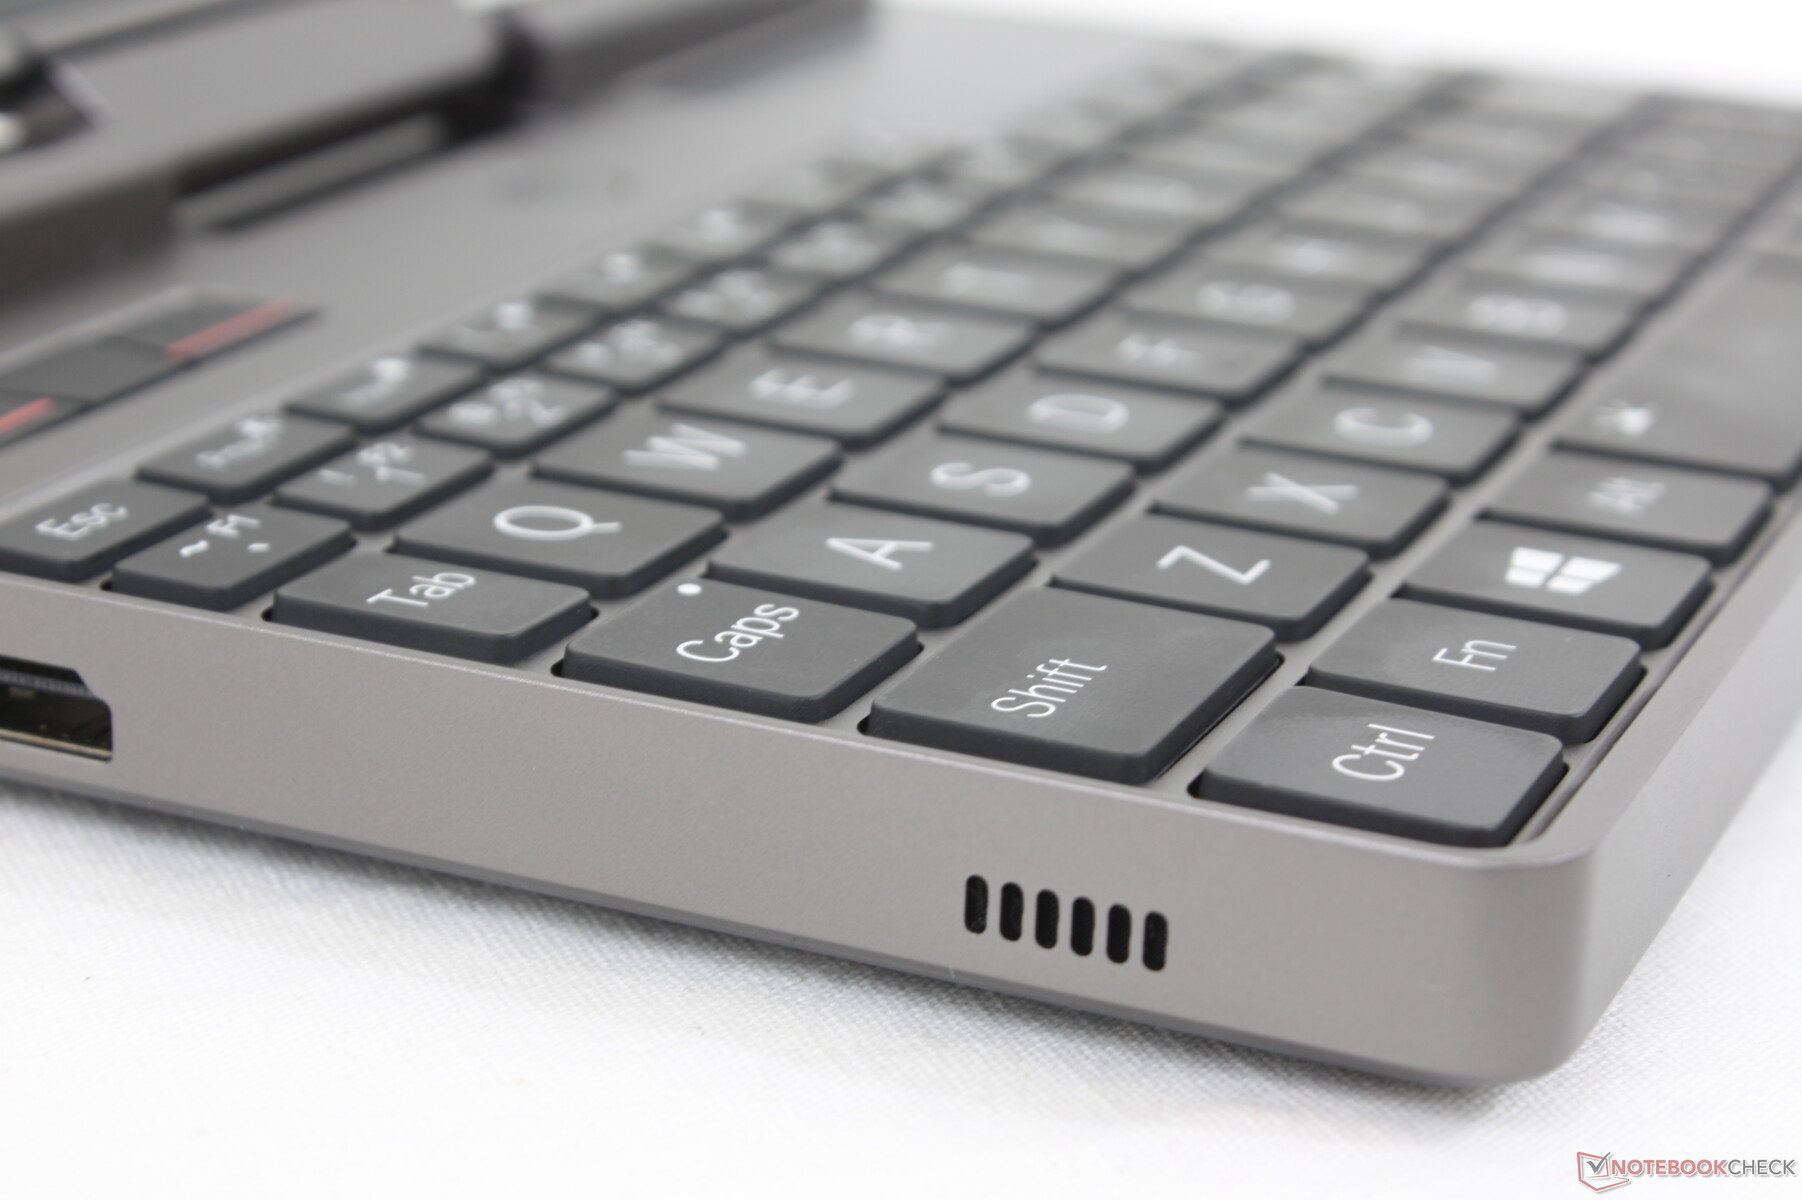
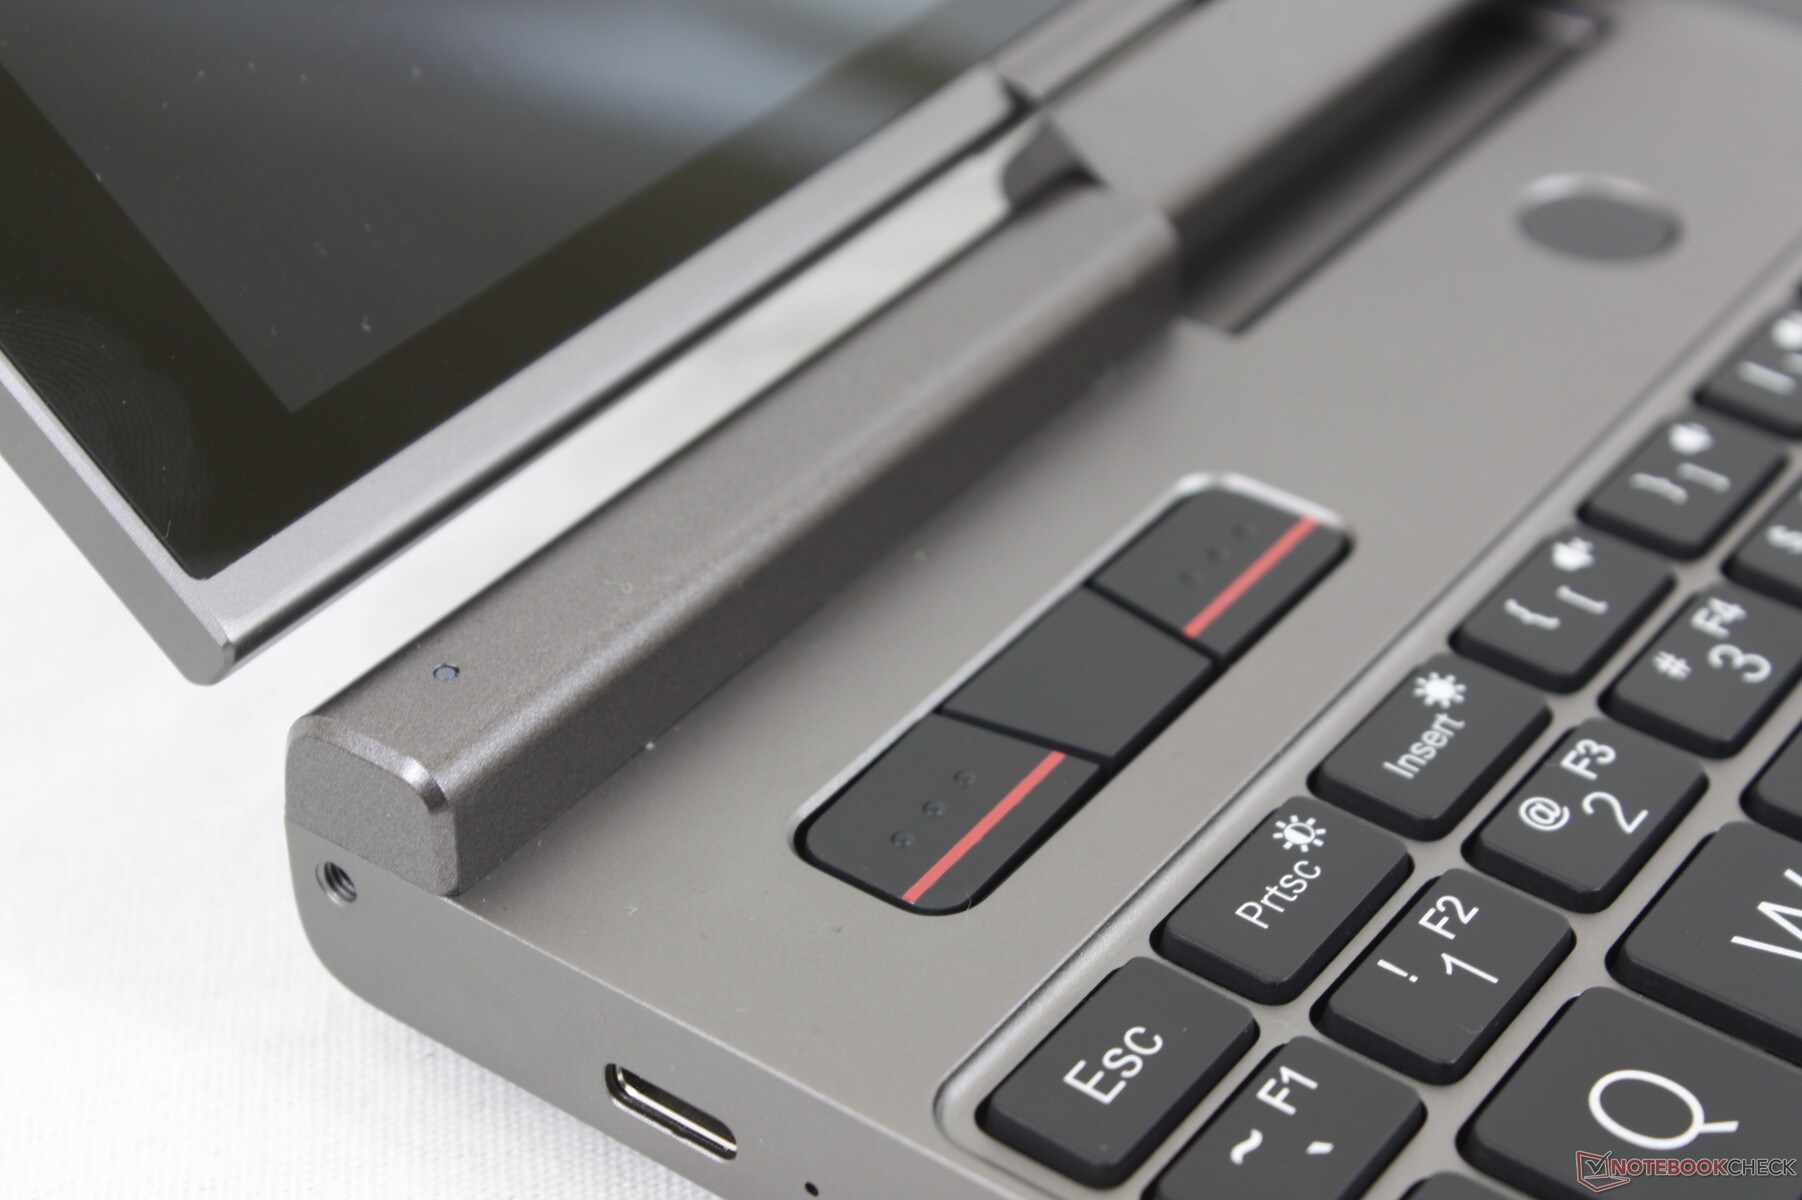
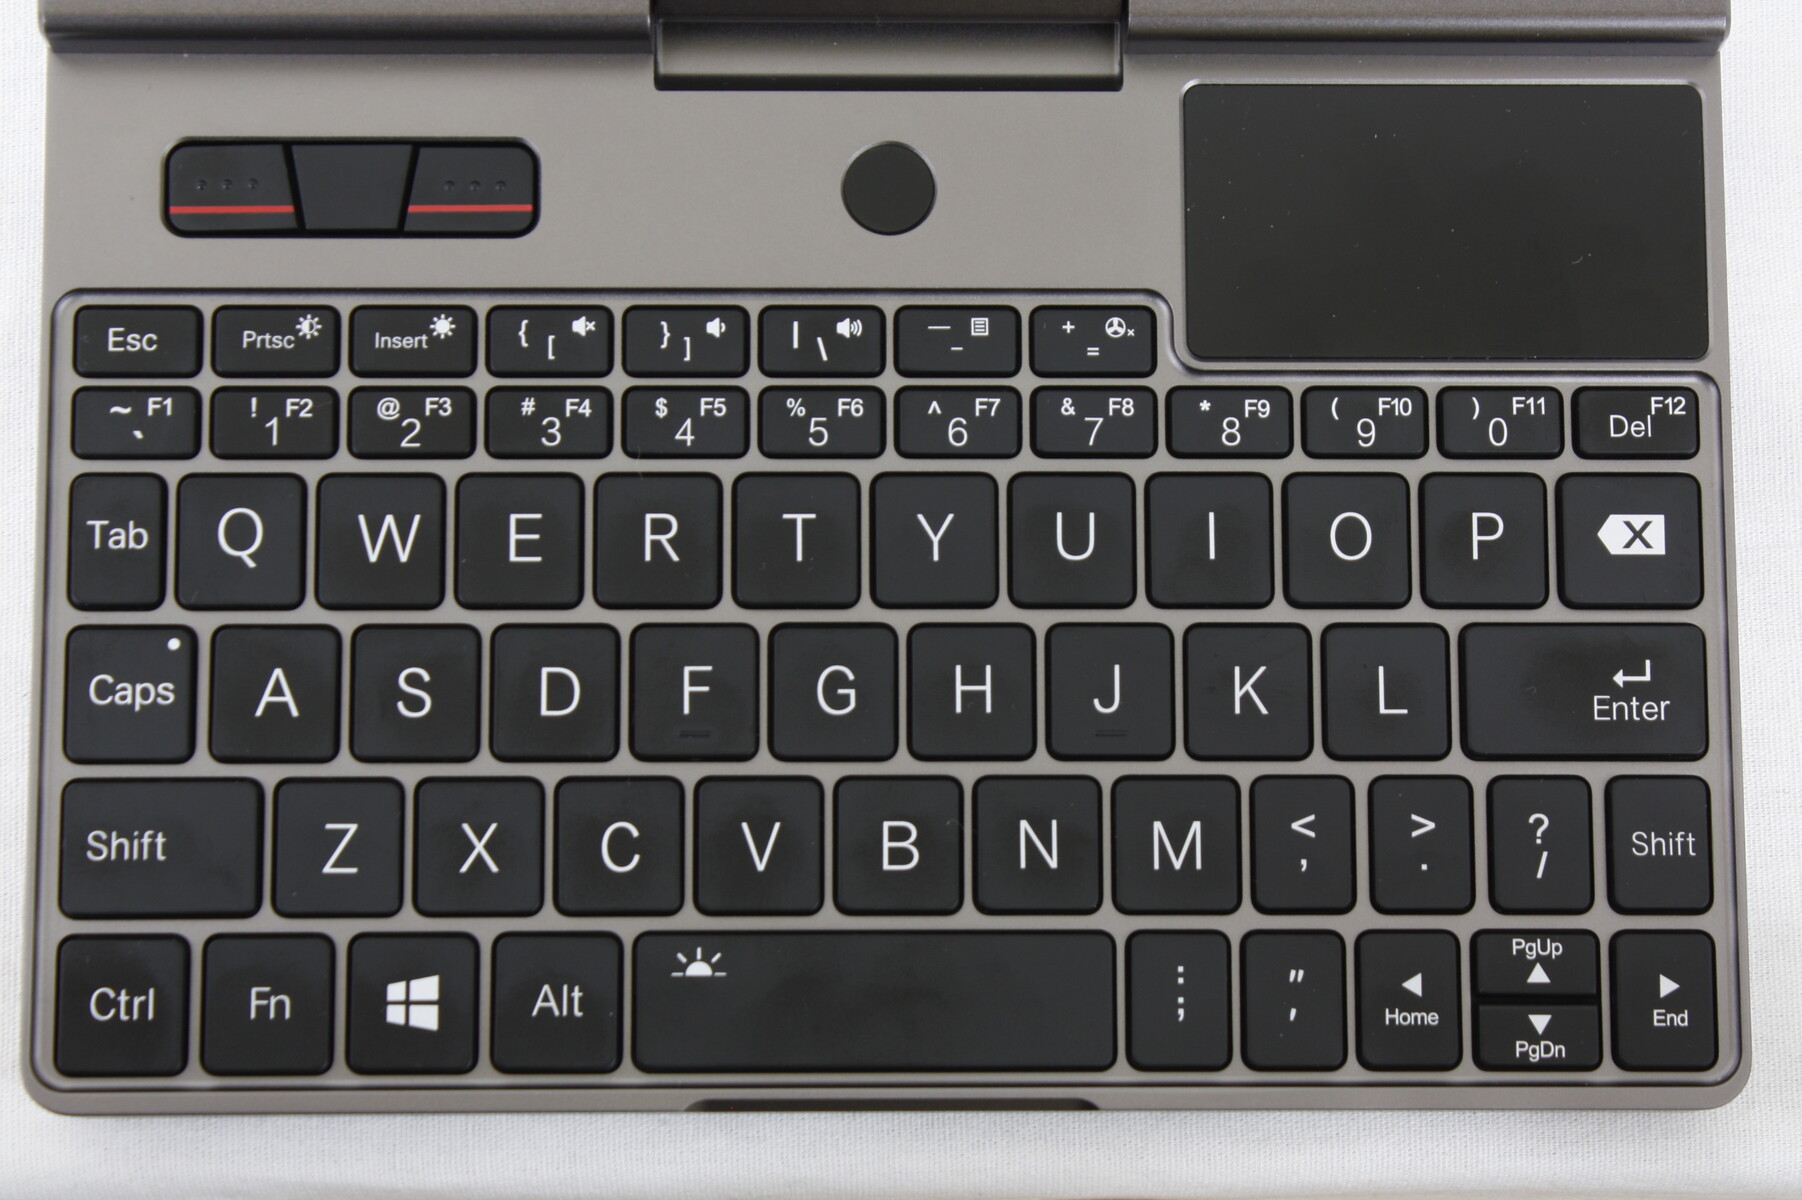
输入设备--对于尺寸来说,令人惊讶的好。
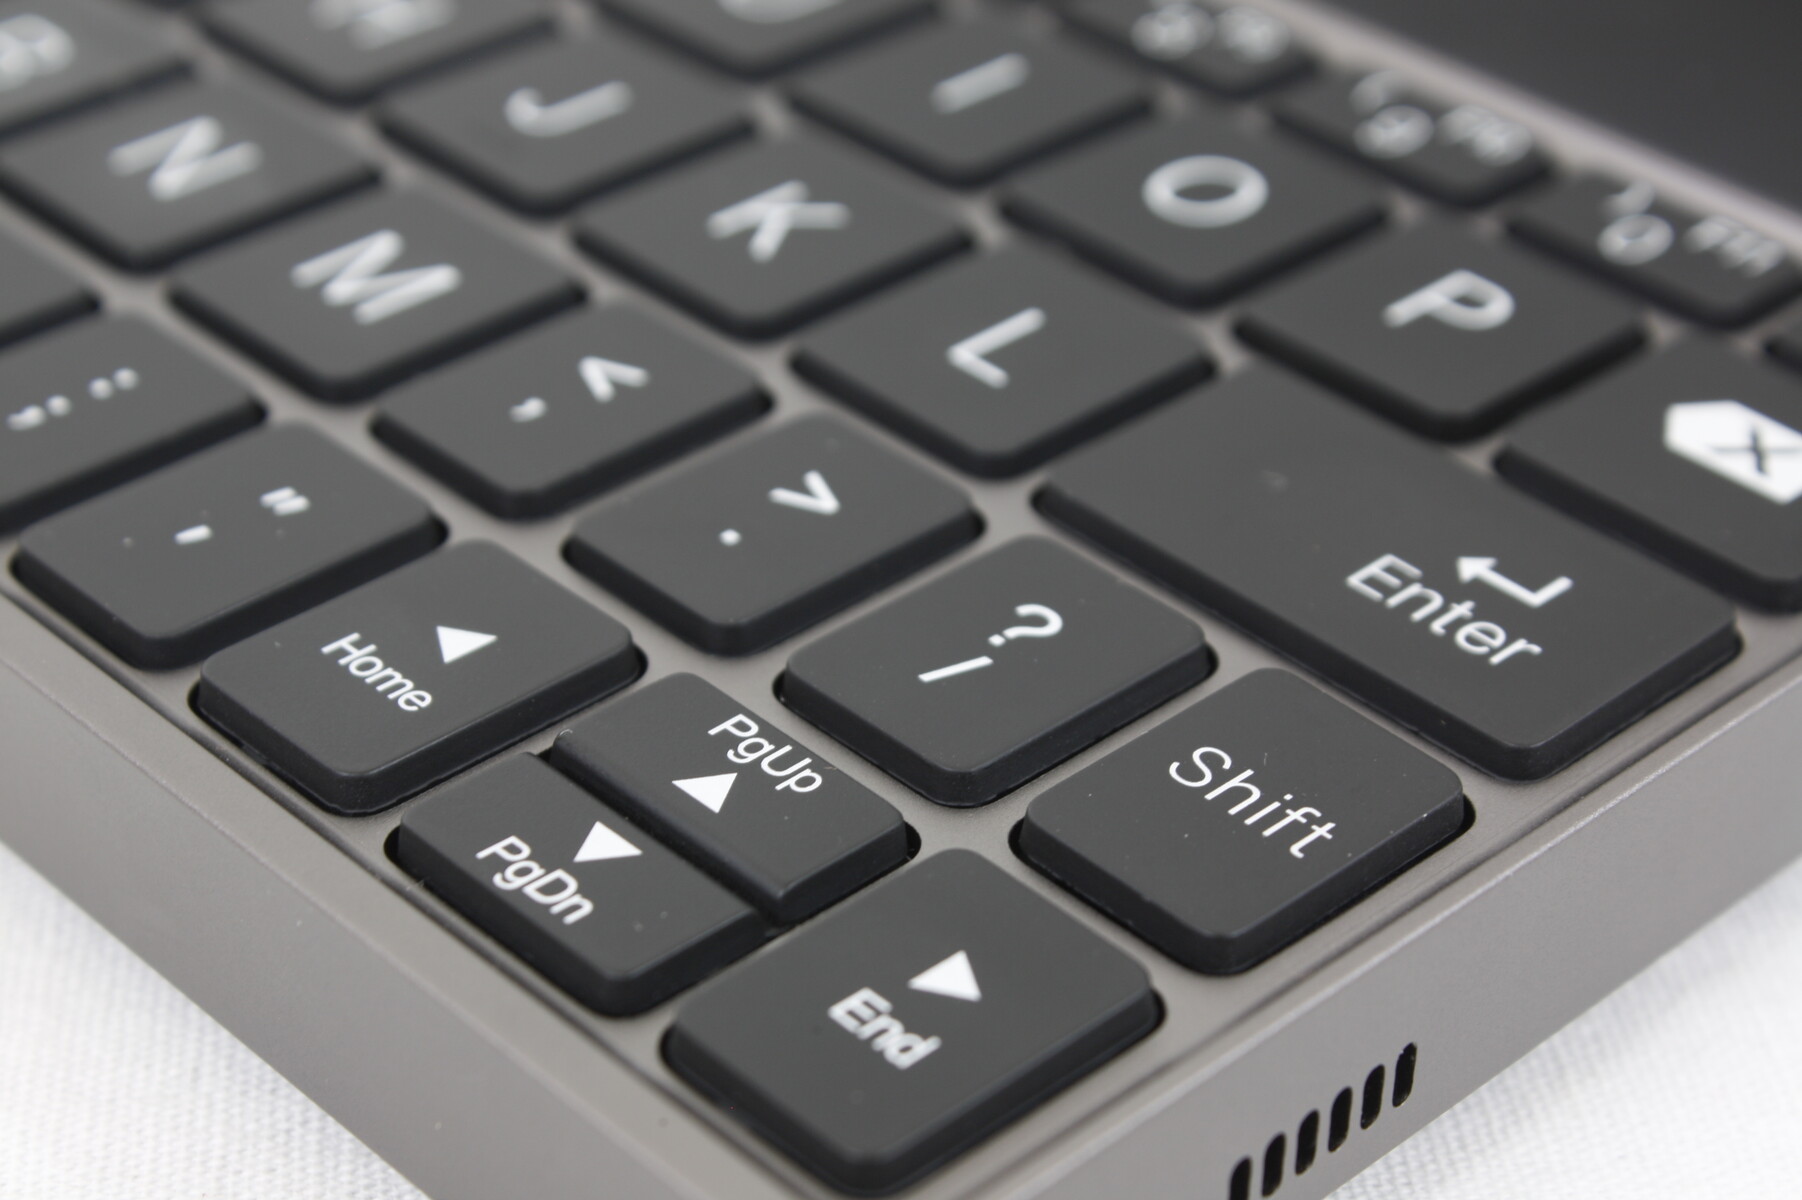
键盘
有趣的是,这些按键比Win Max上的按键略微点击和响亮,以获得相对更舒适的输入体验。用户将不得不习惯于不可避免的小面积。
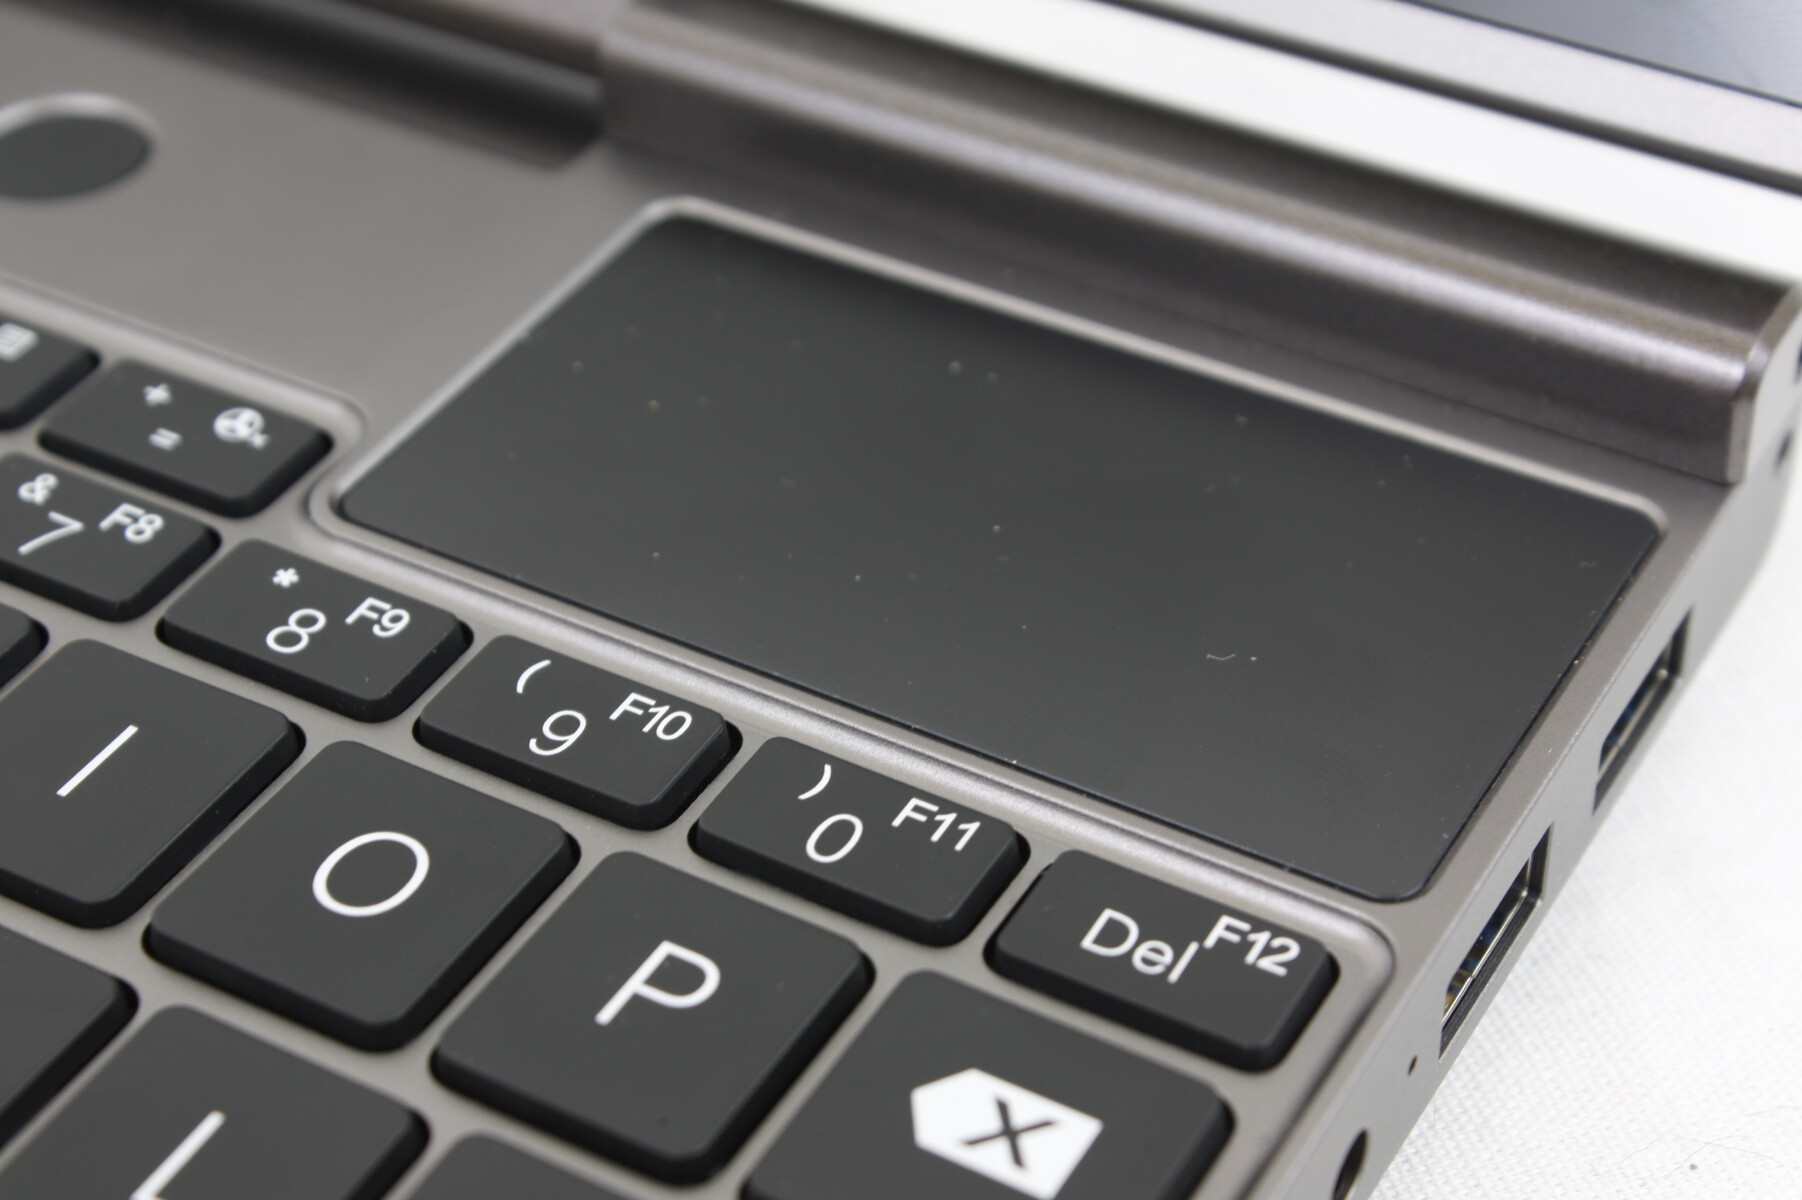
触摸板
小的触摸板(约6.3 x 3.3厘米)工作可靠,无论滑行速度如何,都没有跳跃或跳动。GPD表示,最终的零售单位将采用玻璃(磨砂石膏)触摸板,而不是我们预生产单位的磨砂塑料。同时,鼠标按键安静而牢固,按下时有适当的行程。

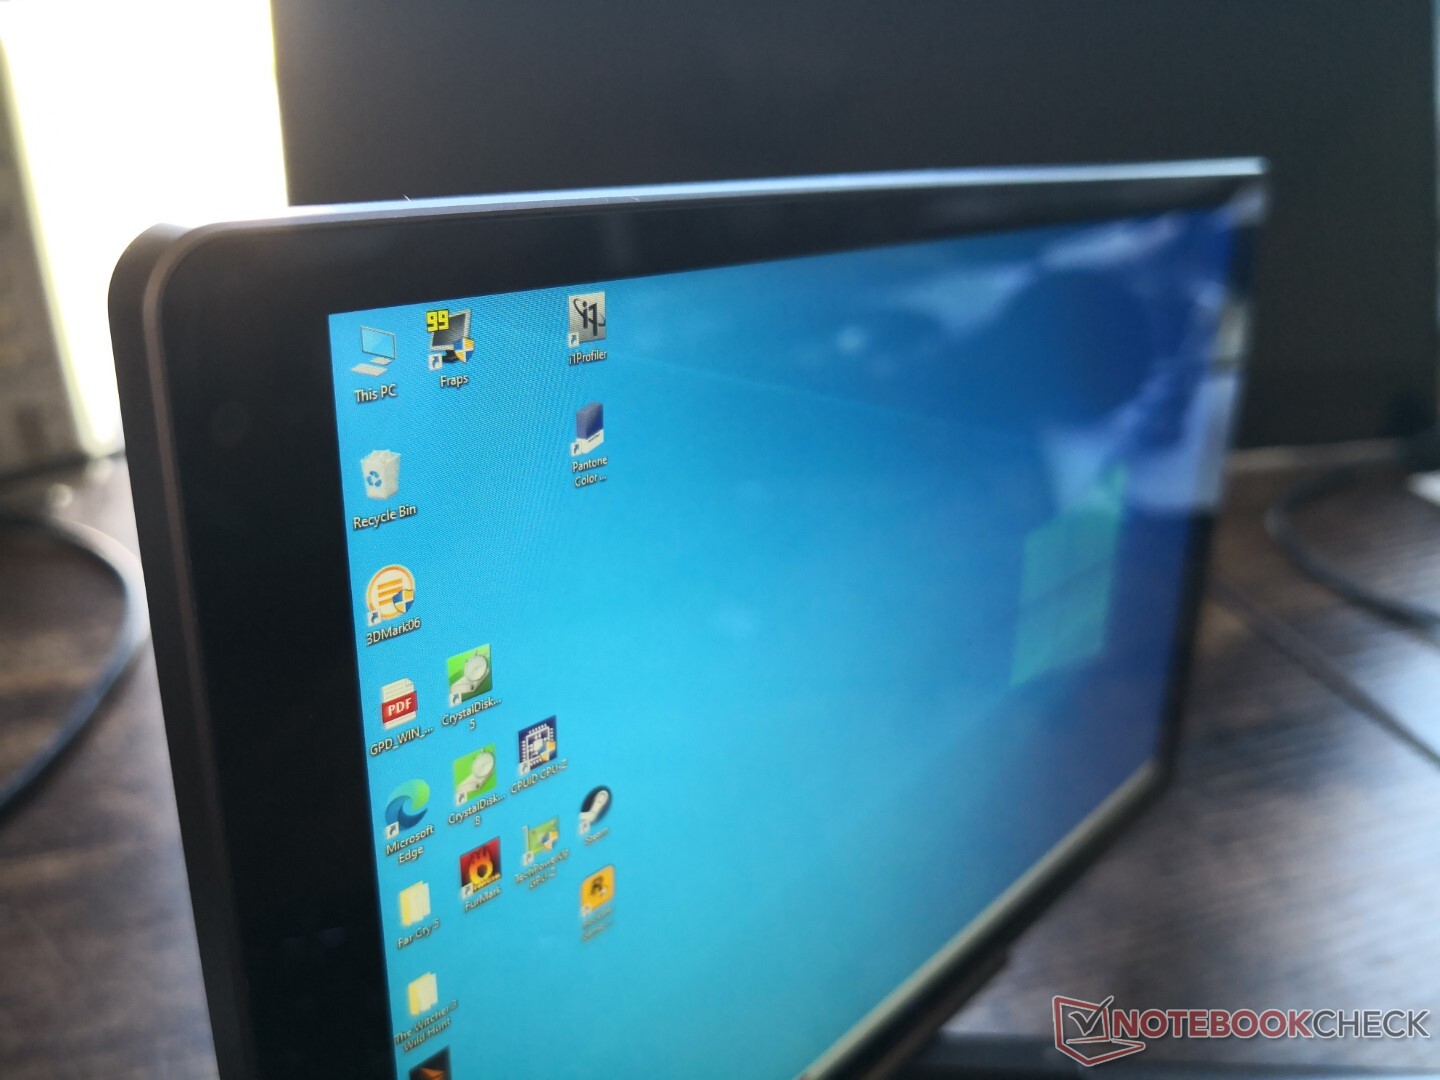
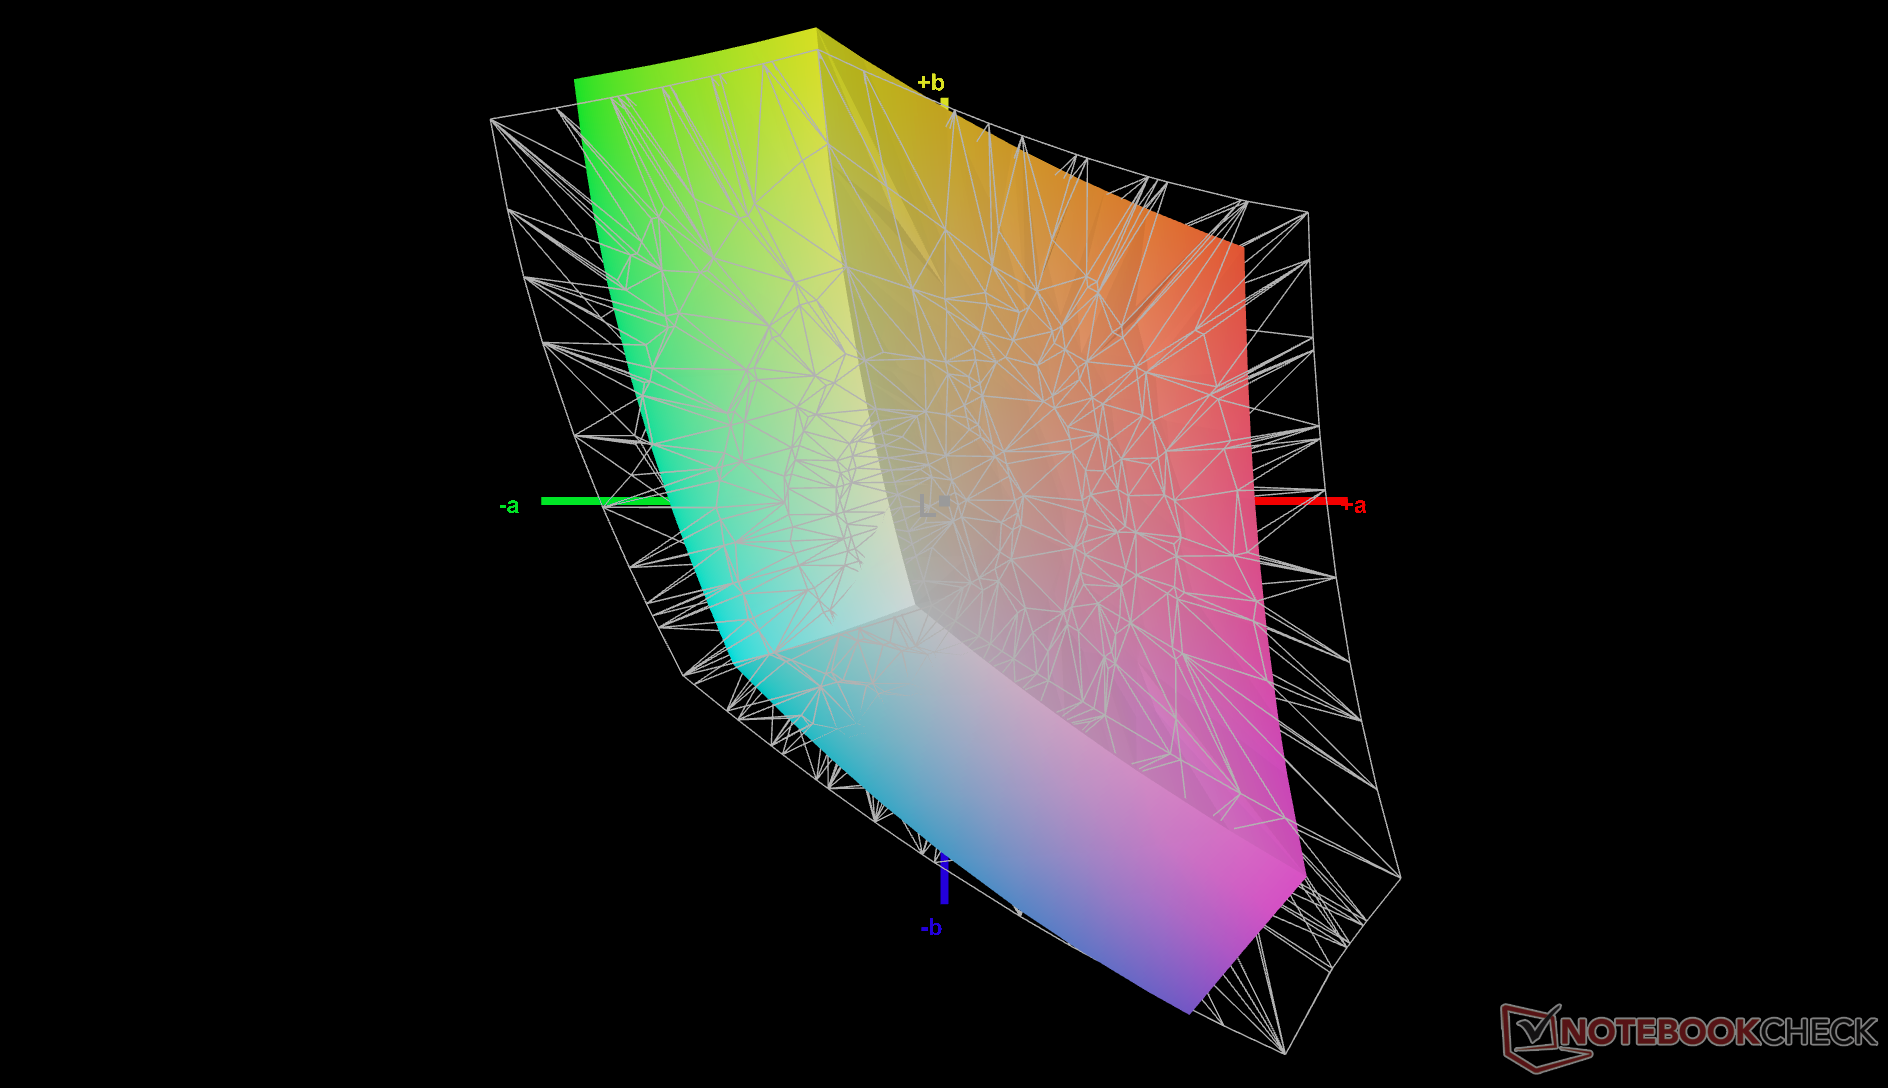
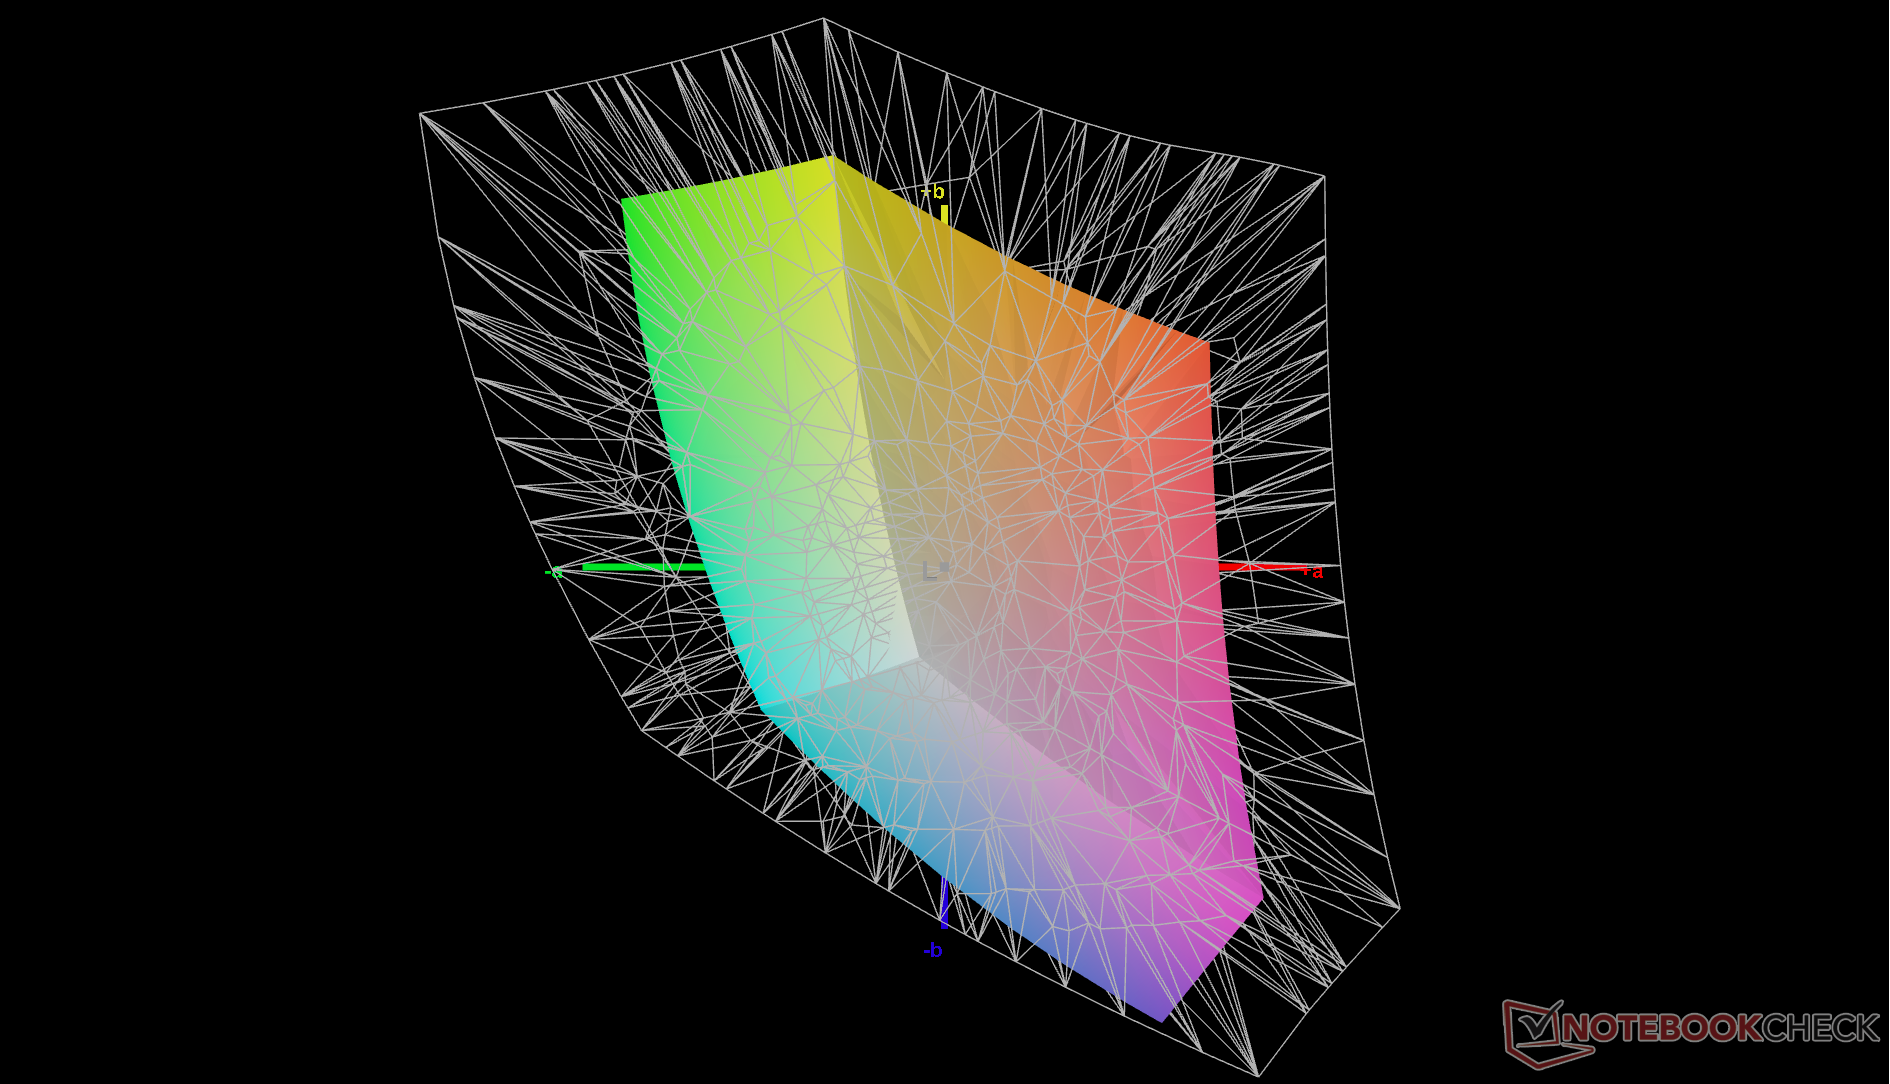
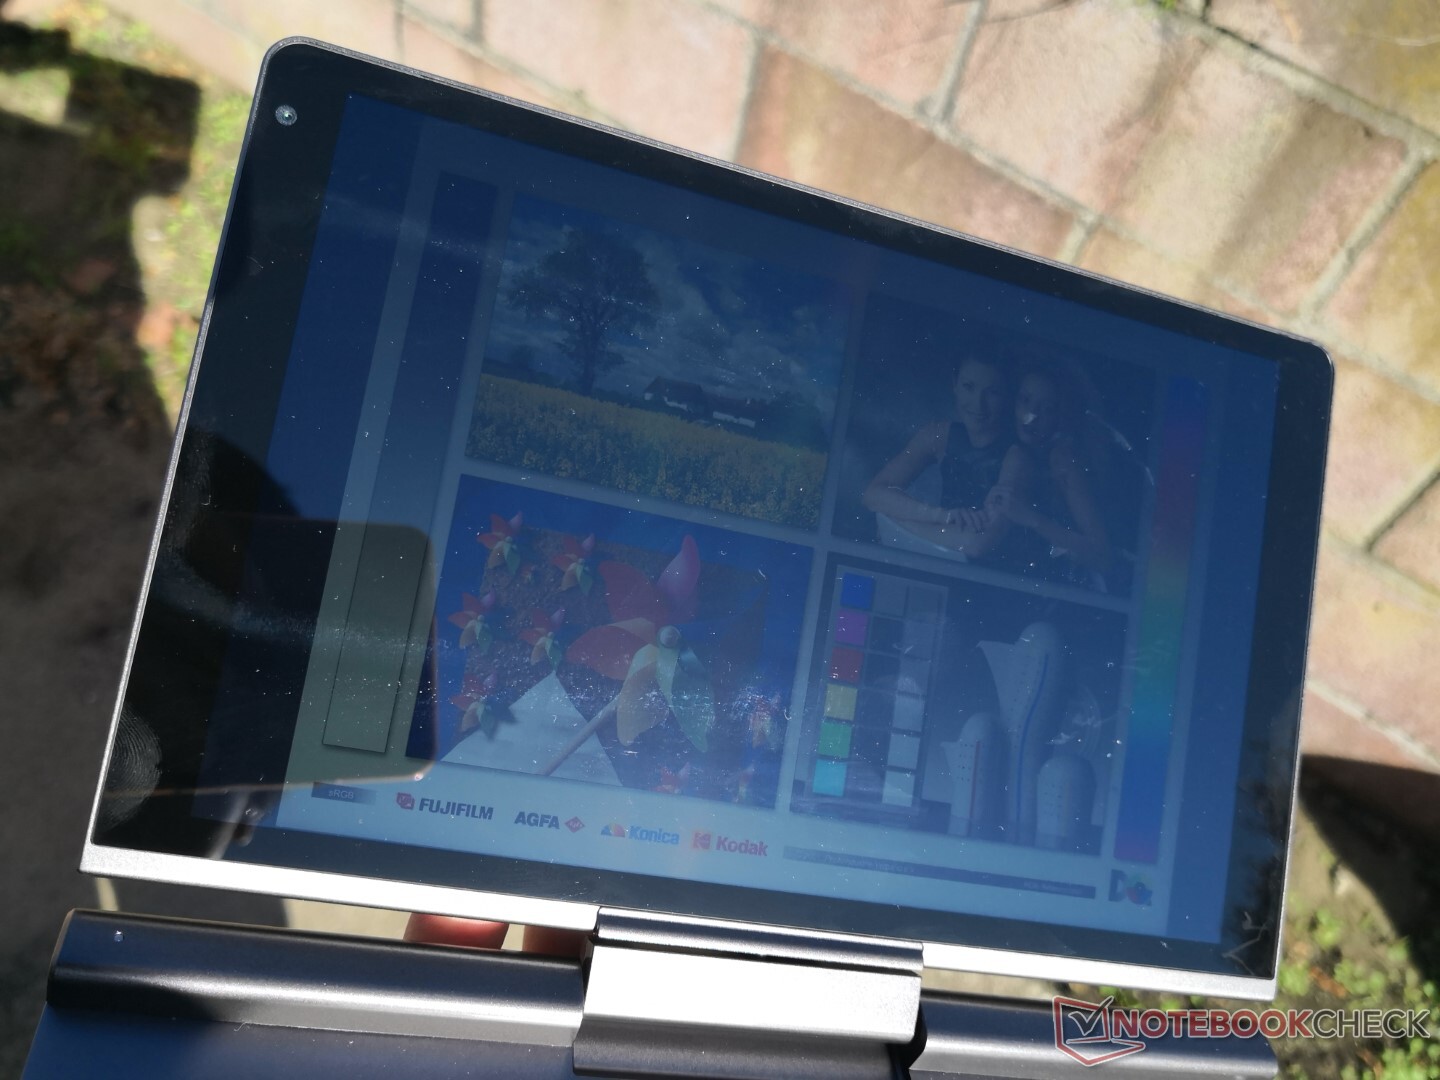
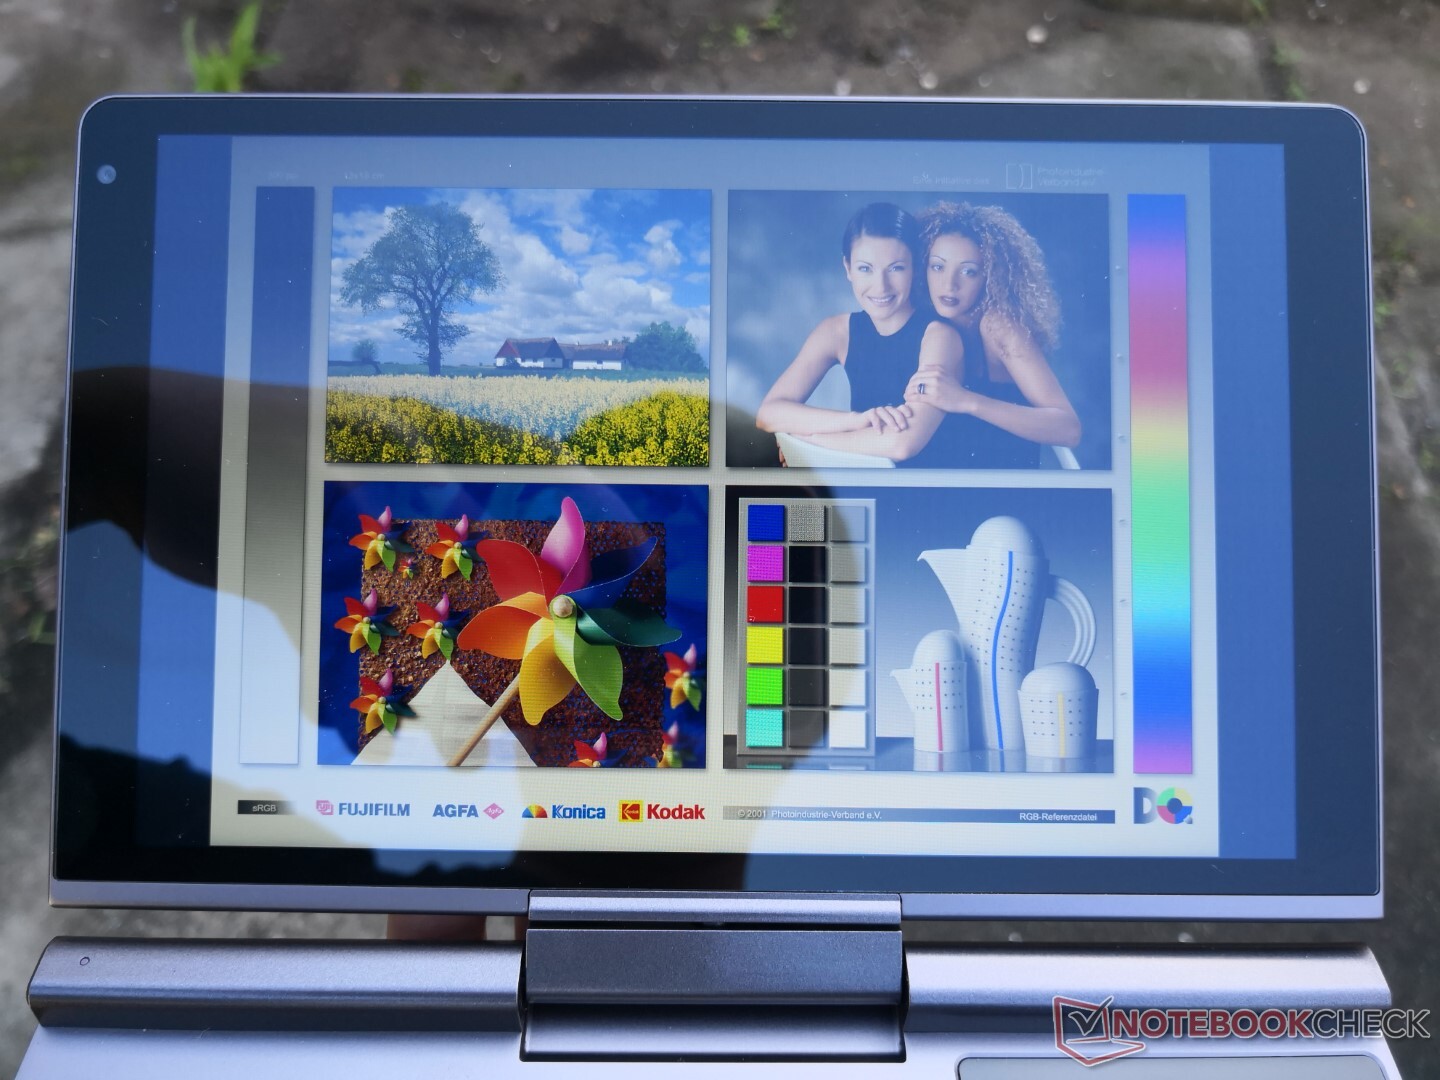
显示 - 清晰而多彩
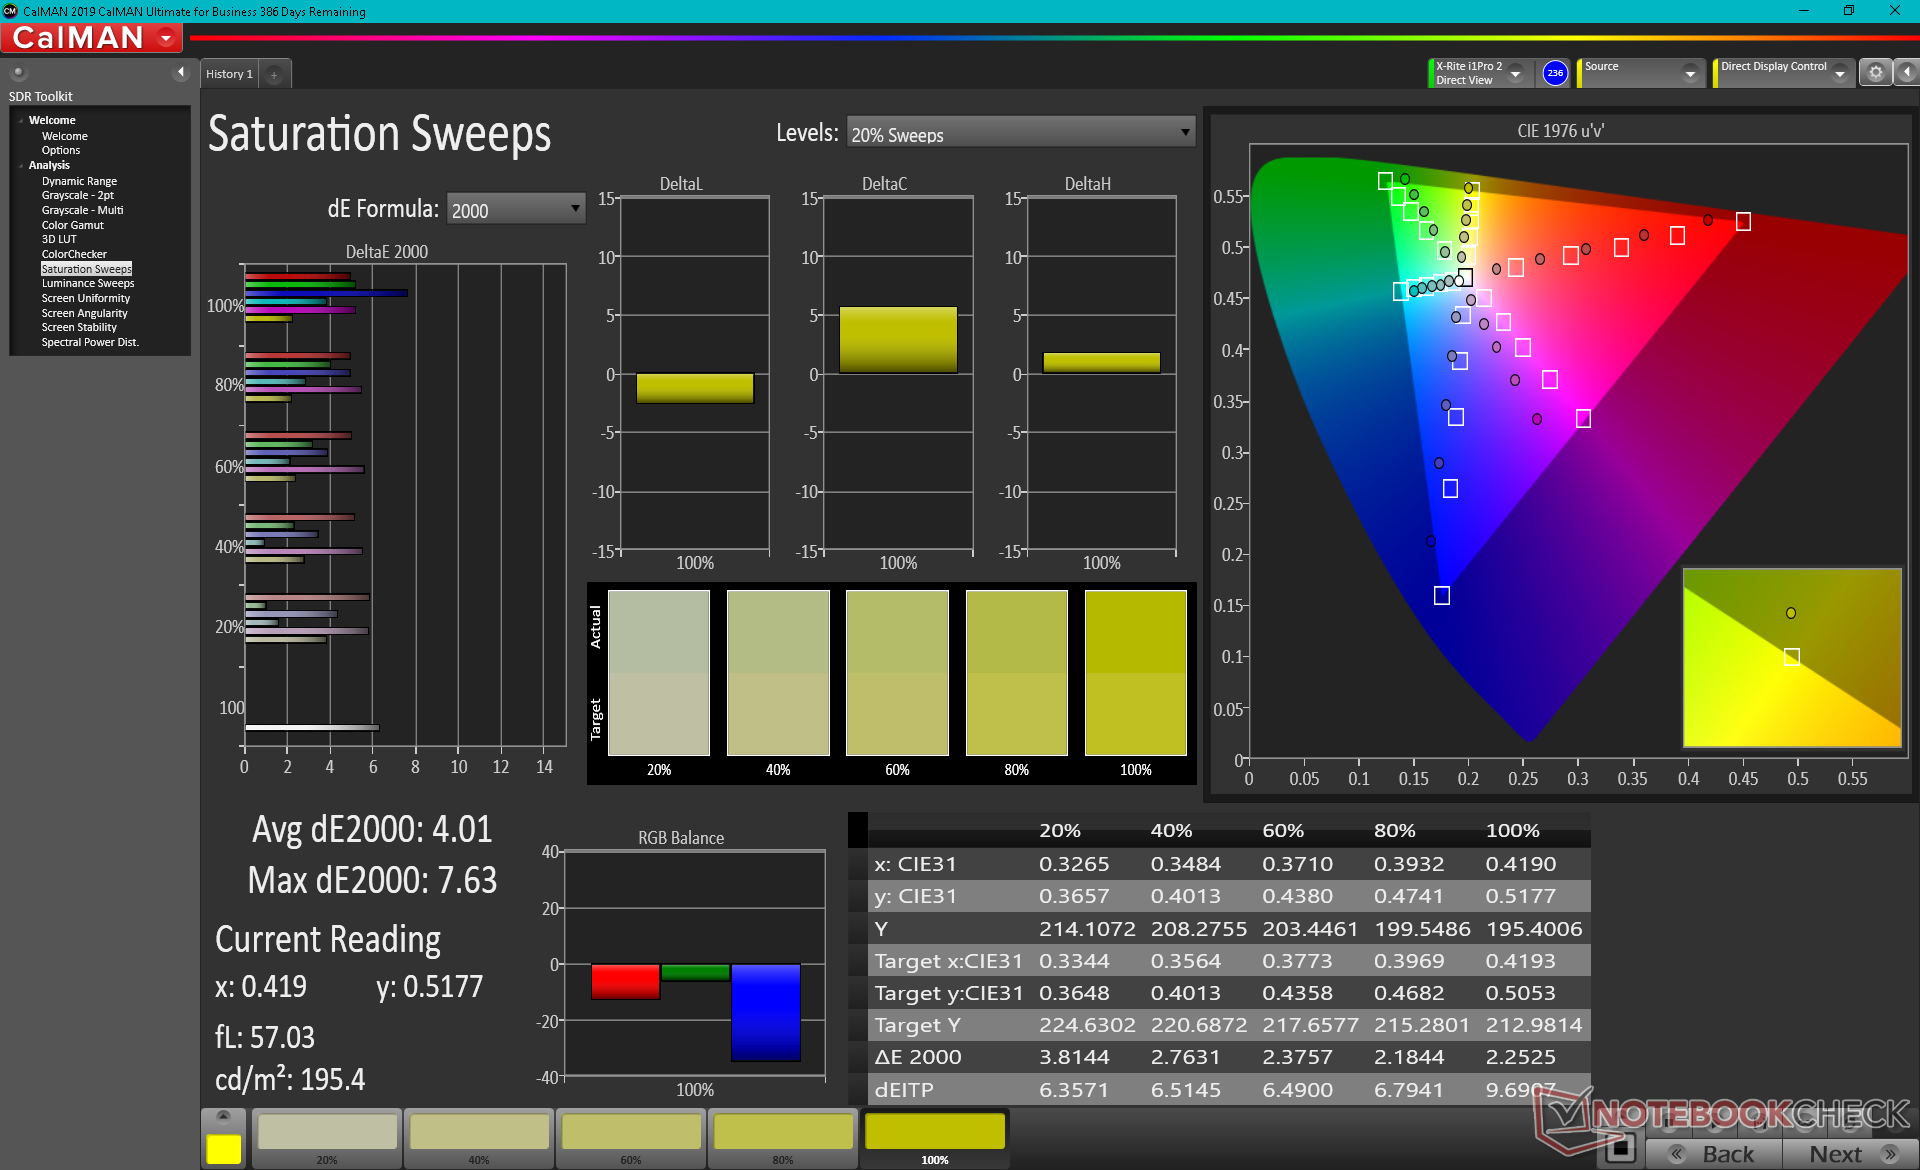
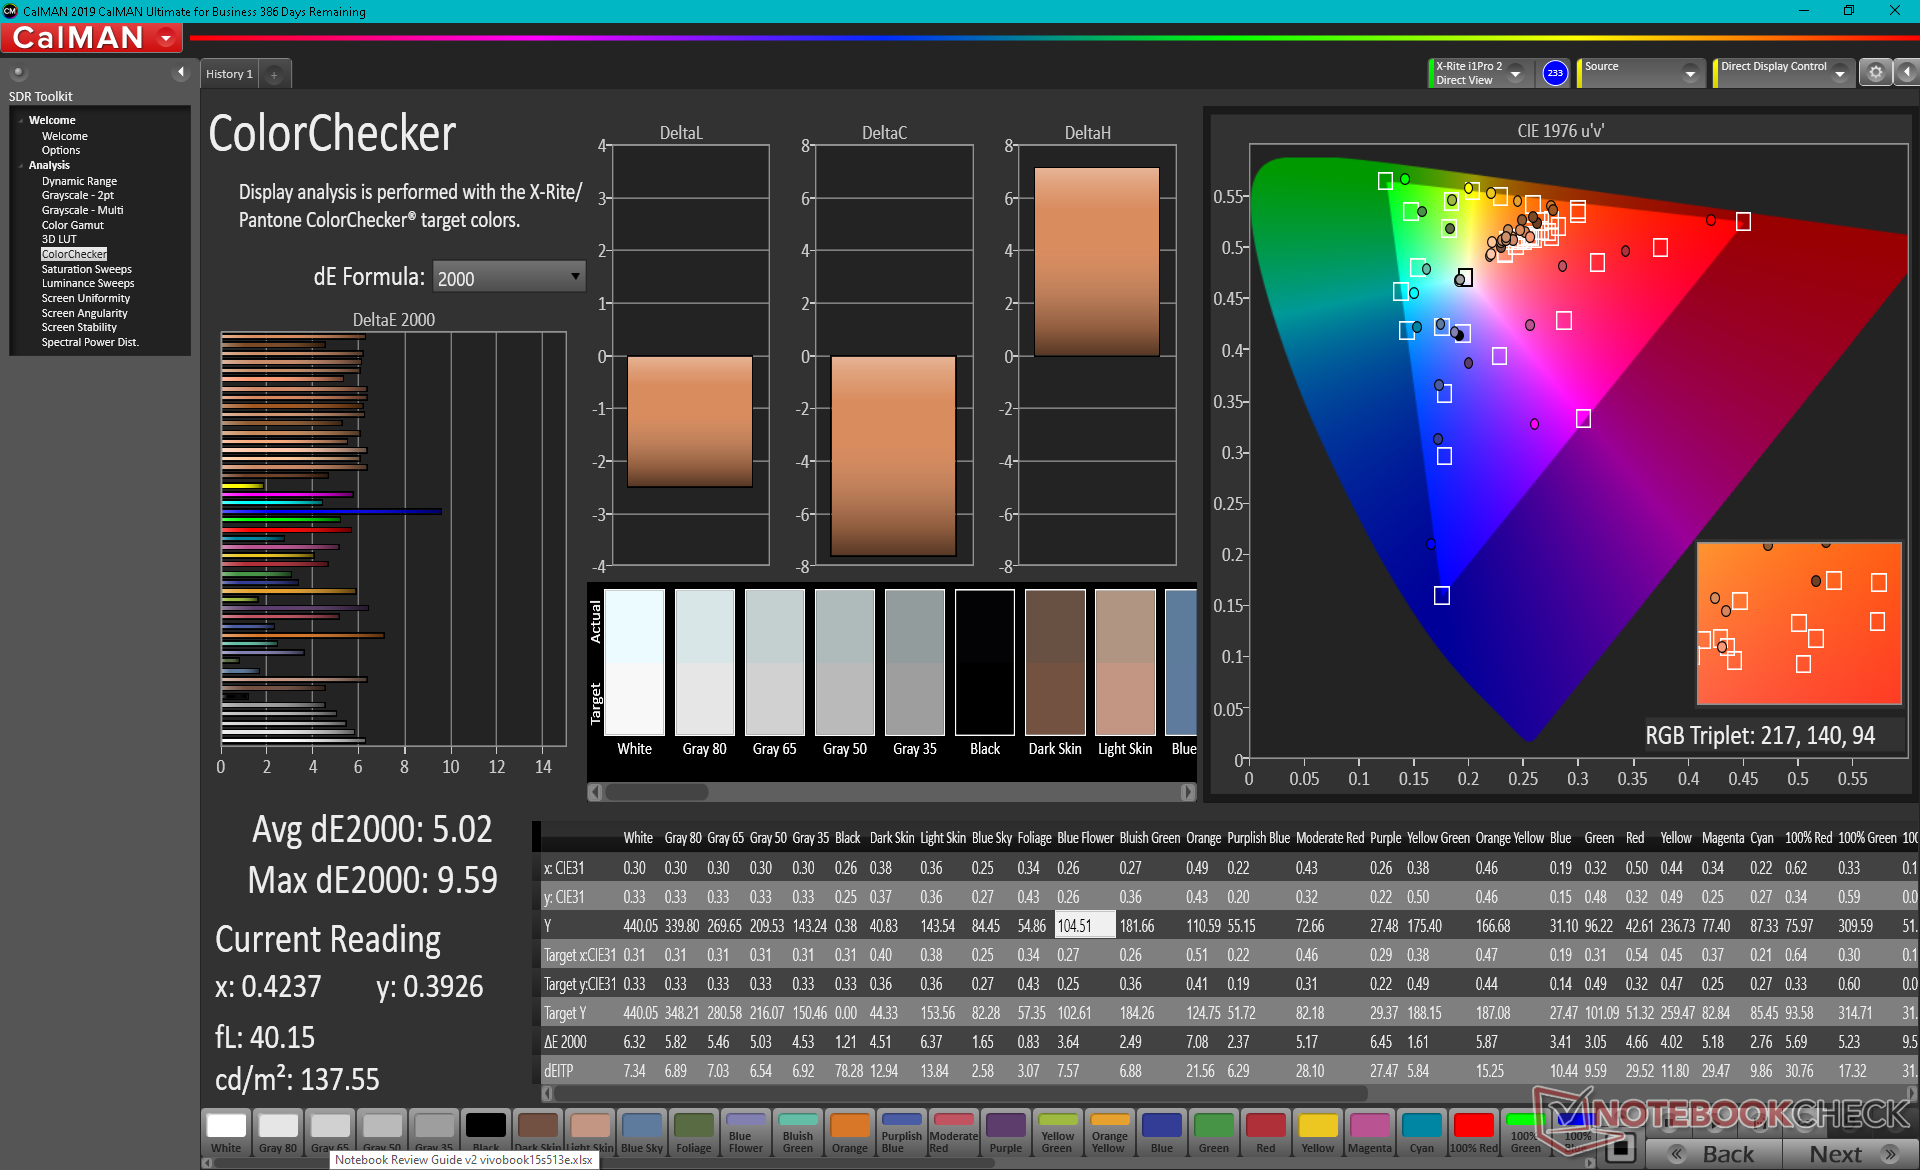
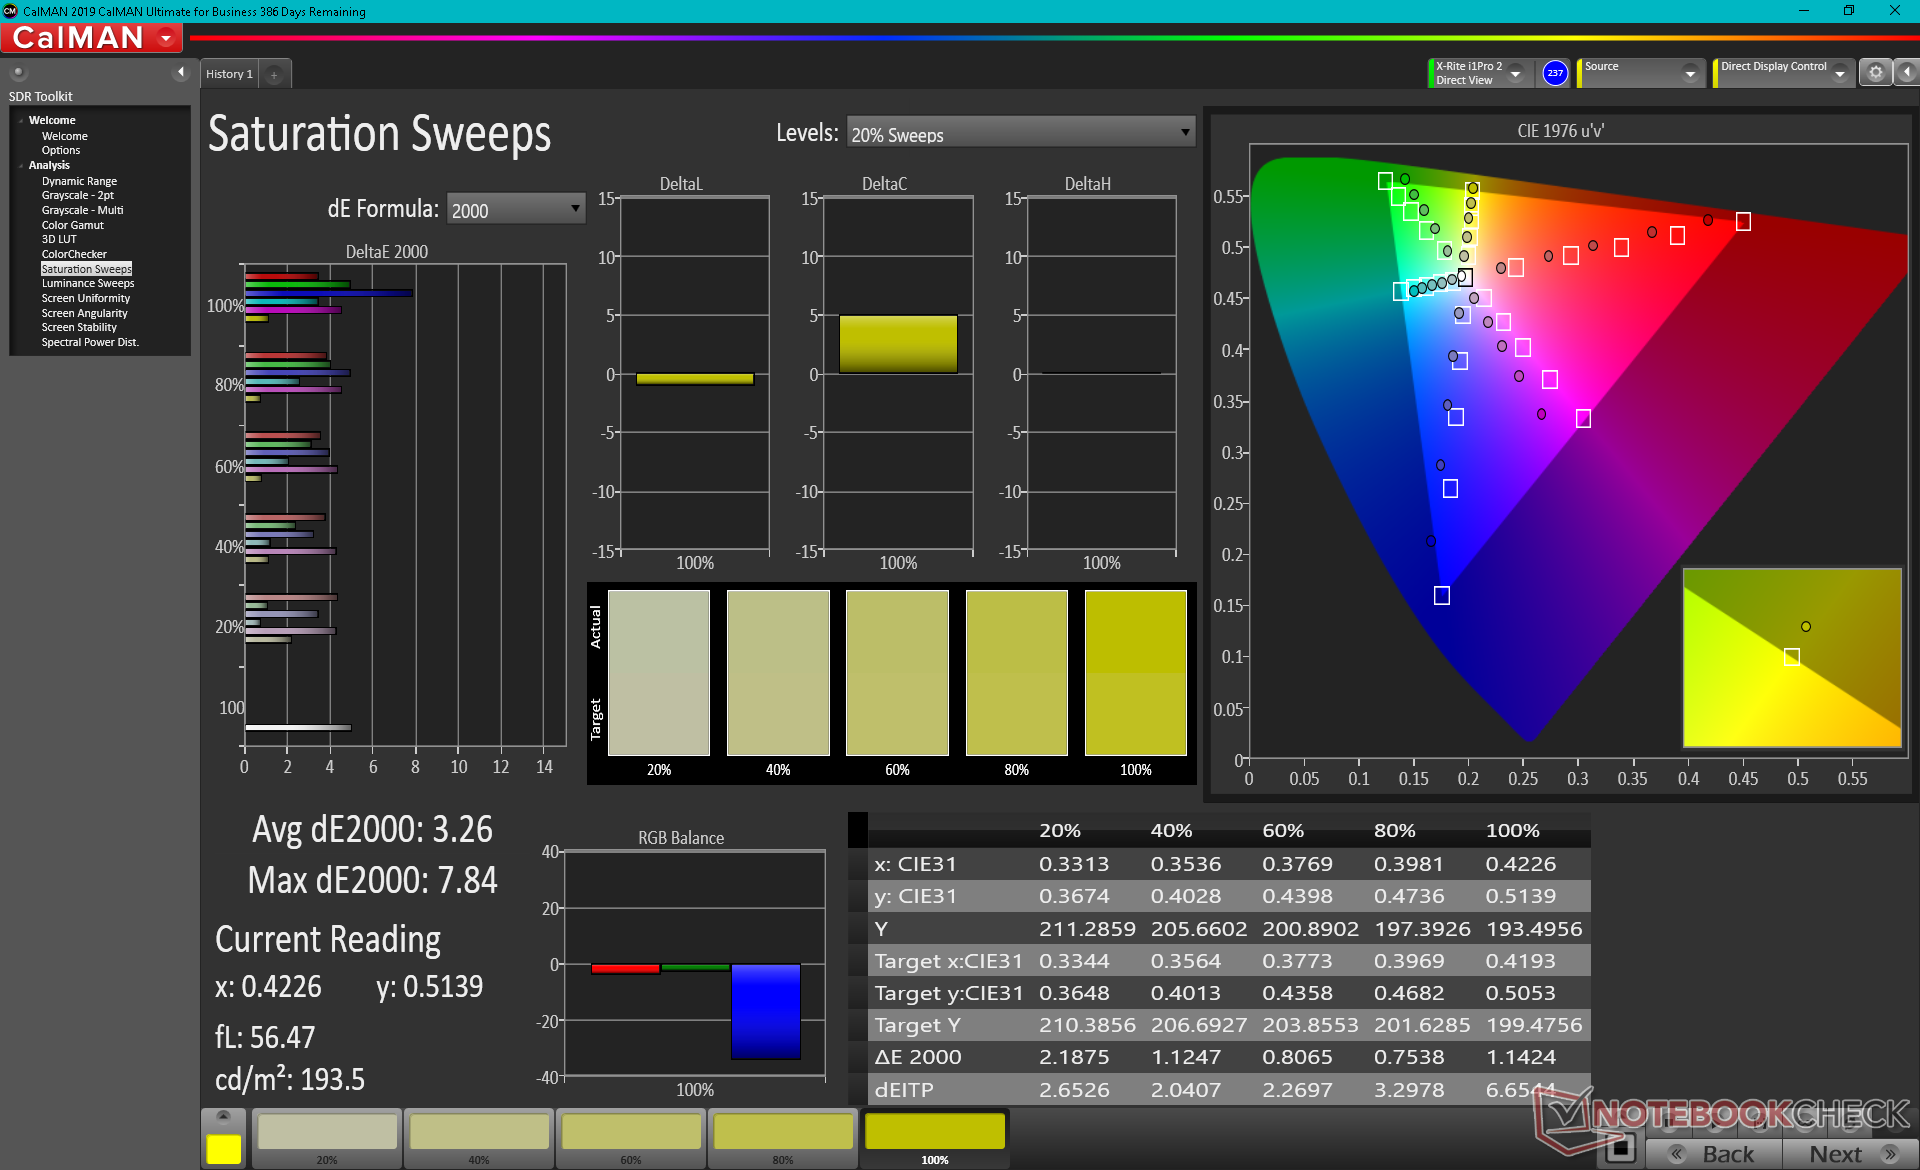
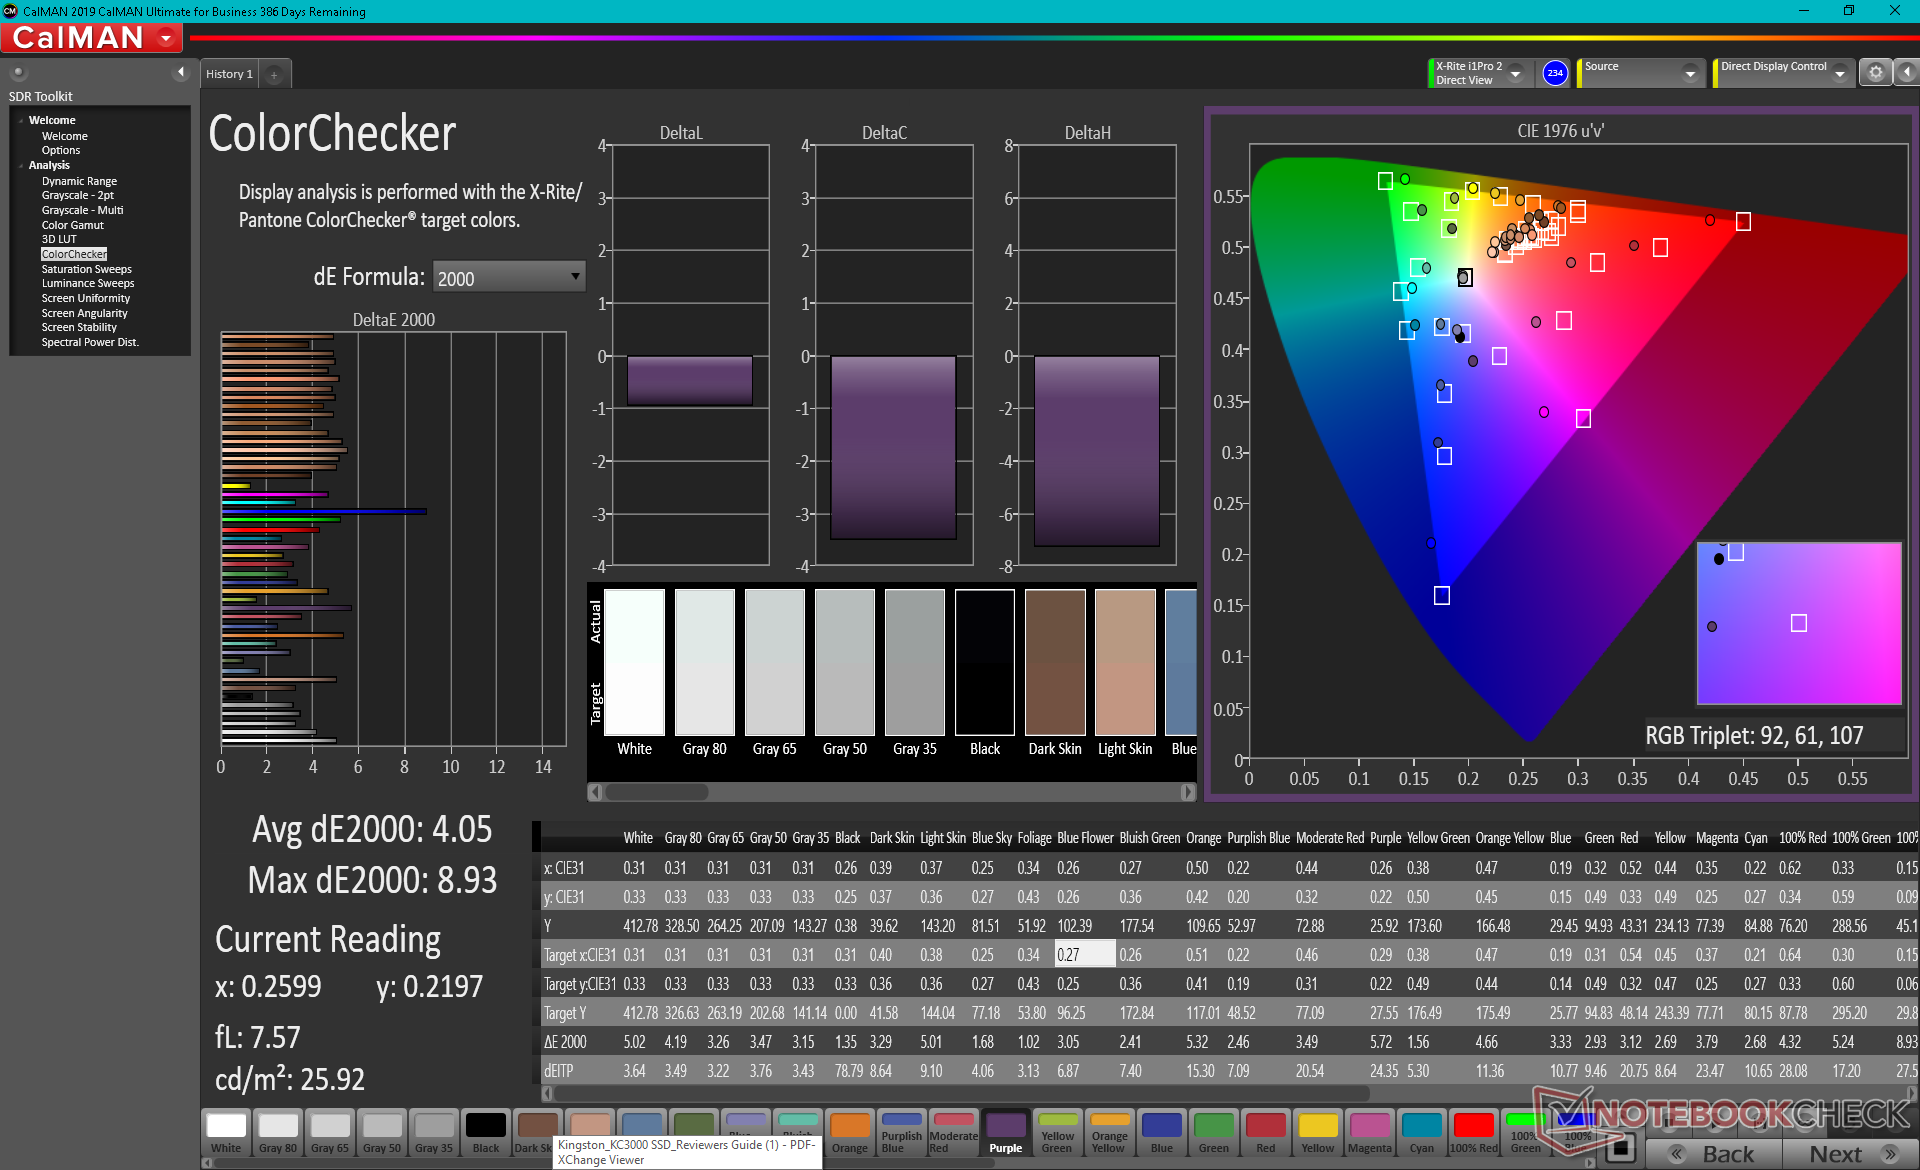
由于高PPI,8英寸1200p面板的显示质量很清晰。颜色和亮度介于Win Max和Win 3之间,对于办公室类型的工作和多媒体播放来说应该是绰绰有余。不幸的是,颜色覆盖面比许多中档超极本要窄,因为在中档超极本中,大于95%的sRGB已经成为标准。 因此,不建议使用内部显示屏进行任何严肃的图形编辑。


| |||||||||||||||||||||||||
Brightness Distribution: 92 %
Center on Battery: 438.4 cd/m²
Contrast: 1096:1 (Black: 0.4 cd/m²)
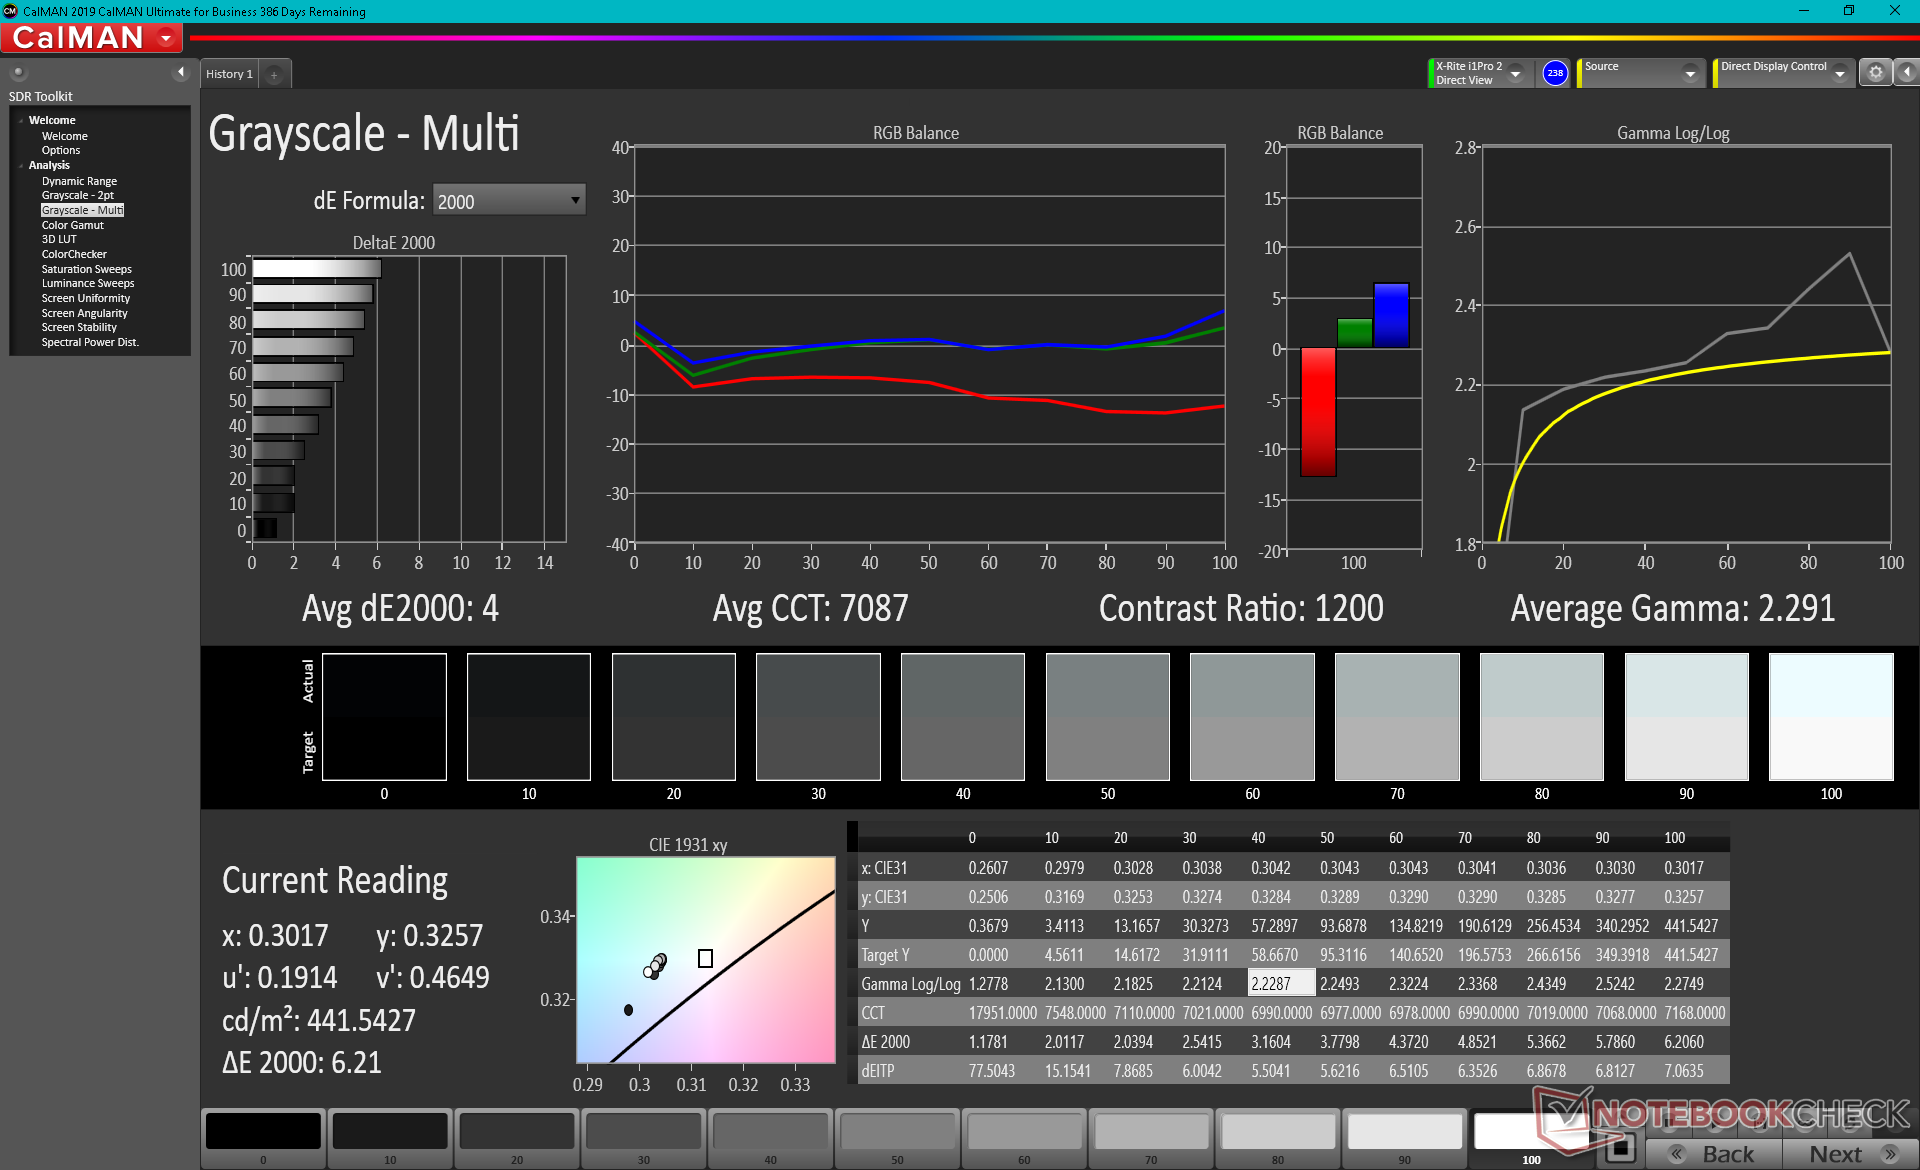
ΔE ColorChecker Calman: 5.02 | ∀{0.5-29.43 Ø4.73}
calibrated: 4.05
ΔE Greyscale Calman: 4 | ∀{0.09-98 Ø4.97}
52.8% AdobeRGB 1998 (Argyll 3D)
74.7% sRGB (Argyll 3D)
51.1% Display P3 (Argyll 3D)
Gamma: 2.29
CCT: 7087 K
| GPD Pocket 3 Digital Flat Panel, IPS, 1920x1200, 8" | GPD Win Max 2021 LT7911D, IPS, 1280x800, 8" | GPD Win 3 IPS, 1280x720, 5.5" | Lenovo ThinkPad X12 20UVS03G00 N123NCA-GS1, a-Si IPS LED, 1920x1280, 12.3" | Dell XPS 13 9310 2-in-1 Sharp LQ134N1, IPS, 1920x1200, 13.4" | HP Spectre x360 14t-ea000 LG Philips LGD0663, IPS, 1920x1280, 13.5" | |
|---|---|---|---|---|---|---|
| Display | -10% | 17% | 31% | 35% | 30% | |
| Display P3 Coverage (%) | 51.1 | 47.2 -8% | 59.5 16% | 67 31% | 69.7 36% | 65.8 29% |
| sRGB Coverage (%) | 74.7 | 65.2 -13% | 89.6 20% | 99.2 33% | 99 33% | 98.2 31% |
| AdobeRGB 1998 Coverage (%) | 52.8 | 47.6 -10% | 61.4 16% | 68.8 30% | 71.7 36% | 67.9 29% |
| Response Times | -37% | 5% | -43% | -39% | -47% | |
| Response Time Grey 50% / Grey 80% * (ms) | 37.2 ? | 56.8 ? -53% | 40 ? -8% | 63.2 ? -70% | 55.6 ? -49% | 62 ? -67% |
| Response Time Black / White * (ms) | 31.2 ? | 37.6 ? -21% | 25.6 ? 18% | 36 ? -15% | 40.4 ? -29% | 39.6 ? -27% |
| PWM Frequency (Hz) | 201.6 ? | 2500 ? | ||||
| Screen | -15% | -29% | 45% | 17% | 36% | |
| Brightness middle (cd/m²) | 438.4 | 374.6 -15% | 468.8 7% | 419 -4% | 555.7 27% | 443.5 1% |
| Brightness (cd/m²) | 421 | 361 -14% | 460 9% | 406 -4% | 528 25% | 394 -6% |
| Brightness Distribution (%) | 92 | 92 0% | 93 1% | 94 2% | 90 -2% | 78 -15% |
| Black Level * (cd/m²) | 0.4 | 0.45 -13% | 0.45 -13% | 0.23 43% | 0.35 13% | 0.17 57% |
| Contrast (:1) | 1096 | 832 -24% | 1042 -5% | 1822 66% | 1588 45% | 2609 138% |
| Colorchecker dE 2000 * | 5.02 | 6.21 -24% | 9 -79% | 1.1 78% | 4.83 4% | 2.7 46% |
| Colorchecker dE 2000 max. * | 9.59 | 9.89 -3% | 15.5 -62% | 2.2 77% | 8.46 12% | 4.36 55% |
| Colorchecker dE 2000 calibrated * | 4.05 | 5.4 -33% | 1.91 53% | 0.5 88% | 0.76 81% | 2.61 36% |
| Greyscale dE 2000 * | 4 | 4.5 -13% | 10.9 -173% | 1.5 62% | 6.1 -53% | 3.4 15% |
| Gamma | 2.29 96% | 2.49 88% | 2.13 103% | 2.06 107% | 1.98 111% | 2.09 105% |
| CCT | 7087 92% | 6726 97% | 10972 59% | 6524 100% | 6686 97% | 6144 106% |
| Color Space (Percent of AdobeRGB 1998) (%) | 56.6 | 62.8 | 62.1 | |||
| Color Space (Percent of sRGB) (%) | 89.2 | 99.2 | 98.5 | |||
| Total Average (Program / Settings) | -21% /
-17% | -2% /
-14% | 11% /
30% | 4% /
13% | 6% /
23% |
* ... smaller is better
默认色温偏冷,色调略微偏蓝。其他方面的颜色校准得很好,在我们的校准工作前后没有大的差异。

Display Response Times
| ↔ Response Time Black to White | ||
|---|---|---|
| 31.2 ms ... rise ↗ and fall ↘ combined | ↗ 17.2 ms rise | 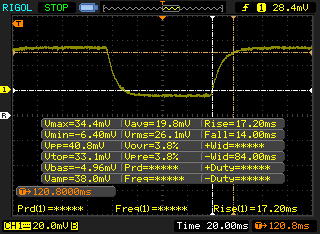 |
| ↘ 14 ms fall | ||
| The screen shows slow response rates in our tests and will be unsatisfactory for gamers. In comparison, all tested devices range from 0.1 (minimum) to 240 (maximum) ms. » 84 % of all devices are better. This means that the measured response time is worse than the average of all tested devices (19.9 ms). | ||
| ↔ Response Time 50% Grey to 80% Grey | ||
| 37.2 ms ... rise ↗ and fall ↘ combined | ↗ 17.6 ms rise | 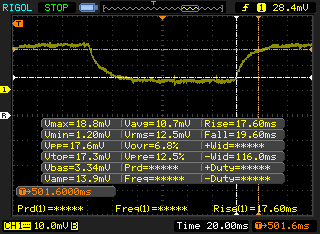 |
| ↘ 19.6 ms fall | ||
| The screen shows slow response rates in our tests and will be unsatisfactory for gamers. In comparison, all tested devices range from 0.165 (minimum) to 636 (maximum) ms. » 54 % of all devices are better. This means that the measured response time is worse than the average of all tested devices (31.1 ms). | ||
Screen Flickering / PWM (Pulse-Width Modulation)
| Screen flickering / PWM not detected | 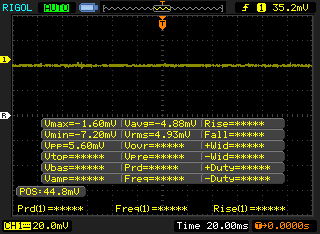 | ||
In comparison: 52 % of all tested devices do not use PWM to dim the display. If PWM was detected, an average of 7798 (minimum: 5 - maximum: 343500) Hz was measured. | |||
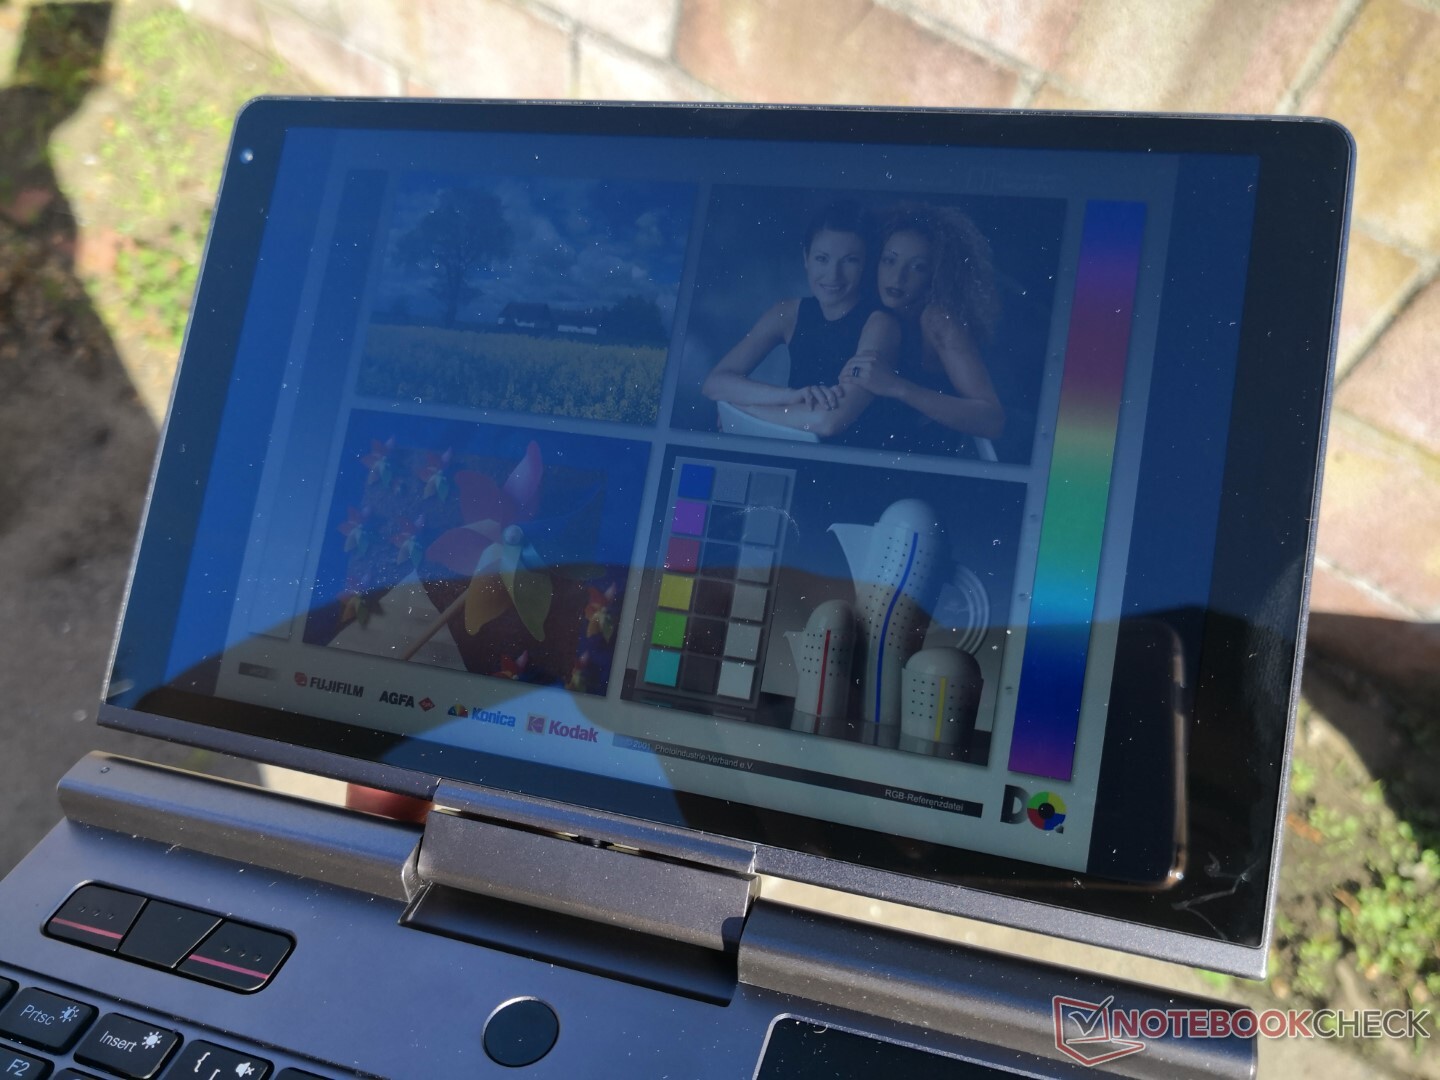
由于两台设备的对比度几乎相同,因此户外可视性与Win 3最为相似。眩光在光泽的触摸屏上基本上是不可避免的,因此用户会想增加字体的缩放比例,以便更容易阅读。如果在阳光直射下,颜色会被冲淡。

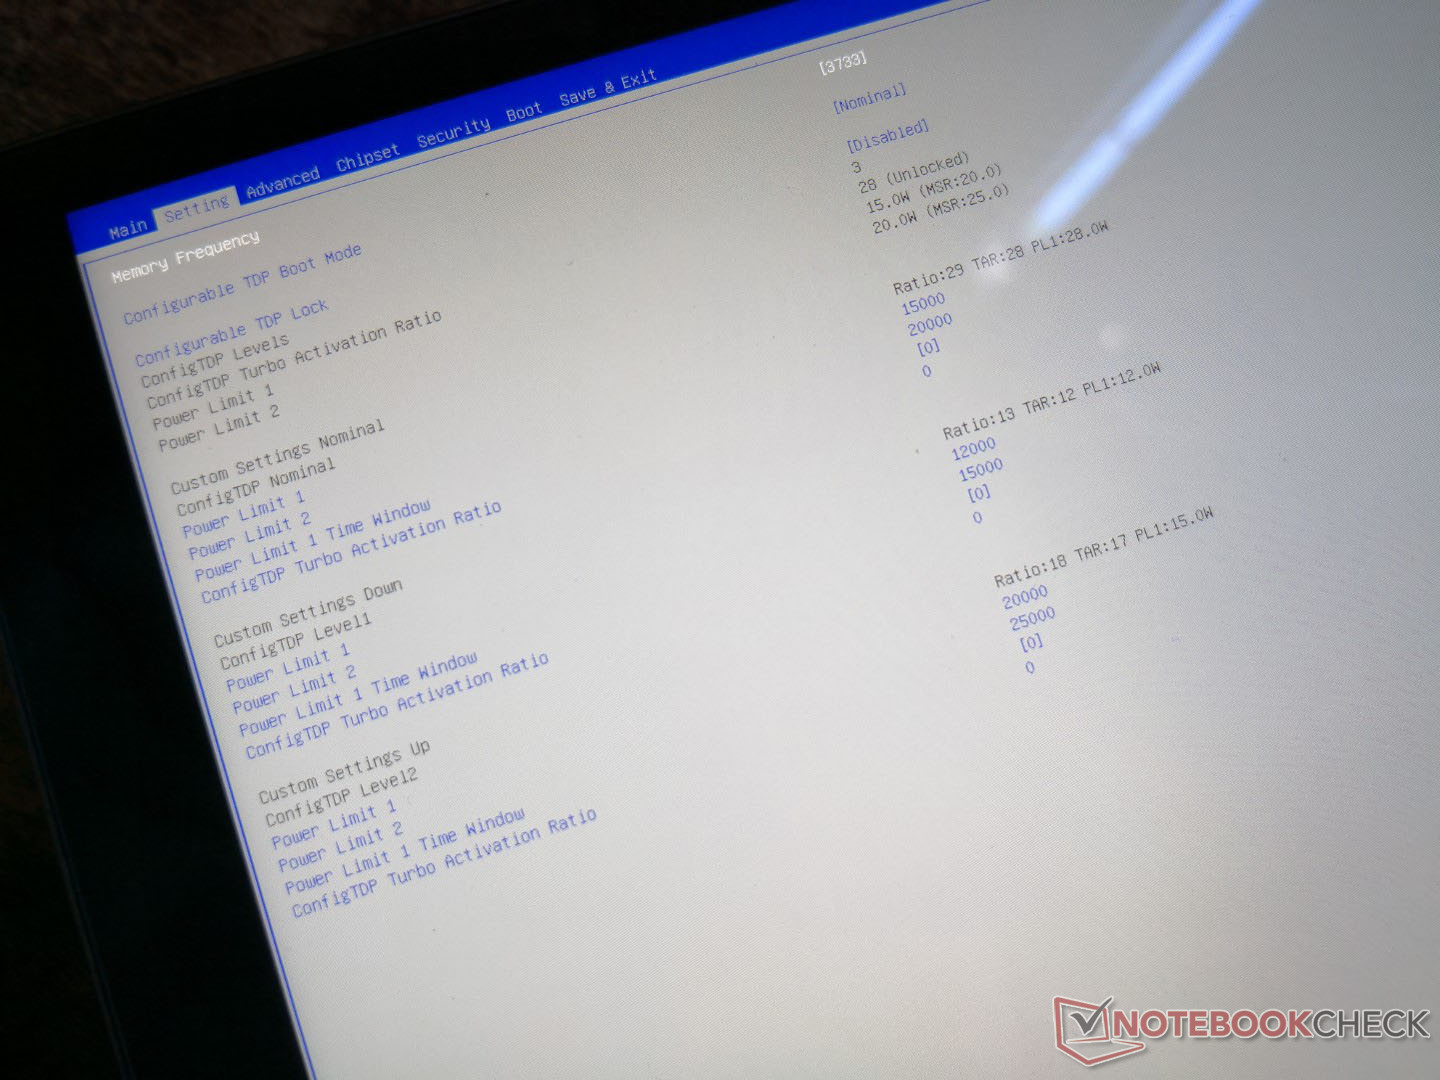
性能 - 高度依赖于BIOS设置
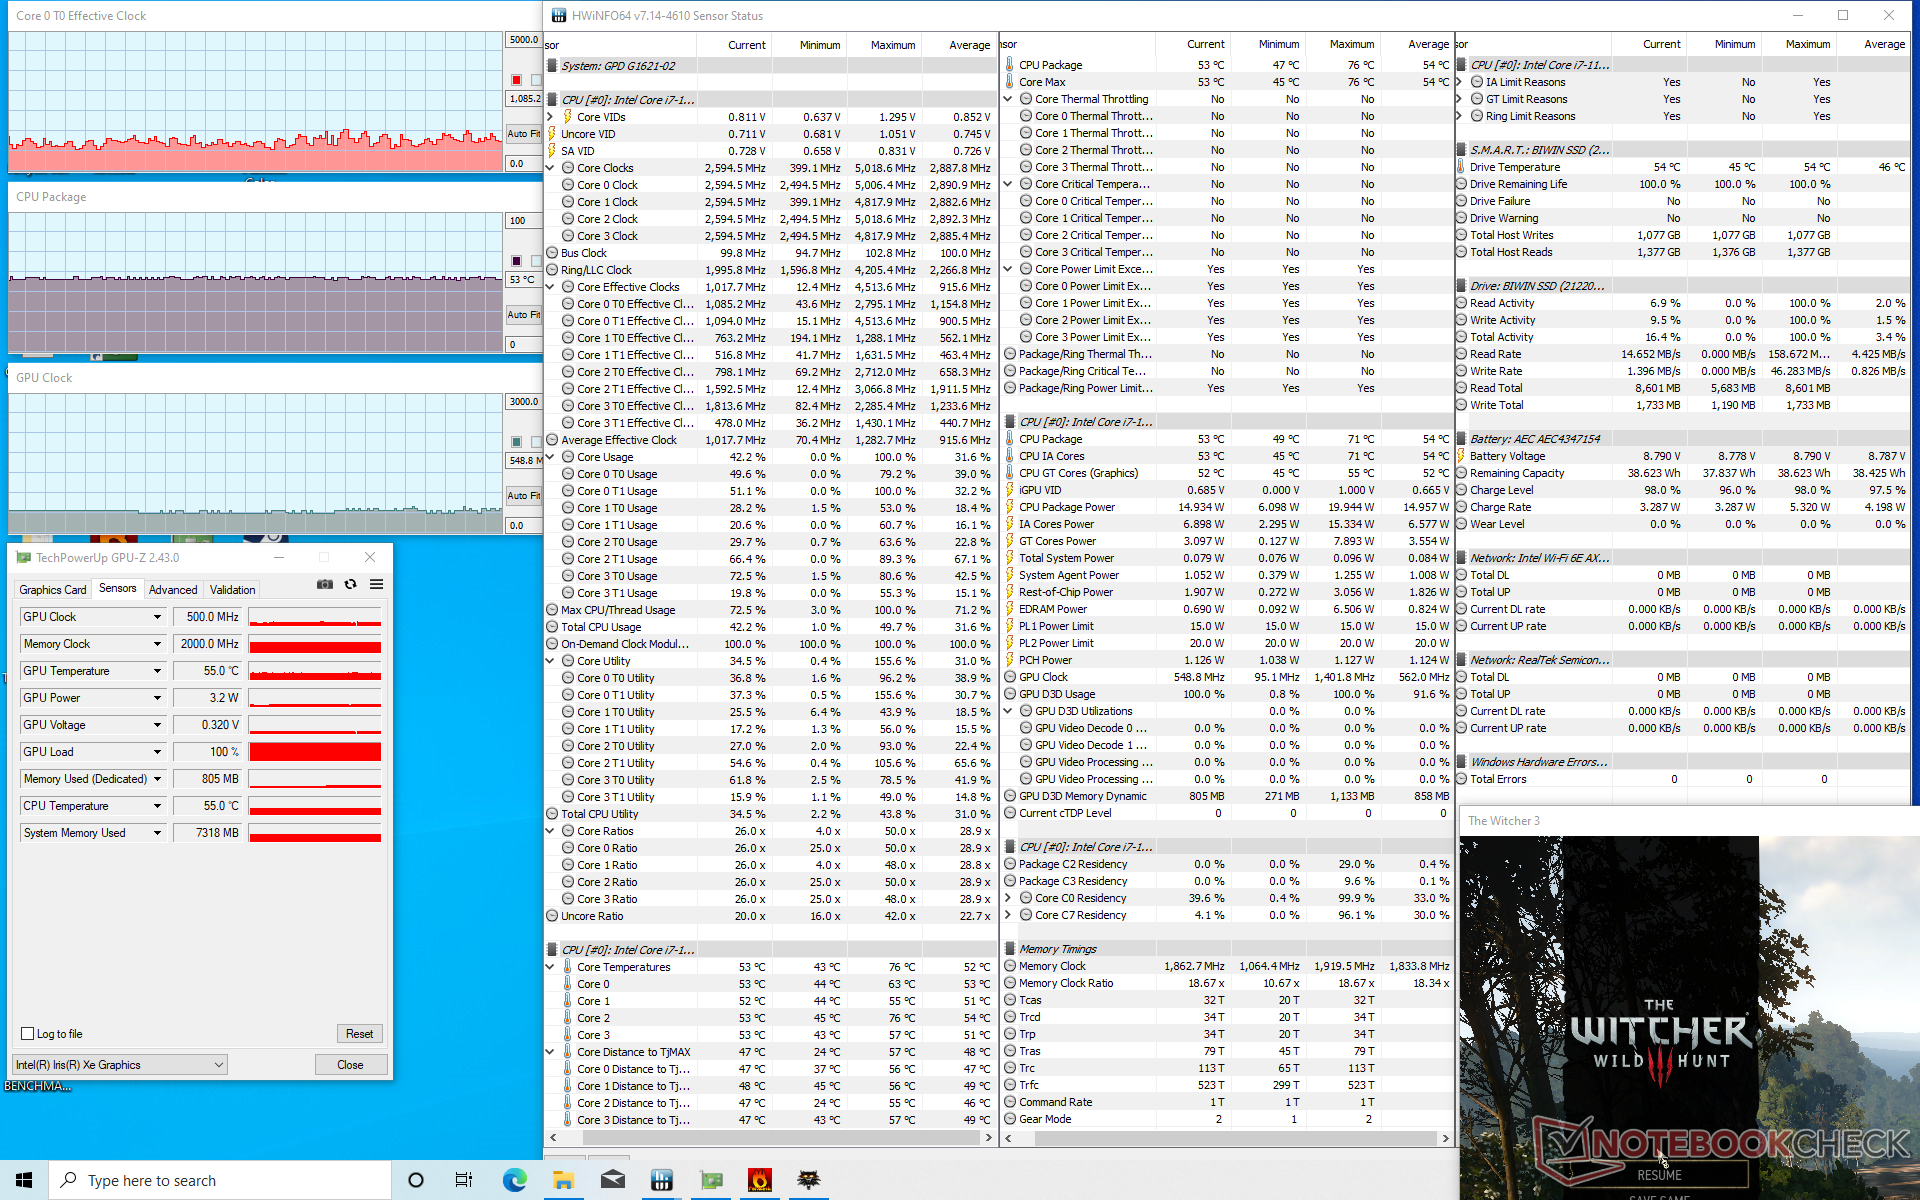
测试条件
处理器的功率限制可以通过BIOS菜单调整。在我们的基准测试中,我们使用制造商提供的默认功率设置(PL1=15,PL2=20),如下图所示。如果需要,用户可以选择以更高的功率限制(PL1=20,PL2=25)或更低的功率限制(PL1=12,PL2=15)运行处理器。我们将比较用户在默认和更高的功率设置之间能有什么不同。
处理器
多线程CPU性能大约比平均水平慢30%到35%。 Core i7-1195G7在我们的数据库中,当运行在默认的BIOS电源级别时,多线程CPU的性能比平均的Core i7-1195G7慢30%到35%。如果在较高的BIOS电源水平上运行,这一性能差距将变得更窄,只有10%。反过来说,单线程性能在两个电源级别设置之间变化不大。
从较低的 奔腾N6000SKU将使CPU的原始性能提高2至3倍。
Cinebench R15 Multi Loop
Cinebench R23: Multi Core | Single Core
Cinebench R20: CPU (Multi Core) | CPU (Single Core)
Cinebench R15: CPU Multi 64Bit | CPU Single 64Bit
Blender: v2.79 BMW27 CPU
7-Zip 18.03: 7z b 4 | 7z b 4 -mmt1
Geekbench 5.5: Multi-Core | Single-Core
HWBOT x265 Benchmark v2.2: 4k Preset
LibreOffice : 20 Documents To PDF
R Benchmark 2.5: Overall mean
| CPU Performance rating | |
| MSI Prestige 15 A10SC -10! | |
| GPD Win Max 2021 -2! | |
| Lenovo Yoga 6 13ALC6 -2! | |
| Asus Zenbook 14X UX5400E | |
| Average Intel Core i7-1195G7 | |
| Lenovo Yoga Slim 7 14ITL05 82A300CNGE | |
| GPD Win 3 | |
| GPD Pocket 3 -2! | |
| Infinix INBook X1 Pro -2! | |
| HP Envy 13-ba0001ng -2! | |
| Asus VivoBook S13 S333JA-DS51 | |
| Asus ZenBook 14 UX434FL-DB77 -2! | |
| Acer Swift 1 SF114-34-P6U1 | |
| Cinebench R23 / Multi Core | |
| GPD Win Max 2021 | |
| Lenovo Yoga 6 13ALC6 | |
| Asus Zenbook 14X UX5400E | |
| Lenovo Yoga Slim 7 14ITL05 82A300CNGE | |
| Average Intel Core i7-1195G7 (3142 - 6806, n=9) | |
| GPD Win 3 | |
| Infinix INBook X1 Pro | |
| Asus VivoBook S13 S333JA-DS51 | |
| GPD Pocket 3 | |
| Acer Swift 1 SF114-34-P6U1 | |
| Cinebench R23 / Single Core | |
| Asus Zenbook 14X UX5400E | |
| Average Intel Core i7-1195G7 (1290 - 1624, n=9) | |
| GPD Pocket 3 | |
| GPD Win 3 | |
| Lenovo Yoga Slim 7 14ITL05 82A300CNGE | |
| Lenovo Yoga 6 13ALC6 | |
| GPD Win Max 2021 | |
| Infinix INBook X1 Pro | |
| Asus VivoBook S13 S333JA-DS51 | |
| Acer Swift 1 SF114-34-P6U1 | |
| Cinebench R20 / CPU (Multi Core) | |
| GPD Win Max 2021 | |
| Lenovo Yoga 6 13ALC6 | |
| MSI Prestige 15 A10SC | |
| Asus Zenbook 14X UX5400E | |
| Lenovo Yoga Slim 7 14ITL05 82A300CNGE | |
| Average Intel Core i7-1195G7 (1212 - 2590, n=9) | |
| GPD Win 3 | |
| Infinix INBook X1 Pro | |
| Asus VivoBook S13 S333JA-DS51 | |
| GPD Pocket 3 | |
| Asus ZenBook 14 UX434FL-DB77 | |
| HP Envy 13-ba0001ng | |
| Acer Swift 1 SF114-34-P6U1 | |
| Cinebench R20 / CPU (Single Core) | |
| Asus Zenbook 14X UX5400E | |
| Average Intel Core i7-1195G7 (498 - 620, n=9) | |
| GPD Pocket 3 | |
| GPD Win 3 | |
| Lenovo Yoga Slim 7 14ITL05 82A300CNGE | |
| Lenovo Yoga 6 13ALC6 | |
| GPD Win Max 2021 | |
| Infinix INBook X1 Pro | |
| MSI Prestige 15 A10SC | |
| Asus ZenBook 14 UX434FL-DB77 | |
| HP Envy 13-ba0001ng | |
| Asus VivoBook S13 S333JA-DS51 | |
| Acer Swift 1 SF114-34-P6U1 | |
| Cinebench R15 / CPU Multi 64Bit | |
| GPD Win Max 2021 | |
| Lenovo Yoga 6 13ALC6 | |
| MSI Prestige 15 A10SC | |
| Asus Zenbook 14X UX5400E | |
| Lenovo Yoga Slim 7 14ITL05 82A300CNGE | |
| Average Intel Core i7-1195G7 (574 - 999, n=9) | |
| GPD Pocket 3 | |
| GPD Pocket 3 | |
| GPD Win 3 | |
| Asus ZenBook 14 UX434FL-DB77 | |
| Infinix INBook X1 Pro | |
| Asus VivoBook S13 S333JA-DS51 | |
| HP Envy 13-ba0001ng | |
| Acer Swift 1 SF114-34-P6U1 | |
| Cinebench R15 / CPU Single 64Bit | |
| GPD Pocket 3 | |
| GPD Pocket 3 | |
| Average Intel Core i7-1195G7 (198 - 238, n=8) | |
| GPD Win 3 | |
| MSI Prestige 15 A10SC | |
| Asus Zenbook 14X UX5400E | |
| Lenovo Yoga 6 13ALC6 | |
| GPD Win Max 2021 | |
| Infinix INBook X1 Pro | |
| Lenovo Yoga Slim 7 14ITL05 82A300CNGE | |
| Asus ZenBook 14 UX434FL-DB77 | |
| HP Envy 13-ba0001ng | |
| Asus VivoBook S13 S333JA-DS51 | |
| Acer Swift 1 SF114-34-P6U1 | |
| Blender / v2.79 BMW27 CPU | |
| Acer Swift 1 SF114-34-P6U1 | |
| HP Envy 13-ba0001ng | |
| GPD Pocket 3 | |
| Asus ZenBook 14 UX434FL-DB77 | |
| Asus VivoBook S13 S333JA-DS51 | |
| Infinix INBook X1 Pro | |
| Lenovo Yoga Slim 7 14ITL05 82A300CNGE | |
| Average Intel Core i7-1195G7 (473 - 1211, n=10) | |
| GPD Win 3 | |
| Asus Zenbook 14X UX5400E | |
| GPD Win Max 2021 | |
| Lenovo Yoga 6 13ALC6 | |
| 7-Zip 18.03 / 7z b 4 | |
| Lenovo Yoga 6 13ALC6 | |
| GPD Win Max 2021 | |
| Average Intel Core i7-1195G7 (17053 - 26183, n=9) | |
| Asus Zenbook 14X UX5400E | |
| GPD Win 3 | |
| Lenovo Yoga Slim 7 14ITL05 82A300CNGE | |
| Infinix INBook X1 Pro | |
| Asus VivoBook S13 S333JA-DS51 | |
| GPD Pocket 3 | |
| Asus ZenBook 14 UX434FL-DB77 | |
| HP Envy 13-ba0001ng | |
| Acer Swift 1 SF114-34-P6U1 | |
| 7-Zip 18.03 / 7z b 4 -mmt1 | |
| Average Intel Core i7-1195G7 (5059 - 5890, n=9) | |
| GPD Pocket 3 | |
| Lenovo Yoga Slim 7 14ITL05 82A300CNGE | |
| GPD Win 3 | |
| HP Envy 13-ba0001ng | |
| Asus Zenbook 14X UX5400E | |
| Lenovo Yoga 6 13ALC6 | |
| GPD Win Max 2021 | |
| Infinix INBook X1 Pro | |
| Asus ZenBook 14 UX434FL-DB77 | |
| Asus VivoBook S13 S333JA-DS51 | |
| Acer Swift 1 SF114-34-P6U1 | |
| Geekbench 5.5 / Multi-Core | |
| Asus Zenbook 14X UX5400E | |
| Average Intel Core i7-1195G7 (4241 - 6349, n=7) | |
| GPD Win 3 | |
| Lenovo Yoga Slim 7 14ITL05 82A300CNGE | |
| Asus VivoBook S13 S333JA-DS51 | |
| HP Envy 13-ba0001ng | |
| Asus ZenBook 14 UX434FL-DB77 | |
| Acer Swift 1 SF114-34-P6U1 | |
| Geekbench 5.5 / Single-Core | |
| Average Intel Core i7-1195G7 (1519 - 1649, n=7) | |
| Asus Zenbook 14X UX5400E | |
| GPD Win 3 | |
| Lenovo Yoga Slim 7 14ITL05 82A300CNGE | |
| HP Envy 13-ba0001ng | |
| Asus ZenBook 14 UX434FL-DB77 | |
| Asus VivoBook S13 S333JA-DS51 | |
| Acer Swift 1 SF114-34-P6U1 | |
| HWBOT x265 Benchmark v2.2 / 4k Preset | |
| GPD Win Max 2021 | |
| Lenovo Yoga 6 13ALC6 | |
| Asus Zenbook 14X UX5400E | |
| Average Intel Core i7-1195G7 (4.23 - 8.8, n=9) | |
| GPD Win 3 | |
| Infinix INBook X1 Pro | |
| Lenovo Yoga Slim 7 14ITL05 82A300CNGE | |
| Asus VivoBook S13 S333JA-DS51 | |
| Asus ZenBook 14 UX434FL-DB77 | |
| GPD Pocket 3 | |
| HP Envy 13-ba0001ng | |
| Acer Swift 1 SF114-34-P6U1 | |
| LibreOffice / 20 Documents To PDF | |
| Acer Swift 1 SF114-34-P6U1 | |
| Asus ZenBook 14 UX434FL-DB77 | |
| Lenovo Yoga 6 13ALC6 | |
| GPD Win Max 2021 | |
| Asus VivoBook S13 S333JA-DS51 | |
| Infinix INBook X1 Pro | |
| HP Envy 13-ba0001ng | |
| Lenovo Yoga Slim 7 14ITL05 82A300CNGE | |
| Asus Zenbook 14X UX5400E | |
| Average Intel Core i7-1195G7 (39.2 - 83.9, n=9) | |
| GPD Win 3 | |
| GPD Pocket 3 | |
| R Benchmark 2.5 / Overall mean | |
| Acer Swift 1 SF114-34-P6U1 | |
| Asus ZenBook 14 UX434FL-DB77 | |
| Asus VivoBook S13 S333JA-DS51 | |
| Infinix INBook X1 Pro | |
| HP Envy 13-ba0001ng | |
| GPD Win 3 | |
| Lenovo Yoga Slim 7 14ITL05 82A300CNGE | |
| Asus Zenbook 14X UX5400E | |
| GPD Win Max 2021 | |
| GPD Pocket 3 | |
| Lenovo Yoga 6 13ALC6 | |
| Average Intel Core i7-1195G7 (0.53 - 0.611, n=9) | |
Cinebench R23: Multi Core | Single Core
Cinebench R20: CPU (Multi Core) | CPU (Single Core)
Cinebench R15: CPU Multi 64Bit | CPU Single 64Bit
Blender: v2.79 BMW27 CPU
7-Zip 18.03: 7z b 4 | 7z b 4 -mmt1
Geekbench 5.5: Multi-Core | Single-Core
HWBOT x265 Benchmark v2.2: 4k Preset
LibreOffice : 20 Documents To PDF
R Benchmark 2.5: Overall mean
* ... smaller is better
AIDA64: FP32 Ray-Trace | FPU Julia | CPU SHA3 | CPU Queen | FPU SinJulia | FPU Mandel | CPU AES | CPU ZLib | FP64 Ray-Trace | CPU PhotoWorxx
| Performance rating | |
| GPD Win Max 2021 | |
| Dell XPS 13 9310 2-in-1 | |
| Average Intel Core i7-1195G7 | |
| GPD Pocket 3 | |
| Lenovo ThinkPad X12 20UVS03G00 | |
| AIDA64 / FP32 Ray-Trace | |
| GPD Win Max 2021 | |
| Dell XPS 13 9310 2-in-1 | |
| Average Intel Core i7-1195G7 (4378 - 7361, n=9) | |
| GPD Pocket 3 | |
| Lenovo ThinkPad X12 20UVS03G00 | |
| AIDA64 / FPU Julia | |
| GPD Win Max 2021 | |
| Dell XPS 13 9310 2-in-1 | |
| Average Intel Core i7-1195G7 (20576 - 30422, n=9) | |
| GPD Pocket 3 | |
| Lenovo ThinkPad X12 20UVS03G00 | |
| AIDA64 / CPU SHA3 | |
| Dell XPS 13 9310 2-in-1 | |
| Average Intel Core i7-1195G7 (1310 - 2026, n=9) | |
| GPD Win Max 2021 | |
| GPD Pocket 3 | |
| Lenovo ThinkPad X12 20UVS03G00 | |
| AIDA64 / CPU Queen | |
| GPD Win Max 2021 | |
| Dell XPS 13 9310 2-in-1 | |
| Average Intel Core i7-1195G7 (38530 - 56262, n=9) | |
| Lenovo ThinkPad X12 20UVS03G00 | |
| GPD Pocket 3 | |
| AIDA64 / FPU SinJulia | |
| GPD Win Max 2021 | |
| Dell XPS 13 9310 2-in-1 | |
| Average Intel Core i7-1195G7 (3209 - 4937, n=9) | |
| GPD Pocket 3 | |
| Lenovo ThinkPad X12 20UVS03G00 | |
| AIDA64 / FPU Mandel | |
| GPD Win Max 2021 | |
| Dell XPS 13 9310 2-in-1 | |
| Average Intel Core i7-1195G7 (12142 - 18123, n=9) | |
| GPD Pocket 3 | |
| Lenovo ThinkPad X12 20UVS03G00 | |
| AIDA64 / CPU AES | |
| Dell XPS 13 9310 2-in-1 | |
| Average Intel Core i7-1195G7 (30854 - 70936, n=9) | |
| GPD Pocket 3 | |
| GPD Win Max 2021 | |
| Lenovo ThinkPad X12 20UVS03G00 | |
| AIDA64 / CPU ZLib | |
| GPD Win Max 2021 | |
| Dell XPS 13 9310 2-in-1 | |
| Average Intel Core i7-1195G7 (231 - 399, n=10) | |
| GPD Pocket 3 | |
| Lenovo ThinkPad X12 20UVS03G00 | |
| AIDA64 / FP64 Ray-Trace | |
| GPD Win Max 2021 | |
| Dell XPS 13 9310 2-in-1 | |
| Average Intel Core i7-1195G7 (2300 - 3949, n=9) | |
| GPD Pocket 3 | |
| Lenovo ThinkPad X12 20UVS03G00 | |
| AIDA64 / CPU PhotoWorxx | |
| Dell XPS 13 9310 2-in-1 | |
| Lenovo ThinkPad X12 20UVS03G00 | |
| GPD Pocket 3 | |
| Average Intel Core i7-1195G7 (13455 - 35235, n=9) | |
| GPD Win Max 2021 | |
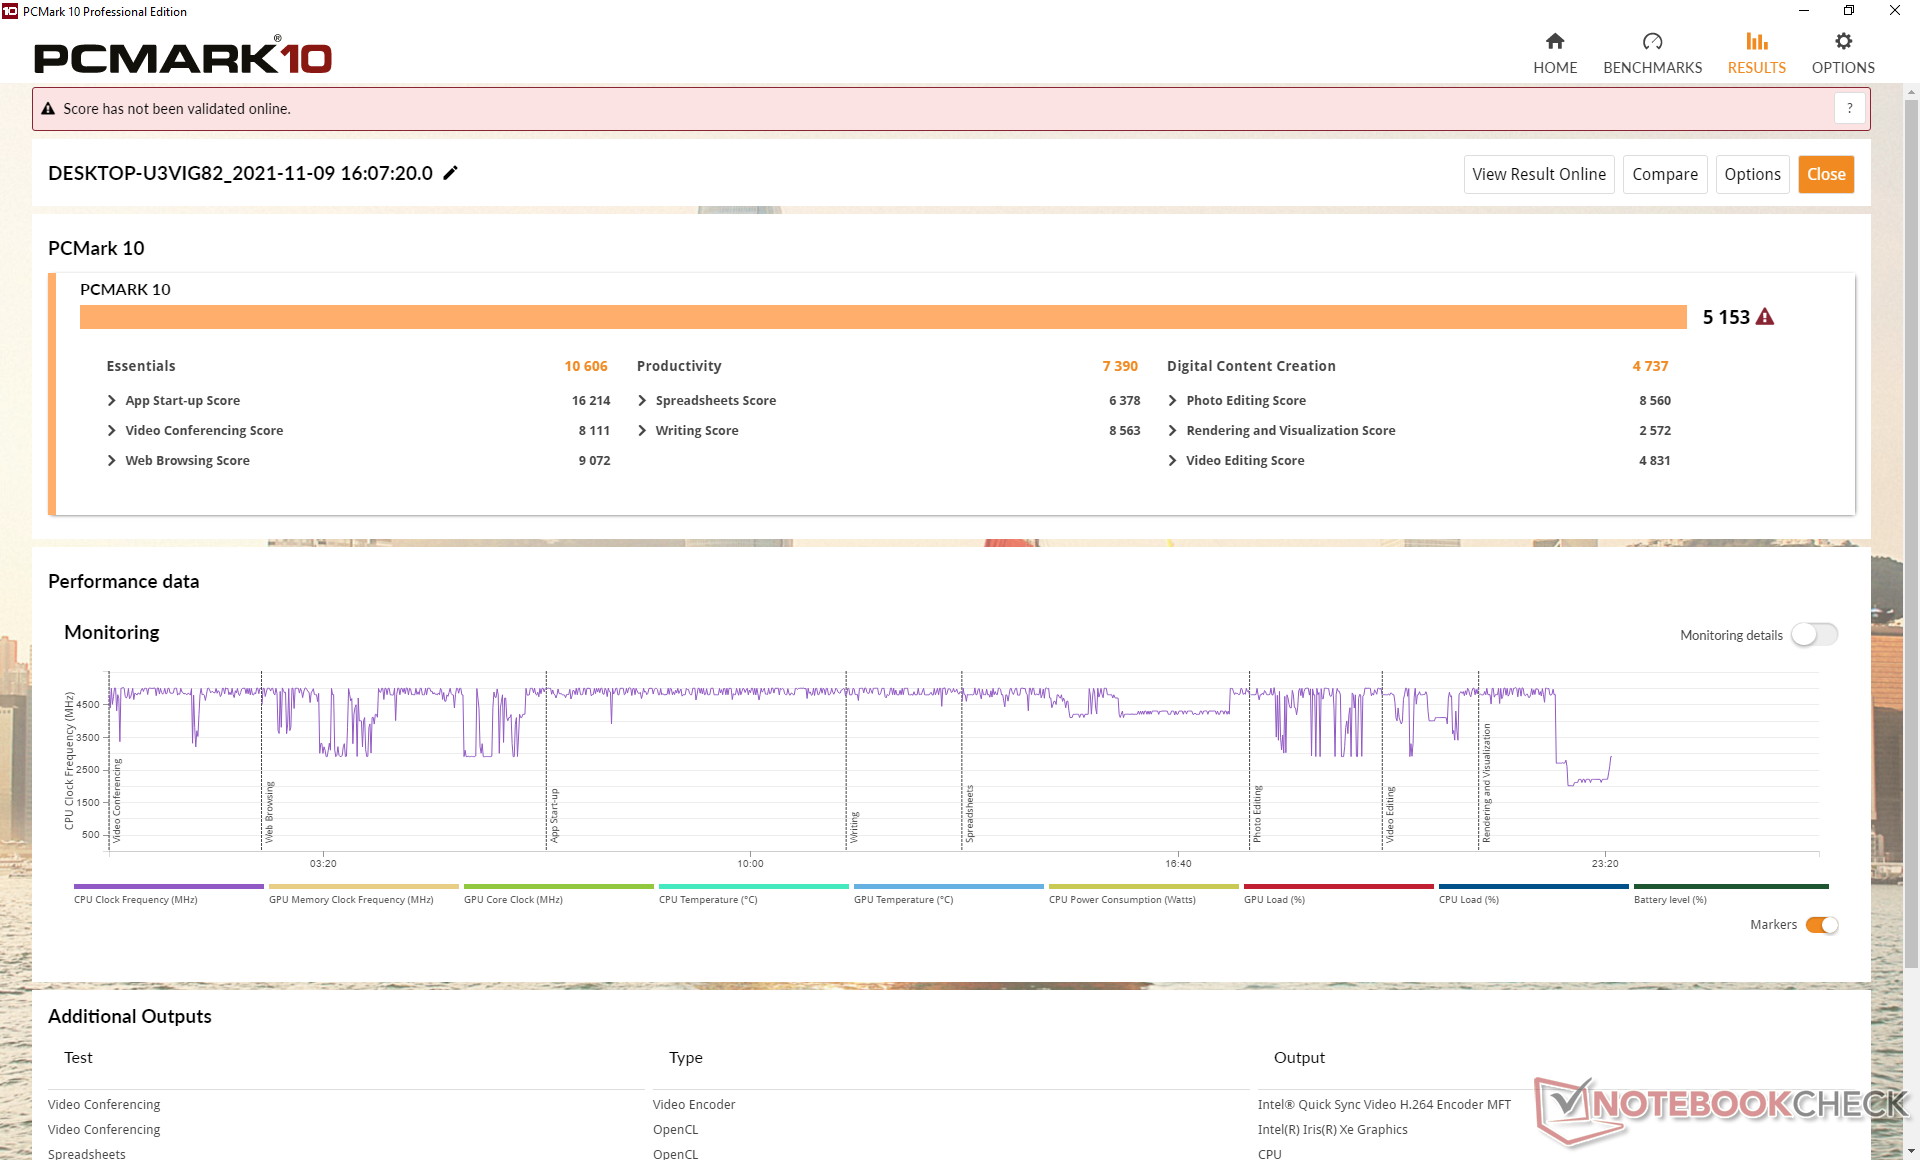
系统性能
尽管在BIOS默认的功率水平上,CPU和GPU的性能低于平均水平,但PCMark的得分却很出色。我们赞赏该系统没有装载任何臃肿的软件。
| PCMark 10 / Score | |
| GPD Win Max 2021 | |
| Average Intel Core i7-1195G7, Intel Iris Xe Graphics G7 96EUs (5067 - 5406, n=6) | |
| Dell XPS 13 9310 2-in-1 | |
| GPD Pocket 3 | |
| HP Spectre x360 14t-ea000 | |
| GPD Win 3 | |
| Lenovo ThinkPad X12 20UVS03G00 | |
| PCMark 10 / Essentials | |
| GPD Pocket 3 | |
| Dell XPS 13 9310 2-in-1 | |
| Average Intel Core i7-1195G7, Intel Iris Xe Graphics G7 96EUs (10156 - 10614, n=6) | |
| HP Spectre x360 14t-ea000 | |
| GPD Win 3 | |
| Lenovo ThinkPad X12 20UVS03G00 | |
| GPD Win Max 2021 | |
| PCMark 10 / Productivity | |
| GPD Win Max 2021 | |
| GPD Pocket 3 | |
| Average Intel Core i7-1195G7, Intel Iris Xe Graphics G7 96EUs (6637 - 7390, n=6) | |
| Dell XPS 13 9310 2-in-1 | |
| HP Spectre x360 14t-ea000 | |
| GPD Win 3 | |
| Lenovo ThinkPad X12 20UVS03G00 | |
| PCMark 10 / Digital Content Creation | |
| Dell XPS 13 9310 2-in-1 | |
| Average Intel Core i7-1195G7, Intel Iris Xe Graphics G7 96EUs (4737 - 5941, n=6) | |
| GPD Win Max 2021 | |
| HP Spectre x360 14t-ea000 | |
| GPD Pocket 3 | |
| Lenovo ThinkPad X12 20UVS03G00 | |
| GPD Win 3 | |
| PCMark 10 Score | 5153 points | |
Help | ||
| AIDA64 / Memory Copy | |
| Dell XPS 13 9310 2-in-1 | |
| GPD Pocket 3 | |
| Lenovo ThinkPad X12 20UVS03G00 | |
| Average Intel Core i7-1195G7 (23332 - 57053, n=10) | |
| GPD Win Max 2021 | |
| AIDA64 / Memory Read | |
| Dell XPS 13 9310 2-in-1 | |
| Lenovo ThinkPad X12 20UVS03G00 | |
| GPD Pocket 3 | |
| GPD Win Max 2021 | |
| Average Intel Core i7-1195G7 (24068 - 53332, n=10) | |
| AIDA64 / Memory Write | |
| Dell XPS 13 9310 2-in-1 | |
| Lenovo ThinkPad X12 20UVS03G00 | |
| GPD Pocket 3 | |
| Average Intel Core i7-1195G7 (22151 - 59019, n=10) | |
| GPD Win Max 2021 | |
| AIDA64 / Memory Latency | |
| GPD Win Max 2021 | |
| Lenovo ThinkPad X12 20UVS03G00 | |
| Average Intel Core i7-1195G7 (69.8 - 114.4, n=10) | |
| Dell XPS 13 9310 2-in-1 | |
| GPD Pocket 3 | |
* ... smaller is better
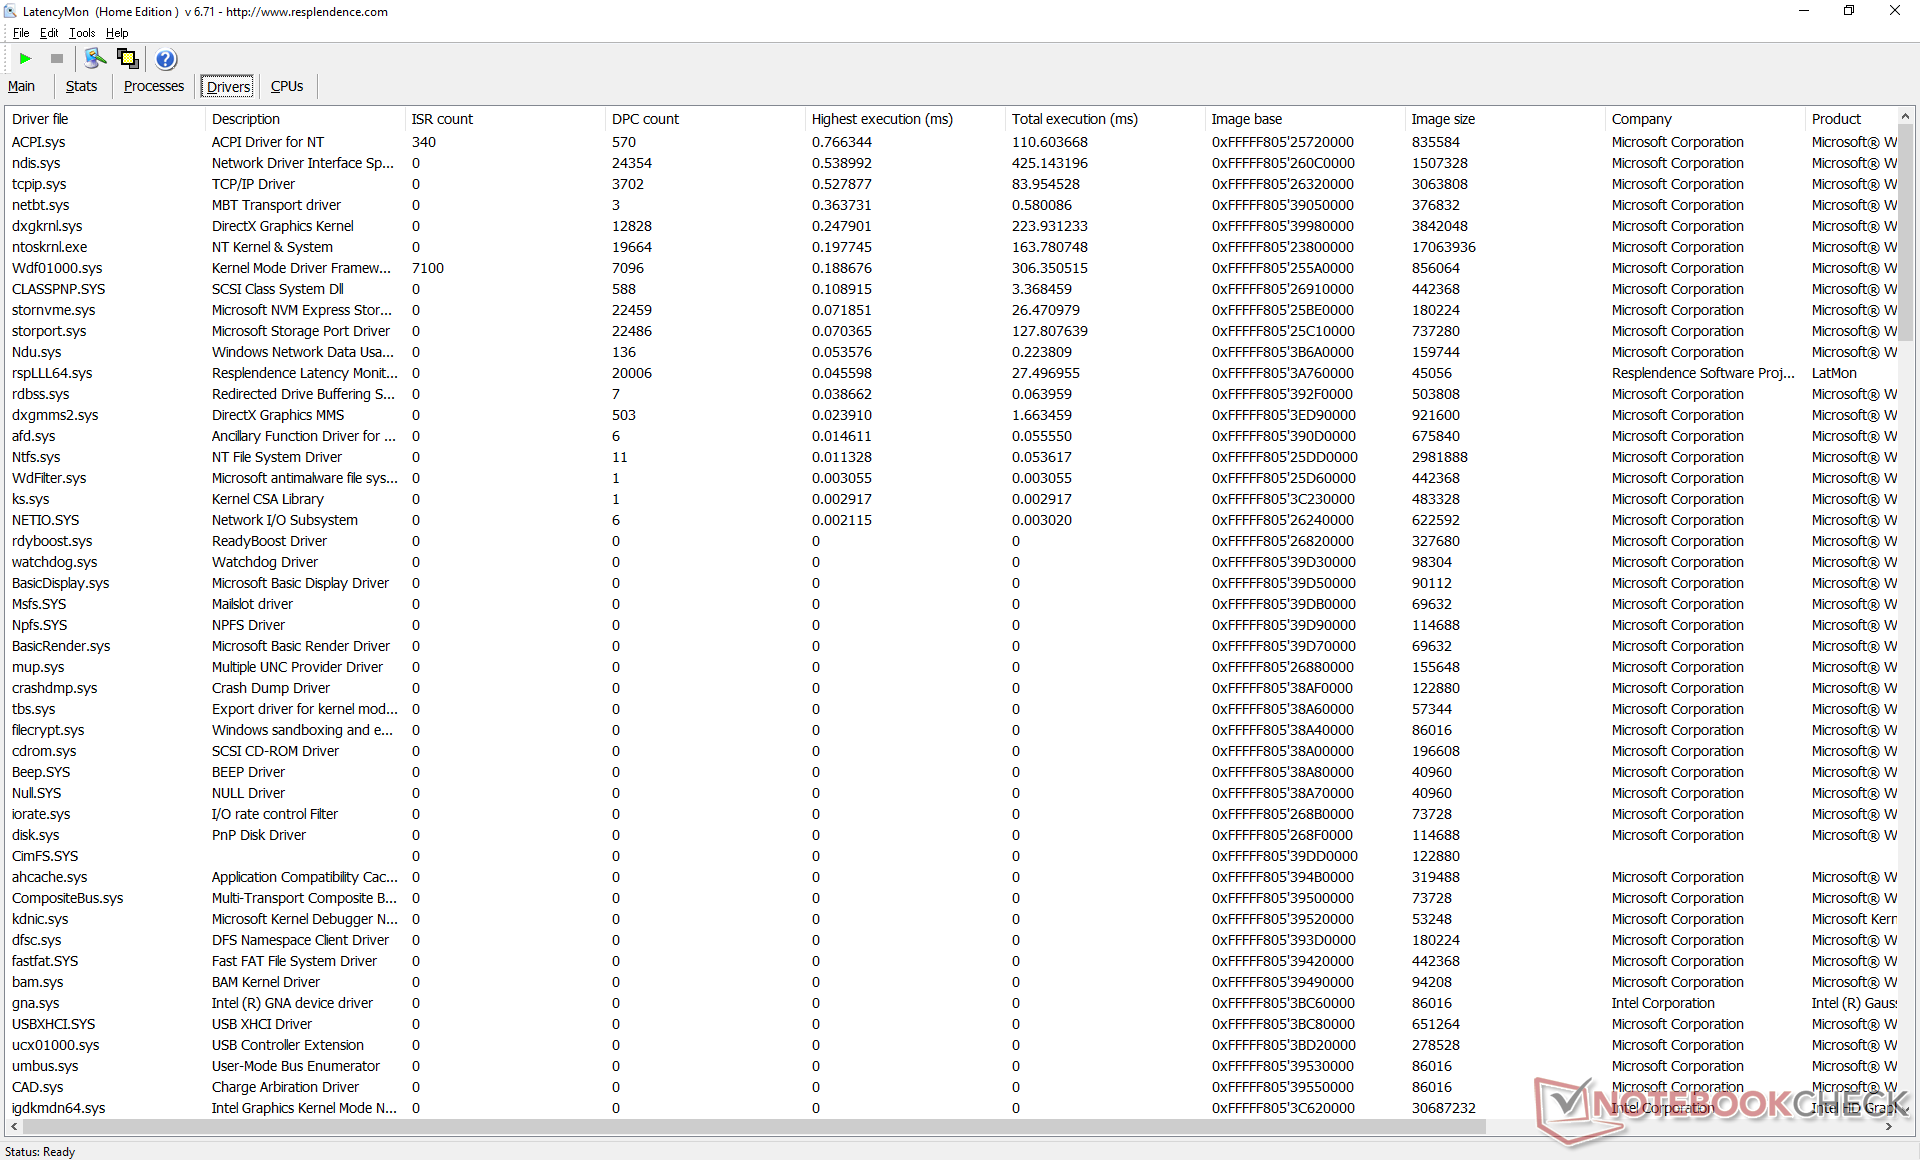
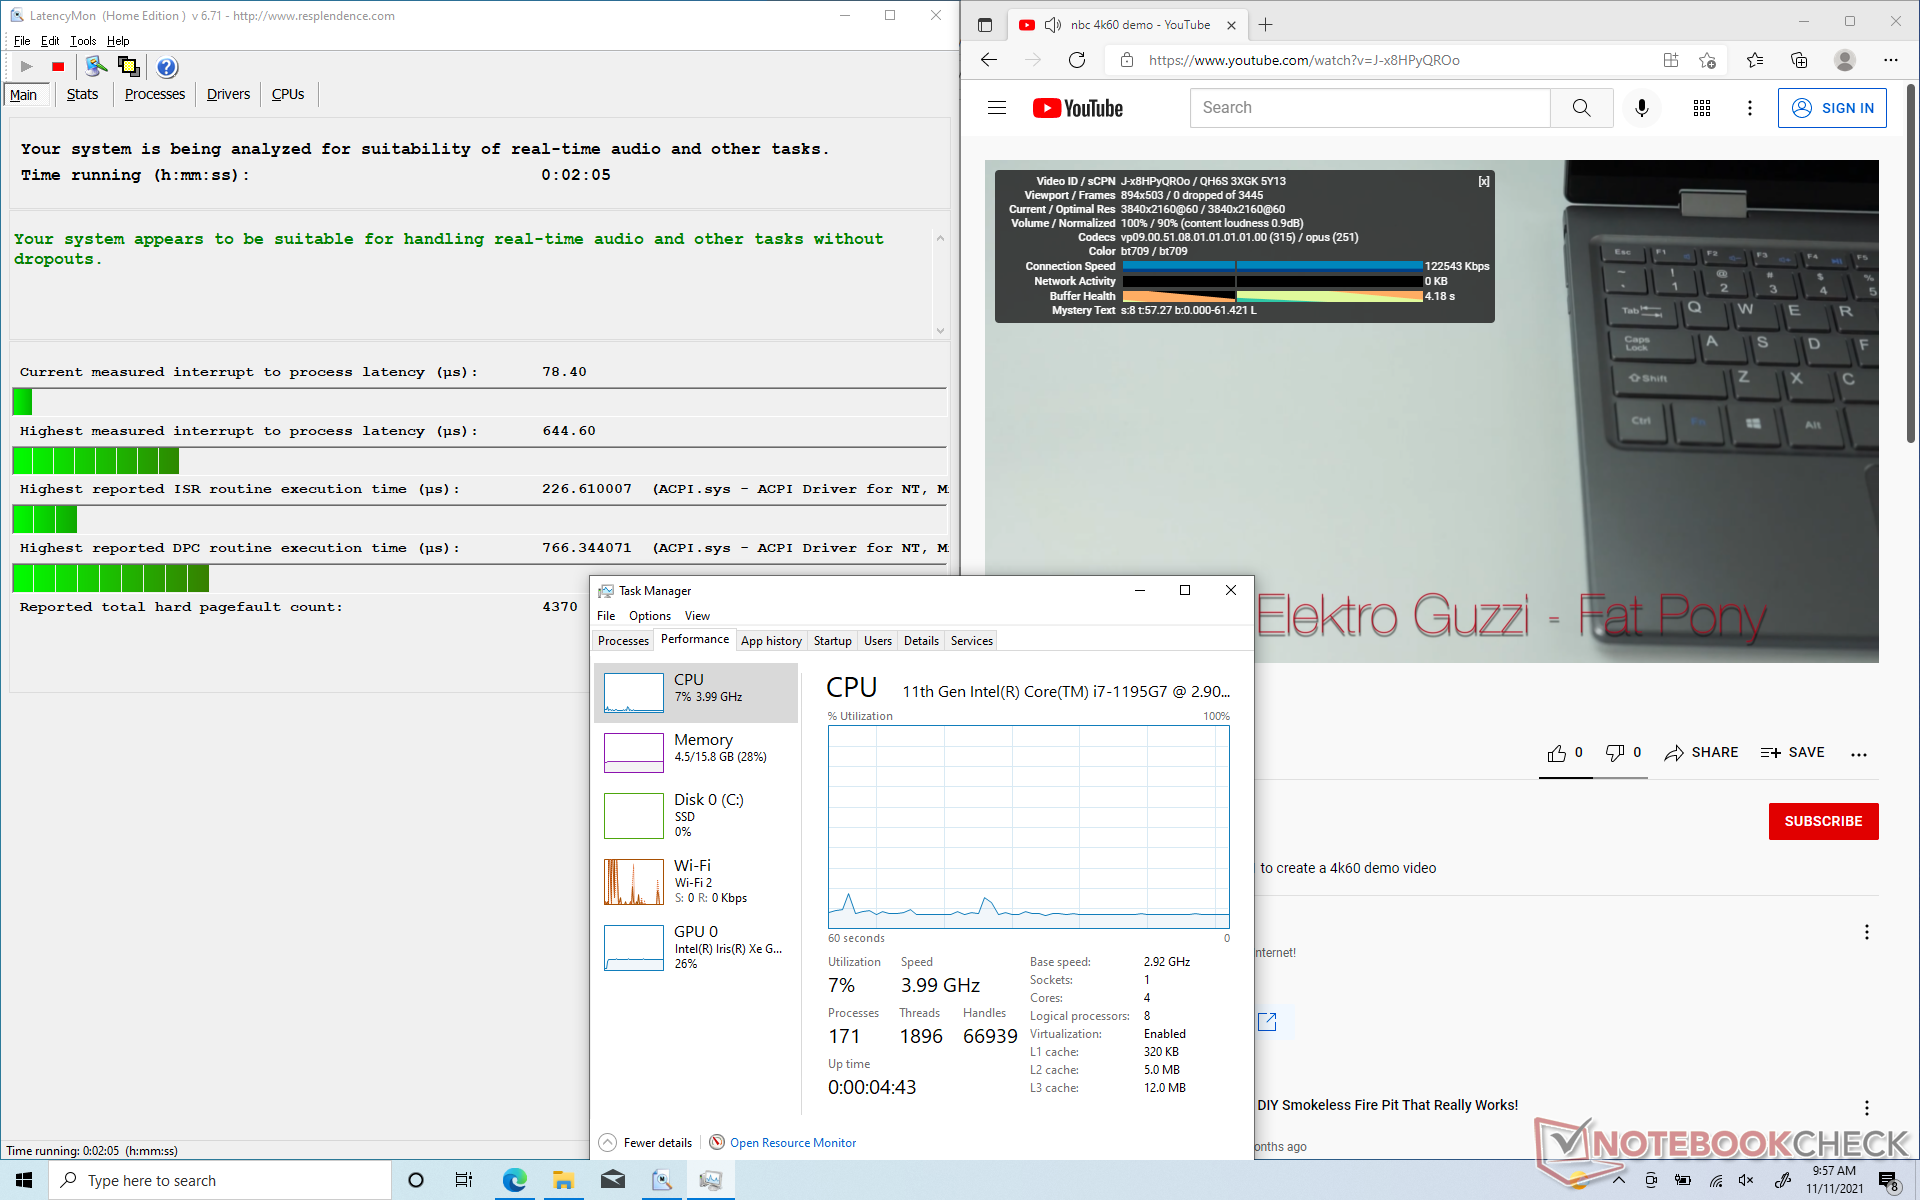
DPC延时
LatencyMon显示在我们的主页上打开多个浏览器标签时没有DPC问题。在60FPS下的4K视频播放很流畅,也没有丢帧。
| DPC Latencies / LatencyMon - interrupt to process latency (max), Web, Youtube, Prime95 | |
| GPD Win Max 2021 | |
| HP Spectre x360 14t-ea000 | |
| GPD Win 3 | |
| GPD Pocket 3 | |
| Dell XPS 13 9310 2-in-1 | |
| Lenovo ThinkPad X12 20UVS03G00 | |
* ... smaller is better
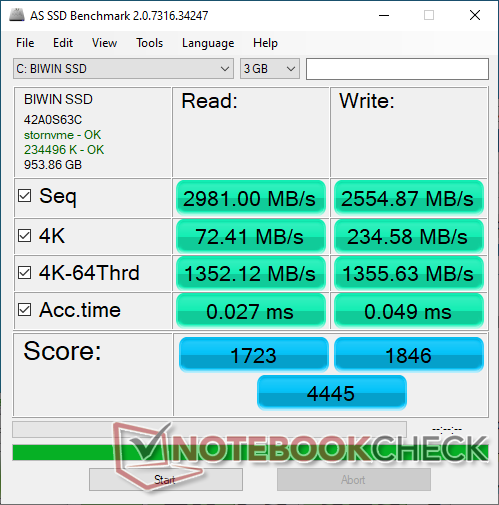
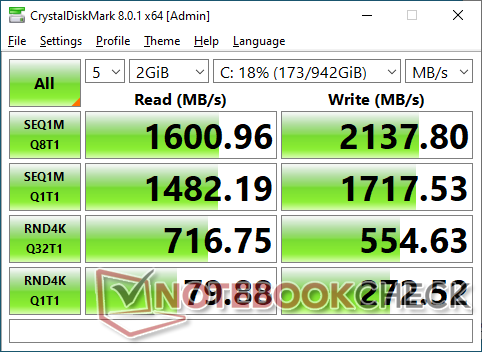
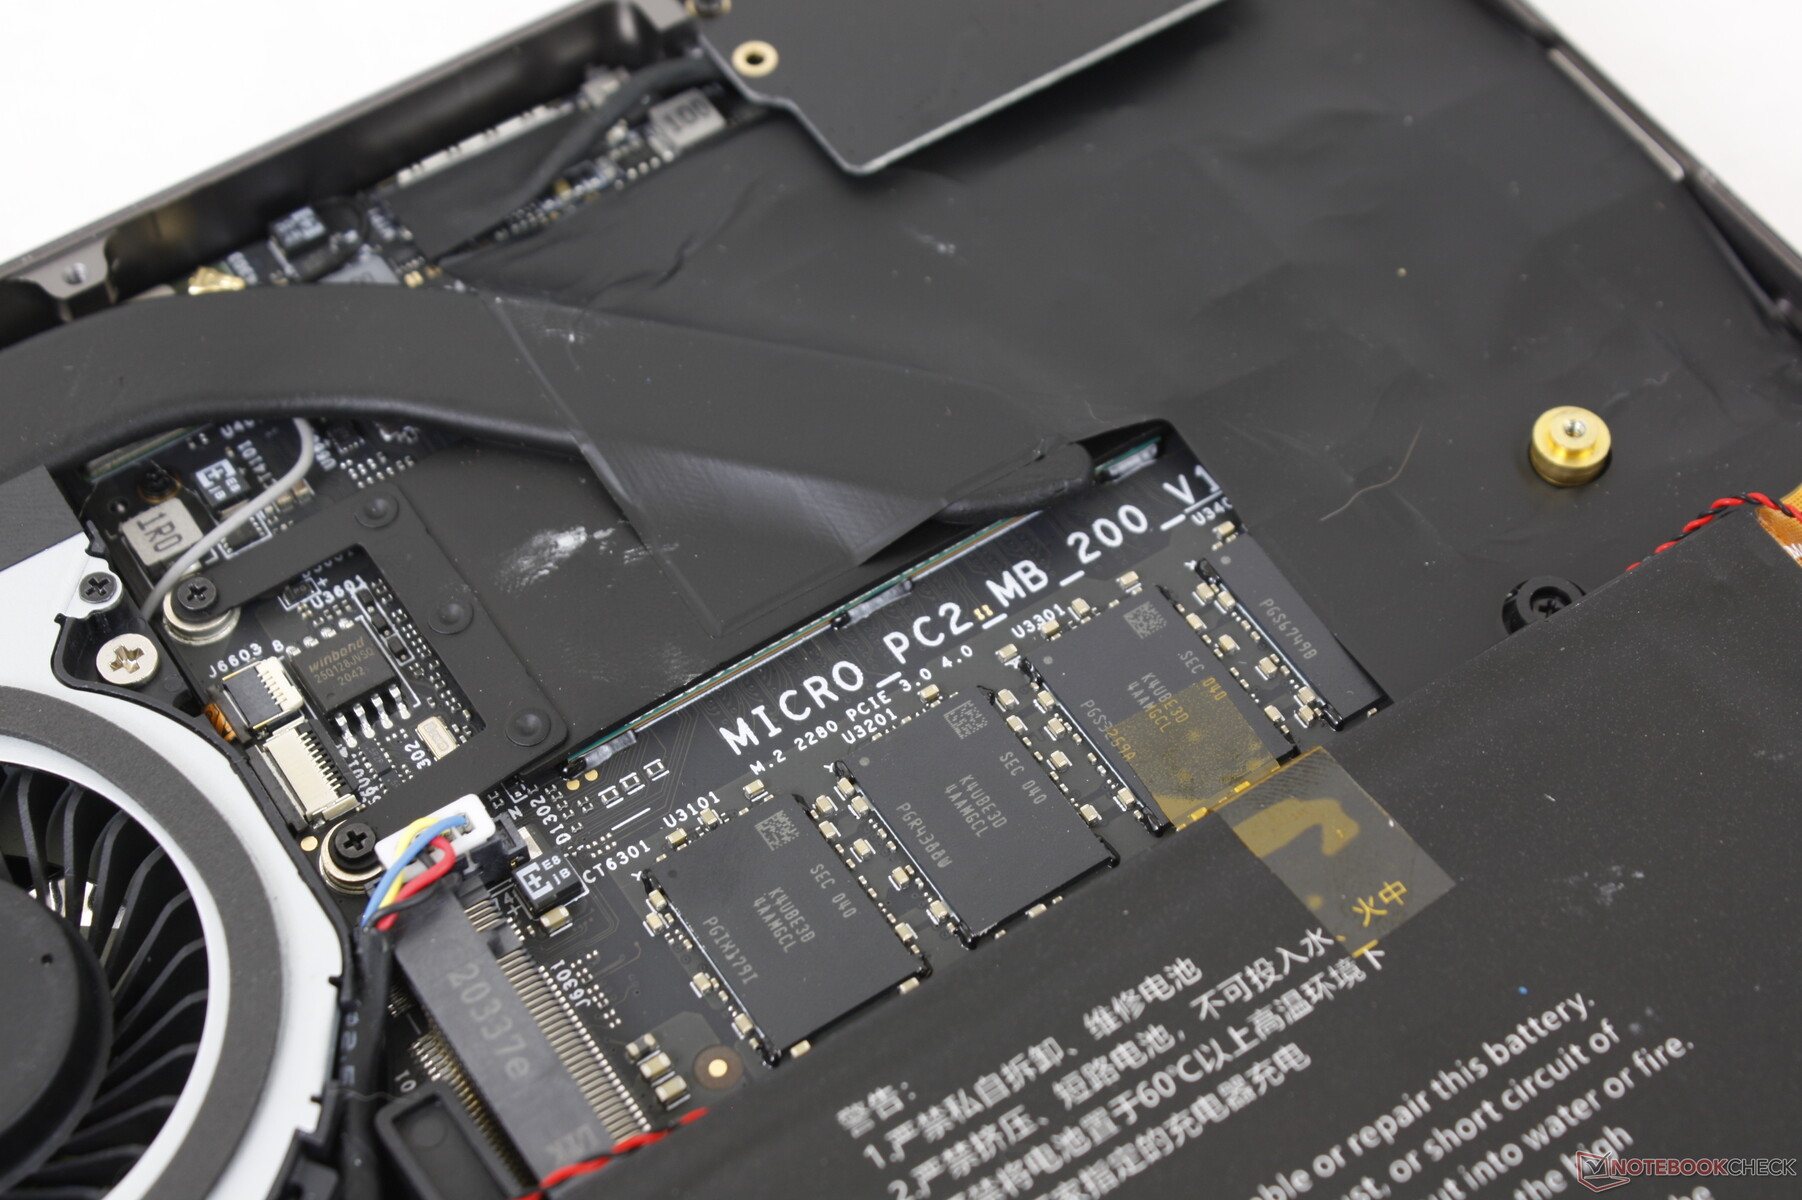
存储设备 - 完全支持PCIe4 x4驱动器
根据CrystalDiskMark 5的测试,我们的1TB BIWIN NQ200 硬盘的连续读取和写入率最高分别为3500 MB/s和2800 MB/s。然而,根据我们的DiskSpd循环测试,由于该硬盘缺乏散热片,所以性能在几分钟后就迅速下降。

| Drive Performance rating - Percent | |
| Average BiWin NQ200 1TB CNF82GS1D00-1TB | |
| GPD Pocket 3 | |
| GPD Win 3 | |
| GPD Win Max 2021 | |
| HP Spectre x360 14t-ea000 | |
| Dell XPS 13 9310 2-in-1 | |
| Lenovo ThinkPad X12 20UVS03G00 | |
* ... smaller is better
Disk Throttling: DiskSpd Read Loop, Queue Depth 8
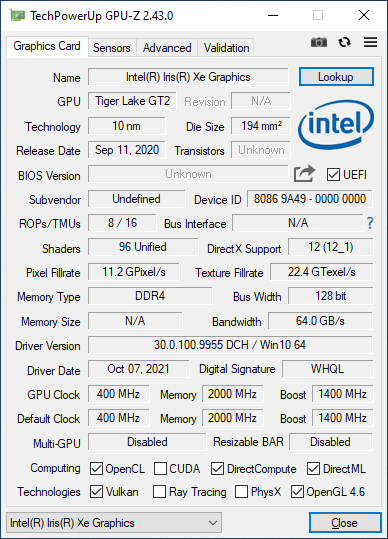
GPU性能 - Iris Xe
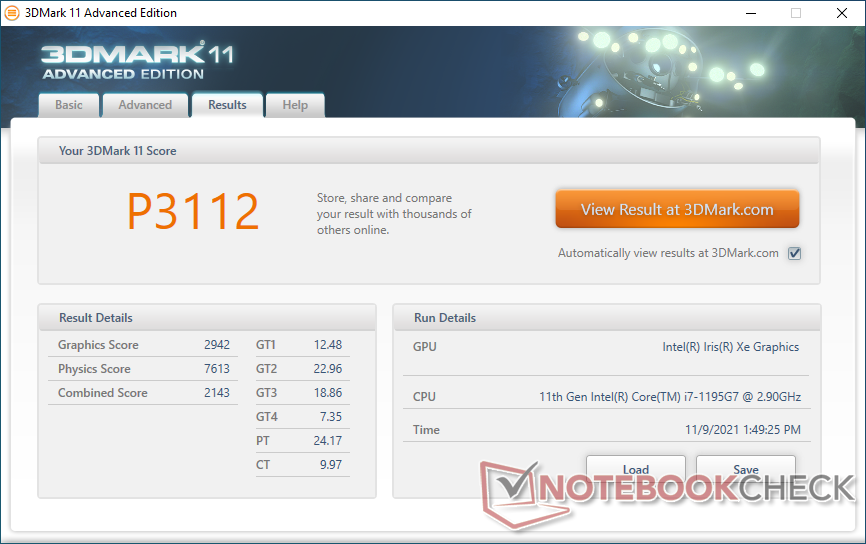
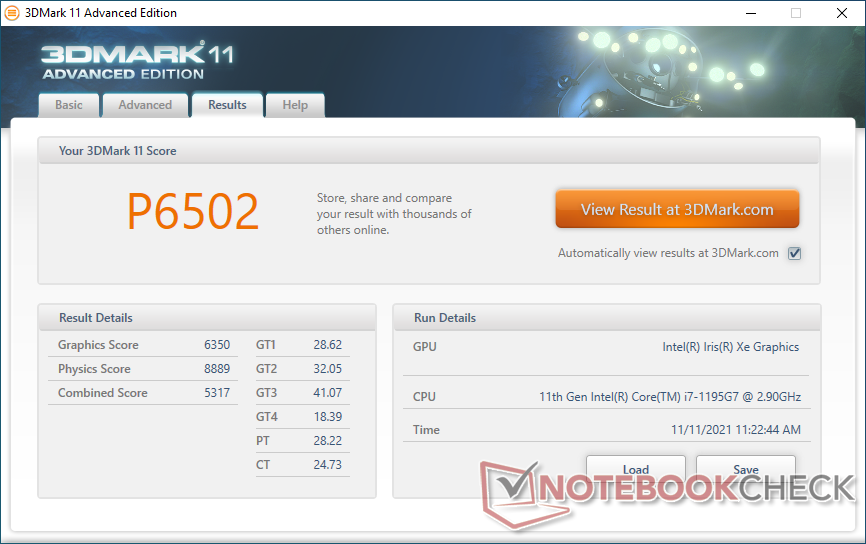
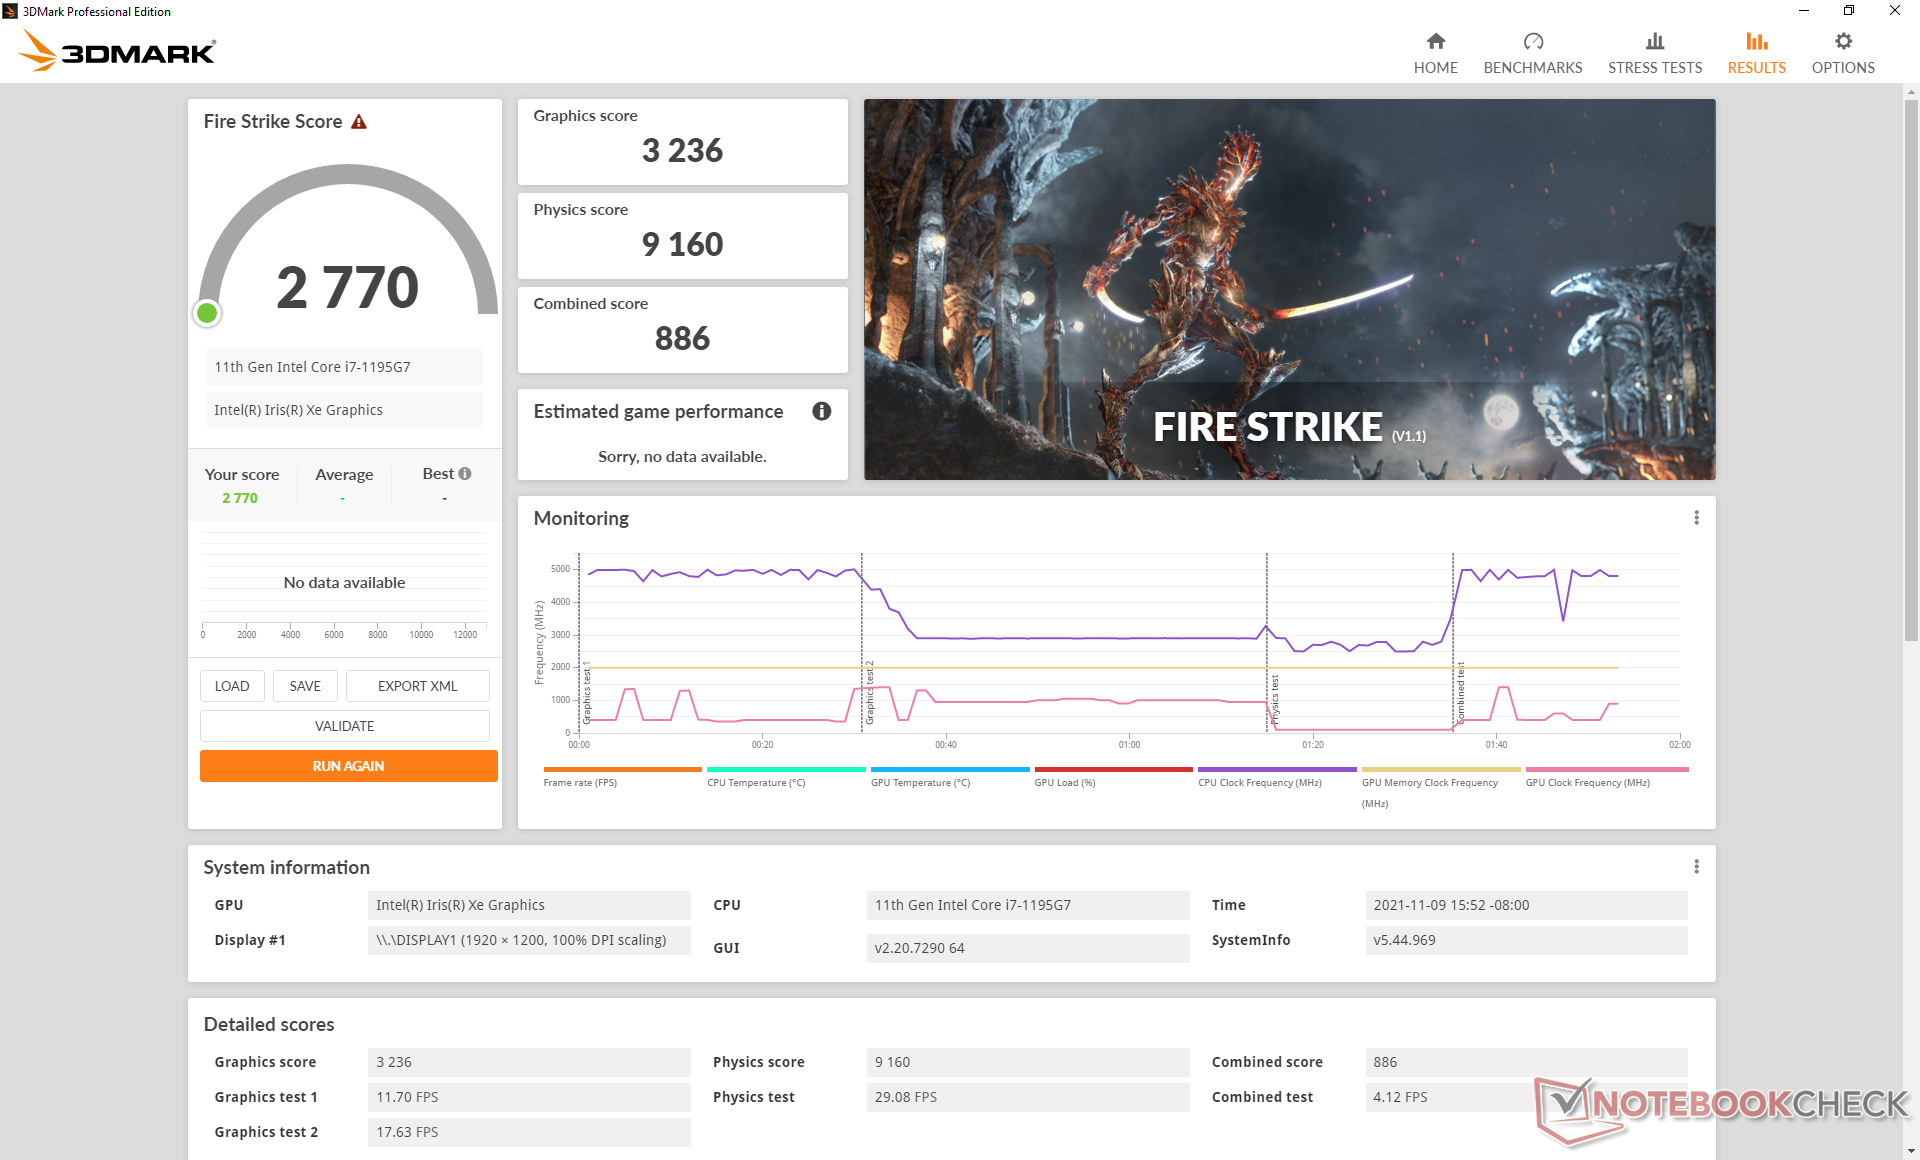
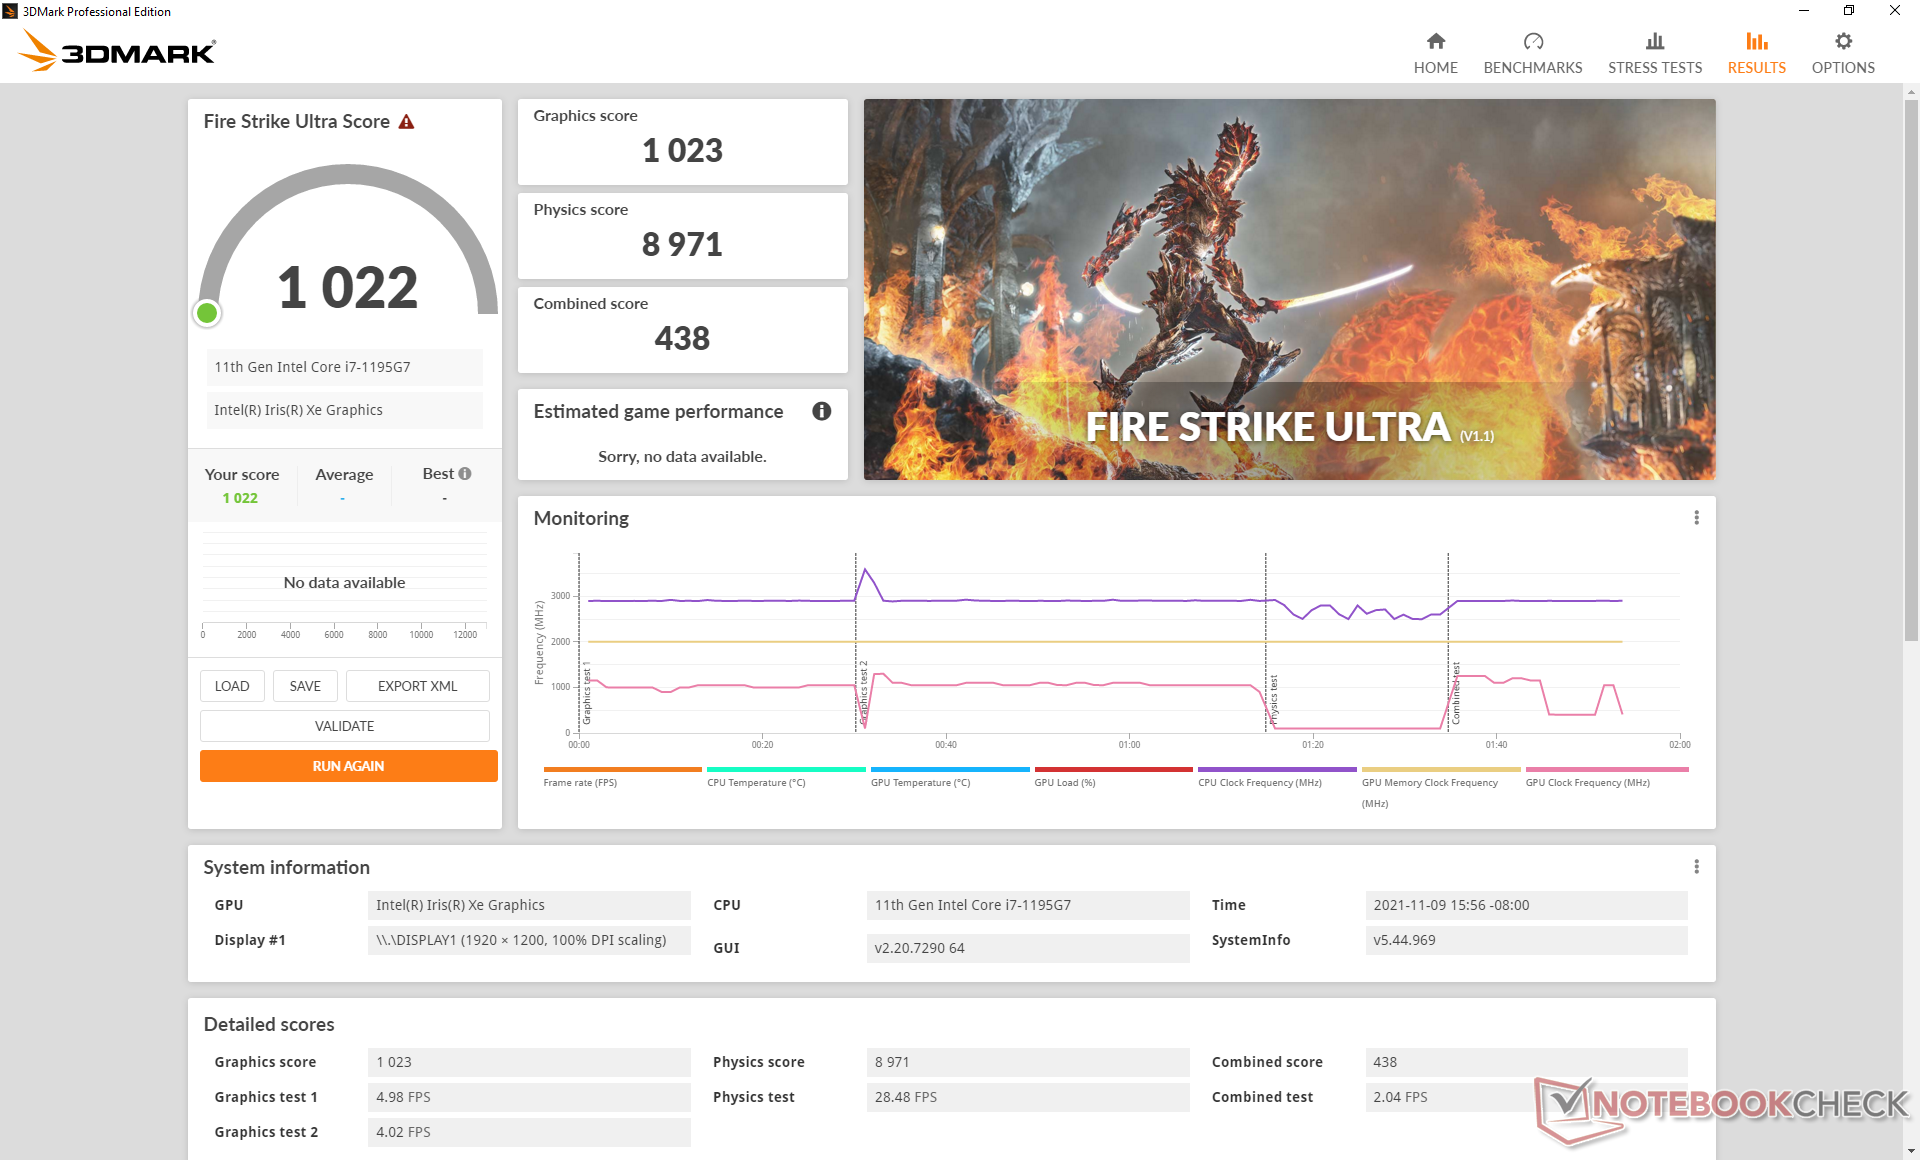
在BIOS默认功率水平下的图形性能令人失望,比平均速度慢30%至35%。 Iris Xe 96 EUs在我们的数据库中。幸运的是,在较高的BIOS电源水平上运行将提高我们的GPU,使其符合我们期望的Iris Xe 96 EUs的平均性能。例如,在较高的功率级别上运行3DMark 11,将返回6350分的GPU得分,而如果在默认的功率级别上则只有2942分。在游戏时也可以观察到类似的差异。
| 3DMark Performance rating - Percent | |
| MSI Prestige 15 A10SC | |
| Asus Zenbook 14X UX5400E -1! | |
| Dell XPS 13 9310 2-in-1 | |
| Average Intel Iris Xe Graphics G7 96EUs | |
| GPD Win 3 | |
| Lenovo ThinkPad X12 20UVS03G00 | |
| GPD Win Max 2021 | |
| HP Envy 13-ba0001ng | |
| Lenovo Yoga 6 13ALC6 | |
| Asus ZenBook 14 UX434FL-DB77 | |
| Infinix INBook X1 Pro | |
| GPD Pocket 3 | |
| Asus VivoBook S13 S333JA-DS51 | |
| 3DMark 11 - 1280x720 Performance GPU | |
| MSI Prestige 15 A10SC | |
| Dell XPS 13 9310 2-in-1 | |
| Average Intel Iris Xe Graphics G7 96EUs (2867 - 7676, n=209) | |
| GPD Win 3 | |
| Lenovo Yoga 6 13ALC6 | |
| GPD Win Max 2021 | |
| HP Envy 13-ba0001ng | |
| Lenovo ThinkPad X12 20UVS03G00 | |
| Infinix INBook X1 Pro | |
| Asus ZenBook 14 UX434FL-DB77 | |
| GPD Pocket 3 | |
| Asus VivoBook S13 S333JA-DS51 | |
| 3DMark 11 Performance | 3112 points | |
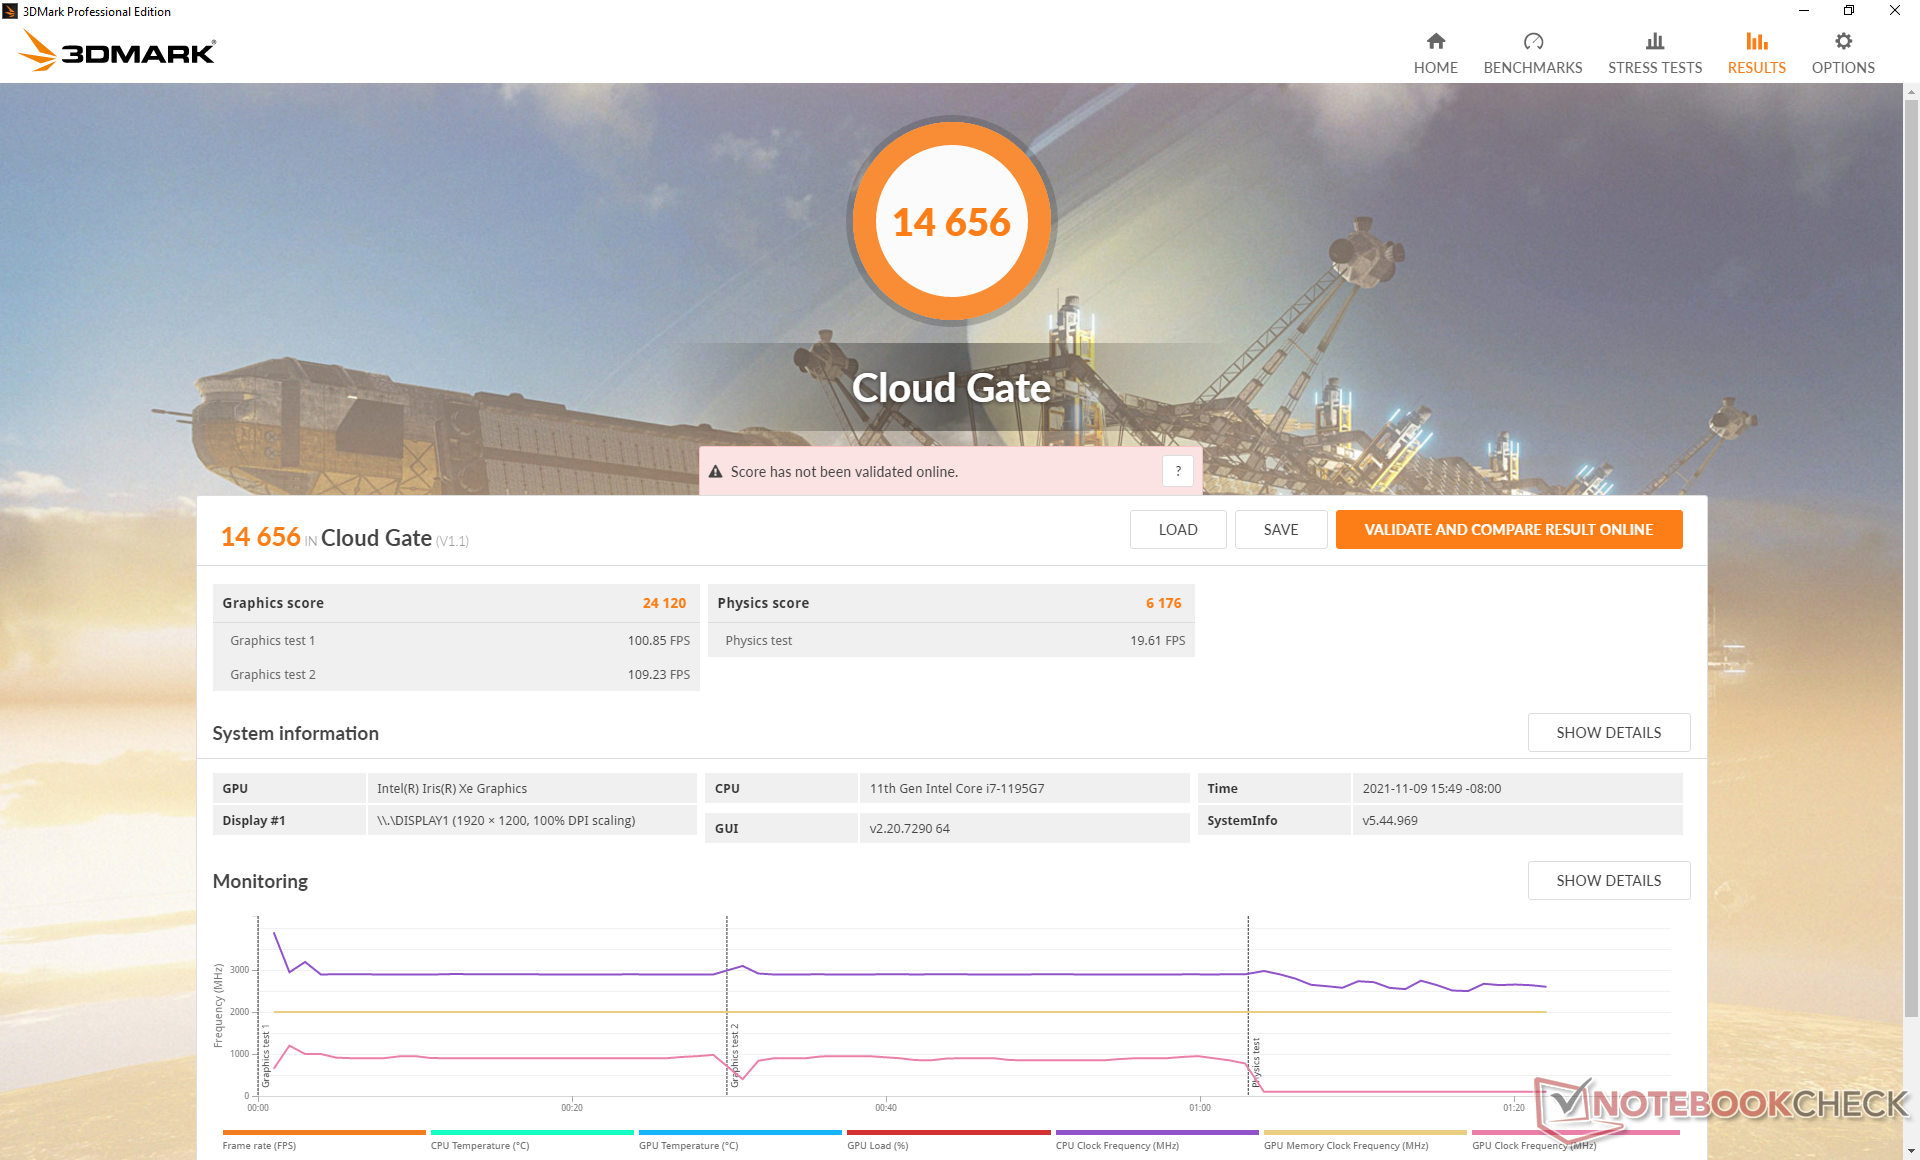
| 3DMark Cloud Gate Standard Score | 14656 points | |
| 3DMark Fire Strike Score | 2770 points | |
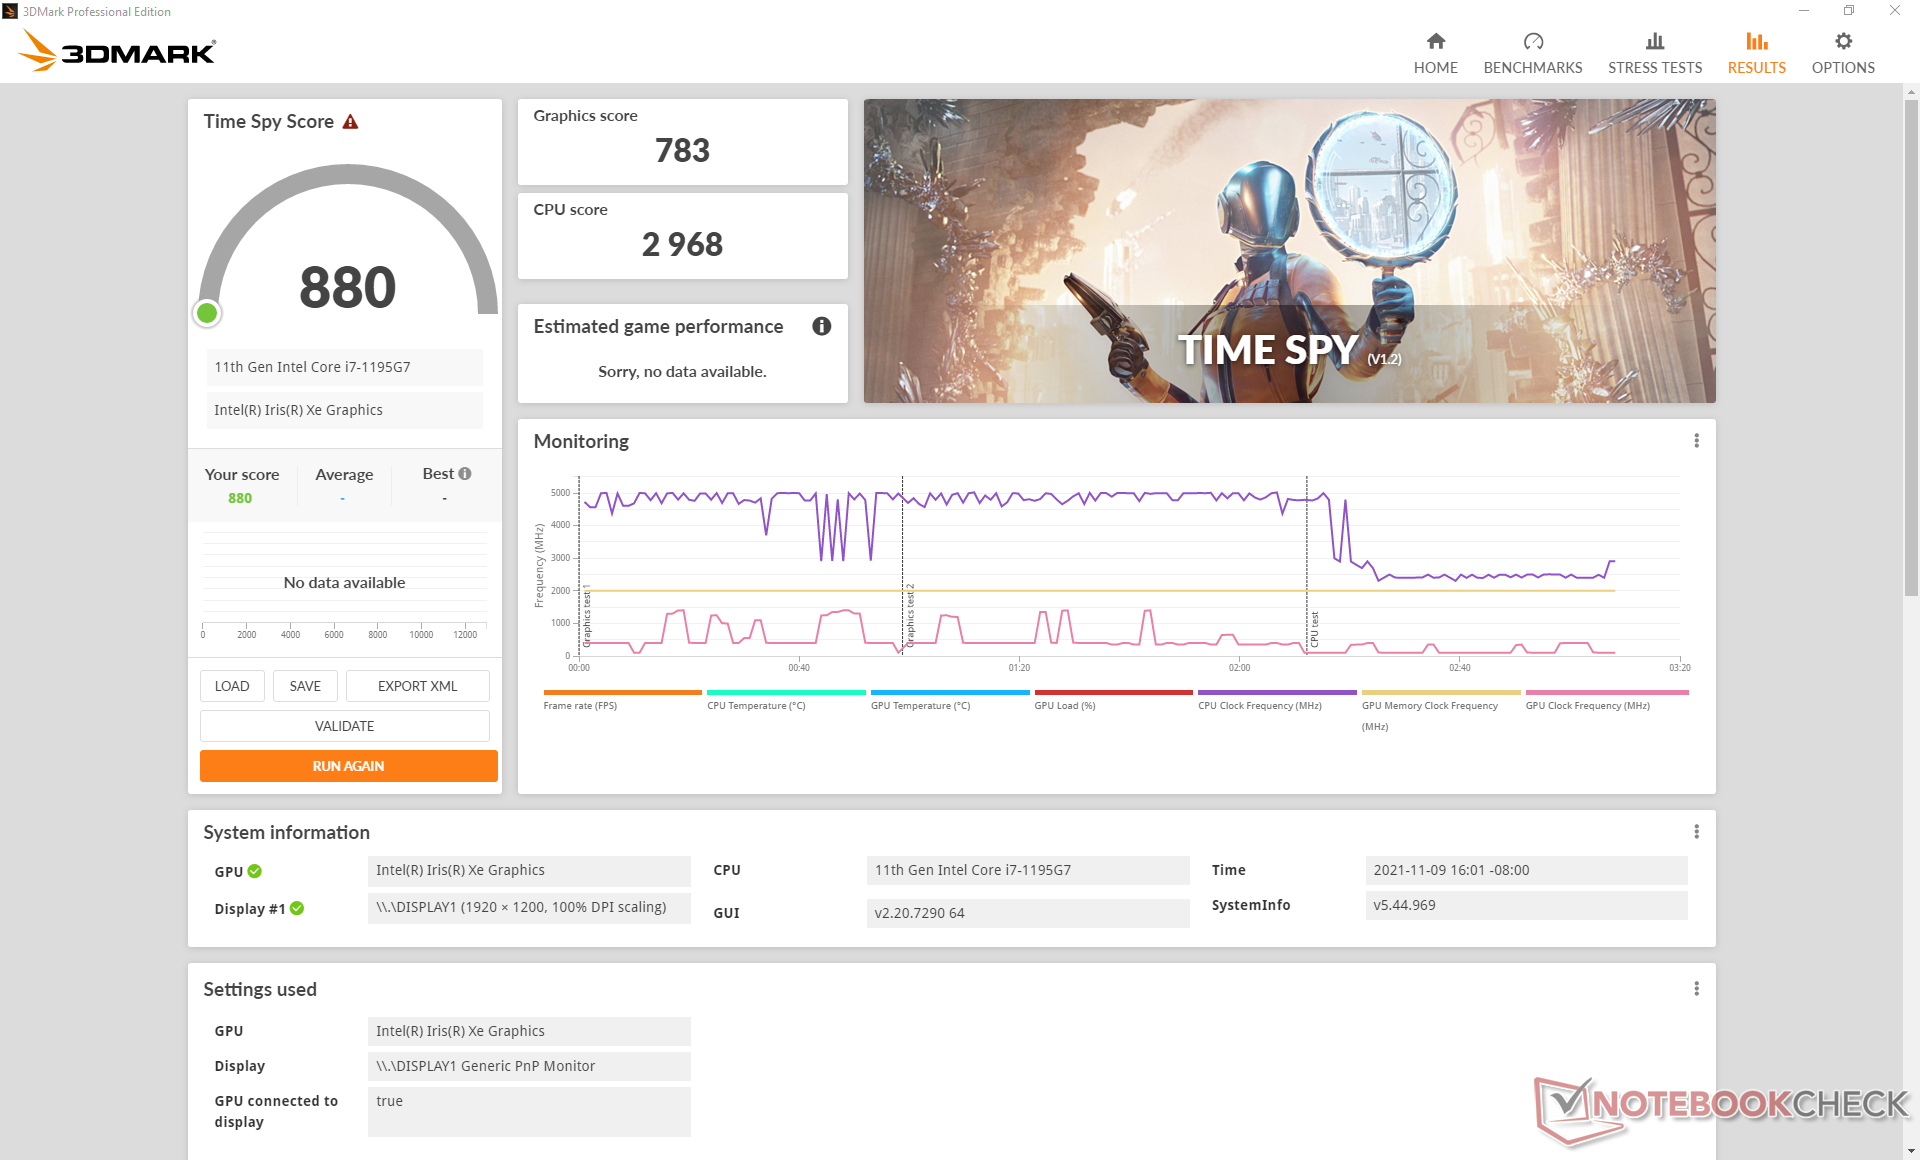
| 3DMark Time Spy Score | 880 points | |
Help | ||
| Final Fantasy XV Benchmark | |
| 1280x720 Lite Quality | |
| HP Spectre x360 14t-ea000 | |
| Average Intel Iris Xe Graphics G7 96EUs (14.9 - 56.5, n=189) | |
| GPD Win 3 | |
| Dell XPS 13 9310 2-in-1 | |
| GPD Win Max 2021 | |
| Asus ZenBook 14 UX434FL-DB77 | |
| Lenovo Yoga 6 13ALC6 | |
| Lenovo Yoga Slim 7 14ITL05 82A300CNGE | |
| GPD Pocket 3 | |
| Infinix INBook X1 Pro | |
| Asus VivoBook S13 S333JA-DS51 | |
| 1920x1080 Standard Quality | |
| HP Spectre x360 14t-ea000 | |
| Average Intel Iris Xe Graphics G7 96EUs (10.5 - 31.2, n=185) | |
| Dell XPS 13 9310 2-in-1 | |
| GPD Win 3 | |
| GPD Win Max 2021 | |
| Lenovo Yoga Slim 7 14ITL05 82A300CNGE | |
| GPD Pocket 3 | |
| Lenovo Yoga 6 13ALC6 | |
| Asus ZenBook 14 UX434FL-DB77 | |
| Infinix INBook X1 Pro | |
| Asus VivoBook S13 S333JA-DS51 | |
| 1920x1080 High Quality | |
| HP Spectre x360 14t-ea000 | |
| Lenovo Yoga Slim 7 14ITL05 82A300CNGE | |
| Average Intel Iris Xe Graphics G7 96EUs (8.15 - 27.8, n=178) | |
| GPD Win 3 | |
| Dell XPS 13 9310 2-in-1 | |
| GPD Win Max 2021 | |
| GPD Pocket 3 | |
| Lenovo Yoga 6 13ALC6 | |
| Asus ZenBook 14 UX434FL-DB77 | |
| Infinix INBook X1 Pro | |
| Asus VivoBook S13 S333JA-DS51 | |
Witcher 3 FPS Chart
| low | med. | high | ultra | |
|---|---|---|---|---|
| GTA V (2015) | 66.1 | 61.3 | 20.6 | 8.99 |
| The Witcher 3 (2015) | 45.3 | 36.8 | 21.2 | 10.5 |
| Dota 2 Reborn (2015) | 95.9 | 68.9 | 45.4 | 41.2 |
| Final Fantasy XV Benchmark (2018) | 27.7 | 16.8 | 11.9 | |
| X-Plane 11.11 (2018) | 22 | 18.8 | 19 | |
| Far Cry 5 (2018) | 44 | 28 | 25 | 24 |
| Strange Brigade (2018) | 70.6 | 32.4 | 26.7 | 21.8 |
排放
系统噪音 - 负载时的高音调
在触摸板旁边有一个涡轮风扇模式键。如果启用,在浏览网页或播放视频时,风扇的脉冲频率将高达31.4 dB(A),而静音背景为23.4 dB(A)。因此,建议在运行低负载或在对噪音敏感的环境中工作时关闭该模式。
在运行游戏等高负荷时,即使在较高的BIOS功率水平设置下,风扇噪音最大也只有不到41 dB(A)。虽然风扇的声音有些高,但至少在类似条件下,它总体上比Win Max或Win 3更安静。
Noise level
| Idle |
| 24.3 / 25.6 / 25.6 dB(A) |
| DVD |
| 40.7 / dB(A) |
| Load |
| 38.3 / 40.7 dB(A) |
 | ||
30 dB silent 40 dB(A) audible 50 dB(A) loud |
||
min: | ||
| GPD Pocket 3 Iris Xe G7 96EUs, i7-1195G7, BiWin NQ200 1TB CNF82GS1D00-1TB | GPD Win Max 2021 Vega 8, R7 4800U, BIWIN NS200 512GB CNF82GS1G00-512 | GPD Win 3 Iris Xe G7 80EUs, i5-1135G7, BIWIN NS200 1TB CNF82GS1G02-1TB | Lenovo ThinkPad X12 20UVS03G00 Iris Xe G7 96EUs, i7-1160G7, Toshiba BG4 KBG40ZNT512G | Dell XPS 13 9310 2-in-1 Iris Xe G7 96EUs, i7-1165G7, Toshiba BG4 KBG40ZPZ512G | HP Spectre x360 14t-ea000 Iris Xe G7 96EUs, i7-1165G7, Samsung SSD PM981a MZVLB512HBJQ | |
|---|---|---|---|---|---|---|
| Noise | -11% | -13% | 3% | 1% | 3% | |
| off / environment * (dB) | 23.4 | 23.3 -0% | 27.4 -17% | 25.1 -7% | 24.3 -4% | 25.8 -10% |
| Idle Minimum * (dB) | 24.3 | 26.6 -9% | 29.1 -20% | 25.1 -3% | 24.8 -2% | 25.9 -7% |
| Idle Average * (dB) | 25.6 | 26.6 -4% | 29.1 -14% | 25.1 2% | 24.8 3% | 25.9 -1% |
| Idle Maximum * (dB) | 25.6 | 26.6 -4% | 29.1 -14% | 26 -2% | 24.8 3% | 25.9 -1% |
| Load Average * (dB) | 38.3 | 46.9 -22% | 40.7 -6% | 34.6 10% | 38 1% | 26.4 31% |
| Witcher 3 ultra * (dB) | 40.7 | 49 -20% | 42.8 -5% | 34.6 15% | 38 7% | 36.9 9% |
| Load Maximum * (dB) | 40.7 | 49.2 -21% | 46.3 -14% | 37 9% | 41.5 -2% | 41.5 -2% |
* ... smaller is better
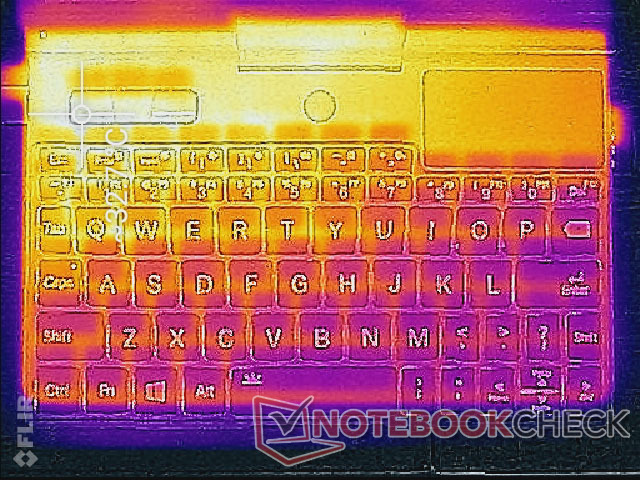
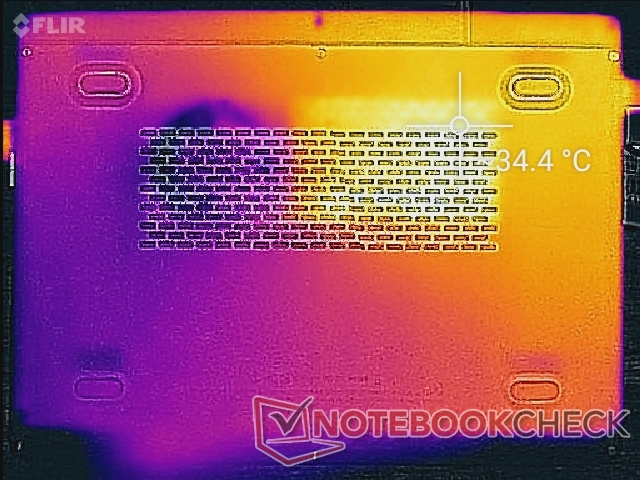
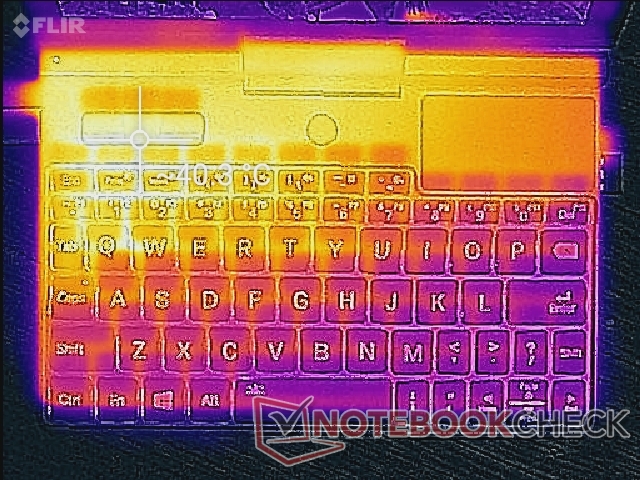
温度
热点更多地集中在机箱的后部,以便尽可能地保持键盘按键的温度。靠近右上角的专用鼠标按键在运行游戏等高要求的负载时可以达到40℃以上。
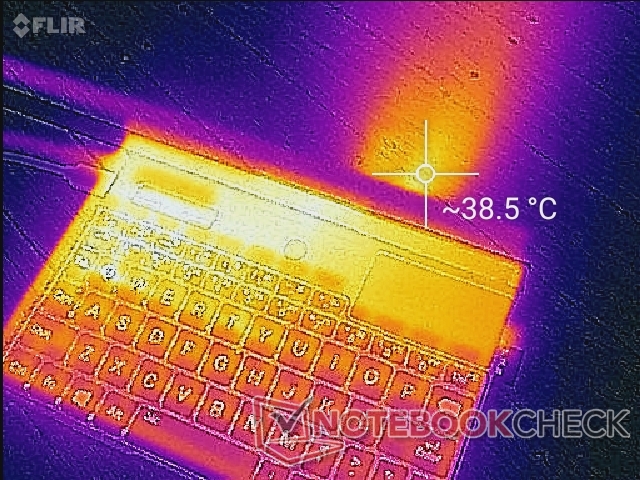
(±) The maximum temperature on the upper side is 40.4 °C / 105 F, compared to the average of 38 °C / 100 F, ranging from 26.6 to 55 °C for the class Handheld / UMPC.
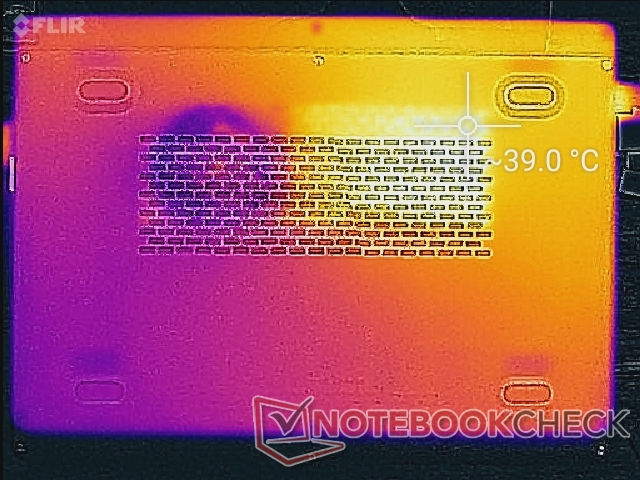
(+) The bottom heats up to a maximum of 39.4 °C / 103 F, compared to the average of 37.1 °C / 99 F
(+) In idle usage, the average temperature for the upper side is 29.4 °C / 85 F, compared to the device average of 32.8 °C / 91 F.
(+) The palmrests and touchpad are cooler than skin temperature with a maximum of 31.8 °C / 89.2 F and are therefore cool to the touch.
(±) The average temperature of the palmrest area of similar devices was 32.2 °C / 90 F (+0.4 °C / 0.8 F).
| GPD Pocket 3 Intel Core i7-1195G7, Intel Iris Xe Graphics G7 96EUs | GPD Win Max 2021 AMD Ryzen 7 4800U, AMD Radeon RX Vega 8 (Ryzen 4000/5000) | Lenovo ThinkPad X12 20UVS03G00 Intel Core i7-1160G7, Intel Iris Xe Graphics G7 96EUs | Dell XPS 13 9310 2-in-1 Intel Core i7-1165G7, Intel Iris Xe Graphics G7 96EUs | HP Spectre x360 14t-ea000 Intel Core i7-1165G7, Intel Iris Xe Graphics G7 96EUs | HP Envy 13-ba0001ng Intel Core i7-10510U, NVIDIA GeForce MX350 | |
|---|---|---|---|---|---|---|
| Heat | 10% | 11% | 1% | -1% | 16% | |
| Maximum Upper Side * (°C) | 40.4 | 38 6% | 39 3% | 51 -26% | 40.4 -0% | 38 6% |
| Maximum Bottom * (°C) | 39.4 | 36.4 8% | 41.7 -6% | 45.4 -15% | 52.8 -34% | 37.1 6% |
| Idle Upper Side * (°C) | 32.6 | 30 8% | 25.6 21% | 24.4 25% | 27.2 17% | 24.5 25% |
| Idle Bottom * (°C) | 34.4 | 28 19% | 25.6 26% | 27.4 20% | 29.2 15% | 25 27% |
* ... smaller is better
压力测试
我们在BIOS默认的功率水平上对系统进行强调,以显示与更高的功率水平设置相比,它可以慢多少。例如,运行Prime95,显示CPU稳定在1.5至1.8 GHz,而配备类似Core i7 CPU的XPG Xenia 14则为3.2 GHz。我们的Iris Xe GPU也将稳定在500 MHz,而上述XPG在运行时为1300 MHz。 Witcher 3.
用电池运行不会影响性能。在电池电源和较高的BIOS电源水平上进行的3DMark 11测试将返回物理和图形分数,分别为9082和6618分,而在主电源上则为8889和6350分。
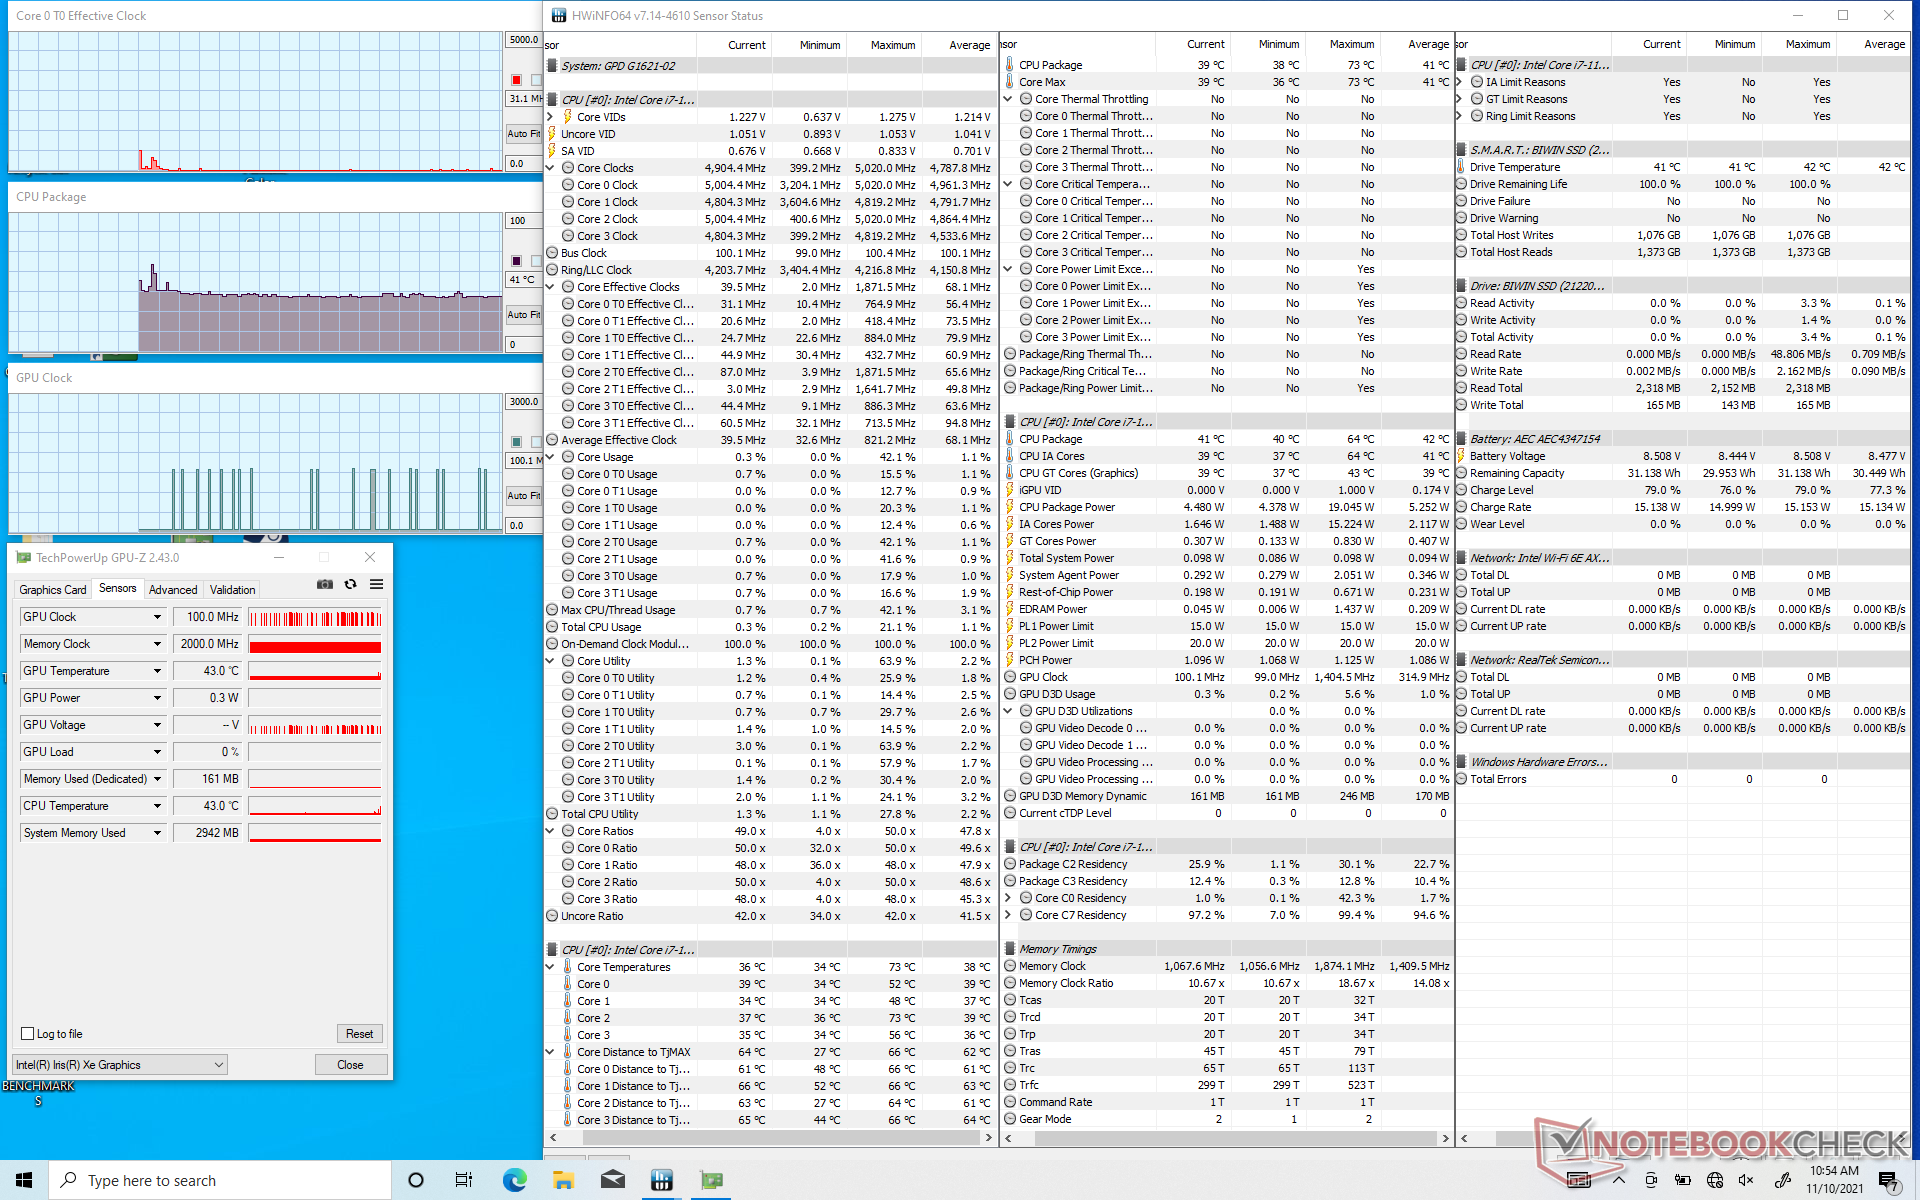
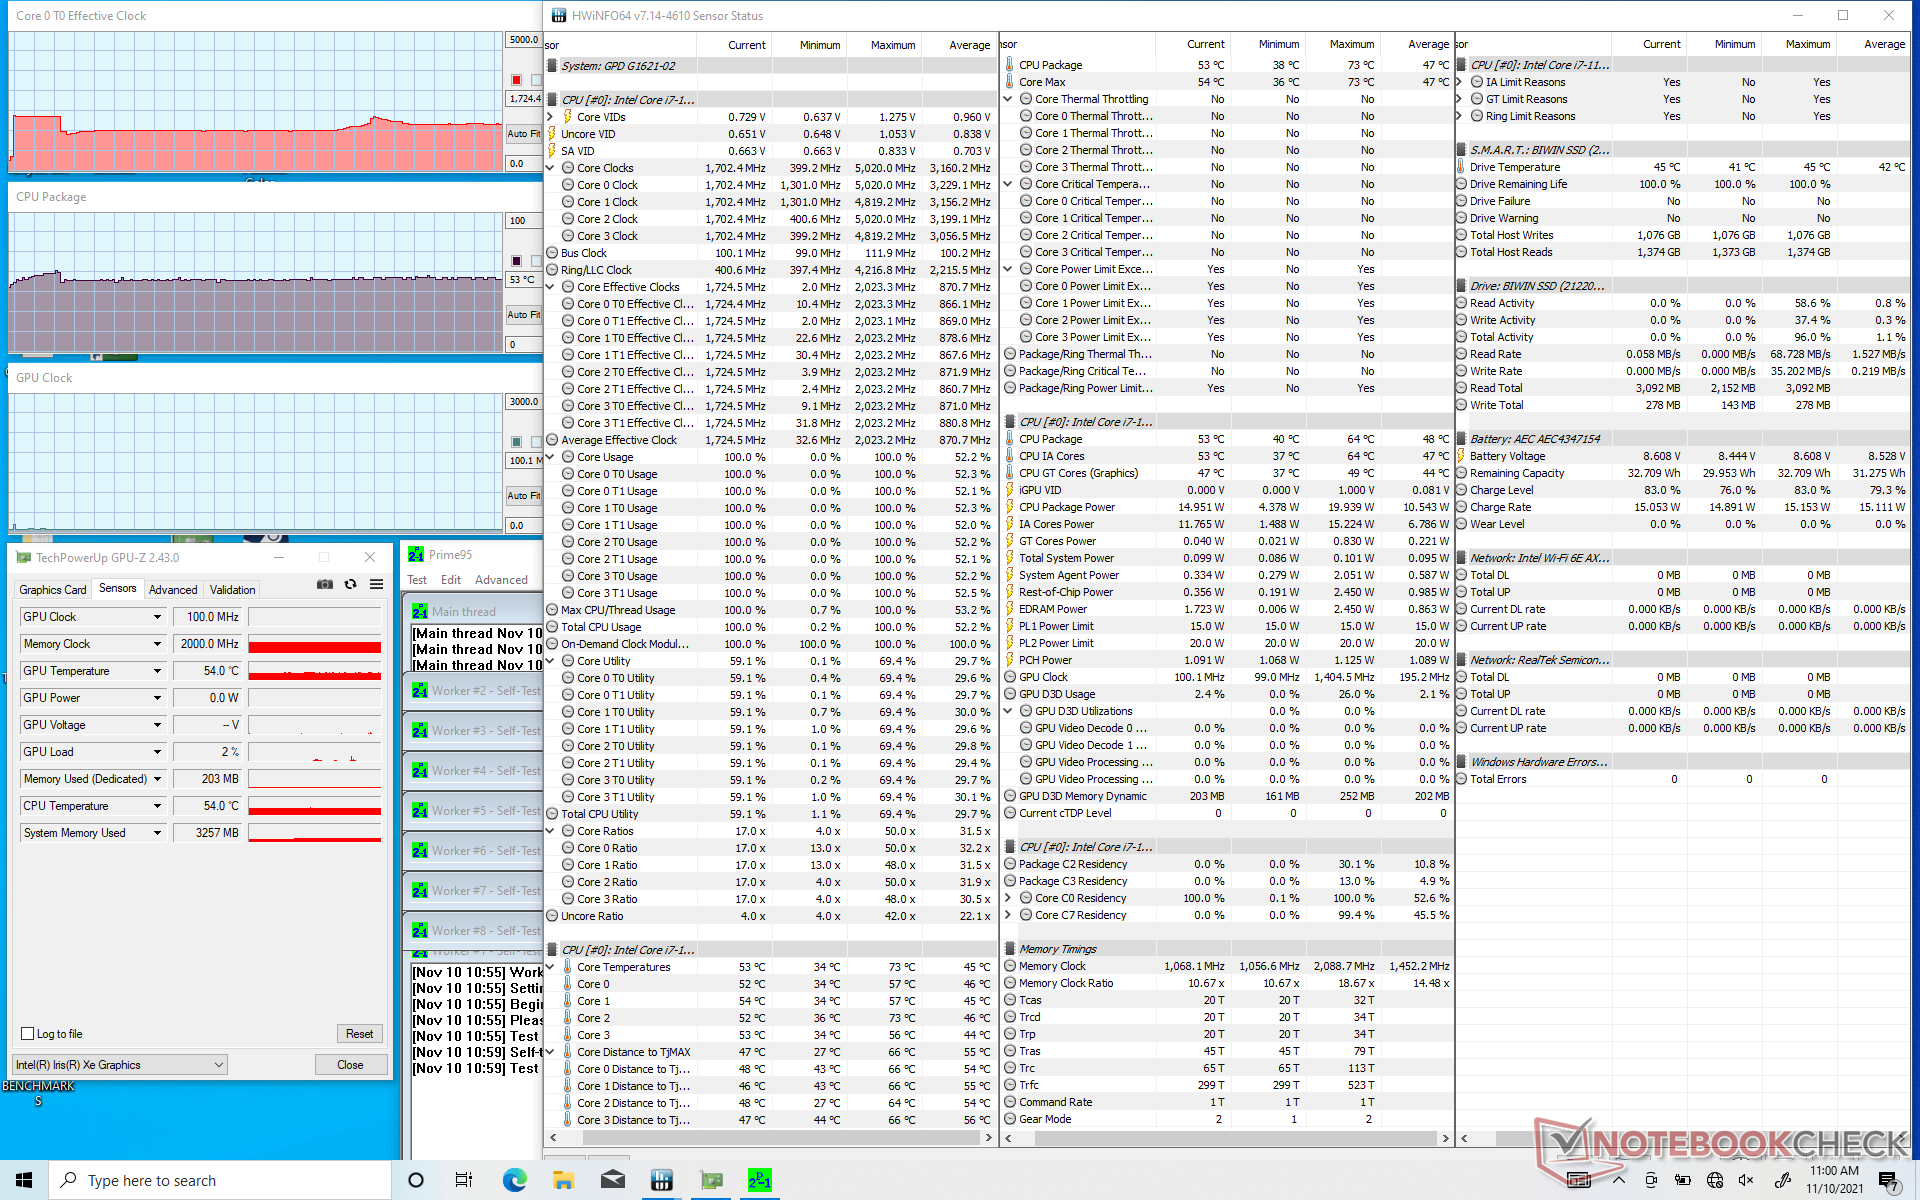
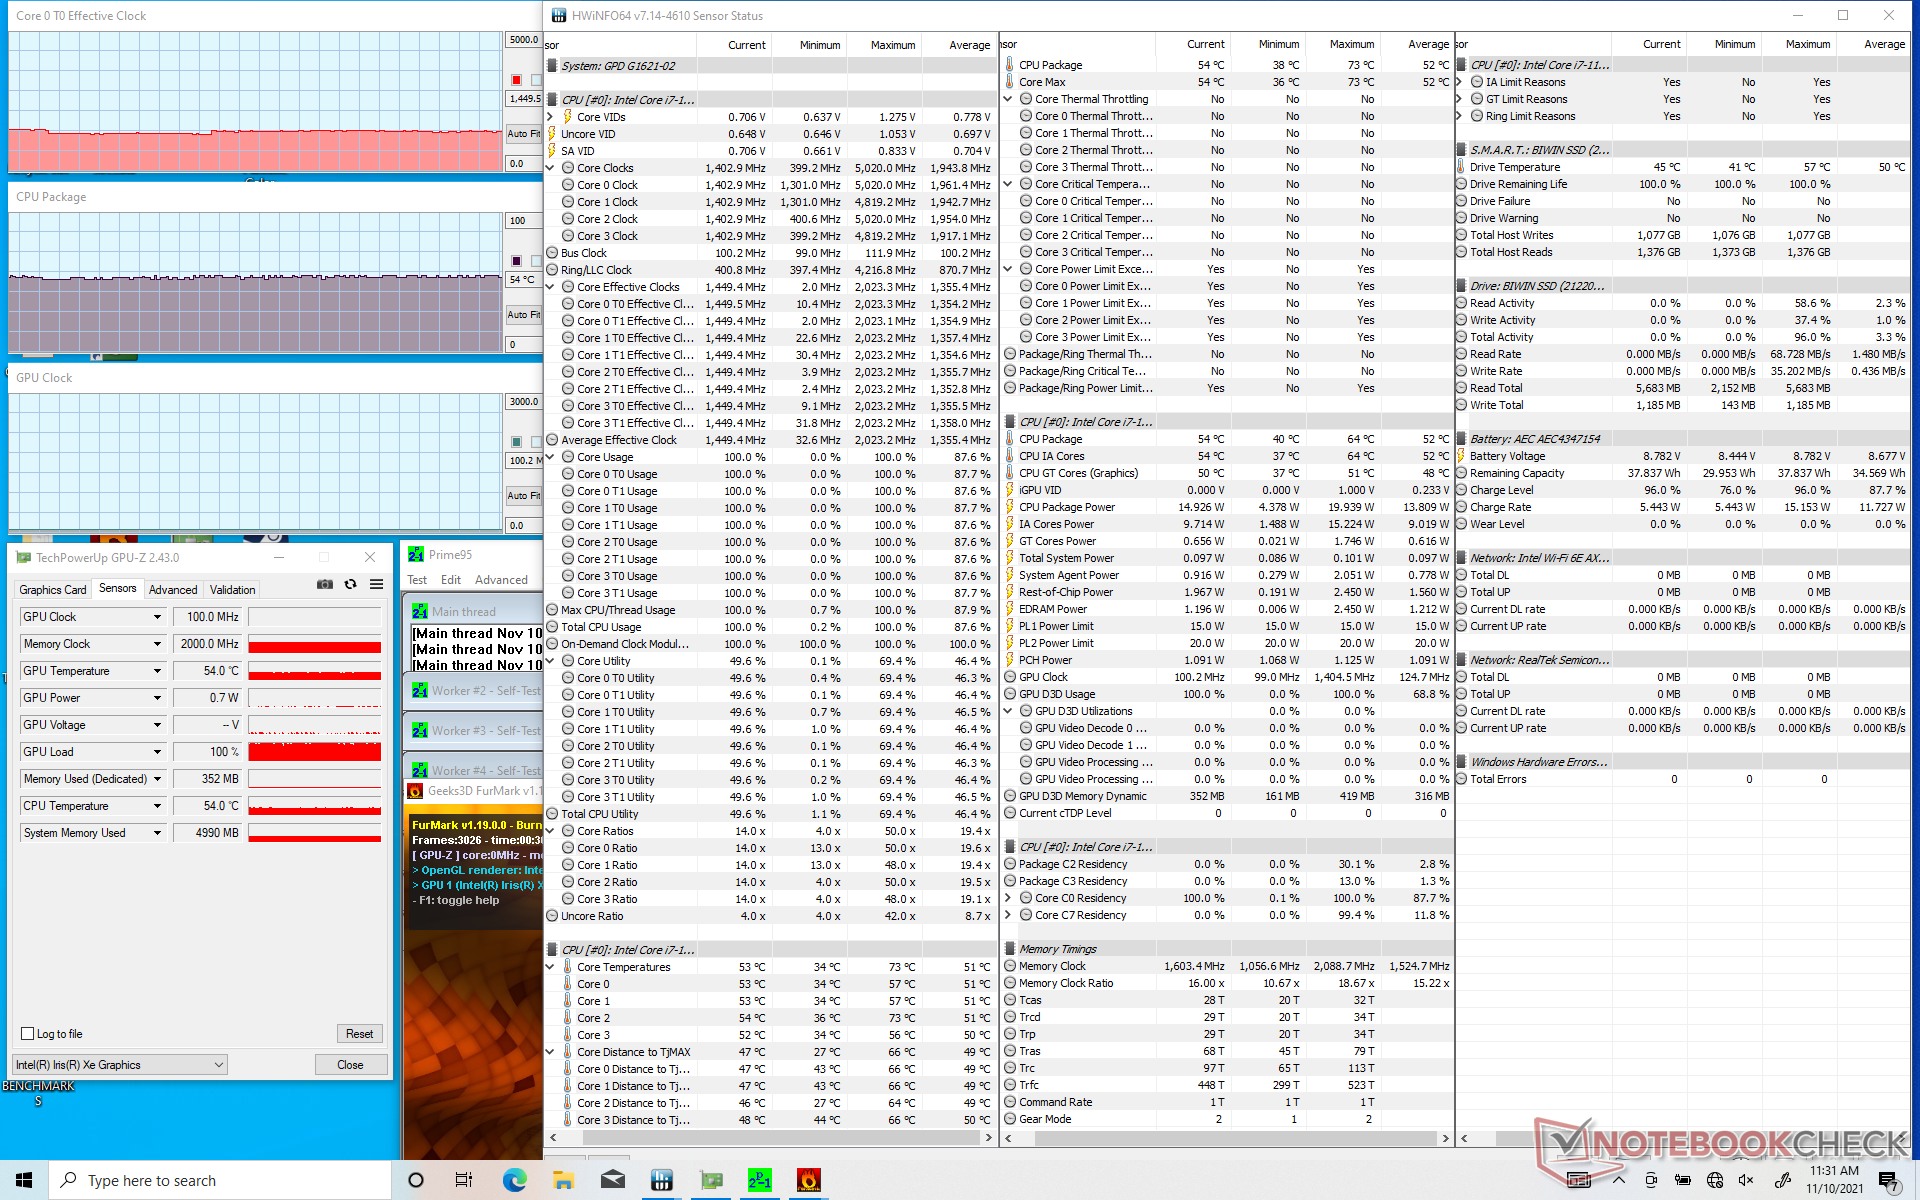
| CPU时钟(GHz) | GPU时钟(MHz) | CPU平均温度(℃) | |
| 系统空闲(默认功率水平) | -- | -- | 41 |
| Prime95压力(默认功率水平) | 1.5 - 1.8 | -- | 53 |
| Prime95 + FurMark压力(默认功率水平) | 1.5 | 100 | 54 |
| Witcher 3 压力 (默认功率水平) | 0.5 - 1.5 | 500 | 53 |
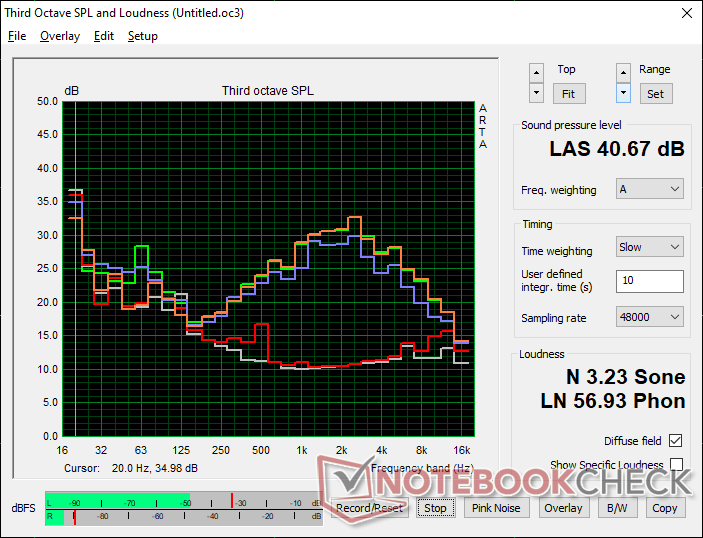
扬声器 - 高音量,低质量
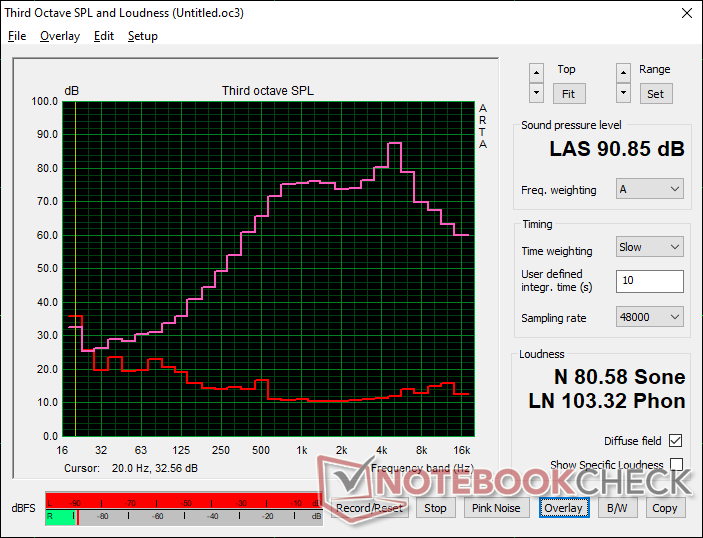
GPD Pocket 3 audio analysis
(+) | speakers can play relatively loud (90.9 dB)
Bass 100 - 315 Hz
(-) | nearly no bass - on average 28.6% lower than median
(+) | bass is linear (6.5% delta to prev. frequency)
Mids 400 - 2000 Hz
(+) | balanced mids - only 4.3% away from median
(+) | mids are linear (5.2% delta to prev. frequency)
Highs 2 - 16 kHz
(±) | higher highs - on average 6.4% higher than median
(±) | linearity of highs is average (8.1% delta to prev. frequency)
Overall 100 - 16.000 Hz
(±) | linearity of overall sound is average (20.2% difference to median)
Compared to same class
» 70% of all tested devices in this class were better, 13% similar, 17% worse
» The best had a delta of 12%, average was 17%, worst was 23%
Compared to all devices tested
» 52% of all tested devices were better, 8% similar, 39% worse
» The best had a delta of 4%, average was 24%, worst was 134%
Apple MacBook 12 (Early 2016) 1.1 GHz audio analysis
(+) | speakers can play relatively loud (83.6 dB)
Bass 100 - 315 Hz
(±) | reduced bass - on average 11.3% lower than median
(±) | linearity of bass is average (14.2% delta to prev. frequency)
Mids 400 - 2000 Hz
(+) | balanced mids - only 2.4% away from median
(+) | mids are linear (5.5% delta to prev. frequency)
Highs 2 - 16 kHz
(+) | balanced highs - only 2% away from median
(+) | highs are linear (4.5% delta to prev. frequency)
Overall 100 - 16.000 Hz
(+) | overall sound is linear (10.2% difference to median)
Compared to same class
» 7% of all tested devices in this class were better, 2% similar, 91% worse
» The best had a delta of 5%, average was 18%, worst was 53%
Compared to all devices tested
» 5% of all tested devices were better, 1% similar, 94% worse
» The best had a delta of 4%, average was 24%, worst was 134%
能源管理
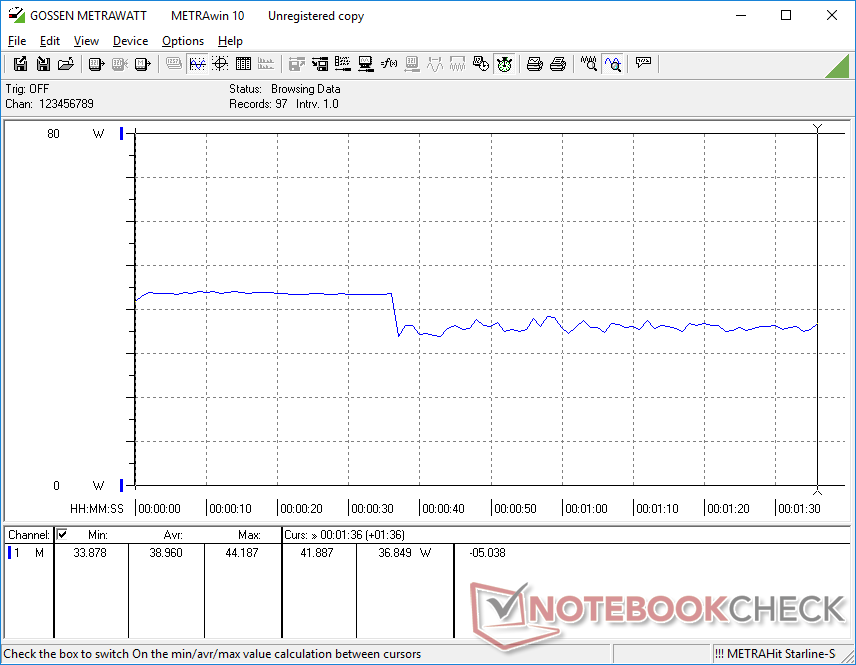
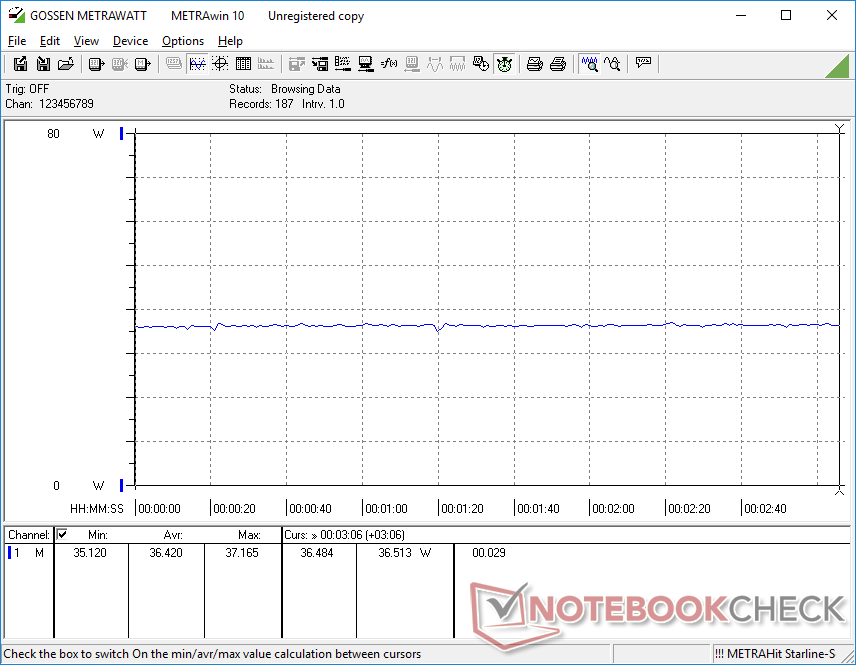
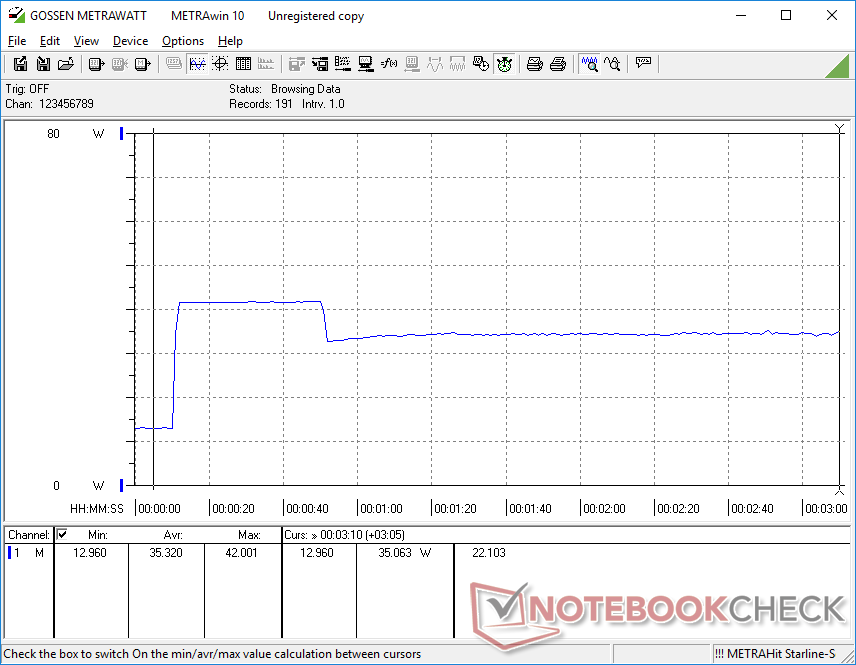
消耗功率
我们下面的功耗读数是在较高的BIOS功率水平设置下进行的。在桌面上空转时的总体消耗量比预期的要高,为9瓦至12瓦。否则,在运行游戏等高负荷时,消耗量仍然稳定在36瓦至42瓦之间。
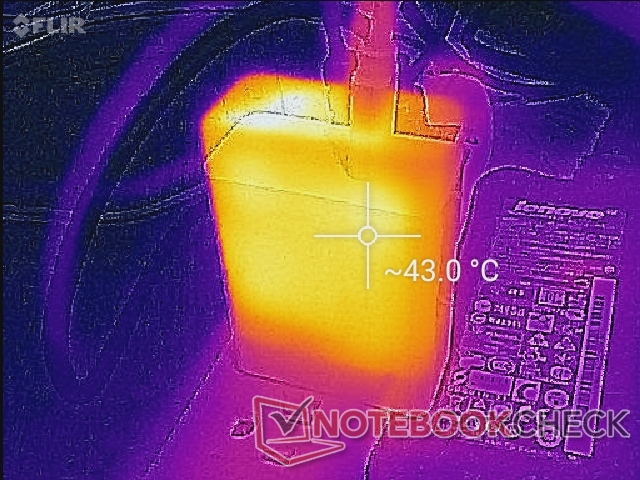
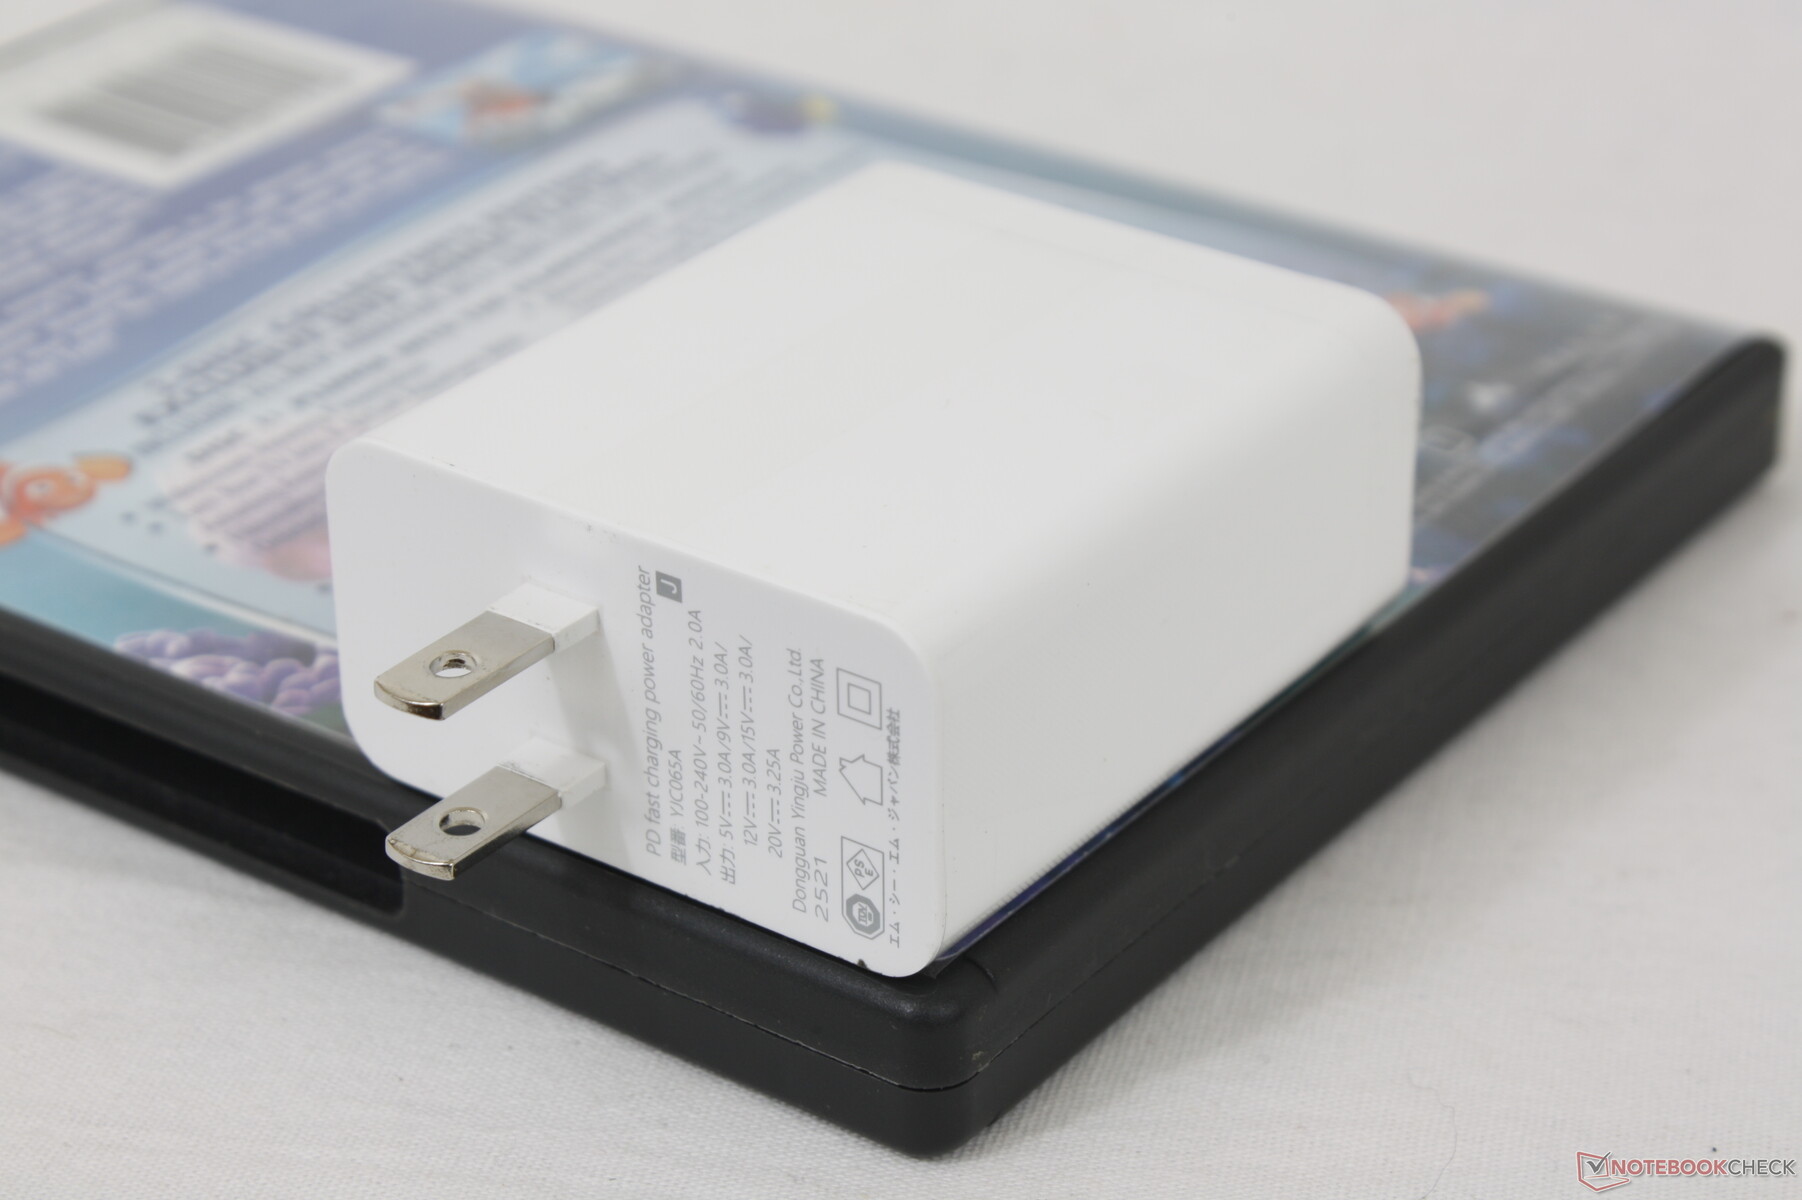
小型USB-C交流适配器(约6.5 x 5.5 x 2.8厘米)的额定输出功率高达65瓦,对Pocket 3来说是绰绰有余。

| Off / Standby | |
| Idle | |
| Load |
|
Key:
min: | |
| GPD Pocket 3 i7-1195G7, Iris Xe G7 96EUs, BiWin NQ200 1TB CNF82GS1D00-1TB, IPS, 1920x1200, 8" | GPD Win Max 2021 R7 4800U, Vega 8, BIWIN NS200 512GB CNF82GS1G00-512, IPS, 1280x800, 8" | GPD Win 3 i5-1135G7, Iris Xe G7 80EUs, BIWIN NS200 1TB CNF82GS1G02-1TB, IPS, 1280x720, 5.5" | Lenovo ThinkPad X12 20UVS03G00 i7-1160G7, Iris Xe G7 96EUs, Toshiba BG4 KBG40ZNT512G, a-Si IPS LED, 1920x1280, 12.3" | Dell XPS 13 9310 2-in-1 i7-1165G7, Iris Xe G7 96EUs, Toshiba BG4 KBG40ZPZ512G, IPS, 1920x1200, 13.4" | HP Spectre x360 14t-ea000 i7-1165G7, Iris Xe G7 96EUs, Samsung SSD PM981a MZVLB512HBJQ, IPS, 1920x1280, 13.5" | |
|---|---|---|---|---|---|---|
| Power Consumption | 22% | 36% | 22% | 29% | 21% | |
| Idle Minimum * (Watt) | 9.6 | 5.2 46% | 2.9 70% | 4 58% | 2.6 73% | 3 69% |
| Idle Average * (Watt) | 11 | 6.5 41% | 4.5 59% | 5.9 46% | 6.4 42% | 5.1 54% |
| Idle Maximum * (Watt) | 11.8 | 7.4 37% | 4.5 62% | 8.3 30% | 7.7 35% | 6.4 46% |
| Load Average * (Watt) | 39 | 37.2 5% | 38.5 1% | 30.1 23% | 29.9 23% | 39.6 -2% |
| Witcher 3 ultra * (Watt) | 36.4 | 38.1 -5% | 28.9 21% | 30.8 15% | 32.2 12% | 39.6 -9% |
| Load Maximum * (Watt) | 42 | 39 7% | 41.4 1% | 59 -40% | 47.5 -13% | 56.2 -34% |
* ... smaller is better
Power Consumption Witcher 3 / Stresstest
电池寿命--对于尺寸和性能来说很好
考虑到小的外形因素,电池容量很小,只有38Wh,这是可以理解的。运行时间也比许多笔记本电脑短,实际使用WLAN的时间只有6个小时,而像XPS 13或Spectre 13这样配备类似的Tiger Lake-U CPU的机型则为10小时或以上。
使用附带的适配器从空电到满电的充电时间非常慢,大约为2.5小时,而大多数笔记本电脑为1.5小时。
| GPD Pocket 3 i7-1195G7, Iris Xe G7 96EUs, 39 Wh | GPD Win Max 2021 R7 4800U, Vega 8, 57 Wh | GPD Win 3 i5-1135G7, Iris Xe G7 80EUs, 44 Wh | Lenovo ThinkPad X12 20UVS03G00 i7-1160G7, Iris Xe G7 96EUs, 42 Wh | Dell XPS 13 9310 2-in-1 i7-1165G7, Iris Xe G7 96EUs, 51 Wh | HP Spectre x360 14t-ea000 i7-1165G7, Iris Xe G7 96EUs, 66 Wh | |
|---|---|---|---|---|---|---|
| Battery runtime | 55% | 88% | 37% | 78% | 97% | |
| WiFi v1.3 (h) | 6 | 9.3 55% | 11.3 88% | 8.2 37% | 10.7 78% | 11.8 97% |
| Load (h) | 1.3 | 2 | 3.4 | 2.4 | ||
| H.264 (h) | 10 | |||||
| Reader / Idle (h) | 25.4 | 36.4 |
Pros
Cons
结论 - 比预期的好得多
GPD提供相对小众的产品,如搭载AMD的PC游戏 Win Max掌上电脑或更小的5.5英寸英特尔驱动的 Win 3 UMPC带滑出式键盘。Pocket 3是该公司最通用的产品,其性能和功能足以补充甚至取代日常超极本。这款超便携系统的几乎所有东西都运作得出奇的好,从它的咔嗒声键盘到它的各种端口和明亮的显示屏,给人留下了极佳的印象。
如果你追求性能,那么一定要通过BIOS启用更高的功率限制,以完全解锁Tiger Lake-U CPU。否则,该处理器的性能将大大降低,特别是在图形方面。
Pocket 3是GPD迄今为止在生产力、人体工程学和可用性方面最好的产品。它提供的性能和功能与许多两倍于它的超极本大致相同。
有几个特点可以改进。特别是旋转铰链可以更强壮、更坚硬,以获得更好的寿命。同时,不对称的网络摄像头定位感觉像是事后才想到的,而尖锐的扬声器对于多媒体用途来说是不令人满意的。由于散热不良,PCIe4固态硬盘的性能很快就被扼杀了,考虑到电池容量小,系统充电速度慢是意料之外的。第二个USB-C端口将使该系统更加通用,特别是在对接方面。
价格和可用性
见官方Indiegogo页面了解更多关于价格层级和发布日期的信息。
GPD Pocket 3
- 11/16/2021 v7 (old)
Allen Ngo
Price comparison

