


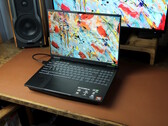
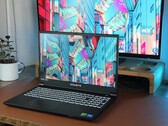
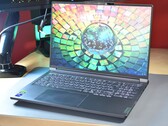
华硕 TUF Gaming A16 评论:酷炫、安静、经济实惠的游戏笔记本电脑,弱点突出但可行
Ryzen AI 9 HX 370 加上 RTX 4060 以及分辨率为 1200p 的 144 Hz 显示屏是华硕 TUF Gaming A16 的主要亮点。我们对这款价格相对实惠的 16 英寸游戏笔记本电脑进行了测试,看看它在竞争中的表现如何。
AMD Ryzen AI 9 HX 370, NVIDIA GeForce RTX 4060 Laptop GPU, 16", 2.2 kg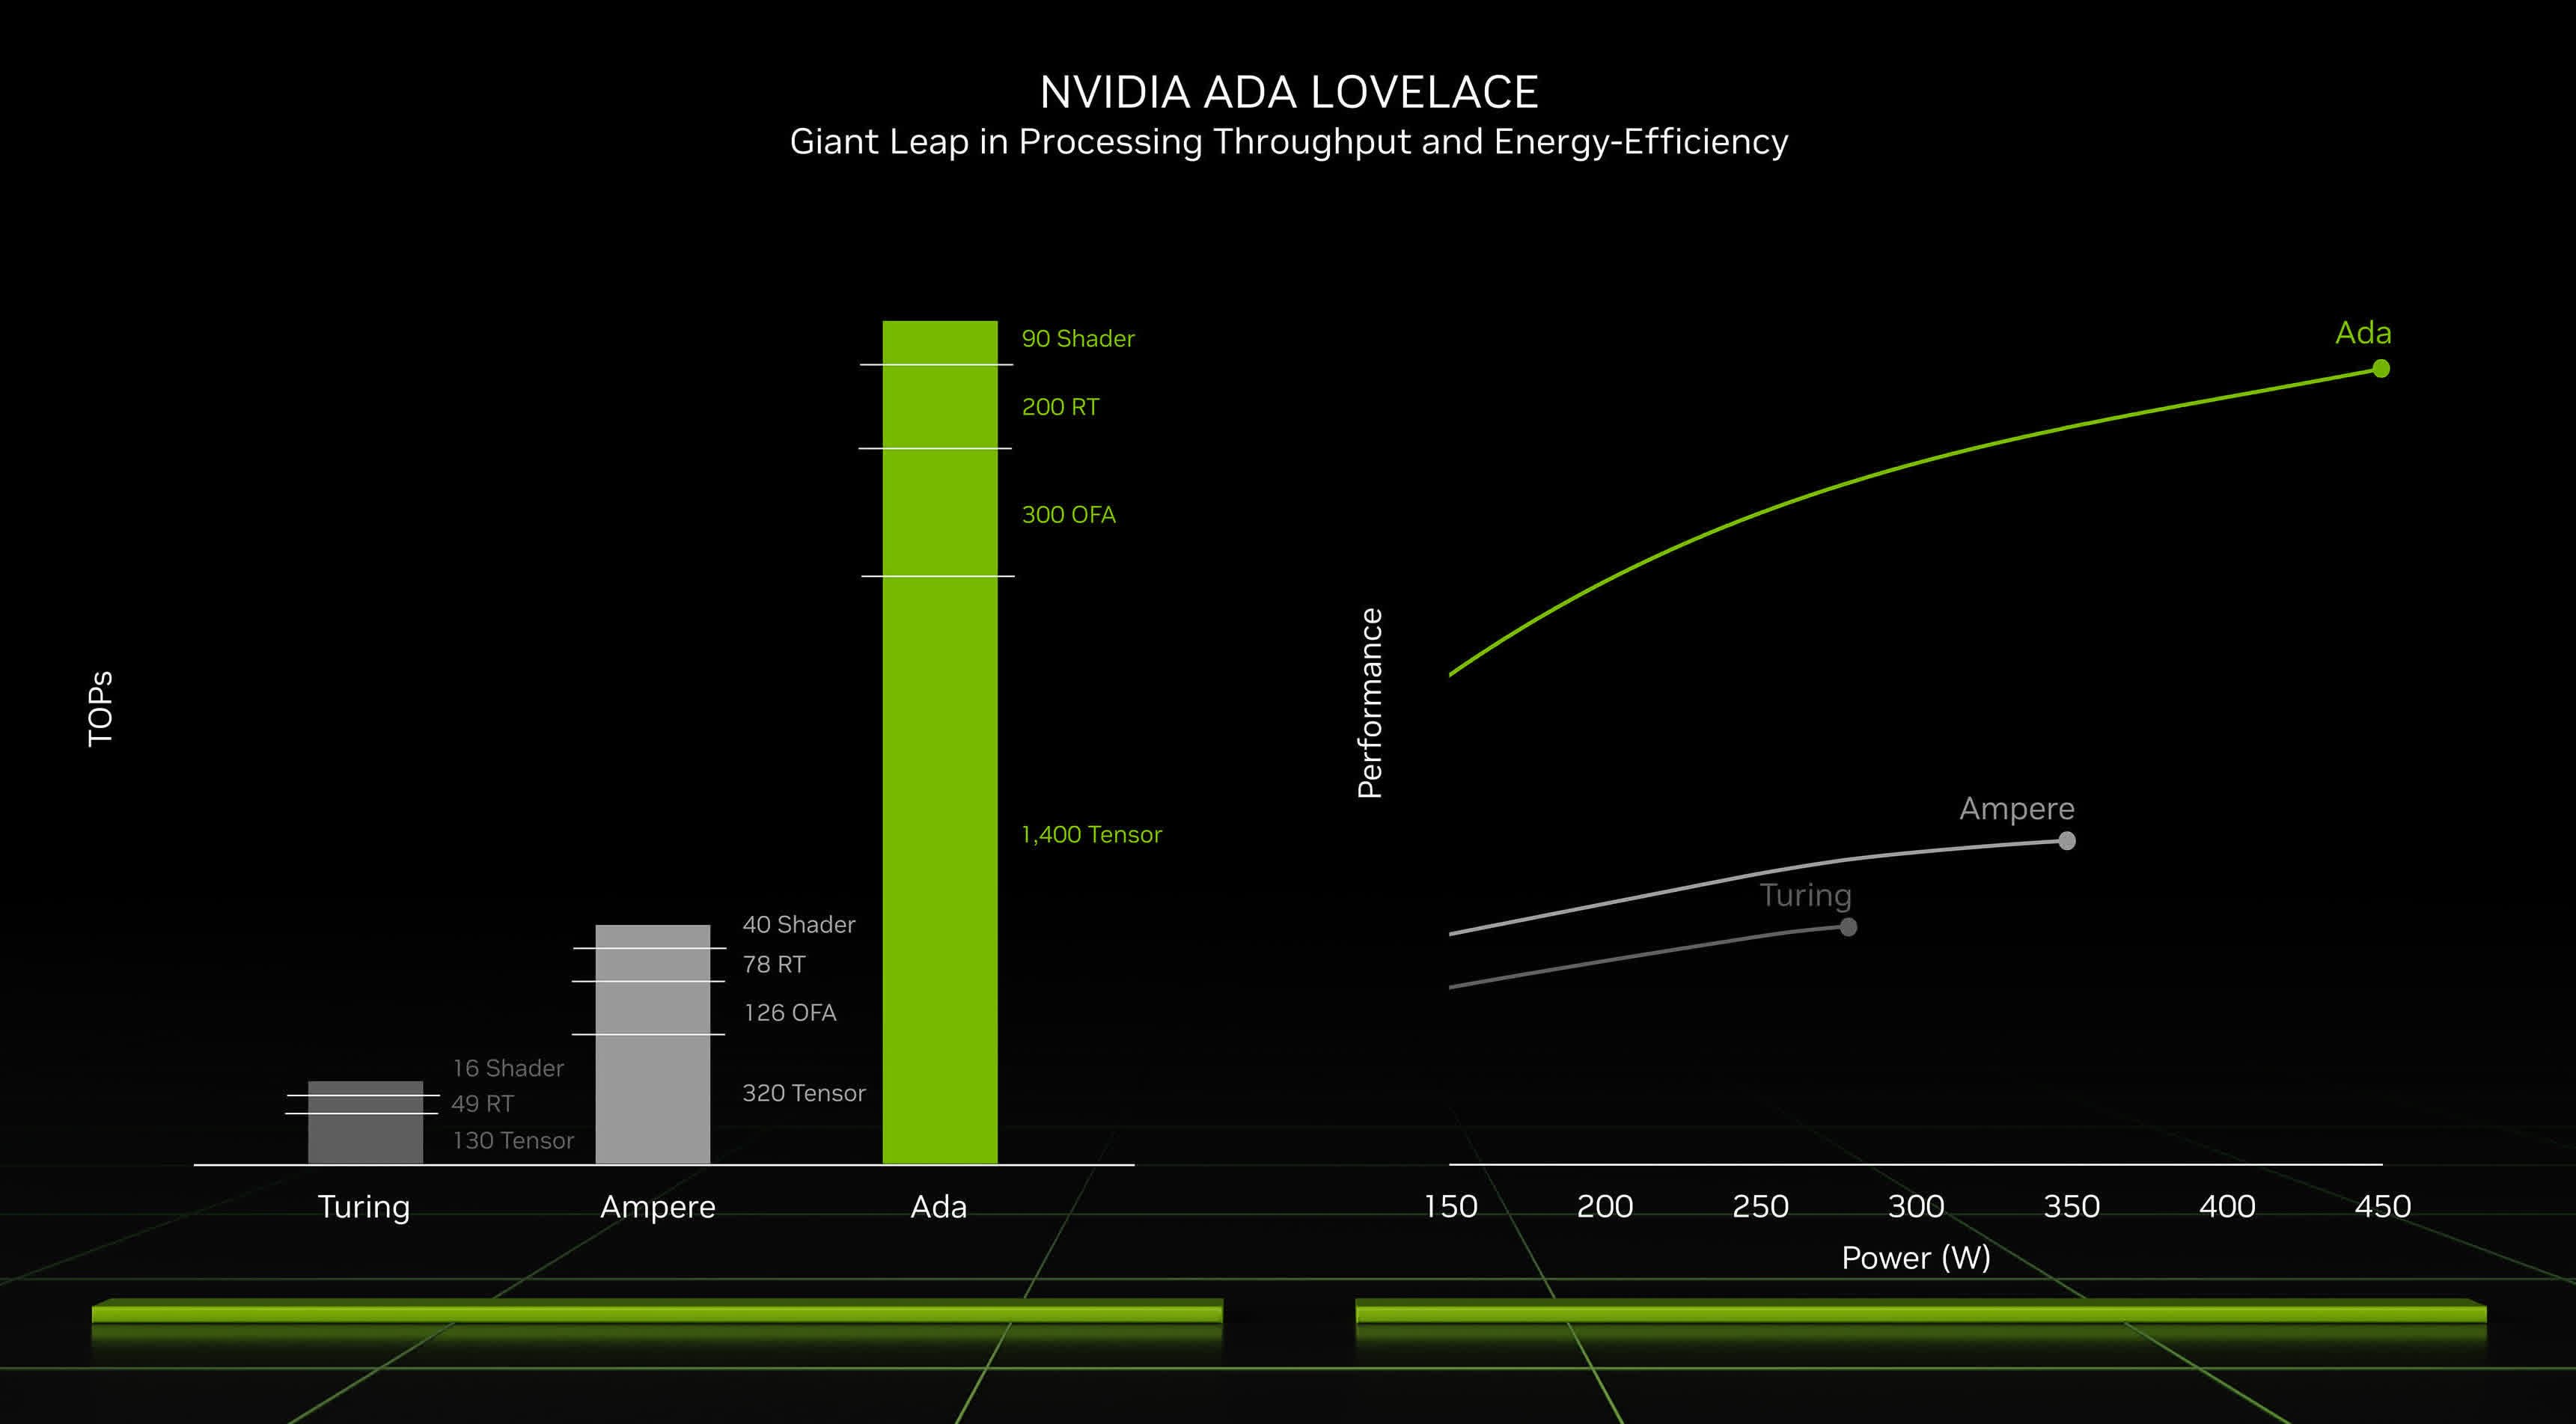
英伟达GeForce RTX 4060 笔记本电脑 GPU(代号 GN21-X4)是一款高端笔记本电脑 GPU。它基于 AD107 芯片,采用 Ada Lovelace 架构。RTX 4060 笔记本电脑提供 3072 个着色器,使用 8 GB GDDR6 专用显存,时钟速度为 16 Gbps(有效),内存总线为 128 位。TGP(图形总功率)可配置为 35 至 115 瓦(+ 来自 CPU 的 15-25 瓦动态提升功率),从而达到不同的性能水平。提升时钟频率从 1470 MHz(35 瓦 TGP 时)到 2370 MHz(115 瓦)不等。
在综合基准测试中,平均 RTX 4060 的性能介于 移动 RTX 3070和 移动 RTX 3070 Ti.功耗限制较低的 GPU(如 45 瓦型号)性能明显较低(在某些评测中性能降低 75%)。RTX 4060 移动版的平均游戏性能非常适合在 1920x1080 的最高设置下运行要求较高的游戏。要求不高的游戏可以轻松运行在 QHD 下(如《博德之门 3》)。请参阅下面我们评测的详细基准测试。在支持的游戏中启用 DLSS,可以大大提高帧率。
RTX 4060 提供 80 个张量核心(第 4 代),可支持 DLSS 3,包括受支持游戏的帧生成。另一方面,20 个光线追踪内核(第 4 代)的使用率较低,因为 RTX 4060 对于要求较高的游戏启用光线追踪功能(低分辨率除外)并不那么强大。
AD107 芯片采用台积电 5 纳米(4N 工艺)制造。
GeForce RTX 4000 Laptop GPU Series
| ||||||||||||||||
| Codename | GN21-X4 | |||||||||||||||
| Architecture | Ada Lovelace | |||||||||||||||
| Pipelines | 3072 - unified | |||||||||||||||
| TMUs | 96 | |||||||||||||||
| ROPs | 32 | |||||||||||||||
| Raytracing Cores | 24 | |||||||||||||||
| Tensor / AI Cores | 96 | |||||||||||||||
| Core Speed | 1545 - 2370 (Boost) MHz | |||||||||||||||
| Theoretical Performance | 11.6 TFLOPS FP16, 11.6 TFLOPS FP32, 0.181 TFLOPS FP64 | |||||||||||||||
| AI GPU | 233 TOPS INT8 | |||||||||||||||
| Cache | L1: 3 MB, L2: 32 MB | |||||||||||||||
| Memory Speed | 16000 effective = 2000 MHz | |||||||||||||||
| Memory Bus Width | 128 Bit | |||||||||||||||
| Memory Type | GDDR6 | |||||||||||||||
| Max. Amount of Memory | 8 GB | |||||||||||||||
| Shared Memory | no | |||||||||||||||
| Memory Bandwidth | 256 GB/s | |||||||||||||||
| API | DirectX 12 Ultimate, Shader 6.7, OpenGL 4.6, OpenCL 3.0, Vulkan 1.3 | |||||||||||||||
| Power Consumption | 115 Watt (35 - 115 Watt TGP) | |||||||||||||||
| Man. Technology | 5 nm | |||||||||||||||
| Displays | 4 Displays (max.), HDMI 2.1, DisplayPort 1.4a | |||||||||||||||
| Notebook Size | large | |||||||||||||||
| Date of Announcement | 03.01.2023 | |||||||||||||||
| Link to Manufacturer Page | www.nvidia.com | |||||||||||||||
| Predecessor | GeForce RTX 3060 Laptop GPU | |||||||||||||||
The following benchmarks stem from our benchmarks of review laptops. The performance depends on the used graphics memory, clock rate, processor, system settings, drivers, and operating systems. So the results don't have to be representative for all laptops with this GPU. For detailed information on the benchmark results, click on the fps number.


For more games that might be playable and a list of all games and graphics cards visit our Gaming List
Lenovo ThinkPad P1 Gen 7 21KV001SGE: Intel Core Ultra 7 155H, 16.00", 2 kg
Review » 联想 ThinkPad P1 7 代评测:无 TrackPoint 按钮,配备 NvidiaGeForce RTX 4060
Acer Nitro 14 AN14-41-R3MX: AMD Ryzen 5 8645HS, 14.50", 2 kg
Review » 宏碁 Nitro 14 (2024) 评测:紧凑型 RTX 4060 游戏笔记本,电池续航时间长
Asus TUF Gaming A14 FA401WV-WB94: AMD Ryzen AI 9 HX 370, 14.00", 1.5 kg
Review » 华硕 TUF Gaming A14 FA401WV 评测:Zen 5 Ryzen 9 继续给人留下深刻印象
Nubia RedMagic Titan 16 Pro: Intel Core i9-14900HX, 16.00", 2.4 kg
Review » RedMagic Titan 16 Pro 评测:智能手机制造商制造的游戏笔记本电脑
Asus ROG Zephyrus G16 GA605WV: AMD Ryzen AI 9 HX 370, 16.00", 1.8 kg
Review » 华硕 ROG Zephyrus G16 2024 评测--配备 AMD Zen 5 的超薄游戏笔记本电脑
Asus TUF Gaming A15 FA507UV: AMD Ryzen 9 8945H, 15.60", 2.1 kg
Review » 华硕 TUF Gaming A15 (2024) 评测:RTX 4060 性能强劲、价格适中、电池续航时间长
Lenovo LOQ 15IRX9: Intel Core i5-13450HX, 15.60", 2.4 kg
Review » 联想LOQ 15评测:配备 RTX 4060 的全高清游戏笔记本电脑,售价约 1,000 美元
Lenovo Legion Pro 5 16IRX9 G9: Intel Core i7-14700HX, 16.00", 2.5 kg
Review » 联想Legion Pro 5i 笔记本电脑评测:超强 i7-14700HX 和 RTX 4060 性能
Dell Inspiron 16 Plus 7640: Intel Core Ultra 7 155H, 16.00", 2.2 kg
Review » 戴尔 Inspiron 16 Plus 7640 笔记本电脑评测:与去年的机型相比,变化虽小却很重要
Schenker XMG Core 15 (M24): AMD Ryzen 7 8845HS, 15.30", 2.1 kg
Review » SCHENKER XMG Core 15 (M24) 笔记本电脑评测:来自德国的高级金属外壳游戏机
Tulpar T7 V20.6: Intel Core i7-13700H, 17.30", 2.6 kg
Review » Tulpar T7 V20.6 (Tongfang GM7PG0R) 笔记本电脑评测:目前最便宜的 RTX 4060 玩家之一
HP Victus 16 (2024): Intel Core i7-14700HX, 16.10", 2.4 kg
Review » 惠普 Victus 16 (2024) 笔记本电脑评测:RTX 4060 性能强劲,运行时间长
Gigabyte G6X 9KG (2024): Intel Core i7-13650HX, 16.00", 2.6 kg
Review » 技嘉 G6X 9KG (2024) 评测:配备 RTX 4060 的经济型游戏笔记本
HP Omen Transcend 14-fb0014: Intel Core Ultra 7 155H, 14.00", 1.6 kg
Review » 惠普 Omen Transcend 14 笔记本电脑评测:值得考虑的 Razer Blade 替代产品
Honor MagicBook Pro 16 2024: Intel Core Ultra 7 155H, 16.00", 1.9 kg
Review » Honor MagicBook Pro 16 2024 - 配备 165 Hz IPS 面板和 RTX 4060 的多媒体笔记本电脑
Dell G16, i7-13650HX, RTX 4060: Intel Core i7-13650HX, 16.00", 2.8 kg
Review » 戴尔 G16 (2024) 笔记本电脑评测:来自同一制造商的经济实惠的 Alienware 替代品?
Lenovo Legion 5 16IRX G9: Intel Core i7-14650HX, 16.00", 2.4 kg
Review » 联想Legion 5i 16 G9 评测--配备 Raptor Lake-HX 和人工智能引擎的快速游戏笔记本电脑
Colorful EVOL X15 AT 23: Intel Core i7-13700HX, 15.60", 2.3 kg
Review » 多彩 EVOL X15 AT 23 评论:令人印象深刻的 QHD 游戏机,配备 Raptor Lake-HX 和一些不可忽视的怪癖
Lenovo Legion Slim 7 16APH8: AMD Ryzen 7 7840HS, 16.00", 2.1 kg
Review » 联想Legion Slim 7 16 游戏笔记本电脑评测:即使采用 AMD Ryzen 也令人信服
Gigabyte G5 KF: Intel Core i5-12500H, 15.60", 1.9 kg
Review » 技嘉 G5 KF 评论:配备 RTX 4060 的游戏笔记本电脑,售价 969 欧元
Schenker XMG Apex 17 (Late 23): AMD Ryzen 7 7840HS, 17.30", 2.5 kg
Review » XMG Apex 17(23 月末)评测:配备 RTX 4060 的 QHD 游戏笔记本电脑
Asus ROG Flow X13 GV302XV: AMD Ryzen 9 7940HS, 13.40", 1.3 kg
Review » 华硕 ROG Flow X13 GV302XV (2023) 评测:配备 AMD Zen 4 Ryzen 9 7940HS 和 60 W Nvidia RTX 4060 的轻薄游戏敞篷跑车
Microsoft Surface Laptop Studio 2 RTX 4060: Intel Core i7-13700H, 14.40", 2 kg
Review » 微软 Surface Laptop Studio 2 评测--配备更快组件的多媒体可折叠笔记本电脑
MSI Raider GE68HX 13VF: Intel Core i9-13950HX, 16.00", 2.7 kg
Review » 微星 Raider GE68 HX 13VF 笔记本电脑评测:彻底改变设计
Lenovo LOQ 16IRH8: Intel Core i7-13620H, 16.00", 2.7 kg
Review » 联想 LOQ 16 游戏笔记本电脑评测:与价格更高的Legion 相比,差距在哪里?
Lenovo Legion Slim 5 14APH8: AMD Ryzen 7 7840HS, 14.50", 1.7 kg
Review » 联想Legion Slim 5 14APH8 笔记本电脑评测:120赫兹2.8K OLED甜蜜点
Captiva Advanced Gaming I74-121: Intel Core i5-13500H, 15.60", 2.3 kg
Review » Captiva Advanced Gaming I74-121 (Clevo V150RND) 评测:配备强大 RTX 4060 的廉价游戏笔记本电脑
Alienware m16 R1 Intel: Intel Core i7-13700HX, 16.00", 3 kg
Review » Alienware m16 R1 评测:配备 RTX 4060 和雷电 4 的 QHD 游戏机
Dell Inspiron 16 Plus 7630: Intel Core i7-13700H, 16.00", 2.2 kg
Review » 戴尔 Inspiron 16 Plus 7630 笔记本电脑评测:60 WGeForce RTX 4060 并不差
Lenovo Legion Slim 5 16APH8: AMD Ryzen 7 7840HS, 16.00", 2.4 kg
Review » 联想Legion Slim 5 16APH8 笔记本电脑评测:设计欠佳,GPU表现不佳
Lenovo Yoga Pro 9 16-IRP G8: Intel Core i7-13705H, 16.00", 2.2 kg
Review » 联想 Yoga Pro 9i 16 笔记本电脑评测:出色的迷你 LED 面板,但不必要的成本节约措施
Asus Vivobook Pro 16X K6604JV-MX016W: Intel Core i9-13980HX, 16.00", 2.1 kg
Review » 华硕 Vivobook Pro 16X 评测:配备出色处理器的创意笔记本
Acer Predator Helios 16 PH16-71-731Q: Intel Core i7-13700HX, 16.00", 2.6 kg
Review » 宏碁Predator Helios 16笔记本电脑评测:一款拥有众多优势的安静游戏笔记本电脑
Schenker XMG Pro 15 (E23): Intel Core i9-13900HX, 15.60", 2.4 kg
Review » 申科XMG Pro 15 E23 (PD50SND-G)游戏笔记本电脑评测:为工作和游戏的平衡干杯!
Acer Nitro 17 AN17-51-71ER: Intel Core i7-13700H, 17.30", 3 kg
Review » 宏碁的安静的Nitro 17笔记本电脑被审查:RTX 4060,完美配置
Dell G15 5530: Intel Core i7-13650HX, 15.60", 3 kg
Review » 戴尔G15 5530评论:一个可行的Alienware替代品,现在有了Raptor Lake-HX
Asus ROG Flow X16 GV601V: Intel Core i9-13900H, 16.00", 2.1 kg
Review » 纤薄的华硕ROG Flow X16笔记本电脑评测:强大的16英寸游戏工作站二合一,带触摸屏
Asus ZenBook Pro 14 Duo UX8402VV-P1021W: Intel Core i9-13900H, 14.50", 1.8 kg
Review » 华硕ZenBook Pro 14 Duo笔记本电脑评测,为创意者提供第二块显示屏:提高生产力
Medion Erazer Defender P40: Intel Core i7-13700HX, 17.30", 2.9 kg
Review » Medion Erazer Defender P40评论:配备RTX4060的经济型QHD游戏笔记本
Lenovo Legion Pro 5 16IRX8: Intel Core i7-13700HX, 16.00", 2.5 kg
Review » 联想Legion Pro 5 16IRX8笔记本电脑评论:GeForce RTX 4060的1600美元的高价。
Asus ROG Flow Z13 GZ301V: Intel Core i9-13900H, 13.40", 1.6 kg
Review » 华硕ROG Flow Z13的回顾:疯狂--RTX4060在一个令人印象深刻的游戏平板中的应用
MSI Cyborg 15 A12VF: Intel Core i7-12650H, 15.60", 2 kg
Review » 微星Cyborg 15 A12VF回顾:带有低功耗RTX4060的游戏笔记本
MSI Katana 17 B13VFK: Intel Core i7-13620H, 17.30", 2.8 kg
Review » 微星Katana 17 B13V笔记本电脑回顾。NvidiaGeForce RTX 4060首次亮相
MSI Thin A15 B7VF: AMD Ryzen 7 7735HS, 15.60", 1.9 kg
External Review » MSI Thin A15 B7VF
MSI Creator A16 AI+ A3HVFG: AMD Ryzen AI 9 HX 370, 16.00", 2.1 kg
External Review » MSI Creator A16 AI+ A3HVFG
Acer Nitro V16 AI ANV16-61: AMD Ryzen AI 7 350, 16.00", 2.4 kg
External Review » Acer Nitro V16 AI ANV16-61
Asus TUF Gaming F15 FX507VV, i7-13620H: Intel Core i7-13620H, 15.60", 2.2 kg
External Review » Asus TUF Gaming F15 FX507VV, i7-13620H
Acer Nitro 5 AN515-58, i9-12900H RTX 4060: Intel Core i9-12900H, 15.60", 2.6 kg
External Review » Acer Nitro 5 AN515-58, i9-12900H RTX 4060
Asus TUF Gaming A17 FA707NVR: AMD Ryzen 7 7435HS, 17.30", 2.6 kg
External Review » Asus TUF Gaming A17 FA707NVR
HP Omen Transcend 14-fb0000ng, Ultra 9 185H: Intel Core Ultra 9 185H, 14.00", 1.6 kg
External Review » HP Omen Transcend 14-fb0000ng, Ultra 9 185H
Schenker XMG Core 15 (M24): AMD Ryzen 7 8845HS, 15.30", 2.1 kg
External Review » SCHENKER XMG Core 15 (M24)
Acer Nitro 16 AN16-42, RTX 4060: AMD Ryzen 7 8845HS, 16.00", 2.7 kg
External Review » Acer Nitro 16 AN16-42, RTX 4060
Acer Nitro V 16 ANV16-41-R5AT: AMD Ryzen 7 8845HS, 16.00", 2.5 kg
External Review » Acer Nitro V 16 ANV16-41-R5AT
Acer Predator Triton Neo 16 PTN16-51, Ultra 9 185H: Intel Core Ultra 9 185H, 16.00", 2.1 kg
External Review » Acer Predator Triton Neo 16 PTN16-51, Ultra 9 185H
MSI VenturePro 16 AI A1VFG: Intel Core Ultra 7 155H, 16.00", 1.9 kg
External Review » MSI VenturePro 16 AI A1VFG
Lenovo Legion 5 15IRX9: Intel Core i7-13650HX, 15.60", 2.3 kg
External Review » Lenovo Legion 5 15IRX9
MSI Stealth A16 AI+ A3XVFG: AMD Ryzen AI 9 365, 16.00", 2.1 kg
External Review » MSI Stealth A16 AI+ A3XVFG
Acer Nitro V16 ANV16-71: Intel Core i7-14650HX, 16.00", 2.5 kg
External Review » Acer Nitro V16 ANV16-71
Acer Nitro V15 ANV15-41: AMD Ryzen 7 7735HS, 15.60", 2.1 kg
External Review » Acer Nitro V15 ANV15-41
Acer Nitro V15 ANV15-41, R5 7535HS: AMD Ryzen 5 7535HS, 15.60", 2.1 kg
External Review » Acer Nitro V15 ANV15-41, R5 7535HS
MSI Sword 16 HX B14VFKG, i7-14700HX: Intel Core i7-14700HX, 16.00", 2.3 kg
External Review » MSI Sword 16 HX B14VFKG, i7-14700HX
Asus TUF Gaming A16 FA608WV: AMD Ryzen AI 9 HX 370, 16.00", 2.2 kg
External Review » Asus TUF Gaming A16 FA608WV
MSI Prestige 14 AI Studio C1VFG, Ultra 9 185H: Intel Core Ultra 9 185H, 14.00", 1.7 kg
External Review » MSI Prestige 14 AI Studio C1VFG, Ultra 9 185H
Lenovo Legion 5 16IRX9, i9-14900HX: Intel Core i9-14900HX, 16.00", 2.3 kg
External Review » Lenovo Legion 5 16IRX9, i9-14900HX
MSI Cyborg 15 AI A1VFK: Intel Core Ultra 7 155H, 15.60", 2 kg
External Review » MSI Cyborg 15 AI A1VFK
Lenovo Yoga Pro 9 16IMH9, Ultra 7 155H: Intel Core Ultra 7 155H, 16.00", 2.1 kg
External Review » Lenovo Yoga Pro 9 16IMH9, Ultra 7 155H
MSI Sword 16 HX B14VFKG, i7-14650HX: Intel Core i7-14650HX, 16.00", 2.3 kg
External Review » MSI Sword 16 HX B14VFKG, i7-14650HX
MSI Prestige 14 AI Studio C1VFG: Intel Core Ultra 7 155H, 14.00", 1.7 kg
External Review » MSI Prestige 14 AI Studio C1VFG
Acer Predator Helios Neo 14 PHN14-51, RTX 4060: Intel Core Ultra 9 185H, 14.50", 1.9 kg
External Review » Acer Predator Helios Neo 14 PHN14-51, RTX 4060
Acer Nitro 16 AN16-73, i7-14700HX: Intel Core i7-14700HX, 16.00", 2.5 kg
External Review » Acer Nitro 16 AN16-73, i7-14700HX
Lenovo LOQ 15IRX9, i7-13650HX RTX 4060: Intel Core i7-13650HX, 15.60", 2.4 kg
External Review » Lenovo LOQ 15IRX9, i7-13650HX RTX 4060
Acer Nitro V16 ANV16-41, R7 8845HS RTX 4060: AMD Ryzen 7 8845HS, 16.00", 2.5 kg
External Review » Acer Nitro V16 ANV16-41, R7 8845HS RTX 4060
Alienware x14 R2: Intel Core i7-13620H, 14.00", 1.9 kg
External Review » Alienware x14 R2
Gigabyte Aero 16 OLED BKF: Intel Core i7-13700H, 16.00", 2.1 kg
External Review » Gigabyte Aero 16 OLED BKF
Asus TUF Gaming A14 FA401UV: AMD Ryzen 7 8845HS, 14.00", 1.5 kg
External Review » Asus TUF Gaming A14 FA401UV
Acer Nitro 16 AN16-73: Intel Core i7-14650HX, 16.00", 2.5 kg
External Review » Acer Nitro 16 AN16-73
Asus ProArt PX13 HN7306WV: AMD Ryzen AI 9 HX 370, 13.30", 1.4 kg
External Review » Asus ProArt PX13 HN7306, RTX 4060
MSI Crosshair 16 HX D14VFKG: Intel Core i7-14700HX, 16.00", 2.5 kg
External Review » MSI Crosshair 16 HX D14VFKG
Acer Nitro V16 ANV16-41, RTX 4060: AMD Ryzen 5 8645HS, 16.00", 2.5 kg
External Review » Acer Nitro V16 ANV16-41, RTX 4060
Asus TUF Gaming A14 FA401WV-WB94: AMD Ryzen AI 9 HX 370, 14.00", 1.5 kg
External Review » Asus TUF Gaming A14 FA401WV-WB94
Lenovo ThinkBook 16p G5 IRX 21N50011GE: Intel Core i9-14900HX, 16.00", 2.2 kg
External Review » Lenovo ThinkBook 16p G5 IRX 21N50011GE
Lenovo ThinkPad P1 Gen 7 21KV001SGE: Intel Core Ultra 7 155H, 16.00", 2 kg
External Review » Lenovo ThinkPad P1 Gen 7 21KV001SGE
HP Omen 16-wf1: Intel Core i9-14900HX, 16.10", 2.4 kg
External Review » HP Omen 16-wf1
Nubia RedMagic Titan 16 Pro: Intel Core i9-14900HX, 16.00", 2.4 kg
External Review » Nubia RedMagic Titan 16 Pro
MSI Prestige 16 AI Studio B1VFG, Ultra 7 155H: Intel Core Ultra 7 155H, 16.00", 1.6 kg
External Review » MSI Prestige 16 AI Studio B1VFG, Ultra 7 155H
Acer Nitro 16 AN16-41, R7 7840HS RTX 4060: AMD Ryzen 7 7840HS, 16.00", 2.7 kg
External Review » Acer Nitro 16 AN16-41, R7 7840HS RTX 4060
HP Victus 16-r1300: Intel Core i5-14500HX, 16.10", 2.3 kg
External Review » HP Victus 16-r1300
HP Omen 17-db0000: AMD Ryzen 9 8945HS, 17.30", 3 kg
External Review » HP Omen 17-db0000
Lenovo Legion Slim 5 16AHP9, RTX 4060: AMD Ryzen 7 8845HS, 16.00", 2.3 kg
External Review » Lenovo Legion Slim 5 16AHP9, RTX 4060
Acer Nitro 17 AN17-41-R38P: AMD Ryzen 7 7735HS, 17.30", 3.1 kg
External Review » Acer Nitro 17 AN17-41-R38P
Gigabyte G6 KF: Intel Core i7-13620H, 16.00", 2.3 kg
External Review » Gigabyte G6 KF
Acer Nitro 14 AN14-41: AMD Ryzen 7 8845HS, 14.50", 2 kg
External Review » Acer Nitro 14 AN14-41
Aorus 16X 2024 9KG: Intel Core i7-13650HX, 16.00", 2.3 kg
External Review » Aorus 16X 2024 9KG
Lenovo Yoga Pro 7 14IMH9, Ultra 9 185H RTX 4060: Intel Core Ultra 9 185H, 14.50", 1.6 kg
External Review » Lenovo Yoga Pro 7 14IMH9, Ultra 9 185H RTX 4060
Acer Nitro V 15 ANV15-51, i9-13900H: Intel Core i9-13900H, 15.60", 2.1 kg
External Review » Acer Nitro V 15 ANV15-51, i9-13900H
Lenovo Yoga Pro 9 16IMH9, RTX 4060: Intel Core Ultra 9 185H, 16.00", 2.1 kg
External Review » Lenovo Yoga Pro 9 16IMH9, RTX 4060
Asus ROG Zephyrus G16 GU605MV: Intel Core Ultra 7 155H, 16.00", 1.9 kg
External Review » Asus ROG Zephyrus G16 GU605MV
Lenovo Legion Pro 5 16IRX9, i9-14900HX RTX 4060: Intel Core i9-14900HX, 16.00", 2.5 kg
External Review » Lenovo Legion Pro 5 16IRX9, i9-14900HX RTX 4060
Acer Nitro 17 AN17-42: AMD Ryzen 7 8845HS, 17.30", 3.1 kg
External Review » Acer Nitro 17 AN17-42
MSI Sword 16 HX B14VFKG, i9-14900HX: Intel Core i9-14900HX, 16.00", 2.3 kg
External Review » MSI Sword 16 HX B14VFKG, i9-14900HX
Asus ROG Zephyrus G16 2024 GU605MV: Intel Core Ultra 9 185H, 16.00", 1.9 kg
External Review » Asus ROG Zephyrus G16 2024 GU605MV
Acer Predator Triton Neo 16 PTN16-51: Intel Core Ultra 7 155H, 16.00", 2.1 kg
External Review » Acer Predator Triton Neo 16 PTN16-51
Asus ROG Zephyrus G16 GA605WV: AMD Ryzen AI 9 HX 370, 16.00", 1.8 kg
External Review » Asus ROG Zephyrus G16 GA605WV
Asus TUF Gaming A14 FA401: AMD Ryzen AI 9 HX 370, 14.00", 1.5 kg
External Review » Asus TUF Gaming A14 FA401
Acer Predator Helios Neo 16 PHN16-72, RTX 4060: Intel Core i9-14900HX, 16.00", 2.5 kg
External Review » Acer Predator Helios Neo 16 PHN16-72, RTX 4060
Infinix GT Book 16: Intel Core i9-13900H, 16.00", 2 kg
External Review » Infinix GT Book 16
Asus VivoBook Pro 15 OLED N6506, Ultra 5 125H: Intel Core Ultra 5 125H, 15.60", 1.8 kg
External Review » Asus VivoBook Pro 15 OLED N6506, Ultra 5 125H
Acer Predator Helios Neo 16 PHN16-72, i7-14650HX RTX 4060: Intel Core i7-14650HX, 16.00", 2.5 kg
External Review » Acer Predator Helios Neo 16 PHN16-72, i7-14650HX RTX 4060
Lenovo Yoga Pro 7 14IMH9, RTX 4060: Intel Core Ultra 5 125H, 14.50", 1.6 kg
External Review » Lenovo Yoga Pro 7 14IMH9, RTX 4060
Asus ProArt P16 H7606: AMD Ryzen AI 9 HX 370, 16.00", 1.9 kg
External Review » Asus ProArt P16 H7606
Dell Inspiron 16 Plus 7640: Intel Core Ultra 7 155H, 16.00", 2.2 kg
External Review » Dell Inspiron 16 Plus 7640
Acer Predator Helios Neo 18 PHN18-71, i7-14650HX RTX 4060: Intel Core i7-14650HX, 18.00", 3.4 kg
External Review » Acer Predator Helios Neo 18 PHN18-71, i7-14650HX RTX 4060
Acer Predator Helios 18 PH18-71: Intel Core i9-13900HX, 18.00", 3.3 kg
External Review » Acer Predator Helios 18 PH18-71
MSI Prestige 16 AI Studio B1VFG: Intel Core Ultra 9 185H, 16.00", 1.6 kg
External Review » MSI Prestige 16 AI Studio B1VFG
Lenovo Legion Pro 5 16IRX9, i7-14650HX: Intel Core i7-14650HX, 16.00", 2.5 kg
External Review » Lenovo Legion Pro 5 16IRX9, i7-14650HX
Asus TUF Gaming F16 FX607JV: Intel Core i7-13650HX, 16.00", 2.3 kg
External Review » Asus TUF Gaming F16 FX607JV
Asus ROG Zephyrus G14 2024 GA403UV: AMD Ryzen 9 8945HS, 14.00", 1.5 kg
External Review » Asus ROG Zephyrus G14 2024 GA403UV
Asus VivoBook Pro 15 OLED N6506M: Intel Core Ultra 7 155H, 15.60", 1.8 kg
External Review » Asus VivoBook Pro 15 OLED N6506M
MSI Sword 16 HX B14VFKG: Intel Core Ultra 9 185H, 16.00", 2.3 kg
External Review » MSI Sword 16 HX B14VFKG
Asus TUF Gaming A15 FA507UI : AMD Ryzen 9 8945HS, 15.60", 2.2 kg
External Review » Asus TUF Gaming A15 FA507UI
HP Omen Transcend 16-u1000ng: Intel Core i7-14700HX, 16.00", 2.2 kg
External Review » HP Omen Transcend 16-u1000ng
HP Omen 16-wf1000: Intel Core i7-14700HX, 16.10", 2.4 kg
External Review » HP Omen 16-wf1000
MSI Raider GE68 HX 14VFG: Intel Core i7-14700HX, 16.00", 2.8 kg
External Review » MSI Raider GE68 HX 14VFG
Dell XPS 16 9640, RTX 4060: Intel Core Ultra 7 155H, 16.30", 2.1 kg
External Review » Dell XPS 16 9640, RTX 4060
Aorus 15 BKG: Intel Core Ultra 7 155H, 15.60", 2.4 kg
External Review » Aorus 15 BKG
Asus TUF Gaming A16 FA607PV: AMD Ryzen 9 7845HX, 16.00", 2.3 kg
External Review » Asus TUF Gaming A16 FA607PV
Asus ROG Zephyrus G14 OLED GA403UV: AMD Ryzen 9 8945HS, 14.00", 1.5 kg
External Review » Asus ROG Zephyrus G14 OLED GA403UV
Lenovo Legion 5 16IRX9: Intel Core i5-13450HX, 16.00", 2.3 kg
External Review » Lenovo Legion 5 16IRX9
Lenovo LOQ 15IRX9, i7-14700HX: Intel Core i7-14700HX, 16.00", 2.3 kg
External Review » Lenovo LOQ 15IRX9
Xiaomi Redmi G Pro 2024: Intel Core i9-14900HX, 16.00", 2.7 kg
External Review » Xiaomi Redmi G Pro 2024
Acer Nitro 16 AN16-41, R7 7735HS RTX 4060: AMD Ryzen 7 7735HS, 16.00", 2.7 kg
External Review » Acer Nitro 16 AN16-41, R7 7735HS RTX 4060
Honor MagicBook Pro 16 2024: Intel Core Ultra 7 155H, 16.00", 1.9 kg
External Review » Honor MagicBook Pro 16 2024
MSI Cyborg 14 A13VE: Intel Core i7-13620H, 14.00", 1.6 kg
External Review » MSI Cyborg 14 A13VE
Asus Vivobook Pro 15 OLED N6506: Intel Core Ultra 9 185H, 15.60", 1.8 kg
External Review » Asus Vivobook Pro 15 OLED N6506
Gigabyte G6X 9KG (2024): Intel Core i7-13650HX, 16.00", 2.6 kg
External Review » Gigabyte G6X 9KG (2024)
Lenovo Legion 5 16IRX G9: Intel Core i7-14650HX, 16.00", 2.4 kg
External Review » Lenovo Legion 5 16IRX G9
HP Omen Transcend 14-fb0014: Intel Core Ultra 7 155H, 14.00", 1.6 kg
External Review » HP Omen Transcend 14-fb0014
Acer Nitro 5 AN517-55-96S6: Intel Core i9-12900H, 17.30", 3 kg
External Review » Acer Nitro 5 AN517-55-96S6
Aorus 15X BKF: Intel Core i7-13700H, 15.60", 2.3 kg
External Review » Aorus 15X BKF
MSI Creator Z16 HX Studio B13VFT: Intel Core i7-13700H, 16.00", 2.4 kg
External Review » MSI Creator Z16 HX Studio B13VFT
Lenovo LOQ 16APH8: AMD Ryzen 5 7640HS, 16.00", 2.6 kg
External Review » Lenovo LOQ 16APH8
Acer Nitro 17 AN17-72: Intel Core i7-14700HX, 17.30", 3.2 kg
External Review » Acer Nitro 17 AN17-72
Asus VivoBook Pro 15 M6500XV: AMD Ryzen 9 7940HS, 15.60", 1.8 kg
External Review » Asus VivoBook Pro 15 M6500XV
Asus Zenbook Pro 14 OLED UX6404VV, i5-13500H: Intel Core i5-13500H, 14.50", 1.6 kg
External Review » Asus Zenbook Pro 14 OLED UX6404VV, i5-13500H
HP Victus 16-s0475ng: AMD Ryzen 7 7840HS, 16.10", 2.3 kg
External Review » HP Victus 16-s0475ng
Lenovo Legion Slim 5 16IRH8, i7-13700H RTX 4060: Intel Core i7-13700H, 16.00", 2.4 kg
External Review » Lenovo Legion Slim 5 16IRH8, i7-13700H RTX 4060
Asus ZenBook Pro 14 Duo UX8402VV: Intel Core i7-13700H, 14.50", 1.8 kg
External Review » Asus ZenBook Pro 14 Duo UX8402VV
HP Omen 16-wf0000ng: Intel Core i5-13500HX, 16.10", 2.4 kg
External Review » HP Omen 16-wf0000ng
MSI Stealth 16 Studio A13VG, i7-13620H: Intel Core i7-13620H, 17.30", 2.8 kg
External Review » MSI Stealth 16 Studio A13VG, i7-13620H
Acer Nitro 17 AN17-41-R182: AMD Ryzen 7 7840HS, 17.30", 3 kg
External Review » Acer Nitro 17 AN17-41-R182
Acer Nitro 17 AN17-51-71ER: Intel Core i7-13700H, 17.30", 3 kg
External Review » Acer Nitro 17 AN17-51-71ER
HP Omen Transcend 16-u0000ng: Intel Core i7-13700HX, 16.00", 2.2 kg
External Review » HP Omen Transcend 16-u0000ng
Lenovo LOQ 15IRH8, i5-13500H RTX 4060: Intel Core i5-13500H, 15.60", 2.4 kg
External Review » Lenovo LOQ 15IRH8, i5-13500H RTX 4060
HP Victus 16-s0000ax: AMD Ryzen 5 7640HS, 16.10", 2.3 kg
External Review » HP Victus 16-s0000ax
MSI Bravo 15 C7VF: AMD Ryzen 7 7735HS, 15.60", 2.3 kg
External Review » MSI Bravo 15 C7VF
Asus Zenbook Pro 14 OLED UX6404VV, i7-13700H: Intel Core i7-13700H, 14.50", 1.6 kg
External Review » Asus Zenbook Pro 14 OLED UX6404VV, i7-13700H
Asus VivoBook Pro 16X K6604JV: Intel Core i9-13980HX, 16.00", 1.9 kg
External Review » Asus VivoBook Pro 16X K6604JV
Asus TUF Gaming F17 FX707VV: Intel Core i9-13900H, 17.30", 2.6 kg
External Review » Asus TUF Gaming F17 FX707VV
HP Omen 16-xf0000: AMD Ryzen 7 7840HS, 16.10", 2.4 kg
External Review » HP Omen 16-xf0000
Lenovo LOQ 15, R7 7840HS RTX 4060: AMD Ryzen 7 7840HS, 15.60", 2.4 kg
External Review » Lenovo LOQ 15, R7 7840HS RTX 4060
MSI Stealth 16 Studio A13VF, i9-13900H: Intel Core i9-13900H, 16.00", 2 kg
External Review » MSI Stealth 16 Studio A13VF, i9-13900H
HP Victus 16-r0017ns: Intel Core i7-13700H, 16.10", 2.3 kg
External Review » HP Victus 16-r0017ns
Lenovo ThinkBook 16p G4: Intel Core i7-13700H, 16.00", 2.2 kg
External Review » Lenovo ThinkBook 16p G4
Dell Inspiron 16 Plus 7630, i7-13700H: Intel Core i7-13700H, 16.00", 2.1 kg
External Review » Dell Inspiron 16 Plus 7630, i7-13700H
Lenovo Legion Slim 5 14APH8: AMD Ryzen 7 7840HS, 14.50", 1.7 kg
External Review » Lenovo Legion Slim 5 14APH8
Microsoft Surface Laptop Studio 2 RTX 4060: Intel Core i7-13700H, 14.40", 2 kg
External Review » Microsoft Surface Laptop Studio 2 RTX 4060
Dell Inspiron 16 Plus 7630: Intel Core i7-13700H, 16.00", 2.2 kg
External Review » Dell Inspiron 16 Plus 7630
Asus VivoBook 16X OLED K3605VV: Intel Core i9-13900H, 16.00", 1.8 kg
External Review » Asus VivoBook 16X OLED K3605VV
MSI Stealth 15 A13VF: Intel Core i7-13620H, 15.60", 2.1 kg
External Review » MSI Stealth 15 A13VF
MSI Raider GE68 HX 13VF: Intel Core i9-13950HX, 16.00", 2.7 kg
External Review » MSI Raider GE68 HX 13VF
Alienware x14 R2 2023, RTX 4060: Intel Core i7-13620H, 14.00", 1.9 kg
External Review » Alienware x14 R2 2023, RTX 4060
Lenovo ThinkPad P1 G6: Intel Core i7-13700H, 16.00", 1.9 kg
External Review » Lenovo ThinkPad P1 G6
Aorus 15 9KF: Intel Core i5-12500H, 15.60", 2.3 kg
External Review » Aorus 15 9KF
Asus ROG Strix G17 G713PV: AMD Ryzen 9 7845HX, 17.30", 2.8 kg
External Review » Asus ROG Strix G17 G713PV
Lenovo Legion Slim 5 16IRH8: Intel Core i5-13500H, 16.00", 2.4 kg
External Review » Lenovo Legion Slim 5 16IRH8
Razer Blade 15 2023: Intel Core i7-13800H, 15.60", 2 kg
External Review » Razer Blade 15 2023
Asus ZenBook Pro 14 Duo UX8402VV-P1021W: Intel Core i9-13900H, 14.50", 1.8 kg
External Review » Asus ZenBook Pro 14 Duo UX8402VV-P1021W
Razer Blade 14 RTX 4060: AMD Ryzen 9 7940HS, 14.00", 1.8 kg
External Review » Razer Blade 14 RTX 4060
Lenovo LOQ 15IRH8, i7-13700H RTX 4060: Intel Core i7-13700H, 15.60", 2.4 kg
External Review » Lenovo LOQ 15IRH8, i7-13700H RTX 4060
Lenovo LOQ 16IRH8, i7-13700H RTX 4060: Intel Core i7-13700H, 16.00", 2.6 kg
External Review » Lenovo LOQ 16IRH8, i7-13700H RTX 4060
Asus ROG Zephyrus G14 GA402XV: AMD Ryzen 9 7940HS, 14.00", 1.7 kg
External Review » Asus ROG Zephyrus G14 GA402XV
Acer Predator Helios Neo 16 PHN16-71, i5-13500HX RTX 4060: Intel Core i5-13500HX, 16.00", 2.6 kg
External Review » Acer Predator Helios Neo 16 PHN16-71, i5-13500HX RTX 4060
HP Envy 16-h1000: Intel Core i9-13900H, 16.00", 2.7 kg
External Review » HP Envy 16-h1000
Acer Predator Helios 16 PH16-71-74UU: Intel Core i7-13700HX, 16.00", 2.7 kg
External Review » Acer Predator Helios 16 PH16-71-74UU
MSI Cyborg 15 A12VF, i5-12450H: Intel Core i5-12450H, 15.60", 2 kg
External Review » MSI Cyborg 15 A12VF, i5-12450H
Asus TUF Gaming F15 FX507VV: Intel Core i7-13700H, 15.60", 2.2 kg
External Review » Asus TUF Gaming F15 FX507VV
Lenovo Yoga Pro 9 14IRP G8, i9-13905H RTX 4060: Intel Core i9-13905H, 14.50", 1.7 kg
External Review » Lenovo Yoga Pro 9 14IRP G8, i9-13905H RTX 4060
MSI Cyborg 15 A12VF-248: Intel Core i7-12700H, 15.60", 2 kg
External Review » MSI Cyborg 15 A12VF-248
Lenovo Legion Slim 5 16APH8: AMD Ryzen 7 7840HS, 16.00", 2.4 kg
External Review » Lenovo Legion Slim 5 16APH8
Lenovo LOQ 16IRH8: Intel Core i7-13620H, 16.00", 2.7 kg
External Review » Lenovo LOQ 16IRH8
Acer Predator Helios 18 PH18-71-74ET: Intel Core i7-13700HX, 18.00", 3.3 kg
External Review » Acer Predator Helios 18 PH18-71-74ET
Medion Erazer Defender P40: Intel Core i7-13700HX, 17.30", 2.9 kg
External Review » Medion Erazer Defender P40
MSI Prestige 16 Studio A13VF: Intel Core i7-13700H, 16.00", 2.1 kg
External Review » MSI Prestige 16 Studio A13VF
MSI Cyborg 15 A13VF: Intel Core i7-13620H, 15.60", 2 kg
External Review » MSI Cyborg 15 A13VF
Dell XPS 15 9530 RTX 4060: Intel Core i7-13700H, 15.60", 1.9 kg
External Review » Dell XPS 15 9530 RTX 4060
Medion Erazer Deputy P50: Intel Core i7-13700HX, 15.60", 2.1 kg
External Review » Medion Erazer Deputy P50
Asus TUF Gaming A15 FA507NV: AMD Ryzen 7 7735HS, 15.60", 2.2 kg
External Review » Asus TUF Gaming A15 FA507NV
Dell G16 7630: Intel Core i7-13650HX, 15.60", 2.9 kg
External Review » Dell G16 7630
Asus TUF Gaming A15 FA507XV: AMD Ryzen 9 7940HS, 15.60", 2.2 kg
External Review » Asus TUF Gaming A15 FA507XV
Acer Nitro 17 AN17-71: Intel Core i7-13700HX, 17.30", 3.3 kg
External Review » Acer Nitro 17 AN17-71
MSI Stealth 14 Studio A13VF: Intel Core i7-13700H, 14.00", 1.7 kg
External Review » MSI Stealth 14 Studio A13VF
Asus VivoBook Pro 16 OLED K6602VV: Intel Core i9-13900H, 16.00", 1.9 kg
External Review » Asus VivoBook Pro 16 OLED K6602VV
Asus Zenbook Pro 14 OLED UX6404VV: Intel Core i9-13900H, 14.50", 1.6 kg
External Review » Asus Zenbook Pro 14 OLED UX6404VV
MSI Katana 17 B12VFK: Intel Core i7-12650H, 17.30", 2.6 kg
External Review » MSI Katana 17 B12VFK
Asus ROG Strix G16 G614JV, i7-13650HX: Intel Core i7-13650HX, 16.00", 2.5 kg
External Review » Asus ROG Strix G16 G614JV, i7-13650HX
Dell G15 5530: Intel Core i7-13650HX, 15.60", 3 kg
External Review » Dell G15 5530
MSI Summit E16 Flip A13 VFT: Intel Core i7-1360P, 16.00", 2.1 kg
External Review » MSI Summit E16 Flip A13 VFT
MSI Vector GP77 13VF: Intel Core i7-13700H, 17.30", 2.8 kg
External Review » MSI Vector GP77 13VF
MSI Stealth 16 Studio A13VF: Intel Core i7-13620H, 16.00", 2 kg
External Review » MSI Stealth 16 Studio A13VF
Alienware m16 R1 Intel: Intel Core i7-13700HX, 16.00", 3 kg
External Review » Alienware m16 R1, i7-13700HX RTX 4060
Acer Predator Helios 16 PH16-71-731Q: Intel Core i7-13700HX, 16.00", 2.6 kg
External Review » Acer Predator Helios 16 PH16-71-731Q
Lenovo LOQ 15IRH8, i7-13620H: Intel Core i7-13620H, 15.60", 2.4 kg
External Review » Lenovo LOQ 15IRH8, i7-13620H
Razer Blade 18 2023 RTX 4060: Intel Core i9-13950HX, 18.00", 3.2 kg
External Review » Razer Blade 18 2023 RTX 4060
Asus ROG Flow X13 GV302XV: AMD Ryzen 9 7940HS, 13.40", 1.3 kg
External Review » Asus ROG Flow X13 GV302XV
MSI Pulse 15 B13VFK: Intel Core i9-13900H, 15.60", 2.3 kg
External Review » MSI Pulse 15 B13VFK
MSI Pulse 17 B13VFK: Intel Core i7-13700H, 17.30", 2.7 kg
External Review » MSI Pulse 17 B13VFK
MSI Cyborg 15 A12VF: Intel Core i7-12650H, 15.60", 2 kg
External Review » MSI Cyborg 15 A12VF
MSI Katana 17 B13VFK: Intel Core i7-13620H, 17.30", 2.8 kg
External Review » MSI Katana 17 B13VFK
Acer Predator Helios Neo 16 PHN16-71-702Z: Intel Core i7-13700HX, 16.00", 2.6 kg
External Review » Acer Predator Helios Neo 16 PHN16-71-702Z
Asus ROG Strix G18 G814JV: Intel Core i7-13700HX, 18.00", 3 kg
External Review » Asus ROG Strix G18 G814JV
Asus ROG Strix G16 G614JV: Intel Core i9-13980HX, 16.00", 2.5 kg
External Review » Asus ROG Strix G16 G614JV
Asus ROG Flow X16 GV601V: Intel Core i9-13900H, 16.00", 2.1 kg
External Review » Asus ROG Flow X16 GV601V
Lenovo Legion Pro 5 16IRX8, i5-13500HX RTX 4060: Intel Core i5-13500HX, 16.00", 2.6 kg
External Review » Lenovo Legion Pro 5 16IRX8, i5-13500HX RTX 4060
Lenovo Legion Slim 7 16IRH8: Intel Core i7-13700H, 16.00", 2 kg
External Review » Lenovo Legion Slim 7 16IRH8
MSI Katana 15 B13VFK: Intel Core i7-13620H, 15.60", 2.3 kg
External Review » MSI Katana 15 B13VFK
Gigabyte G5 KF: Intel Core i5-12500H, 15.60", 1.9 kg
External Review » Gigabyte G5 KF
Asus ROG Flow Z13 GZ301V: Intel Core i9-13900H, 13.40", 1.6 kg
External Review » Asus ROG Flow Z13 GZ301V
Asus ROG Zephyrus G16 GU603VV: Intel Core i7-13620H, 16.00", 2 kg
External Review » Asus ROG Zephyrus G16 GU603VV
Lenovo Legion Pro 5 16IRX8: Intel Core i7-13700HX, 16.00", 2.5 kg
External Review » Lenovo Legion Pro 5 16IRX8
Asus ROG Zephyrus G16 GU603VV-N4007W: Intel Core i9-13900H, 16.00", 2 kg
External Review » Asus ROG Zephyrus G16 2023 GU603VV-N4007W
MSI Prestige 16 AI Studio B1VFG, Ultra 7 155H: Intel Core Ultra 7 155H, 16.00", 1.6 kg
» 英特尔酷睿 200 Geekbench 数据泄露:新款笔记本 CPU 被命名为 Raptor Lake 游戏处理器
Acer Nitro 14 AN14-41-R3MX: AMD Ryzen 5 8645HS, 14.50", 2 kg
» 宏碁 Nitro 14 是一款 QHD 游戏笔记本,散热良好,电池续航时间长达 18 小时
Microsoft Surface Laptop Studio 2 RTX 4060: Intel Core i7-13700H, 14.40", 2 kg
» 微软新款 Surface 笔记本电脑价格昂贵,但产品不够出色
» Comparison of GPUs
Detailed list of all laptop GPUs sorted by class and performance.
» Benchmark List
Sort and restrict laptop GPUs based on performance in synthetic benchmarks.
» Notebook Gaming List
Playable games for each graphics card and their average FPS results.
* Approximate position of the graphics adapter
» Notebookcheck多媒体笔记本电脑Top 10排名
» Notebookcheck游戏笔记本电脑Top 10排名
» Notebookcheck低价办公/商务笔记本电脑Top 10排名
» Notebookcheck高端办公/商务笔记本电脑Top 10排名
» Notebookcheck工作站笔记本电脑Top 10排名
» Notebookcheck亚笔记本电脑Top 10排名
» Notebookcheck超级本产品Top 10排名
» Notebookcheck变形本产品Top 10排名
» Notebookcheck平板电脑Top 10排名
» Notebookcheck智能手机Top 10排名
» Notebookcheck评测过最出色的笔记本电脑屏幕
» Notebookcheck售价500欧元以下笔记本电脑Top 10排名
» Notebookcheck售价300欧元以下笔记本电脑Top 10排名