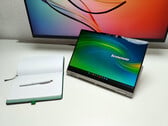
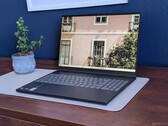
Notebookcheck Logo

AMD Radeon 840M

AMD Radeon 840M

Radeon 840M是一款相当强大的 RDNA 3.5 架构 iGPU,于 2025 年初在 Krakan Point APU 中首次亮相,是 Radeon 740M.它的引擎盖下仅有一些不同之处,如更快的缓存;其 4CUs/WGPs (256 个统一着色器)运行频率高达 2,900 MHz。

它支持 DX12 Ultimate、光线追踪、AI 图像生成和其他现代功能,还支持许多流行的视频编解码器,首先包括 AVC、HEVC、VP9 和 AV1。与英特尔 Lunar Lake 芯片不同的是,最新加入的 VVC 编解码器不支持硬件。支持 Miracast 和 FreeSync。iGPU 可同时驱动多达 4 台显示器,分辨率高达 SUHD 4320p60。

预计 AMD 将在 2027 年之前完全支持基于 RDNA 3.5 的 GPU。

性能

其游戏性能足以在低图形设置下玩 2024 款游戏。从规格上看,840M 应该比一般的 Radeon 740M.

功耗

Krakan Point 芯片采用单芯片设计,这意味着 iGPU 与 CPU 内核采用相同的台积电 N4P 工艺制造,因此能效高于平均水平(截至 2024 年底)。

AMD Radeon 800M Series

Radeon 890M 1024 @ 2.9 GHz? Bit @ 7500 MHz
Radeon 880M 768 @ 2.9 GHz? Bit @ 7500 MHz
Radeon 860M 512 @ 2.9 GHz? Bit @ 7500 MHz
Radeon 840M 256 @ 2.9 GHz? Bit @ 7500 MHz
Radeon 820M 128 @ 2.9 GHz? Bit @ 7500 MHz
CodenameKrackan Point
ArchitectureRDNA 3+
iGPUIntegrated Graphics
Pipelines256 - unified
Raytracing Cores4
Core Speed2900 (Boost) MHz
Memory Speed7500 MHz
Shared Memoryyes
APIDirectX 12_2
Man. Technology4 nm
PCIe4
Displays4 Displays (max.), HDMI 2.1, DisplayPort 2.1
FeaturesFreeSync, Miracast, SUHD 4320p60 resolution support, AVC/HEVC/VP9/AV1 encoding and decoding
Notebook Sizemedium sized
Date of Announcement02.06.2024
PredecessorRadeon 740M
CPU in Radeon 840MGPU Base SpeedGPU Boost / Turbo
AMD Ryzen AI 5 3406 x 2000 MHz, 28 W? MHz2900 MHz
AMD Ryzen AI 5 PRO 3406 x 2000 MHz, 28 W? MHz2900 MHz
AMD Ryzen AI 7 4456 x 2000 MHz, 28 W? MHz2900 MHz
min. - max.? MHz2800 - 2900 MHz

Benchmarks

Performance Rating - 3DMark 11 + Fire Strike + Time Spy
2.1 pt (6%)
AMD Radeon HD 8180
0.0639 -97%
...
NVIDIA GeForce GTX 960M
1.903 -11%
1.926 -10%
NVIDIA Quadro P620
2.06 -4%
2.07 -3%
2.07 -3%
2.08 -3%
2.09 -2%
NVIDIA Quadro P1000
2.11 -1%
NVIDIA Quadro K5100M
2.11 -1%
AMD Radeon 840M
2.14
AMD Radeon 660M
2.15 0%
2.19 2%
AMD Radeon HD 8970M
2.22 4%
NVIDIA GeForce GTX 765M SLI
2.24 5%
AMD Radeon RX 460 (Laptop)
2.25 5%
2.27 6%
NVIDIA GeForce GTX 780M
2.31 8%
AMD Radeon R9 M290X
2.33 9%
2.44 14%
...
22.4 947%
max:
33.3 1456%
0%
100%
Restrict / Search: Model: Max. age: years
3DMark - 3DMark Speed Way Score
min: 130     avg: 136     median: 136 (1%)     max: 142 Points
3DMark - 3DMark Fire Strike Standard Score
min: 3598     avg: 4458     median: 4513 (7%)     max: 5208 Points
3DMark - 3DMark Fire Strike Standard Graphics
min: 3881     avg: 4799     median: 4854 (4%)     max: 5606 Points
3DMark - 3DMark Ice Storm Graphics
236090 Points (26%)
3DMark - 3DMark Time Spy Score
min: 1590     avg: 1711     median: 1663 (4%)     max: 1928 Points
3DMark - 3DMark Time Spy Graphics
min: 1403     avg: 1517     median: 1479 (3%)     max: 1705 Points
Intel UHD Graphics 600
107.5 -93%
...
unknown
1257 -17%
1281 -16%
1322 -13%
AMD Radeon Pro 560
1376 -9%
NVIDIA Quadro P620
1388 -9%
NVIDIA Quadro P1000
1395 -8%
AMD Radeon 660M
1450 -4%
1491 -2%
1496 -1%
AMD Radeon 840M
1517
AMD Radeon Pro 560X
1614 6%
NVIDIA GeForce GTX 1050 Max-Q
1615 6%
1616 7%
1672 10%
1724 14%
Intel Iris Xe MAX Graphics
1735 14%
1769 17%
AMD Radeon RX 560X (Laptop)
1788 18%
1796 18%
...
NVIDIA RTX PRO 5000 Blackwell Generation Laptop
23277 1434%
max:
NVIDIA GeForce RTX 5090
44063 2805%
0%
100%
Restrict / Search: Model: Max. age: years
3DMark - 3DMark Cloud Gate Score
min: 20257     avg: 23104     median: 22757.5 (22%)     max: 26645 Points
3DMark - 3DMark Cloud Gate Graphics
min: 27616     avg: 31142     median: 29795.5 (7%)     max: 37360 Points
3DMark 11 - 3DM11 Performance Score
min: 6985     avg: 7803     median: 7705.5 (9%)     max: 8814 Points
3DMark 11 - 3DM11 Performance GPU
min: 6676     avg: 7472     median: 7379 (6%)     max: 8453 Points
171.8 -98%
...
AMD Radeon R9 M290X
6817 -9%
AMD Radeon R9 M390
6819 -9%
NVIDIA Quadro K5100M
6894 -8%
7030 -6%
7042 -6%
7061 -6%
NVIDIA GeForce GTX 1050 Max-Q
7142 -4%
AMD Radeon HD 8970M
7180 -4%
7372 -1%
AMD Radeon 840M
7472
7536 1%
AMD Radeon Pro 560X
7590 2%
7662 3%
NVIDIA GeForce GTX 780M
7692 3%
AMD Radeon RX 460 (Laptop)
7793 4%
NVIDIA T500 Laptop GPU
7808 4%
NVIDIA GeForce GTX 765M SLI
7944 6%
AMD Radeon RX 560X (Laptop)
7970 7%
8067 8%
...
NVIDIA RTX PRO 5000 Blackwell Generation Laptop
68271 814%
max:
NVIDIA GeForce RTX 5090
129772 1637%
0%
100%
Restrict / Search: Model: Max. age: years
3DMark Vantage
3DM Vant. Perf. total +
3DMark Vantage - 3DM Vant. Perf. total
28720 Points (8%)
3DM Vant. Perf. GPU no PhysX +
3DMark Vantage - 3DM Vant. Perf. GPU no PhysX
24793 Points (14%)
ATI Radeon HD 3200
62 -100%
...
23042 -7%
23092 -7%
23936 -3%
23989 -3%
AMD Radeon R9 M290X
24205 -2%
24335 -2%
NVIDIA Quadro K5100M
24457 -1%
24558 -1%
24697 0%
AMD Radeon 840M
24793
24915 0%
Intel Arc Graphics 130T
24931 1%
25270 2%
NVIDIA GeForce GTX 1050 Max-Q
25293 2%
NVIDIA GeForce GTX 765M SLI
25664 4%
AMD FirePro W7170M
25898 4%
26569 7%
26936 9%
NVIDIA GeForce GTX 780M
27315 10%
...
132443 434%
max:
173912 601%
0%
100%
Restrict / Search: Model: Max. age: years
3DMark 06 3DMark 06 - Standard 1280x1024 +
3DMark 06
34953 Points (46%)
Cinebench R10 Cinebench R10 Shading (32bit) +
Cinebench R10 - Cinebench R10 Shading (32bit)
20280 points (14%)
Cinebench R15
Cinebench R15 OpenGL 64 Bit +
Cinebench R15 - Cinebench R15 OpenGL 64 Bit
min: 130.7     avg: 150.5     median: 145 (8%)     max: 181.3 fps
Cinebench R15 OpenGL Ref. Match 64 Bit +
Cinebench R15 - Cinebench R15 OpenGL Ref. Match 64 Bit
97.9 % (98%)
GFXBench - GFXBench 5.0 4K Aztec Ruins High Tier Offscreen
25 fps (9%)
GFXBench - GFXBench 5.0 Aztec Ruins High Tier Offscreen
56 fps (10%)
3.3 -94%
...
45 -20%
45.07 -20%
NVIDIA GeForce GTX 1050 Max-Q
48.1 -14%
48.6 -13%
NVIDIA GeForce GTX 1050 Ti Max-Q
49.5 -12%
Intel Arc Graphics 130T
50 -11%
51.3 -8%
AMD Radeon 680M
51.7 -8%
AMD Radeon RX 560X (Laptop)
52.4 -6%
AMD Radeon 840M
56
57.2 2%
57.6 3%
61.4 10%
62.7 12%
62.7 12%
62.8 12%
62.9 12%
63.8 14%
64.7 16%
...
530 846%
0%
100%
Restrict / Search: Model: Max. age: years
GFXBench - GFXBench 5.0 Aztec Ruins Normal Tier Offscreen
139.4 fps (10%)
Basemark GPU 1.2 - Basemark GPU 1.2 Vulkan Official Medium Offscreen 1080
104.6 fps (3%)
Basemark GPU 1.2 - Basemark GPU 1.2 Vulkan Official High Offscreen 2160
3.6 fps (1%)
Geekbench 6.6 - Geekbench 6.6 GPU OpenCL
min: 11984     avg: 13175     median: 13292.5 (3%)     max: 14132 points
Geekbench 6.6 - Geekbench 6.6 GPU Vulkan
min: 20105     avg: 21620     median: 21770.5 (5%)     max: 22833 points
LuxMark v2.0 64Bit - LuxMark v2.0 Room GPU
367 Samples/s (1%)
LuxMark v2.0 64Bit - LuxMark v2.0 Sala GPU
720 Samples/s (1%)
ComputeMark v2.1 - ComputeMark v2.1 Result
4356 points (4%)
Power Consumption - Furmark Stress Test Power Consumption - external Monitor *
min: 47     avg: 54.1     median: 54.9 (7%)     max: 59.4 Watt
051015202530354045505560Tooltip
Power Consumption - Cyberpunk 2077 Power Consumption 150cd *
min: 47.8     avg: 52.5     median: 52.5 (15%)     max: 57.3 Watt
051015202530354045505560Tooltip
Power Consumption - Cyberpunk 2077 Power Consumption - external Monitor *
min: 39.9     avg: 48.4     median: 49.4 (6%)     max: 54.8 Watt
05101520253035404550556065Tooltip
Power Consumption - Power Efficiency - Cyberpunk 2077 ultra
min: 0.2007     avg: 0.2     median: 0.2 (1%)     max: 0.2205 fps per Watt
- Range of benchmark values
red legend - Average benchmark values
* Smaller numbers mean a higher performance

Game Benchmarks

The following benchmarks stem from our benchmarks of review laptops. The performance depends on the used graphics memory, clock rate, processor, system settings, drivers, and operating systems. So the results don't have to be representative for all laptops with this GPU. For detailed information on the benchmark results, click on the fps number.

Death Stranding 2

Death Stranding 2

2026
low 1920x1080
10.6  fps    + Compare + 📈 Graph
med. 1920x1080
8.7  fps    + Compare + 📈 Graph
high 1920x1080
8.2  fps    + Compare + 📈 Graph
» The benchmarks indicate that the game is not playable in the tested settings.
Crimson Desert

Crimson Desert

2026
low 1920x1080
14  fps    + Compare + 📈 Graph
med. 1920x1080
7.4  fps    + Compare + 📈 Graph
high 1920x1080
6.8  fps    + Compare + 📈 Graph
» The benchmarks indicate that the game is not playable in the tested settings.
Resident Evil Requiem

Resident Evil Requiem

2026
low 1920x1080
20.3  fps    + Compare + 📈 Graph
med. 1920x1080
13.3  fps    + Compare + 📈 Graph
high 1920x1080
9.2  fps    + Compare + 📈 Graph
» The benchmarks indicate that the game is not playable in the tested settings.
Call of Duty Black Ops 7

Call of Duty Black Ops 7

2025
low 1920x1080
41  fps    + Compare
med. 1920x1080
36  fps    + Compare
high 1920x1080
25  fps    + Compare
» With all tested laptops playable in detail settings med..
Anno 117: Pax Romana

Anno 117: Pax Romana

2025
low 1920x1080
14.4 17.2 ~ 16 fps    + Compare
med. 1920x1080
9.5 11.4 ~ 10 fps    + Compare
high 1920x1080
7 8.1 ~ 8 fps    + Compare
» The benchmarks indicate that the game is not playable in the tested settings.
low 1920x1080
32.8 39.8 ~ 36 fps    + Compare + 📈 Graph
med. 1920x1080
21.7 27.4 ~ 25 fps    + Compare + 📈 Graph
high 1920x1080
15.3 18.5 ~ 17 fps    + Compare + 📈 Graph
» With most tested laptops playable in detail settings low.
low 1920x1080
13.4 16.4 ~ 15 fps    + Compare + 📈 Graph
med. 1920x1080
9.9 12.2 ~ 11 fps    + Compare + 📈 Graph
high 1920x1080
7.6 8.9 ~ 8 fps    + Compare + 📈 Graph
» The benchmarks indicate that the game is not playable in the tested settings.
low 1920x1080
8.7  fps    + Compare + 📈 Graph
med. 1920x1080
7.4  fps    + Compare + 📈 Graph
high 1920x1080
5.8  fps    + Compare + 📈 Graph
» The benchmarks indicate that the game is not playable in the tested settings.
F1 25

F1 25

2025
low 1920x1080
43  fps    + Compare
med. 1920x1080
34  fps    + Compare
high 1920x1080
24  fps    + Compare
» With all tested laptops playable in detail settings low.
low 1920x1080
8.2  fps    + Compare + 📈 Graph
med. 1920x1080
6.3  fps    + Compare + 📈 Graph
high 1920x1080
0 (!)  fps    + Compare
» The benchmarks indicate that the game is not playable in the tested settings.
low 1920x1080
10.9  fps    + Compare + 📈 Graph
med. 1920x1080
9.6  fps    + Compare + 📈 Graph
high 1920x1080
0 (!)  fps    + Compare
» The benchmarks indicate that the game is not playable in the tested settings.
low 1920x1080
12  fps    + Compare
med. 1920x1080
11  fps    + Compare
high 1920x1080
9  fps    + Compare
» The benchmarks indicate that the game is not playable in the tested settings.
low 1920x1080
78.5  fps    + Compare + 📈 Graph
med. 1920x1080
39.1  fps    + Compare + 📈 Graph
high 1920x1080
20.1  fps    + Compare + 📈 Graph
» With all tested laptops playable in detail settings med..
low 1920x1080
12.4  fps    + Compare
med. 1920x1080
9.8  fps    + Compare
high 1920x1080
0 (!)  fps    + Compare
» The benchmarks indicate that the game is not playable in the tested settings.
low 1920x1080
23.8  fps    + Compare + 📈 Graph
med. 1920x1080
17.1  fps    + Compare + 📈 Graph
high 1920x1080
13.9  fps    + Compare + 📈 Graph
» The benchmarks indicate that the game is not playable in the tested settings.
low 1920x1080
13.8  fps    + Compare + 📈 Graph
high 1920x1080
0 (!)  fps    + Compare
» The benchmarks indicate that the game is not playable in the tested settings.
Stalker 2

Stalker 2

2024
low 1920x1080
11.9  fps    + Compare + 📈 Graph
med. 1920x1080
10.1  fps    + Compare + 📈 Graph
high 1920x1080
8.1  fps    + Compare + 📈 Graph
» The benchmarks indicate that the game is not playable in the tested settings.
low 1920x1080
25.9  fps    + Compare + 📈 Graph
med. 1920x1080
16.1  fps    + Compare + 📈 Graph
high 1920x1080
10.5  fps    + Compare + 📈 Graph
» The benchmarks indicate that the game is not playable in the tested settings.
low 1920x1080
15.9  fps    + Compare + 📈 Graph
med. 1920x1080
13.8  fps    + Compare + 📈 Graph
high 1920x1080
12.2  fps    + Compare + 📈 Graph
» The benchmarks indicate that the game is not playable in the tested settings.
low 1920x1080 cinem.
7.5  fps    + Compare + 📈 Graph
med. 1920x1080 cinem.
6.6  fps    + Compare + 📈 Graph
high 1920x1080 cinem.
5.3  fps    + Compare + 📈 Graph
» The benchmarks indicate that the game is not playable in the tested settings.
F1 24

F1 24

2024
low 1920x1080
38.8 44 45.8 ~ 43 fps    + Compare
med. 1920x1080
38 39 ~ 39 fps    + Compare
high 1920x1080
27 27.3 ~ 27 fps    + Compare
ultra 1920x1080
5.6  fps    + Compare
» With all tested laptops playable in detail settings med..
low 1920x1080
10.5  fps    + Compare + 📈 Graph
med. 1920x1080
8.8  fps    + Compare + 📈 Graph
high 1920x1080
6.4  fps    + Compare + 📈 Graph
» The benchmarks indicate that the game is not playable in the tested settings.
low 1920x1080
20.1  fps    + Compare + 📈 Graph
med. 1920x1080
15.9  fps    + Compare + 📈 Graph
high 1920x1080
13.2  fps    + Compare + 📈 Graph
» The benchmarks indicate that the game is not playable in the tested settings.
low 1920x1080
18.2  fps    + Compare + 📈 Graph
med. 1920x1080
15.4  fps    + Compare + 📈 Graph
high 1920x1080
10.6  fps    + Compare + 📈 Graph
» The benchmarks indicate that the game is not playable in the tested settings.
low 1920x1080
15.3  fps    + Compare + 📈 Graph
high 1920x1080
11.3  fps    + Compare + 📈 Graph
» The benchmarks indicate that the game is not playable in the tested settings.
low 1920x1080
22.5  fps    + Compare + 📈 Graph
med. 1920x1080
16.7  fps    + Compare + 📈 Graph
high 1920x1080
14.7  fps    + Compare + 📈 Graph
» The benchmarks indicate that the game is not playable in the tested settings.
med. 1920x1080
162.8  fps    + Compare + 📈 Graph
high 1920x1080
113.5  fps    + Compare + 📈 Graph
» With all tested laptops playable in detail settings high.
low 1920x1080
84.4  fps    + Compare + 📈 Graph
med. 1920x1080
68  fps    + Compare + 📈 Graph
high 1920x1080
29.6  fps    + Compare + 📈 Graph
» With all tested laptops playable in detail settings med..
low 1920x1080
21 23.5 24.8 25.9 ~ 24 fps    + Compare
med. 1920x1080
15.2 17.1 18.4 19.1 ~ 17 fps    + Compare
high 1920x1080
12.8 13.6 15.2 15.4 ~ 14 fps    + Compare
ultra 1920x1080
11 12.2 12.4 ~ 12 fps    + Compare
» The benchmarks indicate that the game is not playable in the tested settings.
Additional Benchmarks
Low Preset (FSR off) 1280x720
45.4
37.5
30min Start Ultra Preset (FSR off) 1920x1080
11.6
9.6
11
9.5
low 1920x1080
19.8 20.6 23.1 23.9 ~ 22 fps    + Compare + 📈 Graph
med. 1920x1080
15.5 17.6 18.6 19 ~ 18 fps    + Compare + 📈 Graph
high 1920x1080
11.8 13.3 13.4 14.2 ~ 13 fps    + Compare + 📈 Graph
ultra 1920x1080
11.4 12.5 12.8 14 ~ 13 fps    + Compare + 📈 Graph
» The benchmarks indicate that the game is not playable in the tested settings.
Additional Benchmarks
Low Preset SMAA 1280x720
38.7
32.8
Strange Brigade

Strange Brigade

2018
low 1280x720
112.7 129.8 131.9 ~ 125 fps    + Compare
med. 1920x1080
39.7 48.6 50.6 ~ 46 fps    + Compare
high 1920x1080
32.7 40.2 41.1 ~ 38 fps    + Compare
ultra 1920x1080
28.4 33.5 34.2 ~ 32 fps    + Compare
» With most tested laptops playable in detail settings high.
low 1280x720
47.7 52.5 57.3 59 ~ 54 fps    + Compare
med. 1920x1080
37.7 39.9 42 42.9 ~ 41 fps    + Compare
high 1920x1080
31.2 34 34 36.5 ~ 34 fps    + Compare
» With all tested laptops playable in detail settings med..
low 1280x720
46.5 57.4 61.1 ~ 55 fps    + Compare
med. 1920x1080
22.6 24.7 25.6 ~ 24 fps    + Compare
high 1920x1080
16.7 16.8 18.2 ~ 17 fps    + Compare
» With all tested laptops playable in detail settings low.
low 1280x720
124.6 134.5 136.8 167.5 ~ 141 fps    + Compare
med. 1366x768
103.2 109.5 121.1 124.5 ~ 115 fps    + Compare
high 1920x1080
59.8 63.7 71.4 73.7 ~ 67 fps    + Compare
ultra 1920x1080
54.2 56.5 62.6 66 ~ 60 fps    + Compare
» With all tested laptops playable in detail settings ultra.
GTA V

GTA V

2015
low 1024x768
130.6 148.8 151.9 163.2 ~ 149 fps    + Compare
med. 1366x768
130 151.5 ~ 141 fps    + Compare
high 1920x1080
40.7 45.4 46.1 50.2 ~ 46 fps    + Compare
ultra 1920x1080
13.7 18.3 19.3 21.5 ~ 18 fps    + Compare
» With all tested laptops playable in detail settings high.
Additional Benchmarks
Normal/Off 4xAF 1920x1080
120.2
91
Lowest Settings possible 1920x1080
123.4
83.3
lowmed.highultraQHD4K
Death Stranding 210.68.738.16
Crimson Desert147.386.76
Resident Evil Requiem20.313.39.21
Call of Duty Black Ops 7413625
Anno 117: Pax Romana16108
ARC Raiders362517
The Outer Worlds 215118
Borderlands 48.717.45.84
F1 25433424
Doom: The Dark Ages8.156.33
The Elder Scrolls IV Oblivion Remastered10.99.59
Assassin's Creed Shadows12119
Civilization 778.539.120.1
Monster Hunter Wilds12.49.8
Kingdom Come Deliverance 223.817.113.9
Indiana Jones and the Great Circle13.8
Stalker 211.910.18.1
Until Dawn25.916.110.5
Space Marine 215.913.812.2
Star Wars Outlaws7.56.635.29
F1 244339275.63
Senua's Saga Hellblade 210.58.786.43
Ghost of Tsushima20.115.913.2
Horizon Forbidden West18.215.410.6
Dragon's Dogma 215.311.3
Helldivers 222.516.714.7
Prince of Persia The Lost Crown162.8113.5
Counter-Strike 284.46829.6
Cyberpunk 207724171412
Baldur's Gate 322181313
Strange Brigade125463832
X-Plane 11.11544134
Final Fantasy XV Benchmark552417
Dota 2 Reborn1411156760
GTA V1491414618
lowmed.highultraQHD4K
< 30 fps
< 60 fps
< 120 fps
≥ 120 fps
23
6
2
3
23
6
2
2
26
3
2
4
1
1


For more games that might be playable and a list of all games and graphics cards visit our Gaming List

Amazon Logo
  • $729.00
    Lenovo Yoga 7 2-in-1 AI PC Copilot Laptop, 16" 2K LCD Touchscreen, AMD Ryzen AI 5 340, AMD Radeon 840M, 16GB LPDDR5X, 1TB SSD, WiFi 7, Backlit KB, Fingerprint, 1080P Webcam, W/128 PSD, Win 11 Home
  • $629.99
    Dell Plus 2 in 1 Laptop, 14" FHD+ Touchscreen, Radeon 840M AMD Ryzen AI 5 340 (Beat i7-1360P), 16GB DDR5 512GB SSD Copilot+ PC Backlit Keyboard Fingerprint Reader Computer for Gaming Business
  • $699.00
    HP OmniBook X Flip 2-in-1 16" FHD+ Touch Screen Laptop |AMD Ryzen AI 5 340|AMD Radeon 840M | Copilot|Backlit|Meteor Silver| 16GB RAM DDR5 | 512GB SSD |Windows 11 Home|Bundle with Stylus Pen
  • $669.00
    Dell 2025 14 Plus 2-in-1 14” WUXGA Touch Laptop 6-Core AMD Ryzen AI 5 340 AMD Radeon 840M Graphics 16GB LPDDR5 512GB SSD USB-C w/DP WiFi BE BT Webcam HDMI1.4 Backlit KB Fingerprint Windows 11 Home
  • $629.97
    Lenovo Yoga 7 2-in-1 Copilot+ PC 16" WUXGA Touchscreen Laptop|AMD Ryzen AI 5 340|AMD Radeon 840M|Fingerprint|Backlit| 16GB RAM DDR5 | 512GB SSD | Windows 11 Home | Bundle with USB 3.0 Hub

v1.35
log 28. 08:58:10

#0 ran 0s before starting gpusingle class +0s ... 0s

#1 no ids found in url (should be separated by "_") +0s ... 0s

#2 not redirecting to Ajax server +0s ... 0s

#3 did not recreate cache, as it is less than 5 days old! Created at Tue, 28 Apr 2026 05:29:52 +0200 +0.005s ... 0.006s

#4 no comparison url found in template nbc.compare_page_1 needed +0.018s ... 0.024s

#5 no comparison url found in template nbc.compare_page_1 needed +0s ... 0.024s

#6 no comparison url found in template nbc.compare_page_1 needed +0s ... 0.024s

#7 no comparison url found in template nbc.compare_page_1 needed +0s ... 0.025s

#8 composed specs +0.001s ... 0.025s

#9 did output specs +0s ... 0.025s

#10 start showIntegratedCPUs +0s ... 0.025s

#11 getting avg benchmarks for device 12990 +0.056s ... 0.082s

#12 got single benchmarks 12990 +0.026s ... 0.108s

#13 got avg benchmarks for devices +0s ... 0.108s

#14 min, max, avg, median took s +2.125s ... 2.233s

#15 before gaming benchmark output +0s ... 2.233s

#16 Got 189 rows for game benchmarks. +0.021s ... 2.253s

#17 composed SQL query for gamebenchmarks +0s ... 2.253s

#18 got data and put it in $dataArray +0.019s ... 2.272s

#19 benchmarks composed for output. +0.5s ... 2.772s

#20 no comparison url found in template nbc.compare_page_1 needed +0.299s ... 3.071s

#21 return log +0s ... 3.071s

Notebook reviews with AMD Radeon 840M graphics card

联想 Yoga Slim 7a 14 评测

联想 Yoga Slim 7a 14 笔记本电脑评测:任何价格的超薄

联想广受欢迎的 Yoga 系列的轻薄版采用了优雅而特别纤薄的机身。在我们的评测中,我们将了解这款产品在哪些方面发挥了作用,哪些方面受到了影响,以及全新 Ryzen AI 7 445 处理器的性能如何。
AMD Ryzen AI 7 445, Radeon 840M, 14", 1.2 kg
联想 IdeaPad 5 2 合 1 15 评测:Ryzen AI 5 430 性能首秀

联想 IdeaPad 5 2 合 1 15 评测:Ryzen AI 5 430 性能首秀

作为为数不多的 15.3 英寸可折叠笔记本电脑之一,新款 IdeaPad 5 2-in-1 15 以入门级用户为目标,同时还提供了最新的 AMD Zen 5 CPU 和 165 Hz OLED,而且价格并不贵。
AMD Ryzen AI 5 430, Radeon 840M, 15.3", 1.8 kg
联想 Yoga 7 二合一 16AGP11 评测:最新的 AMD Ryzen AI 7 更新版落后于英特尔

联想 Yoga 7 二合一 16AGP11 评测:最新的 AMD Ryzen AI 7 更新版落后于英特尔

2026 年,Yoga 7 二合一 16 再次面世,其外观设计与最初的 2023 型号完全相同。相反,新的 CPU 和显示屏选项有助于将这款最新机型与早期配置区分开来,有时甚至是最坏的区分。
AMD Ryzen AI 7 445, Radeon 840M, 16", 1.8 kg
联想 Yoga 7 二合一 14AKP10 笔记本电脑评测:Zen 5 向英特尔发起挑战

联想 Yoga 7 二合一 14AKP10 笔记本电脑评测:Zen 5 向英特尔发起挑战

联想推出的 Yoga 7 二合一笔记本电脑不仅如其名称所示,是一款用途极为广泛的笔记本电脑,而且有多种配置可供选择。我们选择了一款搭载之前未测试过的 Ryzen AI 5 340 的机型,并将其性能与同类产品进行了比较。
AMD Ryzen AI 5 340, Radeon 840M, 14", 1.4 kg

Asus Zenbook 14 UM3406GA: AMD Ryzen AI 5 430, 14.00", 1.2 kg
  External Review » Asus Zenbook 14 UM3406GA

Asus Vivobook S14 M3407GA: AMD Ryzen AI 7 445, 14.00", 1.4 kg
  External Review » 华硕 Vivobook S14 M3407GA

Lenovo Yoga Slim 7a 14AGP11 AI 5 430: AMD Ryzen AI 5 430, 14.00", 1.2 kg
  External Review » Lenovo Yoga Slim 7a 14AGP11

Lenovo IdeaPad Pro 5 14AKP10: AMD Ryzen AI 5 340, 14.00", 0 kg
  External Review » Lenovo IdeaPad Pro 5 14AKP10

HP OmniBook X Flip NGAI 14-fk0000ng: AMD Ryzen AI 5 340, 14.00", 1.4 kg
  External Review » HP OmniBook X Flip NGAI 14-fk0000ng

Dell 14 Plus DB14255: AMD Ryzen AI 5 340, 14.00", 1.5 kg
  External Review » Dell 14 Plus DB14255

Acer Swift Air 16 SFA16-61M: AMD Ryzen AI 5 340, 16.00", 1.1 kg
  External Review » Acer Swift Air 16 SFA16-61M

HP OmniBook 3 NGAI 15-fn0000: AMD Ryzen AI 5 340, 15.60", 1.7 kg
  External Review » HP OmniBook 3 NGAI 15-fn0000

HP OmniBook 5 NGAI 16-ag1000: AMD Ryzen AI 5 340, 16.00", 1.8 kg
  External Review » HP OmniBook 5 NGAI 16-ag1000

Dell 14 Plus 2-in-1, Ryzen AI 5 340: AMD Ryzen AI 5 340, 14.00", 1.6 kg
  External Review » Dell 14 Plus 2-in-1, Ryzen AI 5 340

Lenovo IdeaPad 5 2-in-1 15AGP11: AMD Ryzen AI 5 430, 15.30", 1.8 kg
   » Ryzen AI 5 430 首次基准测试结果喜忧参半

   » 联想新款 IdeaPad 5a 2-in-1 15 升级 OLED 几乎没有悬念

Lenovo Yoga 7 2-in-1 16AGP11: AMD Ryzen AI 7 445, 16.00", 1.8 kg
   » AMD Ryzen AI 7 445 首次内部基准测试结果令人失望

Please share our article, every link counts!
Mail Logo

» Comparison of GPUs
Detailed list of all laptop GPUs sorted by class and performance.

» Benchmark List
Sort and restrict laptop GPUs based on performance in synthetic benchmarks.

» Notebook Gaming List
Playable games for each graphics card and their average FPS results.

Class 1

Class 2

GeForce RTX 2080 Super Mobile
RTX PRO 2000 Blackwell Generation Laptop
M5 Max 32-Core GPU *
M1 Max 32-Core GPU *
M1 Max 24-Core GPU *
GeForce RTX 2070 Super Mobile
Radeon 8050S
Quadro RTX 5000 Max-Q
Radeon RX 5700M *
Quadro RTX 4000 (Laptop)
GeForce GTX 1080 Mobile
M1 Pro 16-Core GPU *
Radeon PRO W6600M *
GeForce RTX 2070 Super Max-Q
RTX PRO 1000 Blackwell Generation Laptop *
M1 Pro 14-Core GPU *
Quadro RTX 4000 Max-Q
Quadro P5200
Quadro RTX 3000 Max-Q
Quadro P4200
Radeon 8040S *
Pro A60M *

Class 3

Quadro P5000 Max-Q *
Quadro P4000
Arc 140T
Quadro P4000 Max-Q
Quadro P3200
Radeon RX 580X (Laptop) *
Radeon RX 580 (Laptop)
Pro A30M
Radeon Pro 5300M
Radeon RX 5300M
Quadro P3000 Max-Q *
Quadro T2000 Max-Q
Radeon RX 570X (Laptop) *
Radeon RX 570 (Laptop) *
Quadro T1000 Max-Q *
Vega M GH
GeForce GTX 1050 Ti Mobile
GeForce GTX 1050 Ti Max-Q
Radeon 680M
Quadro P2000
Quadro P2000 Max-Q
T500 Laptop GPU
Arc 130T
Radeon Pro Vega 16
WX Vega M GL
GeForce GTX 1050 Max-Q
Radeon 660M
Radeon Pro WX 4150 *
Radeon RX 560X (Laptop)
Radeon RX 560 (Laptop)
Quadro P1000
Xe MAX
Radeon Pro 560X
Radeon Pro 560
Quadro P620
Radeon RX 550X (Laptop)
Radeon Pro WX 3200 *
Radeon Pro 555X
Radeon Pro 555
Quadro P600
Graphics 3-Core iGPU (Arrow Lake) *
Radeon Pro WX 2100 *
Radeon Pro WX 3100 *
Graphics 2-Core iGPU (Arrow Lake) *
Radeon 630
Quadro P520
Radeon RX 540X *
Radeon 540X *
Quadro P500 *
Vega 10
Vega 9
Iris Plus Graphics G7 (Ice Lake 64 EU) *
UHD Graphics 32EUs
UHD Graphics 750
Vega 7
UHD Graphics Xe 32EUs (Tiger Lake-H)
UHD Graphics Xe G4 48EUs
Vega 8
UHD Graphics 730
Iris Plus Graphics G4 (Ice Lake 48 EU)
Iris Plus Graphics 650
Radeon 625
Vega 6 *
Iris Plus Graphics 640
UHD Graphics 24EUs (Alder Lake-N) *
GeForce 920M
Radeon 620
Radeon 610
Radeon 610M *
Vega 6 *
UHD Graphics Xe 16EUs *
UHD Graphics G1 (Ice Lake 32 EU)
Adreno 690 *
Adreno 685 *
Adreno 680 *
GeForce 910M

Class 4

* Approximate position of the graphics adapter