结论 - 适合办公室或家庭使用的专业外观
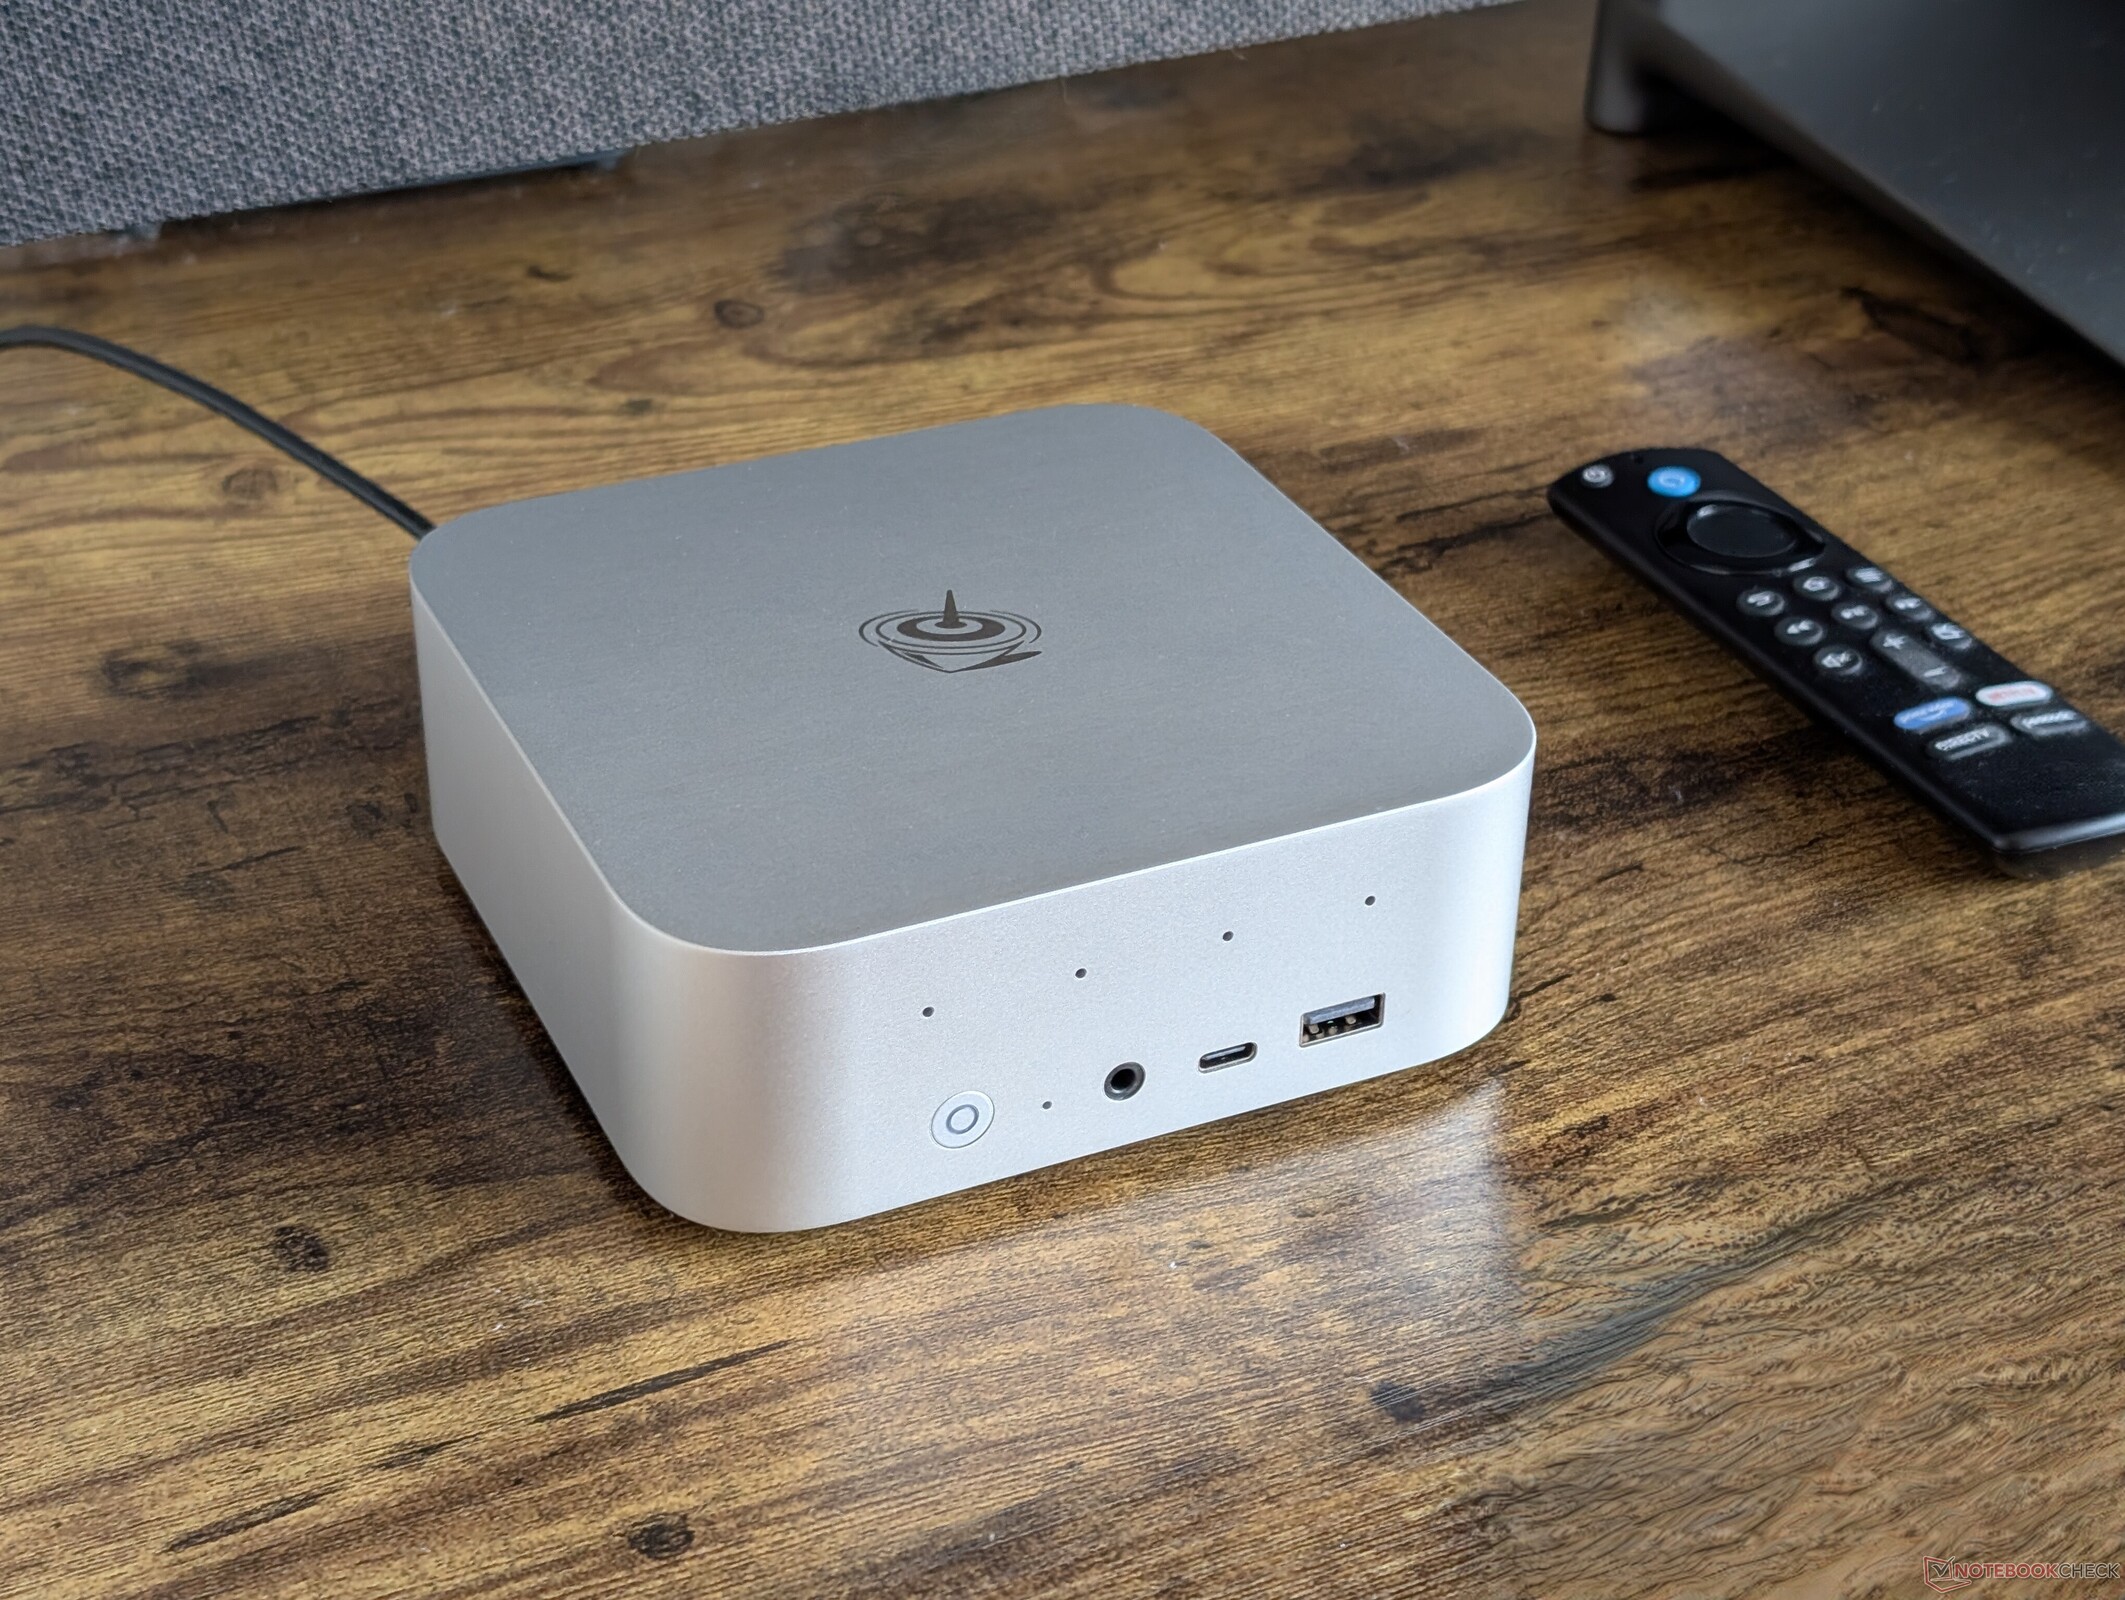
Beelink SEi13 Pro 最吸引人的地方之一是其灵感源自Apple 的设计,因为与 SER7 的老式重塑料设计相比,该系统更容易融入办公室或家庭环境。 SER7 或 SEi12一代相比,它更容易融入办公室或家庭环境。更高品质的构造和材料并没有导致价格的大幅提高,这意味着 SEi13 Pro 的价格仍在 500 至 600 美元之间。
CPU 性能和端口也保持强劲,酷睿 i9-13900HK 和三种视频输出端口足以满足大多数办公或多媒体设置的需要。此外,我们还非常欣赏它的静音效果和更紧凑的尺寸,与更大更贵的 GTi13 Ultra相比,GTi13 Ultra 的噪音更小、尺寸更紧凑。
虽然大多数用户会认为 SEi13 Pro 足够使用,但高级用户可能会对 CPU 缺乏人工智能加速功能以及即使是集成图形处理器也整体较弱的图形性能表示不满。集成的立体声扬声器虽然纸面性能不错,但音量不足以让会议室或客厅充满音效。VESA、Thunderbolt 支持甚至 SD 读卡器等功能的缺失可能会限制连接选项,并对用户体验产生负面影响。升级到 GTi13 Ultra 可以解决其中一些问题,而 AMD 的替代产品,如 SER8 等 AMD 替代品则能以差不多的价格提供更强的图形处理能力。
Pros
Cons
价格和供应情况
亚马逊现已开始销售Beelink SEi13 Pro,售价为 540 美元。用户也可以直接从制造商处购买https://www.bee-link.com/products/beelink-sei13pro-i9-13900hk以相同的价格购买。
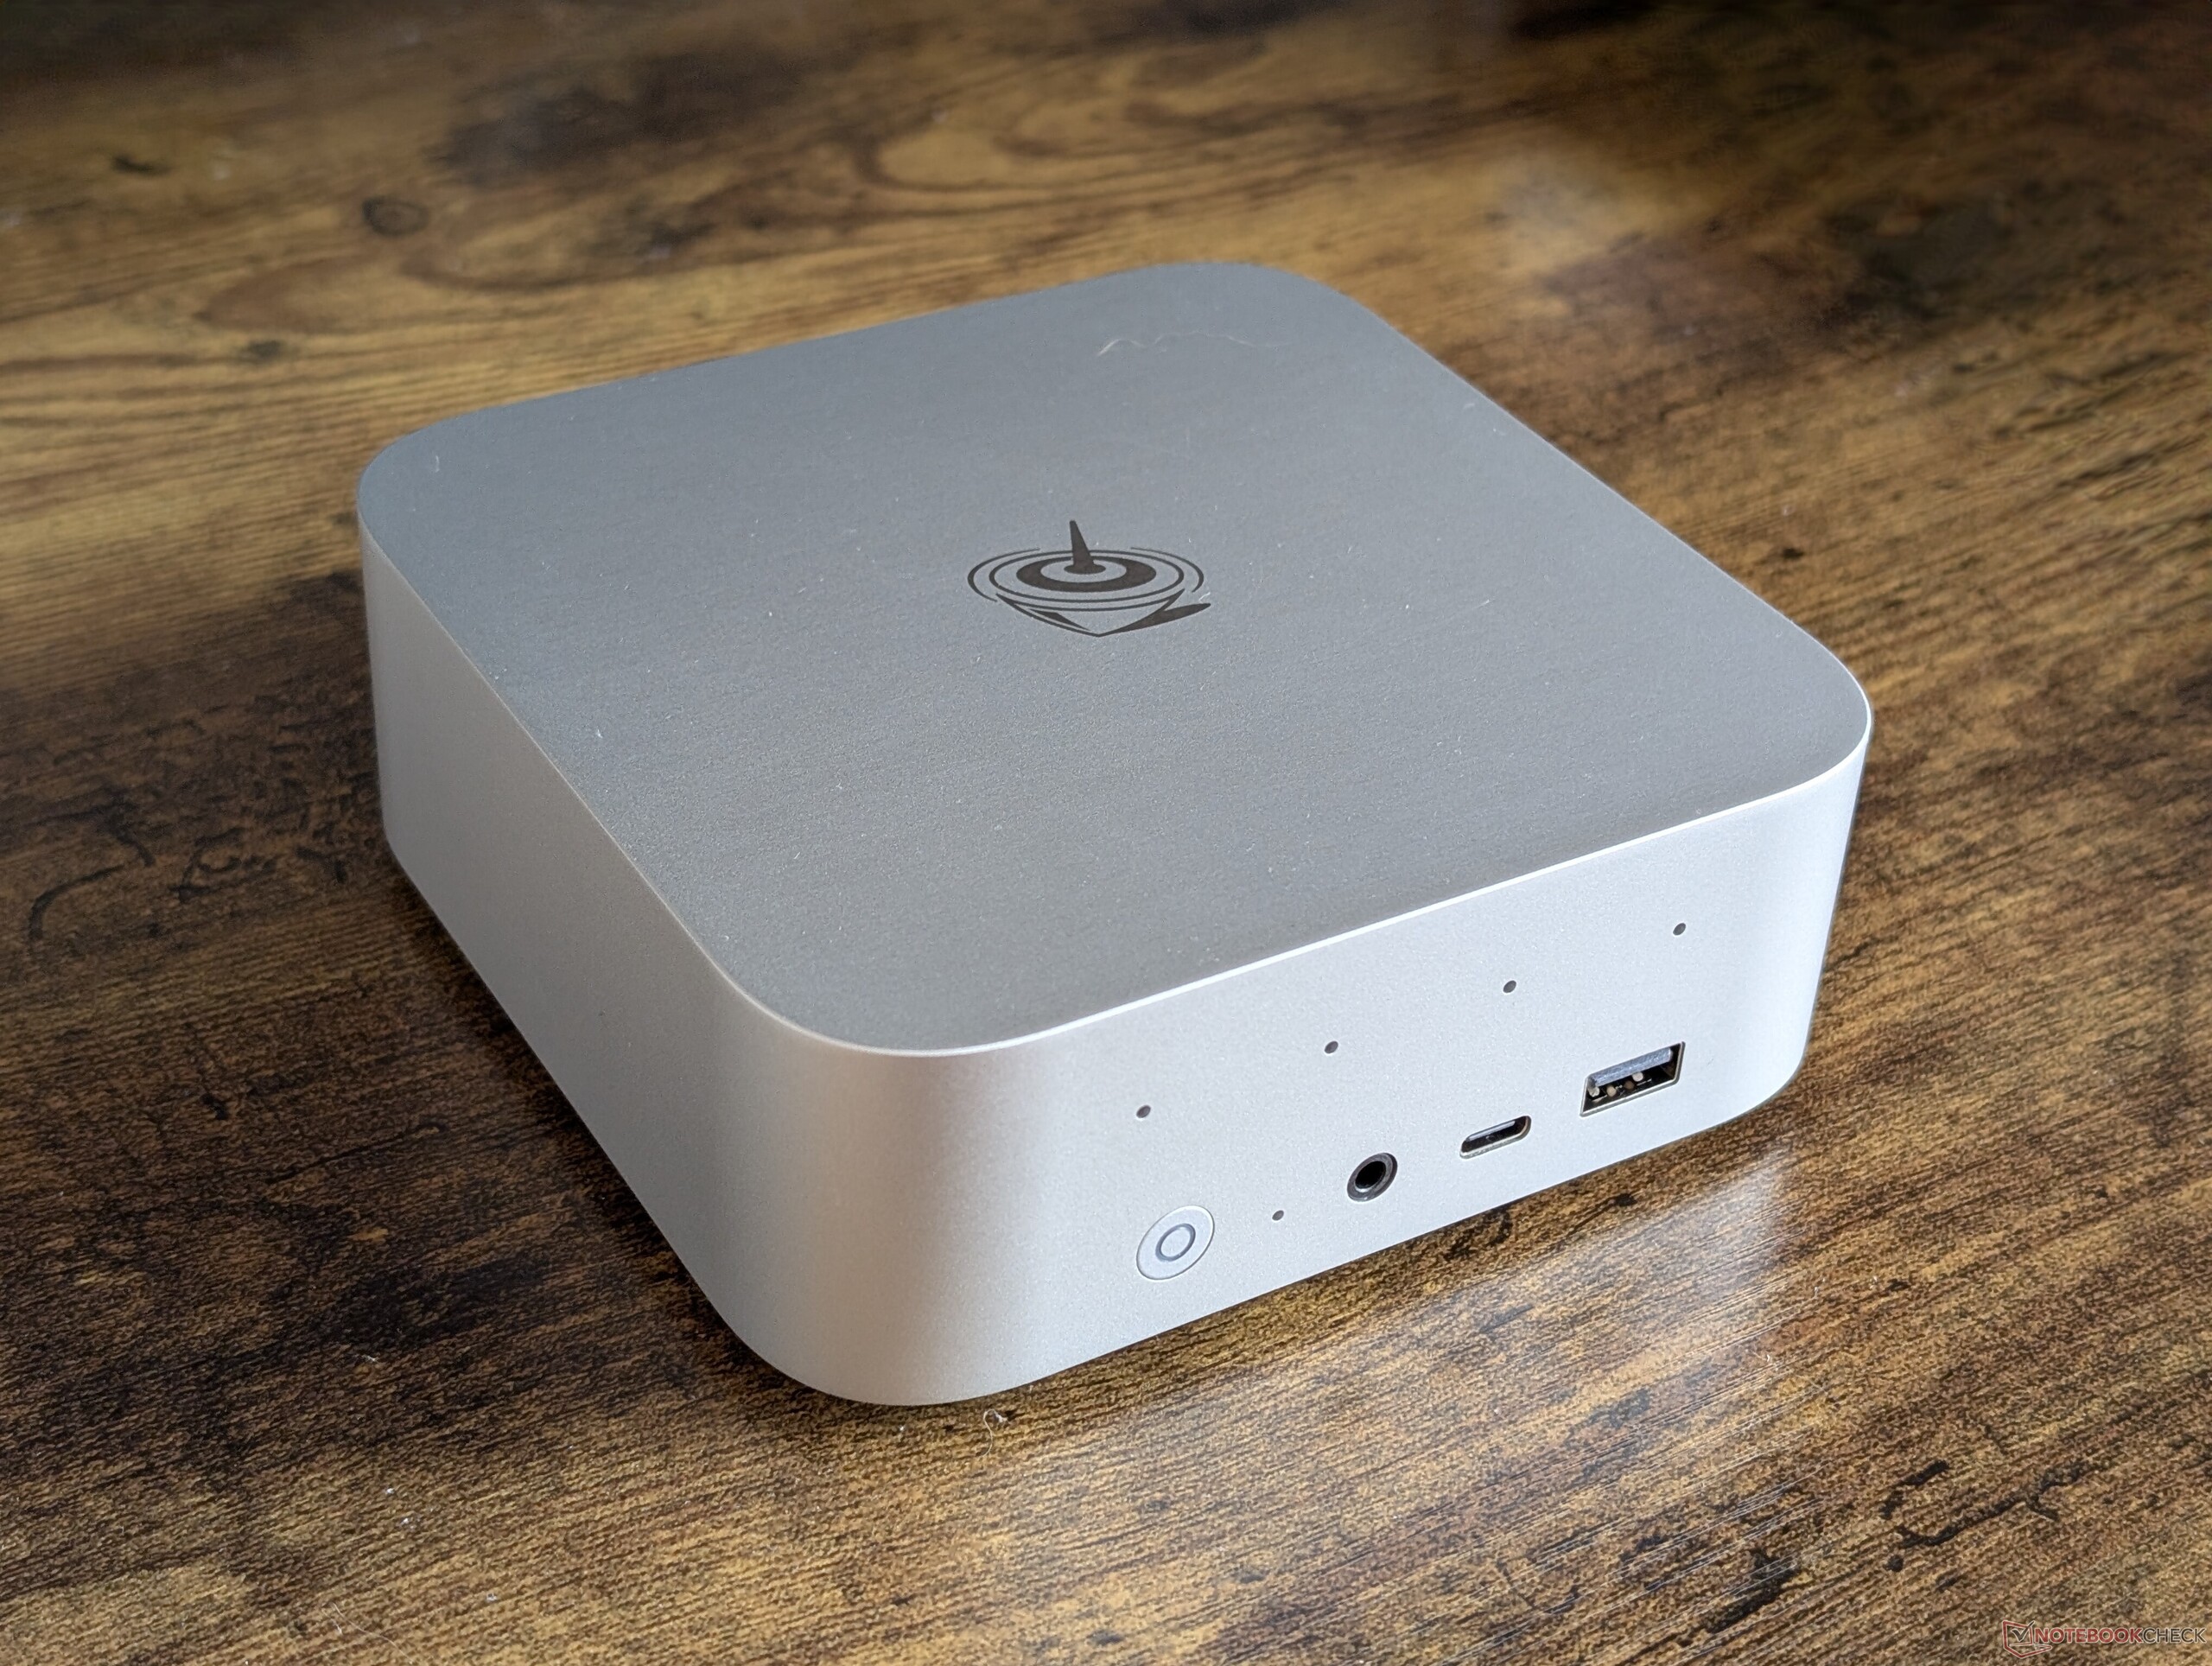
SEi13 Pro 是一款多媒体迷你电脑,其设计灵感来自于 Apple Mac Mini适合家庭或办公室使用。它的显著特点是集成了立体声扬声器和蒸汽腔冷却系统,这在同价位的其他迷你电脑中并不多见。
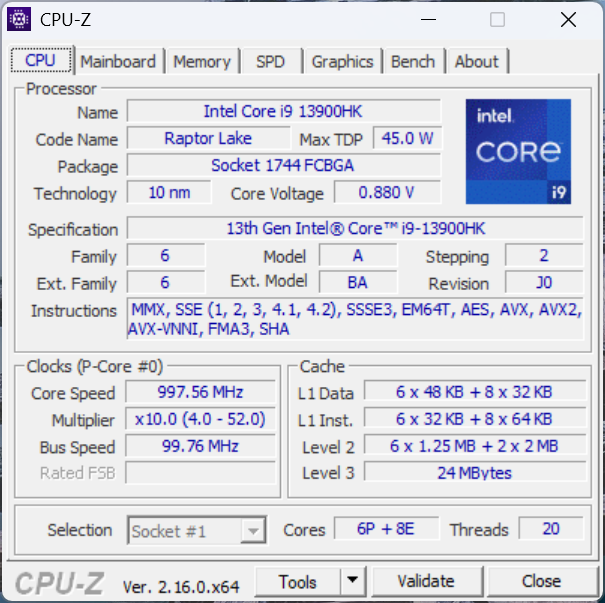
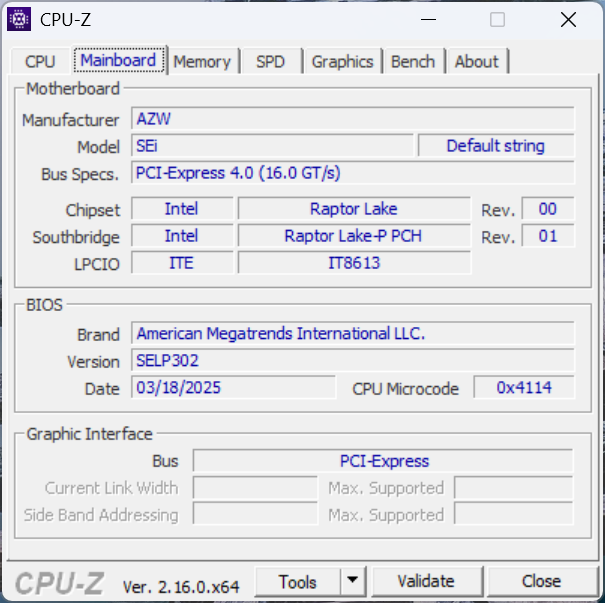
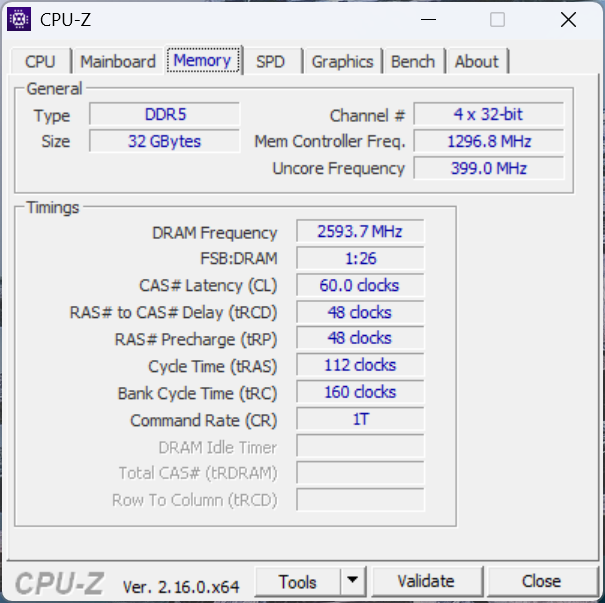
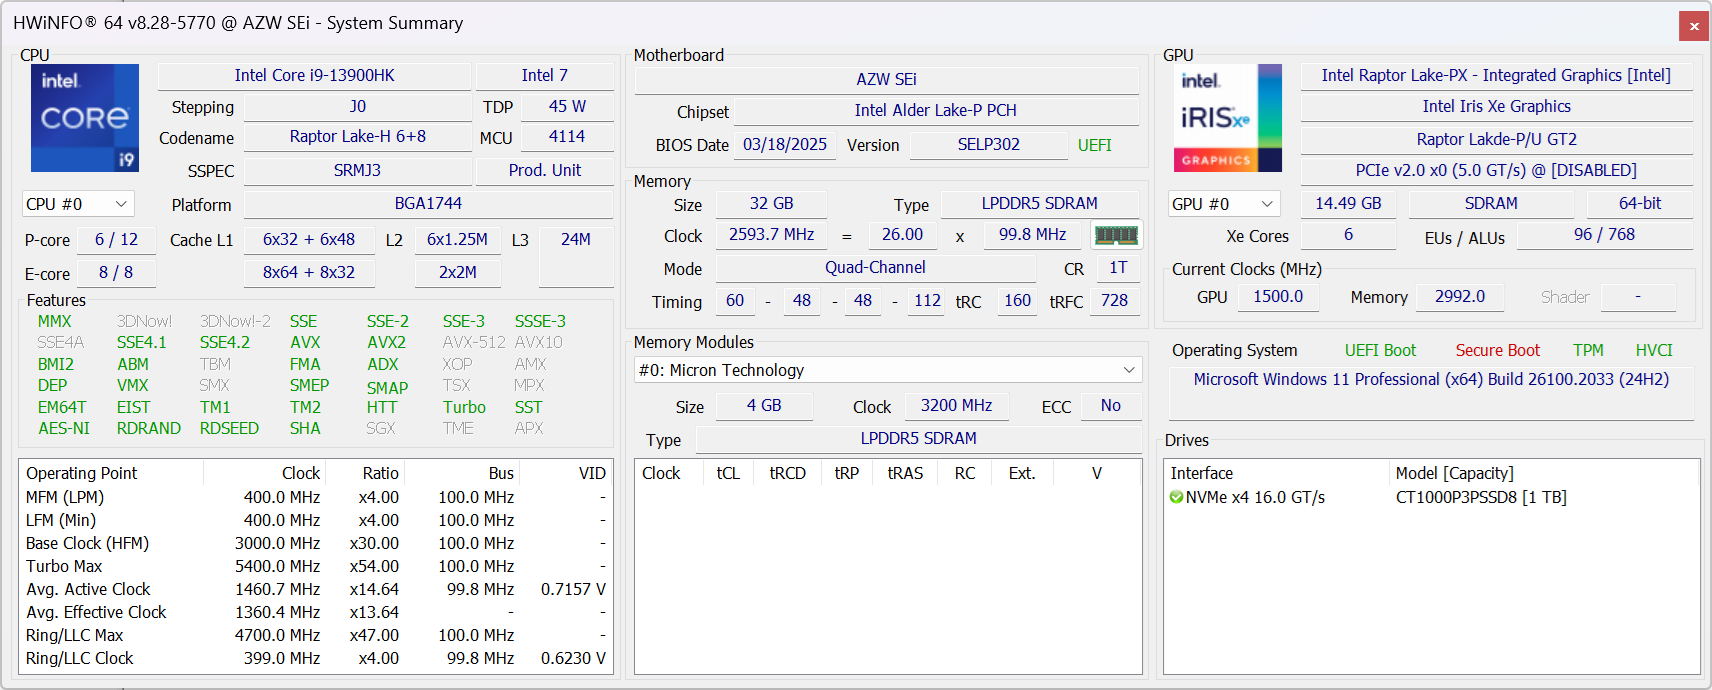
我们的测试机配备了 Raptor Lake Core i9-13900HK CPU、32 GB 内存和 1 TB SSD,售价 540 美元。有灰色和银色可供选择。
更多 Beelink 评论:
规格
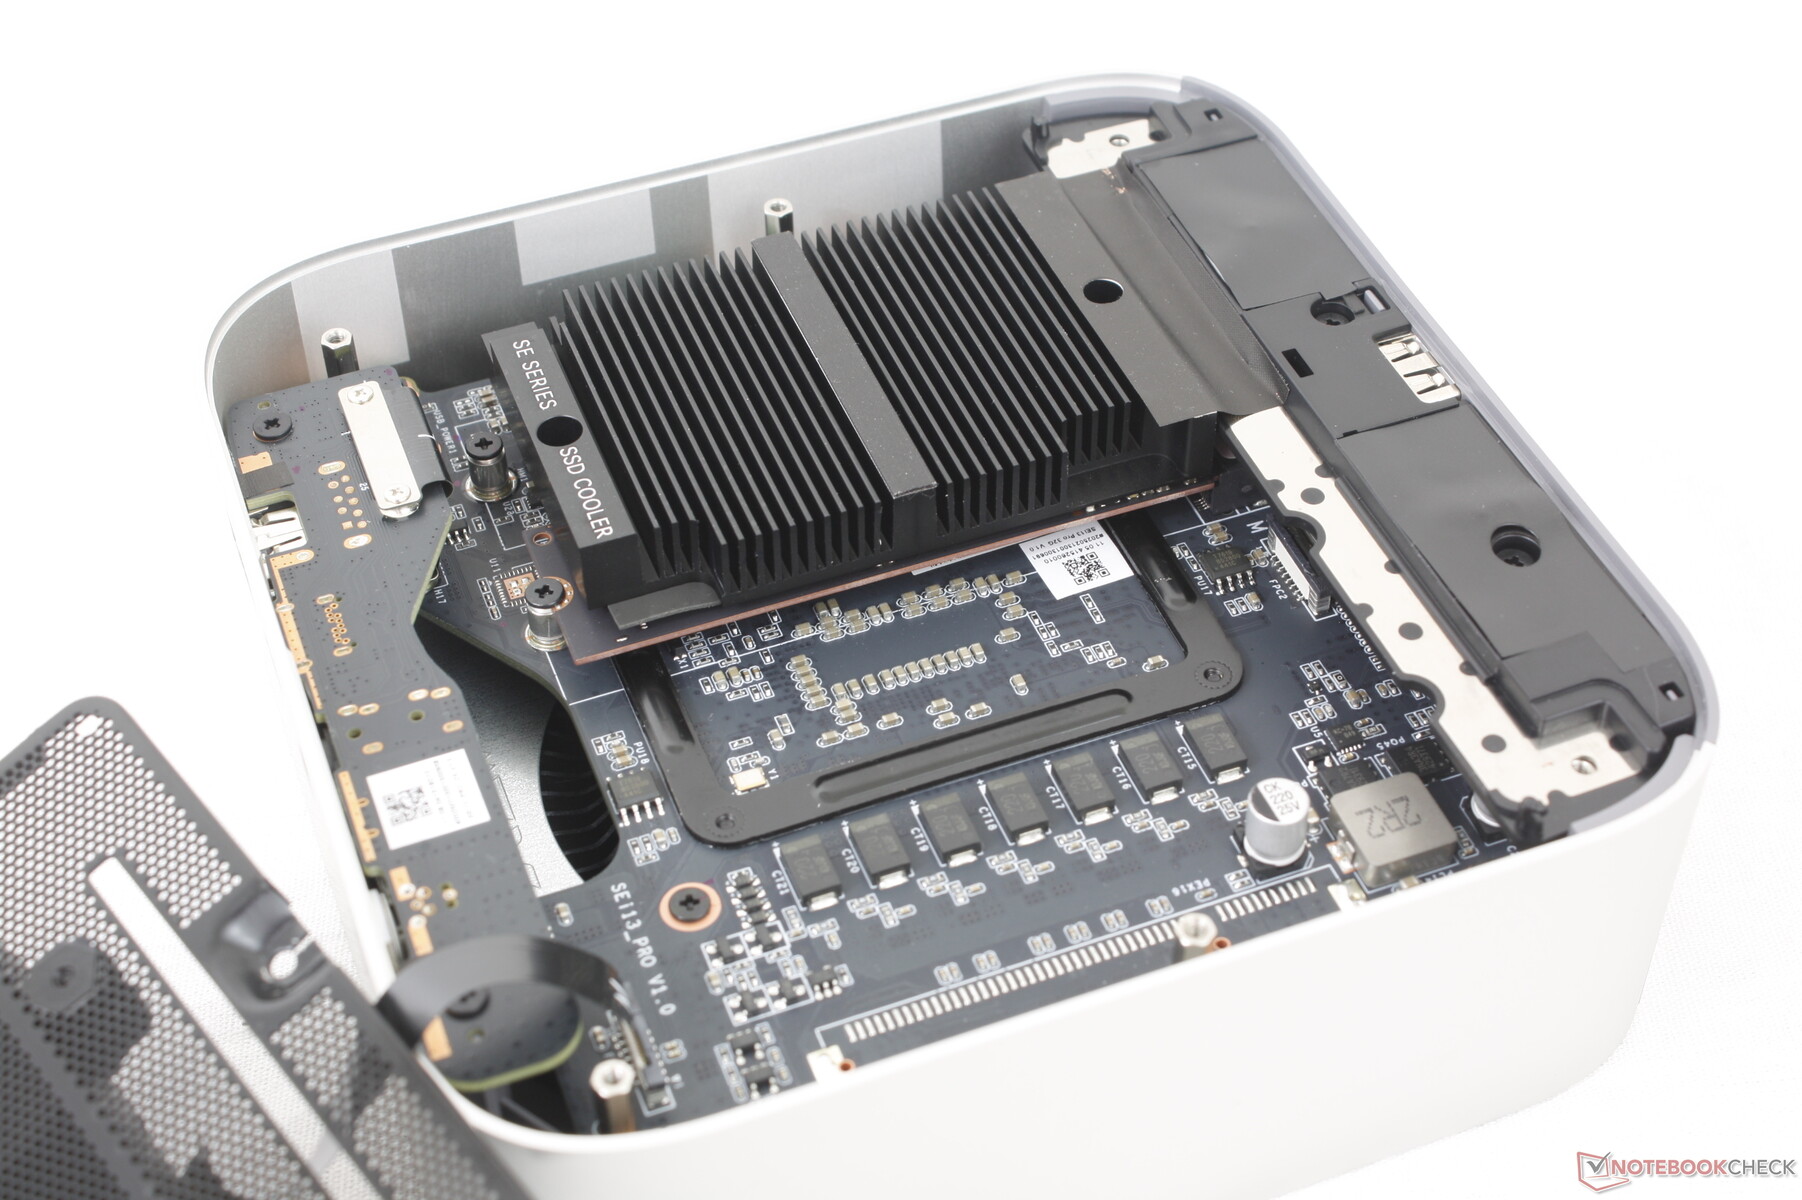
案例
SEi13 Pro 本质上是 GTi13 Ultra 的缩小版和轻便版。金属外壳材料保持不变,给人类似 Mac Mini-like 的感觉。
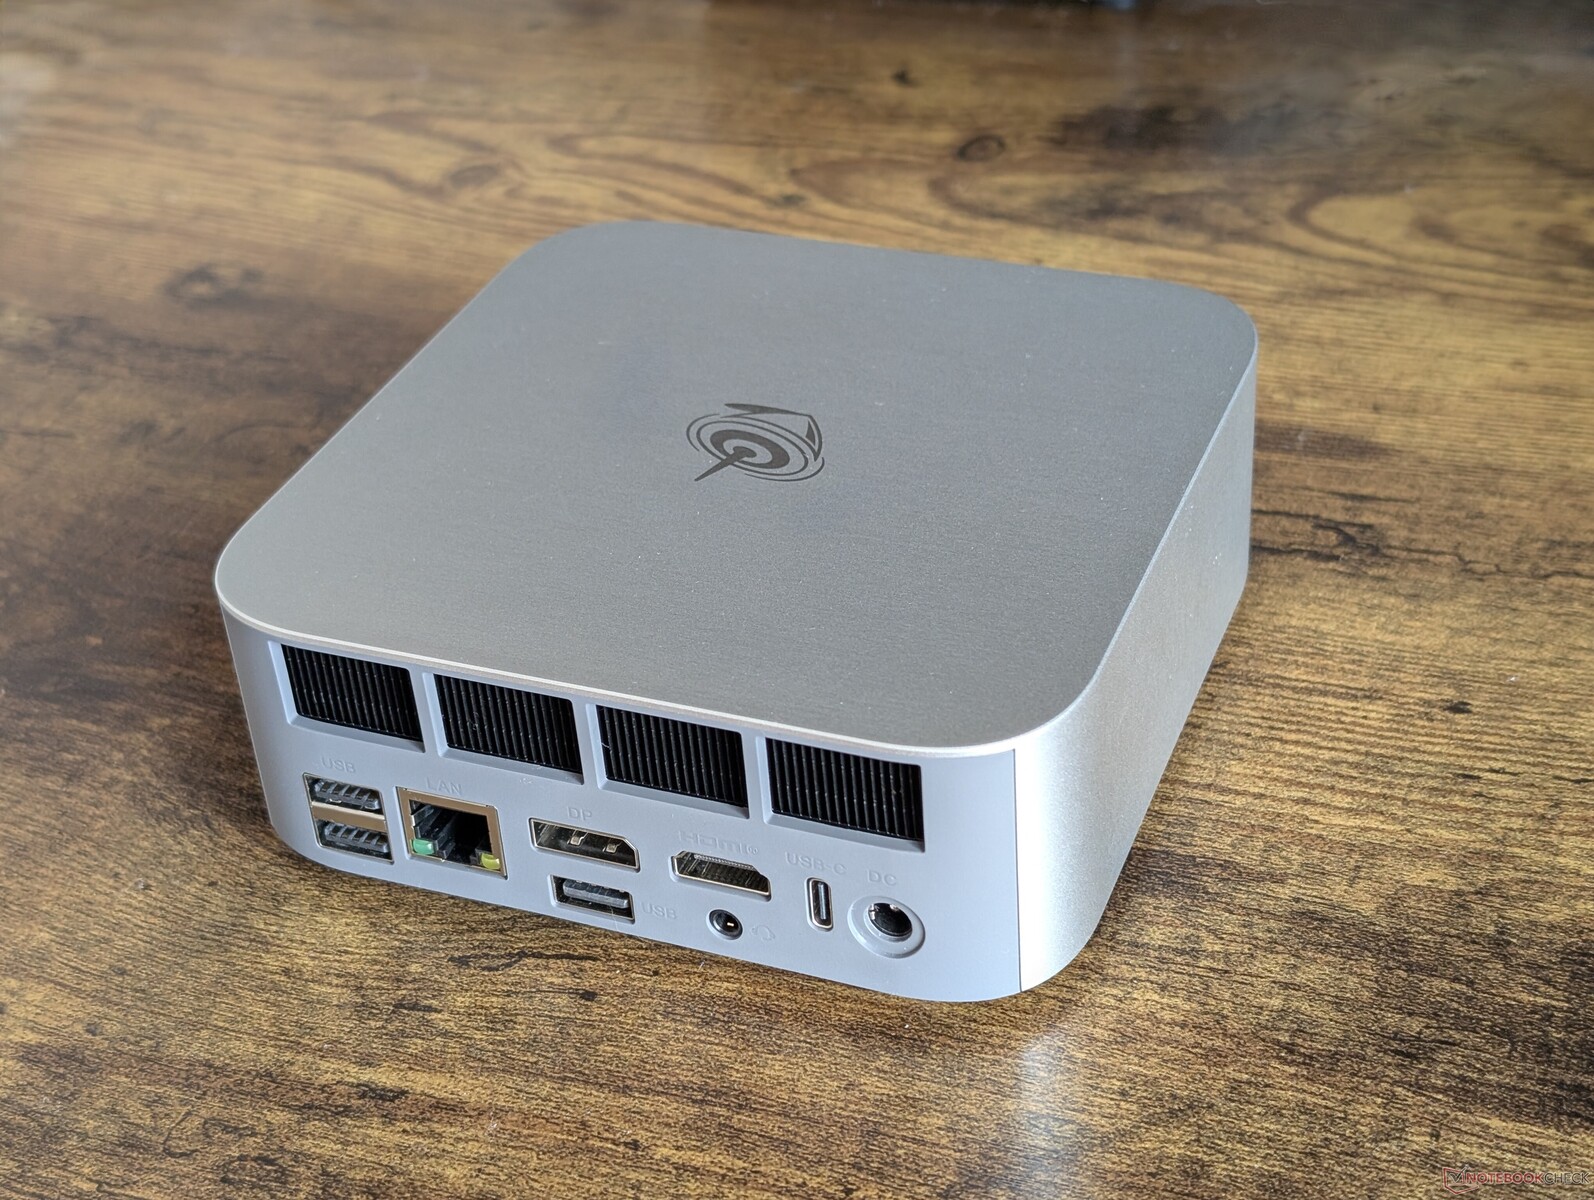
连接性
除了不同的交流适配器端口以及后部较少的 USB-A 和 RJ-45 端口外,SEi13 Ultra 上几乎所有的端口都集成在一起。此外,还取消了 SD 读卡器。
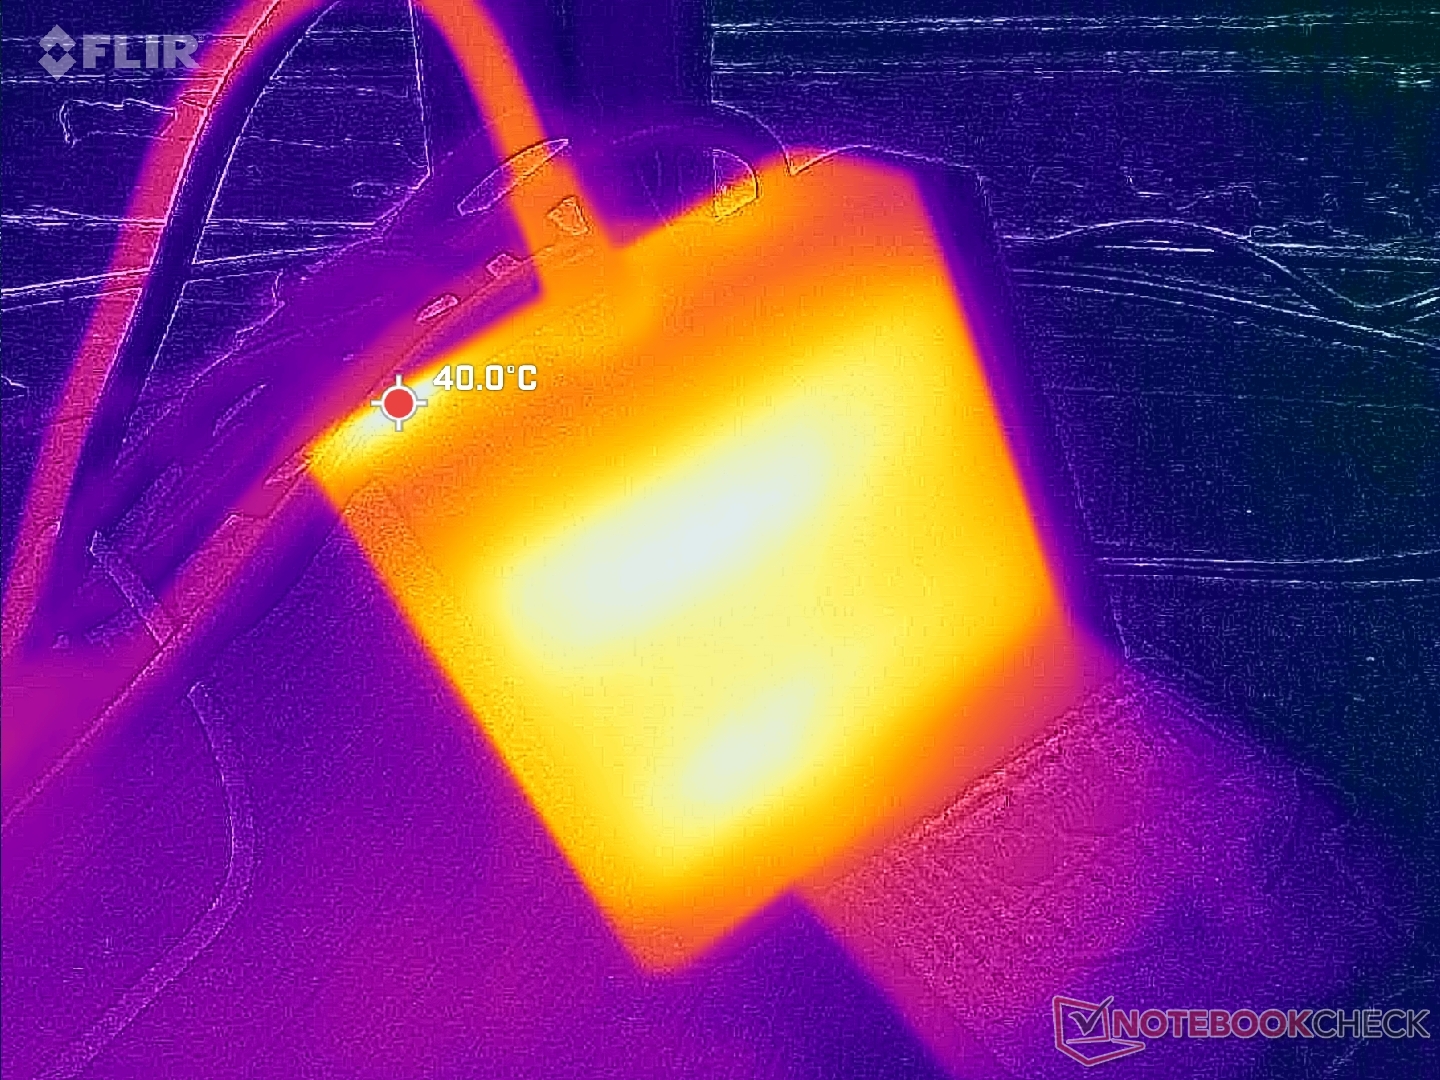
需要注意的是,如果丢失了随机附带的 100 W 桶装交流适配器,可以通过通用 USB-C 交流适配器为系统供电。
交流
| Networking | |
| iperf3 transmit AXE11000 | |
| BOSGAME M4 Neo | |
| Beelink SEi12 Core i5-1235U | |
| HP Z2 Mini G1a | |
| Beelink GTI13 Ultra | |
| Beelink SEi13 Pro | |
| iperf3 receive AXE11000 | |
| BOSGAME M4 Neo | |
| Beelink SEi12 Core i5-1235U | |
| HP Z2 Mini G1a | |
| Beelink GTI13 Ultra | |
| Beelink SEi13 Pro | |
| iperf3 transmit AXE11000 6GHz | |
| HP Z2 Mini G1a | |
| BOSGAME M4 Neo | |
| iperf3 receive AXE11000 6GHz | |
| HP Z2 Mini G1a | |
| BOSGAME M4 Neo | |
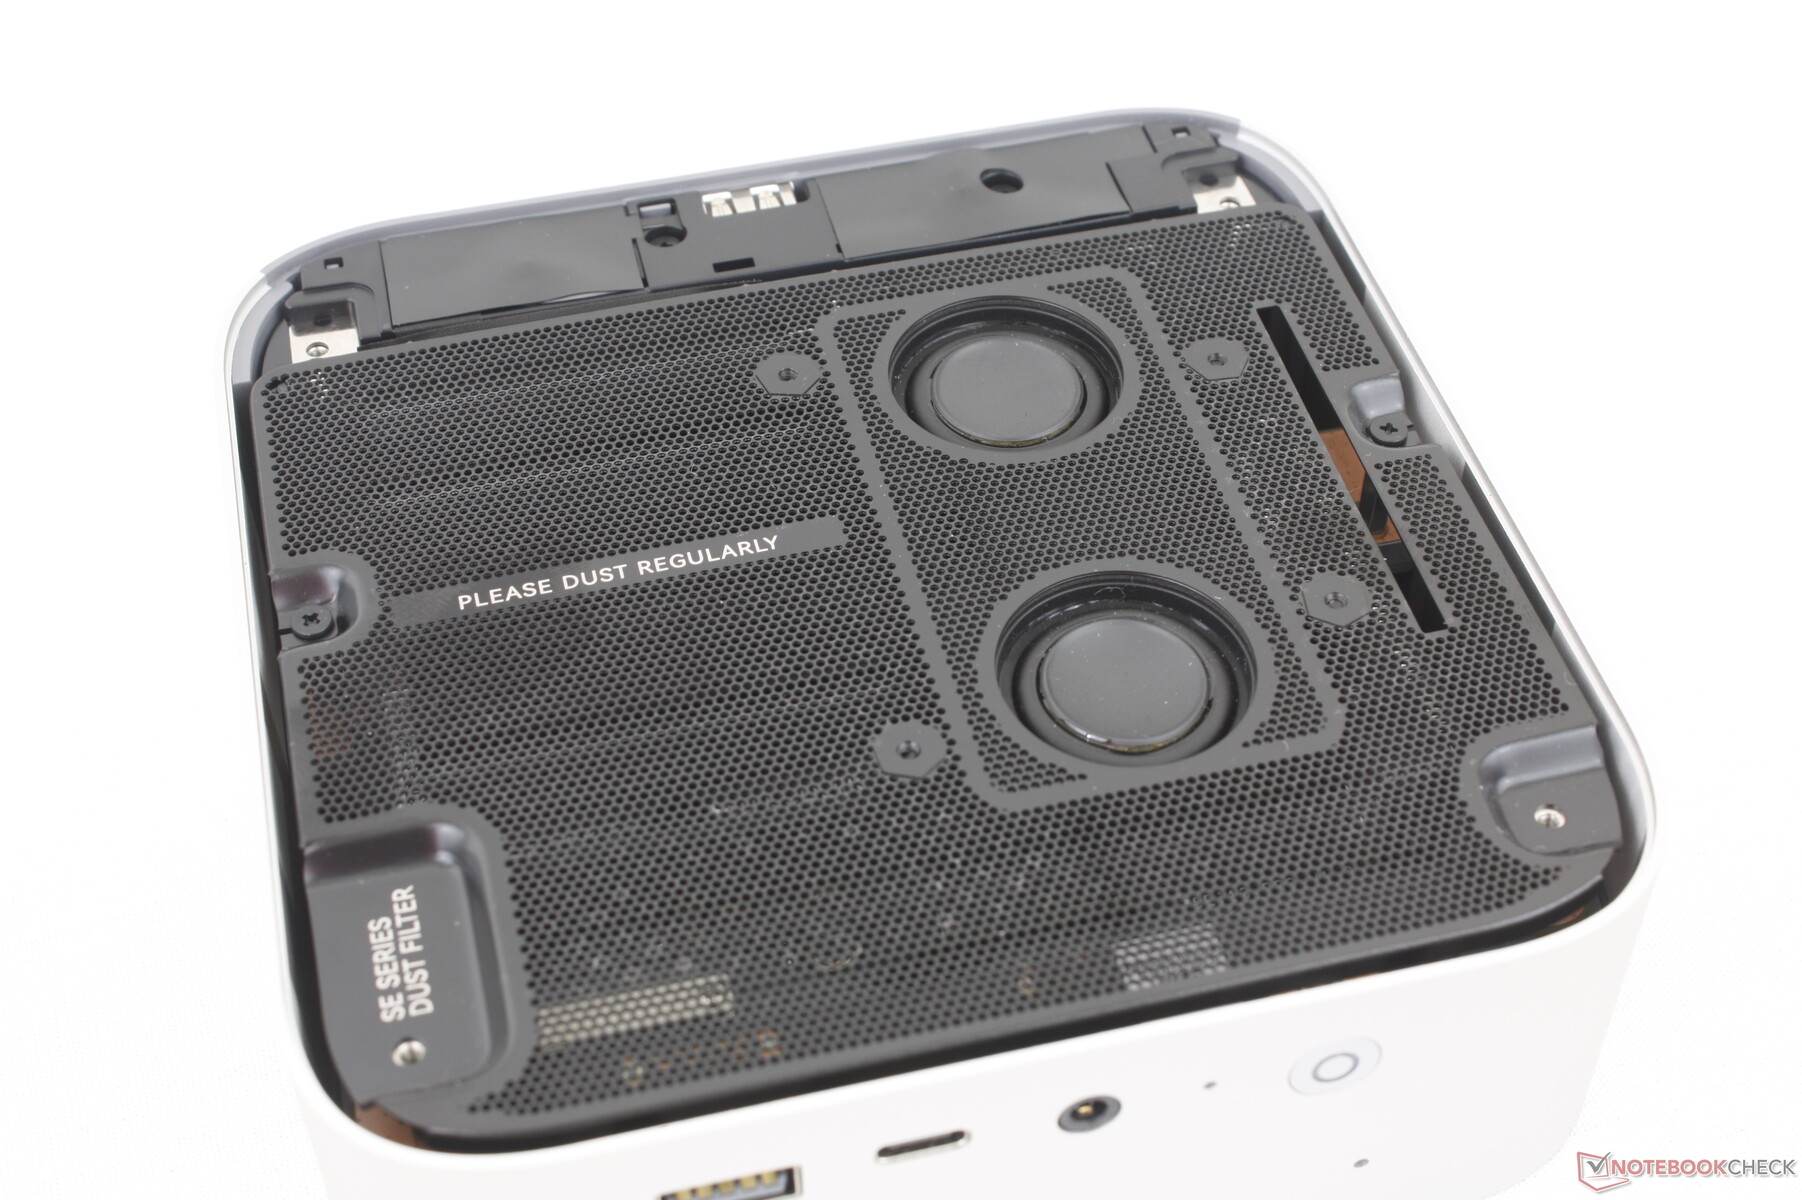
维护
与 GTi13 Ultra 相比,SEi13 的主板上没有集成 PSU,因此升级更容易。不过,与上述 GTi13 Ultra 不同的是,由于内存是焊接的,因此升级仅限于两个 M.2 SSD。
可持续性
制造商只字未提生产过程中使用的回收材料。包装本身都是纸板和纸,外加塑料包装。
配件和保修
零售包装盒包括 HDMI 线和交流适配器及说明书。如果在美国购买,制造商通常提供一年有限保修。
性能
测试条件
在运行以下基准测试之前,我们将 Windows 设置为性能模式。
处理器
虽然就价格而言速度仍然相当快,但 酷睿 i9-13900HK缺少用于人工智能加速的集成 NPU。
Cinebench R15 Multi Loop
Cinebench R23: Multi Core | Single Core
Cinebench R20: CPU (Multi Core) | CPU (Single Core)
Cinebench R15: CPU Multi 64Bit | CPU Single 64Bit
Blender: v2.79 BMW27 CPU
7-Zip 18.03: 7z b 4 | 7z b 4 -mmt1
Geekbench 6.7: Multi-Core | Single-Core
Geekbench 5.5: Multi-Core | Single-Core
HWBOT x265 Benchmark v2.2: 4k Preset
LibreOffice : 20 Documents To PDF
R Benchmark 2.5: Overall mean
| CPU Performance rating | |
| Minisforum MS-A2 | |
| HP Z2 Mini G1a | |
| Acemagic F3A | |
| Geekom Mini IT15, Ultra 9 285H | |
| Khadas Mind 2s | |
| Beelink GTI13 Ultra | |
| BOSGAME M4 Neo | |
| Average Intel Core i9-13900HK | |
| Geekom Mini IT13 | |
| Beelink SEi13 Pro | |
| Minix Elite EU512-AI -2! | |
| BMAX B9 Power | |
| Beelink SEi12 Core i5-1235U -2! | |
| NiPoGi AM06 Pro | |
| Cinebench R20 / CPU (Multi Core) | |
| HP Z2 Mini G1a | |
| Minisforum MS-A2 | |
| Acemagic F3A | |
| Geekom Mini IT15, Ultra 9 285H | |
| Khadas Mind 2s | |
| BOSGAME M4 Neo | |
| Beelink GTI13 Ultra | |
| Average Intel Core i9-13900HK (4968 - 7542, n=4) | |
| Beelink SEi13 Pro | |
| Minix Elite EU512-AI | |
| BMAX B9 Power | |
| Geekom Mini IT13 | |
| Beelink SEi12 Core i5-1235U | |
| NiPoGi AM06 Pro | |
| Cinebench R20 / CPU (Single Core) | |
| Minisforum MS-A2 | |
| Geekom Mini IT15, Ultra 9 285H | |
| Khadas Mind 2s | |
| Acemagic F3A | |
| Beelink GTI13 Ultra | |
| HP Z2 Mini G1a | |
| Average Intel Core i9-13900HK (549 - 798, n=4) | |
| BOSGAME M4 Neo | |
| Geekom Mini IT13 | |
| Minix Elite EU512-AI | |
| Beelink SEi12 Core i5-1235U | |
| Beelink SEi13 Pro | |
| BMAX B9 Power | |
| NiPoGi AM06 Pro | |
| Cinebench R15 / CPU Multi 64Bit | |
| HP Z2 Mini G1a | |
| Minisforum MS-A2 | |
| Acemagic F3A | |
| Geekom Mini IT15, Ultra 9 285H | |
| Khadas Mind 2s | |
| BOSGAME M4 Neo | |
| Average Intel Core i9-13900HK (2004 - 2950, n=4) | |
| Beelink GTI13 Ultra | |
| Beelink SEi13 Pro | |
| BMAX B9 Power | |
| Minix Elite EU512-AI | |
| Geekom Mini IT13 | |
| Beelink SEi12 Core i5-1235U | |
| NiPoGi AM06 Pro | |
| Cinebench R15 / CPU Single 64Bit | |
| Minisforum MS-A2 | |
| Acemagic F3A | |
| Khadas Mind 2s | |
| Geekom Mini IT15, Ultra 9 285H | |
| HP Z2 Mini G1a | |
| Beelink GTI13 Ultra | |
| BOSGAME M4 Neo | |
| Average Intel Core i9-13900HK (204 - 296, n=4) | |
| Geekom Mini IT13 | |
| Minix Elite EU512-AI | |
| Beelink SEi12 Core i5-1235U | |
| Beelink SEi13 Pro | |
| BMAX B9 Power | |
| NiPoGi AM06 Pro | |
| Geekbench 6.7 / Multi-Core | |
| Minisforum MS-A2 | |
| HP Z2 Mini G1a | |
| Geekom Mini IT15, Ultra 9 285H | |
| Khadas Mind 2s | |
| Beelink GTI13 Ultra | |
| BOSGAME M4 Neo | |
| Acemagic F3A | |
| Geekom Mini IT13 | |
| Average Intel Core i9-13900HK (7103 - 13309, n=4) | |
| BMAX B9 Power | |
| Beelink SEi13 Pro | |
| NiPoGi AM06 Pro | |
| Geekbench 6.7 / Single-Core | |
| Minisforum MS-A2 | |
| Geekom Mini IT15, Ultra 9 285H | |
| Acemagic F3A | |
| Khadas Mind 2s | |
| HP Z2 Mini G1a | |
| Beelink GTI13 Ultra | |
| BOSGAME M4 Neo | |
| Geekom Mini IT13 | |
| Average Intel Core i9-13900HK (1849 - 2883, n=4) | |
| Beelink SEi13 Pro | |
| BMAX B9 Power | |
| NiPoGi AM06 Pro | |
| HWBOT x265 Benchmark v2.2 / 4k Preset | |
| Minisforum MS-A2 | |
| HP Z2 Mini G1a | |
| Acemagic F3A | |
| Geekom Mini IT15, Ultra 9 285H | |
| BOSGAME M4 Neo | |
| Khadas Mind 2s | |
| Beelink GTI13 Ultra | |
| Average Intel Core i9-13900HK (14.2 - 21.9, n=4) | |
| Beelink SEi13 Pro | |
| BMAX B9 Power | |
| Minix Elite EU512-AI | |
| Geekom Mini IT13 | |
| Beelink SEi12 Core i5-1235U | |
| NiPoGi AM06 Pro | |
| LibreOffice / 20 Documents To PDF | |
| NiPoGi AM06 Pro | |
| Minix Elite EU512-AI | |
| Acemagic F3A | |
| BMAX B9 Power | |
| HP Z2 Mini G1a | |
| Beelink SEi13 Pro | |
| Geekom Mini IT13 | |
| Beelink SEi12 Core i5-1235U | |
| BOSGAME M4 Neo | |
| Average Intel Core i9-13900HK (37.3 - 56, n=4) | |
| Khadas Mind 2s | |
| Minisforum MS-A2 | |
| Geekom Mini IT15, Ultra 9 285H | |
| Beelink GTI13 Ultra | |
| R Benchmark 2.5 / Overall mean | |
| Beelink SEi13 Pro | |
| BMAX B9 Power | |
| NiPoGi AM06 Pro | |
| Minix Elite EU512-AI | |
| Beelink SEi12 Core i5-1235U | |
| Average Intel Core i9-13900HK (0.4119 - 0.653, n=4) | |
| Geekom Mini IT13 | |
| BOSGAME M4 Neo | |
| Khadas Mind 2s | |
| Beelink GTI13 Ultra | |
| Geekom Mini IT15, Ultra 9 285H | |
| HP Z2 Mini G1a | |
| Acemagic F3A | |
| Minisforum MS-A2 | |
Cinebench R23: Multi Core | Single Core
Cinebench R20: CPU (Multi Core) | CPU (Single Core)
Cinebench R15: CPU Multi 64Bit | CPU Single 64Bit
Blender: v2.79 BMW27 CPU
7-Zip 18.03: 7z b 4 | 7z b 4 -mmt1
Geekbench 6.7: Multi-Core | Single-Core
Geekbench 5.5: Multi-Core | Single-Core
HWBOT x265 Benchmark v2.2: 4k Preset
LibreOffice : 20 Documents To PDF
R Benchmark 2.5: Overall mean
* ... smaller is better
AIDA64: FP32 Ray-Trace | FPU Julia | CPU SHA3 | CPU Queen | FPU SinJulia | FPU Mandel | CPU AES | CPU ZLib | FP64 Ray-Trace | CPU PhotoWorxx
| Performance rating | |
| HP Z2 Mini G1a | |
| BOSGAME M4 Neo | |
| Beelink GTI13 Ultra | |
| Average Intel Core i9-13900HK | |
| BMAX B9 Power | |
| Beelink SEi13 Pro | |
| Beelink SEi12 Core i5-1235U | |
| AIDA64 / FP32 Ray-Trace | |
| HP Z2 Mini G1a | |
| BOSGAME M4 Neo | |
| Beelink SEi13 Pro | |
| Average Intel Core i9-13900HK (12351 - 18326, n=4) | |
| Beelink GTI13 Ultra | |
| BMAX B9 Power | |
| Beelink SEi12 Core i5-1235U | |
| AIDA64 / FPU Julia | |
| HP Z2 Mini G1a | |
| BOSGAME M4 Neo | |
| Beelink GTI13 Ultra | |
| Average Intel Core i9-13900HK (61409 - 92925, n=4) | |
| Beelink SEi13 Pro | |
| BMAX B9 Power | |
| Beelink SEi12 Core i5-1235U | |
| AIDA64 / CPU SHA3 | |
| HP Z2 Mini G1a | |
| BOSGAME M4 Neo | |
| Average Intel Core i9-13900HK (2923 - 4190, n=4) | |
| Beelink GTI13 Ultra | |
| Beelink SEi13 Pro | |
| BMAX B9 Power | |
| Beelink SEi12 Core i5-1235U | |
| AIDA64 / CPU Queen | |
| HP Z2 Mini G1a | |
| BOSGAME M4 Neo | |
| Beelink GTI13 Ultra | |
| Average Intel Core i9-13900HK (75615 - 118166, n=4) | |
| Beelink SEi13 Pro | |
| BMAX B9 Power | |
| Beelink SEi12 Core i5-1235U | |
| AIDA64 / FPU SinJulia | |
| HP Z2 Mini G1a | |
| BOSGAME M4 Neo | |
| Beelink GTI13 Ultra | |
| Average Intel Core i9-13900HK (7427 - 11249, n=4) | |
| Beelink SEi13 Pro | |
| BMAX B9 Power | |
| Beelink SEi12 Core i5-1235U | |
| AIDA64 / FPU Mandel | |
| HP Z2 Mini G1a | |
| BOSGAME M4 Neo | |
| Beelink SEi13 Pro | |
| Beelink GTI13 Ultra | |
| Average Intel Core i9-13900HK (30549 - 45616, n=4) | |
| BMAX B9 Power | |
| Beelink SEi12 Core i5-1235U | |
| AIDA64 / CPU AES | |
| HP Z2 Mini G1a | |
| BMAX B9 Power | |
| BOSGAME M4 Neo | |
| Average Intel Core i9-13900HK (68508 - 100891, n=4) | |
| Beelink GTI13 Ultra | |
| Beelink SEi13 Pro | |
| Beelink SEi12 Core i5-1235U | |
| AIDA64 / CPU ZLib | |
| HP Z2 Mini G1a | |
| Beelink GTI13 Ultra | |
| Average Intel Core i9-13900HK (797 - 1249, n=4) | |
| BOSGAME M4 Neo | |
| Beelink SEi13 Pro | |
| BMAX B9 Power | |
| Beelink SEi12 Core i5-1235U | |
| AIDA64 / FP64 Ray-Trace | |
| HP Z2 Mini G1a | |
| BOSGAME M4 Neo | |
| Average Intel Core i9-13900HK (6839 - 10018, n=4) | |
| Beelink SEi13 Pro | |
| Beelink GTI13 Ultra | |
| BMAX B9 Power | |
| Beelink SEi12 Core i5-1235U | |
| AIDA64 / CPU PhotoWorxx | |
| HP Z2 Mini G1a | |
| Beelink GTI13 Ultra | |
| BOSGAME M4 Neo | |
| Average Intel Core i9-13900HK (15421 - 49539, n=4) | |
| Beelink SEi12 Core i5-1235U | |
| BMAX B9 Power | |
| Beelink SEi13 Pro | |
系统性能
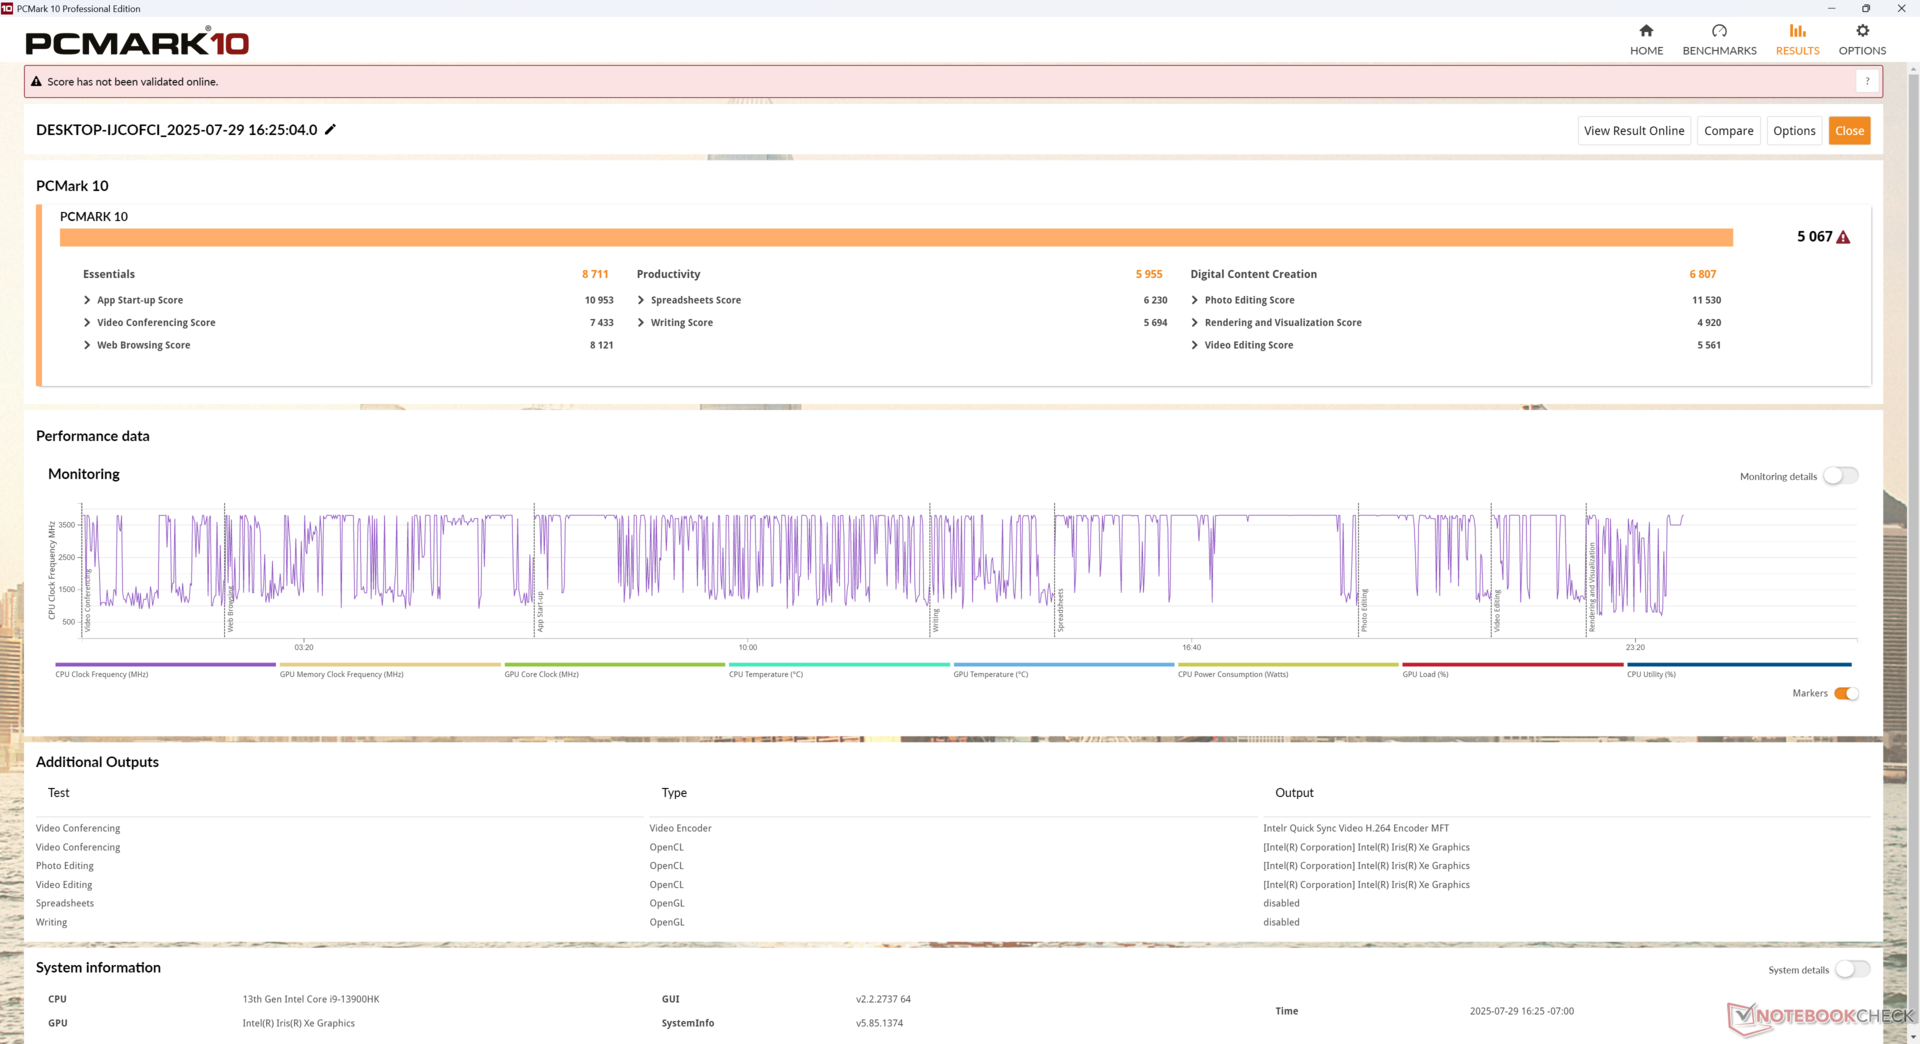
PCMark 10: Score | Essentials | Productivity | Digital Content Creation
CrossMark: Overall | Productivity | Creativity | Responsiveness
WebXPRT 3: Overall
WebXPRT 4: Overall
Mozilla Kraken 1.1: Total
| Performance rating | |
| HP Z2 Mini G1a | |
| Beelink GTI13 Ultra | |
| BOSGAME M4 Neo | |
| Beelink SEi12 Core i5-1235U | |
| Beelink SEi13 Pro -4! | |
| BMAX B9 Power -4! | |
| PCMark 10 / Score | |
| HP Z2 Mini G1a | |
| BOSGAME M4 Neo | |
| Beelink GTI13 Ultra | |
| Beelink SEi12 Core i5-1235U | |
| PCMark 10 / Essentials | |
| Beelink GTI13 Ultra | |
| Beelink SEi12 Core i5-1235U | |
| HP Z2 Mini G1a | |
| BOSGAME M4 Neo | |
| PCMark 10 / Productivity | |
| HP Z2 Mini G1a | |
| BOSGAME M4 Neo | |
| Beelink GTI13 Ultra | |
| Beelink SEi12 Core i5-1235U | |
| PCMark 10 / Digital Content Creation | |
| HP Z2 Mini G1a | |
| BOSGAME M4 Neo | |
| Beelink GTI13 Ultra | |
| Beelink SEi12 Core i5-1235U | |
| CrossMark / Overall | |
| Beelink GTI13 Ultra | |
| HP Z2 Mini G1a | |
| BOSGAME M4 Neo | |
| Beelink SEi12 Core i5-1235U | |
| Beelink SEi13 Pro | |
| BMAX B9 Power | |
| CrossMark / Productivity | |
| Beelink GTI13 Ultra | |
| BOSGAME M4 Neo | |
| Beelink SEi12 Core i5-1235U | |
| HP Z2 Mini G1a | |
| Beelink SEi13 Pro | |
| BMAX B9 Power | |
| CrossMark / Creativity | |
| HP Z2 Mini G1a | |
| Beelink GTI13 Ultra | |
| BOSGAME M4 Neo | |
| Beelink SEi12 Core i5-1235U | |
| BMAX B9 Power | |
| Beelink SEi13 Pro | |
| CrossMark / Responsiveness | |
| Beelink GTI13 Ultra | |
| Beelink SEi12 Core i5-1235U | |
| BOSGAME M4 Neo | |
| Beelink SEi13 Pro | |
| HP Z2 Mini G1a | |
| BMAX B9 Power | |
| WebXPRT 3 / Overall | |
| Beelink GTI13 Ultra | |
| HP Z2 Mini G1a | |
| BOSGAME M4 Neo | |
| Beelink SEi12 Core i5-1235U | |
| BMAX B9 Power | |
| Beelink SEi13 Pro | |
| WebXPRT 4 / Overall | |
| Beelink GTI13 Ultra | |
| HP Z2 Mini G1a | |
| BOSGAME M4 Neo | |
| Beelink SEi12 Core i5-1235U | |
| Beelink SEi13 Pro | |
| BMAX B9 Power | |
| Mozilla Kraken 1.1 / Total | |
| BMAX B9 Power | |
| Beelink SEi13 Pro | |
| Beelink SEi12 Core i5-1235U | |
| BOSGAME M4 Neo | |
| Beelink GTI13 Ultra | |
| HP Z2 Mini G1a | |
* ... smaller is better
» No benchmarks for this notebook found!
| AIDA64 / Memory Copy | |
| HP Z2 Mini G1a | |
| Beelink GTI13 Ultra | |
| BOSGAME M4 Neo | |
| Beelink SEi13 Pro | |
| Average Intel Core i9-13900HK (45935 - 74460, n=4) | |
| Beelink SEi12 Core i5-1235U | |
| BMAX B9 Power | |
| AIDA64 / Memory Read | |
| HP Z2 Mini G1a | |
| Beelink GTI13 Ultra | |
| BOSGAME M4 Neo | |
| Average Intel Core i9-13900HK (34298 - 74896, n=4) | |
| Beelink SEi12 Core i5-1235U | |
| BMAX B9 Power | |
| Beelink SEi13 Pro | |
| AIDA64 / Memory Write | |
| HP Z2 Mini G1a | |
| BOSGAME M4 Neo | |
| Beelink SEi13 Pro | |
| Beelink GTI13 Ultra | |
| Average Intel Core i9-13900HK (47347 - 85917, n=4) | |
| Beelink SEi12 Core i5-1235U | |
| BMAX B9 Power | |
| AIDA64 / Memory Latency | |
| HP Z2 Mini G1a | |
| Beelink SEi13 Pro | |
| BMAX B9 Power | |
| Average Intel Core i9-13900HK (83 - 115.3, n=4) | |
| Beelink SEi12 Core i5-1235U | |
| BOSGAME M4 Neo | |
| Beelink GTI13 Ultra | |
* ... smaller is better
DPC 延迟
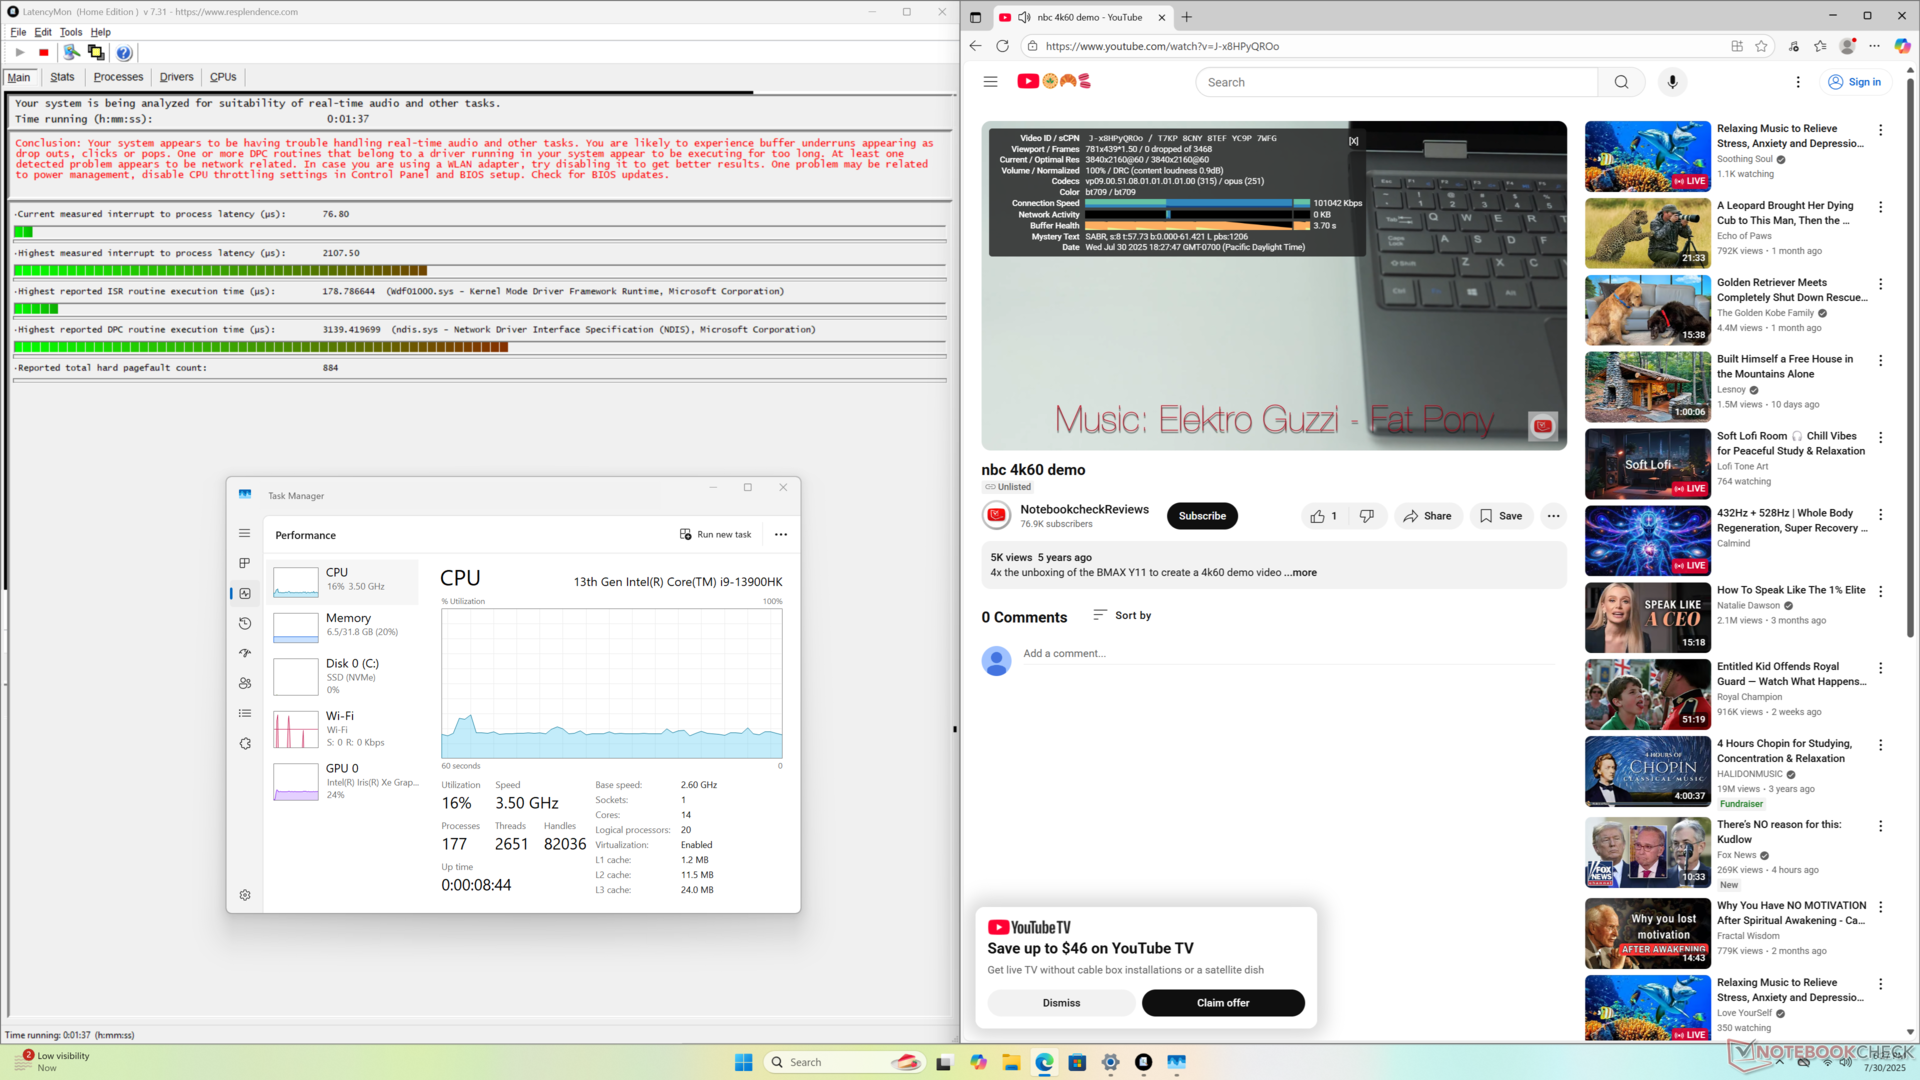
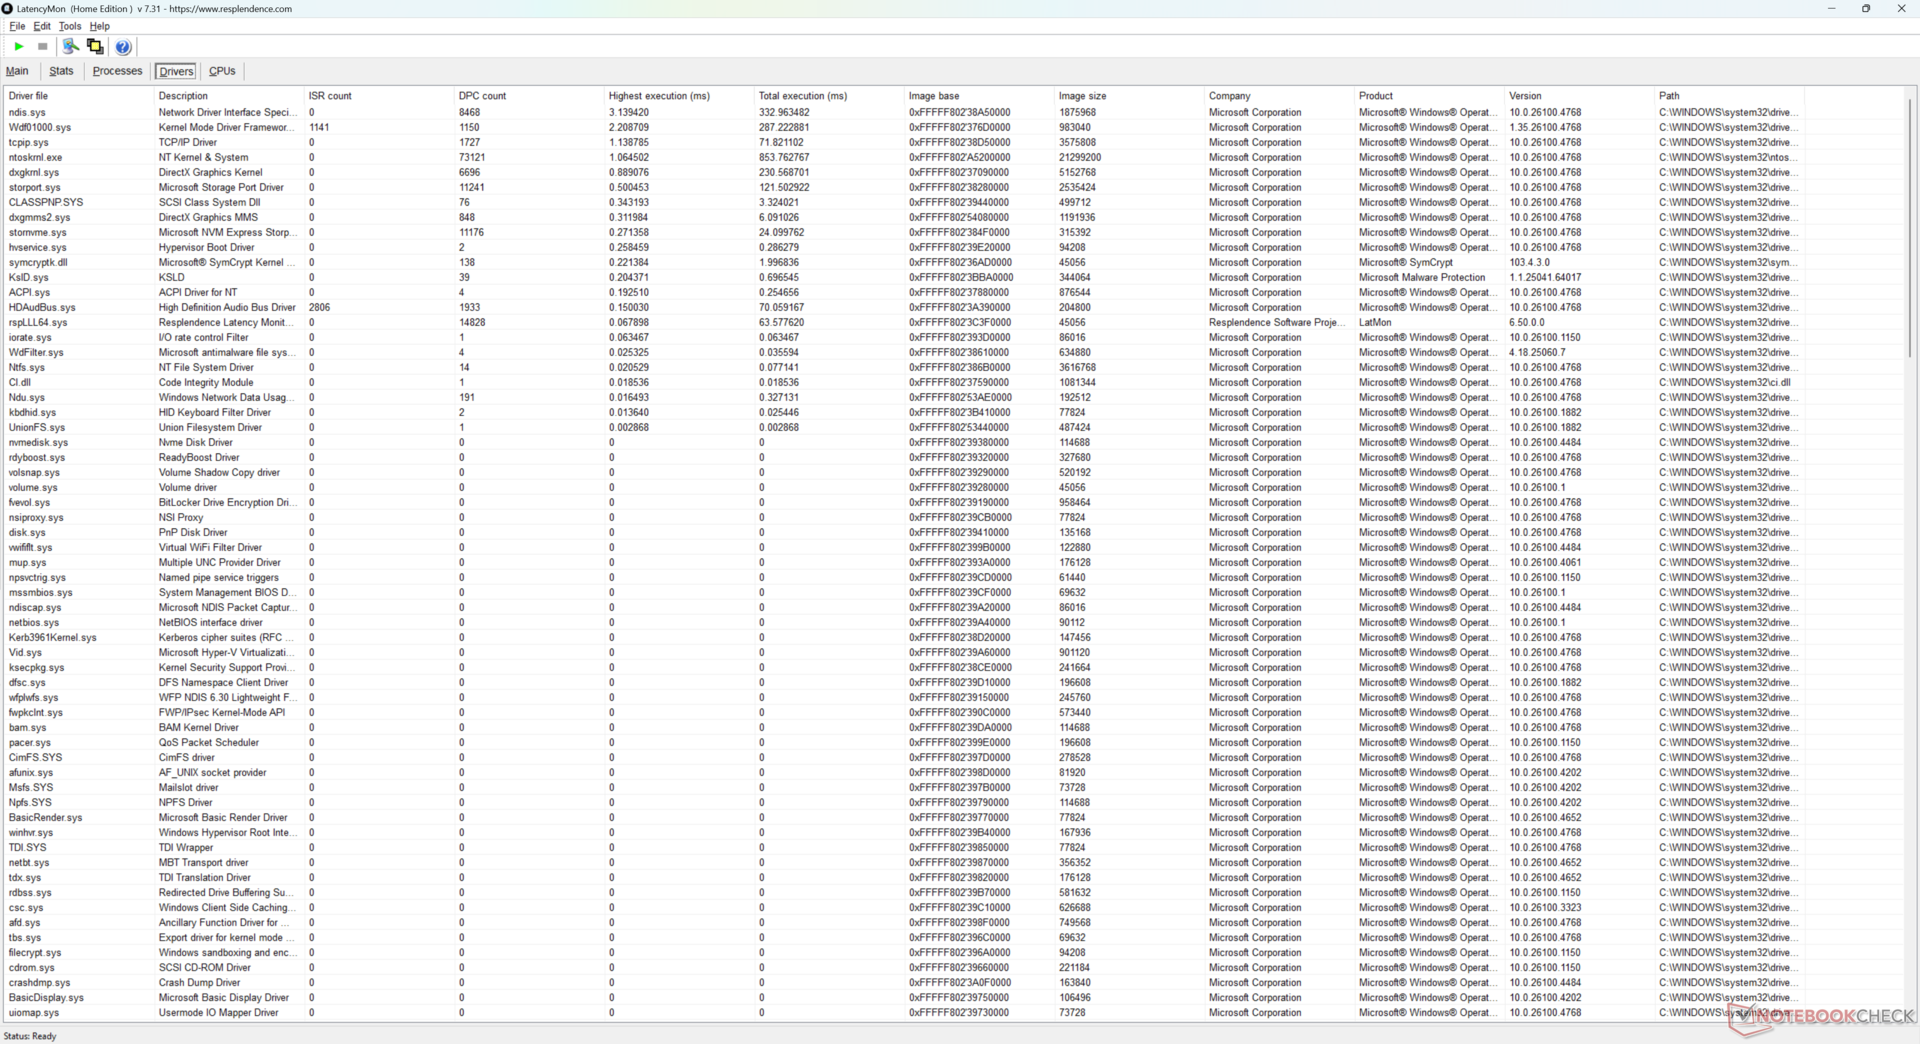
| DPC Latencies / LatencyMon - interrupt to process latency (max), Web, Youtube, Prime95 | |
| HP Z2 Mini G1a | |
| Beelink SEi13 Pro | |
| Beelink GTI13 Ultra | |
| Beelink SEi12 Core i5-1235U | |
| BOSGAME M4 Neo | |
* ... smaller is better
存储设备
机箱还配备了一个大型散热器,用于冷却两个固态硬盘插槽。
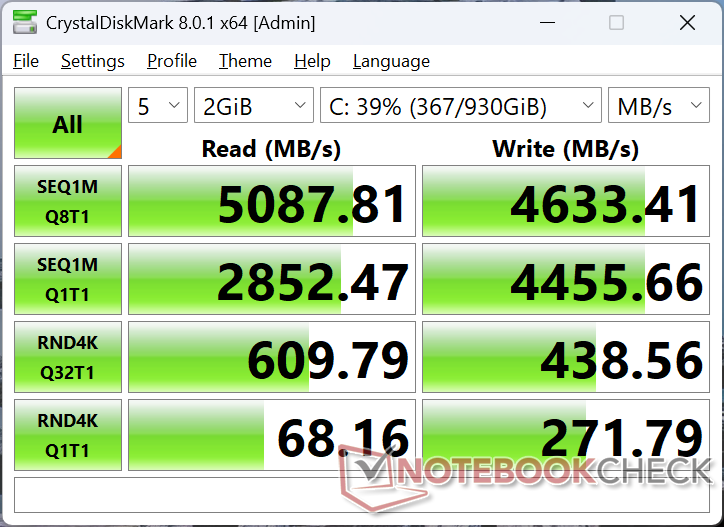
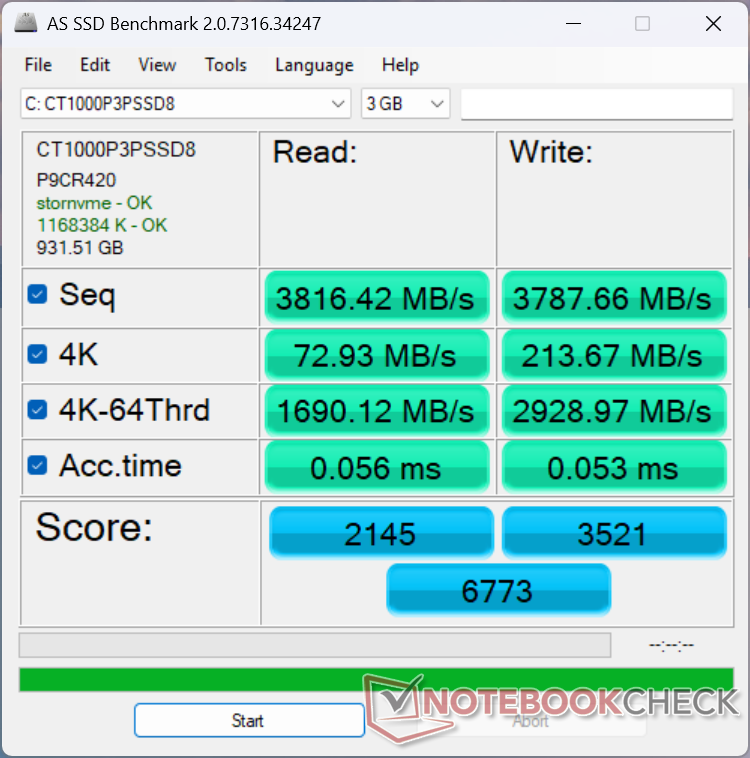

| Drive Performance rating - Percent | |
| Beelink GTI13 Ultra | |
| Beelink SEi13 Pro | |
| HP Z2 Mini G1a | |
| BOSGAME M4 Neo | |
| Beelink SEi12 Core i5-1235U | |
| BMAX B9 Power | |
* ... smaller is better
Disk Throttling: DiskSpd Read Loop, Queue Depth 8
图形处理器性能
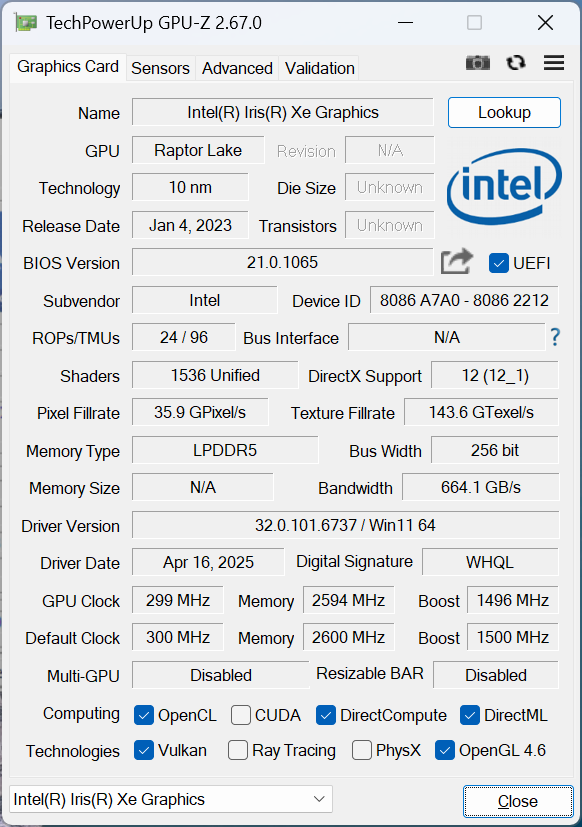
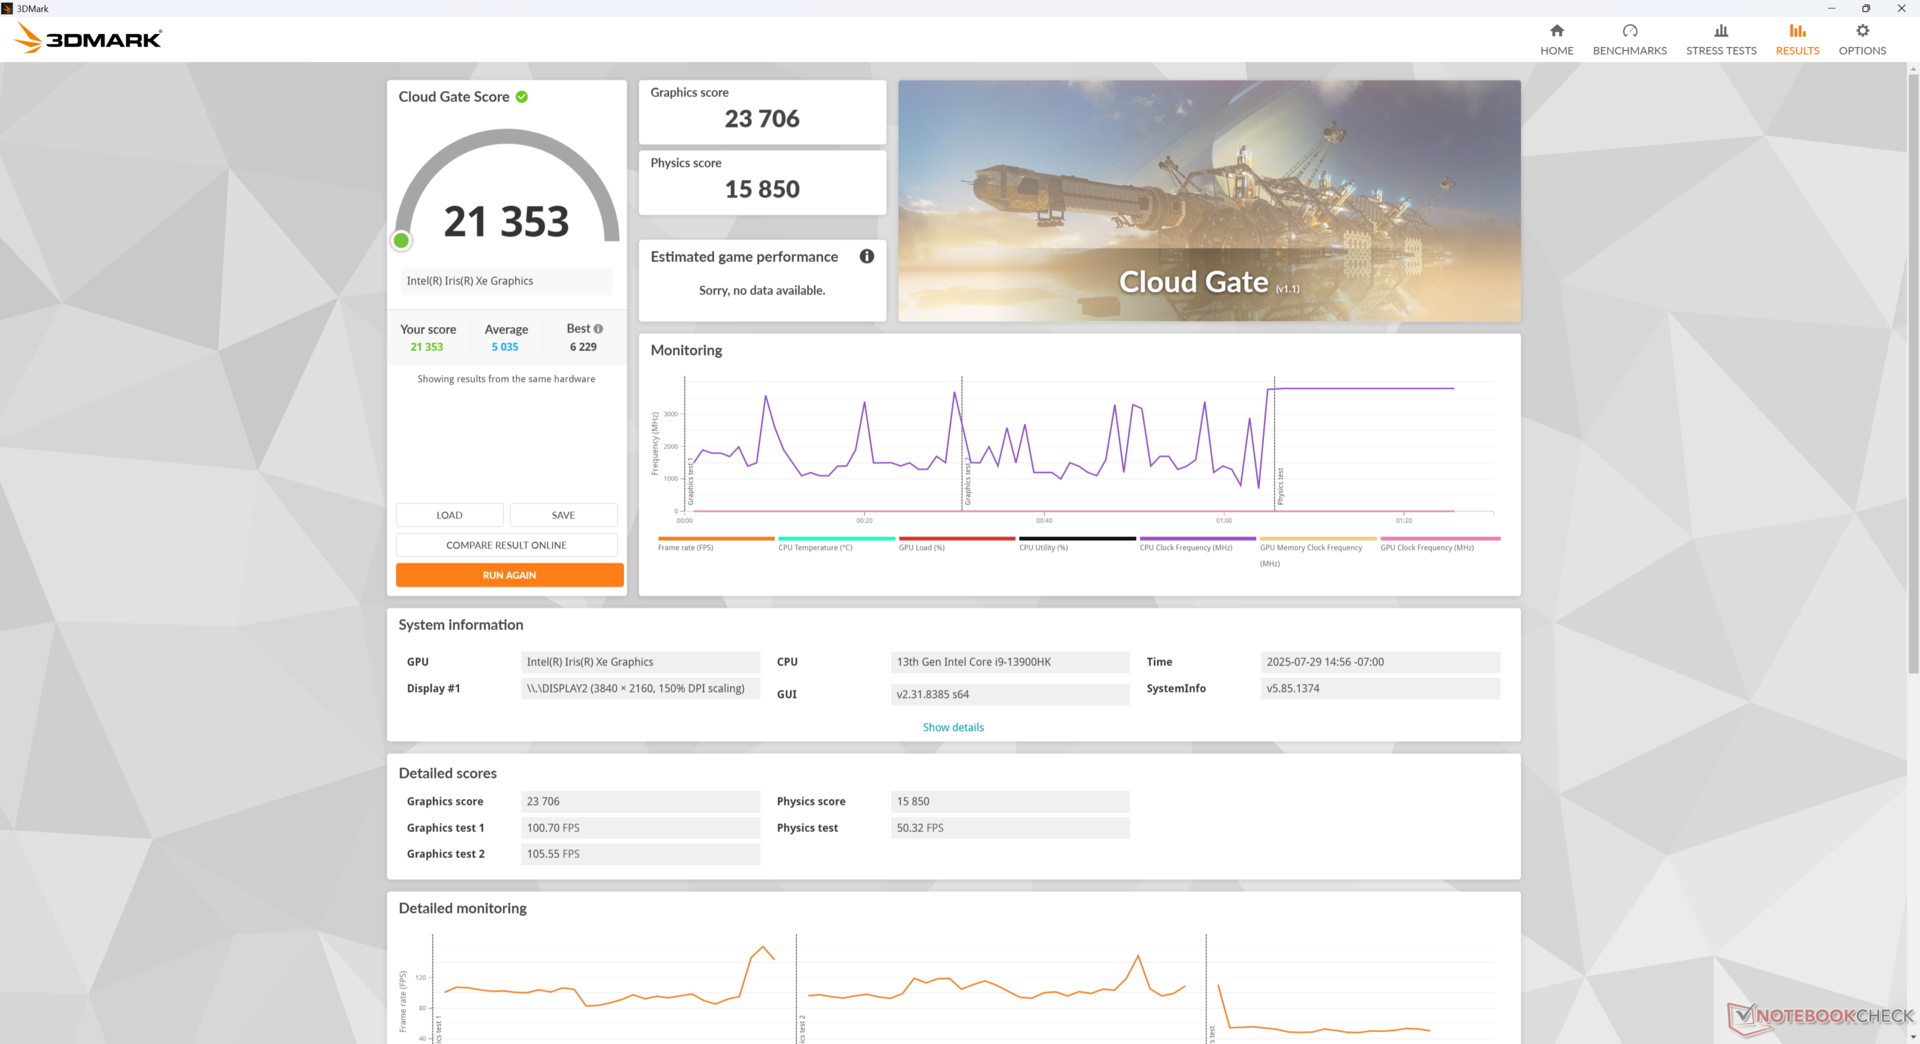
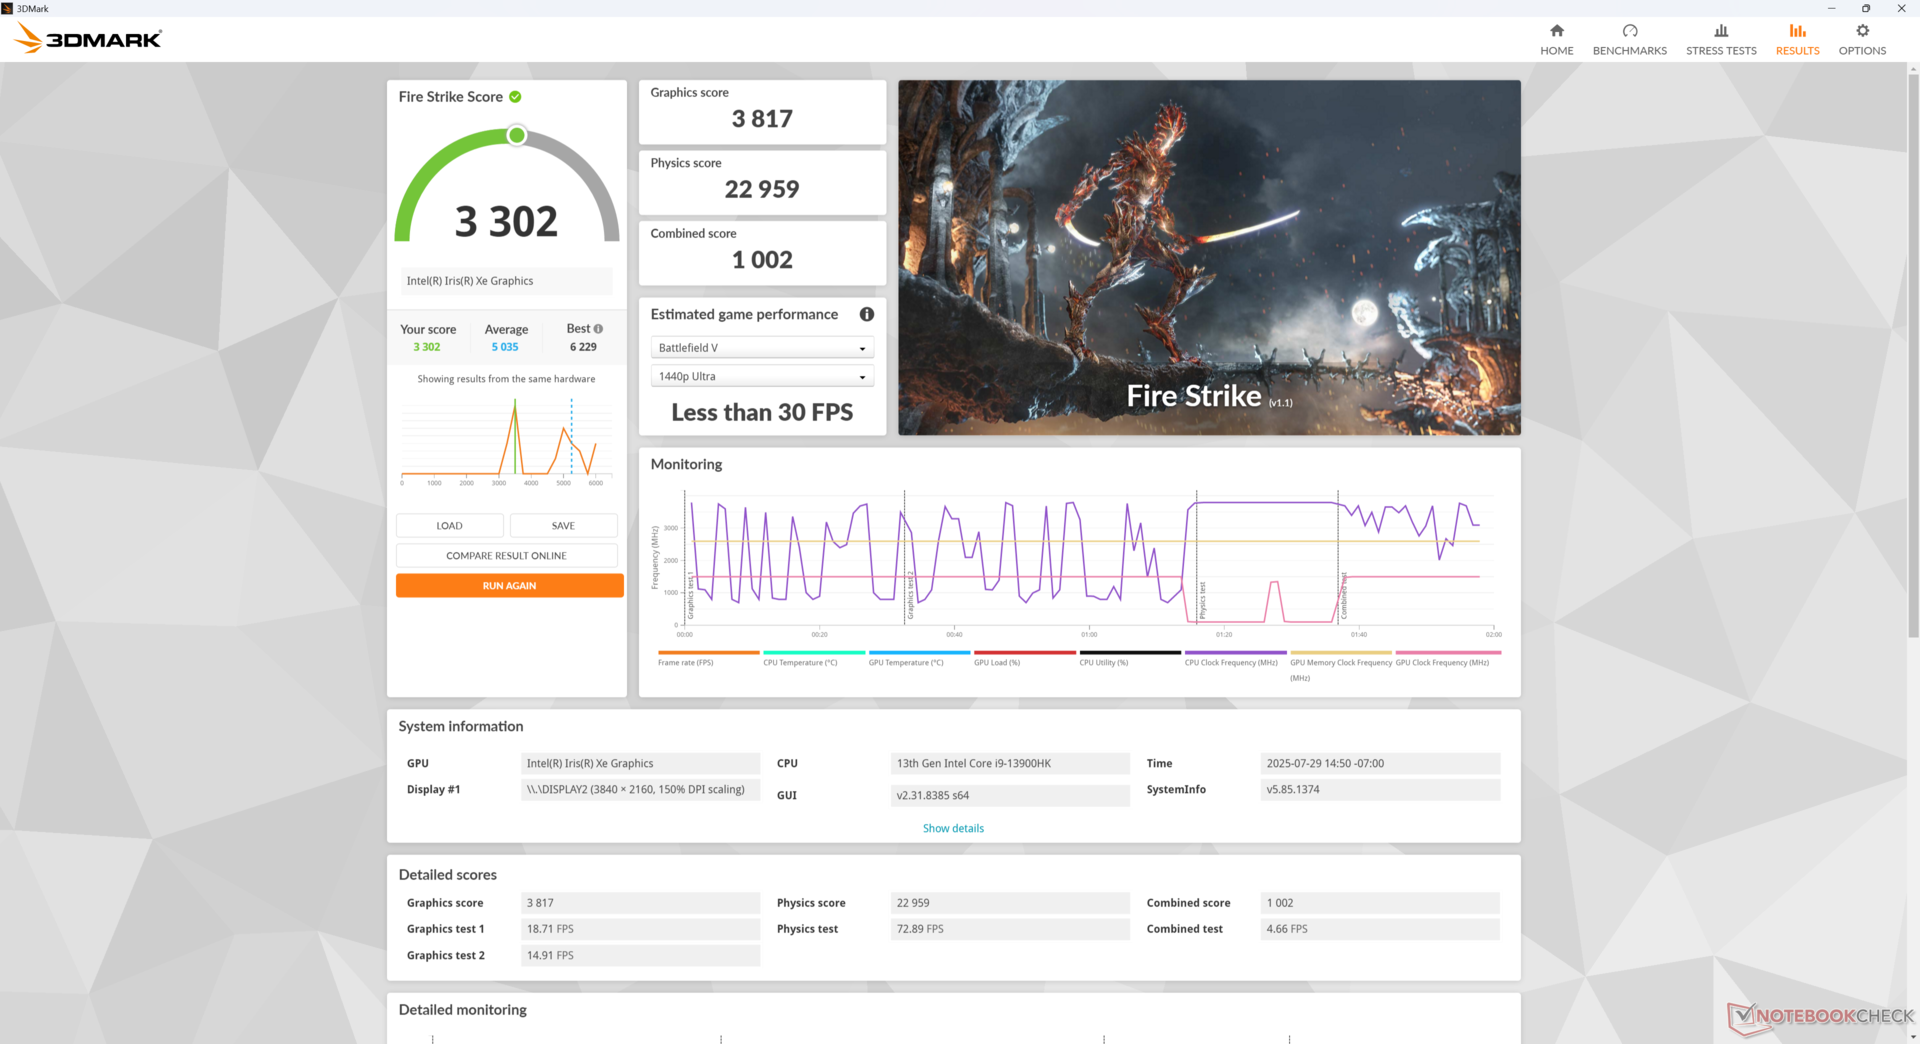
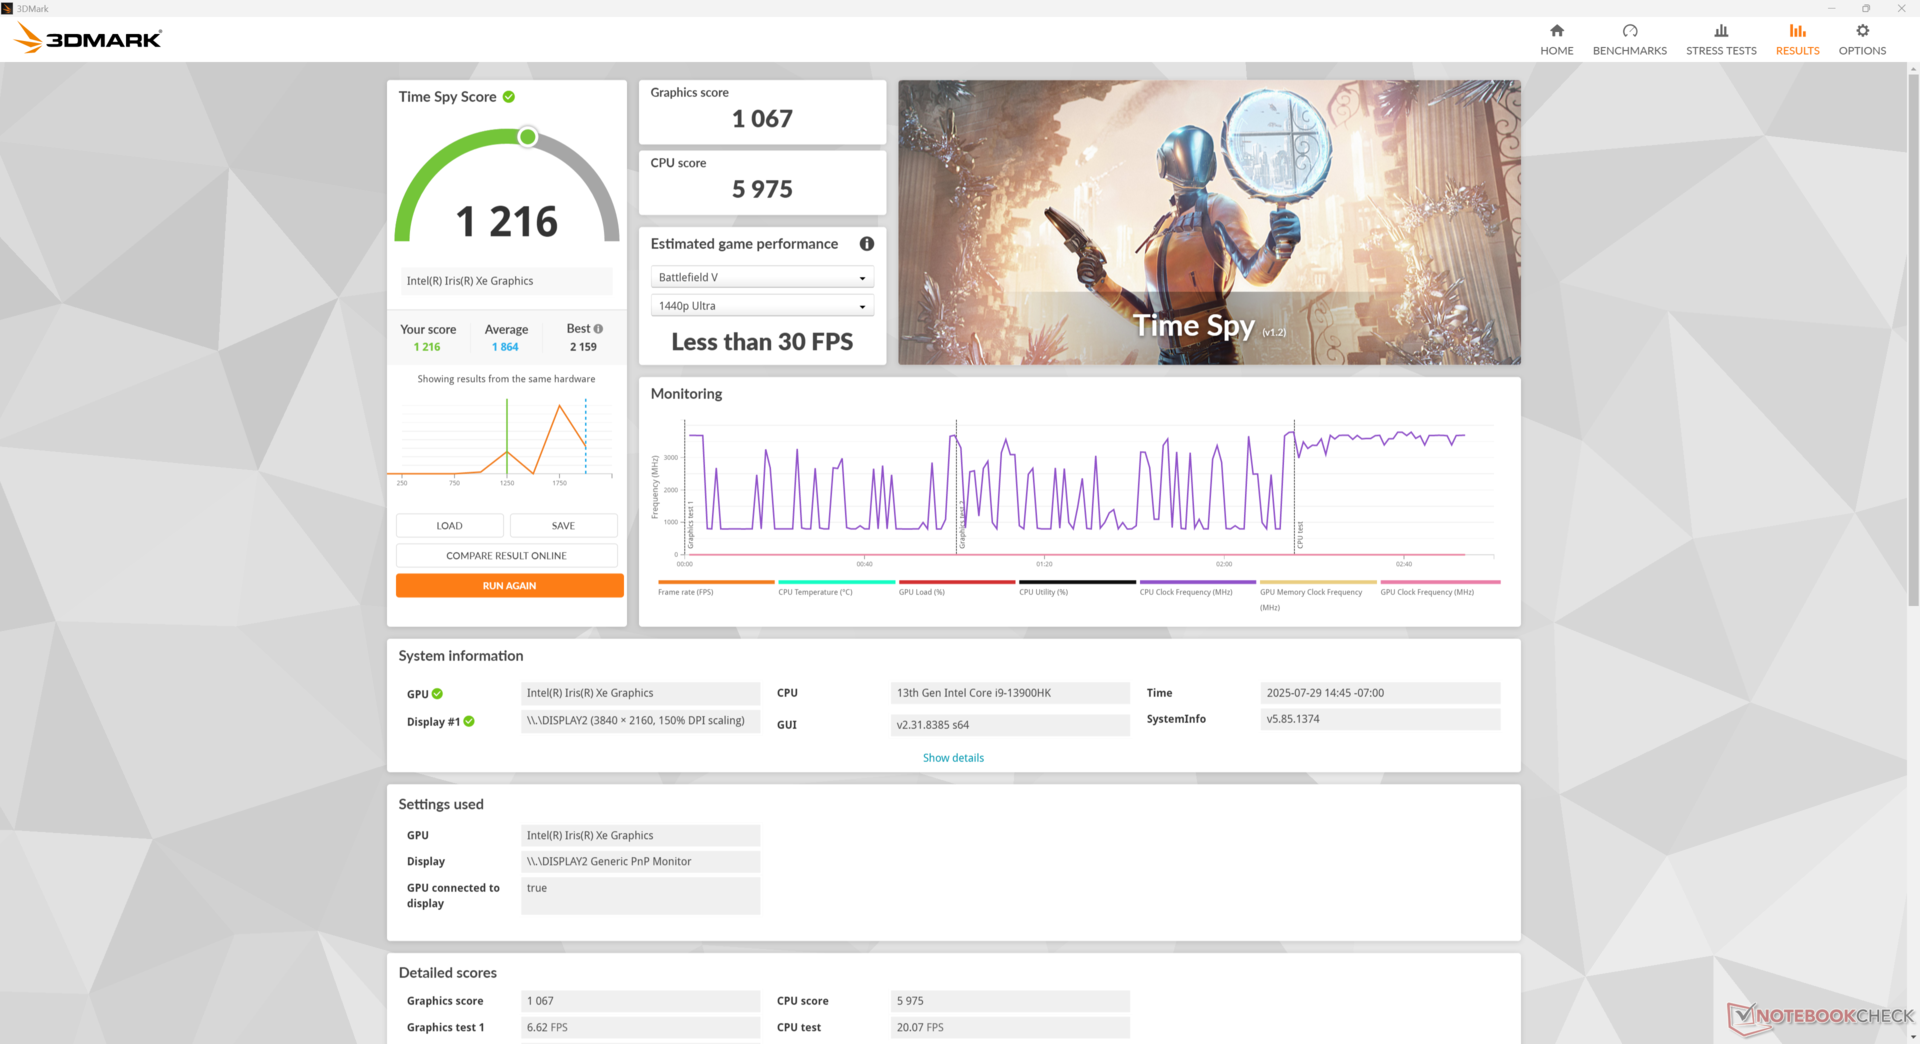
图形 Iris Xe Graphics G7 96 EUs是当前 Arc 系列产品中速度较慢的集成 GPU 之一。虽然不适合游戏,但它仍然足够强大,可以流畅地运行 4K 流媒体。
值得一提的是,X-Plane 11.11和《赛博朋克 2077》基准测试即使经过多次重试和重置,也总是会崩溃。
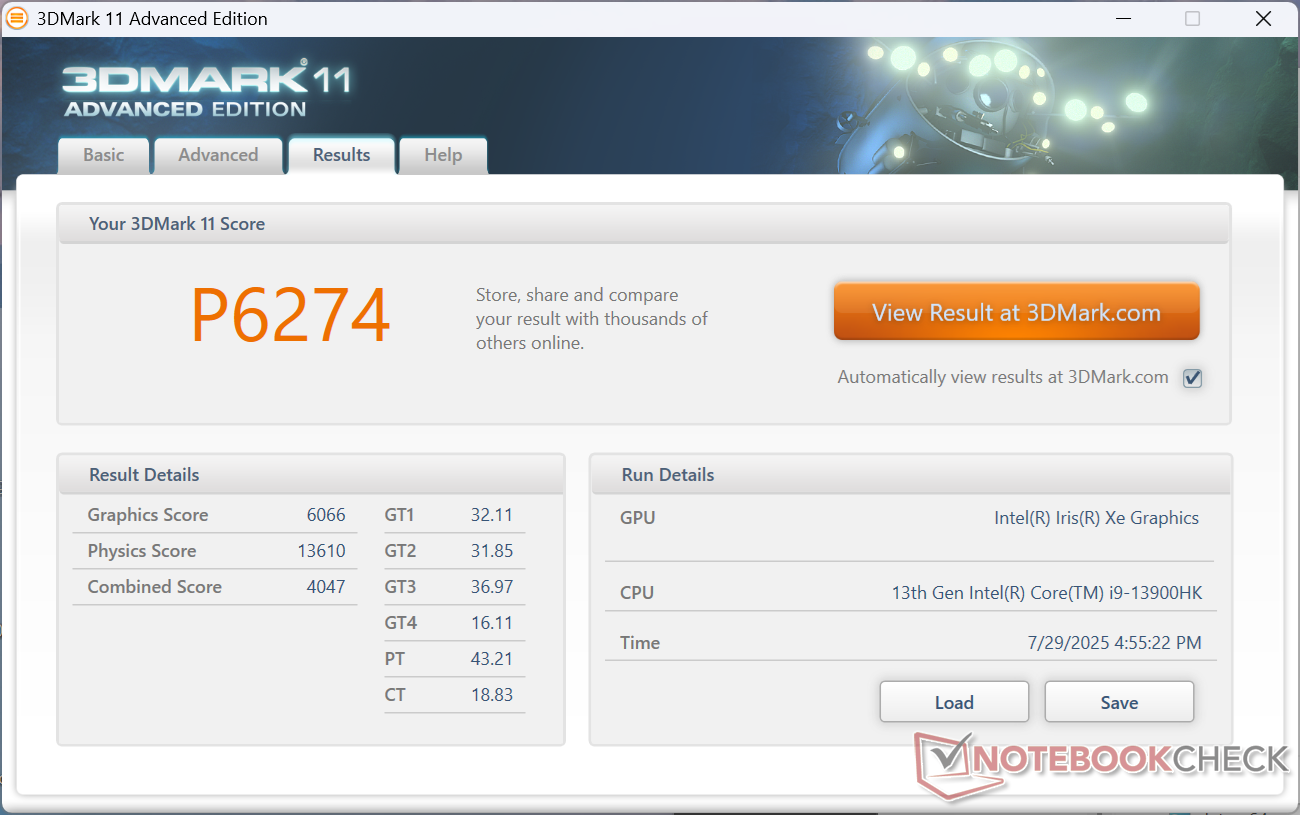
| 3DMark 11 Performance | 6274 points | |
| 3DMark Cloud Gate Standard Score | 21353 points | |
| 3DMark Fire Strike Score | 3302 points | |
| 3DMark Time Spy Score | 1216 points | |
Help | ||
* ... smaller is better
Cyberpunk 2077 ultra FPS Chart
| low | med. | high | ultra | |
|---|---|---|---|---|
| GTA V (2015) | 67.2 | 56.2 | 11.7 | 4.79 |
| Dota 2 Reborn (2015) | 84.4 | 68 | 46.1 | 44 |
| Final Fantasy XV Benchmark (2018) | 30.2 | 14.9 | 10.7 | |
| Strange Brigade (2018) | 67 | 23.4 | 20.1 | 17 |
| Baldur's Gate 3 (2023) | 12.9 | 10.7 | 9.2 | 9.2 |
| Cyberpunk 2077 (2023) | ||||
| F1 24 (2024) | 25.7 | 23.8 | 18 | 14.8 |
排放量
系统噪音
风扇噪音水平略高于较大的 GTi13 Ultra。即便如此,天花板噪音还是明显低于其他产品,如 BOSGAME M4 Neo或更老更慢的 SEi12。
Noise level
| Idle |
| 28 / 28 / 28 dB(A) |
| Load |
| 32.6 / 36.3 dB(A) |
 | ||
30 dB silent 40 dB(A) audible 50 dB(A) loud |
||
min: | ||
| Beelink SEi13 Pro Iris Xe G7 96EUs, i9-13900HK, Crucial P3 Plus CT1000P3PSSD8 | Beelink GTI13 Ultra Iris Xe G7 96EUs, i9-13900HK, Crucial P5 Plus 1TB CT1000P5PSSD8 | Beelink SEi12 Core i5-1235U Iris Xe G7 80EUs, i5-1235U, Kingston NV1 SNVS/500GCN | HP Z2 Mini G1a Radeon 8060S, Ryzen AI Max+ PRO 395, Samsung PM9A1 MZVL22T0HBLB | BOSGAME M4 Neo Radeon 780M, R7 7840HS, Kingston OM8PGP41024N-A0 | |
|---|---|---|---|---|---|
| Noise | 5% | -1% | -37% | -23% | |
| off / environment * (dB) | 23.1 | 23.4 -1% | 23.3 -1% | 24.9 -8% | 24.3 -5% |
| Idle Minimum * (dB) | 28 | 26.5 5% | 27.8 1% | 32.1 -15% | 37.6 -34% |
| Idle Average * (dB) | 28 | 26.7 5% | 27.8 1% | 32.4 -16% | 37.9 -35% |
| Idle Maximum * (dB) | 28 | 28.5 -2% | 27.8 1% | 32.6 -16% | 38 -36% |
| Load Average * (dB) | 32.6 | 30.6 6% | 32 2% | 41.1 -26% | 40.8 -25% |
| Cyberpunk 2077 ultra * (dB) | 34.3 | 32.5 5% | 67 -95% | 40.18 -17% | |
| Load Maximum * (dB) | 36.3 | 30.8 15% | 39.2 -8% | 67.3 -85% | 40.2 -11% |
| Witcher 3 ultra * (dB) | 34.1 | 70 |
* ... smaller is better
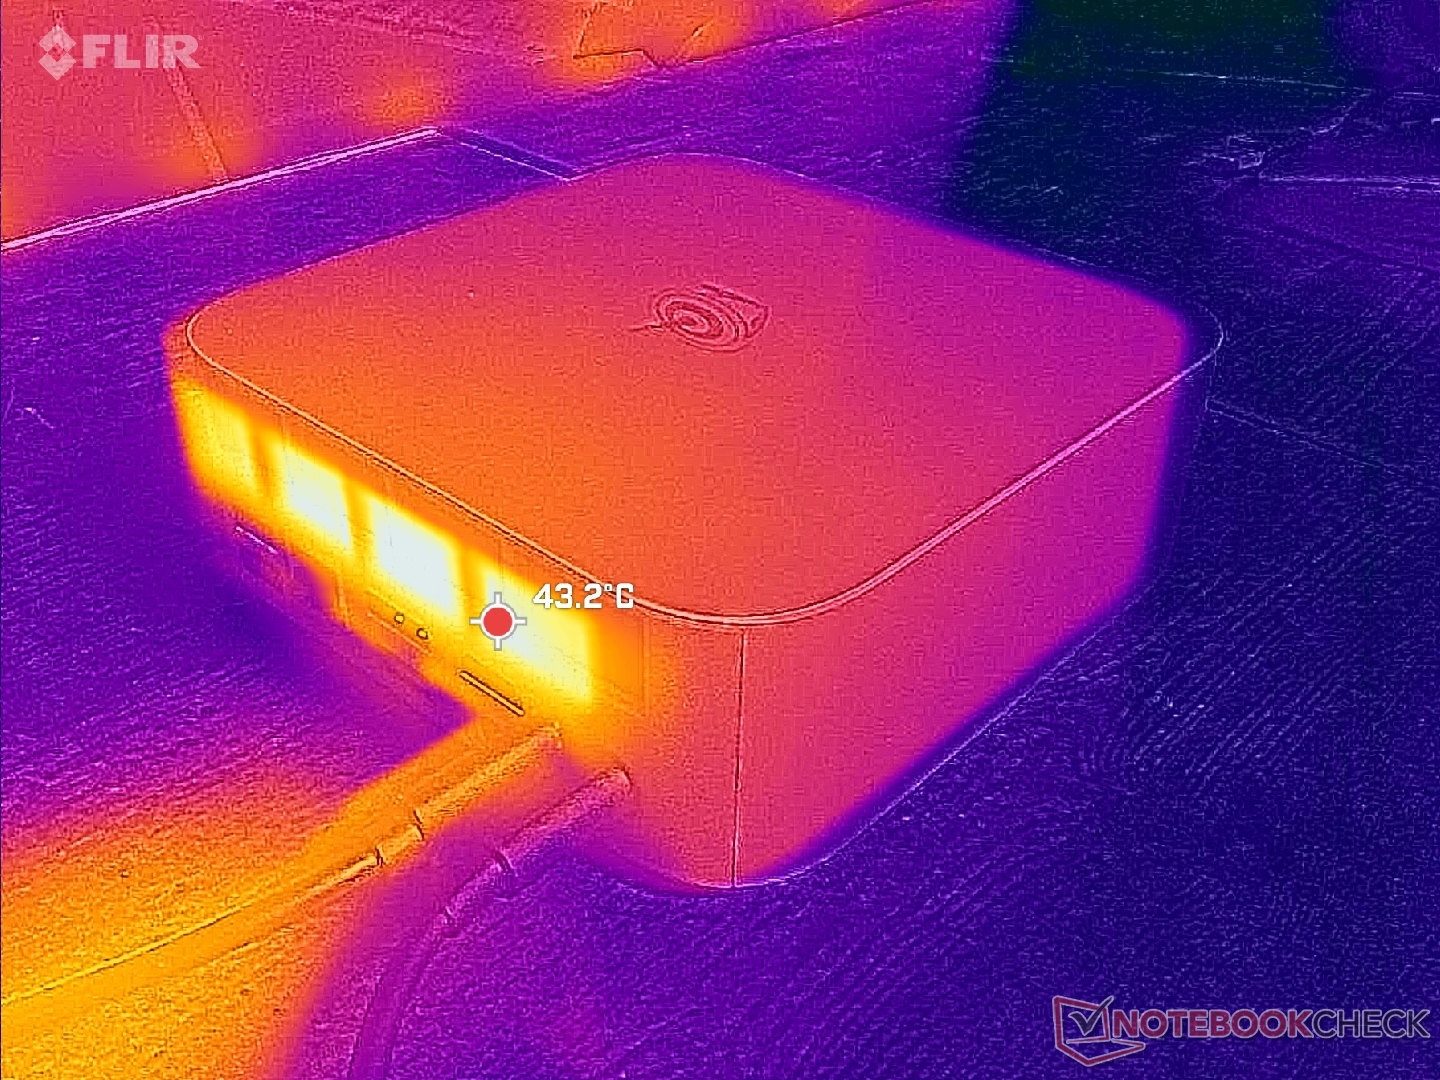
温度
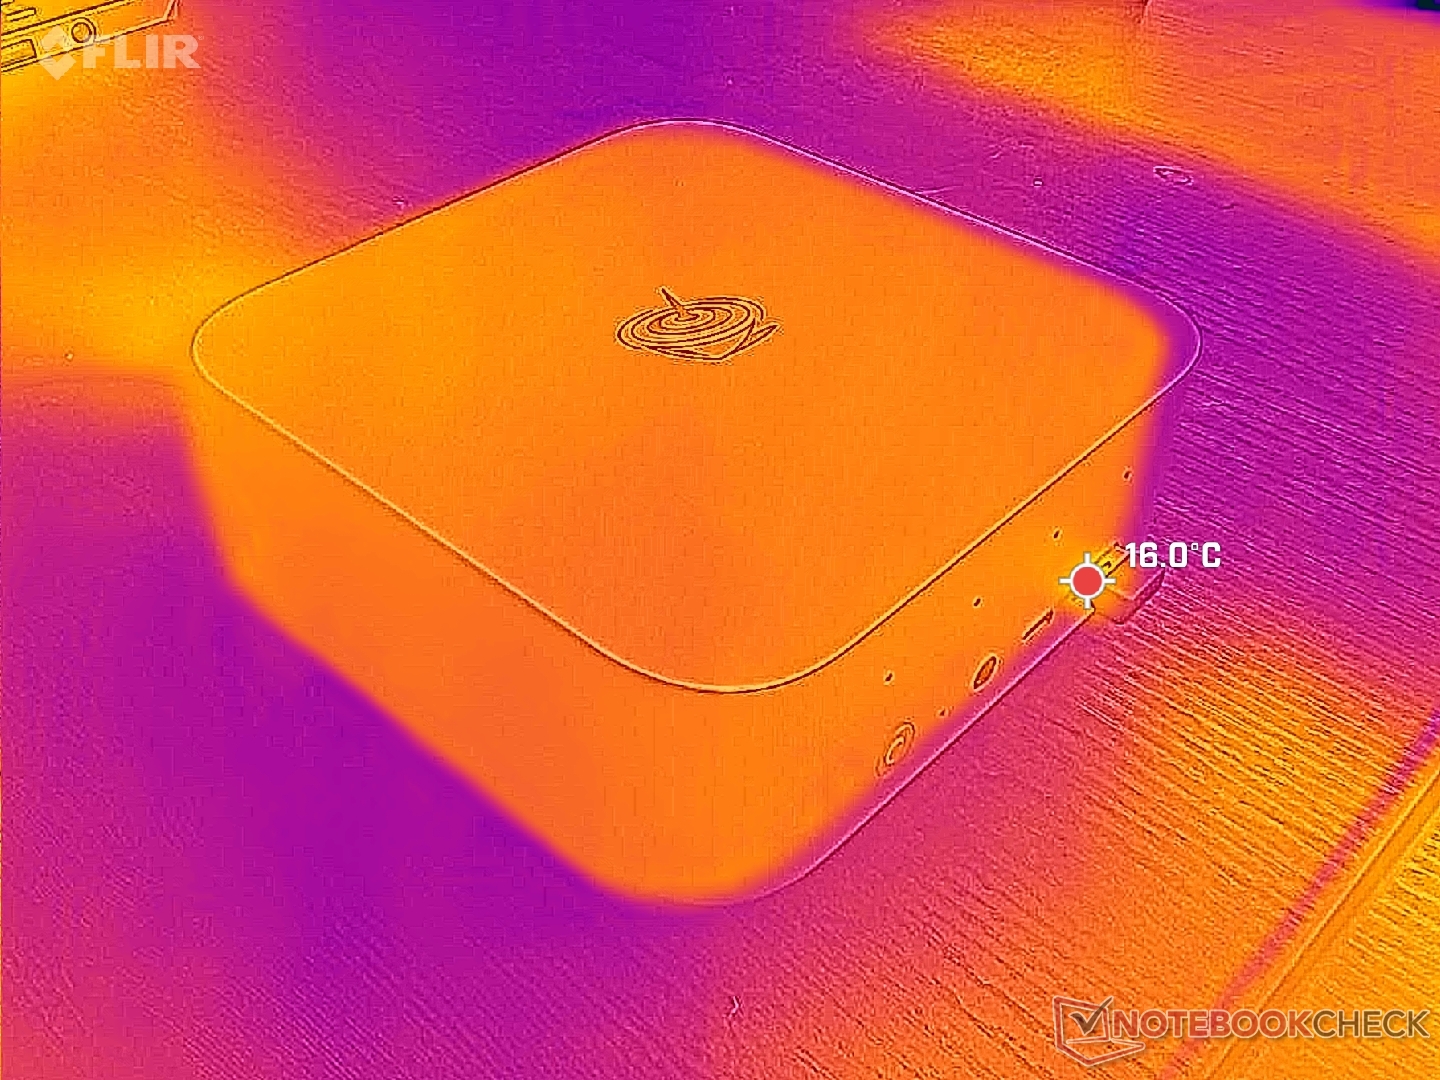
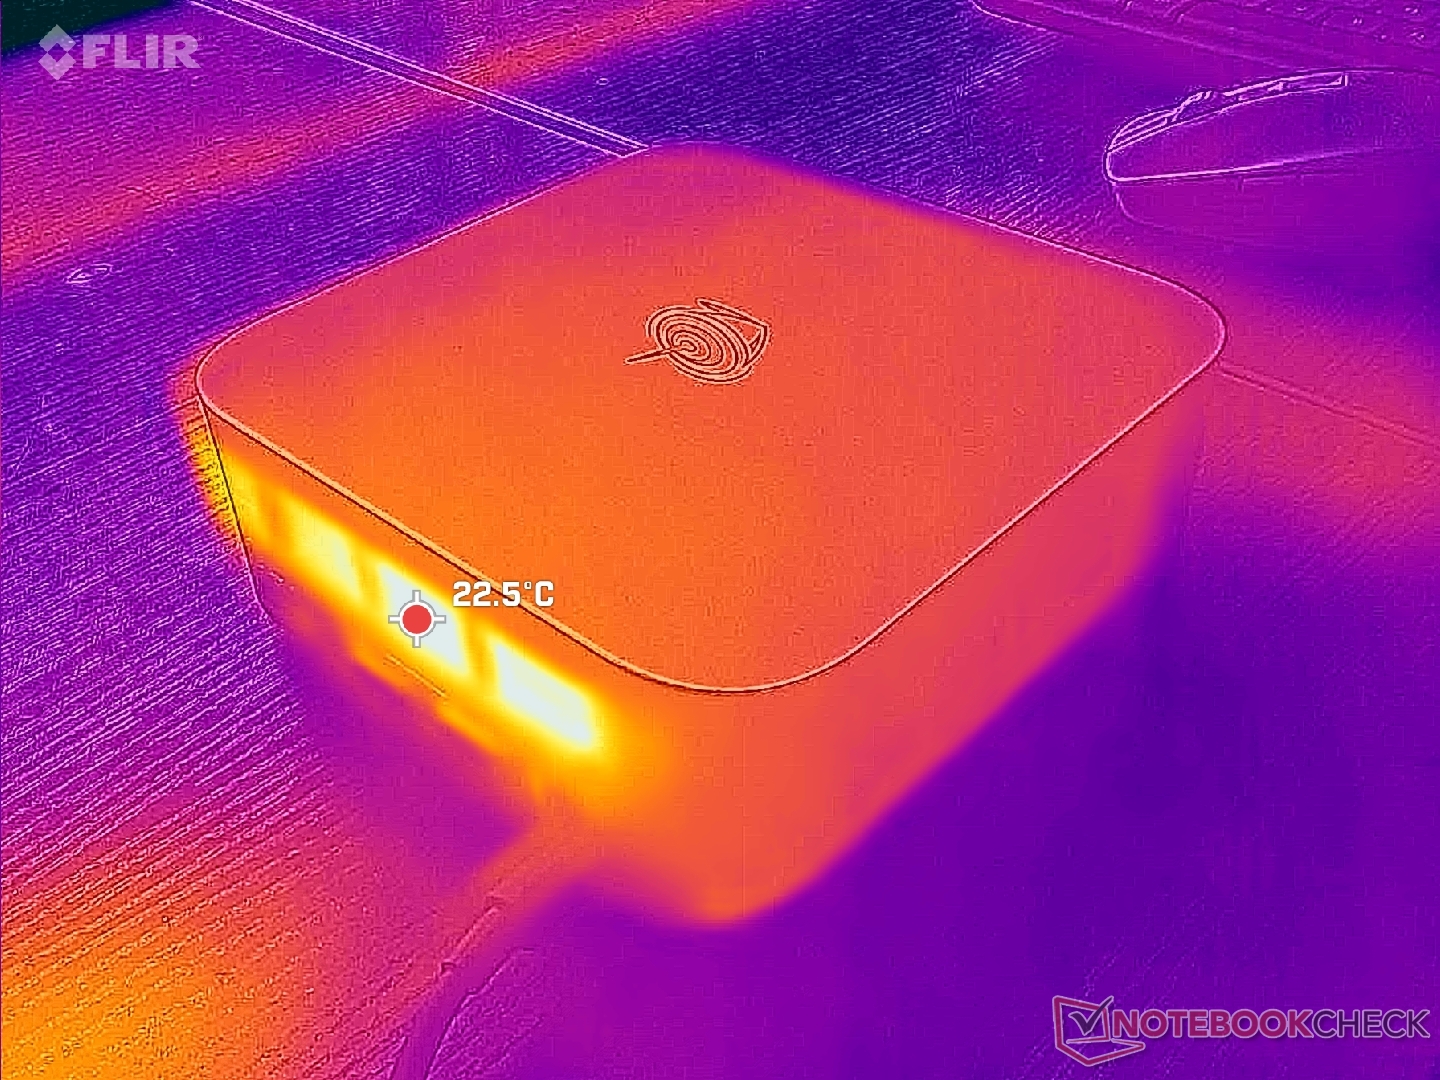
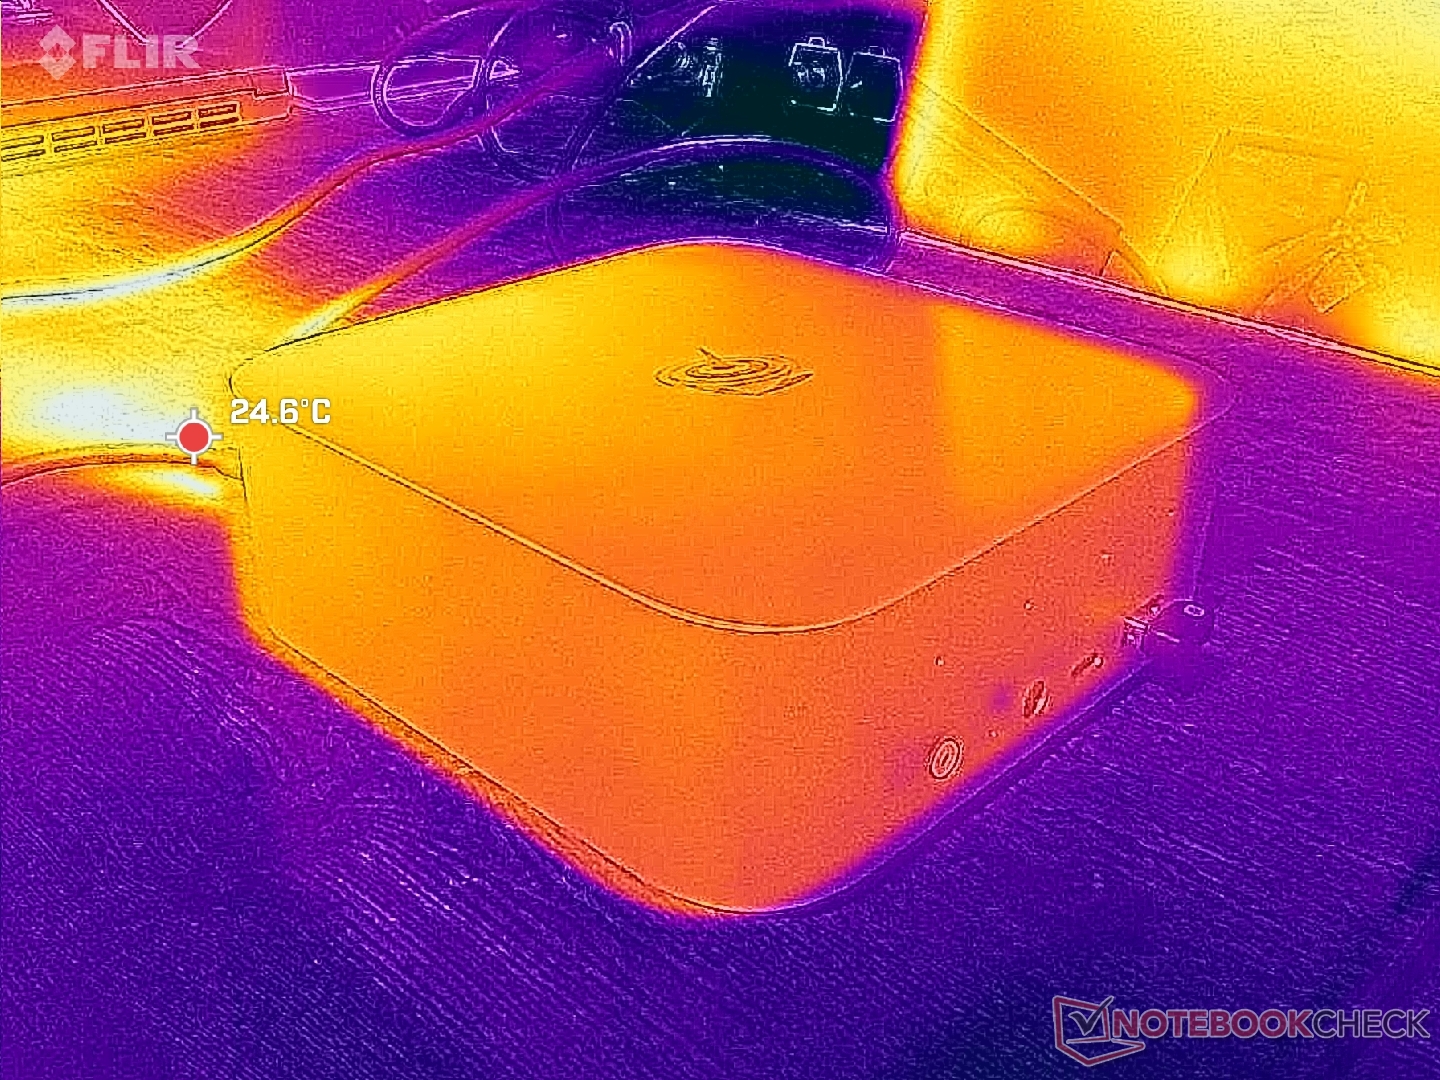
废热从后部排出,新鲜空气从底部进入。尽管通风栅很少,但顶部表面会变得温暖,但绝不会热得让人不舒服。
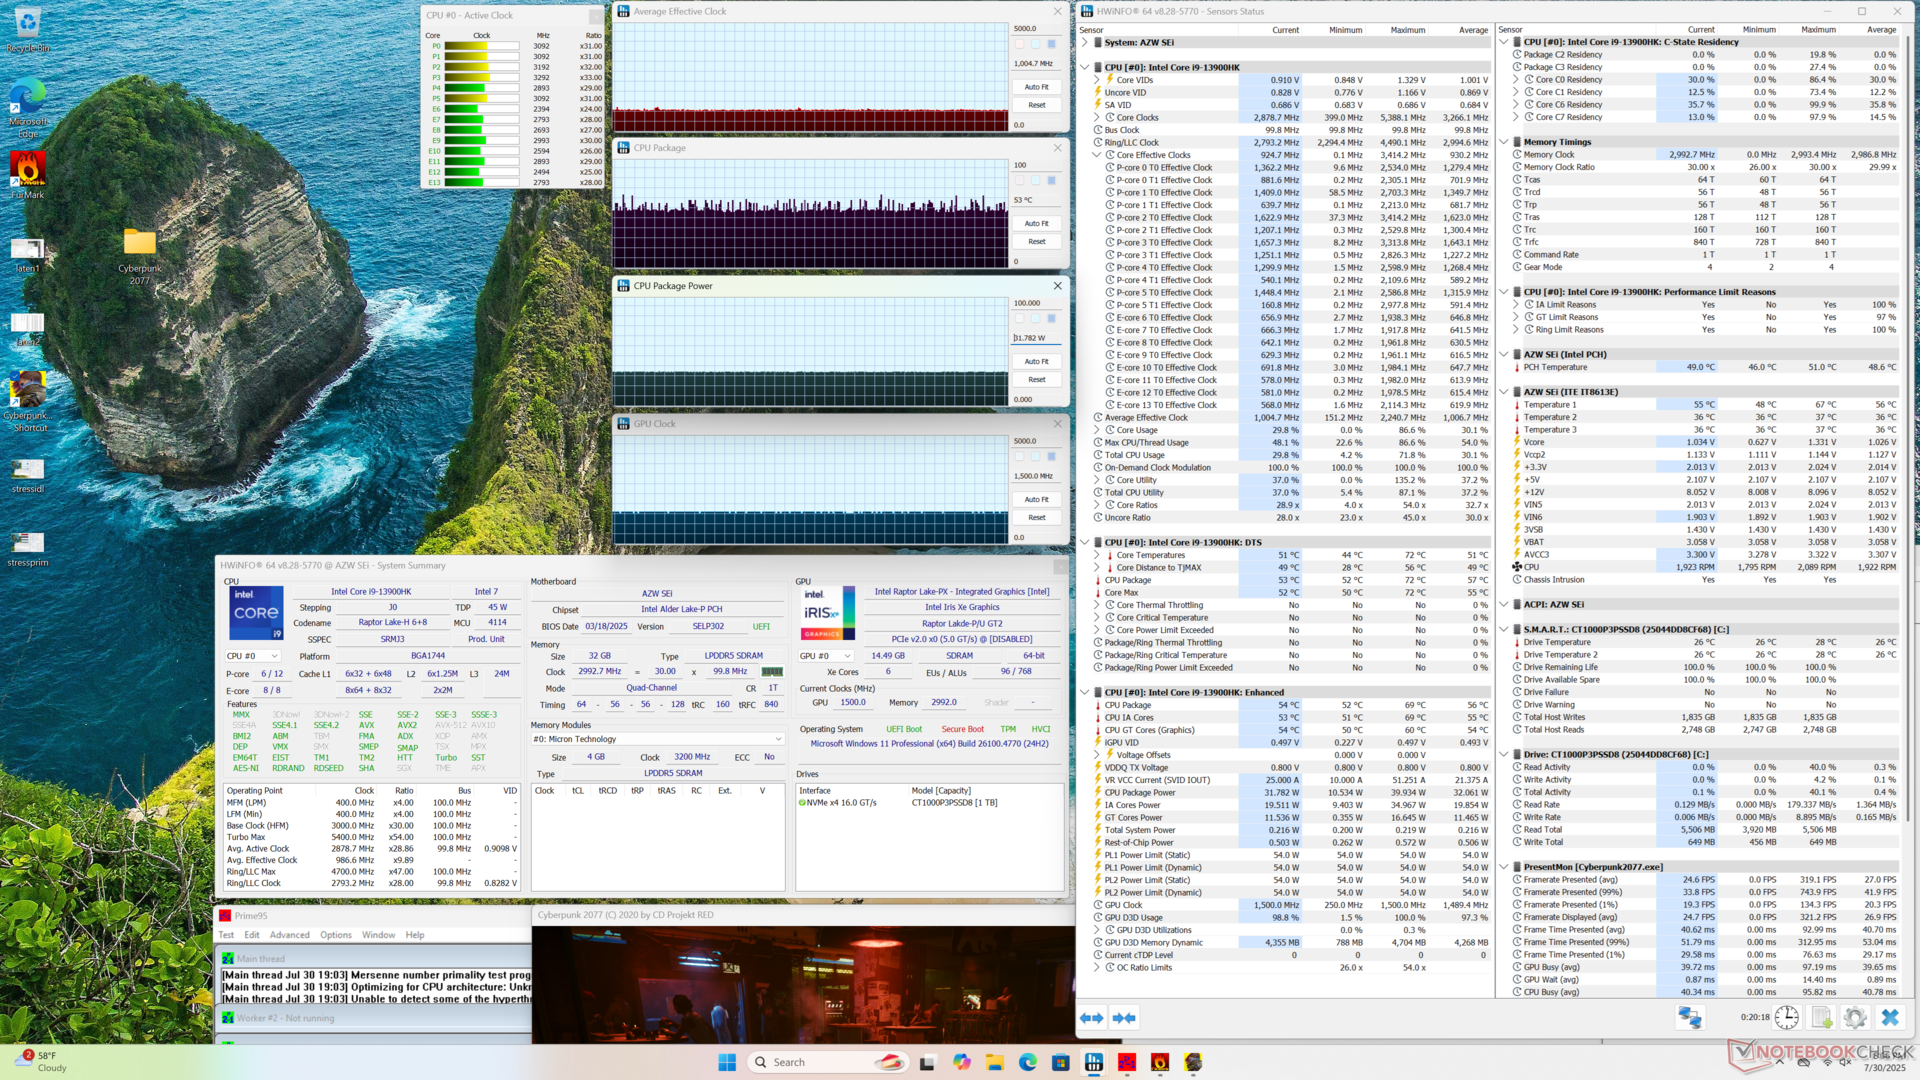
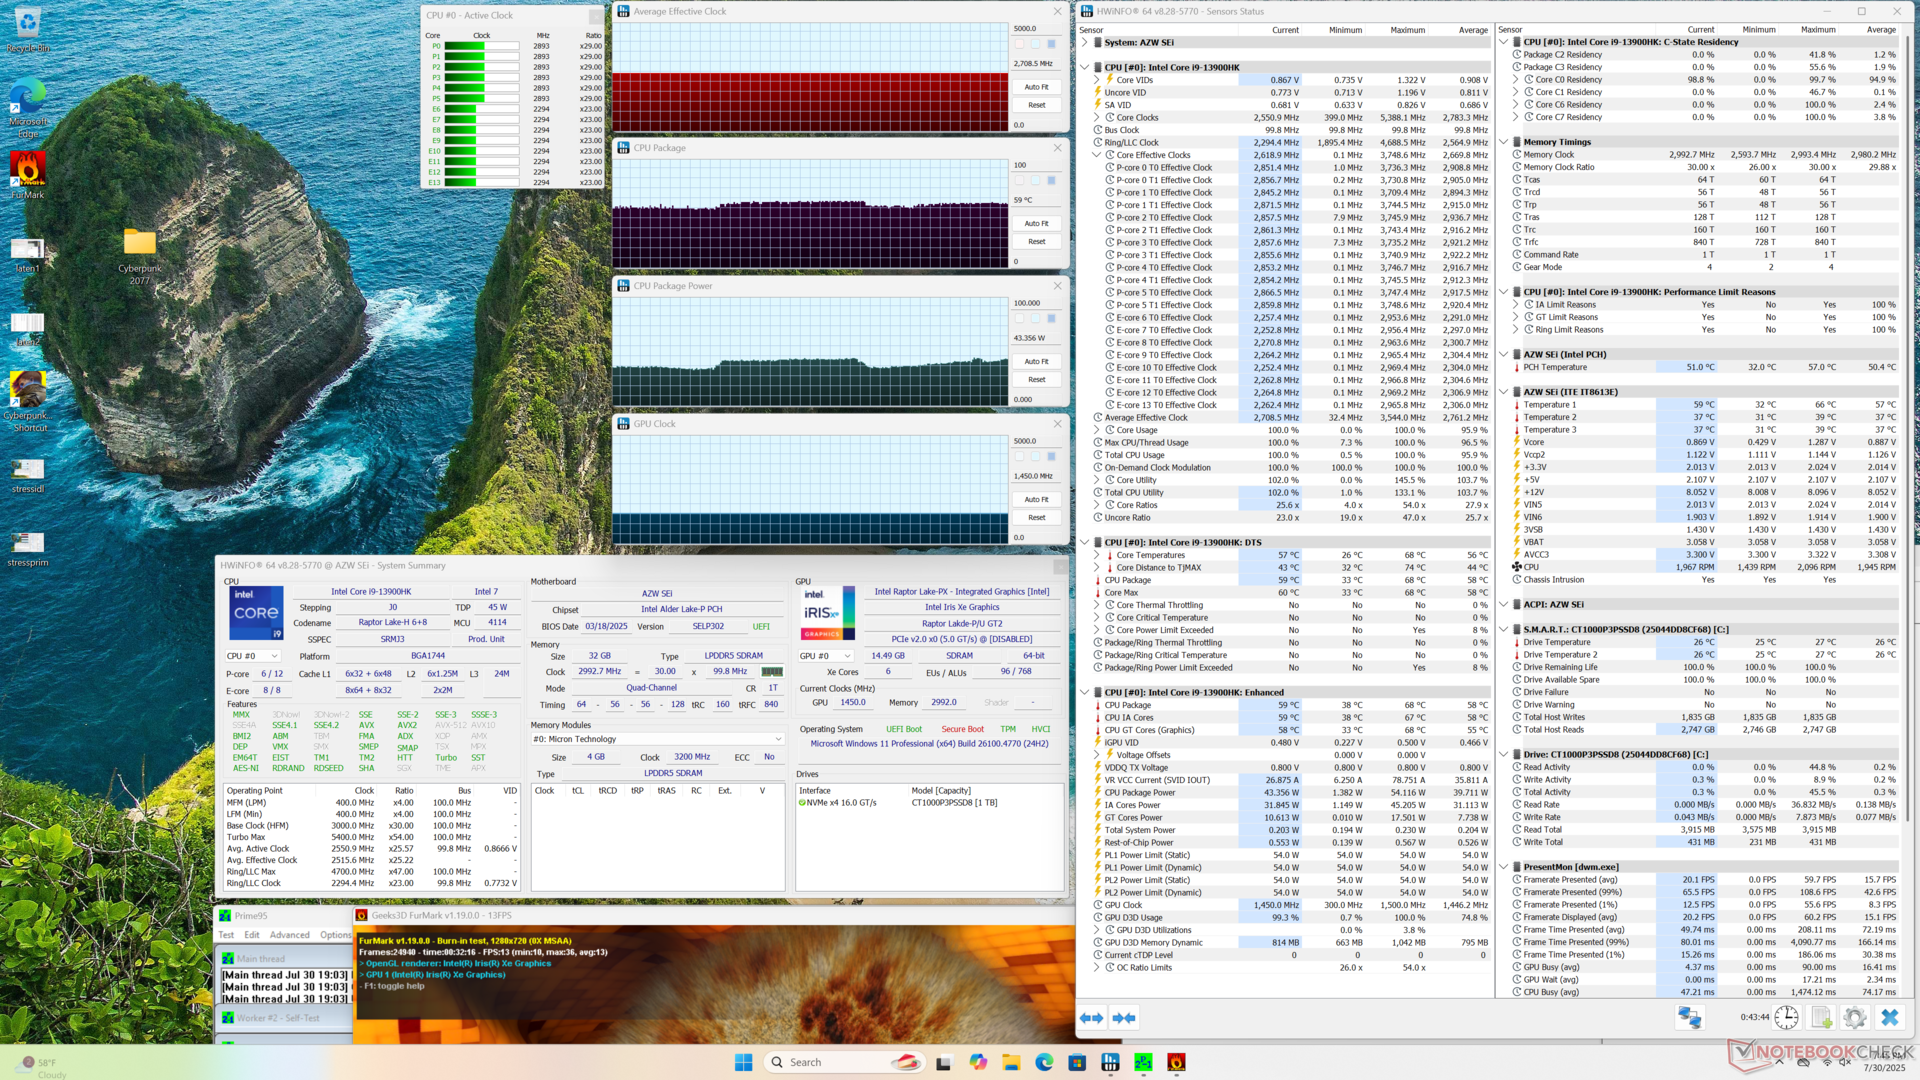
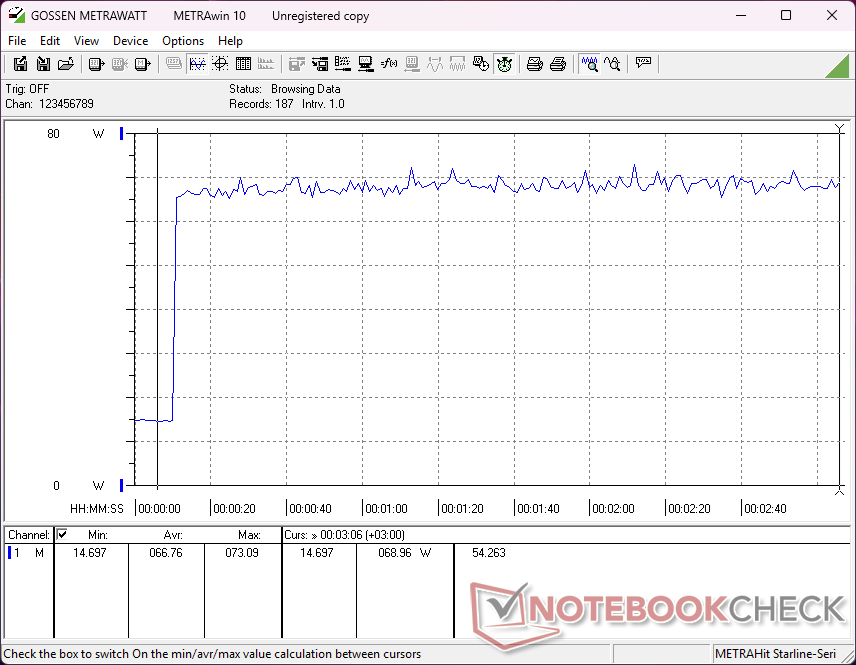
压力测试
运行 Prime95 时,CPU 的频率稳定在 3.5 GHz,功耗为 44 W,温度为 60 C,比我们在 GTI13 Ultra 上观察到的温度低几度。
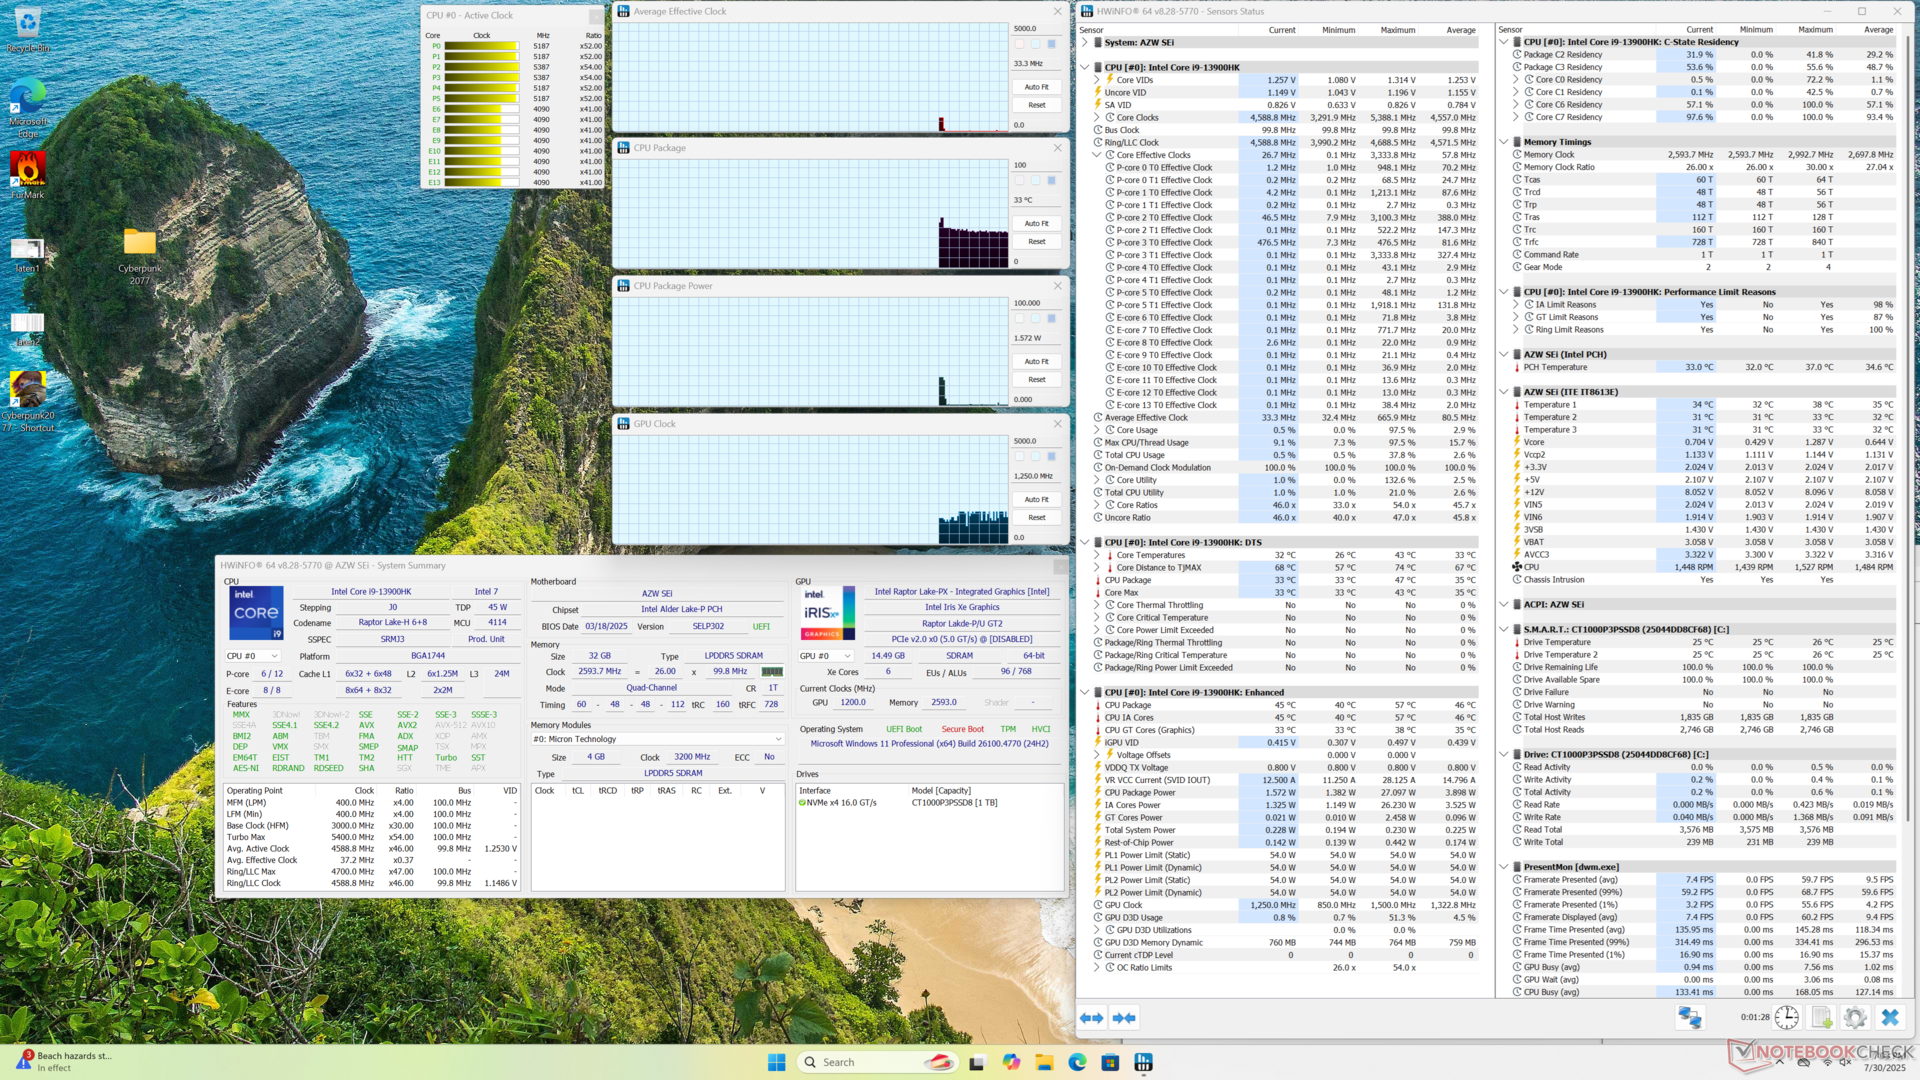

| CPU 平均时钟 (GHz) | GPU 时钟 (MHz) | CPU 平均温度 (°C) | |
| 系统闲置 | -- | -- | 33 |
| Prime95 压力 | 3.5 | -- | 60 |
| Prime95 + FurMark Stress | 2.7 | 1450 | 59 |
| 赛博朋克 2077》压力 | 1.0 | 1500 | 53 |
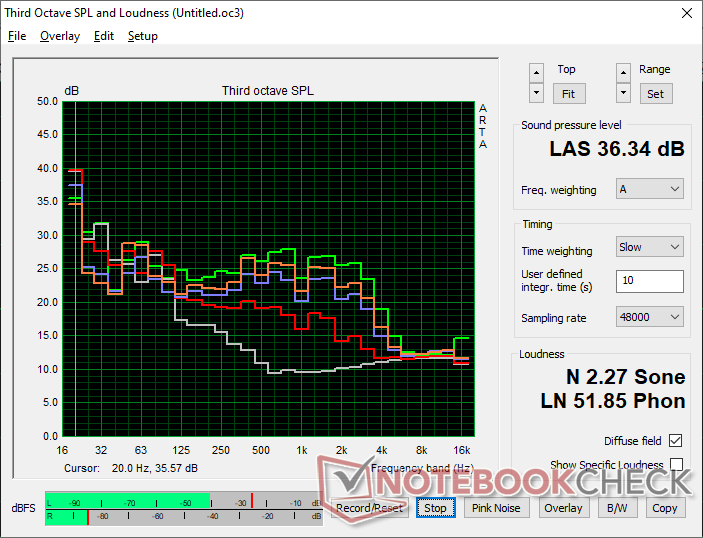
发言人
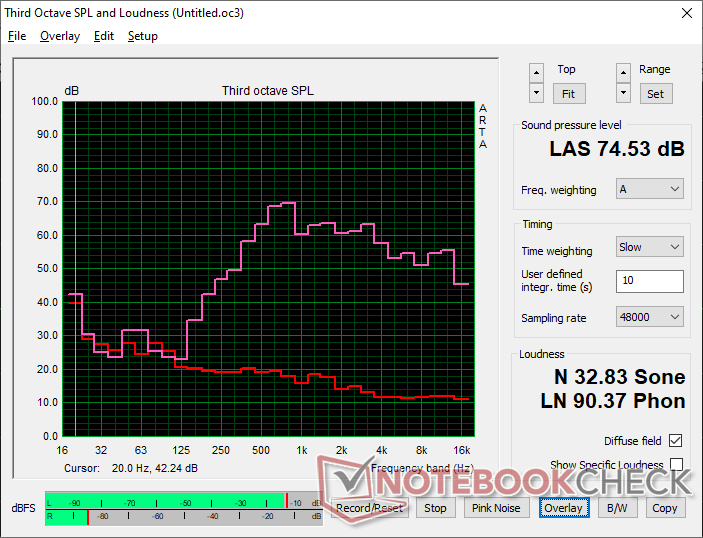
Beelink SEi13 Pro audio analysis
(±) | speaker loudness is average but good (74.5 dB)
Bass 100 - 315 Hz
(-) | nearly no bass - on average 18.9% lower than median
(±) | linearity of bass is average (12.7% delta to prev. frequency)
Mids 400 - 2000 Hz
(±) | higher mids - on average 7.9% higher than median
(±) | linearity of mids is average (11.9% delta to prev. frequency)
Highs 2 - 16 kHz
(+) | balanced highs - only 3.5% away from median
(±) | linearity of highs is average (8.1% delta to prev. frequency)
Overall 100 - 16.000 Hz
(±) | linearity of overall sound is average (26.7% difference to median)
Compared to same class
» 71% of all tested devices in this class were better, 4% similar, 25% worse
» The best had a delta of 13%, average was 24%, worst was 64%
Compared to all devices tested
» 82% of all tested devices were better, 4% similar, 14% worse
» The best had a delta of 4%, average was 23%, worst was 134%
Apple MacBook Pro 16 2021 M1 Pro audio analysis
(+) | speakers can play relatively loud (84.7 dB)
Bass 100 - 315 Hz
(+) | good bass - only 3.8% away from median
(+) | bass is linear (5.2% delta to prev. frequency)
Mids 400 - 2000 Hz
(+) | balanced mids - only 1.3% away from median
(+) | mids are linear (2.1% delta to prev. frequency)
Highs 2 - 16 kHz
(+) | balanced highs - only 1.9% away from median
(+) | highs are linear (2.7% delta to prev. frequency)
Overall 100 - 16.000 Hz
(+) | overall sound is linear (4.6% difference to median)
Compared to same class
» 0% of all tested devices in this class were better, 0% similar, 100% worse
» The best had a delta of 5%, average was 17%, worst was 45%
Compared to all devices tested
» 0% of all tested devices were better, 0% similar, 100% worse
» The best had a delta of 4%, average was 23%, worst was 134%
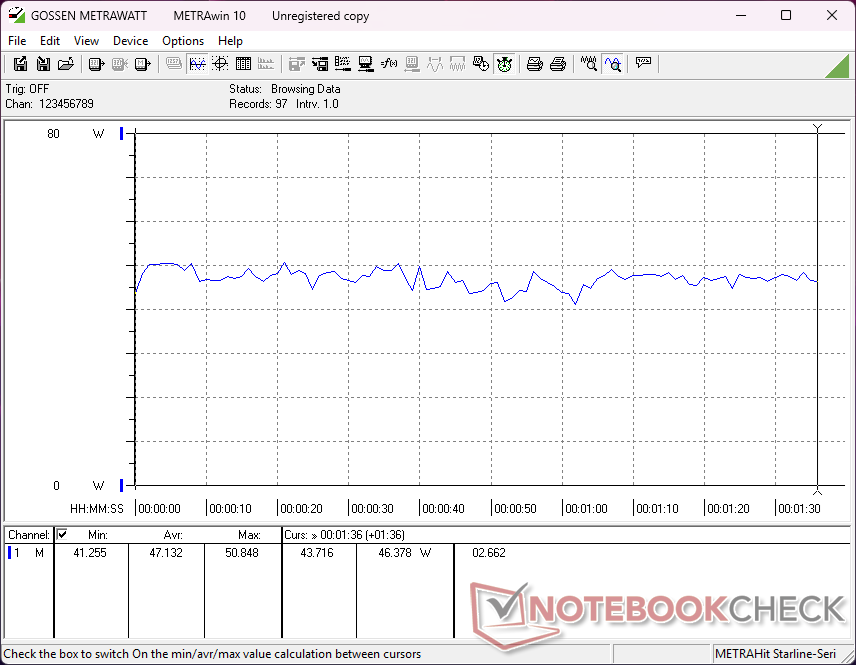
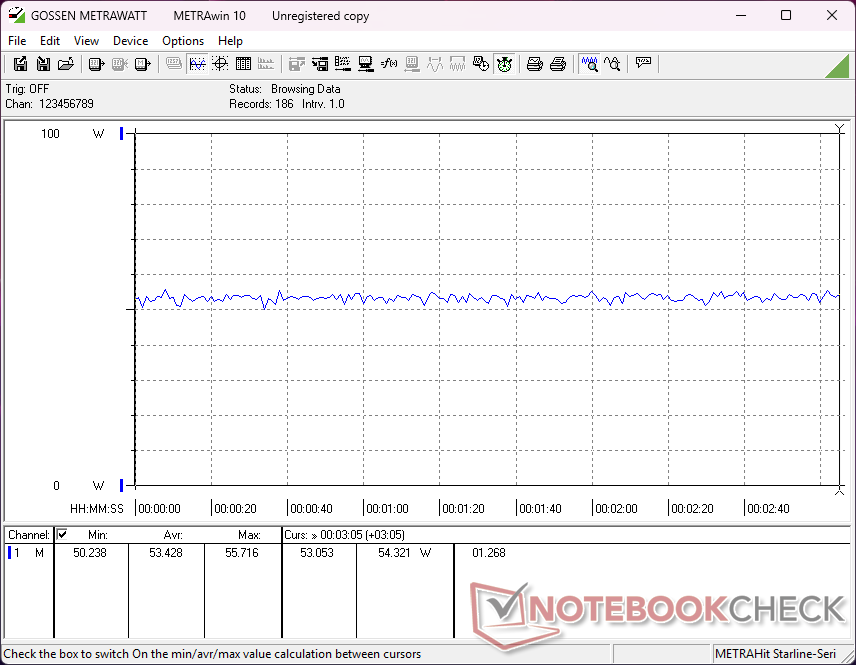
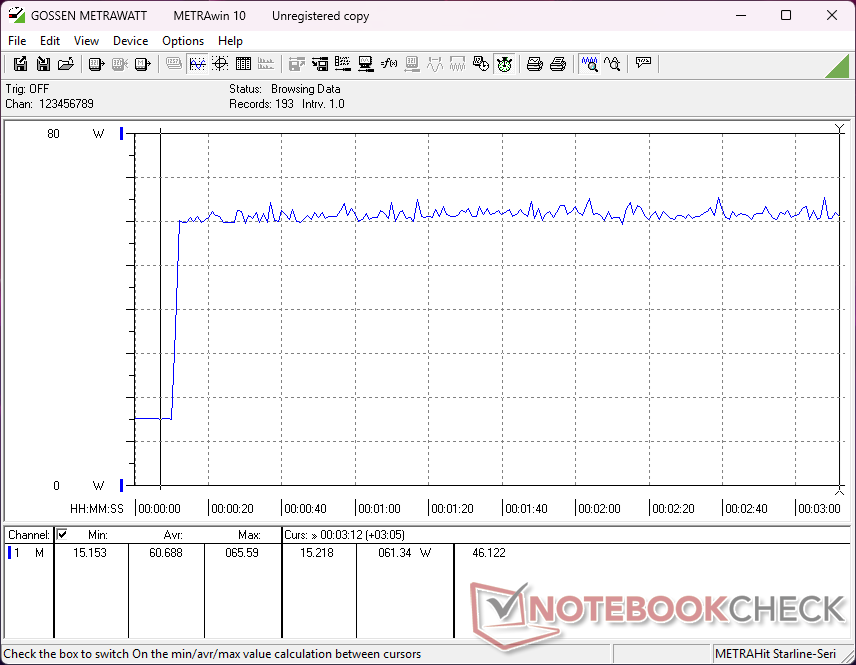
能源管理
耗电量
与 GTi13 Ultra在负载情况下,CPU 的默认最高功耗为 44 W,而后者为 55 W。功耗也低于 BOSGAME M4的功耗也低于 BOSGAME M4,但后者提供了更快的图形性能作为补偿。
| Off / Standby | |
| Idle | |
| Load |
|
Key:
min: | |
| Beelink SEi13 Pro i9-13900HK, Iris Xe G7 96EUs, Crucial P3 Plus CT1000P3PSSD8, , x, | Beelink GTI13 Ultra i9-13900HK, Iris Xe G7 96EUs, Crucial P5 Plus 1TB CT1000P5PSSD8, , x, | Beelink SEi12 Core i5-1235U i5-1235U, Iris Xe G7 80EUs, Kingston NV1 SNVS/500GCN, , x, | HP Z2 Mini G1a Ryzen AI Max+ PRO 395, Radeon 8060S, Samsung PM9A1 MZVL22T0HBLB, , x, | BOSGAME M4 Neo R7 7840HS, Radeon 780M, Kingston OM8PGP41024N-A0, , x, | |
|---|---|---|---|---|---|
| Power Consumption | -31% | -17% | -69% | 1% | |
| Idle Minimum * (Watt) | 14.5 | 15.7 -8% | 15.8 -9% | 7.1 51% | 7.6 48% |
| Idle Average * (Watt) | 14.9 | 16.5 -11% | 16.8 -13% | 9.5 36% | 9.1 39% |
| Idle Maximum * (Watt) | 15.8 | 16.5 -4% | 17 -8% | 13.8 13% | 11.1 30% |
| Load Average * (Watt) | 47.1 | 77.3 -64% | 54.4 -15% | 76.7 -63% | 67.2 -43% |
| Cyberpunk 2077 ultra external monitor * (Watt) | 53.4 | 91.9 -72% | 195.1 -265% | 81.3 -52% | |
| Load Maximum * (Watt) | 85.7 | 106 -24% | 119.1 -39% | 245.4 -186% | 98.4 -15% |
| Witcher 3 ultra * (Watt) | 50.7 |
* ... smaller is better
Power Consumption Cyberpunk / Stress Test
Power Consumption external Monitor
笔记本检查评级
Beelink SEi13 Pro
- 08/01/2025 v8
Allen Ngo
 Total Sustainability Score:
 潜在竞争对手比较
Transparency
The selection of devices to be reviewed is made by our editorial team. The test sample was provided to the author as a loan by the manufacturer or retailer for the purpose of this review. The lender had no influence on this review, nor did the manufacturer receive a copy of this review before publication. There was no obligation to publish this review. As an independent media company, Notebookcheck is not subjected to the authority of manufacturers, retailers or publishers.
This is how Notebookcheck is testing
Every year, Notebookcheck independently reviews hundreds of laptops and smartphones using standardized procedures to ensure that all results are comparable. We have continuously developed our test methods for around 20 years and set industry standards in the process. In our test labs, high-quality measuring equipment is utilized by experienced technicians and editors. These tests involve a multi-stage validation process. Our complex rating system is based on hundreds of well-founded measurements and benchmarks, which maintains objectivity. Further information on our test methods can be found here.

