


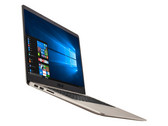
华硕 VivoBook S15 S510UQ (i5-7200U, 940MX) 笔记本电脑简短评测
完成待续。华硕的这台多媒体办公笔记本,强调其设计的优雅和外壳的轻巧。但很难凭借GeForce 940MX,在游戏领域跟上大部队。尽管它有很多不错的特质,但是我们还是不建议购买该机。当然不仅仅是因为它的电池续航能力很平庸。
Intel Core i5-7200U, NVIDIA GeForce 940MX, 15.6", 1.7 kg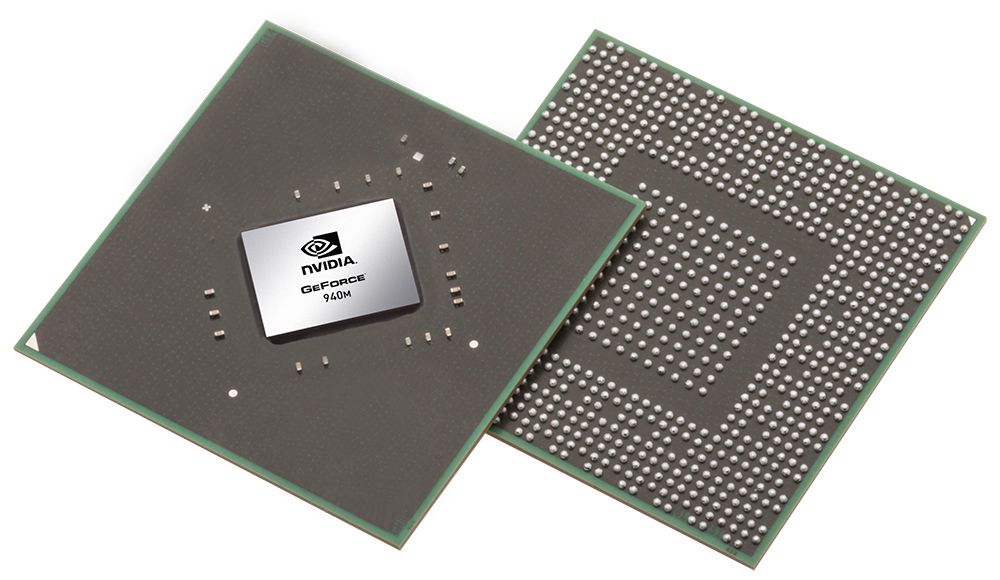
英伟达GeForce 940MX是一款支持DirectX 12(FL 11_0)的中端笔记本电脑显卡。它在2016年第一季度已经发布,是GeForce 940M的更新。相比前代型号,它也是基于同一芯片,但支持更快的GDDR5显存。因此,它类似于微软Surface Book中的麦克斯韦尔显卡,同时搭配更大容量显存和更高频率。然而,大多数笔记本电脑厂商将采用940MX较慢的DDR3版本。
940MX的GDDR5版本似乎有还采用GM107-B芯片,搭配512个着色器而不是384个,但运行于较低的时钟频率的型号。Acer Aspire E5-774G采用的940MX提供了512个着色器(GM107),主频为795 - 861 MHz。然而戴尔Inspiron 17 7778的版本提供了384个着色器,基于GM108芯片,主频在1098至1883MHz之间。
它的性能在很大程度上取决于所使用的显存和芯片。根据我们的基准测试结果(见本页面下方),DDR3版本的性能和之前的940M非常相似(由于只有略微的提高的时钟速率)。然而,GDDR5版本的性能提高了20%(甚至30%,如果搭配快速的桌面四核处理器,不过我们缺少940M在相应配置下的分数)。因此,2015年的高要求游戏应该可以在低设置和WXGA分辨率下运行。
这款显卡的TDP在15至30瓦之间(根据版本,频率和显存不同而不同)。因此,它最适合于13英寸或更大的笔记本电脑。
GeForce 900M Series
| ||||||||||||||||||||||||||||
| Codename | N16S-GTR-B/S | |||||||||||||||||||||||||||
| Architecture | Maxwell | |||||||||||||||||||||||||||
| Pipelines | 384 - unified | |||||||||||||||||||||||||||
| TMUs | 42 | |||||||||||||||||||||||||||
| ROPs | 16 | |||||||||||||||||||||||||||
| Core Speed | 1122 - 1242 (Boost) MHz | |||||||||||||||||||||||||||
| Memory Speed | 4000 effective = 1253 MHz | |||||||||||||||||||||||||||
| Memory Bus Width | 64 Bit | |||||||||||||||||||||||||||
| Memory Type | DDR3, GDDR5 | |||||||||||||||||||||||||||
| Max. Amount of Memory | 4 GB | |||||||||||||||||||||||||||
| Shared Memory | no | |||||||||||||||||||||||||||
| Memory Bandwidth | 40.1 GB/s | |||||||||||||||||||||||||||
| API | DirectX 12 (FL 11_0), Shader 5.0, OpenGL 4.5 | |||||||||||||||||||||||||||
| Power Consumption | 15-25 Watt | |||||||||||||||||||||||||||
| Transistor Count | 1.9 Billion | |||||||||||||||||||||||||||
| Man. Technology | 28 nm | |||||||||||||||||||||||||||
| PCIe | 3.0 | |||||||||||||||||||||||||||
| Features | GPU Boost 2.0, Optimus, PhysX, CUDA, GeForce Experience, GameWorks | |||||||||||||||||||||||||||
| Notebook Size | medium sized | |||||||||||||||||||||||||||
| Date of Announcement | 10.03.2016 | |||||||||||||||||||||||||||
| Link to Manufacturer Page | www.geforce.com | |||||||||||||||||||||||||||
The following benchmarks stem from our benchmarks of review laptops. The performance depends on the used graphics memory, clock rate, processor, system settings, drivers, and operating systems. So the results don't have to be representative for all laptops with this GPU. For detailed information on the benchmark results, click on the fps number.


For more games that might be playable and a list of all games and graphics cards visit our Gaming List
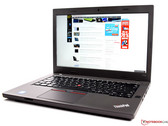
Lenovo ThinkPad T570-20HAS01E00: Intel Core i7-7500U, 15.60", 2 kg
Review » 联想 ThinkPad T570 (Core i7, 4K, 940MX) 笔记本简短评测
Acer TravelMate P658-G2-MG-7327: Intel Core i7-7500U, 15.60", 2.1 kg
Review » 宏碁 TravelMate P658-G2 (7500U, 940MX, 全高清) 笔记本电脑简短评测
Asus AsusPro P4540UQ-FY0056R: Intel Core i5-7200U, 15.60", 2.4 kg
Review » 华硕 ASUSPRO P4540UQ (7200U, 940MX, 全高清) 笔记本电脑简短评测
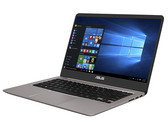
Asus UX310UQ-FC396T: Intel Core i7-7500U, 13.30", 1.5 kg
Review » 华硕 ZenBook UX310UQ (7500U, 940MX, Full HD) 笔记本简短评测
Asus Vivobook F556UQ-XO626D: Intel Core i5-6198DU, 15.60", 2.3 kg
Review » 华硕 Vivobook F556UQ-XO626D 笔记本电脑简短评测
HP Spectre x360 15-bl002xx: Intel Core i7-7500U, 15.60", 2 kg
Review » 惠普 Spectre x360 15-bl002xx 变形本简短评测
Lenovo IdeaPad 710S Plus-13IKB: Intel Core i7-7500U, 13.30", 1.1 kg
Review » 联想 IdeaPad 710S Plus (酷睿 i7) 亚笔记本电脑简短评测
MSI CX62 7QL: Intel Core i5-7200U, 15.60", 2.2 kg
Review » 微星 CX62 7QL 笔记本电脑简短评测
Lenovo ThinkPad E470-20H2S00400: Intel Core i5-7200U, 14.00", 1.9 kg
Review » 联想 ThinkPad E470 (Core i5, GeForce 940MX) 笔记本电脑简短评测
Acer TravelMate P259-MG-71UU: Intel Core i7-6500U, 15.60", 2.3 kg
Review » 宏碁 TravelMate P259-MG-71UU 笔记本电脑简单评测
HP Pavilion 15t-au100 CTO (W0P31AV): Intel Core i7-7500U, 15.60", 2.1 kg
Review » 惠普 Pavilion 15t-au100 (W0P31AV) 笔记本电脑简短评测
Asus Zenbook UX310UQ-GL011T: Intel Core i7-6500U, 13.30", 1.5 kg
Review » 华硕 Zenbook UX310UQ-GL011T 笔记本电脑简短评测
MSI CX72-7QLi581: Intel Core i5-7200U, 17.30", 2.8 kg
Review » 微星 CX72-7QLi581 笔记本电脑简短评测
Lenovo IdeaPad 510-15IKB 80SV0087GE: Intel Core i7-7500U, 15.60", 2.2 kg
Review » 联想 IdeaPad 510-15IKB 笔记本电脑简短评测
Xiaomi Mi Notebook Air 13.3 2016: Intel Core i5-6200U, 13.30", 1.3 kg
Review » 小米 Mi Air (13.3寸) 笔记本电脑简短评测
Lenovo Ideapad 510-15ISK: Intel Core i5-6200U, 15.60", 2.2 kg
Review » 联想 IdeaPad 510-15ISK 笔记本电脑简短评测
Acer Aspire E5-774G-78NA: Intel Core i7-6500U, 17.30", 3 kg
Review » 宏碁 Aspire E5-774G-78NA (GeForce 940MX GDDR5) 笔记本电脑简短评测
Dell Inspiron 17 7778: Intel Core i7-6500U, 17.30", 2.8 kg
Review » 戴尔 Inspiron 17 7778 变形本简短评测
Lenovo Yoga 710-14ISK: Intel Core i5-6200U, 14.00", 1.6 kg
Review » 联想 Yoga 710-14ISK 变形本简短评测
Asus VivoBook X556UQ-XO076T: Intel Core i5-6200U, 15.60", 2.3 kg
Review » 华硕 VivoBook X556UQ-XO076T 笔记本电脑简短评测
Lenovo ThinkPad T460p-20FXS05500: Intel Core i7-6700HQ, 14.00", 1.9 kg
Review » 联想 ThinkPad T460p (Core i7, GeForce 940MX) 笔记本电脑简短评测
HP Pavilion 14-bf013ns: Intel Core i7-7500U, 14.00", 1.5 kg
External Review » HP Pavilion 14-bf013ns
Dell Inspiron 15 7570-0CH38: Intel Core i5-8250U, 15.60", 2 kg
External Review » Dell Inspiron 15 7570-0CH38
HP Pavilion 14-bf105ns: Intel Core i5-8250U, 14.00", 1.6 kg
External Review » HP Pavilion 14-bf105ns
HP Pavilion 15-ck007ns: Intel Core i7-8550U, 15.60", 1.9 kg
External Review » HP Pavilion 15-ck007ns
Asus Vivobook 17 A705UQ-BX109T: Intel Core i5-8250U, 17.30", 2.1 kg
External Review » Asus Vivobook 17 A705UQ-BX109T
Lenovo Ideapad 320-15IKB-80XL03L4SP: Intel Core i3-7130U, 15.60", 2.2 kg
External Review » Lenovo Ideapad 320-15IKB-80XL03L4SP
Asus VivoBook S15 S510UQ-BQ702T: Intel Core i7-8550U, 15.60", 1.7 kg
External Review » Asus VivoBook S15 S510UQ-BQ702T
HP Pavilion 14-bf108ns: Intel Core i7-8550U, 14.00", 1.5 kg
External Review » HP Pavilion 14-bf108ns
Lenovo Yoga 520-14IKB-80X8006KSP: Intel Core i5-7200U, 14.00", 1.8 kg
External Review » Lenovo Yoga 520-14IKB-80X8006KSP
HP Pavilion 14-bf014ns: Intel Core i7-7500U, 14.00", 1.5 kg
External Review » HP Pavilion 14-bf014ns
Lenovo Yoga 520-14IKB-80X8006LSP: Intel Core i3-7100U, 14.00", 1.8 kg
External Review » Lenovo Yoga 520-14IKB-80X8006LSP
HP Pavilion 15-cc504ur: Intel Core i5-7200U, 15.60", 1.9 kg
External Review » HP Pavilion 15-cc504ur
HP Pavilion 15-ck015ns: Intel Core i5-8250U, 15.60", 1.8 kg
External Review » HP Pavilion 15-ck015ns
Lenovo Ideapad 520-15IKB-80YL00MNSP: Intel Core i7-7500U, 15.60", 2.2 kg
External Review » Lenovo Ideapad 520-15IKB-80YL00MNSP
Asus X756UQ-TY355T: Intel Core i5-7200U, 17.30", 2.7 kg
External Review » Asus X756UQ-TY355T
Asus VivoBook S15 S510UQ-BQ178T: Intel Core i5-7200U, 15.60", 1.7 kg
External Review » Asus VivoBook S15 S510UQ-BQ178T
Lenovo IdeaPad 320-15IKB 80XL01NEGE: Intel Core i5-7200U, 15.60", 2.2 kg
External Review » Lenovo IdeaPad 320-15IKB 80XL01NEGE
Lenovo Ideapad 520-15IKB-80YL00MMSP: Intel Core i5-7200U, 15.60", 2.2 kg
External Review » Lenovo Ideapad 520-15IKB-80YL00MMSP
Lenovo Ideapad 320-15IKBN-80XL02U2SP: Intel Core i7-7500U, 15.60", 2.2 kg
External Review » Lenovo Ideapad 320-15IKBN-80XL02U2SP
Asus A442UQ-FA020T : Intel Core i7-7500U, 14.00", 1.8 kg
External Review » Asus A442UQ-FA020T
Acer Aspire E5-576G-36WC: Intel Core i3-7130U, 15.60", 2.1 kg
External Review » Acer Aspire E5-576G-36WC
HP Pavilion 14-ba140ns x360: Intel Core i7-8550U, 14.00", 1.6 kg
External Review » HP Pavilion 14-ba140ns x360
Lenovo Yoga 3-14-80JH00QYSP: Intel Core i3-5005U, 14.00", 1.6 kg
External Review » Lenovo Yoga 3-14-80JH00QYSP
Acer Aspire 5 A515-51G-51LK: Intel Core i5-7200U, 15.60", 2.2 kg
External Review » Acer Aspire 5 A515-51G-51LK
Medion Akoya P7645-30022215: Intel Core i5-7200U, 17.30", 2.7 kg
External Review » Medion Akoya P7645-30022215
Lenovo ThinkPad T560-20FH002RGE: Intel Core i7-6600U, 15.60", 2.3 kg
External Review » Lenovo ThinkPad T560-20FH002RGE
HP Pavilion 14-bf106ns: Intel Core i5-8250U, 14.00", 1.6 kg
External Review » HP Pavilion 14-bf106ns
Dell Vostro 15 5568-V4F8F: Intel Core i7-7500U, 15.60", 2 kg
External Review » Dell Vostro 15 5568-V4F8F
Asus UX410UQ-GV045R: Intel Core i7-7500U, 14.00", 1.4 kg
External Review » Asus UX410UQ-GV045R
Acer Aspire 5 A515-51G-35NN: Intel Core i3-6006U, 15.60", 2.2 kg
External Review » Acer Aspire 5 A515-51G-35NN
HP Pavilion 14-ba139ns x360: Intel Core i5-8250U, 14.00", 1.6 kg
External Review » HP Pavilion 14-ba139ns x360
Asus VivoBook Flip 15 TP510UQ-E8033T: Intel Core i5-8250U, 15.60", 1.9 kg
External Review » Asus VivoBook Flip 15 TP510UQ-E8033T
HP Pavilion 15-cc108ng: Intel Core i7-8550U, 15.60", 1.8 kg
External Review » HP Pavilion 15-cc108ng
Asus X542UQ-DM284: Intel Core i5-7200U, 15.60", 2.2 kg
External Review » Asus X542UQ-DM284
Lenovo IdeaPad 520s-14IKB 80X200C1GE: Intel Core i5-7200U, 14.00", 1.6 kg
External Review » Lenovo IdeaPad 520s-14IKB 80X200C1GE
Asus VivoBook X510UQ-BR594T: Intel Core i5-8250U, 15.60", 1.7 kg
External Review » Asus VivoBook X510UQ-BR594T
HP Pavilion 15-au120tx: Intel Core i5-7200U, 15.60", 2 kg
External Review » HP Pavilion 15-au120tx
Asus X542UQ: Intel Core i3-7100U, 15.60", 2.2 kg
External Review » Asus X542UQ
Lenovo IdeaPad 520s-14IKB-80X2002VCK: Intel Core i7-7500U, 14.00", 1.7 kg
External Review » Lenovo IdeaPad 520s-14IKB-80X2002VCK
HP Pavilion 15-cc509nh: Intel Core i5-7200U, 15.60", 1.9 kg
External Review » HP Pavilion 15-cc509nh
HP Pavilion 14-ba009ne x360: Intel Core i5-7200U, 14.00", 1.7 kg
External Review » HP Pavilion 14-ba009ne x360
Lenovo IdeaPad Flex 5 1570-80XB0000US: Intel Core i7-7500U, 15.60", 2 kg
External Review » Lenovo Flex 5 1570-80XB0000US
Lenovo IdeaPad 320-15IKB-80XL03AUIN: Intel Core i5-7200U, 15.60", 2.2 kg
External Review » Lenovo IdeaPad 320-15IKB-80XL03AUIN
Dell Latitude 5580-X1W6W: Intel Core i7-7820HQ, 15.60", 2.2 kg
External Review » Dell Latitude 5580-X1W6W
HP Pavilion 14-bf104ns: Intel Core i5-8250U, 14.00", 1.5 kg
External Review » HP Pavilion 14-bf104ns
Asus VivoBook S510UQ-BQ323T: Intel Core i5-7200U, 15.60", 1.7 kg
External Review » Asus VivoBook S510UQ-BQ323T
HP Envy x360 15-bp008ng: Intel Core i7-7500U, 15.60", 2.2 kg
External Review » HP Envy x360 15-bp008ng
HP Pavilion 15-cc508ns: Intel Core i5-7200U, 15.60", 1.9 kg
External Review » HP Pavilion 15-cc508ns
Acer Aspire E5-575G-56X9: Intel Core i5-7200U, 15.60", 2.2 kg
External Review » Acer Aspire E5-575G-56X9
HP Pavilion 15-ck001ns: Intel Core i5-8250U, 15.60", 1.8 kg
External Review » HP Pavilion 15-ck001ns
Acer Aspire F5 573G-71S6: Intel Core i7-7500U, 15.60", 2.3 kg
External Review » Acer Aspire F5 573G-71S6
Asus VivoBook S510UQ-BQ322T: Intel Core i5-7200U, 15.60", 1.6 kg
External Review » Asus VivoBook S510UQ-BQ322T
HP Pavilion 14-bf009ns: Intel Core i5-7200U, 14.00", 1.5 kg
External Review » HP Pavilion 14-bf009ns
HP Pavilion 14-Bf009Ur: Intel Core i7-7500U, 14.00", 1.6 kg
External Review » HP Pavilion 14-Bf009Ur
Asus K556UQ-XO431T: Intel Core i5-6200U, 15.60", 2.4 kg
External Review » Asus K556UQ-XO431T
Acer Aspire E5-575G-55XS: Intel Core i5-7200U, 15.60", 2.2 kg
External Review » Acer Aspire E5-575G-55XS
Dell Inspiron 15 7570: Intel Core i7-8550U, 15.60", 2 kg
External Review » Dell Inspiron 15-7570
Acer Aspire 5 A515-51G-54T5: Intel Core i5-7200U, 15.60", 2.2 kg
External Review » Acer Aspire 5 A515-51G-54T5
Lenovo Ideapad 320-15IKBN-80XL02U4SP: Intel Core i5-7200U, 15.60", 2.2 kg
External Review » Lenovo Ideapad 320-15IKBN-80XL02U4SP
Asus Vivobook S15 S510UQ-BQ189T: Intel Core i5-7200U, 15.60", 1.7 kg
External Review » Asus Vivobook S15 S510UQ-BQ189T
Lenovo ThinkPad 25: Intel Core i7-7500U, 14.00", 1.7 kg
External Review » Lenovo ThinkPad 25
HP Pavilion 14-BF007NS: Intel Core i7-7500U, 14.00", 1.6 kg
External Review » HP Pavilion 14-BF007NS
HP Pavilion 15-cc509ns: Intel Core i5-7200U, 15.60", 1.8 kg
External Review » HP Pavilion 15-cc509ns
Lenovo IdeaPad 320-15IKB-80XL0053RK: Intel Core i5-7200U, 15.60", 2 kg
External Review » Lenovo IdeaPad 320-15IKB-80XL0053RK
Lenovo Yoga 520-14-80X8001URK: Intel Core i3-7100U, 14.00", 1.7 kg
External Review » Lenovo Yoga 520-14-80X8001URK
Lenovo IdeaPad Flex 5 14-80XA0009US: Intel Core i7-7500U, 14.00", 1.7 kg
External Review » Lenovo Flex 5 14-80XA0009US
HP Pavilion x360 14-ba073TX: Intel Core i5-7200U, 14.00", 1.6 kg
External Review » HP Pavilion x360 14-ba073TX
Acer Aspire E5-575G-36VF: Intel Core i3-6006U, 15.60", 2.4 kg
External Review » Acer Aspire E5-575G-36VF
Samsung Notebook 7 Spin NP740U5L-Y03US: Intel Core i7-6500U, 15.60", 1.8 kg
External Review » Samsung Notebook 7 Spin NP740U5L-Y03US
Lenovo IdeaPad 720S-80XC004NGE: Intel Core i7-7500U, 14.00", 1.6 kg
External Review » Lenovo IdeaPad 720S-80XC004NGE
Lenovo IdeaPad 720S-80XC003RGE: Intel Core i5-7200U, 14.00", 1.6 kg
External Review » Lenovo IdeaPad 720S-80XC003RGE
Acer Aspire 5 A515-51G-52R1: Intel Core i5-7200U, 15.60", 2.1 kg
External Review » Acer Aspire 5 A515-51G-52R1
Asus UX310UQ-FC396T: Intel Core i7-7500U, 13.30", 1.5 kg
External Review » Asus UX310UQ-FC396T
Lenovo IdeaPad Flex 5 15-80XB0014US: Intel Core i7-7500U, 15.60", 2 kg
External Review » Lenovo Flex 5 15-80XB0014US
Acer Aspire 5 A515-51G-58AM: Intel Core i5-7200U, 15.60", 2.1 kg
External Review » Acer Aspire 5 A515-51G-58AM
HP Envy 15-bp030nd x360: Intel Core i7-7500U, 15.60", 2.2 kg
External Review » HP Envy 15-bp030nd x360
HP Pavilion 15-cc593nd: Intel Core i5-7200U, 15.60", 1.9 kg
External Review » HP Pavilion 15-cc593nd
HP Pavilion x360 14-ba043nd: Intel Core i7-7500U, 14.00", 1.6 kg
External Review » HP Pavilion x360 14-ba043nd
Asus UX410UQ-GV109T: Intel Core i7-7500U, 14.00", 1.5 kg
External Review » Asus UX410UQ-GV109T
Asus VivoBook S15 S510UQ-BQ165T: Intel Core i7-7500U, 15.60", 2 kg
External Review » Asus VivoBook S15 S510UQ-BQ165T
HP Pavilion x360 14-ba028ns: Intel Core i5-7200U, 14.00", 1.6 kg
External Review » HP Pavilion x360 14-ba028ns
HP Pavilion 15-au111nt: Intel Core i5-7200U, 15.60", 2 kg
External Review » HP Pavilion 15-au111nt
Acer Aspire E5-575G-73CN: Intel Core i7-7500U, 15.60", 2.2 kg
External Review » Acer Aspire E5-575G-73CN
Asus Vivobook S15 S510UQ-BR180T: Intel Core i7-7500U, 15.60", 1.7 kg
External Review » Asus Vivobook S15 S510UQ-BR180T
Asus Vivobook S15 S510UQ-BQ182T: Intel Core i7-7500U, 15.60", 1.7 kg
External Review » Asus Vivobook S15 S510UQ-BQ182T
HP Pavilion 14-bf015ns: Intel Core i7-7500U, 14.00", 1.5 kg
External Review » HP Pavilion 14-bf015ns
Lenovo ThinkPad T470p-20J60018MH: Intel Core i7-7700HQ, 14.00", 2 kg
External Review » Lenovo ThinkPad T470p-20J60018MH
Acer Aspire E5-575G-57D4: Intel Core i5-7200U, 15.60", 2.4 kg
External Review » Acer Aspire E5-575G-57D4
MSI CX72 6QD-080XES: Intel Core i7-6700HQ, 17.30", 2.8 kg
External Review » MSI CX72 6QD-080XES
HP Pavilion 14-ba028n x360: Intel Core i5-7200U, 14.00", 1.6 kg
External Review » HP Pavilion 14-ba028n x360
Acer Aspire E5-575G-50AL: Intel Core i5-7200U, 15.60", 2.4 kg
External Review » Acer Aspire E5-575G-50AL
Lenovo Ideapad 510-15IKB-80SV00QVGE: Intel Core i7-7500U, 15.60", 2.2 kg
External Review » Lenovo Ideapad 510-15IKB-80SV00QVGE
Asus Zenbook U5100UQ: Intel Core i7-7500U, 15.60", 1.6 kg
External Review » Asus Zenbook U5100UQ
Asus Zenbook U4100UQ: Intel Core i7-7500U, 14.00", 1.3 kg
External Review » Asus Zenbook U4100UQ
Medion Akoya P6677-MD60283: Intel Core i7-7500U, 15.60", 2.3 kg
External Review » Medion Akoya P6677-MD60283
HP Spectre x360 15-bl001ng: Intel Core i7-7500U, 15.60", 2 kg
External Review » HP Spectre x360 15-bl001ng
Acer Aspire F15 F5-573G-7420: Intel Core i7-7500U, 15.60", 2.3 kg
External Review » Acer Aspire F15 F5-573G-7420
Asus ZenBook UX430UQ-PURE4: Intel Core i7-7500U, 14.00", 1.3 kg
External Review » Asus ZenBook UX430UQ-PURE4
Asus ZenBook Flip UX560UQ 2017: Intel Core i7-7500U, 15.60", 2.3 kg
External Review » Asus ZenBook Flip UX560UQ 2017
Huawei MateBook D 15, i7-7500U 940MX: Intel Core i7-7500U, 15.60", 1.8 kg
External Review » Huawei MateBook D
Acer Aspire E5-575G-598W: Intel Core i5-7200U, 15.60", 2.4 kg
External Review » Acer Aspire E5-575G-598W
Lenovo ThinkPad E470-20H2S00400: Intel Core i5-7200U, 14.00", 1.9 kg
External Review » Lenovo ThinkPad E470-20H2S00400
Lenovo Ideapad 510-15ISK: Intel Core i5-6200U, 15.60", 2.2 kg
External Review » Lenovo Ideapad 510-15ISK
Acer Aspire E5-575G-51WV: Intel Core i5-7200U, 15.60", 2.4 kg
External Review » Acer Aspire E5-575G-51WV
Samsung Notebook 9 NP900X5N-X01US: Intel Core i7-7500U, 15.00", 1.2 kg
External Review » Samsung Notebook 9 NP900X5N-X01US
Asus X550VQ-0021B: Intel Core i5-6300HQ, 15.60", 2.5 kg
External Review » Asus X550VQ-0021B
Lenovo IdeaPad 710S Plus-13IKB: Intel Core i7-7500U, 13.30", 1.1 kg
External Review » Lenovo IdeaPad 710S Plus-13IKB
Dell Inspiron 17-7779: Intel Core i7-7500U, 17.30", 2.8 kg
External Review » Dell Inspiron 17-7779
Asus Zenbook UX310UQ-FC275T: Intel Core i5-7200U, 13.30", 1.5 kg
External Review » Asus Zenbook UX310UQ-FC275T
Lenovo Yoga 710-14 80TY002QTX: Intel Core i7-6500U, 14.00", 1.6 kg
External Review » Lenovo Yoga 710-14 80TY002QTX
Lenovo Ideapad 510-15ISK 80SR00AVSP: Intel Core i5-6200U, 15.60", 2.1 kg
External Review » Lenovo Ideapad 510-15ISK 80SR00AVSP
HP Pavilion 15-au100ns: Intel Core i5-7200U, 15.60", 2 kg
External Review » HP Pavilion 15-au100ns
Acer Aspire F5-771G-31JJ: Intel Core i3-7100U, 17.30", 2.9 kg
External Review » Acer Aspire F5-771G-31JJ
Asus UX410UQ-GV034T: Intel Core i7-7500U, 14.00", 1.2 kg
External Review » Asus UX410UQ-GV034T
MSI CX62 7QL-047XES: Intel Core i7-7500U, 15.60", 2.3 kg
External Review » MSI CX62 7QL-047XES
Acer Aspire E5-575G-56X: Intel Core i5-7200U, 15.60", 2.4 kg
External Review » Acer Aspire E5-575G-56X
Acer Aspire F15 F5-573G-77L0: Intel Core i7-6500U, 15.60", 2.3 kg
External Review » Acer Aspire F15 F5-573G-77L0
HP Envy 17-W0Q29AV: Intel Core i7-7500U, 17.30", 3 kg
External Review » HP Envy 17-W0Q29AV
Lenovo Yoga 710-15-80V50000US: Intel Core i5-7200U, 15.60", 1.9 kg
External Review » Lenovo Yoga 710-15-80V50000US
Dell Vostro 14 5468-P75G001: Intel Core i5-7200U, 14.00", 1.6 kg
External Review » Dell Vostro 5468-P75G001
Asus R558UQ-DM539D: Intel Core i5-7200U, 15.60", 2.1 kg
External Review » Asus R558UQ-DM539D
Lenovo Yoga 520-14IKB 80X80097GE: Intel Core i5-7200U, 14.10", 1.8 kg
External Review » Lenovo Yoga 520-14IKB
HP Spectre x360 15-bl002xx: Intel Core i7-7500U, 15.60", 2 kg
External Review » HP Spectre x360 15-bl002xx
HP Spectre x360 15-bl020nd: Intel Core i7-7500U, 15.60", 2 kg
External Review » HP Spectre x360 15-bl020nd
Dell Inspiron 14 7460: Intel Core i5-7200U, 14.00", 1.7 kg
External Review » Dell Inspiron 14 7460
Acer Aspire E5-575G-51PV: Intel Core i5-7200U, 15.60", 2.4 kg
External Review » Acer Aspire E5-575G-51PV
Asus ZenBook UX3410UQ-GV077T: Intel Core i7-7500U, 14.00", 1.4 kg
External Review » Asus ZenBook UX3410UQ-GV077T
Lenovo Ideapad 510-15IKB-80SV00G3GE: Intel Core i5-7200U, 15.60", 2.2 kg
External Review » Lenovo Ideapad 510-15IKB-80SV00G3GE
Acer TravelMate P259-MG-549Q: Intel Core i5-6200U, 15.60", 2.4 kg
External Review » Acer TravelMate P259-MG-549Q
Asus VivoBook Flip TP501UQ-CJ012T: Intel Core i5-6200U, 15.60", 2.2 kg
External Review » Asus VivoBook Flip TP501UQ-CJ012T
Lenovo Yoga 710-14IKB-80V4002VGE: Intel Core i7-7500U, 14.00", 1.6 kg
External Review » Lenovo Yoga 710-14IKB-80V4002VGE
Asus Zenbook UX310UQ-GL011T: Intel Core i7-6500U, 13.30", 1.5 kg
External Review » Asus Zenbook UX310UQ-GL011T
Asus A456UQ-FA073D: Intel Core i7-7500U, 14.00", 2.3 kg
External Review » Asus A456UQ-FA073D
Lenovo Yoga 710-14IKB-80V40031SP: Intel Core i7-7500U, 14.00", 1.6 kg
External Review » Lenovo Yoga 710-14IKB-80V40031SP
Acer Aspire E5-575G-71UK: Intel Core i7-6500U, 15.60", 2.2 kg
External Review » Acer Aspire E5-575G-71UK
Asus Zenbook Flip UX560UQ-FZ018R: Intel Core i5-6200U, 15.60", 2.3 kg
External Review » Asus Zenbook Flip UX560UQ-FZ018R
Acer Aspire F15 F5-573G-52PJ: Intel Core i5-7200U, 15.60", 2.3 kg
External Review » Acer Aspire F15 F5-573G-52PJ
Acer Aspire F5-573G-52PJ: Intel Core i5-7200U, 15.60", 2.3 kg
External Review » Acer Aspire F5-573G-52PJ
Acer Aspire E5-774G-59PC: Intel Core i5-6200U, 17.30", 3.3 kg
External Review » Acer Aspire E5-774G-59PC
Dell Inspiron 15 7560, Core i7: Intel Core i7-7500U, 15.60", 2 kg
External Review » Dell Inspiron 15-7560, Core i7
Asus K501UQ-DM032T: Intel Core i7-6500U, 15.60", 2 kg
External Review » Asus K501UQ-DM032T
HP Pavilion 14-AL107NT: Intel Core i5-7200U, 14.00", 1.5 kg
External Review » HP Pavilion 14-AL107NT
HP Pavilion 15-X9Z69EA: Intel Core i5-6200U, 15.60", 2.4 kg
External Review » HP Pavilion 15-X9Z69EA
Dell Vostro 5468-N010VN5468EMEA01: Intel Core i7-7500U, 14.00", 1.6 kg
External Review » Dell Vostro 5468-N010VN5468EMEA01
Asus K501UQ: Intel Core i5-6200U, 15.60", 2 kg
External Review » Asus K501UQ
HP Pavilion 14-al104ng: Intel Core i5-7200U, 14.10", 1.5 kg
External Review » HP Pavilion 14-al104ng
Acer Aspire F15 F5-573G-748R: Intel Core i7-6500U, 15.60", 2.3 kg
External Review » Acer Aspire F15 F5-573G-748R
Acer Aspire F15 F5-573G-75UZ: Intel Core i7-6500U, 15.60", 2.3 kg
External Review » Acer Aspire F15 F5-573G-75UZ
Lenovo Ideapad 510-15ISK-80SR003JGE: Intel Core i7-6500U, 15.60", 2.1 kg
External Review » Lenovo Ideapad 510-15ISK-80SR003JGE
Medion Akoya P6670: Intel Core i5-6200U, 15.60", 2.3 kg
External Review » Medion Akoya P6670
Acer Aspire E5-774G-553R: Intel Core i5-7200U, 17.30", 3 kg
External Review » Acer Aspire E5-774G-553R
Asus Zenbook UX310UQ-GL011T: Intel Core i7-6500U, 13.30", 1.5 kg
External Review » Asus Zenbook UX310UQ-GL011T
Acer Aspire R15 R5-571TG-50RF: Intel Core i5-6200U, 15.60", 2.2 kg
External Review » Acer Aspire R15 R5-571TG-50RF
Xiaomi Mi Notebook Air 13.3 2016: Intel Core i5-6200U, 13.30", 1.3 kg
External Review » Xiaomi Mi Air 13 inch 2016 i5 940MX
Asus VivoBook R558UQ-DM326T: Intel Core i5-6200U, 15.60", 2.3 kg
External Review » Asus VivoBook R558UQ-DM326T
Acer Aspire R15 R5-571TG-765T: Intel Core i7-6500U, 15.60", 2.2 kg
External Review » Acer Aspire R15 R5-571TG-765T
Acer Aspire E5-575G-54TU: Intel Core i5-6200U, 15.60", 2.4 kg
External Review » Acer Aspire E5-575G-54TU
Lenovo Yoga 700-14ISK-80TY000QGE: Intel Core i7-6500U, 14.00", 1.5 kg
External Review » Lenovo Yoga 700-14ISK-80TY000QGE
Dell Inspiron 17-7778-1142: Intel Core i7-6500U, 17.30", 2.8 kg
External Review » Dell Inspiron 17-7778-1142
Lenovo Yoga 710-15ISK-80U00005US: Intel Core i7-6500U, 15.60", 1.9 kg
External Review » Lenovo Yoga 710-15ISK-80U00005US
Asus Q524UQ: Intel Core i7-6500U, 15.60", 2.3 kg
External Review » Asus Q524UQ
Dell Inspiron 17 7778: Intel Core i7-6500U, 17.30", 2.8 kg
External Review » Dell Inspiron 17 7778
Lenovo Yoga 710-14ISK: Intel Core i5-6200U, 14.00", 1.6 kg
External Review » Lenovo Yoga 710-14ISK
Acer Aspire E5-575G-53VG: Intel Core i5-6200U, 15.60", 2.4 kg
External Review » Acer Aspire E5-575G-53VG
Acer Aspire F15 F5-573G-50BM: Intel Core i5-6200U, 15.60", 2.4 kg
External Review » Acer Aspire F15 F5-573G-50BM
MSI GL62-6QC-065UK: Intel Core i5-6300HQ, 15.60", 2.3 kg
External Review » MSI GL62-6QC-065UK
Lenovo ThinkPad T460p-20FXS05500: Intel Core i7-6700HQ, 14.00", 1.9 kg
External Review » Lenovo ThinkPad T460p-20FXS05500
» Comparison of GPUs
Detailed list of all laptop GPUs sorted by class and performance.
» Benchmark List
Sort and restrict laptop GPUs based on performance in synthetic benchmarks.
» Notebook Gaming List
Playable games for each graphics card and their average FPS results.
* Approximate position of the graphics adapter
» Notebookcheck多媒体笔记本电脑Top 10排名
» Notebookcheck游戏笔记本电脑Top 10排名
» Notebookcheck低价办公/商务笔记本电脑Top 10排名
» Notebookcheck高端办公/商务笔记本电脑Top 10排名
» Notebookcheck工作站笔记本电脑Top 10排名
» Notebookcheck亚笔记本电脑Top 10排名
» Notebookcheck超级本产品Top 10排名
» Notebookcheck变形本产品Top 10排名
» Notebookcheck平板电脑Top 10排名
» Notebookcheck智能手机Top 10排名
» Notebookcheck评测过最出色的笔记本电脑屏幕
» Notebookcheck售价500欧元以下笔记本电脑Top 10排名
» Notebookcheck售价300欧元以下笔记本电脑Top 10排名