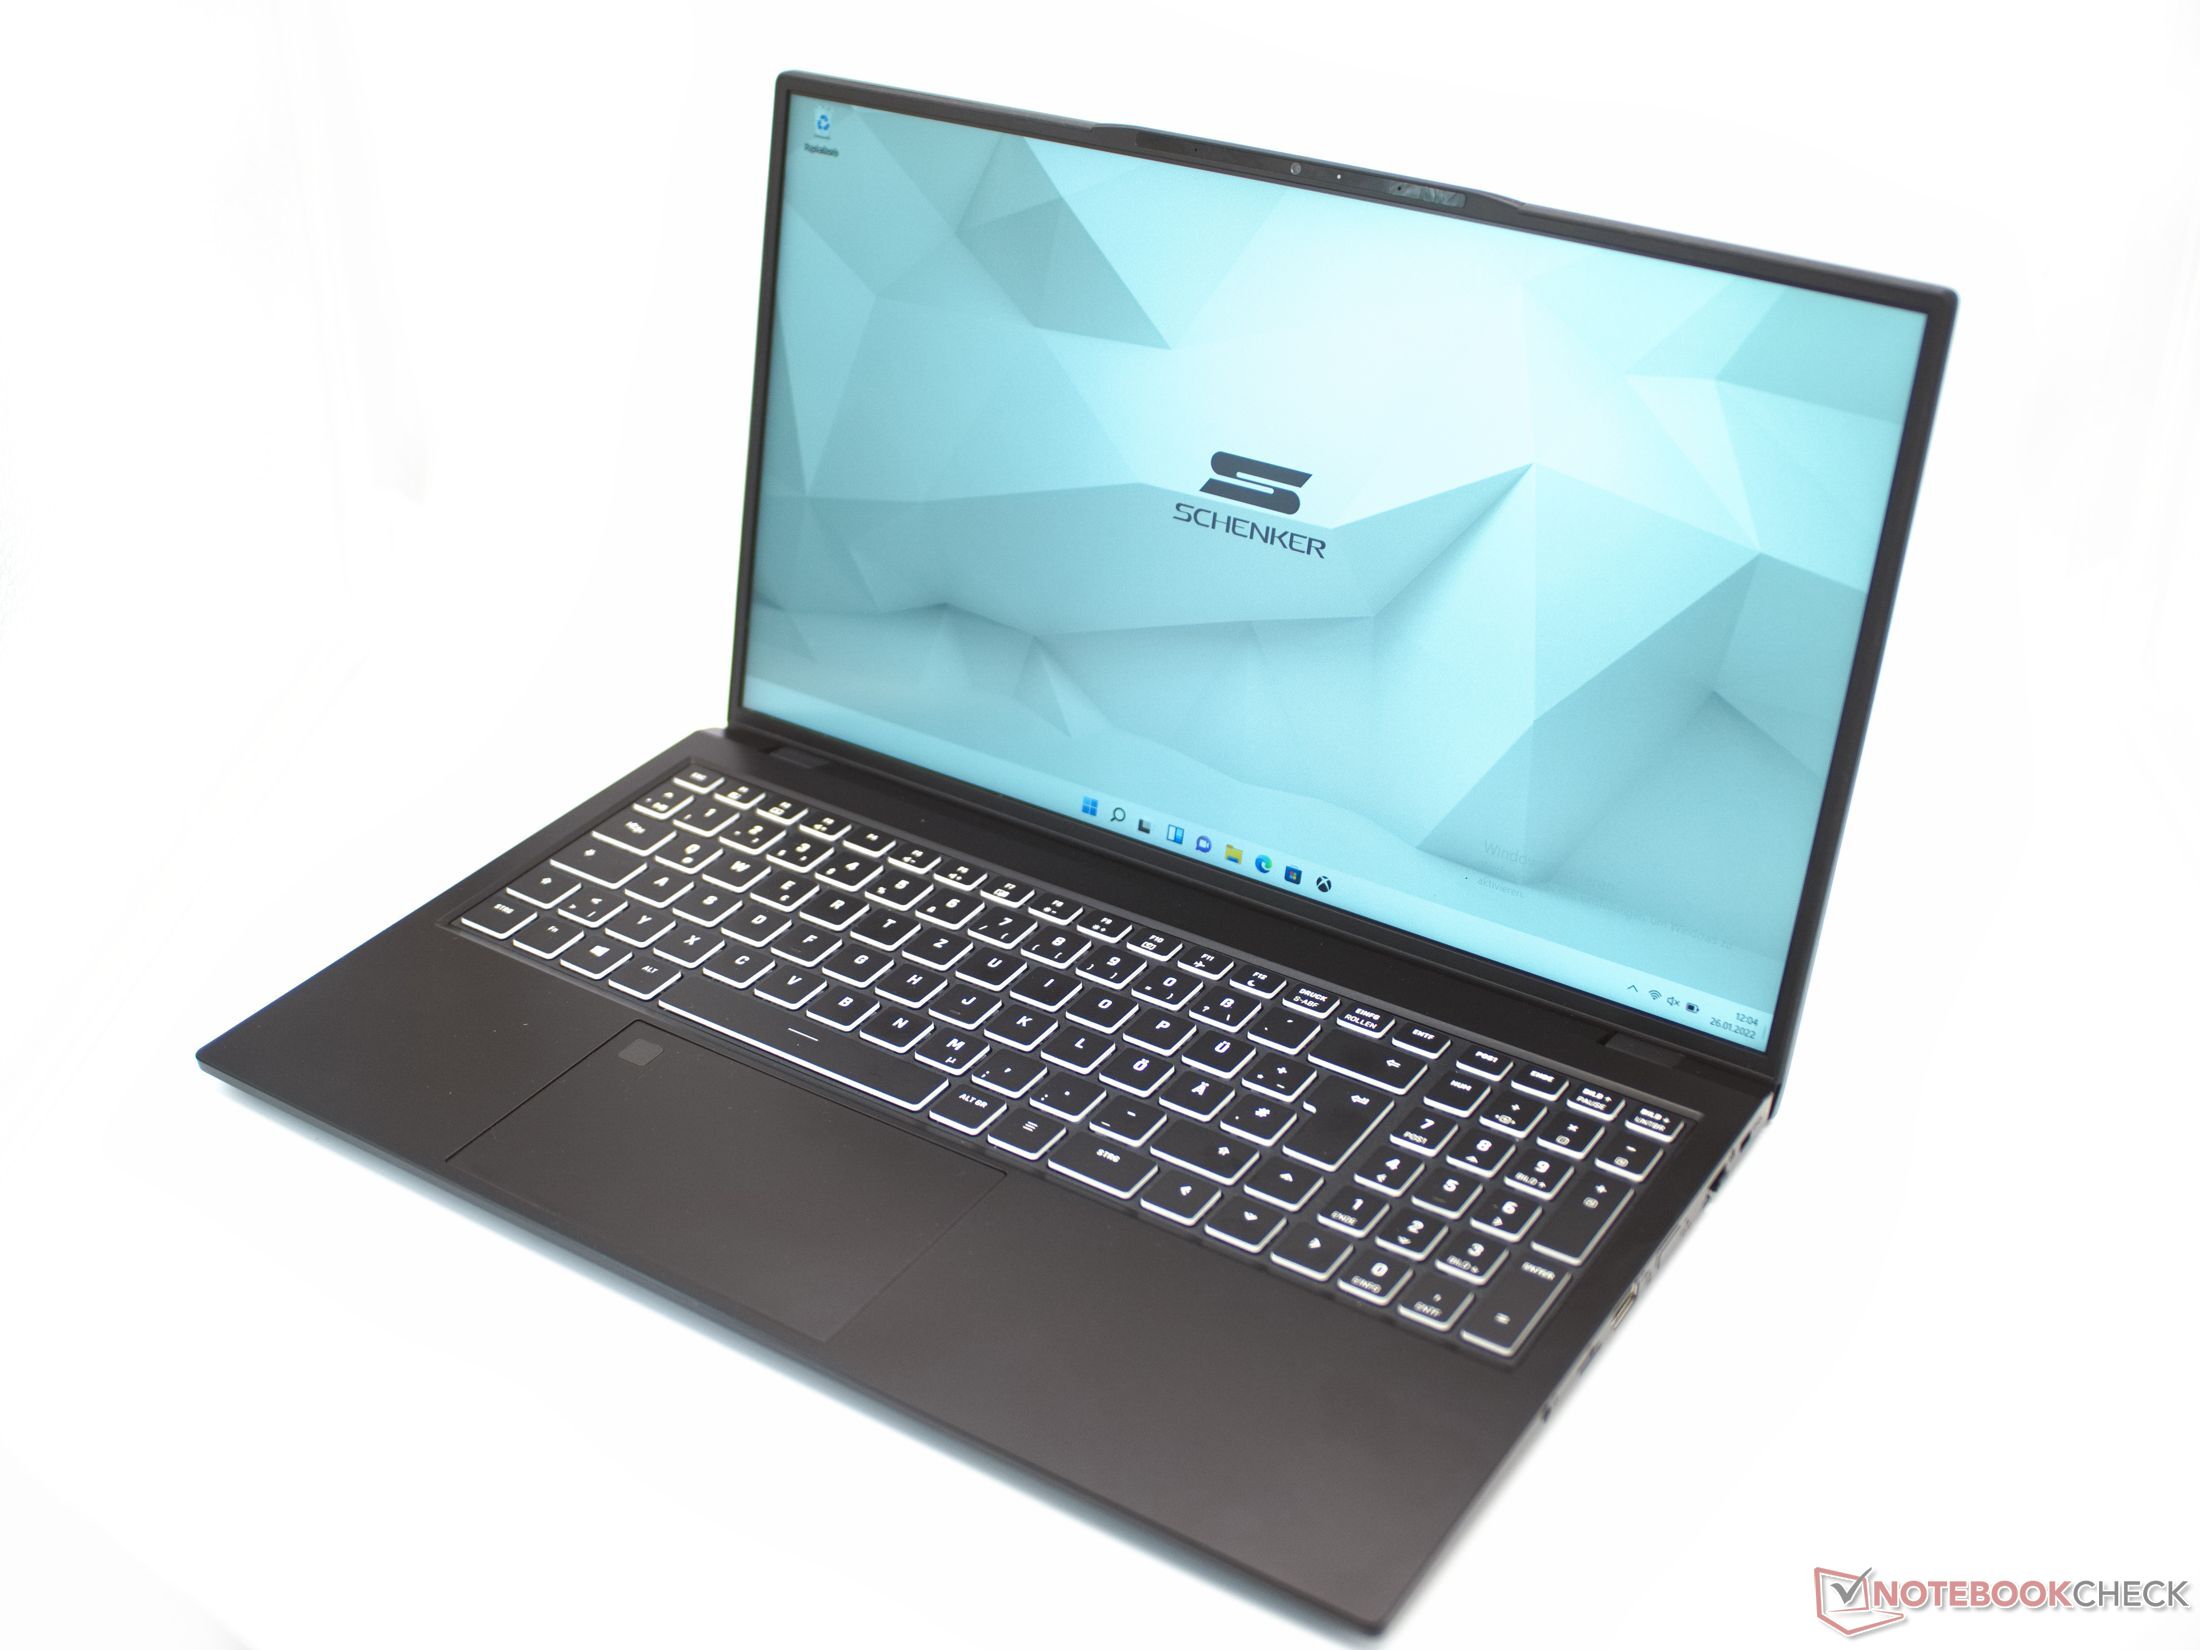
Schenker Work 15Tiger Lake-H 笔记本电脑评论。办公室里的RGB照明
全球国际货运代理公司的工作用笔记本电脑结合了强大的硬件和许多配置选项。因此,该公司的办公笔记本可以很好地适应所需的目的。H系列的英特尔酷睿i5和i7处理器可供选择,并配有高达64GB的工作内存。坚固的外壳,主要由铝制成,使整个画面更加完美。
我们的测试设备有32GB工作内存。 英特尔酷睿i7-11370H和1TB NVMe固态硬盘的价格为1440欧元,没有Windows许可证。通过制造商的网站,最便宜的配置价格约为1000欧元。
作为Work 15的竞争对手,有几款15英寸办公设备可供选择。例如,类似的配置有联想ThinkPad E15和戴尔 Inspiron 15 3501.然而,没有其他办公笔记本电脑拥有RGB照明键盘。
潜在的竞争对手比较
Rating | Date | Model | Weight | Height | Size | Resolution | Price |
|---|---|---|---|---|---|---|---|
| 84.3 % v7 (old) | 02 / 2022 | Schenker Work 15 Tiger Lake-H i7-11370H, Iris Xe G7 96EUs | 1.7 kg | 19.9 mm | 15.60" | 1920x1080 | |
| 84.9 % v7 (old) | 01 / 2022 | LG Gram 15Z90P-G.AA89G i7-1165G7, Iris Xe G7 96EUs | 1.1 kg | 17.4 mm | 15.60" | 1920x1080 | |
| 80.5 % v7 (old) | 10 / 2021 | Dell Inspiron 15 3501 i7-1165G7, Iris Xe G7 96EUs | 2 kg | 19.9 mm | 15.60" | 1920x1080 | |
| 85.5 % v7 (old) | 08 / 2021 | Lenovo ThinkPad E15 G3-20YG003UGE R7 5700U, Vega 8 | 1.8 kg | 18.9 mm | 15.60" | 1920x1080 | |
| 82.1 % v7 (old) | Asus VivoBook S15 D533UA R7 5700U, Vega 8 | 1.8 kg | 16.1 mm | 15.60" | 1920x1080 | ||
| 80.8 % v7 (old) | 12 / 2021 | HP Pavilion x360 15-er0155ng i5-1135G7, Iris Xe G7 80EUs | 1.8 kg | 19.9 mm | 15.60" | 1920x1080 |
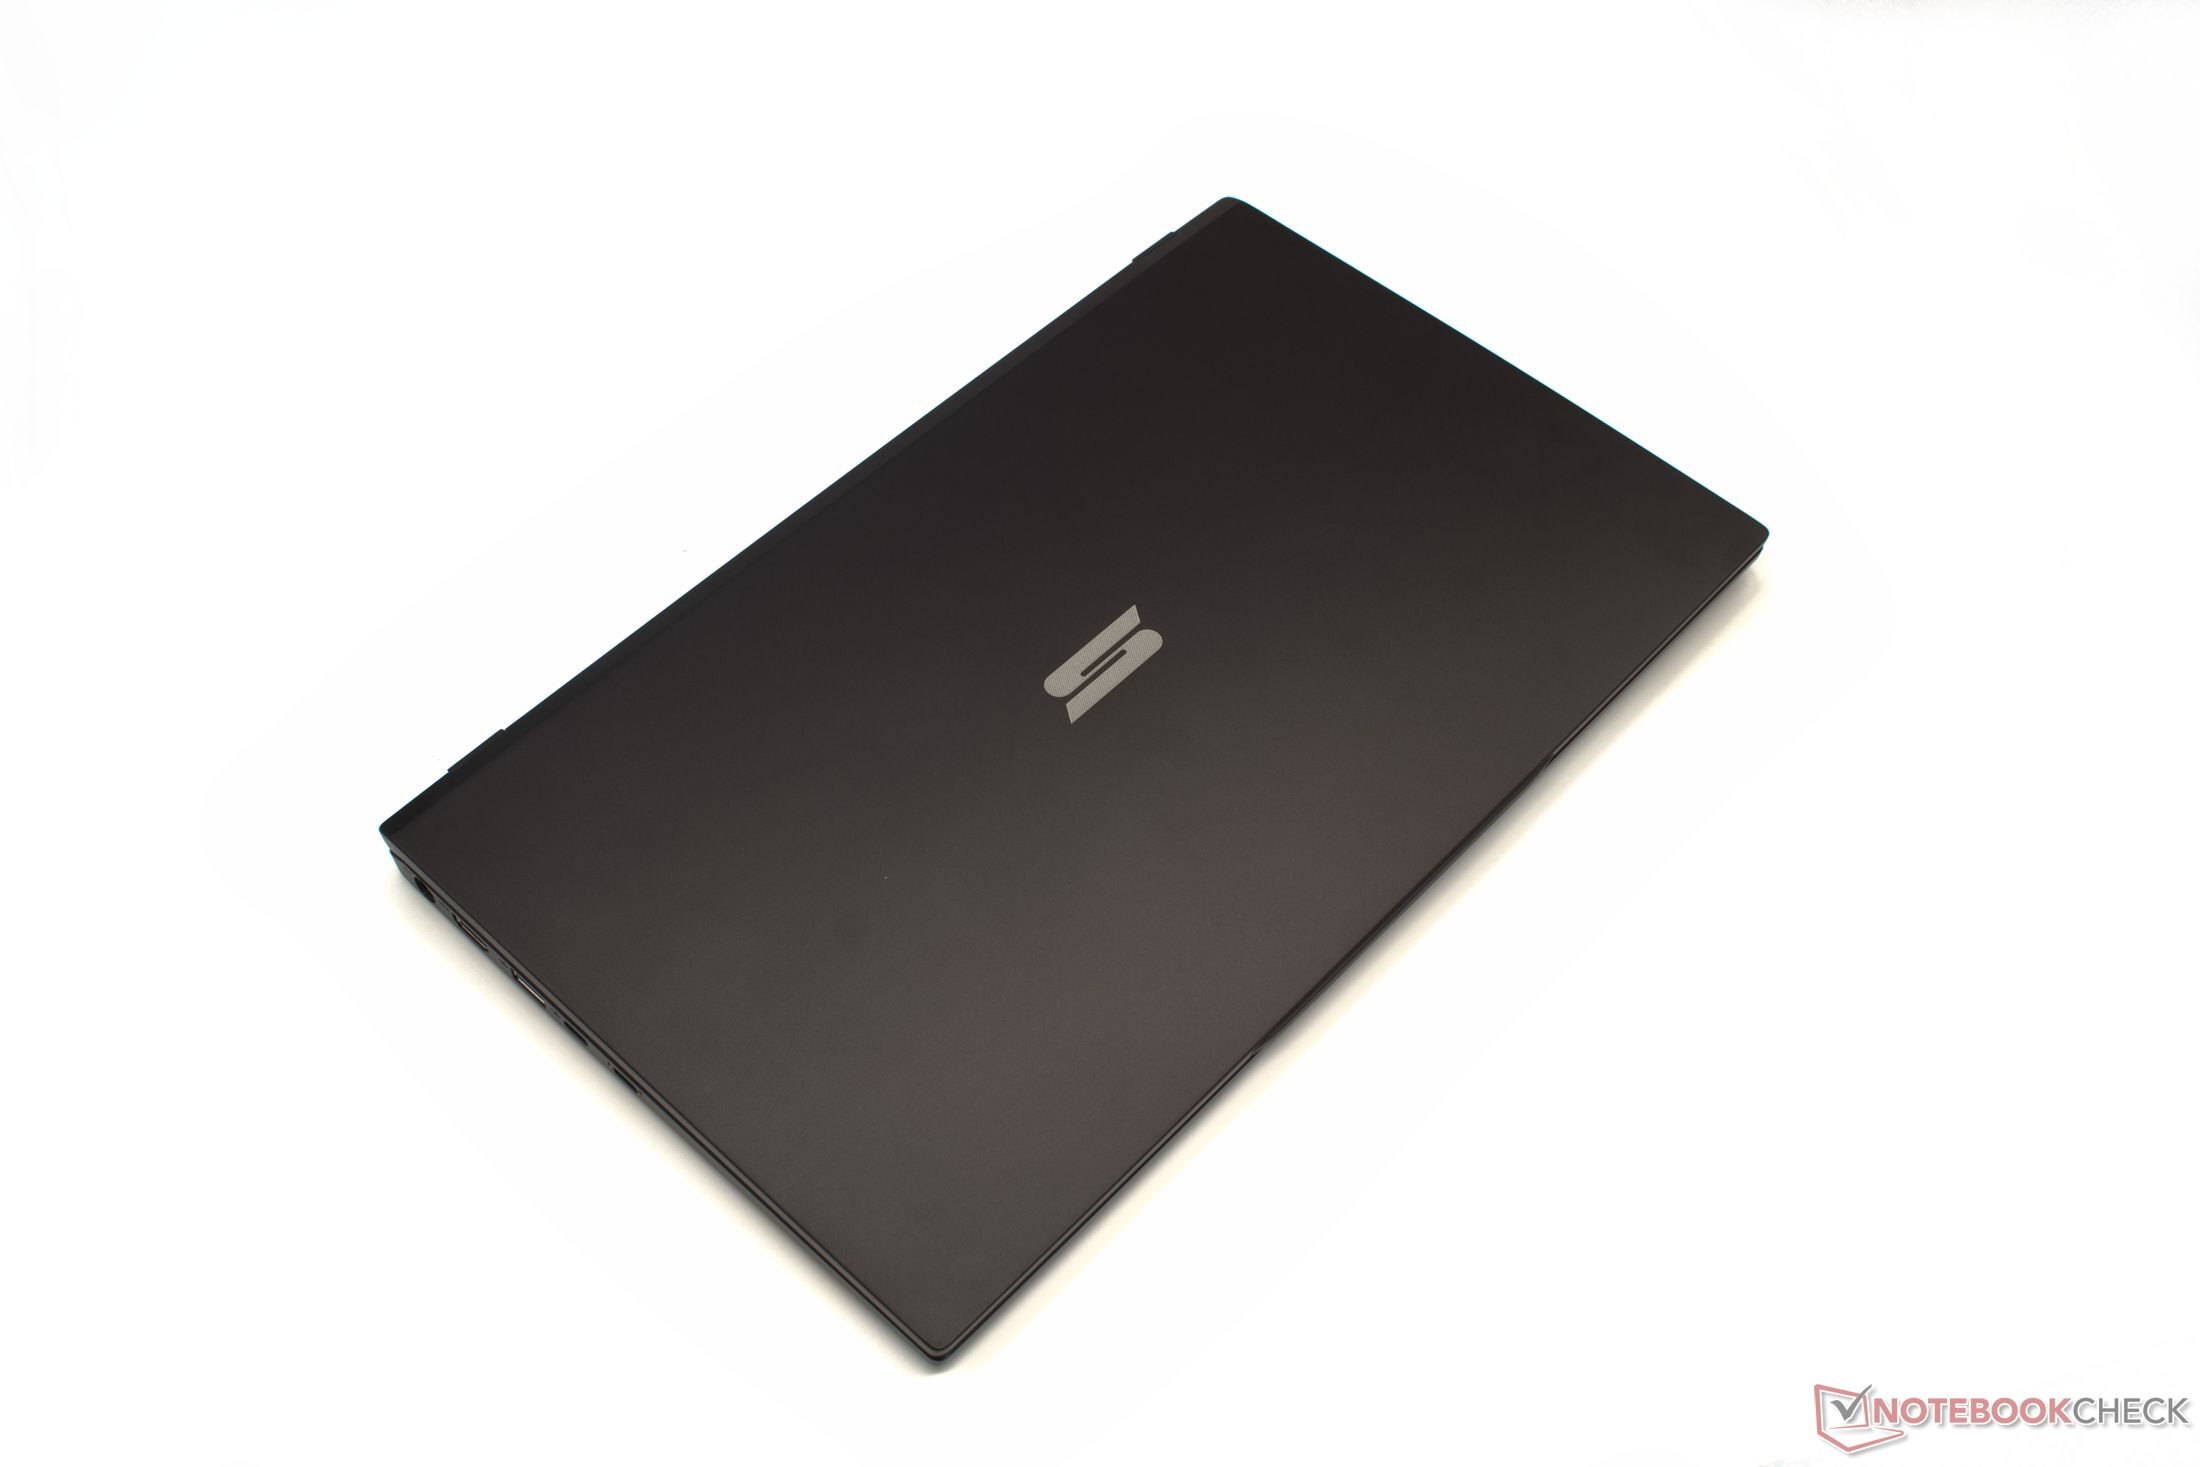
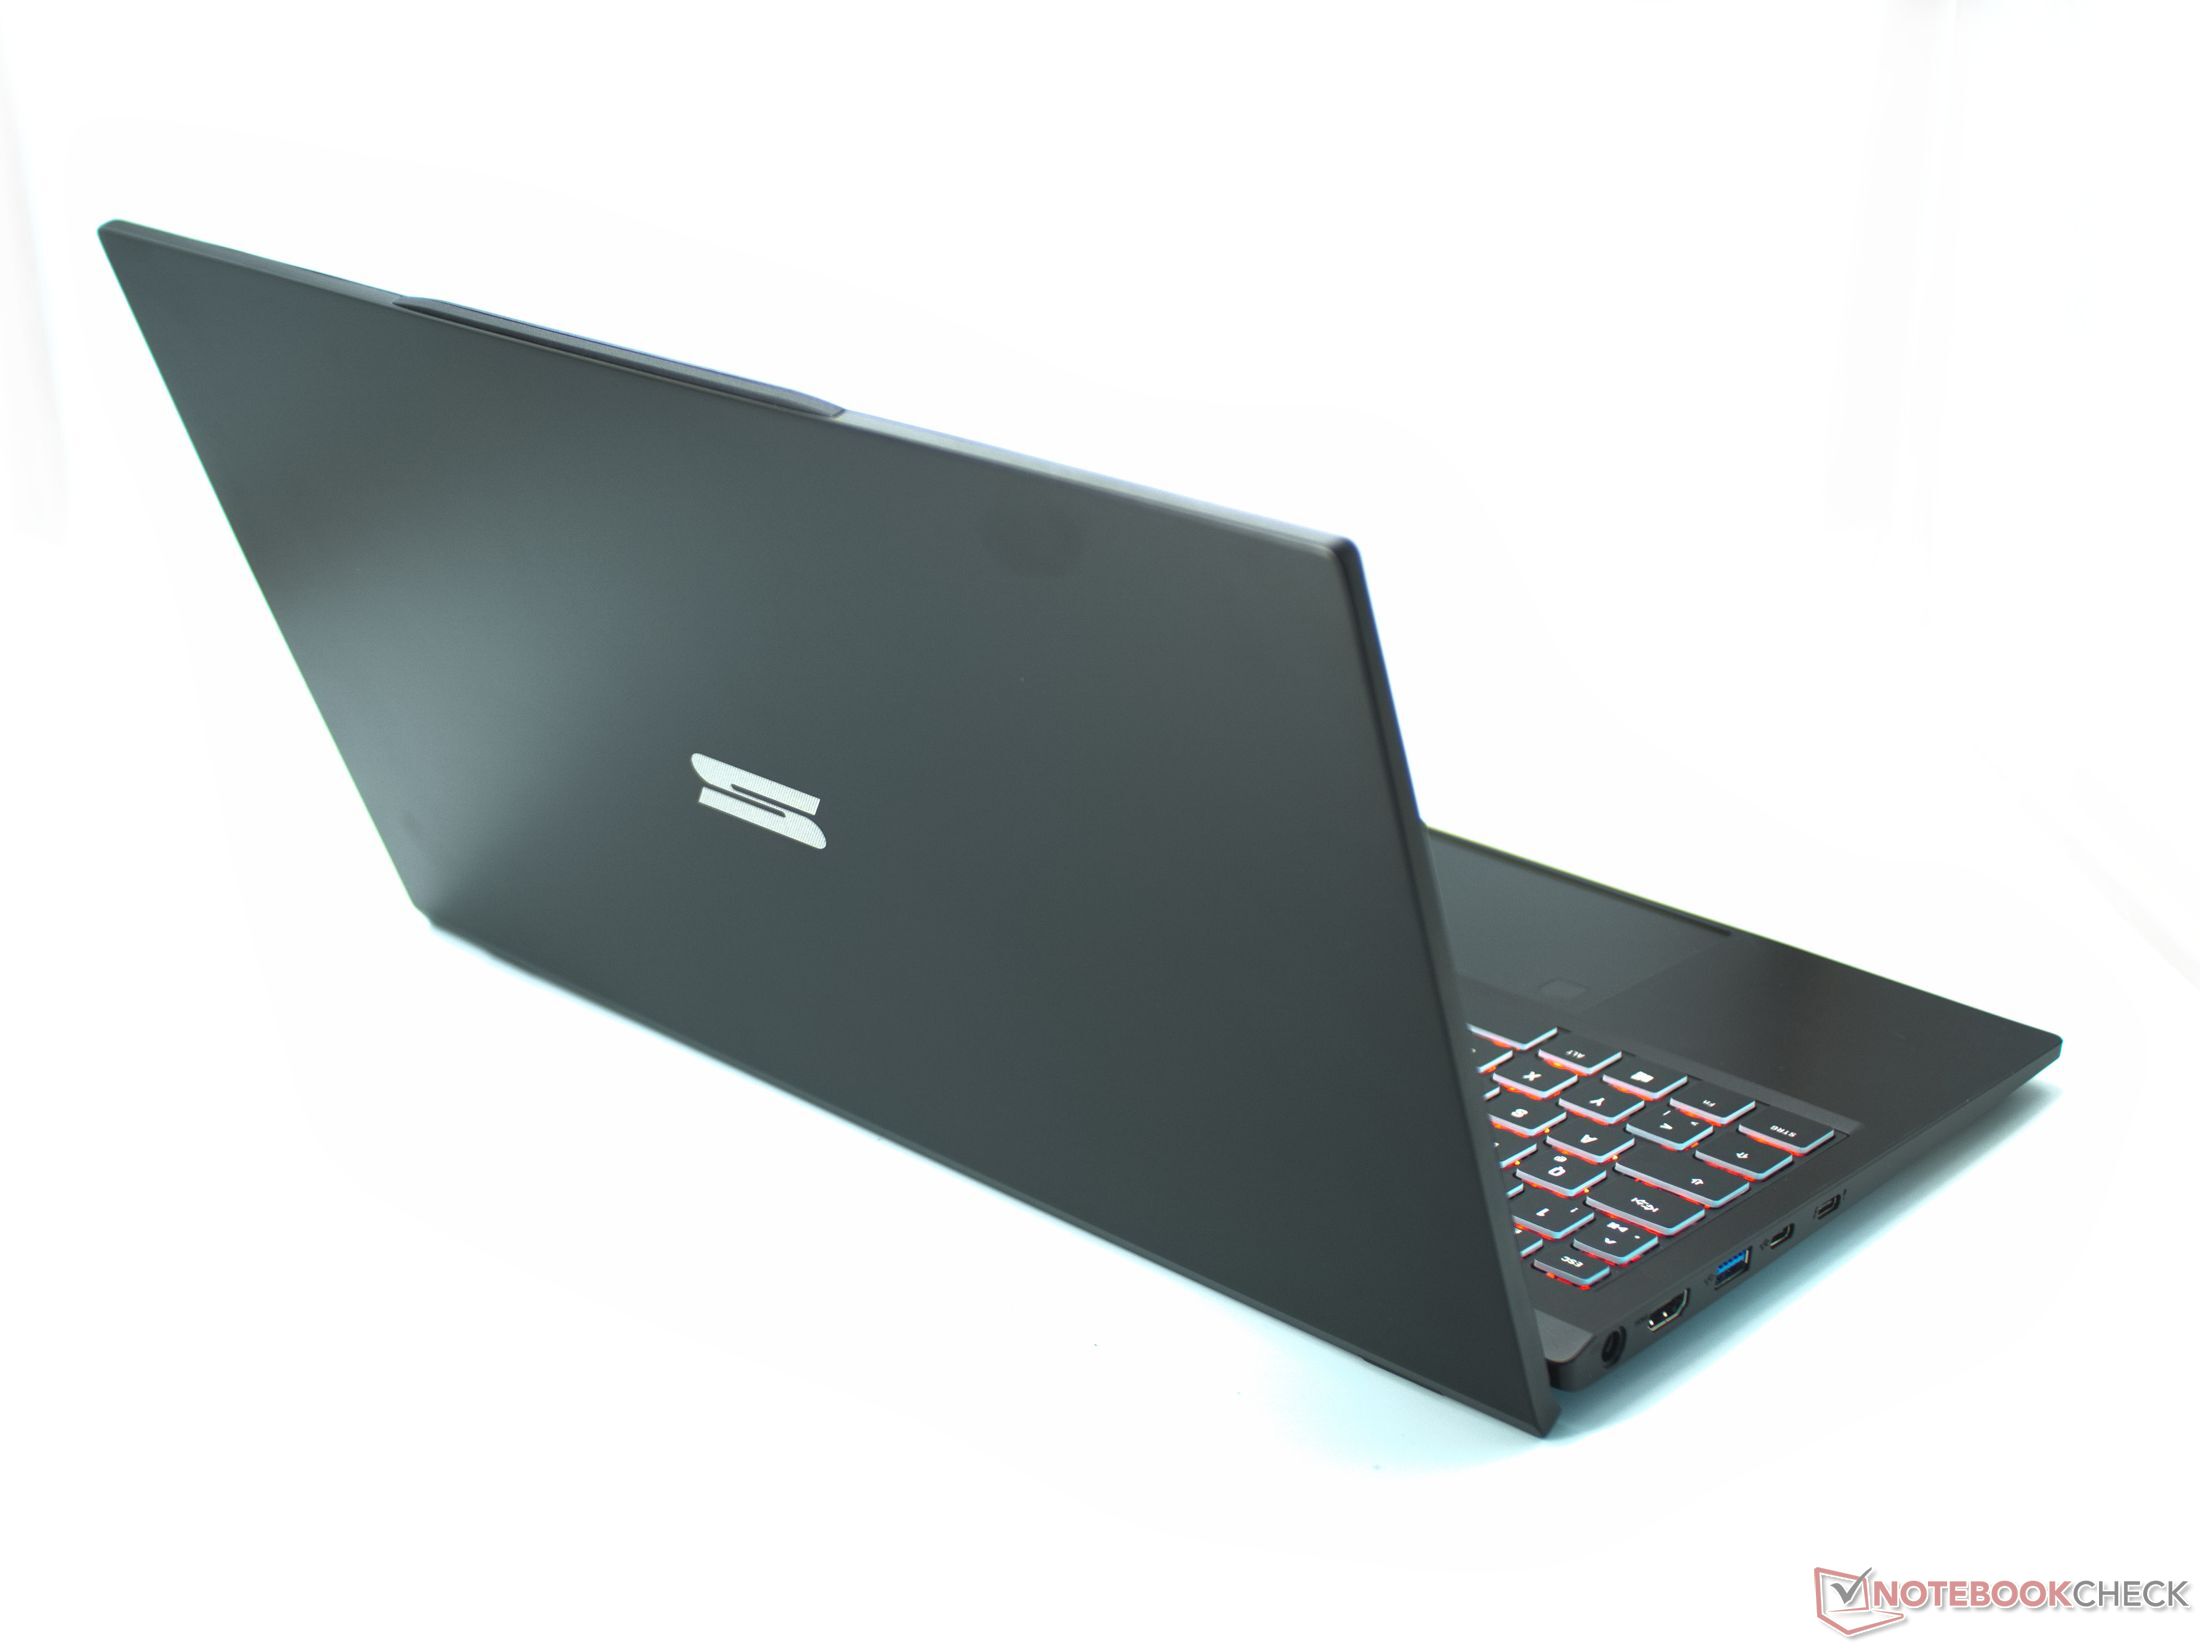
外壳和设备。铝制外壳和Thunderbolt 4
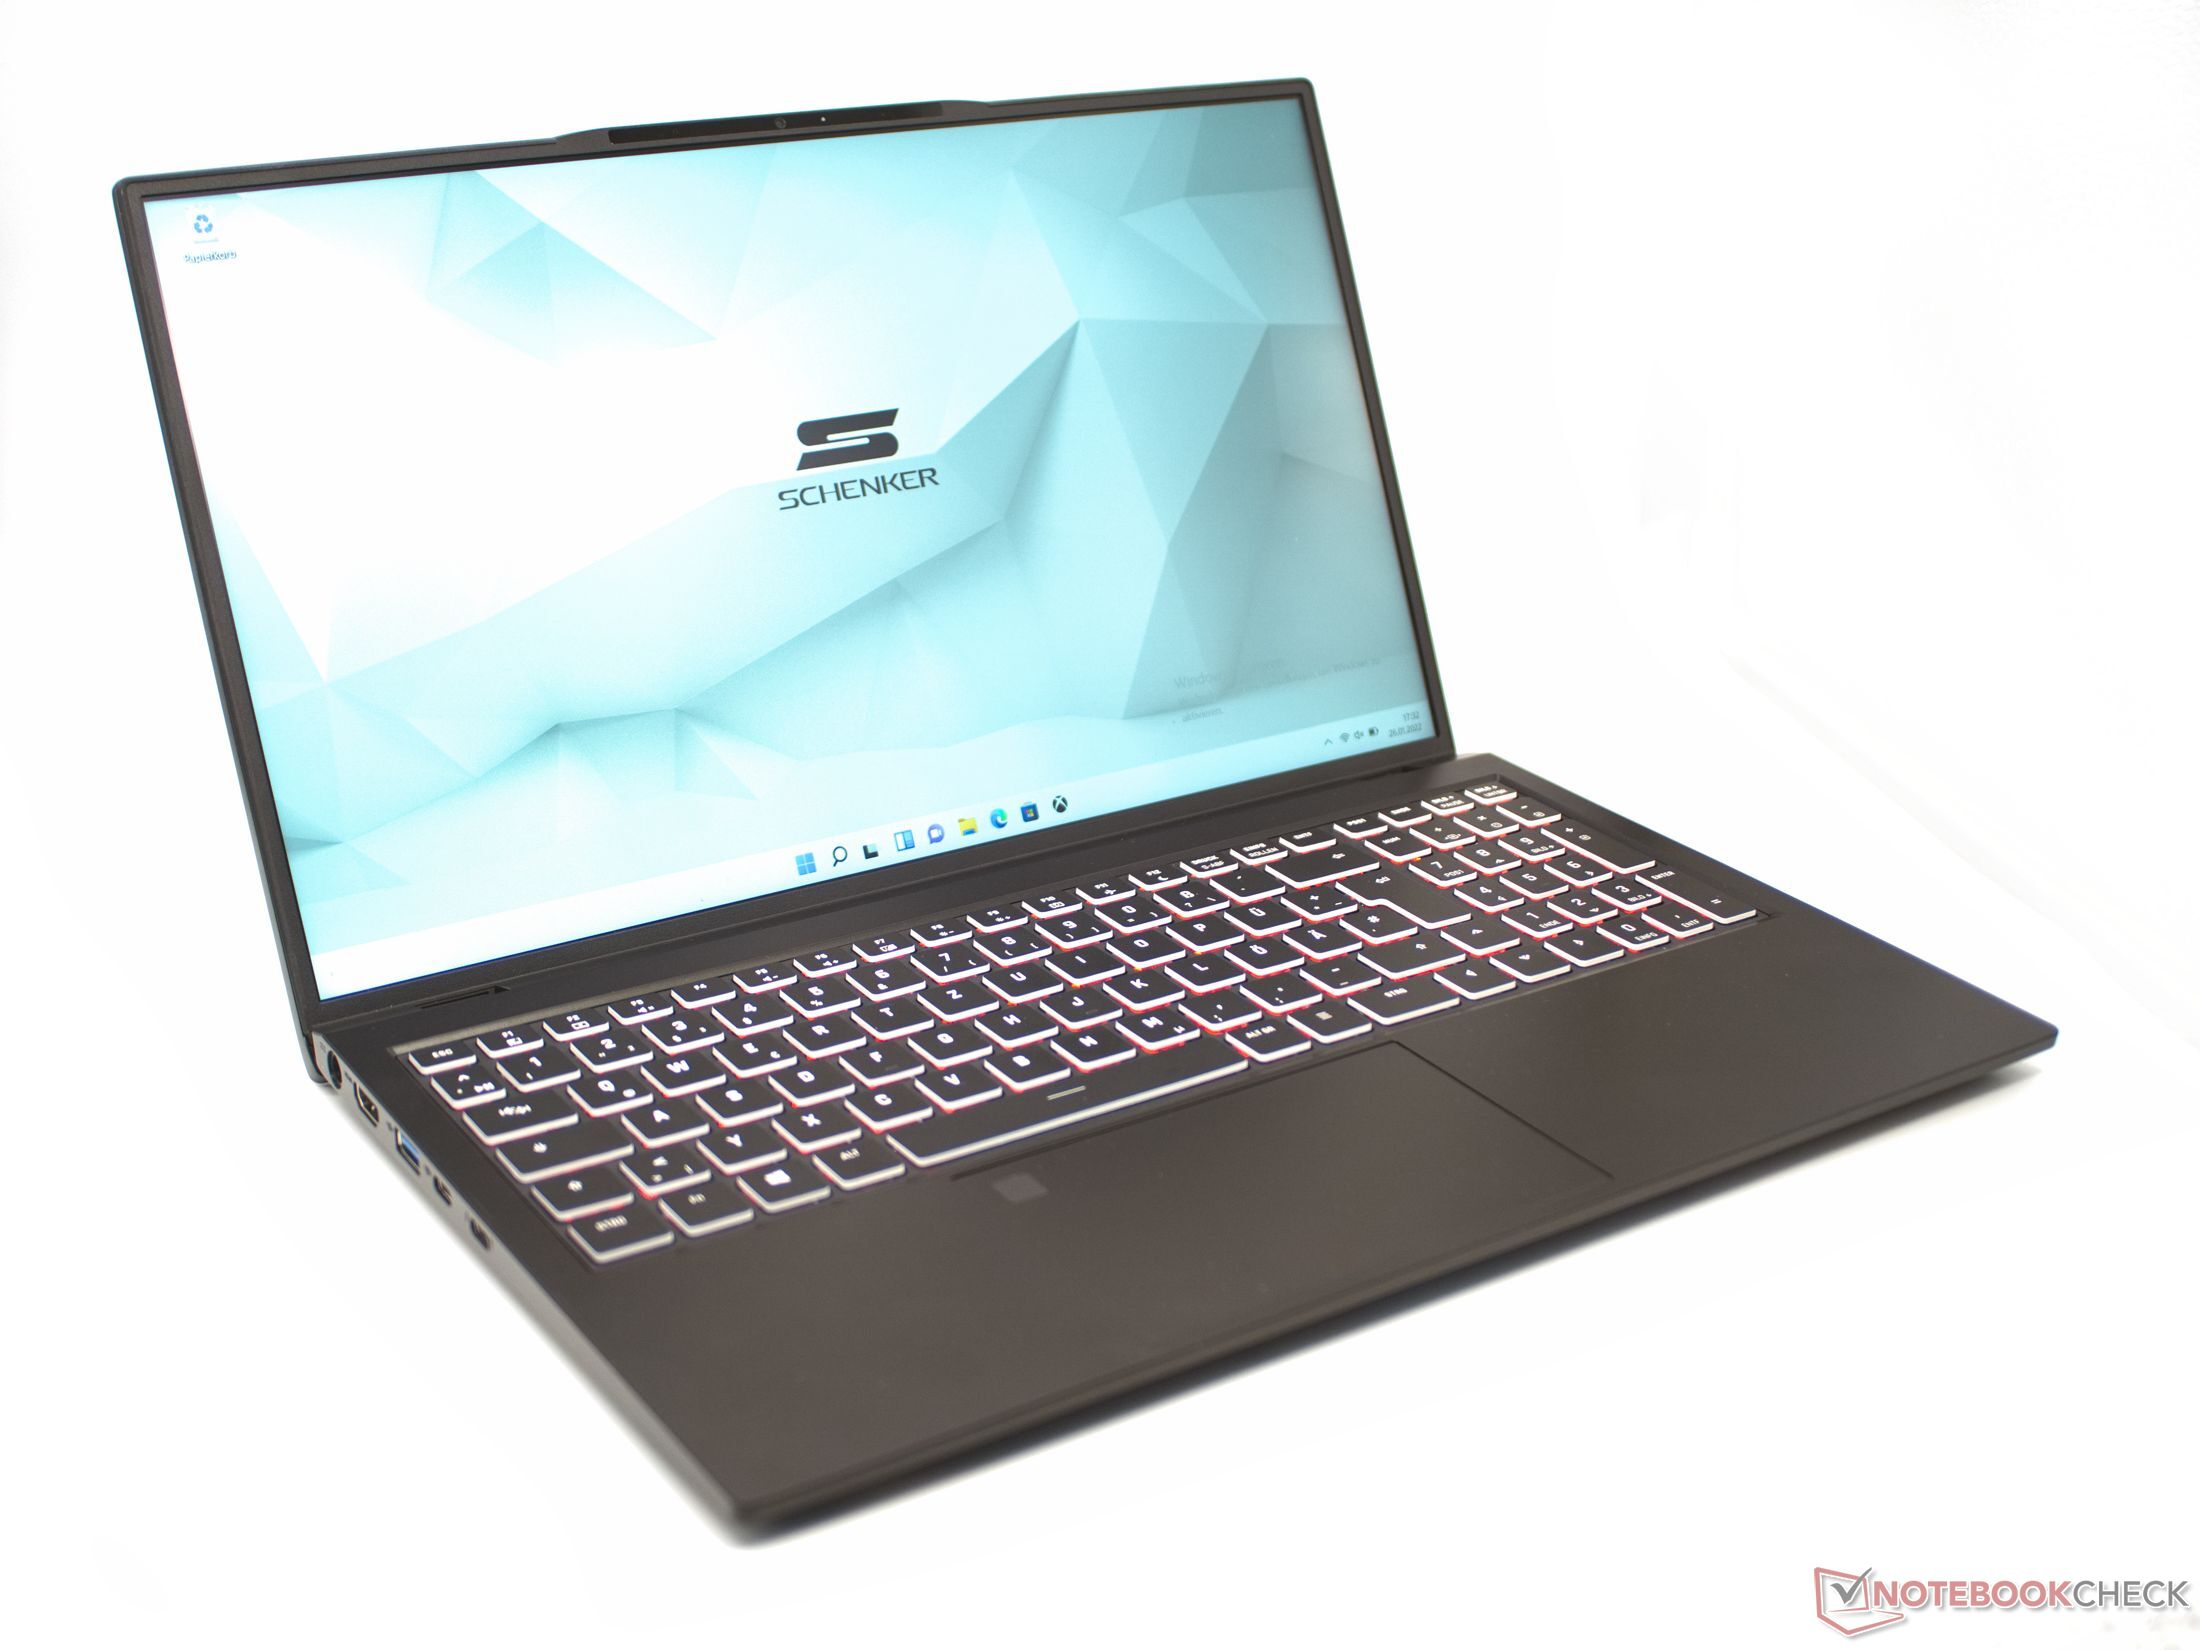
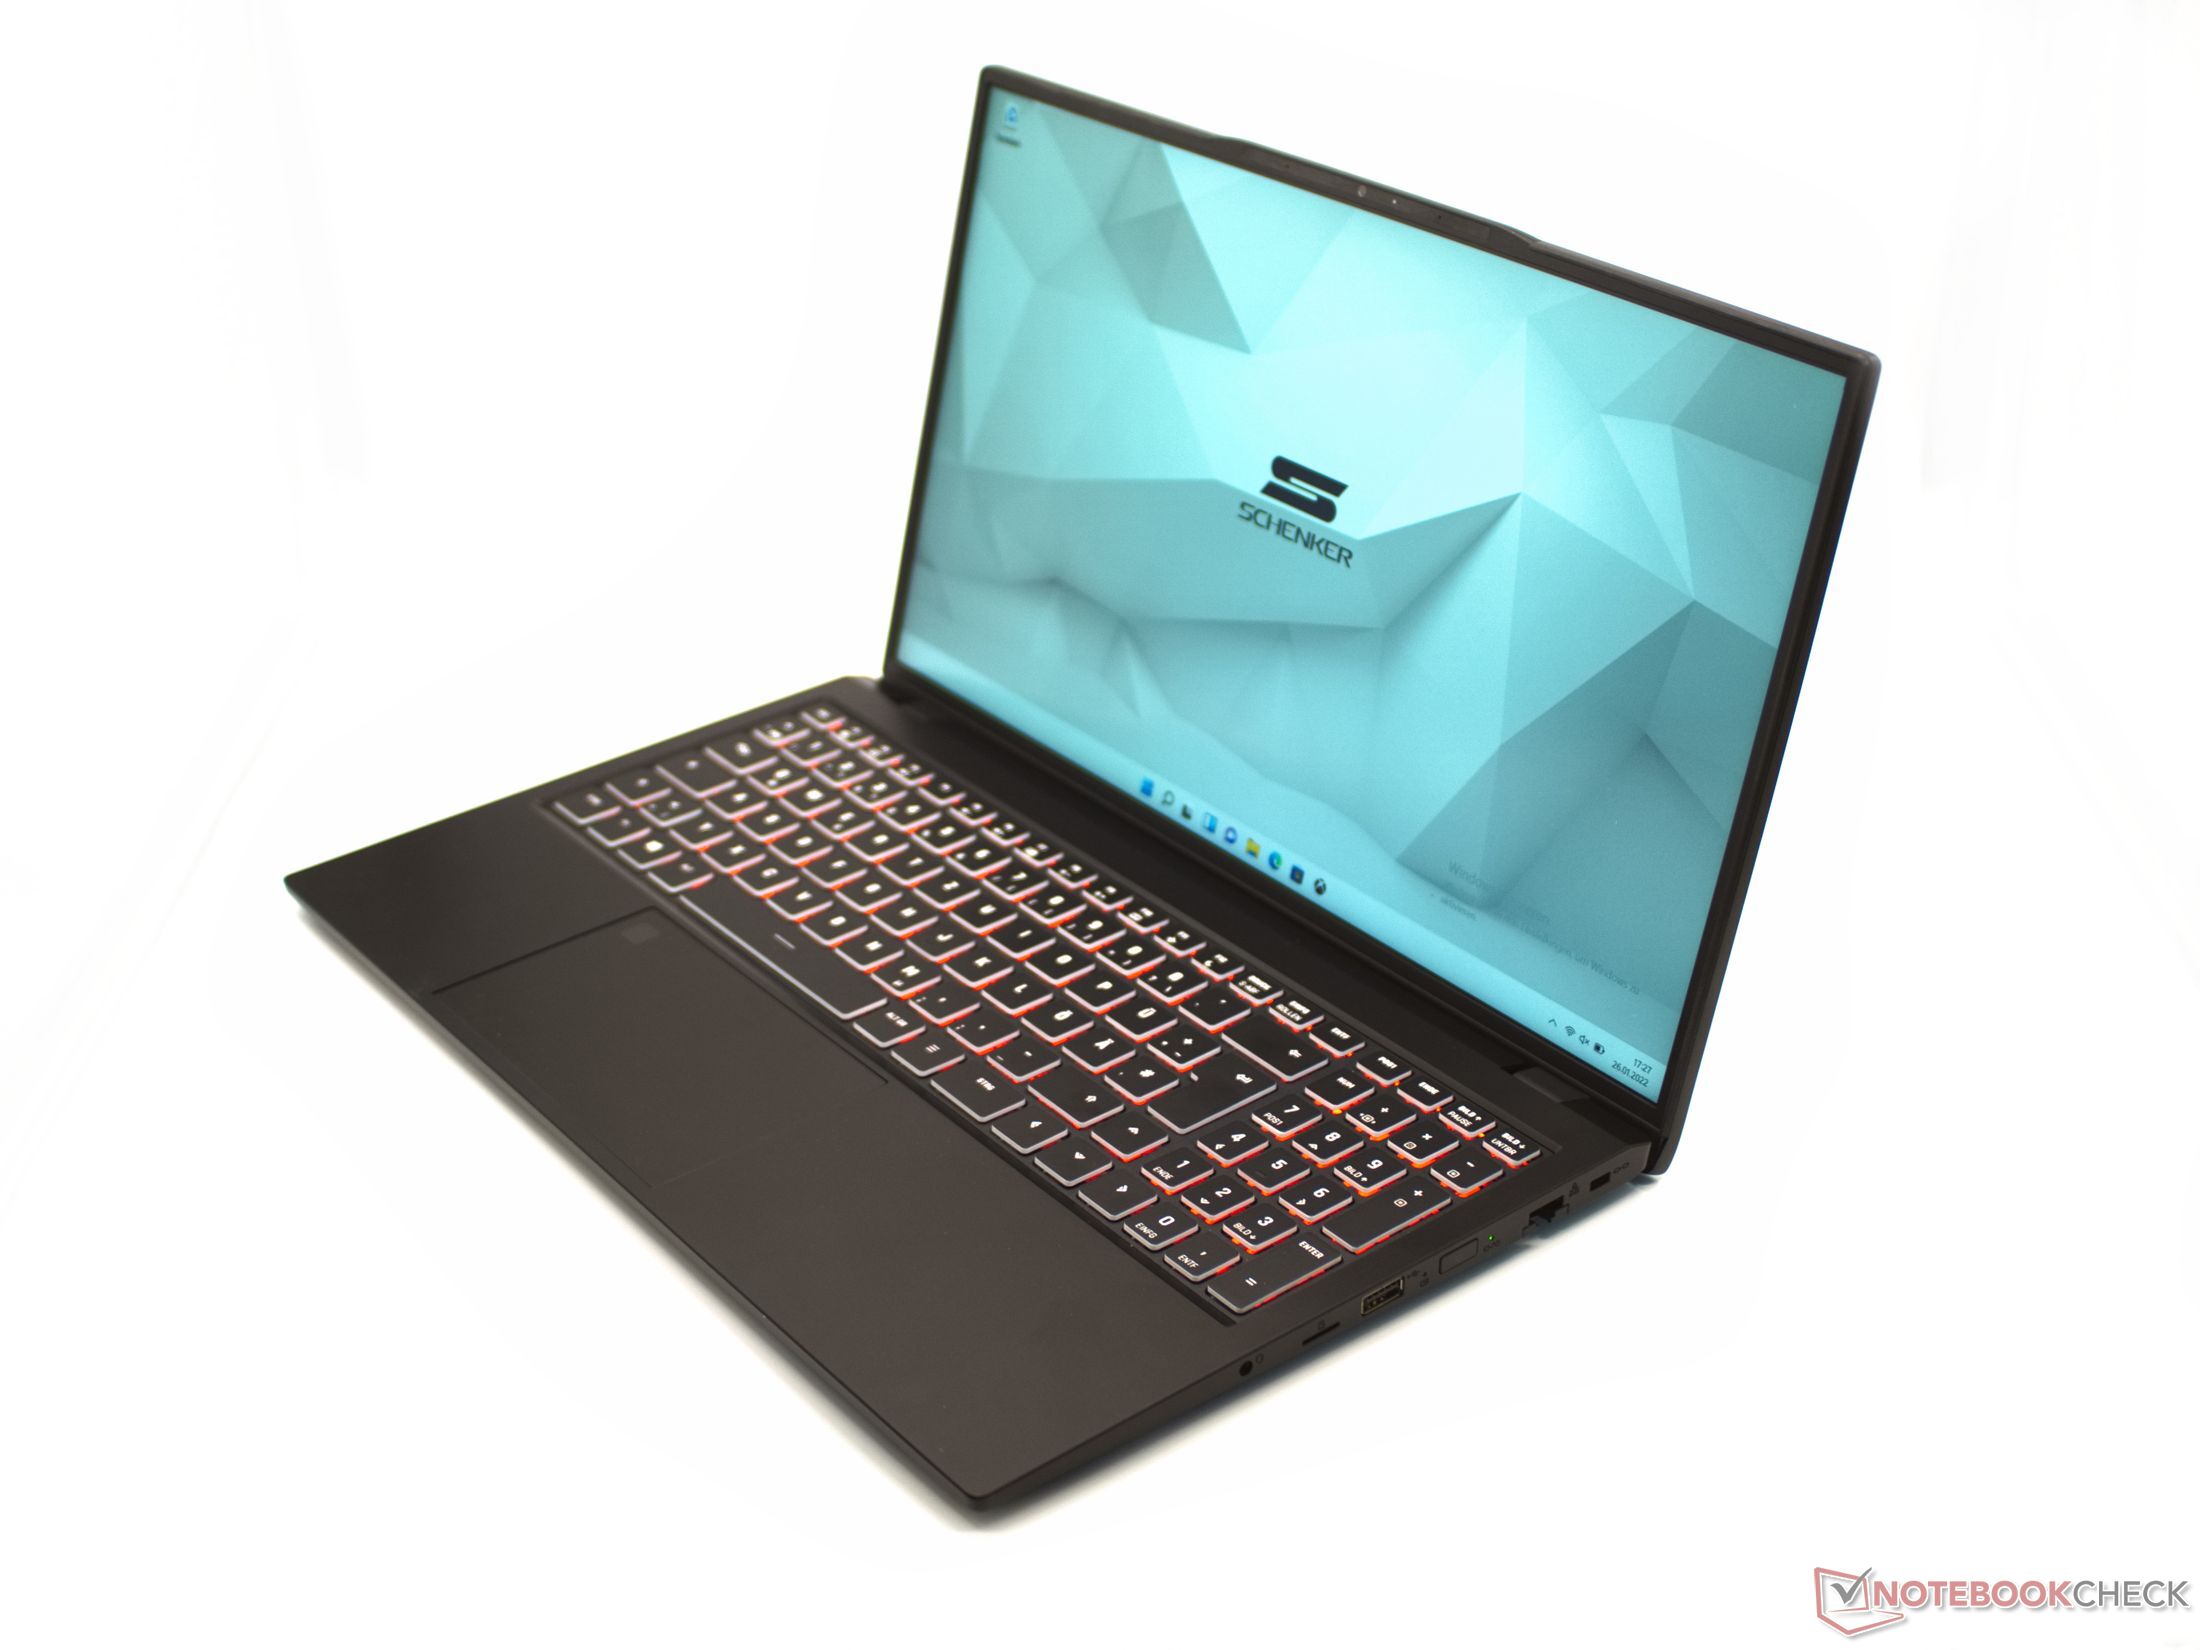
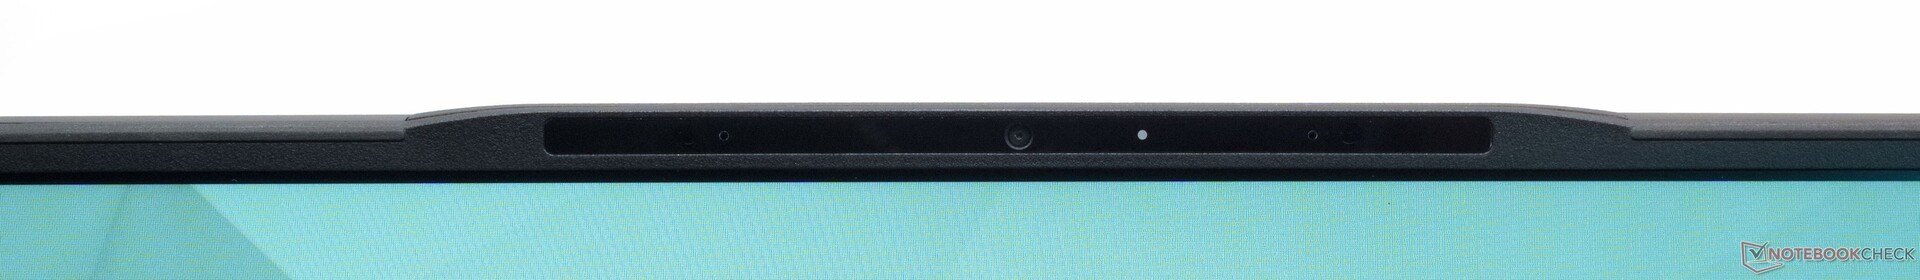
由金属和塑料制成的黑色外壳非常纤薄,仍然提供高连接性。显示屏被一个6毫米宽的边框所包围。边框加宽了一些,只是为了放置网络摄像头和麦克风。哑光的表面不容易受到灰尘的影响,并提供了一个令人愉快的感觉。清晰的边缘和小半径决定了笔记本电脑的外观。申克的设计非常简单,同时看起来也很有质量。底座的底部和显示盖是由金属制成的,而底座的顶部是由塑料制成的。
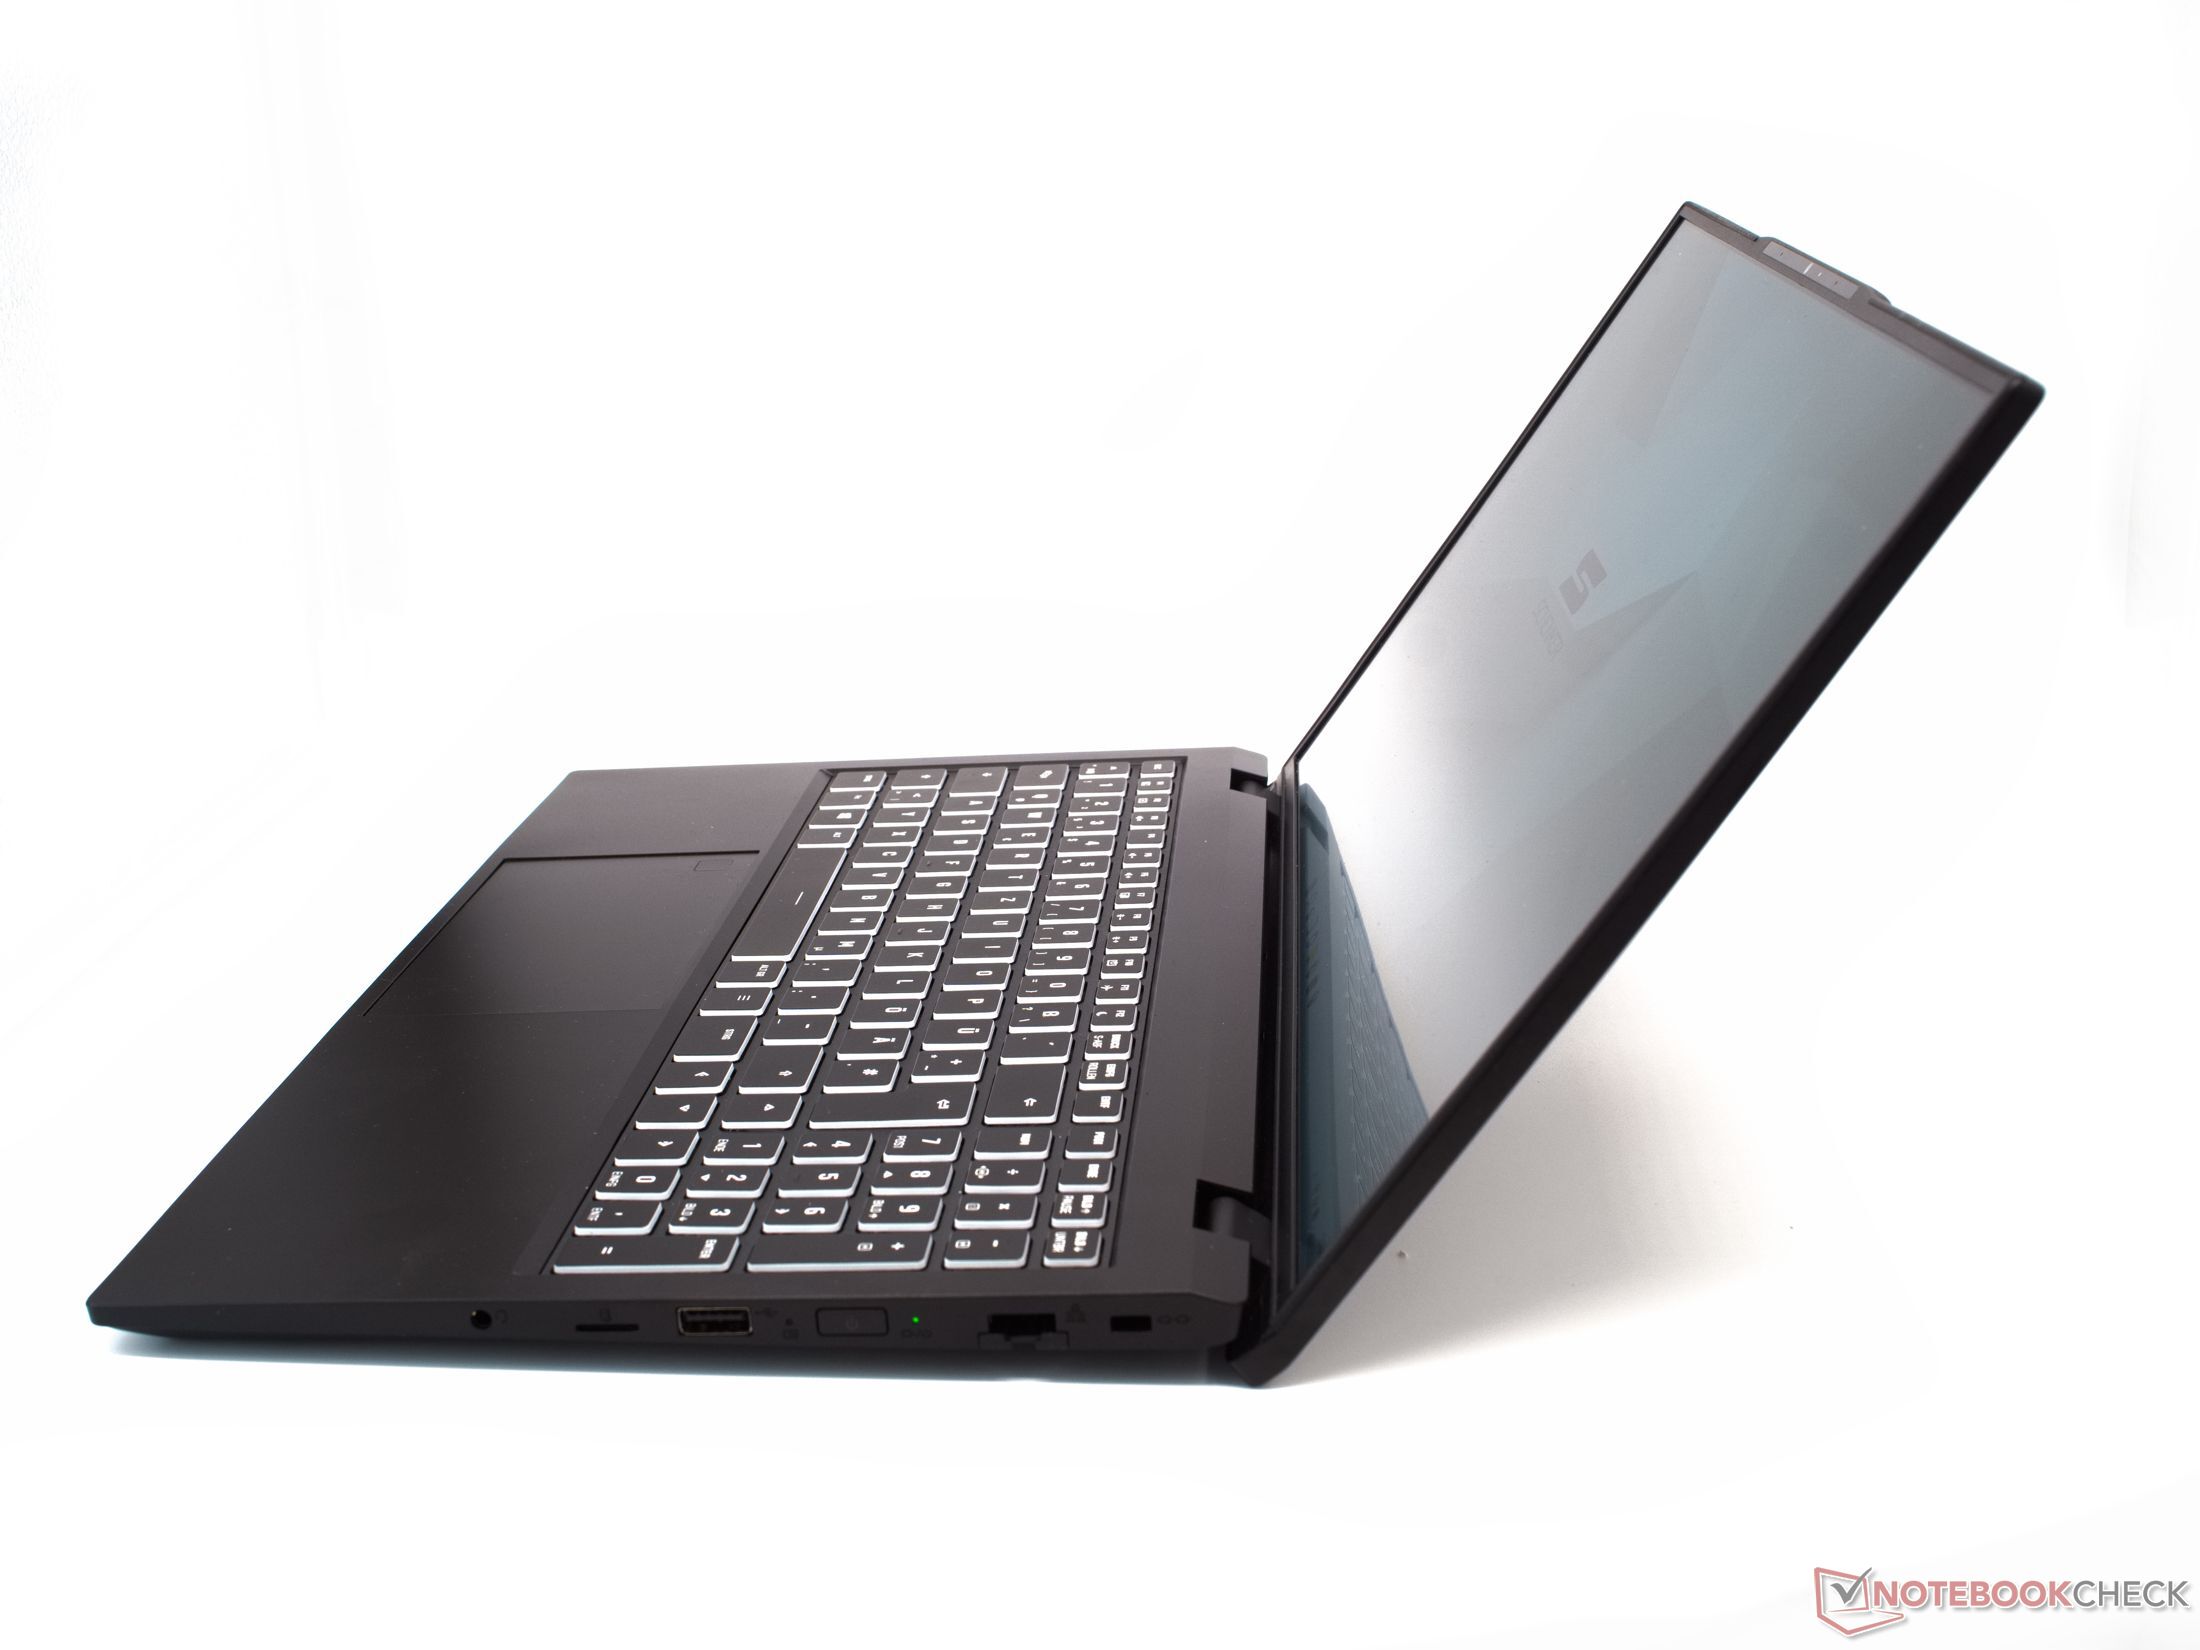
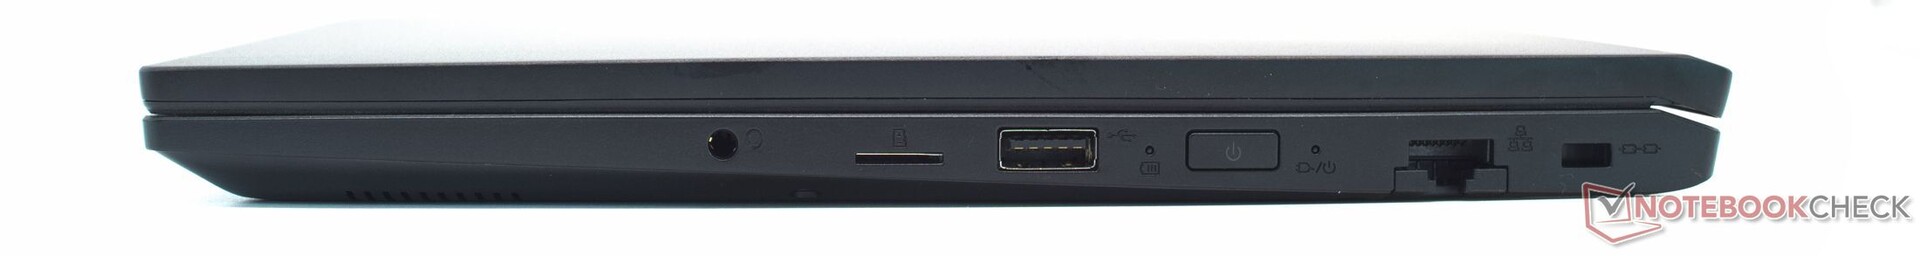
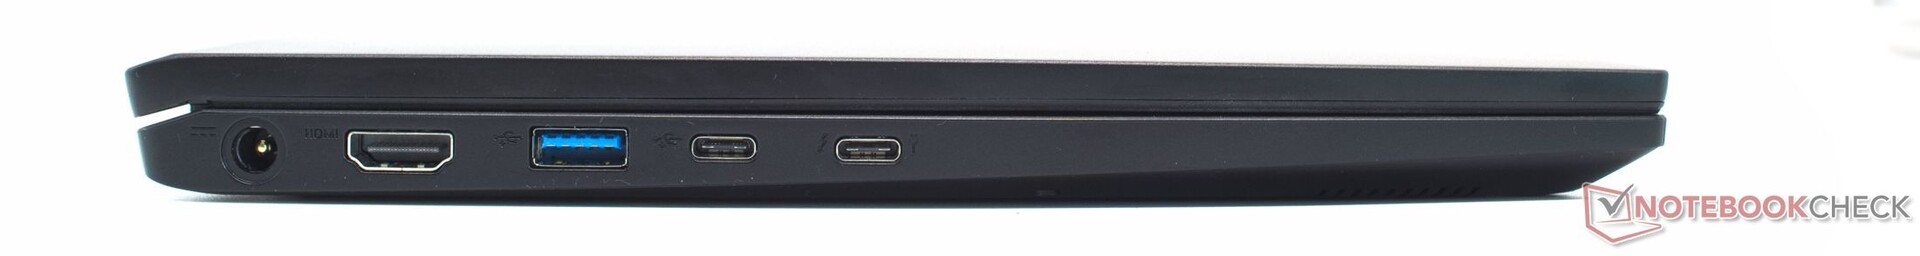
Schenker Work 15提供了广泛的连接选项。microSD读卡器和Wi-Fi 6以预期的高速度工作。由于有了Thunderbolt 4和PowerDelivery,两个USB-C端口都能提供全方位的功能。HDMI和千兆网络也是可用的。在安全方面,英特尔酷睿i7-11370H的安全功能与指纹传感器和Kensington锁槽一起提供。网络摄像头显示出笔记本电脑网络摄像头的典型低质量。
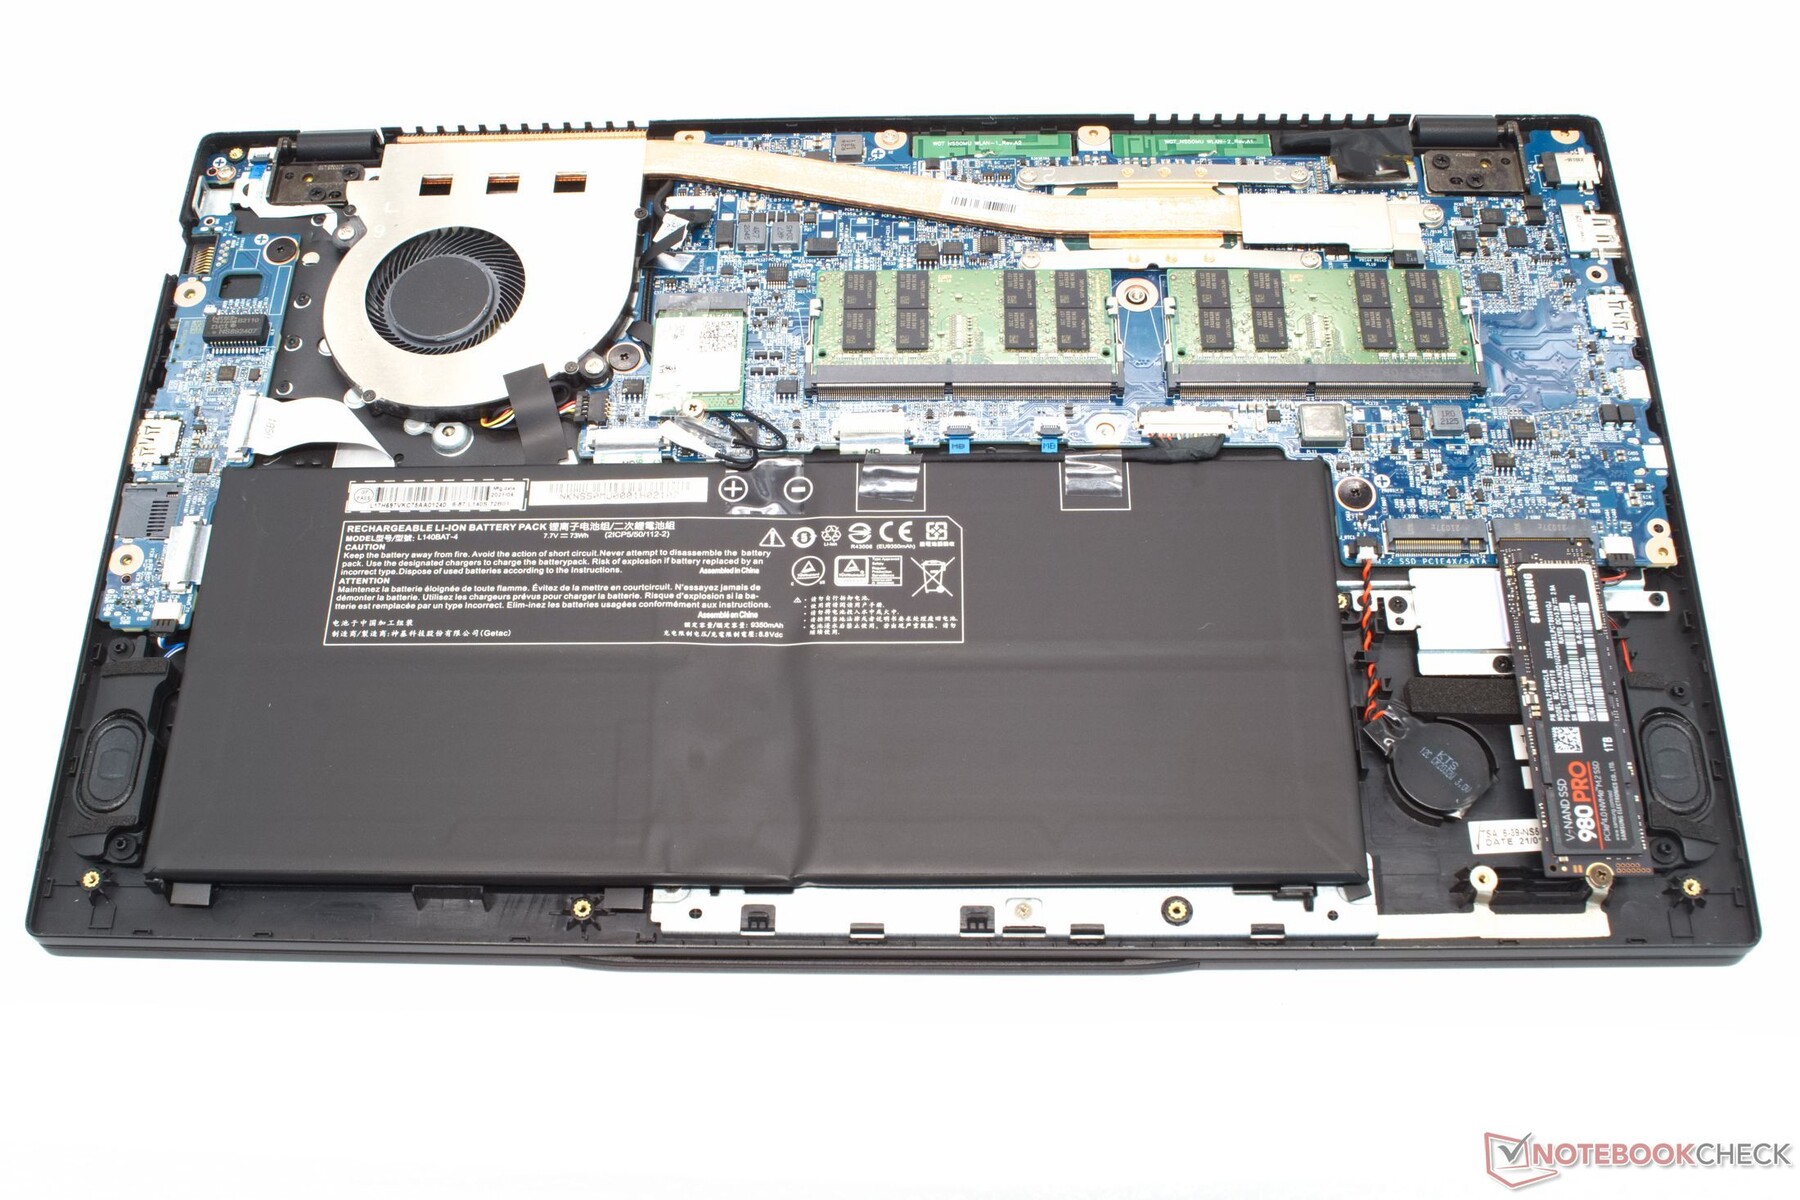
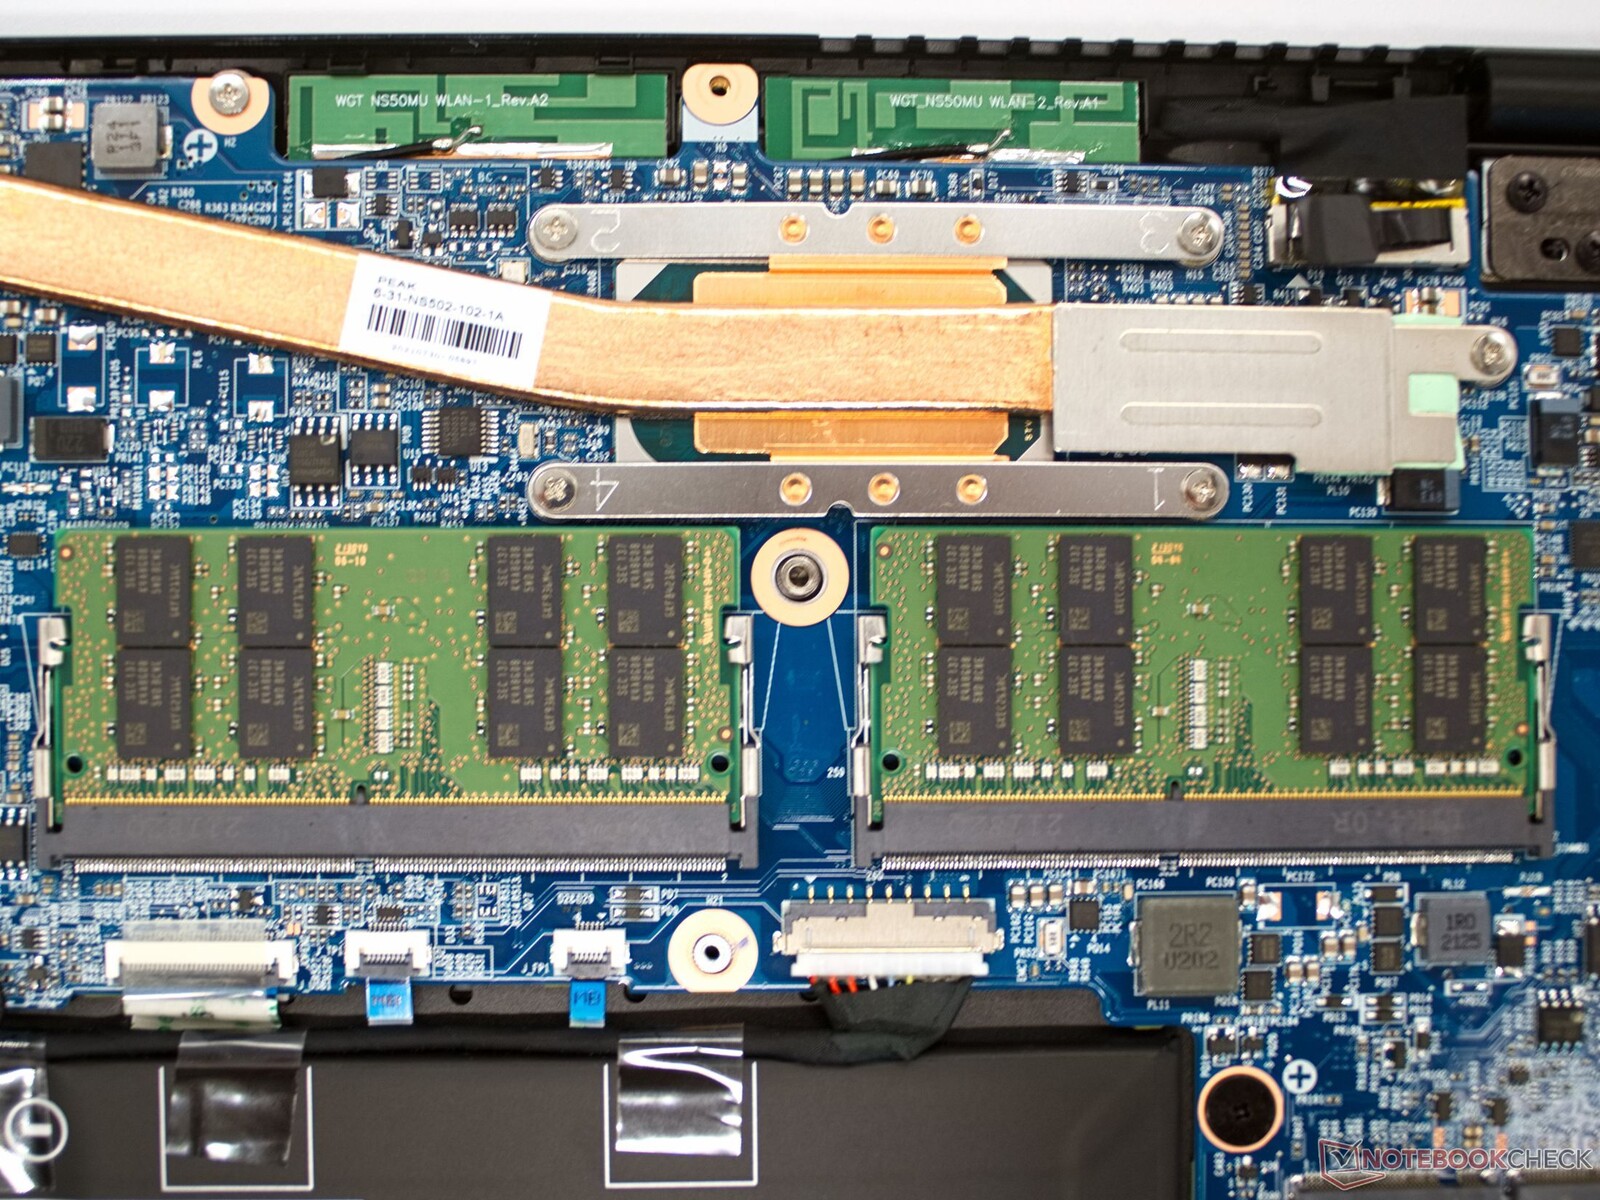
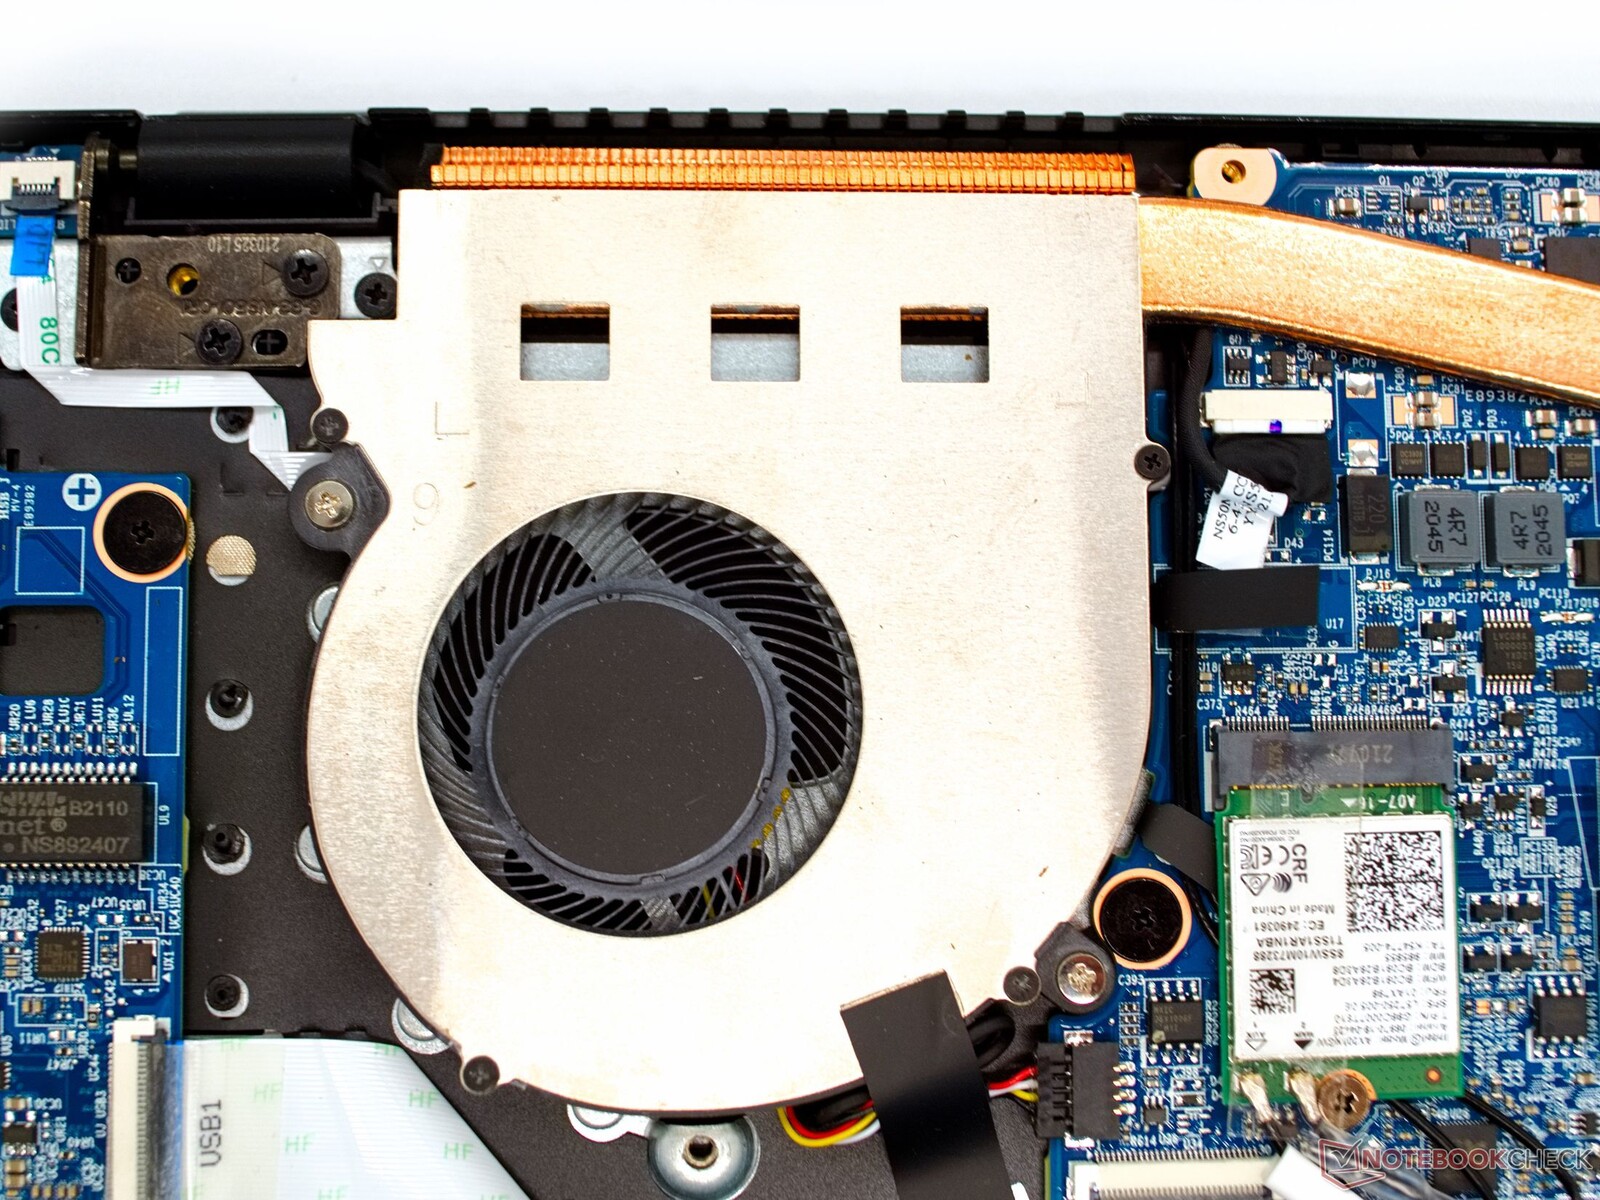
底部的机箱盖由许多螺丝固定,但一旦拆下,评测样品很容易打开。下面是可升级的工作内存和一个免费的M.2插槽,可用于另一个固态硬盘。
| SD Card Reader | |
| average JPG Copy Test (av. of 3 runs) | |
| LG Gram 15Z90P-G.AA89G (AV Pro SD microSD 128 GB V60) | |
| HP Pavilion x360 15-er0155ng (AV PRO microSD 128 GB V60) | |
| Schenker Work 15 Tiger Lake-H (Angelbird AV Pro V60) | |
| Average of class Office (19.8 - 198.5, n=22, last 2 years) | |
| Asus VivoBook S15 D533UA (AV PRO microSD 128 GB V60) | |
| Dell Inspiron 15 3501 (AV Pro SD 128 GB V60) | |
| maximum AS SSD Seq Read Test (1GB) | |
| LG Gram 15Z90P-G.AA89G (AV Pro SD microSD 128 GB V60) | |
| HP Pavilion x360 15-er0155ng (AV PRO microSD 128 GB V60) | |
| Average of class Office (27.4 - 249, n=21, last 2 years) | |
| Schenker Work 15 Tiger Lake-H (Angelbird AV Pro V60) | |
| Asus VivoBook S15 D533UA (AV PRO microSD 128 GB V60) | |
| Dell Inspiron 15 3501 (AV Pro SD microSD 128 GB V60) | |
| Networking | |
| iperf3 transmit AX12 | |
| LG Gram 15Z90P-G.AA89G | |
| Schenker Work 15 Tiger Lake-H | |
| Average Intel Wi-Fi 6 AX201 (49.8 - 1775, n=324) | |
| Asus VivoBook S15 D533UA | |
| Lenovo ThinkPad E15 G3-20YG003UGE | |
| Dell Inspiron 15 3501 | |
| iperf3 receive AX12 | |
| LG Gram 15Z90P-G.AA89G | |
| Asus VivoBook S15 D533UA | |
| Average Intel Wi-Fi 6 AX201 (136 - 1743, n=324) | |
| Schenker Work 15 Tiger Lake-H | |
| Lenovo ThinkPad E15 G3-20YG003UGE | |
| Dell Inspiron 15 3501 | |


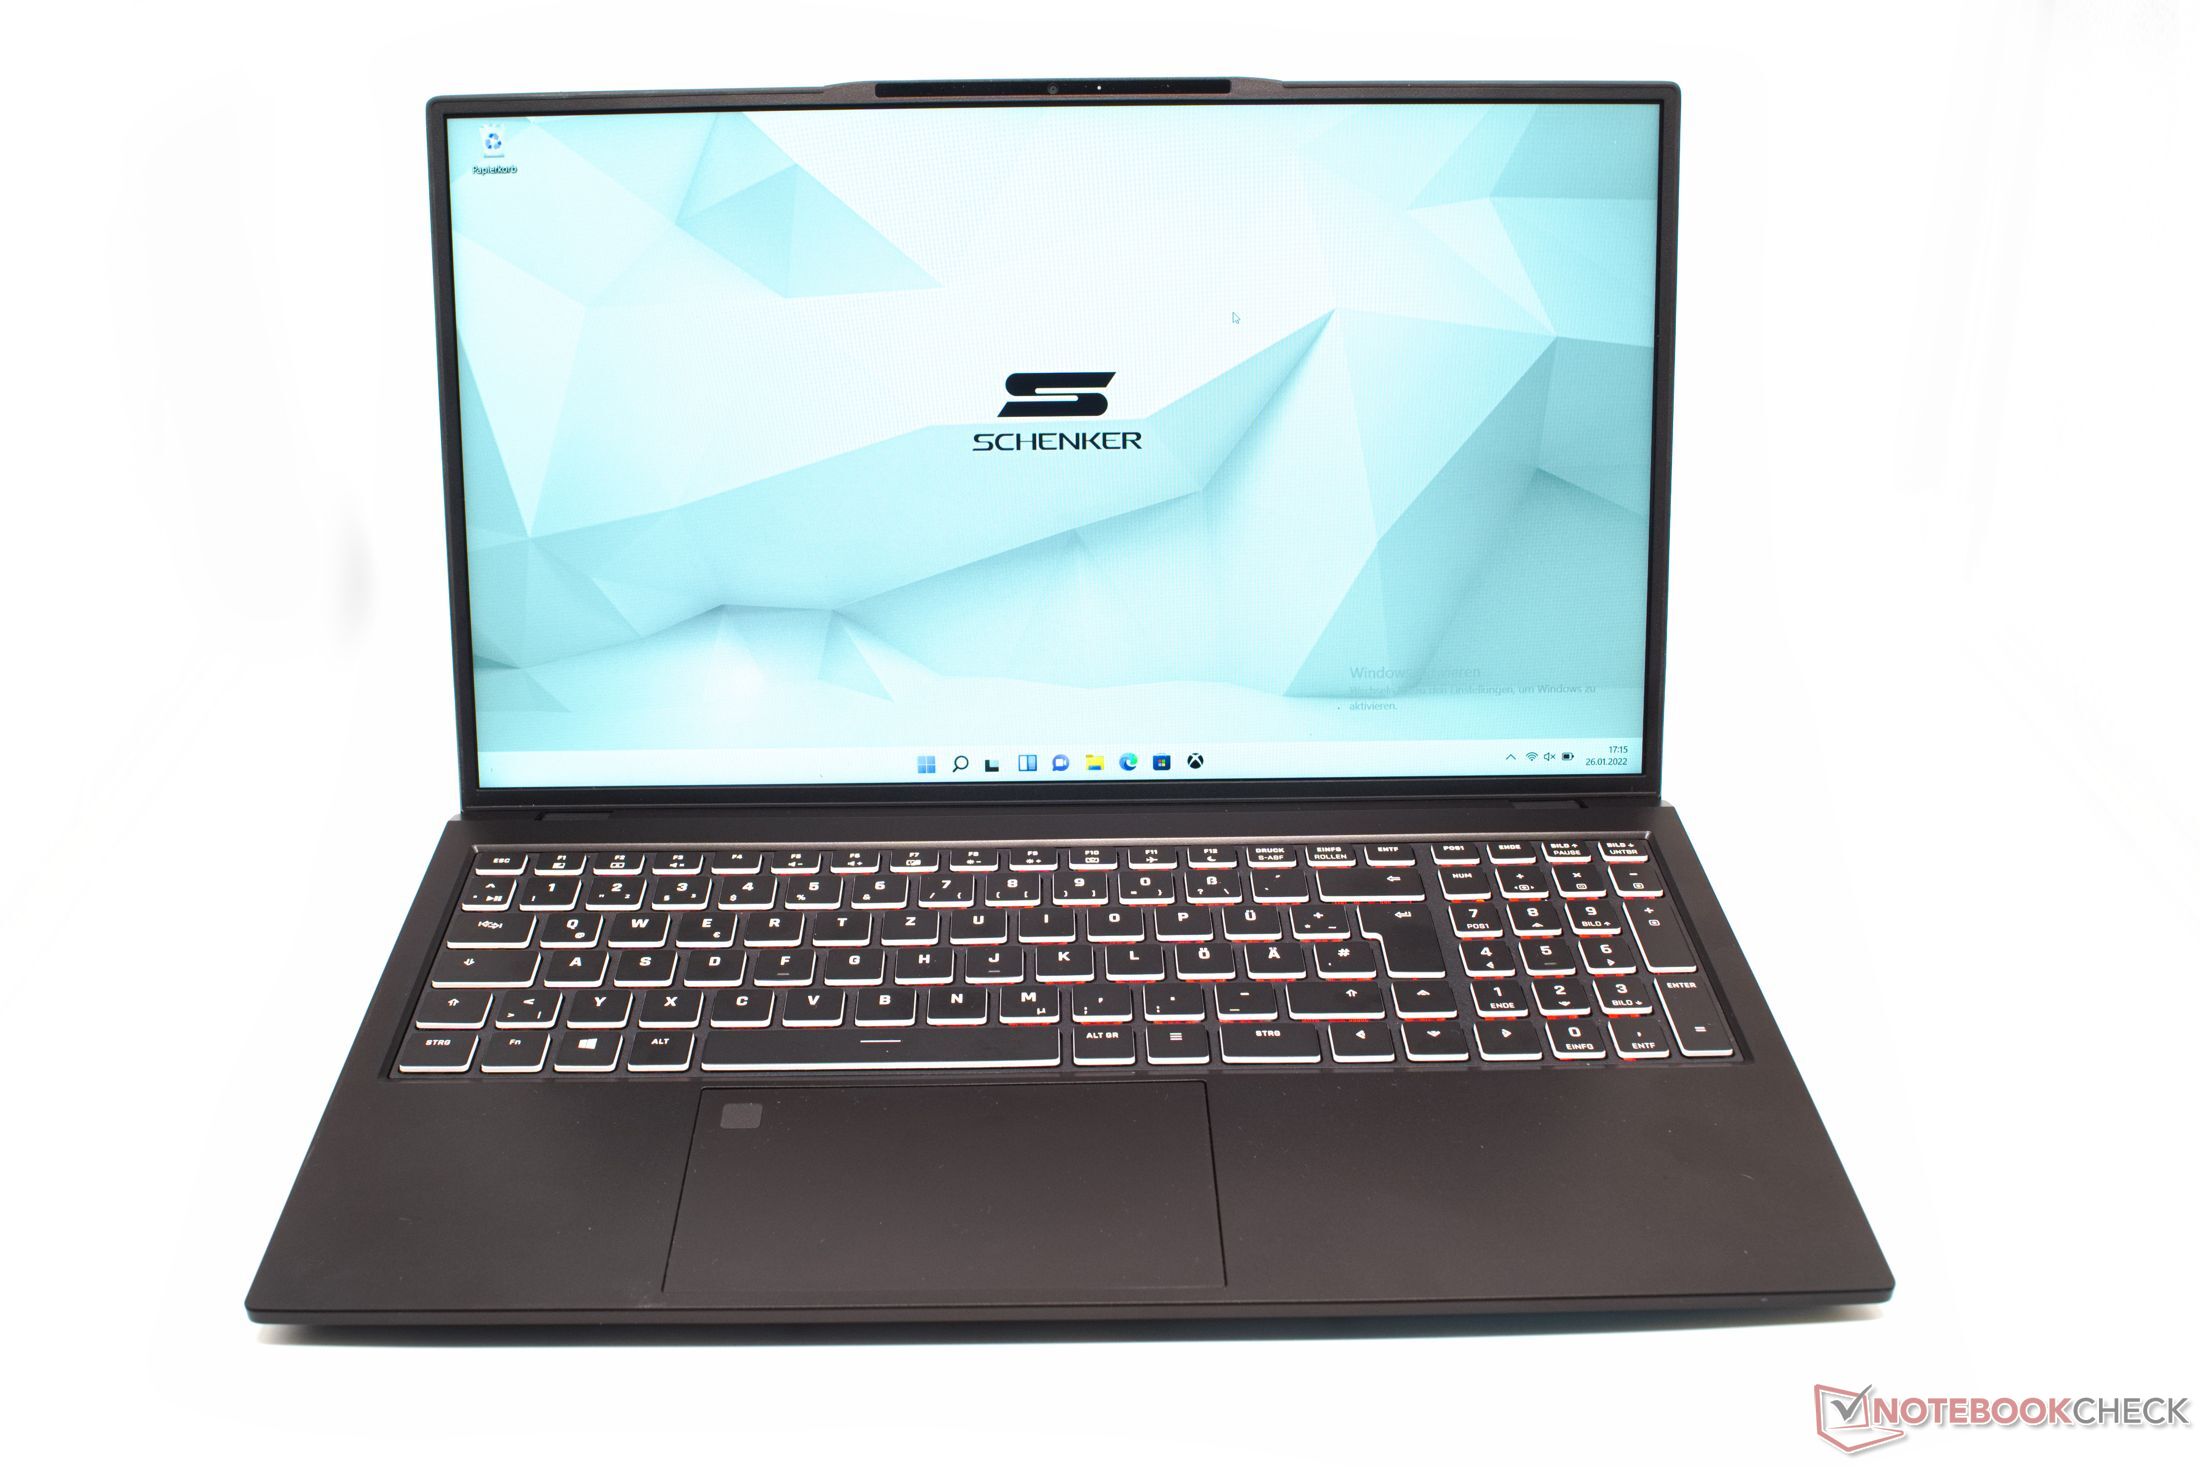
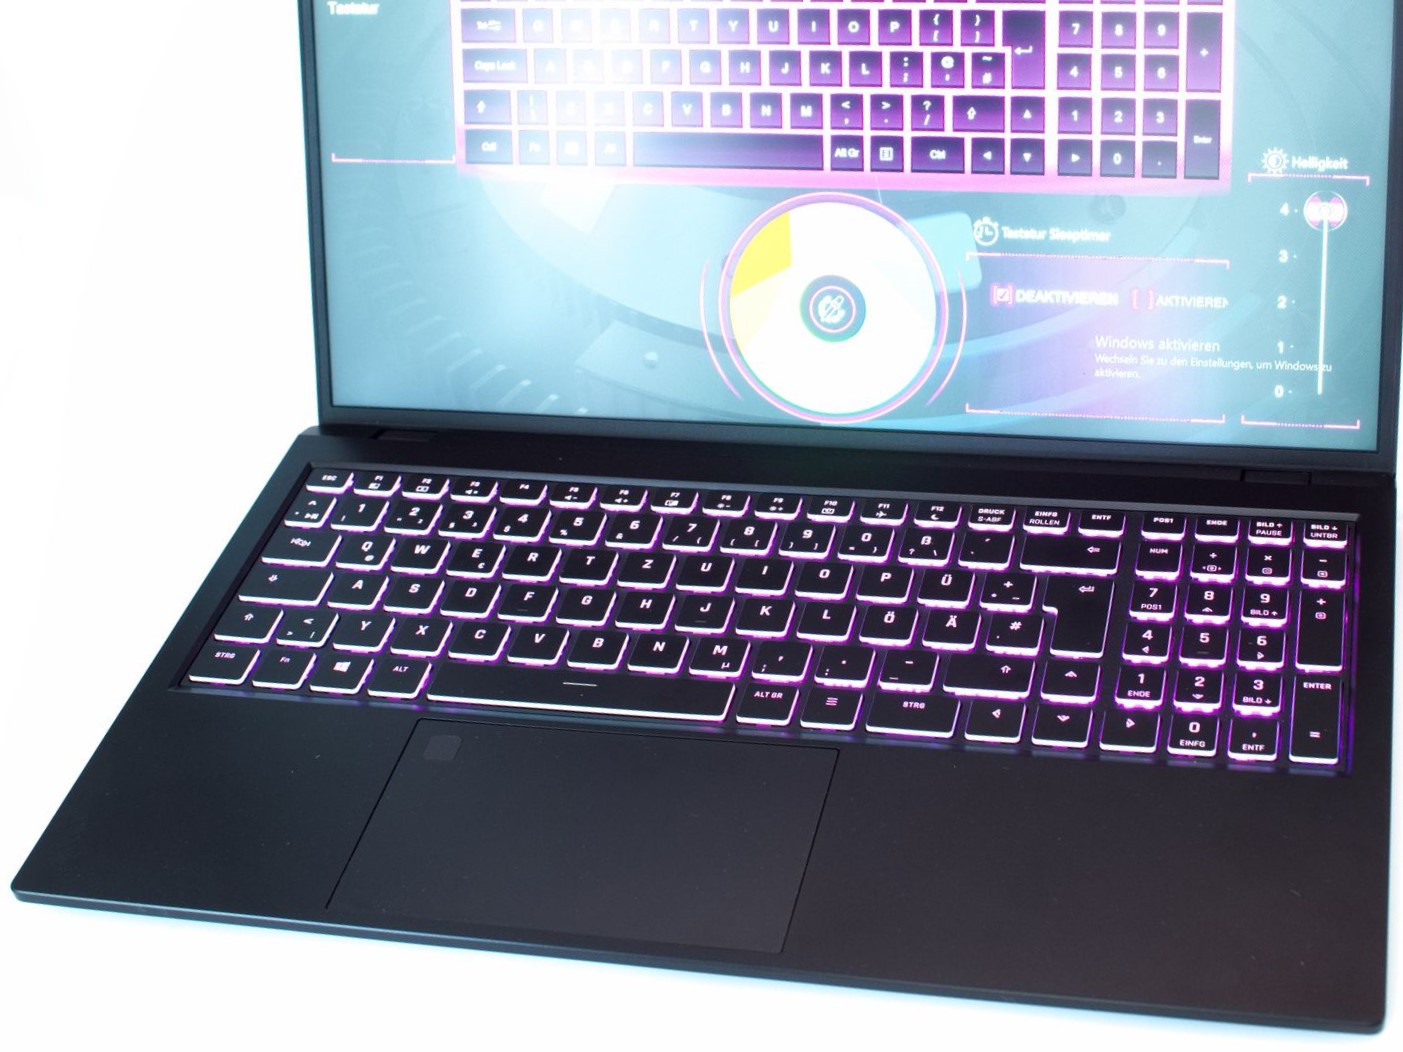
输入设备。带RGB灯
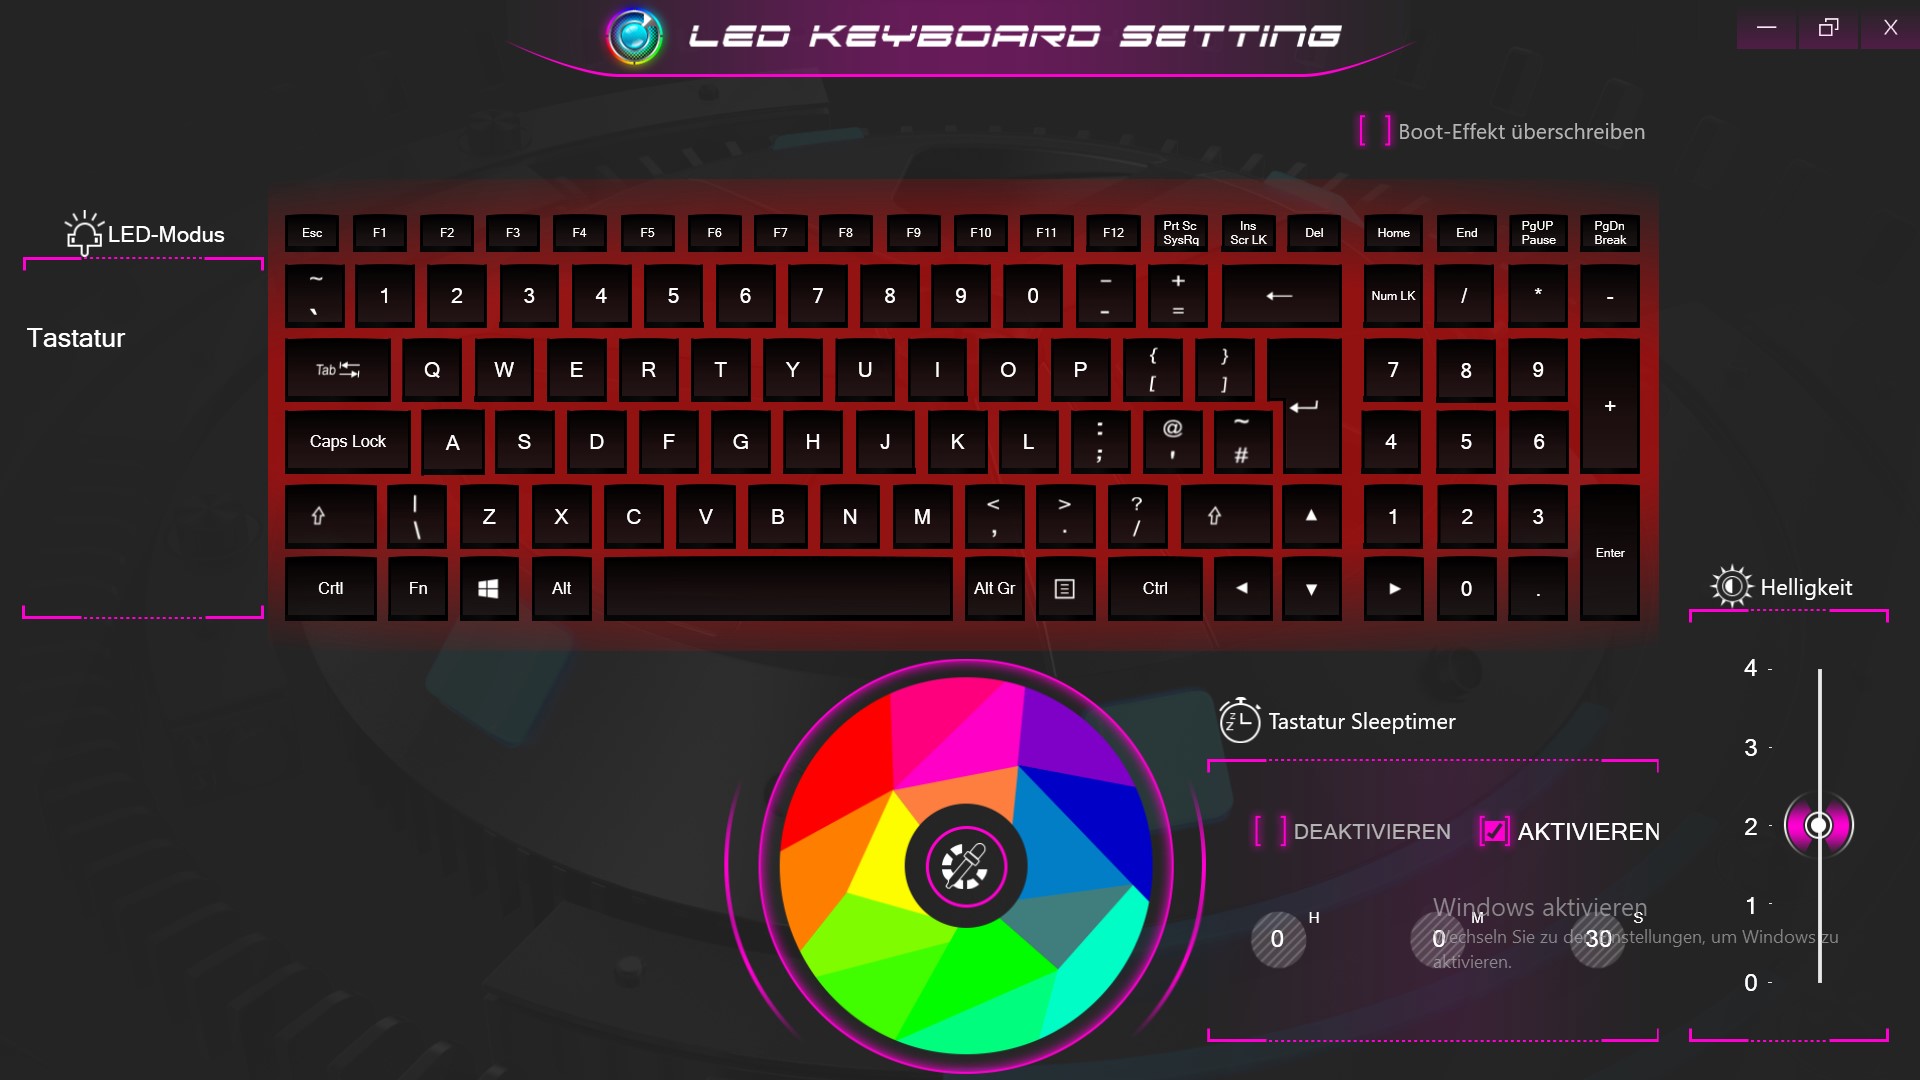
Schenker Work 15的键盘很大,有足够的键程和良好的触觉反馈,使其在打字时有一种愉快的感觉。RGB背光一开始似乎有点不寻常,但至少你可以根据需要调整照明。
12厘米×7厘米的触摸板有一个平滑的滑动表面,可以提供精确的输入。指纹传感器被集成在触摸板的左上角。
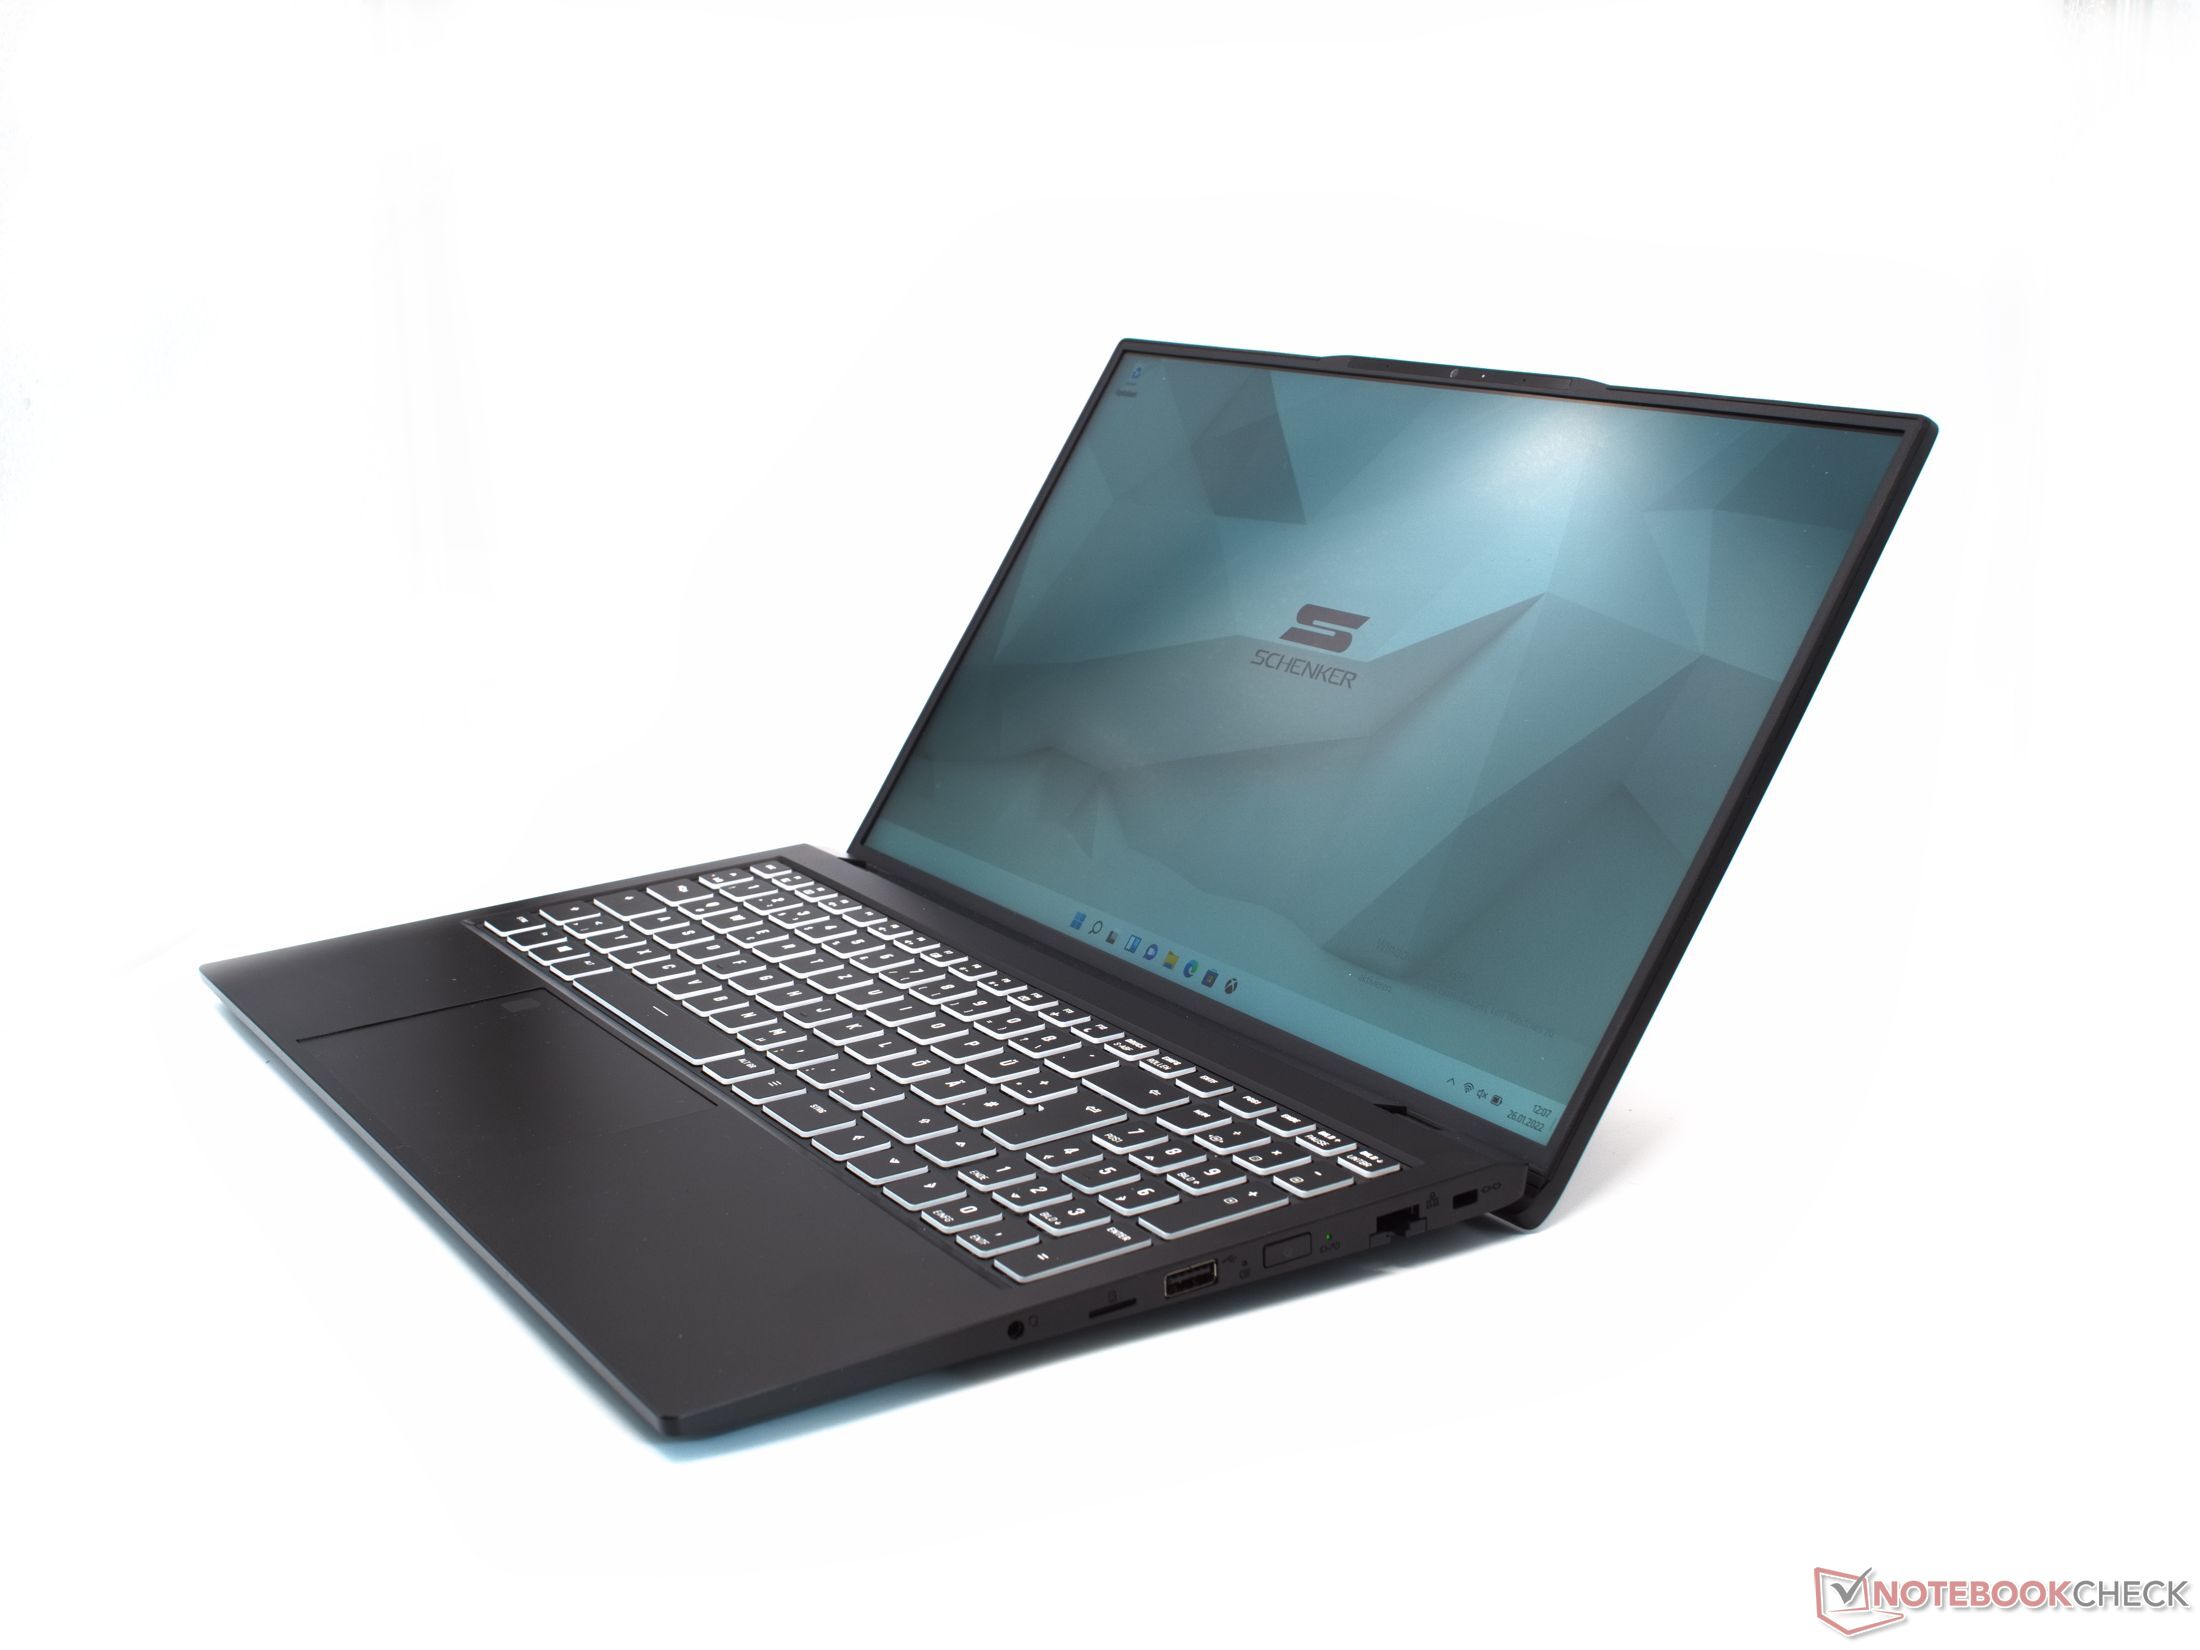
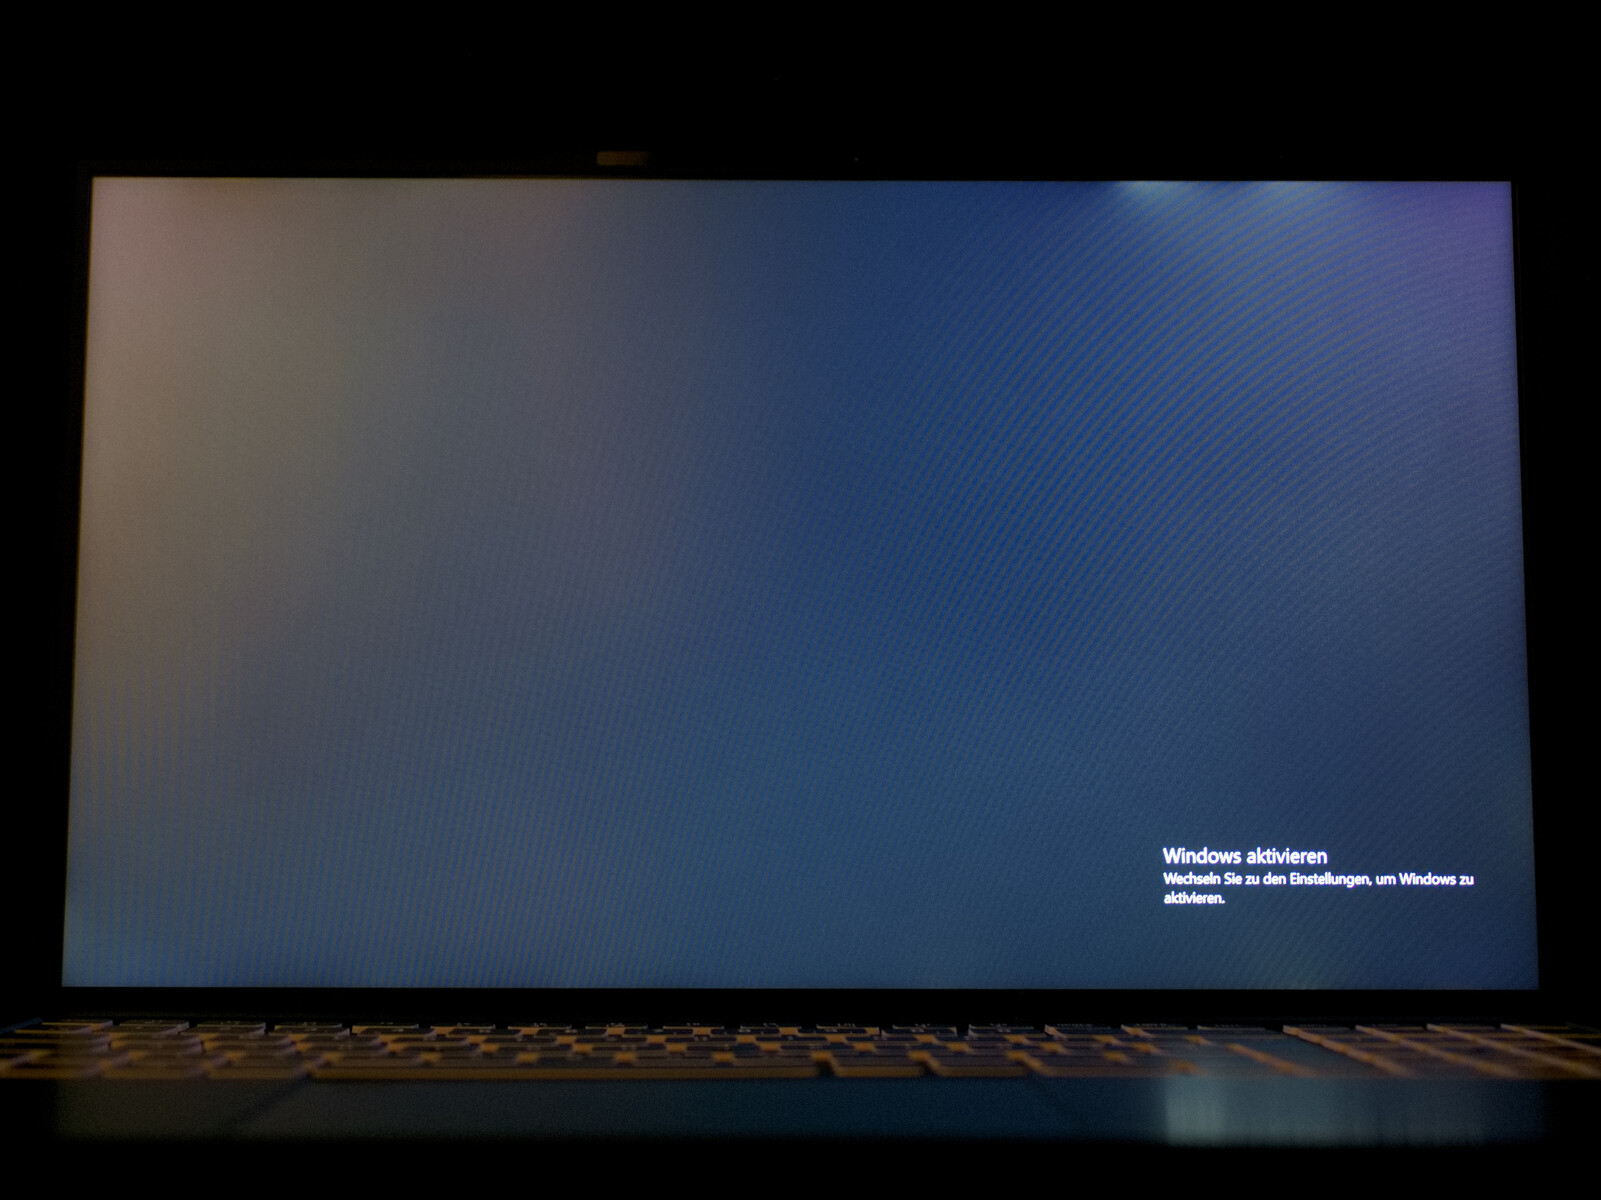
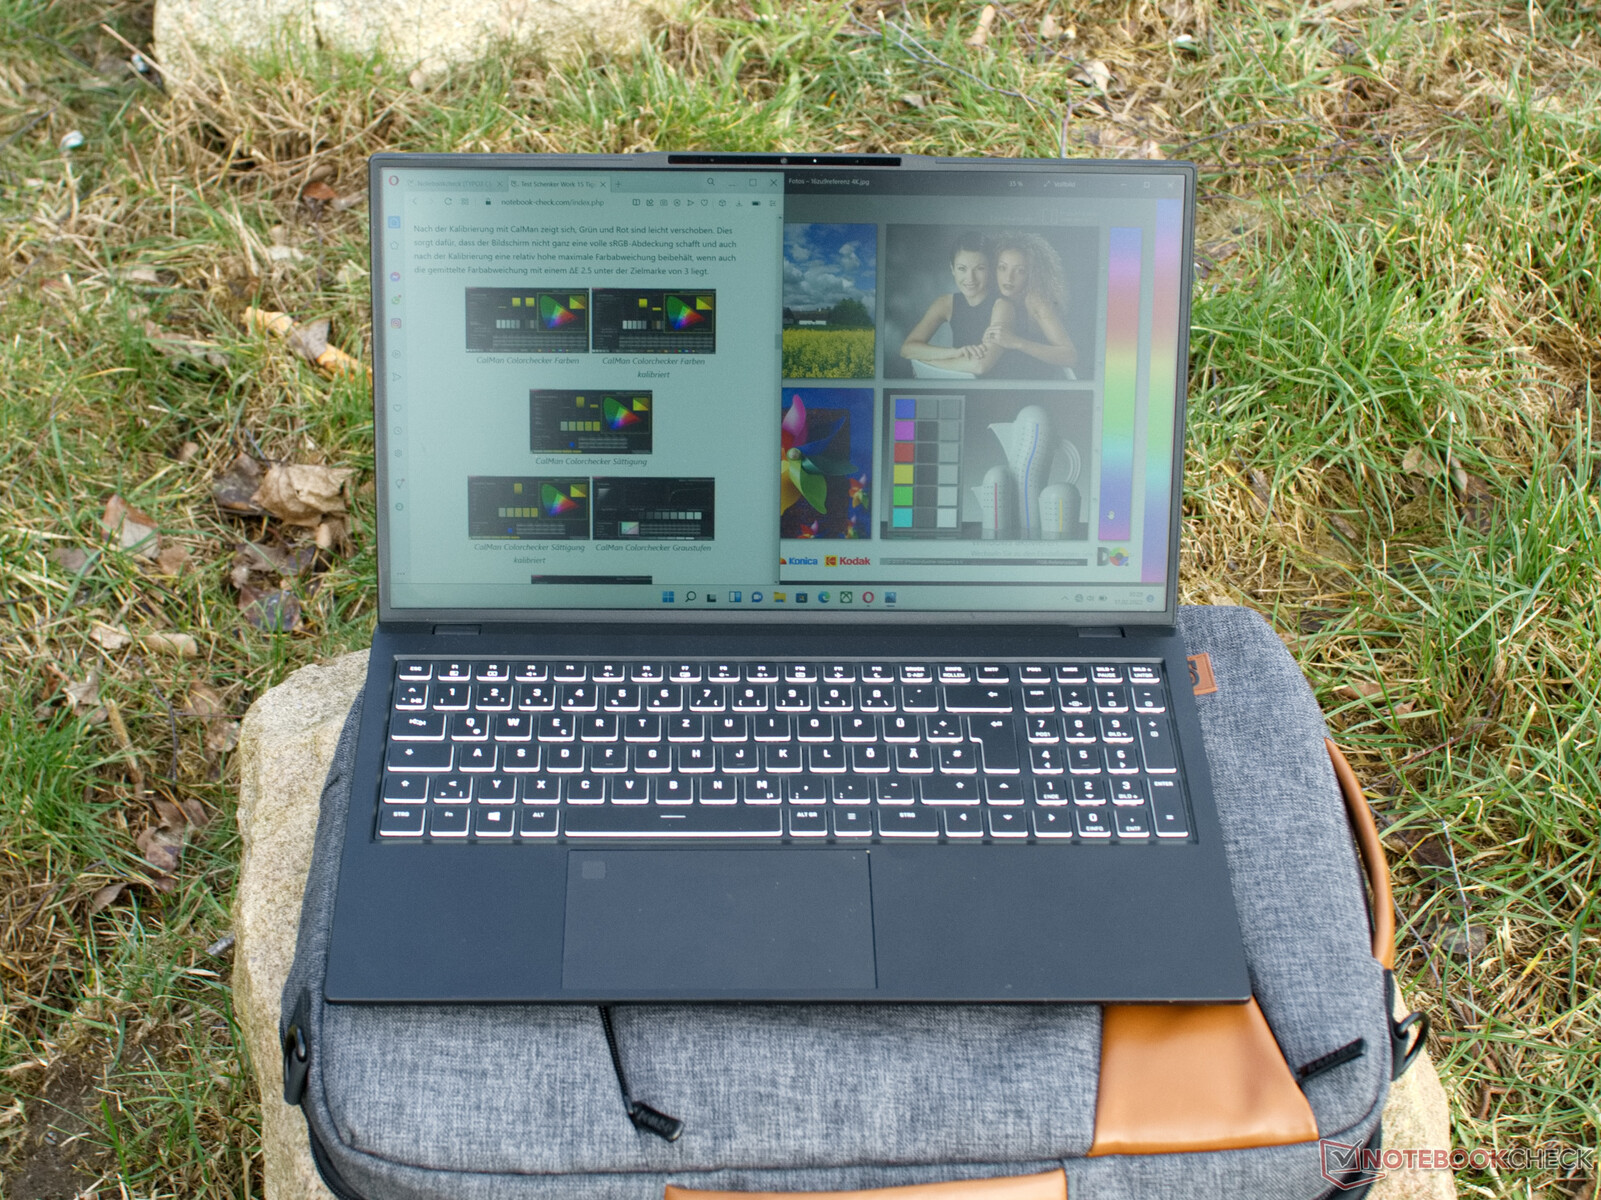
显示屏。工作15,采用哑光IPS面板
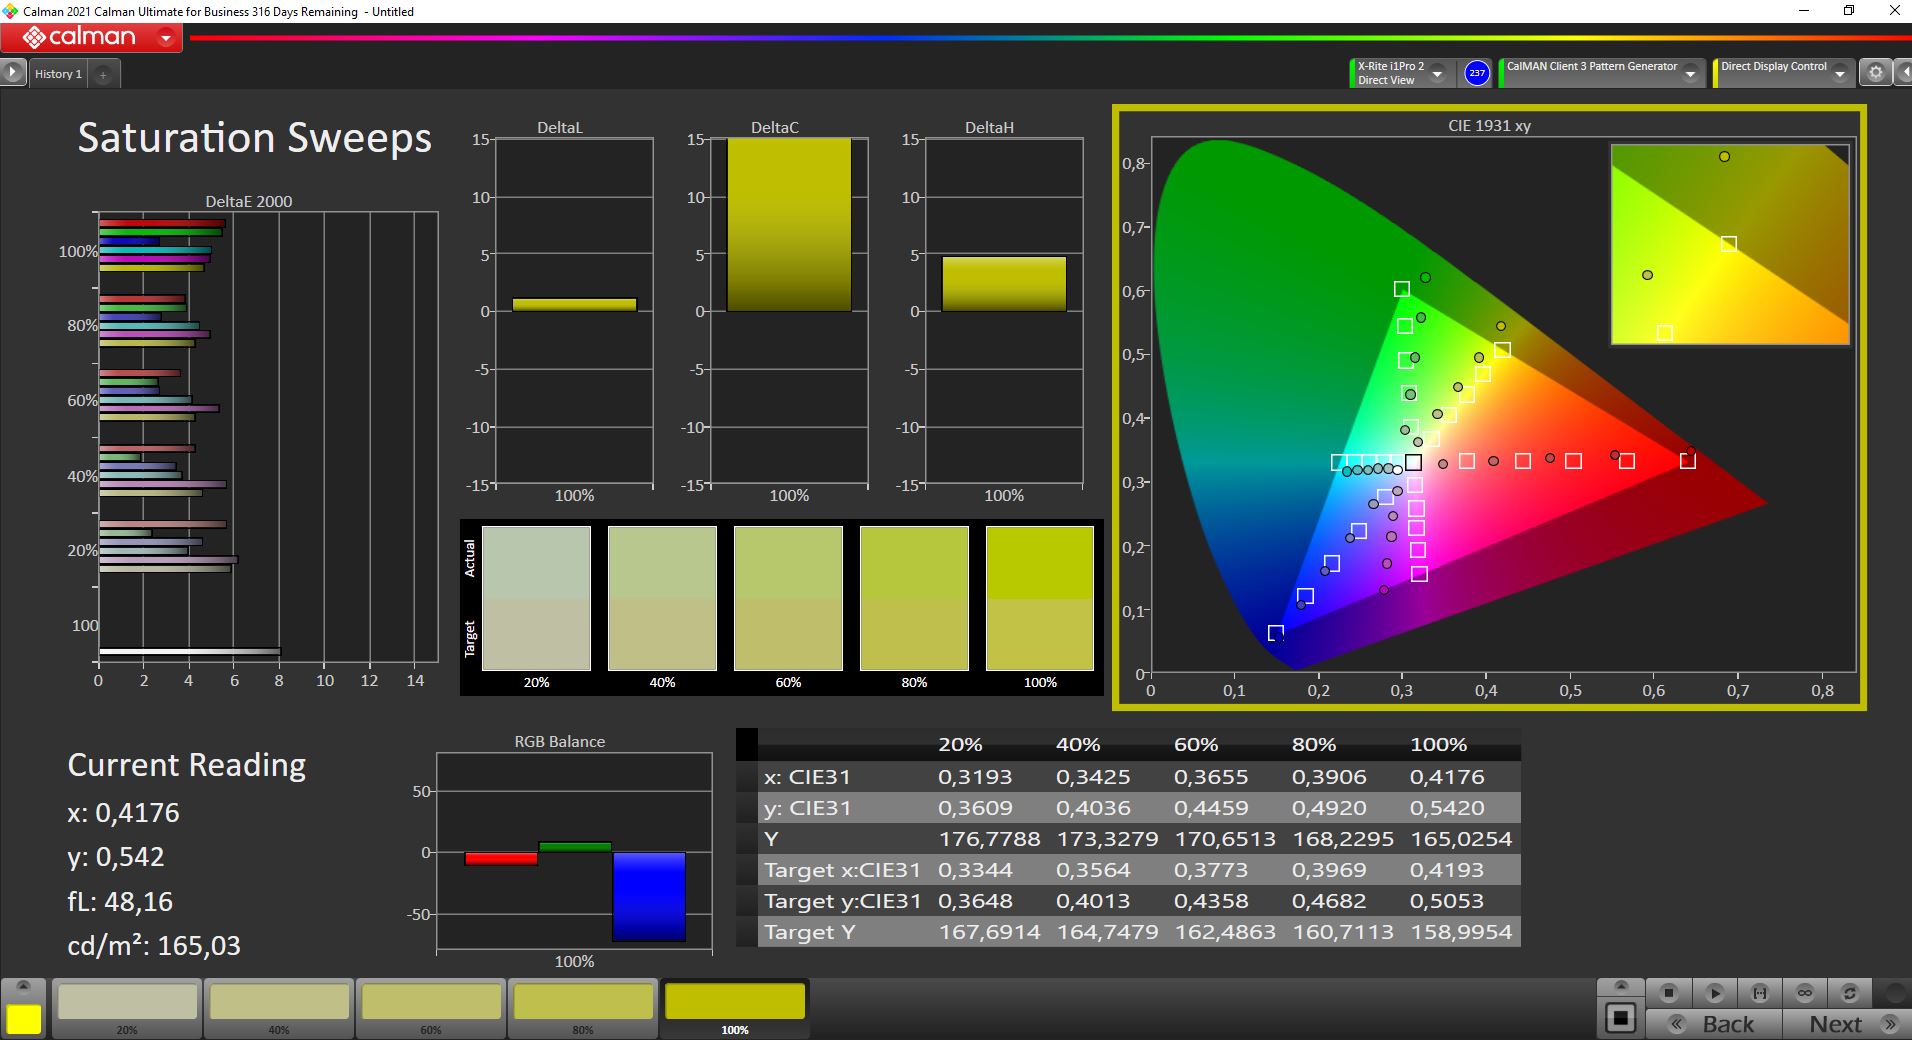
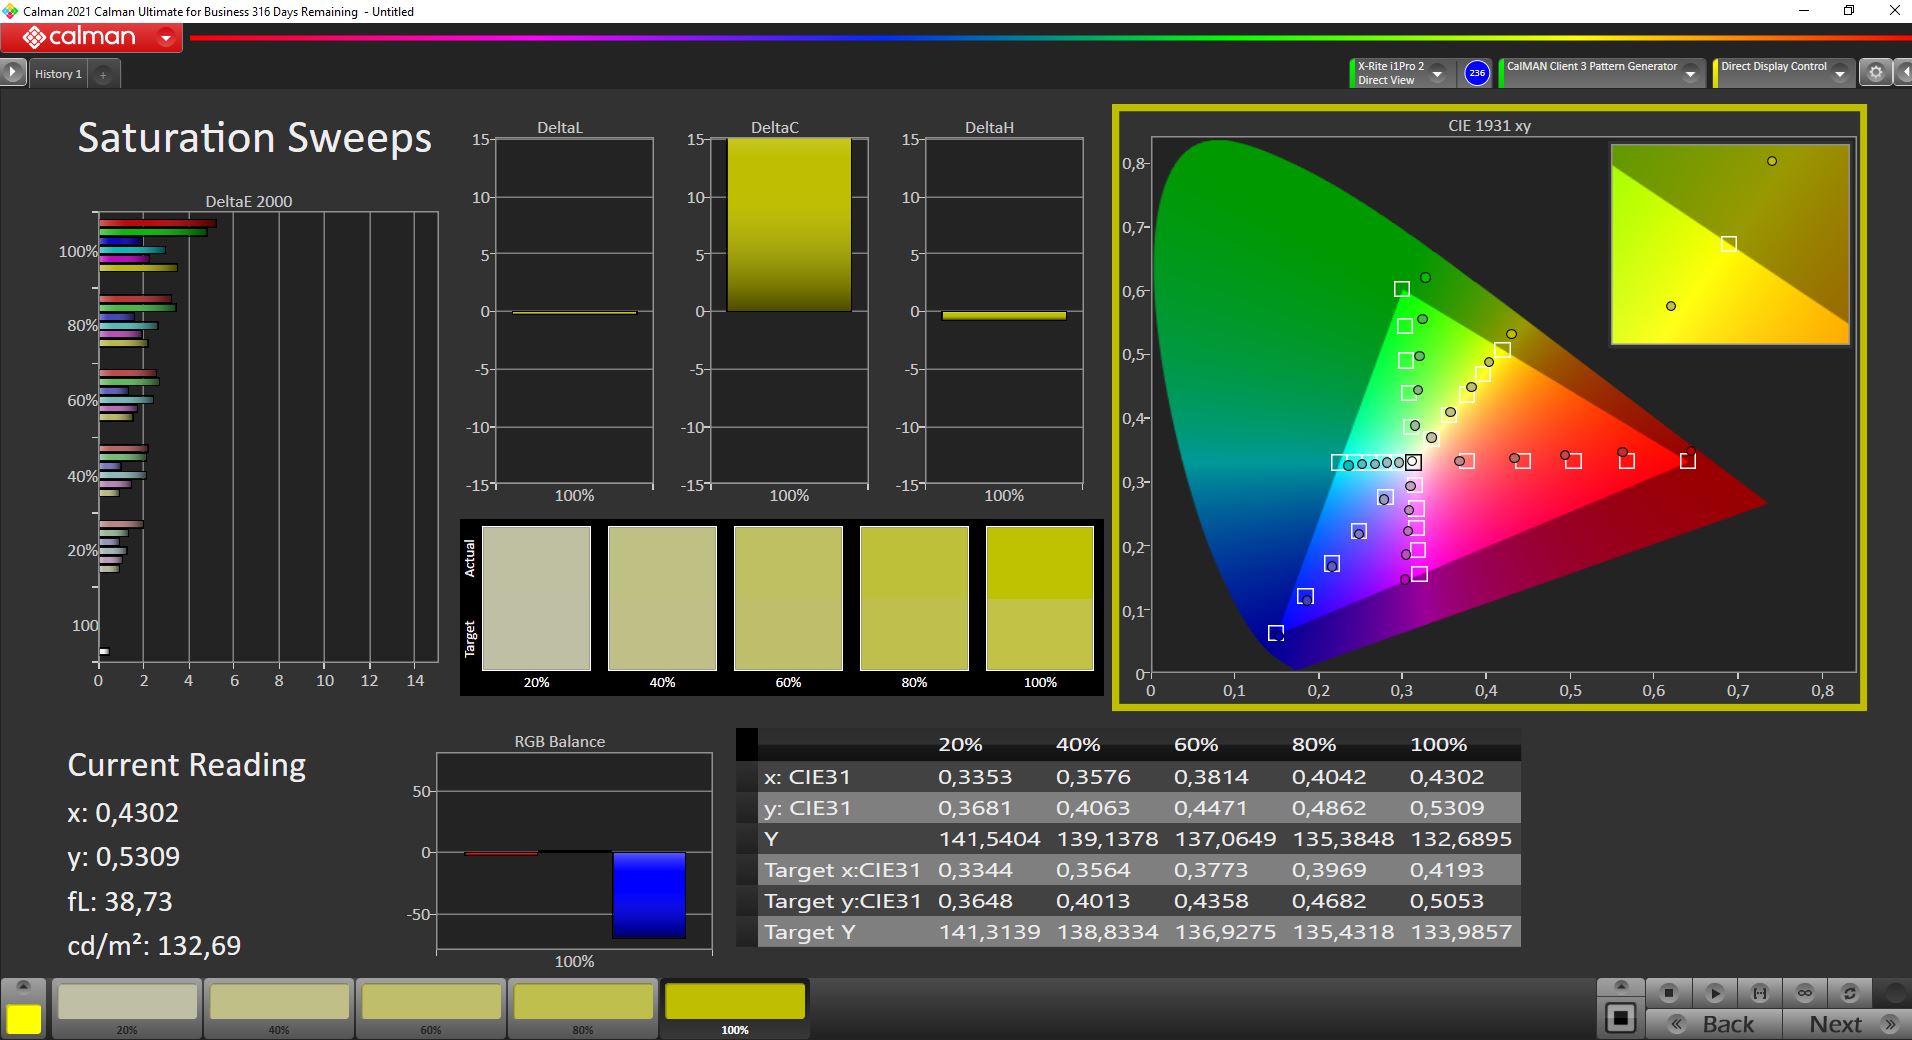
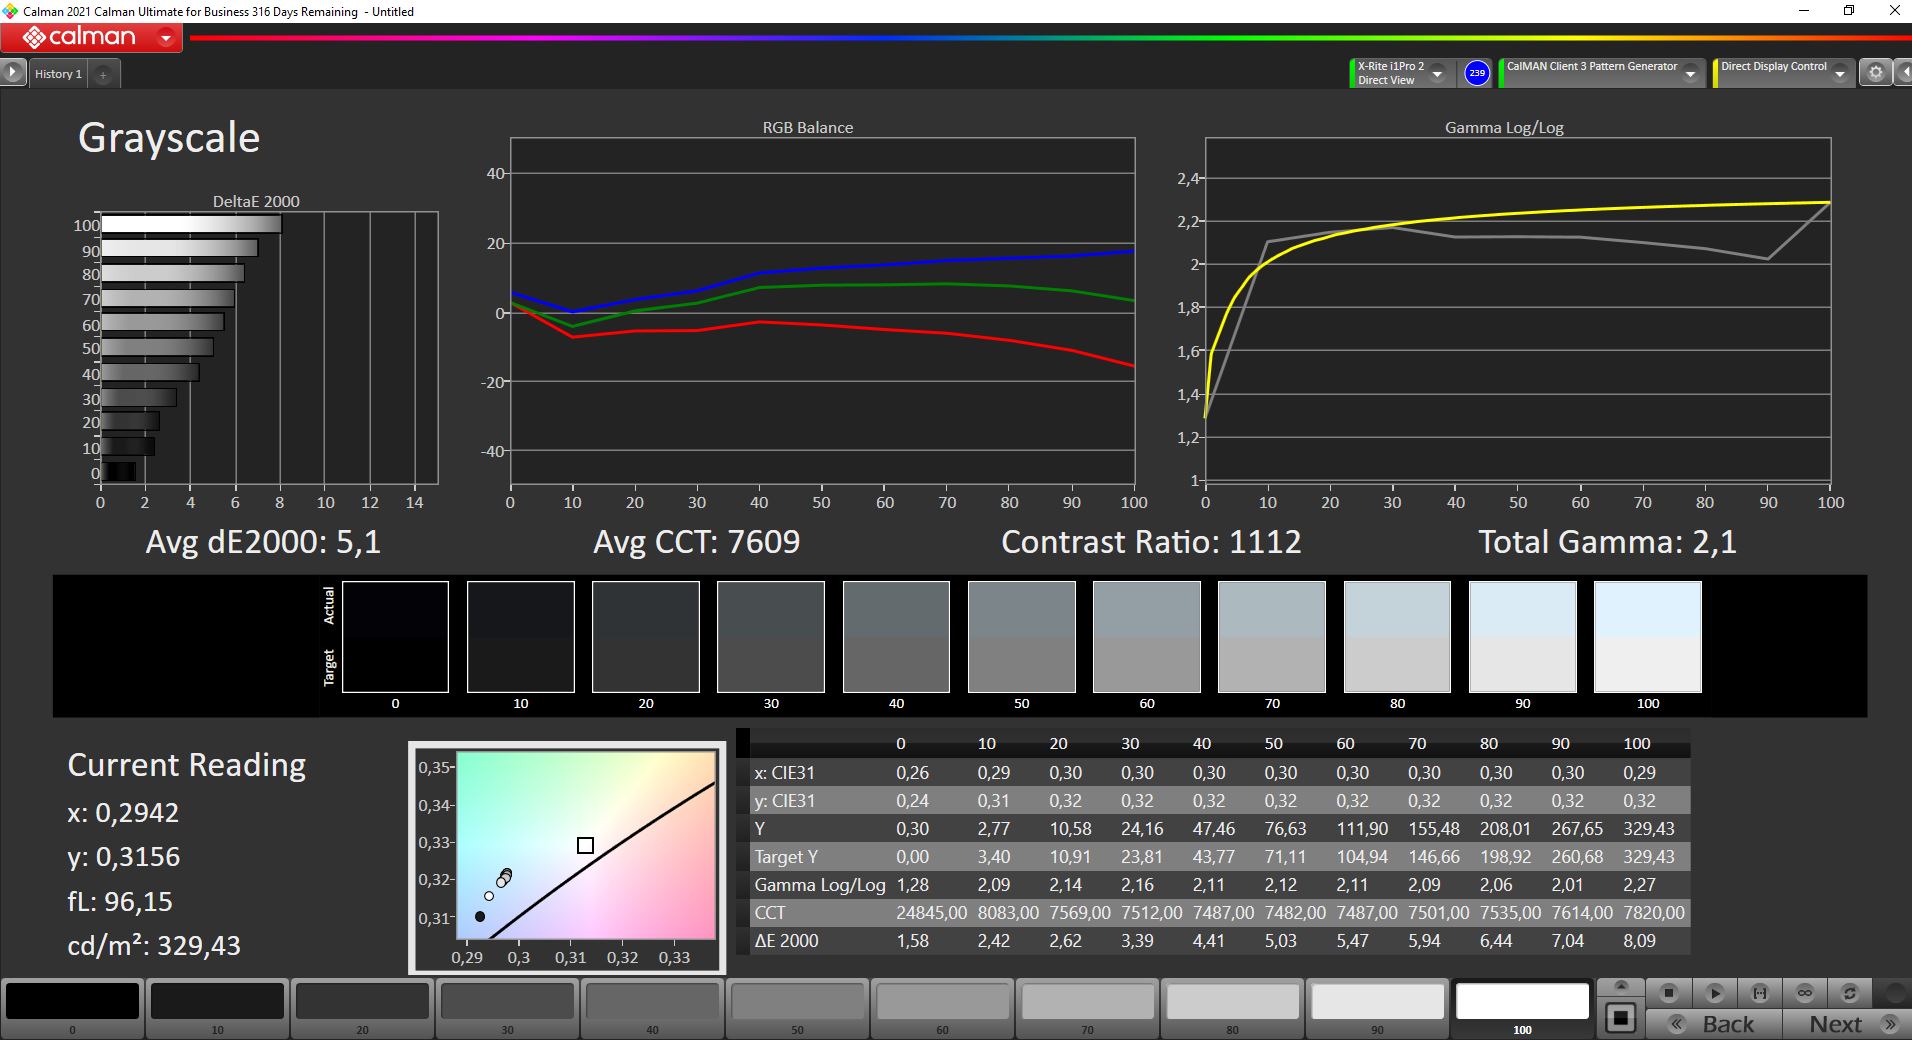
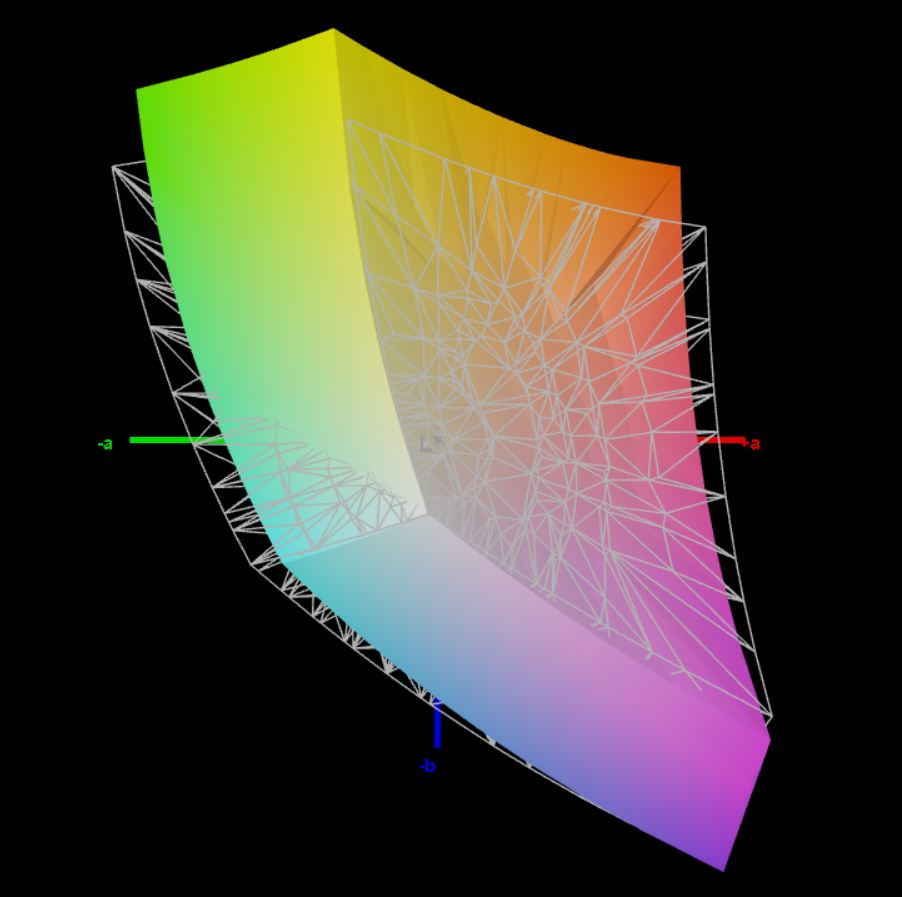
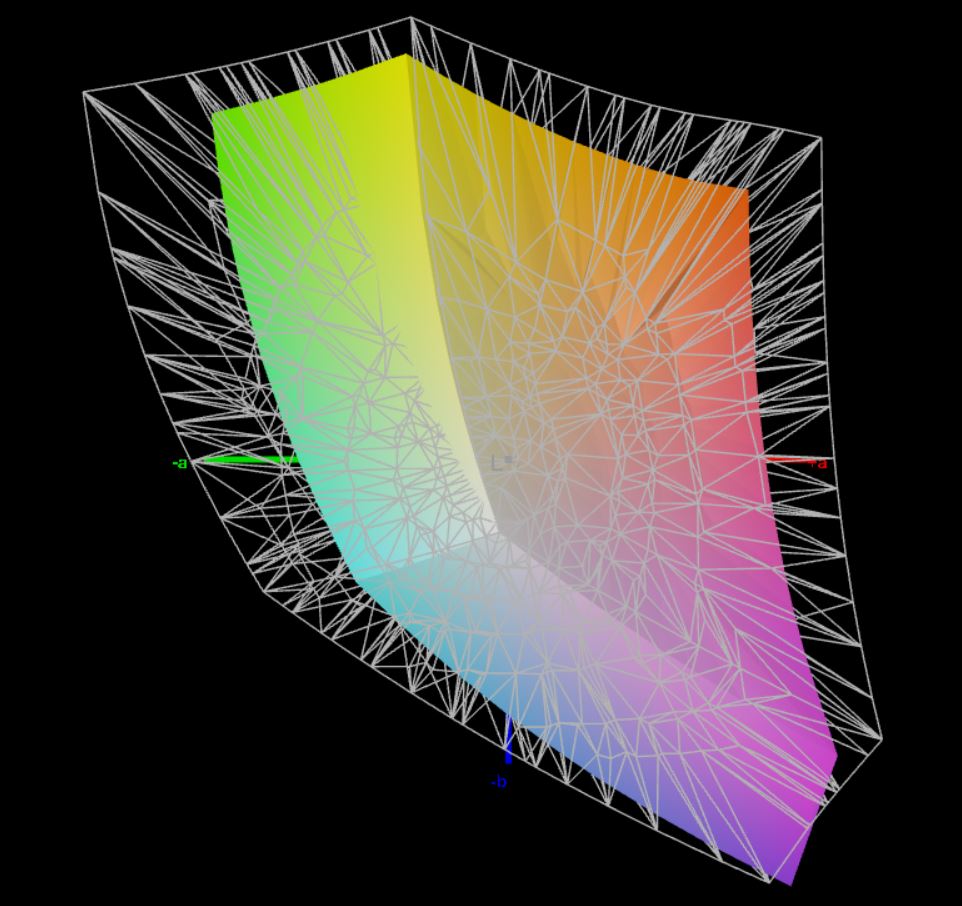
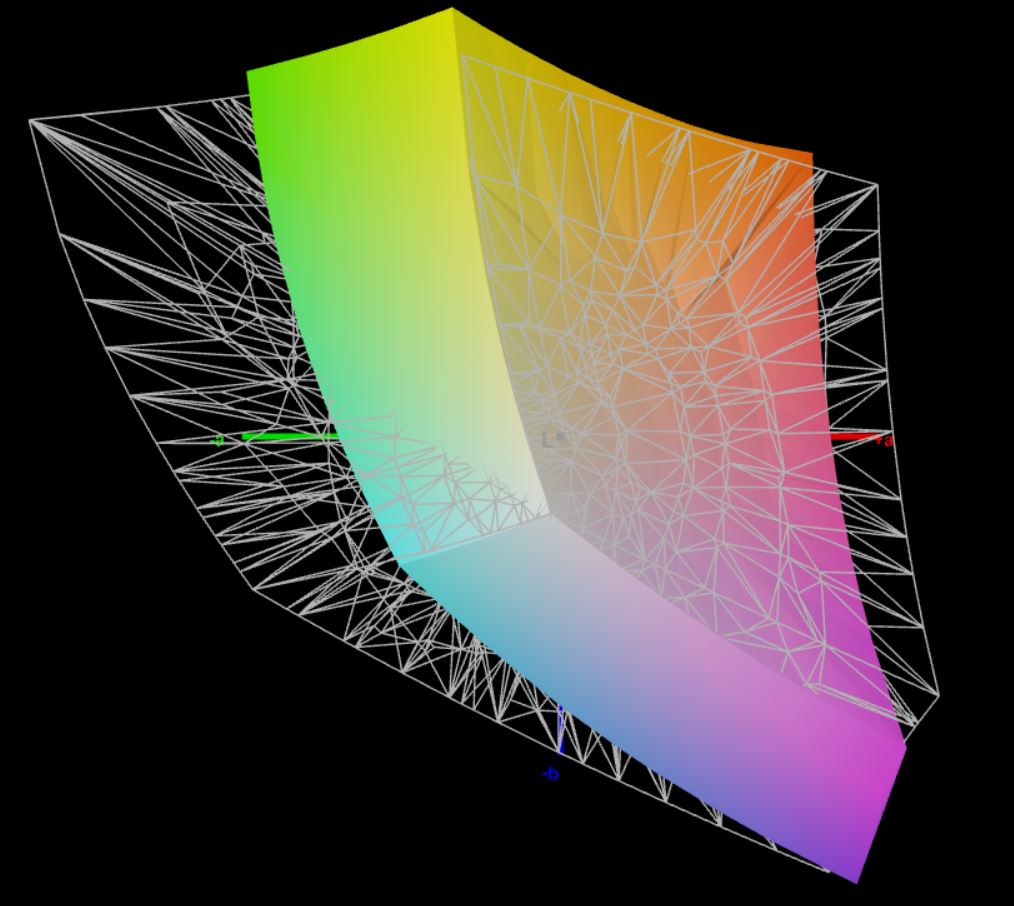
Schenker Work 15的哑光显示屏以全高清分辨率提供了良好的整体画面。超过300cd/m²的亮度确保了良好的可读性,即使是在户外。照度非常均匀,除非用长曝光时间的相机观察,否则不会发现屏幕出血的情况。86.2%的sRGB色彩空间覆盖率和色彩偏差对于办公室工作来说是足够的,但不适合用于图像编辑。在屏幕上检测不到闪烁,1097:1的对比度也很好。
| |||||||||||||||||||||||||
Brightness Distribution: 92 %
Center on Battery: 329 cd/m²
Contrast: 1097:1 (Black: 0.3 cd/m²)
ΔE ColorChecker Calman: 5.4 | ∀{0.5-29.43 Ø4.71}
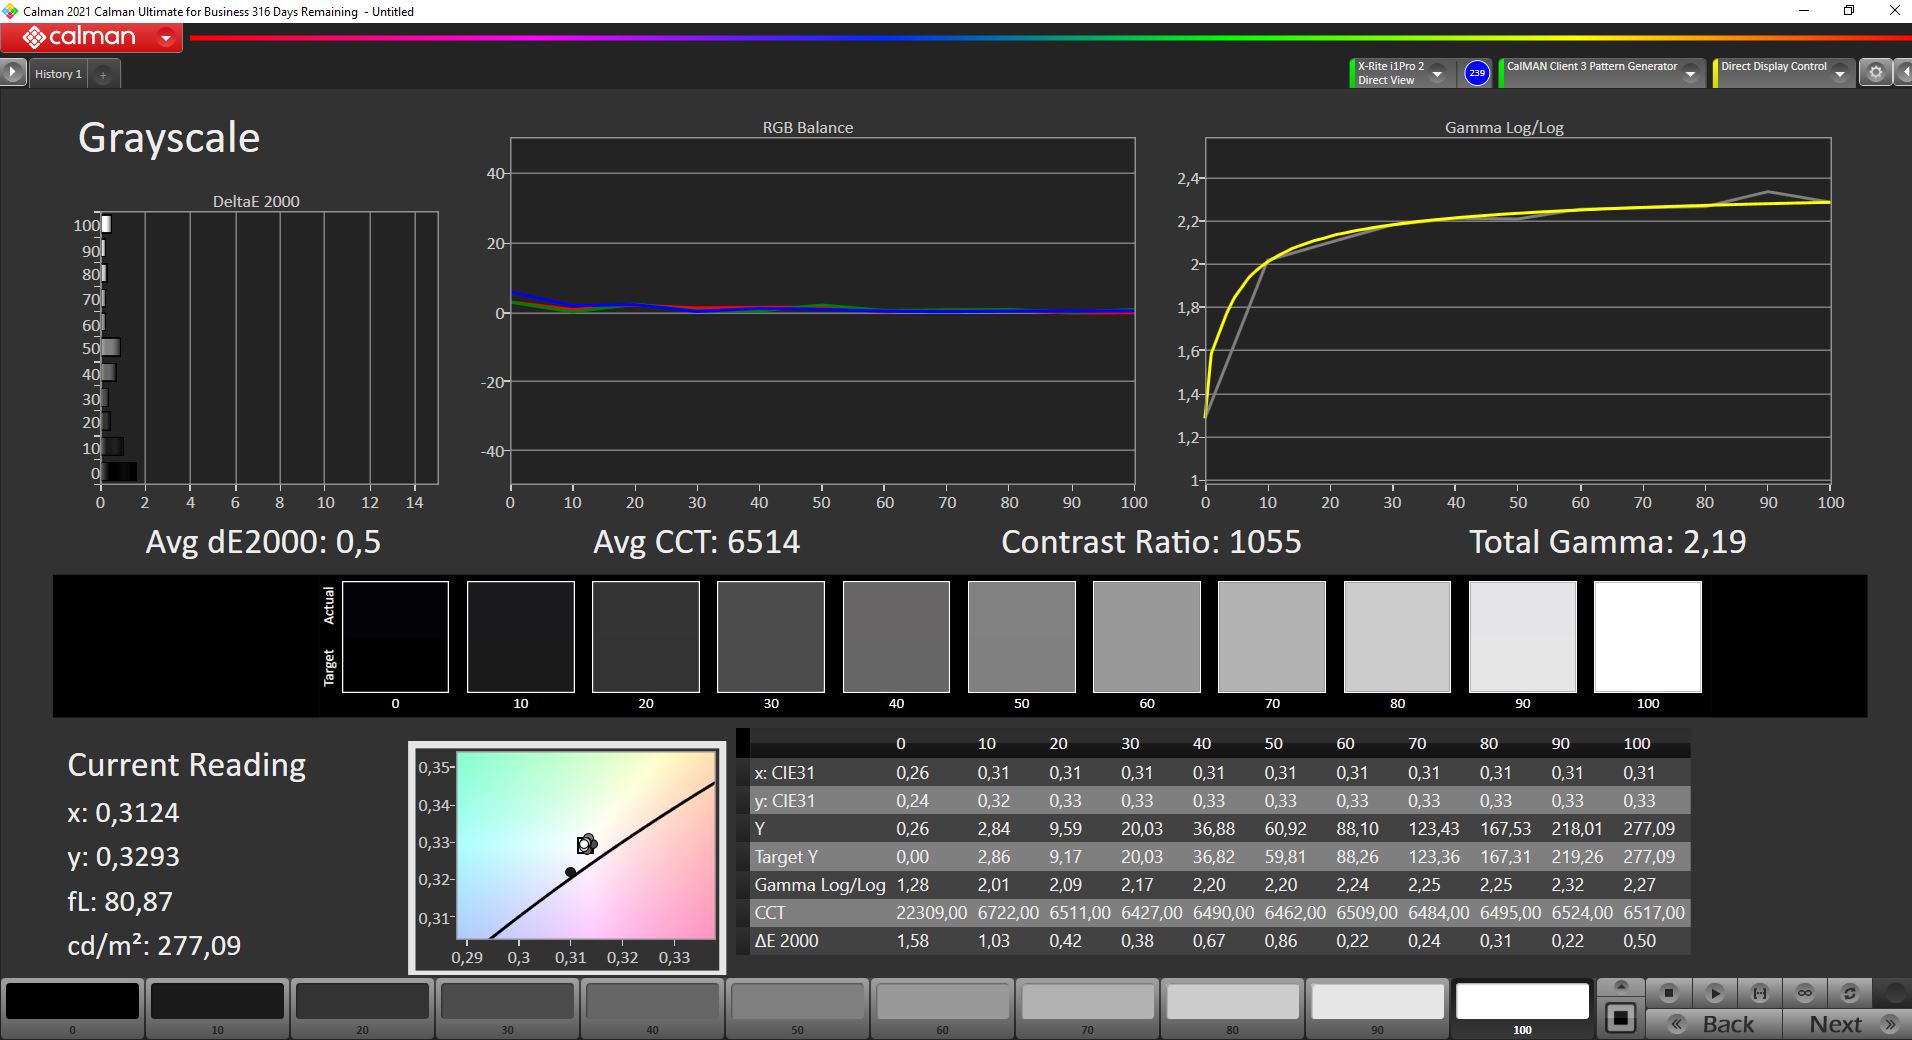
calibrated: 2.5
ΔE Greyscale Calman: 5.1 | ∀{0.09-98 Ø4.96}
62.9% AdobeRGB 1998 (Argyll 3D)
86.2% sRGB (Argyll 3D)
64.5% Display P3 (Argyll 3D)
Gamma: 2.1
CCT: 7609 K
| Schenker Work 15 Tiger Lake-H BOE07D8, IPS, 1920x1080, 15.6" | LG Gram 15Z90P-G.AA89G LG Display LP156WFC-SPY1, IPS 99% sRGB, 1920x1080, 15.6" | Dell Inspiron 15 3501 BOE NV15N3D (Dell P/N: N39X1), IPS, 1920x1080, 15.6" | Lenovo ThinkPad E15 G3-20YG003UGE B156HAN02.1, IPS, 1920x1080, 15.6" | Asus VivoBook S15 D533UA Chi Mei N156HCA-EAB, IPS, 1920x1080, 15.6" | HP Pavilion x360 15-er0155ng AU Optronics AUOC48A, IPS, 1920x1080, 15.6" | |
|---|---|---|---|---|---|---|
| Display | 2% | -35% | -34% | -28% | -35% | |
| Display P3 Coverage (%) | 64.5 | 62 -4% | 39.4 -39% | 40.3 -38% | 43.6 -32% | 39.8 -38% |
| sRGB Coverage (%) | 86.2 | 92 7% | 58.7 -32% | 60.2 -30% | 65.2 -24% | 59.7 -31% |
| AdobeRGB 1998 Coverage (%) | 62.9 | 64 2% | 40.7 -35% | 41.6 -34% | 45 -28% | 41.1 -35% |
| Response Times | 44% | 18% | 20% | 58% | 24% | |
| Response Time Grey 50% / Grey 80% * (ms) | 58.4 ? | 36 ? 38% | 43 ? 26% | 44 ? 25% | 18 ? 69% | 42 ? 28% |
| Response Time Black / White * (ms) | 35.2 ? | 18 ? 49% | 32 ? 9% | 30.4 ? 14% | 19 ? 46% | 28 ? 20% |
| PWM Frequency (Hz) | 1000 ? | |||||
| Screen | 6% | 20% | -4% | -10% | -10% | |
| Brightness middle (cd/m²) | 329 | 343 4% | 271 -18% | 347 5% | 289 -12% | 249 -24% |
| Brightness (cd/m²) | 316 | 311 -2% | 263 -17% | 329 4% | 267 -16% | 246 -22% |
| Brightness Distribution (%) | 92 | 86 -7% | 92 0% | 93 1% | 85 -8% | 93 1% |
| Black Level * (cd/m²) | 0.3 | 0.46 -53% | 0.15 50% | 0.25 17% | 0.56 -87% | 0.29 3% |
| Contrast (:1) | 1097 | 746 -32% | 1807 65% | 1388 27% | 516 -53% | 859 -22% |
| Colorchecker dE 2000 * | 5.4 | 3.5 35% | 4.83 11% | 4.7 13% | 3.96 27% | 6.01 -11% |
| Colorchecker dE 2000 max. * | 10.1 | 6.25 38% | 7 31% | 19.4 -92% | 6.76 33% | 11.01 -9% |
| Colorchecker dE 2000 calibrated * | 2.5 | 1.17 53% | 4.4 -76% | |||
| Greyscale dE 2000 * | 5.1 | 4.35 15% | 3.36 34% | 1.7 67% | 3.43 33% | 4.67 8% |
| Gamma | 2.1 105% | 2.55 86% | 2.56 86% | 2.2 100% | 2.28 96% | 2.79 79% |
| CCT | 7609 85% | 6016 108% | 6764 96% | 6475 100% | 7191 90% | 6390 102% |
| Color Space (Percent of AdobeRGB 1998) (%) | 42 | 38 | ||||
| Color Space (Percent of sRGB) (%) | 65 | 59 | ||||
| Total Average (Program / Settings) | 17% /
10% | 1% /
7% | -6% /
-7% | 7% /
-4% | -7% /
-10% |
* ... smaller is better
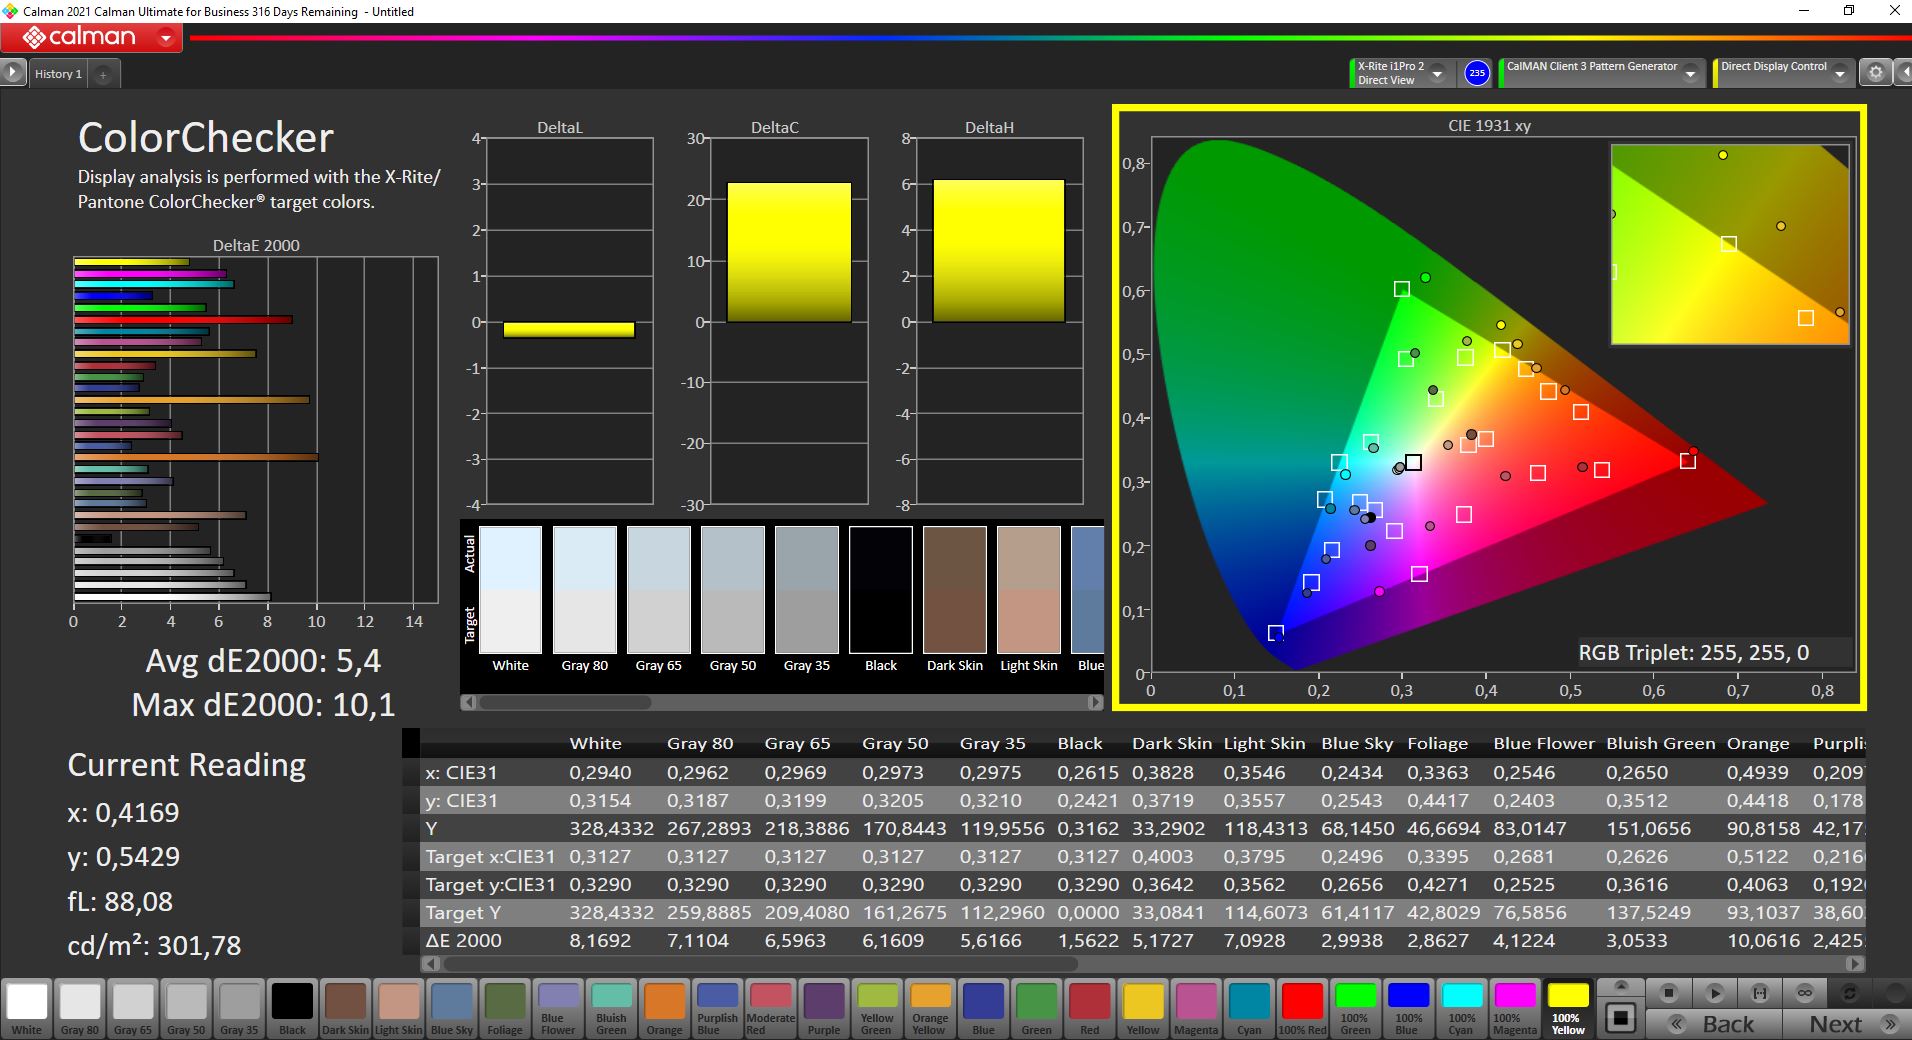
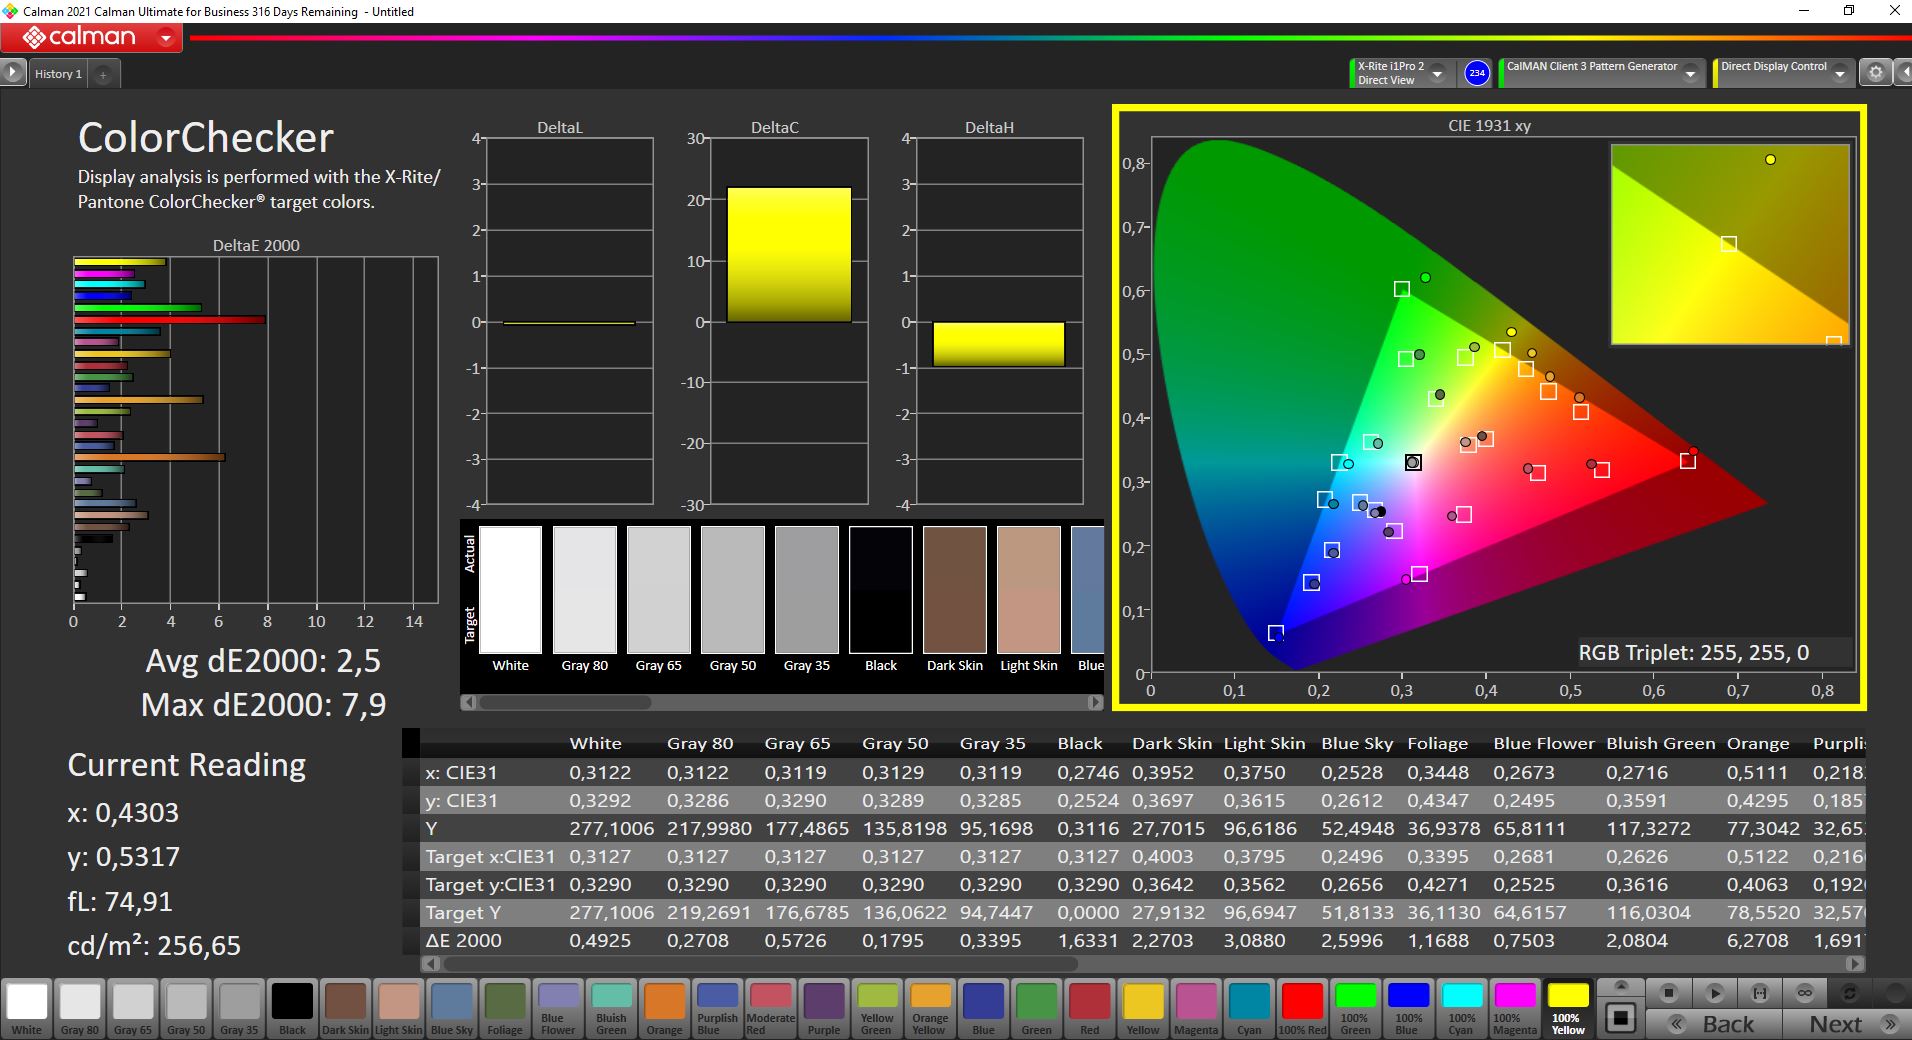
用CalMan进行的开箱即用的色彩检查显示绿色和红色有轻微的偏移。这表明屏幕并没有完全实现sRGB覆盖,即使在校准后,它仍然保持着相对较高的最大色彩偏差。然而,ΔΕ2.5的平均色彩偏差仍然低于3的目标标记。
Display Response Times
| ↔ Response Time Black to White | ||
|---|---|---|
| 35.2 ms ... rise ↗ and fall ↘ combined | ↗ 18 ms rise | 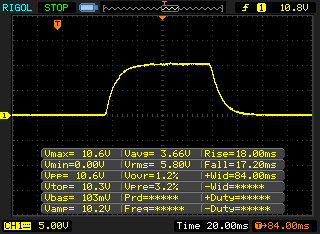 |
| ↘ 17.2 ms fall | ||
| The screen shows slow response rates in our tests and will be unsatisfactory for gamers. In comparison, all tested devices range from 0.1 (minimum) to 240 (maximum) ms. » 93 % of all devices are better. This means that the measured response time is worse than the average of all tested devices (19.8 ms). | ||
| ↔ Response Time 50% Grey to 80% Grey | ||
| 58.4 ms ... rise ↗ and fall ↘ combined | ↗ 26.8 ms rise | 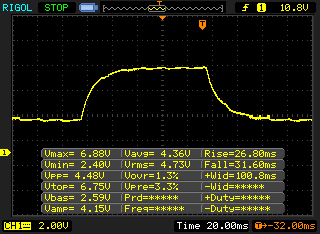 |
| ↘ 31.6 ms fall | ||
| The screen shows slow response rates in our tests and will be unsatisfactory for gamers. In comparison, all tested devices range from 0.165 (minimum) to 636 (maximum) ms. » 95 % of all devices are better. This means that the measured response time is worse than the average of all tested devices (31 ms). | ||
Screen Flickering / PWM (Pulse-Width Modulation)
| Screen flickering / PWM not detected | 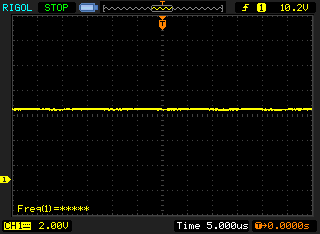 | ||
In comparison: 52 % of all tested devices do not use PWM to dim the display. If PWM was detected, an average of 7754 (minimum: 5 - maximum: 343500) Hz was measured. | |||
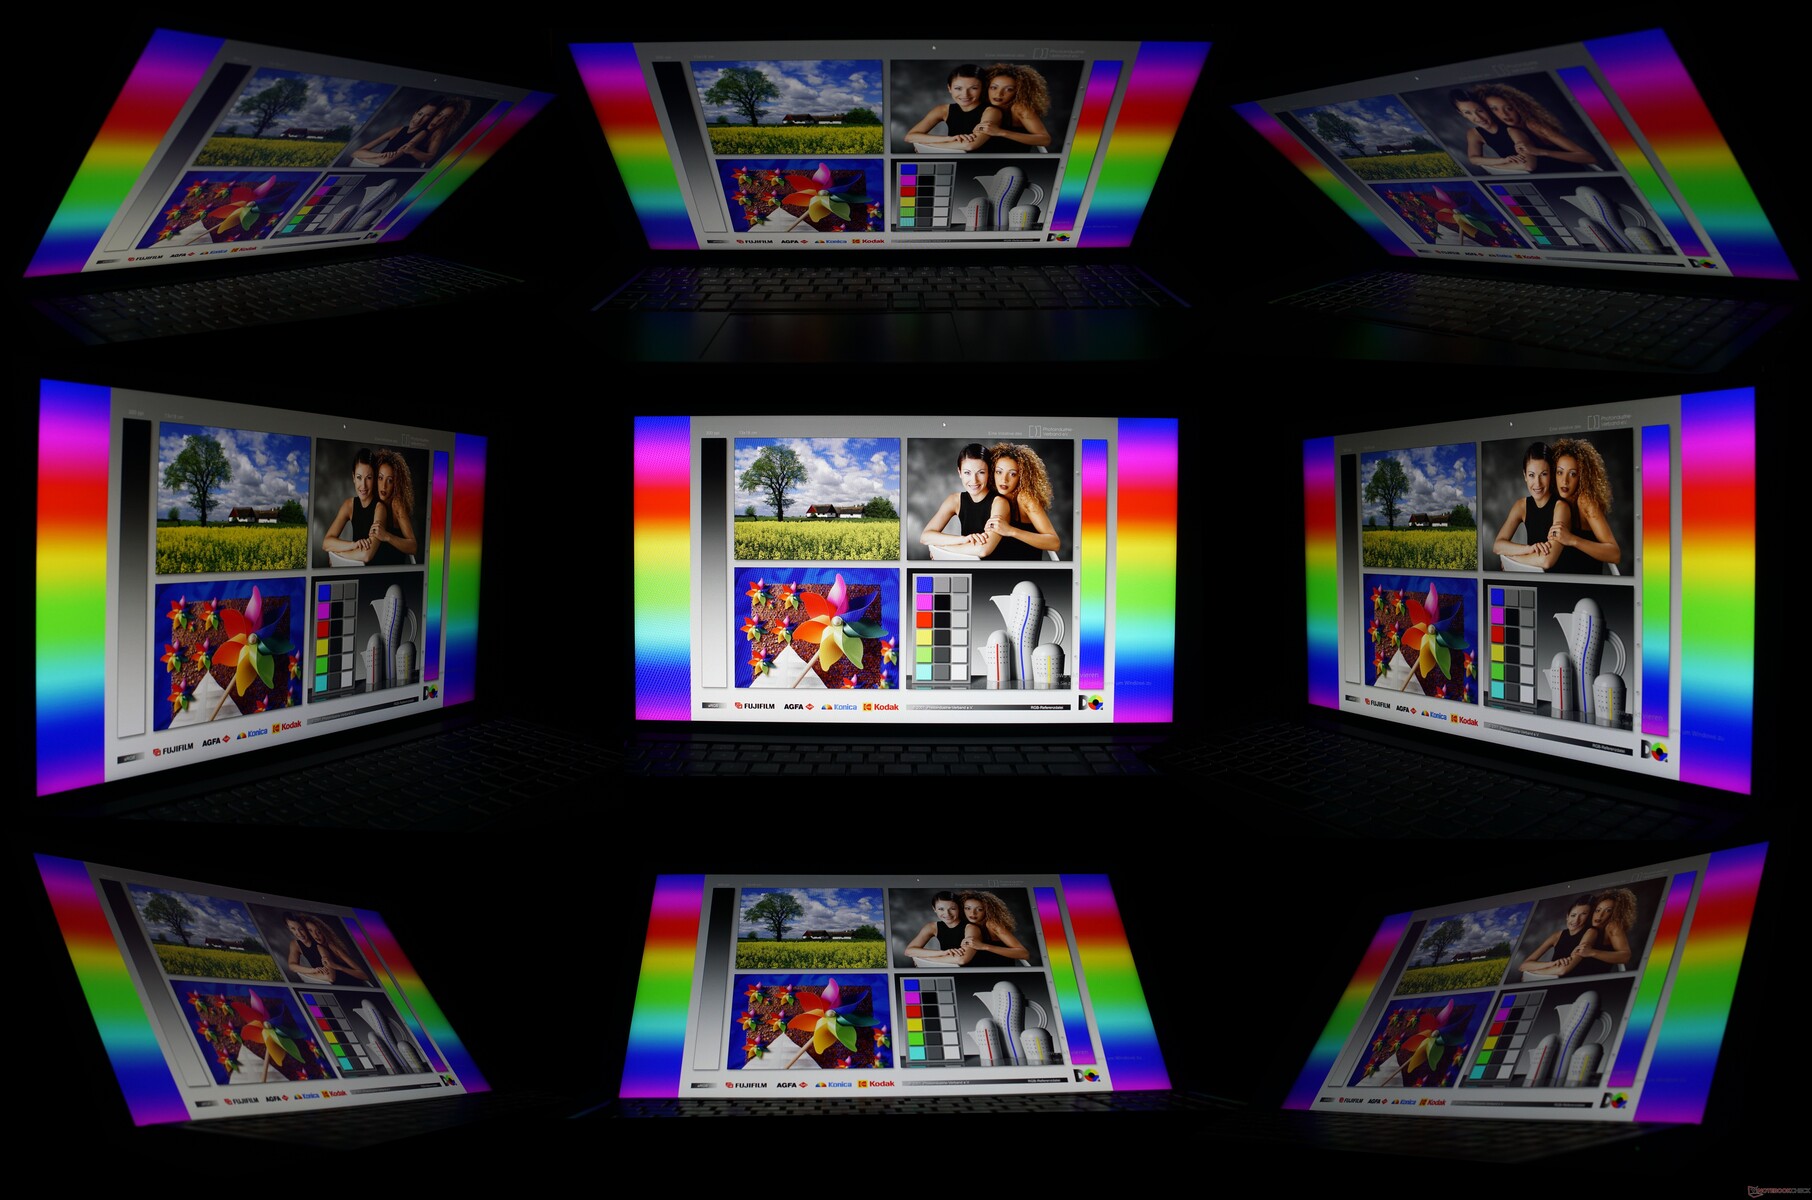
只有当太阳直接反射到显示屏的哑光表面时,在户外阅读才会变得困难。这台办公用笔记本电脑在户外和从各种角度都能显示出良好的画面。
绩效。态度问题
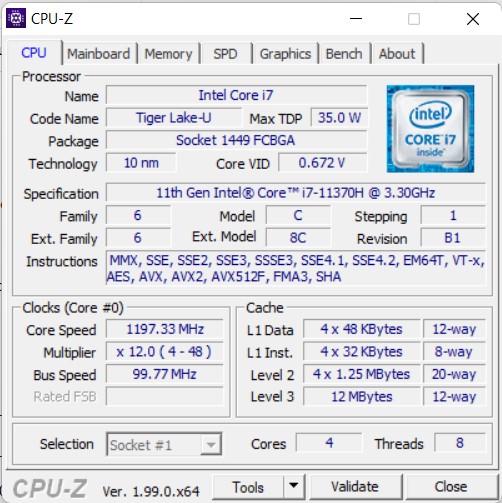
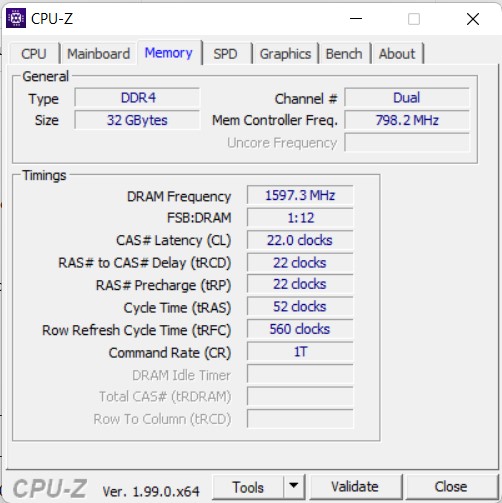
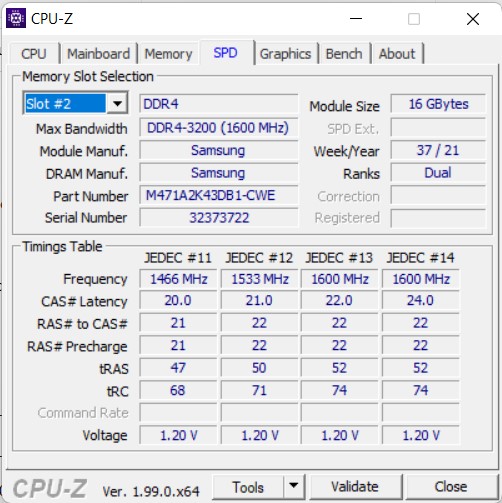
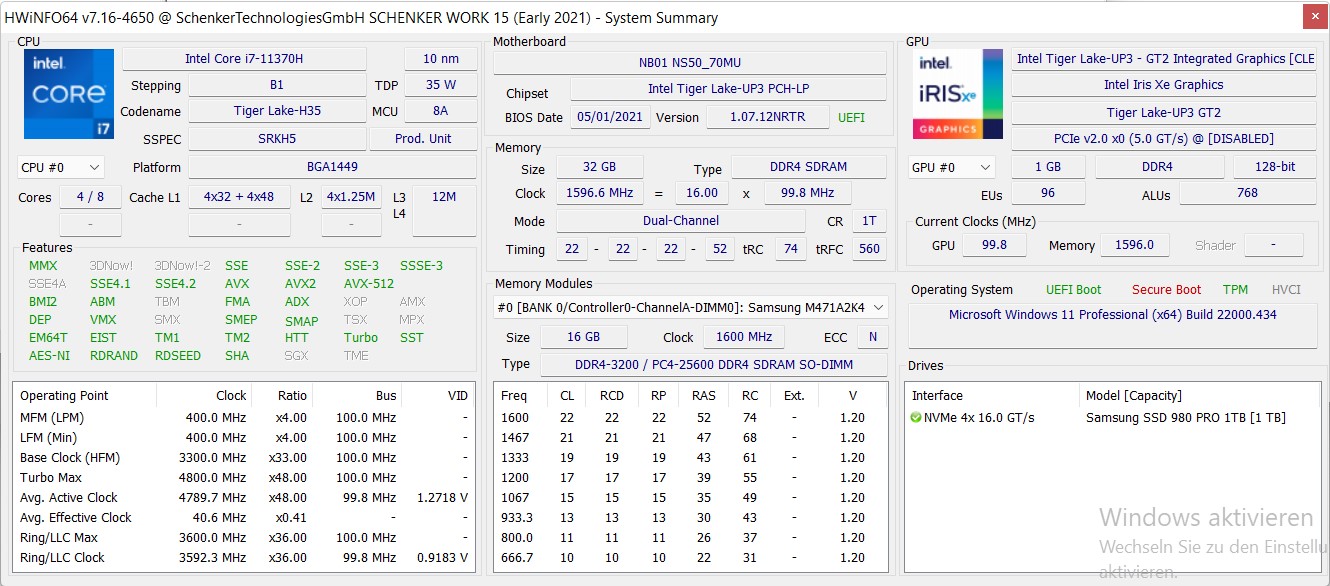
由于有许多可自由选择的配置,Schenker Work 15可以适应许多使用领域。我们的测试设备配备了英特尔酷睿i7-11370H,32GB工作内存,以及1TB快速NVMe固态硬盘。进一步的配置选项有 英特尔酷睿i5-11300H,8至32GB工作内存,最高8TB的不同SSD存储,以及许多其他保修、WLAN、键盘和操作系统的选项。
测试条件
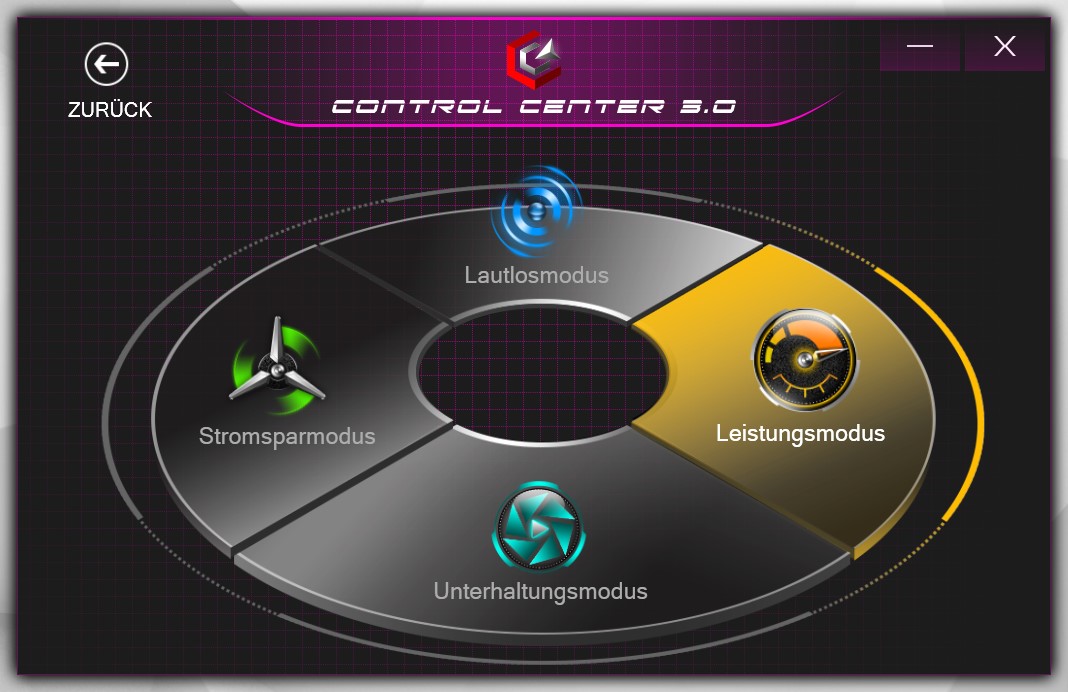
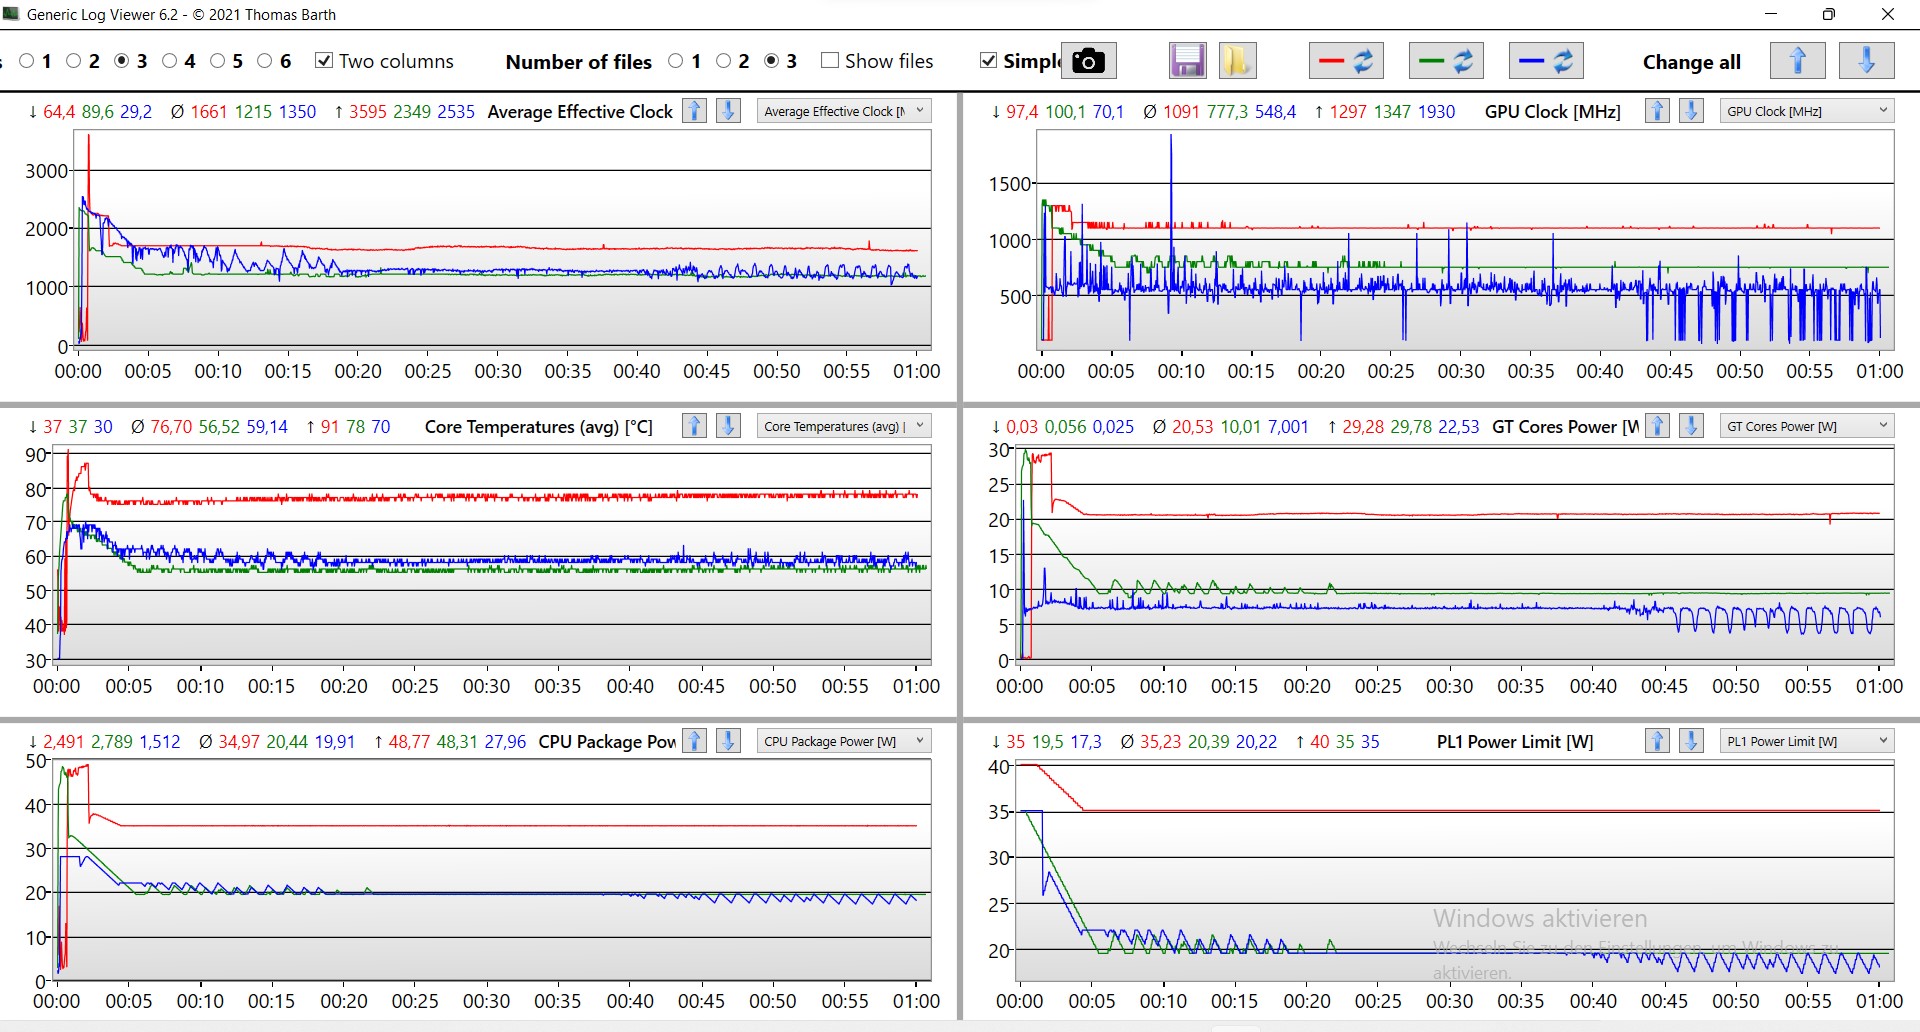
所有的基准测试都是在Windows "最佳性能 "的能源计划中运行的。在Schenker的控制中心选择了 "娱乐模式 "预设。这导致英特尔酷睿i7的PL2为42W,PL1为22W左右。
控制中心还提供其他性能模式。因此,在性能模式下,可以实现相当高的PL1,即35W。然而,这里的核心温度也上升到100℃。除了一些通用的处理器基准测试,如Cinebench,在这种模式下没有看到明显的性能提升。
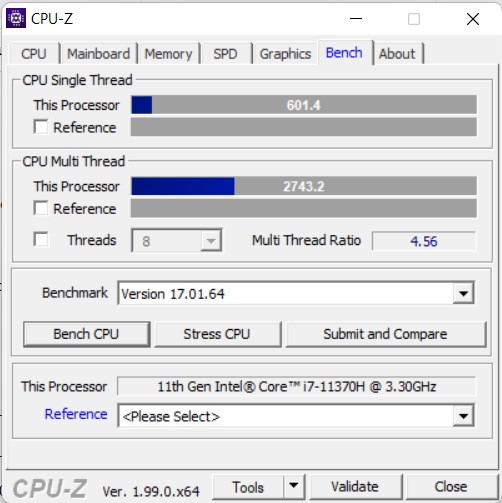
处理器
该 英特尔酷睿i7-11370H在薄型工作站和游戏笔记本中特别常见。根据设定的性能模式,该处理器在长期负载的基准测试中显示出略低于平均水平的性能。该处理器只有在性能模式下才能完全说服人。然而,由于相对较高的Boost性能和典型的强大的单核性能,Schenker Work 15在除Cinebench之外的测试中总能取得好成绩。
与性能模式相比,在Cinebench R15基准测试中,计算能力刚刚超过一半。
Cinebench R15 Multi Dauertest
Cinebench R23: Multi Core | Single Core
Cinebench R20: CPU (Multi Core) | CPU (Single Core)
Cinebench R15: CPU Multi 64Bit | CPU Single 64Bit
Blender: v2.79 BMW27 CPU
7-Zip 18.03: 7z b 4 | 7z b 4 -mmt1
Geekbench 5.5: Multi-Core | Single-Core
HWBOT x265 Benchmark v2.2: 4k Preset
LibreOffice : 20 Documents To PDF
R Benchmark 2.5: Overall mean
| CPU Performance rating | |
| Average of class Office | |
| Asus VivoBook S15 D533UA | |
| Lenovo ThinkPad E15 G3-20YG003UGE | |
| Average Intel Core i7-11370H | |
| Schenker Work 15 Tiger Lake-H | |
| Dell Inspiron 15 3501 | |
| HP Pavilion x360 15-er0155ng | |
| LG Gram 15Z90P-G.AA89G | |
| Cinebench R23 / Multi Core | |
| Average of class Office (1673 - 22808, n=76, last 2 years) | |
| Asus VivoBook S15 D533UA | |
| Lenovo ThinkPad E15 G3-20YG003UGE | |
| Average Intel Core i7-11370H (3696 - 6646, n=12) | |
| Dell Inspiron 15 3501 | |
| Schenker Work 15 Tiger Lake-H | |
| HP Pavilion x360 15-er0155ng | |
| LG Gram 15Z90P-G.AA89G | |
| Cinebench R23 / Single Core | |
| Average of class Office (708 - 2130, n=76, last 2 years) | |
| Average Intel Core i7-11370H (1081 - 1556, n=11) | |
| Schenker Work 15 Tiger Lake-H | |
| Dell Inspiron 15 3501 | |
| HP Pavilion x360 15-er0155ng | |
| Asus VivoBook S15 D533UA | |
| Lenovo ThinkPad E15 G3-20YG003UGE | |
| LG Gram 15Z90P-G.AA89G | |
| Cinebench R20 / CPU (Multi Core) | |
| Average of class Office (648 - 8840, n=75, last 2 years) | |
| Asus VivoBook S15 D533UA | |
| Lenovo ThinkPad E15 G3-20YG003UGE | |
| Average Intel Core i7-11370H (1438 - 2578, n=11) | |
| Dell Inspiron 15 3501 | |
| HP Pavilion x360 15-er0155ng | |
| Schenker Work 15 Tiger Lake-H | |
| LG Gram 15Z90P-G.AA89G | |
| Cinebench R20 / CPU (Single Core) | |
| Average of class Office (345 - 816, n=75, last 2 years) | |
| Average Intel Core i7-11370H (475 - 601, n=11) | |
| Dell Inspiron 15 3501 | |
| Schenker Work 15 Tiger Lake-H | |
| HP Pavilion x360 15-er0155ng | |
| Asus VivoBook S15 D533UA | |
| Lenovo ThinkPad E15 G3-20YG003UGE | |
| LG Gram 15Z90P-G.AA89G | |
| Cinebench R15 / CPU Multi 64Bit | |
| Average of class Office (250 - 3380, n=77, last 2 years) | |
| Asus VivoBook S15 D533UA | |
| Lenovo ThinkPad E15 G3-20YG003UGE | |
| Average Intel Core i7-11370H (606 - 1086, n=17) | |
| Schenker Work 15 Tiger Lake-H | |
| Schenker Work 15 Tiger Lake-H | |
| Schenker Work 15 Tiger Lake-H | |
| Dell Inspiron 15 3501 | |
| LG Gram 15Z90P-G.AA89G | |
| HP Pavilion x360 15-er0155ng | |
| Cinebench R15 / CPU Single 64Bit | |
| Average of class Office (99.5 - 316, n=77, last 2 years) | |
| Average Intel Core i7-11370H (162.9 - 233, n=15) | |
| Schenker Work 15 Tiger Lake-H | |
| Schenker Work 15 Tiger Lake-H | |
| HP Pavilion x360 15-er0155ng | |
| Asus VivoBook S15 D533UA | |
| Lenovo ThinkPad E15 G3-20YG003UGE | |
| LG Gram 15Z90P-G.AA89G | |
| Dell Inspiron 15 3501 | |
| Blender / v2.79 BMW27 CPU | |
| LG Gram 15Z90P-G.AA89G | |
| Schenker Work 15 Tiger Lake-H | |
| HP Pavilion x360 15-er0155ng | |
| Dell Inspiron 15 3501 | |
| Average Intel Core i7-11370H (432 - 762, n=11) | |
| Average of class Office (158 - 1940, n=76, last 2 years) | |
| Asus VivoBook S15 D533UA | |
| Lenovo ThinkPad E15 G3-20YG003UGE | |
| 7-Zip 18.03 / 7z b 4 | |
| Average of class Office (7098 - 76886, n=77, last 2 years) | |
| Asus VivoBook S15 D533UA | |
| Lenovo ThinkPad E15 G3-20YG003UGE | |
| Average Intel Core i7-11370H (18961 - 28520, n=11) | |
| Dell Inspiron 15 3501 | |
| HP Pavilion x360 15-er0155ng | |
| Schenker Work 15 Tiger Lake-H | |
| LG Gram 15Z90P-G.AA89G | |
| 7-Zip 18.03 / 7z b 4 -mmt1 | |
| Average of class Office (3387 - 6469, n=77, last 2 years) | |
| Average Intel Core i7-11370H (5074 - 5550, n=11) | |
| Schenker Work 15 Tiger Lake-H | |
| Dell Inspiron 15 3501 | |
| HP Pavilion x360 15-er0155ng | |
| LG Gram 15Z90P-G.AA89G | |
| Asus VivoBook S15 D533UA | |
| Lenovo ThinkPad E15 G3-20YG003UGE | |
| Geekbench 5.5 / Multi-Core | |
| Average of class Office (1483 - 16999, n=73, last 2 years) | |
| Asus VivoBook S15 D533UA | |
| Lenovo ThinkPad E15 G3-20YG003UGE | |
| Schenker Work 15 Tiger Lake-H | |
| Average Intel Core i7-11370H (3828 - 6115, n=10) | |
| HP Pavilion x360 15-er0155ng | |
| LG Gram 15Z90P-G.AA89G | |
| Dell Inspiron 15 3501 | |
| Geekbench 5.5 / Single-Core | |
| Average of class Office (811 - 2175, n=73, last 2 years) | |
| Schenker Work 15 Tiger Lake-H | |
| Average Intel Core i7-11370H (1376 - 1607, n=10) | |
| LG Gram 15Z90P-G.AA89G | |
| Dell Inspiron 15 3501 | |
| HP Pavilion x360 15-er0155ng | |
| Asus VivoBook S15 D533UA | |
| Lenovo ThinkPad E15 G3-20YG003UGE | |
| HWBOT x265 Benchmark v2.2 / 4k Preset | |
| Average of class Office (2.21 - 26, n=76, last 2 years) | |
| Asus VivoBook S15 D533UA | |
| Lenovo ThinkPad E15 G3-20YG003UGE | |
| Average Intel Core i7-11370H (4.98 - 8.82, n=11) | |
| Dell Inspiron 15 3501 | |
| HP Pavilion x360 15-er0155ng | |
| Schenker Work 15 Tiger Lake-H | |
| LG Gram 15Z90P-G.AA89G | |
| LibreOffice / 20 Documents To PDF | |
| Lenovo ThinkPad E15 G3-20YG003UGE | |
| Asus VivoBook S15 D533UA | |
| Average of class Office (39.9 - 102.3, n=76, last 2 years) | |
| LG Gram 15Z90P-G.AA89G | |
| Dell Inspiron 15 3501 | |
| HP Pavilion x360 15-er0155ng | |
| Average Intel Core i7-11370H (23.6 - 56.5, n=11) | |
| Schenker Work 15 Tiger Lake-H | |
| R Benchmark 2.5 / Overall mean | |
| LG Gram 15Z90P-G.AA89G | |
| HP Pavilion x360 15-er0155ng | |
| Dell Inspiron 15 3501 | |
| Lenovo ThinkPad E15 G3-20YG003UGE | |
| Asus VivoBook S15 D533UA | |
| Schenker Work 15 Tiger Lake-H | |
| Average Intel Core i7-11370H (0.544 - 0.596, n=11) | |
| Average of class Office (0.393 - 0.888, n=76, last 2 years) | |
* ... smaller is better
AIDA64: FP32 Ray-Trace | FPU Julia | CPU SHA3 | CPU Queen | FPU SinJulia | FPU Mandel | CPU AES | CPU ZLib | FP64 Ray-Trace | CPU PhotoWorxx
| Performance rating | |
| Average of class Office | |
| Asus VivoBook S15 D533UA | |
| Lenovo ThinkPad E15 G3-20YG003UGE | |
| Schenker Work 15 Tiger Lake-H | |
| Average Intel Core i7-11370H | |
| Dell Inspiron 15 3501 | |
| HP Pavilion x360 15-er0155ng | |
| LG Gram 15Z90P-G.AA89G | |
| AIDA64 / FP32 Ray-Trace | |
| Average of class Office (2083 - 31245, n=83, last 2 years) | |
| Asus VivoBook S15 D533UA | |
| Lenovo ThinkPad E15 G3-20YG003UGE | |
| Average Intel Core i7-11370H (5204 - 8413, n=10) | |
| Schenker Work 15 Tiger Lake-H | |
| Dell Inspiron 15 3501 | |
| HP Pavilion x360 15-er0155ng | |
| LG Gram 15Z90P-G.AA89G | |
| AIDA64 / FPU Julia | |
| Average of class Office (8191 - 125394, n=83, last 2 years) | |
| Asus VivoBook S15 D533UA | |
| Lenovo ThinkPad E15 G3-20YG003UGE | |
| Average Intel Core i7-11370H (23958 - 34020, n=10) | |
| Schenker Work 15 Tiger Lake-H | |
| Dell Inspiron 15 3501 | |
| HP Pavilion x360 15-er0155ng | |
| LG Gram 15Z90P-G.AA89G | |
| AIDA64 / CPU SHA3 | |
| Average of class Office (433 - 5755, n=83, last 2 years) | |
| Average Intel Core i7-11370H (1656 - 2297, n=10) | |
| Schenker Work 15 Tiger Lake-H | |
| Asus VivoBook S15 D533UA | |
| Lenovo ThinkPad E15 G3-20YG003UGE | |
| Dell Inspiron 15 3501 | |
| HP Pavilion x360 15-er0155ng | |
| LG Gram 15Z90P-G.AA89G | |
| AIDA64 / CPU Queen | |
| Asus VivoBook S15 D533UA | |
| Lenovo ThinkPad E15 G3-20YG003UGE | |
| Average of class Office (22784 - 115197, n=67, last 2 years) | |
| Schenker Work 15 Tiger Lake-H | |
| Average Intel Core i7-11370H (42086 - 52930, n=10) | |
| Dell Inspiron 15 3501 | |
| HP Pavilion x360 15-er0155ng | |
| LG Gram 15Z90P-G.AA89G | |
| AIDA64 / FPU SinJulia | |
| Asus VivoBook S15 D533UA | |
| Lenovo ThinkPad E15 G3-20YG003UGE | |
| Average of class Office (1378 - 18321, n=83, last 2 years) | |
| Schenker Work 15 Tiger Lake-H | |
| Average Intel Core i7-11370H (3755 - 5027, n=10) | |
| Dell Inspiron 15 3501 | |
| HP Pavilion x360 15-er0155ng | |
| LG Gram 15Z90P-G.AA89G | |
| AIDA64 / FPU Mandel | |
| Average of class Office (4601 - 66922, n=83, last 2 years) | |
| Asus VivoBook S15 D533UA | |
| Lenovo ThinkPad E15 G3-20YG003UGE | |
| Average Intel Core i7-11370H (14433 - 20417, n=10) | |
| Schenker Work 15 Tiger Lake-H | |
| Dell Inspiron 15 3501 | |
| HP Pavilion x360 15-er0155ng | |
| LG Gram 15Z90P-G.AA89G | |
| AIDA64 / CPU AES | |
| Schenker Work 15 Tiger Lake-H | |
| Average Intel Core i7-11370H (44267 - 76866, n=10) | |
| Dell Inspiron 15 3501 | |
| Asus VivoBook S15 D533UA | |
| Lenovo ThinkPad E15 G3-20YG003UGE | |
| HP Pavilion x360 15-er0155ng | |
| Average of class Office (4854 - 155900, n=83, last 2 years) | |
| LG Gram 15Z90P-G.AA89G | |
| AIDA64 / CPU ZLib | |
| Average of class Office (114.6 - 1366, n=83, last 2 years) | |
| Asus VivoBook S15 D533UA | |
| Lenovo ThinkPad E15 G3-20YG003UGE | |
| Schenker Work 15 Tiger Lake-H | |
| Average Intel Core i7-11370H (289 - 422, n=10) | |
| Dell Inspiron 15 3501 | |
| HP Pavilion x360 15-er0155ng | |
| LG Gram 15Z90P-G.AA89G | |
| AIDA64 / FP64 Ray-Trace | |
| Average of class Office (1109 - 17834, n=83, last 2 years) | |
| Asus VivoBook S15 D533UA | |
| Lenovo ThinkPad E15 G3-20YG003UGE | |
| Average Intel Core i7-11370H (2756 - 4551, n=10) | |
| Schenker Work 15 Tiger Lake-H | |
| Dell Inspiron 15 3501 | |
| HP Pavilion x360 15-er0155ng | |
| LG Gram 15Z90P-G.AA89G | |
| AIDA64 / CPU PhotoWorxx | |
| Average of class Office (11090 - 65229, n=83, last 2 years) | |
| LG Gram 15Z90P-G.AA89G | |
| Schenker Work 15 Tiger Lake-H | |
| Average Intel Core i7-11370H (15892 - 40069, n=10) | |
| HP Pavilion x360 15-er0155ng | |
| Dell Inspiron 15 3501 | |
| Asus VivoBook S15 D533UA | |
| Lenovo ThinkPad E15 G3-20YG003UGE | |
系统性能
Schenker Work 15在系统性能方面并没有妥协。一个高的Boost和慷慨的32GB工作内存使该测试设备在PCMark10基准测试中取得了略高于平均水平的结果。因此,你可以得到一个反应灵敏、功能强大的设备,适合正常使用。
| PCMark 10 / Score | |
| Average of class Office (2601 - 9298, n=68, last 2 years) | |
| Schenker Work 15 Tiger Lake-H | |
| Lenovo ThinkPad E15 G3-20YG003UGE | |
| Asus VivoBook S15 D533UA | |
| Average Intel Core i7-11370H, Intel Iris Xe Graphics G7 96EUs (5199 - 5459, n=6) | |
| Dell Inspiron 15 3501 | |
| LG Gram 15Z90P-G.AA89G | |
| HP Pavilion x360 15-er0155ng | |
| PCMark 10 / Essentials | |
| Schenker Work 15 Tiger Lake-H | |
| Average Intel Core i7-11370H, Intel Iris Xe Graphics G7 96EUs (9996 - 10650, n=6) | |
| Average of class Office (3245 - 11594, n=68, last 2 years) | |
| LG Gram 15Z90P-G.AA89G | |
| Dell Inspiron 15 3501 | |
| HP Pavilion x360 15-er0155ng | |
| Lenovo ThinkPad E15 G3-20YG003UGE | |
| Asus VivoBook S15 D533UA | |
| PCMark 10 / Productivity | |
| Average of class Office (5336 - 17243, n=68, last 2 years) | |
| Lenovo ThinkPad E15 G3-20YG003UGE | |
| Asus VivoBook S15 D533UA | |
| Average Intel Core i7-11370H, Intel Iris Xe Graphics G7 96EUs (6911 - 7388, n=6) | |
| Schenker Work 15 Tiger Lake-H | |
| Dell Inspiron 15 3501 | |
| LG Gram 15Z90P-G.AA89G | |
| HP Pavilion x360 15-er0155ng | |
| PCMark 10 / Digital Content Creation | |
| Average of class Office (2049 - 13541, n=68, last 2 years) | |
| Schenker Work 15 Tiger Lake-H | |
| Average Intel Core i7-11370H, Intel Iris Xe Graphics G7 96EUs (5483 - 5838, n=6) | |
| Asus VivoBook S15 D533UA | |
| Lenovo ThinkPad E15 G3-20YG003UGE | |
| Dell Inspiron 15 3501 | |
| LG Gram 15Z90P-G.AA89G | |
| HP Pavilion x360 15-er0155ng | |
| PCMark 10 Score | 5415 points | |
Help | ||
| AIDA64 / Memory Copy | |
| Average of class Office (20075 - 110930, n=80, last 2 years) | |
| LG Gram 15Z90P-G.AA89G | |
| Schenker Work 15 Tiger Lake-H | |
| Average Intel Core i7-11370H (32035 - 64524, n=10) | |
| HP Pavilion x360 15-er0155ng | |
| Asus VivoBook S15 D533UA | |
| Lenovo ThinkPad E15 G3-20YG003UGE | |
| Dell Inspiron 15 3501 | |
| AIDA64 / Memory Read | |
| Average of class Office (10084 - 128030, n=81, last 2 years) | |
| LG Gram 15Z90P-G.AA89G | |
| Schenker Work 15 Tiger Lake-H | |
| Average Intel Core i7-11370H (37216 - 62417, n=10) | |
| HP Pavilion x360 15-er0155ng | |
| Asus VivoBook S15 D533UA | |
| Lenovo ThinkPad E15 G3-20YG003UGE | |
| Dell Inspiron 15 3501 | |
| AIDA64 / Memory Write | |
| Average of class Office (20073 - 119858, n=81, last 2 years) | |
| LG Gram 15Z90P-G.AA89G | |
| Average Intel Core i7-11370H (36920 - 65610, n=10) | |
| Schenker Work 15 Tiger Lake-H | |
| HP Pavilion x360 15-er0155ng | |
| Asus VivoBook S15 D533UA | |
| Lenovo ThinkPad E15 G3-20YG003UGE | |
| Dell Inspiron 15 3501 | |
| AIDA64 / Memory Latency | |
| LG Gram 15Z90P-G.AA89G | |
| Average of class Office (7.6 - 162.9, n=76, last 2 years) | |
| Lenovo ThinkPad E15 G3-20YG003UGE | |
| Asus VivoBook S15 D533UA | |
| Dell Inspiron 15 3501 | |
| Average Intel Core i7-11370H (73.4 - 103, n=10) | |
| Schenker Work 15 Tiger Lake-H | |
| HP Pavilion x360 15-er0155ng | |
* ... smaller is better
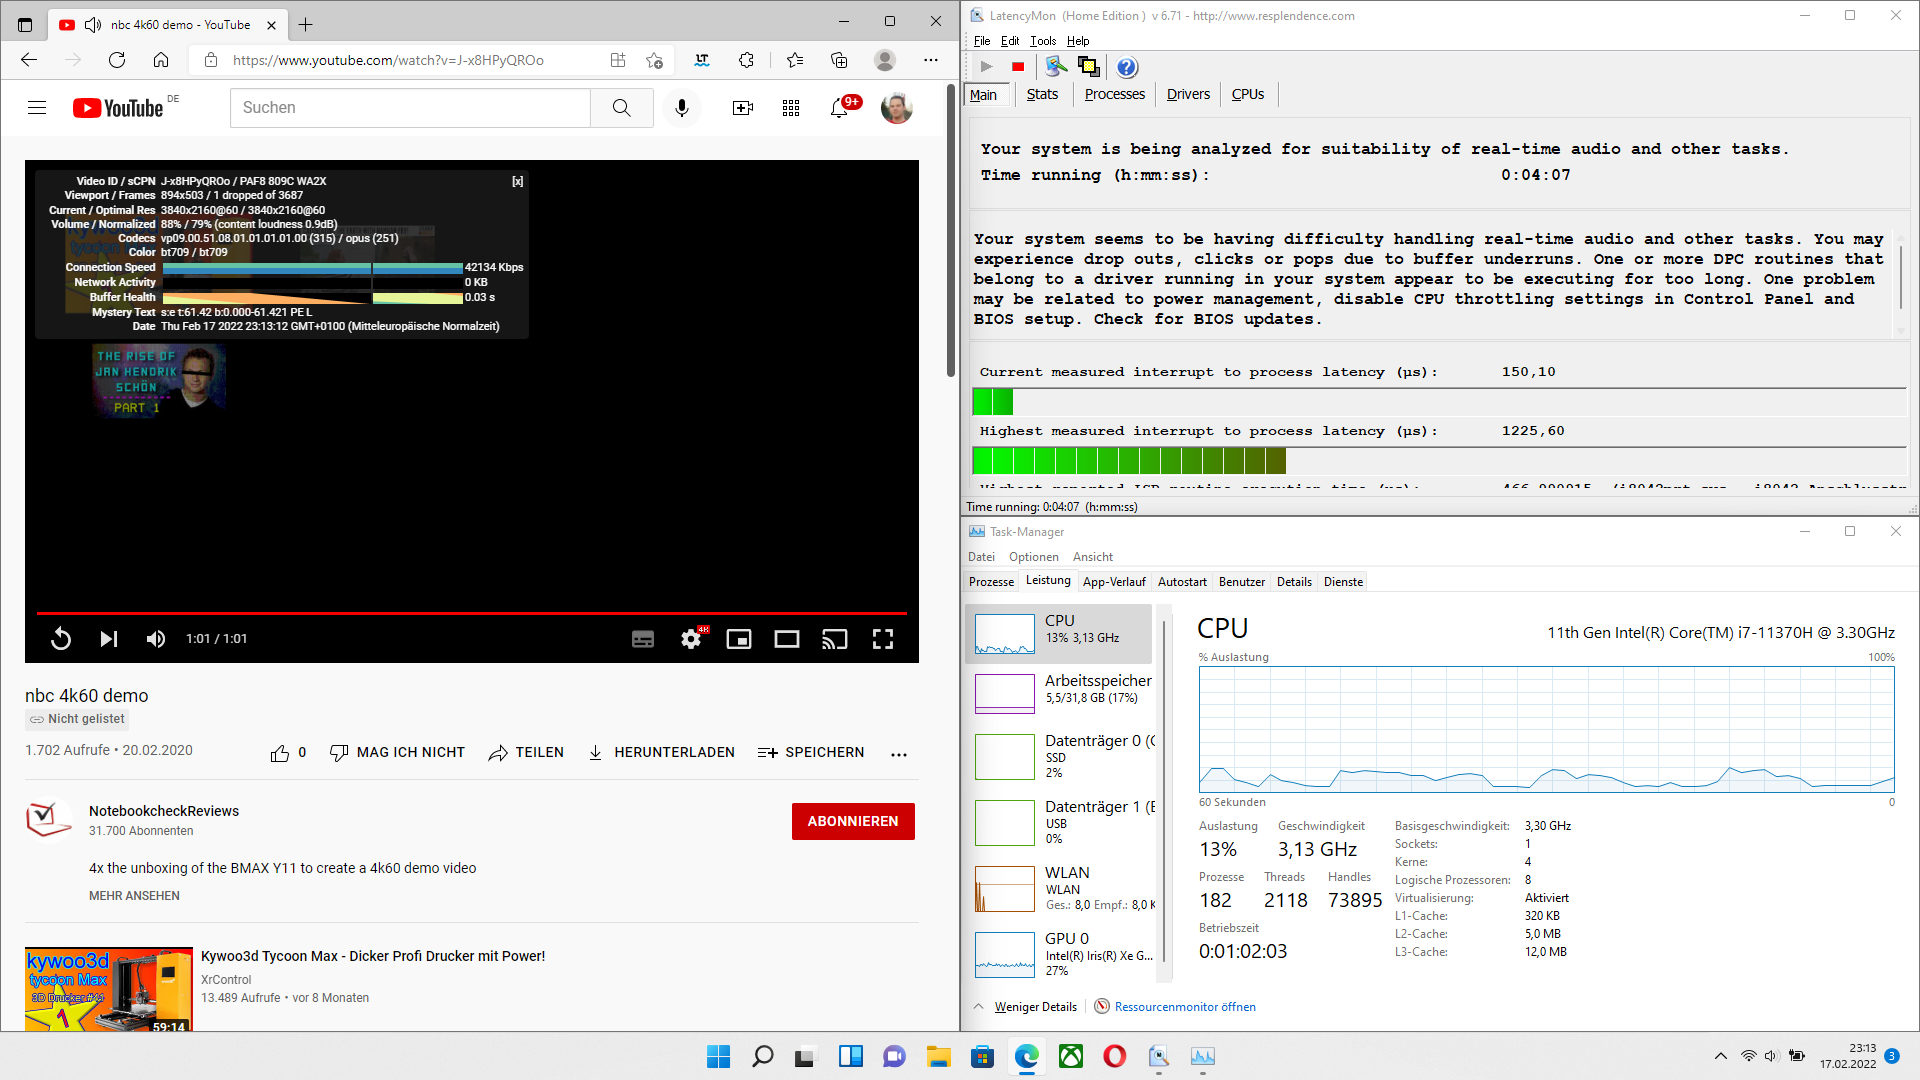
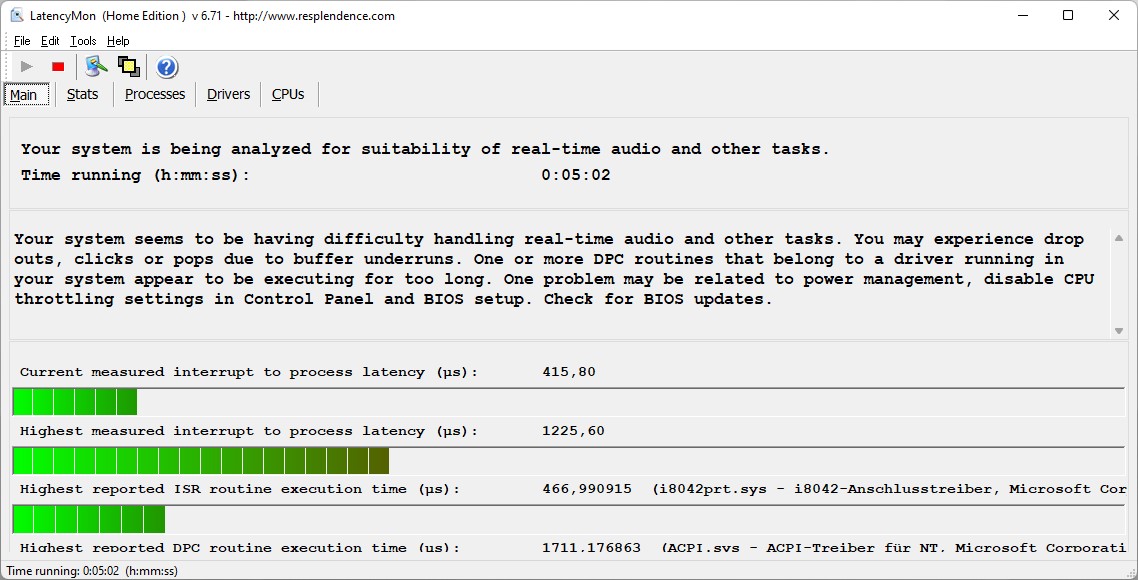
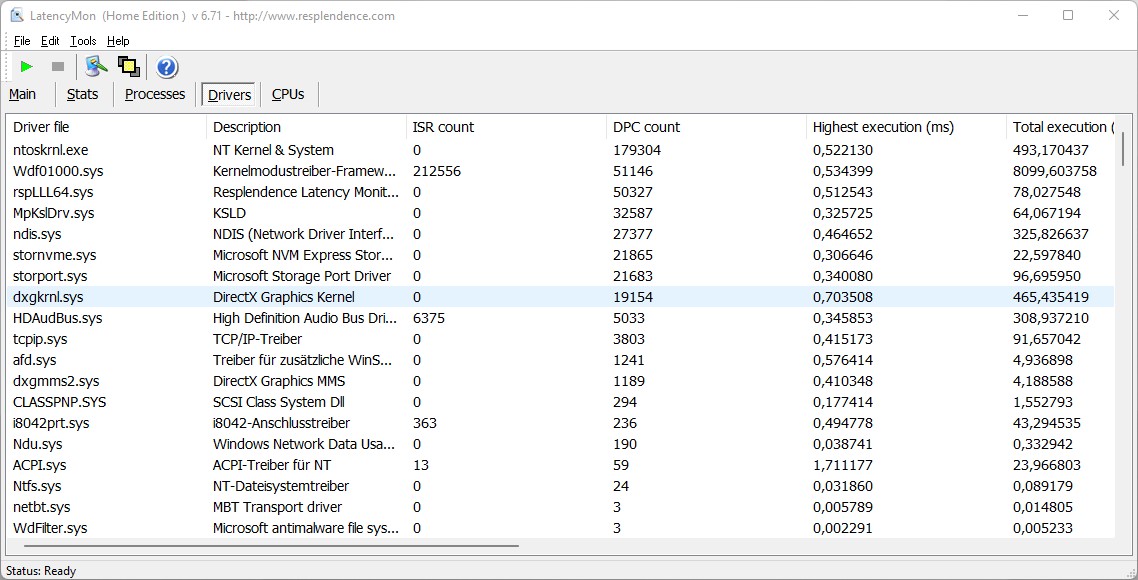
DPC延时
有一个DPC延时超过一毫秒,Schenker Work 15在比较领域并不孤单。这个远非良好的价值反映了当前许多笔记本电脑的问题,但这可能会随着驱动程序的更新而产生很大的波动。
| DPC Latencies / LatencyMon - interrupt to process latency (max), Web, Youtube, Prime95 | |
| LG Gram 15Z90P-G.AA89G | |
| Schenker Work 15 Tiger Lake-H | |
| Dell Inspiron 15 3501 | |
| Lenovo ThinkPad E15 G3-20YG003UGE | |
| Asus VivoBook S15 D533UA | |
* ... smaller is better
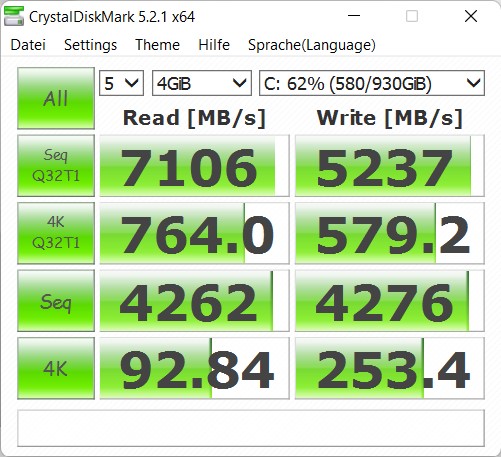
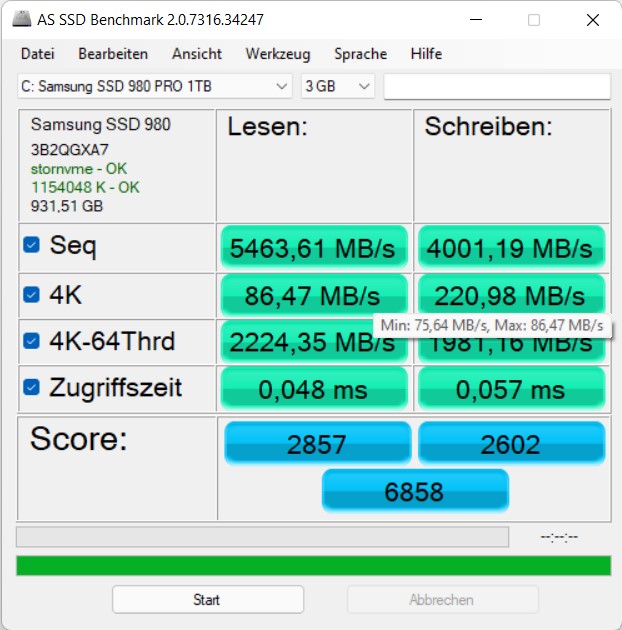
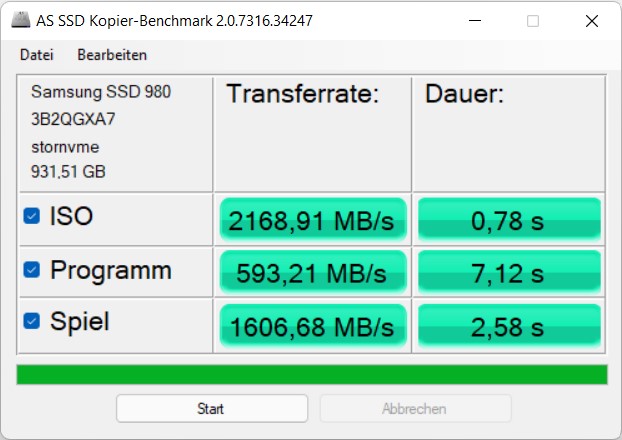
大容量存储
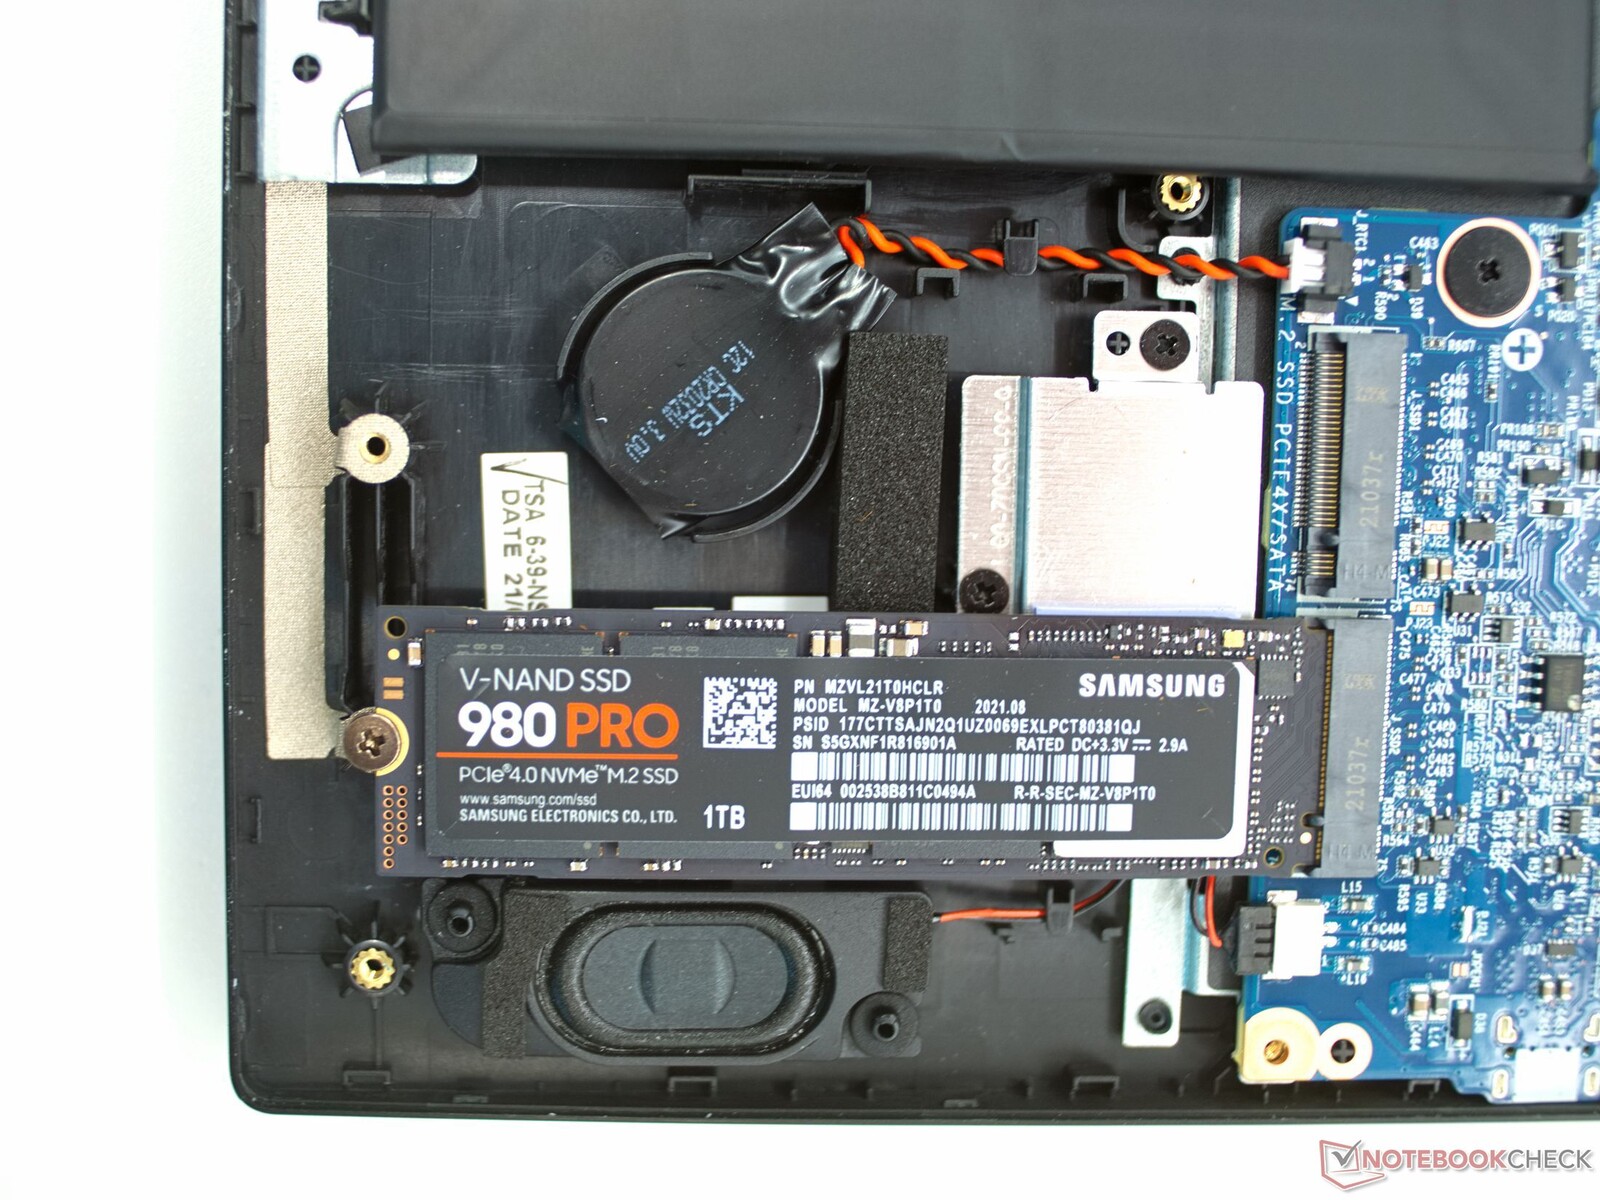
根据我们的SSD和HDD基准表,拥有1TB存储空间的三星980 Pro是最快的存储选项之一。 SSDs和HDDs的基准表.由于PCIe 4.0(第二个M.2插槽使用PCIe 3.0 x4接口),SSD在Schenker笔记本电脑中以预期的高速度工作。

| Drive Performance rating - Percent | |
| Average Samsung SSD 980 Pro 1TB MZ-V8P1T0BW | |
| Schenker Work 15 Tiger Lake-H | |
| LG Gram 15Z90P-G.AA89G | |
| Lenovo ThinkPad E15 G3-20YG003UGE | |
| Average of class Office | |
| Dell Inspiron 15 3501 | |
| Asus VivoBook S15 D533UA | |
| HP Pavilion x360 15-er0155ng | |
* ... smaller is better
Dauerleistung Lesen: DiskSpd Read Loop, Queue Depth 8
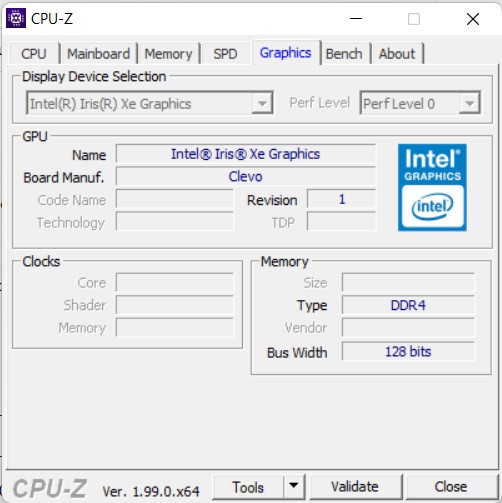
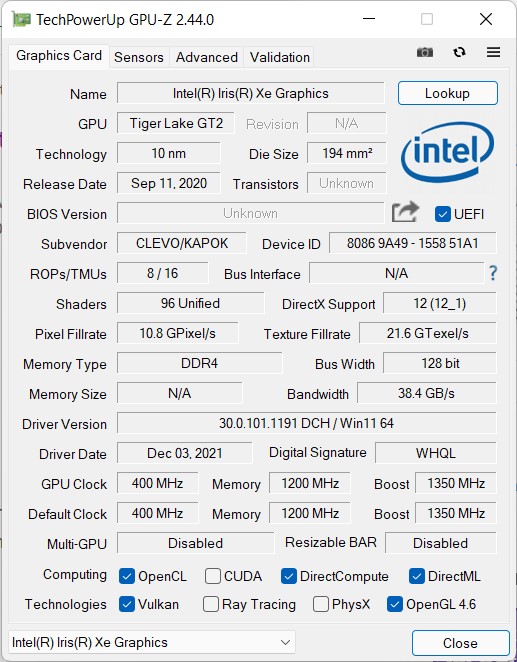
图形卡
有了 英特尔Iris Xe图形G7与96EUsSchenker Work 15并没有成为一台游戏笔记本,但这台办公笔记本仍然可以流畅地渲染许多游戏。这款笔记本在3DMark基准测试中也取得了相当好的成绩,特别是由于iGPU有大量的工作内存可供支配。如果你需要更多的图形处理能力,你可以通过雷电4端口连接一个外部显卡。
| 3DMark Performance rating - Percent | |
| Average of class Office | |
| Schenker Work 15 Tiger Lake-H -2! | |
| Average Intel Iris Xe Graphics G7 96EUs | |
| LG Gram 15Z90P-G.AA89G -1! | |
| HP Pavilion x360 15-er0155ng | |
| Dell Inspiron 15 3501 | |
| Lenovo ThinkPad E15 G3-20YG003UGE | |
| Asus VivoBook S15 D533UA -1! | |
| 3DMark 11 - 1280x720 Performance GPU | |
| Average of class Office (2551 - 18313, n=72, last 2 years) | |
| Average Intel Iris Xe Graphics G7 96EUs (2867 - 7676, n=209) | |
| LG Gram 15Z90P-G.AA89G | |
| Dell Inspiron 15 3501 | |
| HP Pavilion x360 15-er0155ng | |
| Asus VivoBook S15 D533UA | |
| Lenovo ThinkPad E15 G3-20YG003UGE | |
| 3DMark 06 Standard Score | 27110 points | |
| 3DMark Ice Storm Standard Score | 72531 points | |
| 3DMark Fire Strike Score | 4450 points | |
| 3DMark Time Spy Score | 1774 points | |
Help | ||
| The Witcher 3 | |
| 1366x768 Medium Graphics & Postprocessing | |
| Average of class Office (44.7 - 90.4, n=3, last 2 years) | |
| Schenker Work 15 Tiger Lake-H | |
| Average Intel Iris Xe Graphics G7 96EUs (21.4 - 77.8, n=185) | |
| Dell Inspiron 15 3501 | |
| Asus VivoBook S15 D533UA | |
| LG Gram 15Z90P-G.AA89G | |
| 1920x1080 High Graphics & Postprocessing (Nvidia HairWorks Off) | |
| Average of class Office (23.7 - 53.4, n=3, last 2 years) | |
| Average Intel Iris Xe Graphics G7 96EUs (10.6 - 45.9, n=191) | |
| Schenker Work 15 Tiger Lake-H | |
| Lenovo ThinkPad E15 G3-20YG003UGE | |
| Asus VivoBook S15 D533UA | |
| LG Gram 15Z90P-G.AA89G | |
| Dell Inspiron 15 3501 | |
| GTA V | |
| 1366x768 Normal/Off AF:4x | |
| Average of class Office (51.9 - 174.4, n=65, last 2 years) | |
| Average Intel Iris Xe Graphics G7 96EUs (24.1 - 152.7, n=169) | |
| Lenovo ThinkPad E15 G3-20YG003UGE | |
| Asus VivoBook S15 D533UA | |
| Schenker Work 15 Tiger Lake-H | |
| Dell Inspiron 15 3501 | |
| LG Gram 15Z90P-G.AA89G | |
| 1920x1080 High/On (Advanced Graphics Off) AA:2xMSAA + FX AF:8x | |
| Average of class Office (11.4 - 163.1, n=70, last 2 years) | |
| Asus VivoBook S15 D533UA | |
| Lenovo ThinkPad E15 G3-20YG003UGE | |
| Schenker Work 15 Tiger Lake-H | |
| Average Intel Iris Xe Graphics G7 96EUs (9.39 - 51.6, n=162) | |
| Dell Inspiron 15 3501 | |
| LG Gram 15Z90P-G.AA89G | |
| Dota 2 Reborn | |
| 1920x1080 high (2/3) | |
| Average of class Office (16.2 - 143.3, n=77, last 2 years) | |
| Average Intel Iris Xe Graphics G7 96EUs (23.2 - 88.1, n=221) | |
| Lenovo ThinkPad E15 G3-20YG003UGE | |
| Asus VivoBook S15 D533UA | |
| Schenker Work 15 Tiger Lake-H | |
| Dell Inspiron 15 3501 | |
| LG Gram 15Z90P-G.AA89G | |
| 1366x768 med (1/3) | |
| Average of class Office (31.2 - 152, n=77, last 2 years) | |
| Asus VivoBook S15 D533UA | |
| Average Intel Iris Xe Graphics G7 96EUs (31.6 - 108.5, n=221) | |
| Lenovo ThinkPad E15 G3-20YG003UGE | |
| LG Gram 15Z90P-G.AA89G | |
| Schenker Work 15 Tiger Lake-H | |
| Dell Inspiron 15 3501 | |
| X-Plane 11.11 | |
| 1920x1080 high (fps_test=3) | |
| Average of class Office (12 - 82.4, n=69, last 2 years) | |
| Average Intel Iris Xe Graphics G7 96EUs (11.1 - 59.8, n=213) | |
| Schenker Work 15 Tiger Lake-H | |
| Lenovo ThinkPad E15 G3-20YG003UGE | |
| Asus VivoBook S15 D533UA | |
| LG Gram 15Z90P-G.AA89G | |
| Dell Inspiron 15 3501 | |
| 1920x1080 med (fps_test=2) | |
| Average of class Office (13.4 - 94.8, n=69, last 2 years) | |
| Average Intel Iris Xe Graphics G7 96EUs (11.6 - 69.5, n=214) | |
| Schenker Work 15 Tiger Lake-H | |
| Lenovo ThinkPad E15 G3-20YG003UGE | |
| Asus VivoBook S15 D533UA | |
| LG Gram 15Z90P-G.AA89G | |
| Dell Inspiron 15 3501 | |
| Far Cry 5 | |
| 1920x1080 Medium Preset AA:T | |
| Average of class Office (21 - 59, n=13, last 2 years) | |
| Average Intel Iris Xe Graphics G7 96EUs (14 - 39, n=91) | |
| Schenker Work 15 Tiger Lake-H | |
| Asus VivoBook S15 D533UA | |
| LG Gram 15Z90P-G.AA89G | |
| 1920x1080 High Preset AA:T | |
| Average of class Office (19 - 54, n=13, last 2 years) | |
| Average Intel Iris Xe Graphics G7 96EUs (10 - 35, n=89) | |
| Schenker Work 15 Tiger Lake-H | |
| Asus VivoBook S15 D533UA | |
| F1 2021 | |
| 1920x1080 Medium Preset AA:T AF:16x | |
| Schenker Work 15 Tiger Lake-H | |
| Average Intel Iris Xe Graphics G7 96EUs (29.4 - 64.9, n=45) | |
| Lenovo ThinkPad E15 G3-20YG003UGE | |
| 1920x1080 High Preset AA:T AF:16x | |
| Schenker Work 15 Tiger Lake-H | |
| Average Intel Iris Xe Graphics G7 96EUs (24 - 50.8, n=45) | |
| Lenovo ThinkPad E15 G3-20YG003UGE | |
Witcher 3 FPS-Diagramm
| low | med. | high | ultra | |
|---|---|---|---|---|
| GTA V (2015) | 92 | 73.2 | 24.7 | 10.1 |
| The Witcher 3 (2015) | 91.2 | 59.2 | 22 | 12.6 |
| Dota 2 Reborn (2015) | 120 | 70 | 47 | 47.2 |
| X-Plane 11.11 (2018) | 40 | 34 | 30.4 | |
| Far Cry 5 (2018) | 47 | 25 | 22 | |
| Strange Brigade (2018) | 87 | 36.9 | 29.9 | 24.4 |
| F1 2021 (2021) | 99.1 | 48.2 | 38.1 | 26.9 |
排放与能源。喧闹而冷静
噪声排放
Schenker Work 15的噪音排放约为45 dB(A),在负载情况下并不真正安静,几乎是令人讨厌的声音。然而,根据设定的电源模式,风扇保持在感知阈值以下,或者可以完全关闭。在任何情况下,风扇都不会产生令人不快的高频率。
Noise level
| Idle |
| 24.4 / 24.4 / 26.7 dB(A) |
| Load |
| 43.8 / 44.8 dB(A) |
 | ||
30 dB silent 40 dB(A) audible 50 dB(A) loud |
||
min: | ||
| Schenker Work 15 Tiger Lake-H Iris Xe G7 96EUs, i7-11370H, Samsung SSD 980 Pro 1TB MZ-V8P1T0BW | LG Gram 15Z90P-G.AA89G Iris Xe G7 96EUs, i7-1165G7, SK Hynix HFM001TD3JX013N | Dell Inspiron 15 3501 Iris Xe G7 96EUs, i7-1165G7, Samsung PM991a MZ9LQ512HBLU-00BD1 | Lenovo ThinkPad E15 G3-20YG003UGE Vega 8, R7 5700U, SK Hynix PC711 1TB HFS001TDE9X084N | Asus VivoBook S15 D533UA Vega 8, R7 5700U, WDC PC SN530 SDBPNPZ-1T00 | HP Pavilion x360 15-er0155ng Iris Xe G7 80EUs, i5-1135G7, WDC PC SN530 SDBPNPZ-512G | |
|---|---|---|---|---|---|---|
| Noise | 8% | 3% | 8% | -5% | 2% | |
| off / environment * (dB) | 24.4 | 25 -2% | 26 -7% | 23.8 2% | 26 -7% | 26 -7% |
| Idle Minimum * (dB) | 24.4 | 25 -2% | 26 -7% | 23.8 2% | 26 -7% | 26 -7% |
| Idle Average * (dB) | 24.4 | 25 -2% | 26 -7% | 23.8 2% | 26 -7% | 26 -7% |
| Idle Maximum * (dB) | 26.7 | 26.7 -0% | 26 3% | 28 -5% | 28.8 -8% | 26 3% |
| Load Average * (dB) | 43.8 | 32.2 26% | 35.9 18% | 32.9 25% | 45 -3% | 35.1 20% |
| Witcher 3 ultra * (dB) | 43.8 | |||||
| Load Maximum * (dB) | 44.8 | 32.4 28% | 35.8 20% | 35 22% | 45 -0% | 39.6 12% |
* ... smaller is better
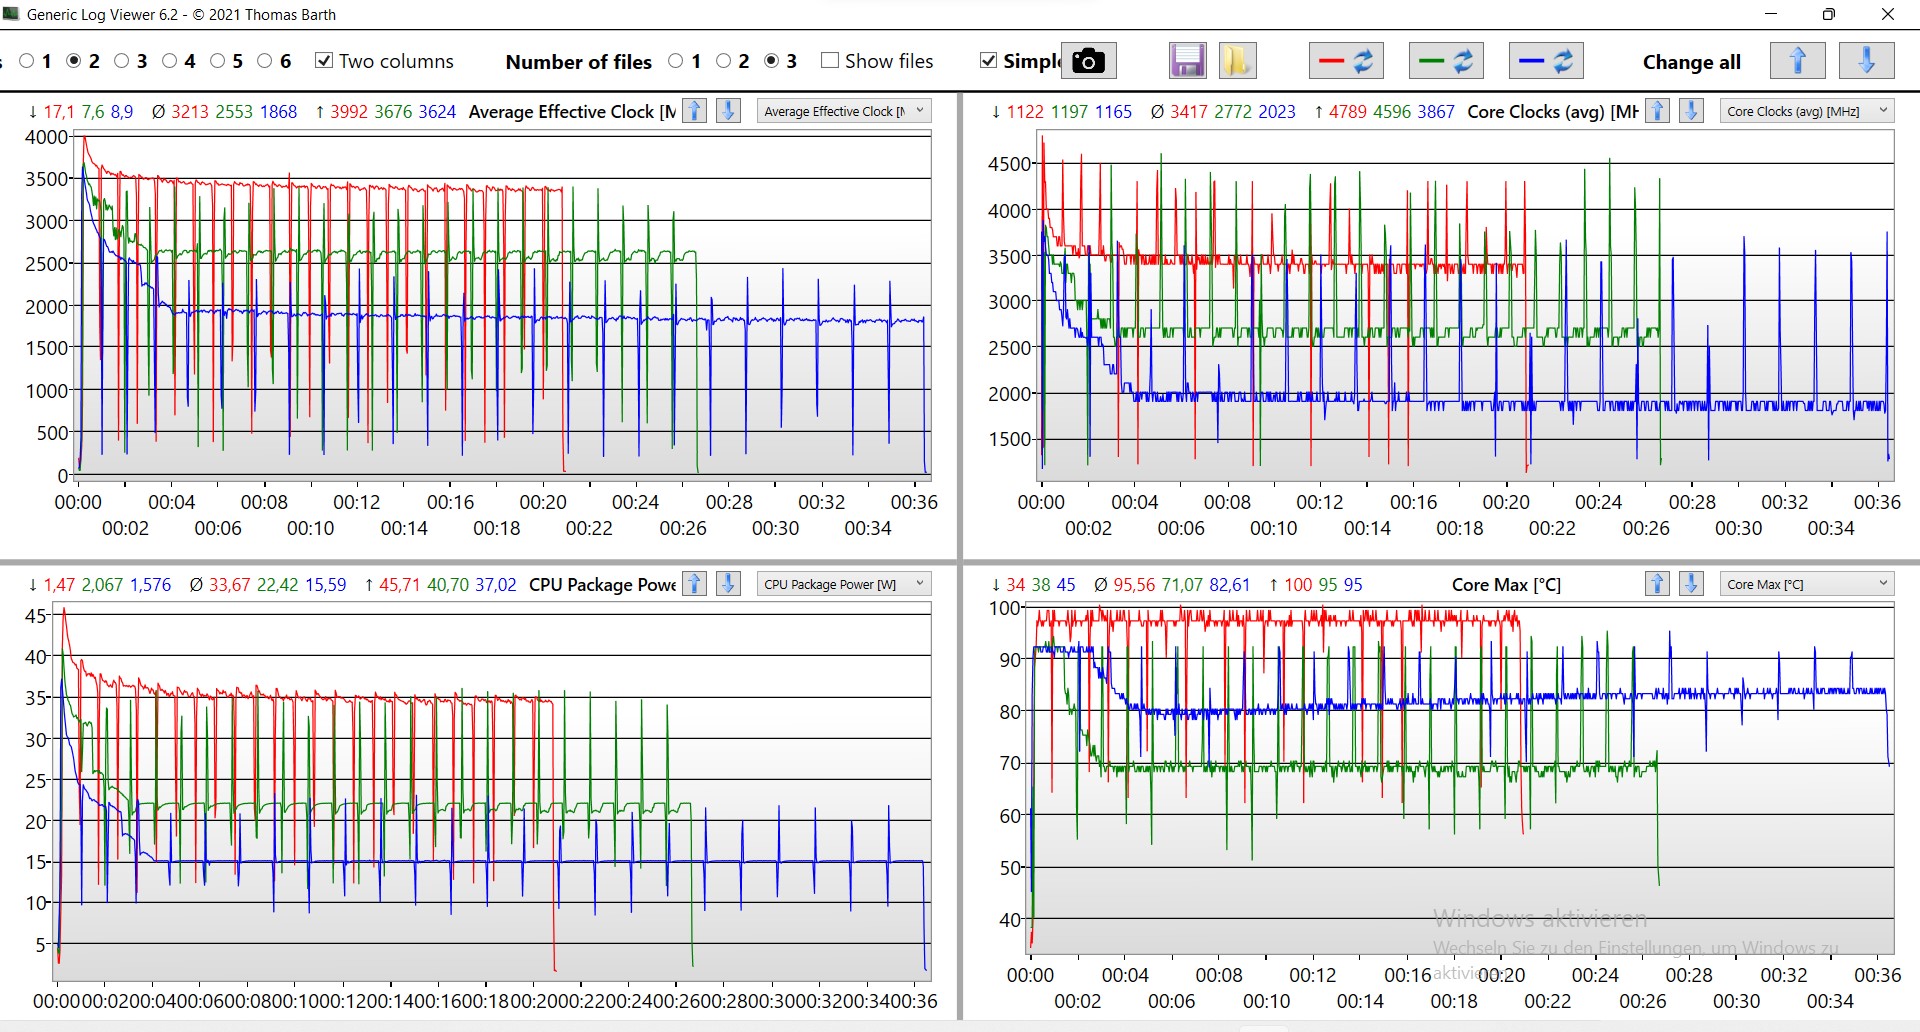
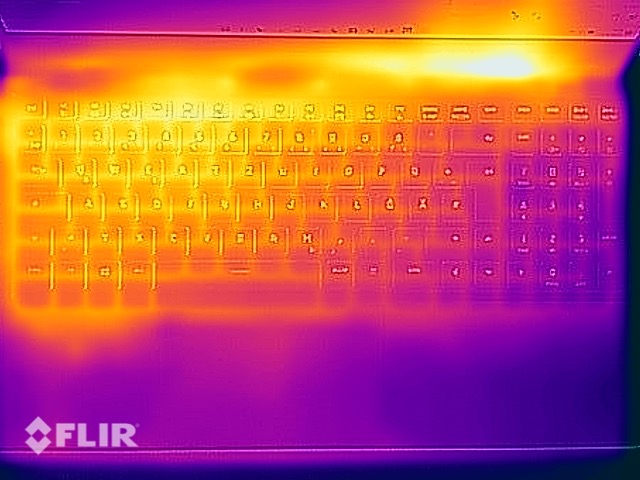
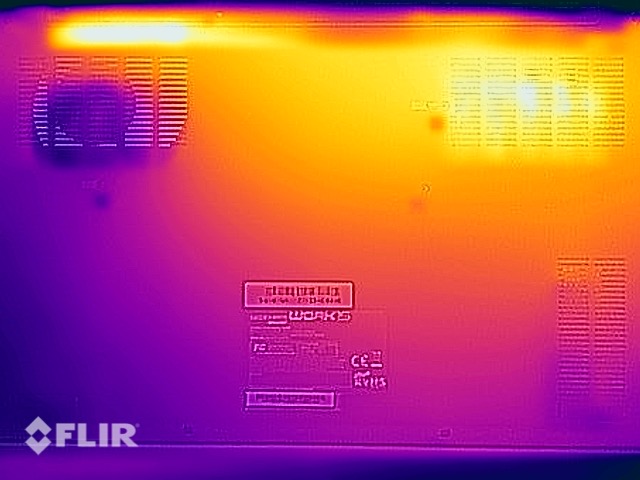
温度
在压力测试中,笔记本电脑的表面温度几乎没有超过人体温度。底部比上部明显变热,但掌托始终保持相对凉爽
在压力测试中,笔记本电脑可以长期保持通过控制中心设置的性能。因此,这台办公用笔记本电脑显示了很好的耐力。尽管如此,在娱乐模式下,PL1的轻微波动是很明显的。
(+) The maximum temperature on the upper side is 39.1 °C / 102 F, compared to the average of 34.3 °C / 94 F, ranging from 21.2 to 62.5 °C for the class Office.
(±) The bottom heats up to a maximum of 43.4 °C / 110 F, compared to the average of 36.8 °C / 98 F
(+) In idle usage, the average temperature for the upper side is 23.6 °C / 74 F, compared to the device average of 29.5 °C / 85 F.
(+) Playing The Witcher 3, the average temperature for the upper side is 31.6 °C / 89 F, compared to the device average of 29.5 °C / 85 F.
(+) The palmrests and touchpad are cooler than skin temperature with a maximum of 29 °C / 84.2 F and are therefore cool to the touch.
(±) The average temperature of the palmrest area of similar devices was 27.5 °C / 81.5 F (-1.5 °C / -2.7 F).
| Schenker Work 15 Tiger Lake-H Intel Core i7-11370H, Intel Iris Xe Graphics G7 96EUs | LG Gram 15Z90P-G.AA89G Intel Core i7-1165G7, Intel Iris Xe Graphics G7 96EUs | Dell Inspiron 15 3501 Intel Core i7-1165G7, Intel Iris Xe Graphics G7 96EUs | Lenovo ThinkPad E15 G3-20YG003UGE AMD Ryzen 7 5700U, AMD Radeon RX Vega 8 (Ryzen 4000/5000) | Asus VivoBook S15 D533UA AMD Ryzen 7 5700U, AMD Radeon RX Vega 8 (Ryzen 4000/5000) | HP Pavilion x360 15-er0155ng Intel Core i5-1135G7, Intel Iris Xe Graphics G7 80EUs | |
|---|---|---|---|---|---|---|
| Heat | -1% | -11% | -20% | -13% | -5% | |
| Maximum Upper Side * (°C) | 39.1 | 42.9 -10% | 45.6 -17% | 46.4 -19% | 46.1 -18% | 39.9 -2% |
| Maximum Bottom * (°C) | 43.4 | 39.4 9% | 41 6% | 60.9 -40% | 46.6 -7% | 43.1 1% |
| Idle Upper Side * (°C) | 24.3 | 25.4 -5% | 28.2 -16% | 26.5 -9% | 27.4 -13% | 26.3 -8% |
| Idle Bottom * (°C) | 25.1 | 24.9 1% | 29.1 -16% | 27.5 -10% | 28.2 -12% | 27.4 -9% |
* ... smaller is better
扬声器
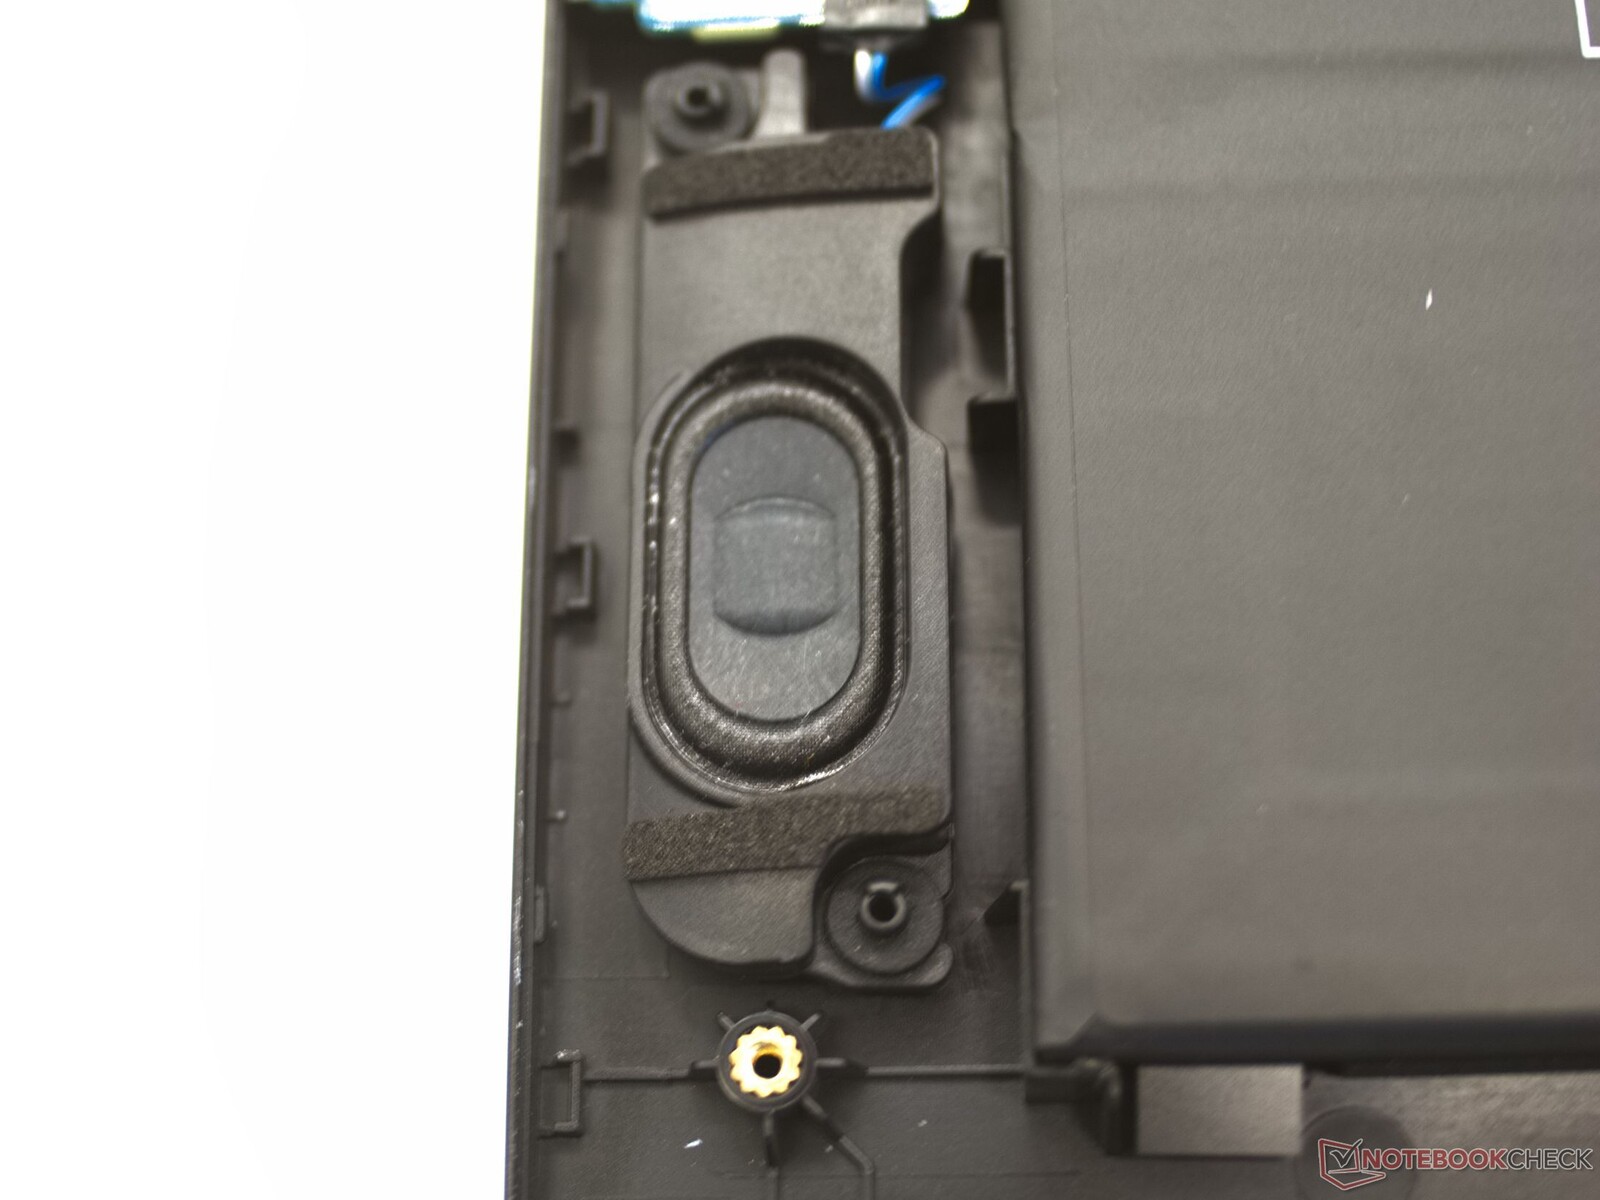
Schenker Work 15的小型扬声器对于办公室的笔记本电脑来说是足够的。然而,由于对不同频率的线性再现较少,而且缺乏低音和次低音,声音显得非常尖锐。
Schenker Work 15 Tiger Lake-H audio analysis
(+) | speakers can play relatively loud (82.3 dB)
Bass 100 - 315 Hz
(-) | nearly no bass - on average 27.2% lower than median
(+) | bass is linear (6.5% delta to prev. frequency)
Mids 400 - 2000 Hz
(±) | higher mids - on average 10.1% higher than median
(-) | mids are not linear (15.1% delta to prev. frequency)
Highs 2 - 16 kHz
(+) | balanced highs - only 4.1% away from median
(+) | highs are linear (6.9% delta to prev. frequency)
Overall 100 - 16.000 Hz
(±) | linearity of overall sound is average (28.8% difference to median)
Compared to same class
» 89% of all tested devices in this class were better, 2% similar, 8% worse
» The best had a delta of 7%, average was 21%, worst was 53%
Compared to all devices tested
» 86% of all tested devices were better, 3% similar, 11% worse
» The best had a delta of 4%, average was 23%, worst was 134%
LG Gram 15Z90P-G.AA89G audio analysis
(+) | speakers can play relatively loud (85.3 dB)
Bass 100 - 315 Hz
(-) | nearly no bass - on average 19.7% lower than median
(±) | linearity of bass is average (13.4% delta to prev. frequency)
Mids 400 - 2000 Hz
(+) | balanced mids - only 2.1% away from median
(+) | mids are linear (3.7% delta to prev. frequency)
Highs 2 - 16 kHz
(±) | higher highs - on average 7.4% higher than median
(±) | linearity of highs is average (7.7% delta to prev. frequency)
Overall 100 - 16.000 Hz
(±) | linearity of overall sound is average (16.6% difference to median)
Compared to same class
» 43% of all tested devices in this class were better, 6% similar, 51% worse
» The best had a delta of 5%, average was 18%, worst was 53%
Compared to all devices tested
» 29% of all tested devices were better, 6% similar, 65% worse
» The best had a delta of 4%, average was 23%, worst was 134%
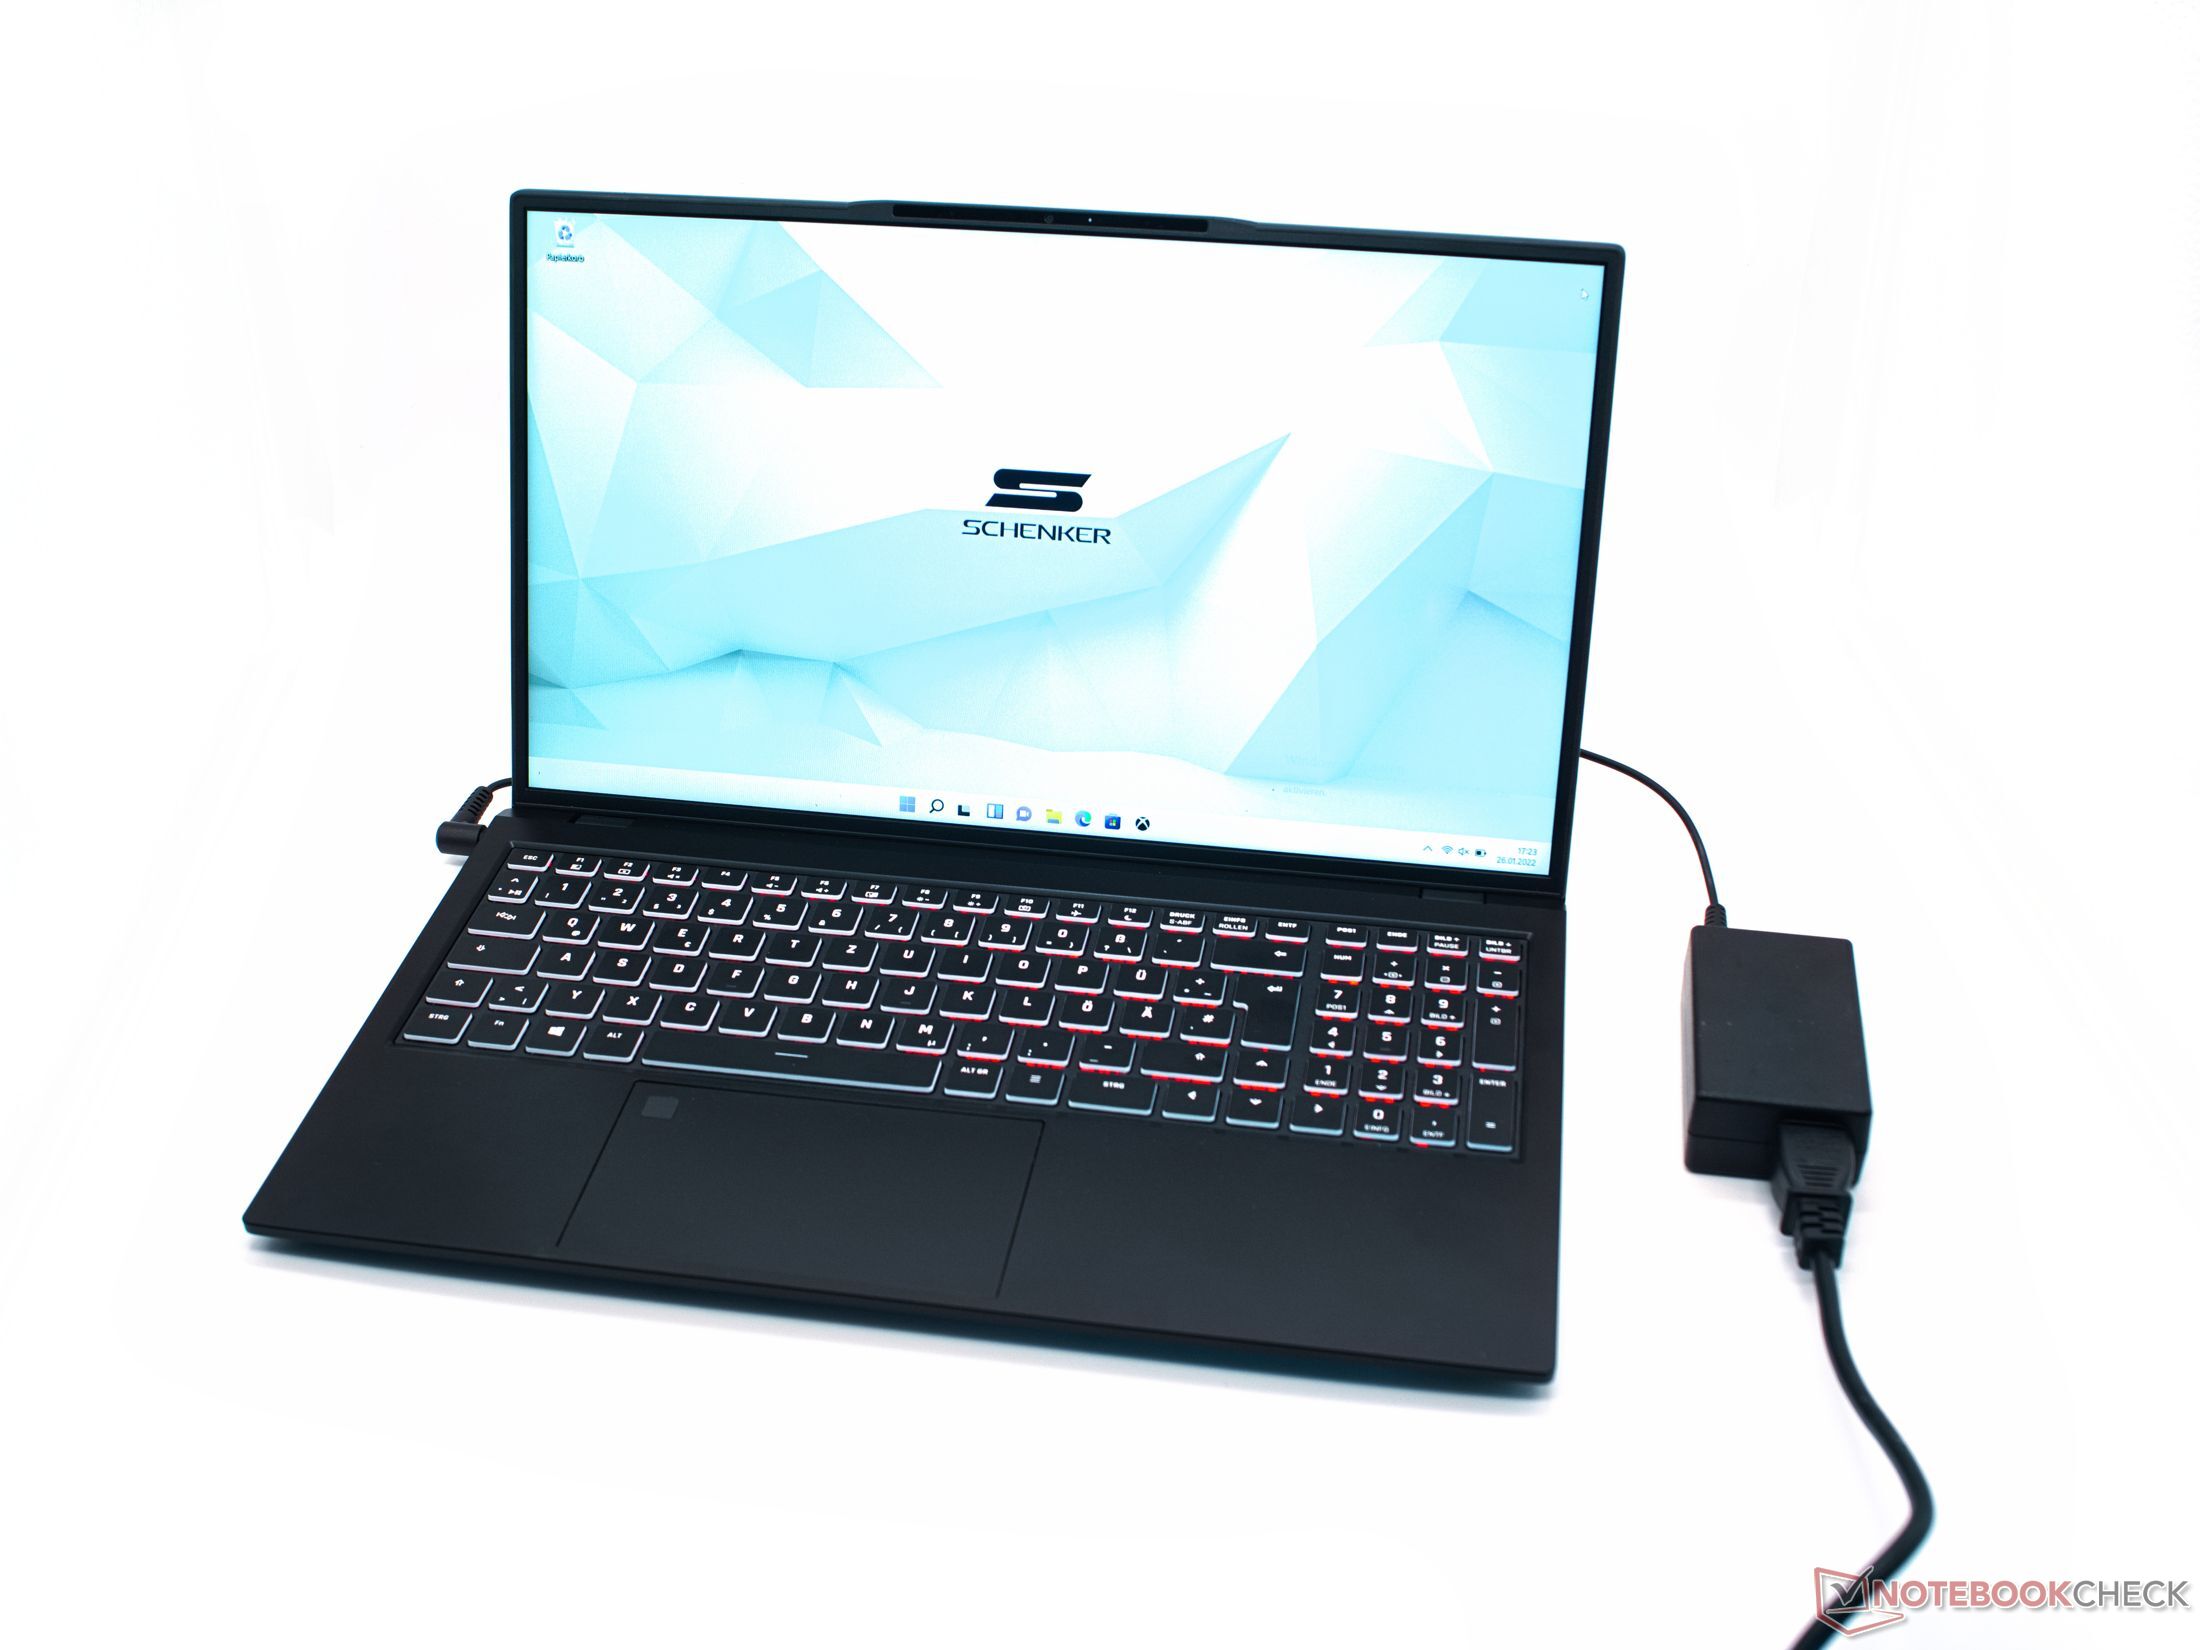
电源管理。电池运行时间长
能量吸收
申克公司的笔记本电脑平均空闲功耗为8瓦,相当节能。然而,在负载情况下,它也可以在几分钟内完全利用所附电源的65瓦功率限制。测得的最大功耗为69.4瓦,该电源刚好够用。
| Off / Standby | |
| Idle | |
| Load |
|
Key:
min: | |
Energieaufnahme Witcher 3 / Stresstest
Power consumption with external monitor
电池寿命
双芯74瓦时锂离子电池使Schenker Work 15的电池运行时间相对较长。在我们实际的Wi-Fi网上冲浪测试中,8至10小时的时间也应导致相应长的实际工作时间。即使在负载情况下,运行时间也相对较长,但有一个限制,即可用的计算能力明显低于主电源的操作。
| Schenker Work 15 Tiger Lake-H i7-11370H, Iris Xe G7 96EUs, 73 Wh | LG Gram 15Z90P-G.AA89G i7-1165G7, Iris Xe G7 96EUs, 80 Wh | Dell Inspiron 15 3501 i7-1165G7, Iris Xe G7 96EUs, 42 Wh | Lenovo ThinkPad E15 G3-20YG003UGE R7 5700U, Vega 8, 57 Wh | Asus VivoBook S15 D533UA R7 5700U, Vega 8, 50 Wh | Average of class Office | |
|---|---|---|---|---|---|---|
| Battery runtime | 41% | -33% | -2% | -12% | 18% | |
| Reader / Idle (h) | 24.5 | 26 6% | 24.5 ? 0% | |||
| H.264 (h) | 9.6 | 15.5 ? 61% | ||||
| WiFi v1.3 (h) | 10.2 | 13.7 34% | 6.8 -33% | 10 -2% | 9 -12% | 13.2 ? 29% |
| Load (h) | 2.2 | 4 82% | 1.808 ? -18% |
Pros
Cons
结论:令人振奋的配置选项,具有节约潜力

优秀的键盘、较长的电池运行时间和许多端口使申克工作15成为一台优秀的办公笔记本电脑。然而,英特尔酷睿i7-11370H的良好性能伴随着相对较高的噪音水平。软件和硬件方面的许多配置选项使买家能够使笔记本适应自己的需要。
互联网应用和办公以及许多游戏对APU不构成大的挑战。这款笔记本电脑没有显示出任何重大的弱点。只有屏幕可以做得更好一些,但对于办公设备来说已经足够。
Schenker Work 15是一款不寻常的办公笔记本电脑,有许多配置选项。
不想支付高额购买价格的用户可以在配置器中用i5和较少的工作内存节省很多钱。据推测,稍弱的酷睿i5-11300H应该不会对计算性能产生明显的负面影响。然而,通过选择较短的保修期或不同的SSD,购买价格也可以减少不少欧元。
价格和可用性
Schenker Work 15可向制造商提供各种配置,起价927欧元。.
Schenker Work 15 Tiger Lake-H
- 02/18/2022 v7 (old)
Marc Herter
Price comparison
