


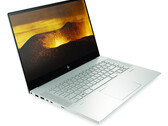
2020惠普Envy 15 Creator Core i7笔记本电脑评测:惠普对MacBook的回应
惠普将赌注押在4K AMOLED,更快的GeForce RTX图形以及更便宜的起始价格上,以挑战MacBook Pro系列并吸引更多的内容创作者。
Intel Core i7-10750H, NVIDIA GeForce RTX 2060 Max-Q, 15.6", 2 kg带有Max-Q设计的NVIDIA GeForce RTX 2060是移动GeForce RTX 2060的低功耗版本。因此,它是适用于轻薄笔记本电脑的高端游戏图形卡。它与RTX 2060使用相同的芯片,但频率降低且功耗更低。它于2020年与Zephyrus G14游戏笔记本电脑一起发布。
通过更新,Nvidia还重新设计了Max-Q技术以提高效率。低压GDDR6(时钟频率较低,但GPU的余量更大)和改进的稳压器效率将提高每瓦性能。 OEM还可以实现两个新的可选功能。 Max-Q Dynamic Boost能够按帧将功耗从CPU转移到GPU,以提高整体性能。此外,笔记本电脑制造商还可以通过动态显示开关(硬件)实施Advanced Optimus,以启用Optimus,G-SYNC和高刷新率显示(最高4K 120 Hz)。
与常规GTX 1080相比,频率并不是唯一的区别。针对Max-Q版本的驱动器针对效率进行了优化(而非性能;仅针对Max-Q型号进行了优化),针对1V运行,高端冷却方法以及风扇噪声限制为40 dB的驱动优化了电压转换器(并进行时钟调整以确保始终如此)。
由于降低了频率,因此性能应略低于正常RTX 2060。它应该最适合高特效的1080p游戏。但是,光线追踪功能可能会大大降低帧率,因此使用光线追踪将仅限于某些游戏。
该芯片的额定TGP为65瓦左右,因此明显低于常规RTX 2060 Mobile的80-90瓦。
GeForce RTX 2000 Series
| ||||||||||||||||||||||||||||||||||||||||||||||||||||||||||
| Codename | N18E-G1 MAX-Q TU106 | |||||||||||||||||||||||||||||||||||||||||||||||||||||||||
| Architecture | Turing | |||||||||||||||||||||||||||||||||||||||||||||||||||||||||
| Pipelines | 1920 - unified | |||||||||||||||||||||||||||||||||||||||||||||||||||||||||
| Core Speed | 975 - 1185 (Boost) MHz | |||||||||||||||||||||||||||||||||||||||||||||||||||||||||
| Memory Speed | 11000 MHz | |||||||||||||||||||||||||||||||||||||||||||||||||||||||||
| Memory Bus Width | 192 Bit | |||||||||||||||||||||||||||||||||||||||||||||||||||||||||
| Memory Type | GDDR6 | |||||||||||||||||||||||||||||||||||||||||||||||||||||||||
| Max. Amount of Memory | 6 GB | |||||||||||||||||||||||||||||||||||||||||||||||||||||||||
| Shared Memory | no | |||||||||||||||||||||||||||||||||||||||||||||||||||||||||
| API | DirectX 12_1, OpenGL 4.6 | |||||||||||||||||||||||||||||||||||||||||||||||||||||||||
| Power Consumption | 65 Watt | |||||||||||||||||||||||||||||||||||||||||||||||||||||||||
| Man. Technology | 12 nm | |||||||||||||||||||||||||||||||||||||||||||||||||||||||||
| Features | DLSS, Raytraycing, VR Ready, G-SYNC, Vulkan, Multi Monitor | |||||||||||||||||||||||||||||||||||||||||||||||||||||||||
| Notebook Size | large | |||||||||||||||||||||||||||||||||||||||||||||||||||||||||
| Date of Announcement | 06.01.2019 | |||||||||||||||||||||||||||||||||||||||||||||||||||||||||
The following benchmarks stem from our benchmarks of review laptops. The performance depends on the used graphics memory, clock rate, processor, system settings, drivers, and operating systems. So the results don't have to be representative for all laptops with this GPU. For detailed information on the benchmark results, click on the fps number.


| low | med. | high | ultra | QHD | 4K | |
|---|---|---|---|---|---|---|
| Gears Tactics | 257.9 | 120.4 | 76.4 | 56.9 | 18.9 | |
| Doom Eternal | 176.1 | 108.7 | 95.7 | 93.3 | ||
| Hunt Showdown | 194.2 | 96.3 | 75.7 | |||
| Escape from Tarkov | 78.5 | 68.5 | 68.2 | 85.3 | ||
| Star Wars Jedi Fallen Order | 92.9 | 88 | 77.8 | |||
| Need for Speed Heat | 103.2 | 88.7 | 82.2 | 79 | ||
| GRID 2019 | 157.4 | 109.4 | 103.4 | 73.5 | 33.1 | |
| Ghost Recon Breakpoint | 123 | 82 | 75 | 55 | ||
| Borderlands 3 | 117 | 89.5 | 61.9 | 48.3 | ||
| Control | 183.7 | 67.1 | 50.4 | |||
| F1 2019 | 196 | 137 | 116 | 101 | ||
| Total War: Three Kingdoms | 201.1 | 103.3 | 69.2 | 50.7 | ||
| Anno 1800 | 81.5 | 81.6 | 61.4 | 36.5 | ||
| The Division 2 | 154 | 92 | 74 | 56 | ||
| Dirt Rally 2.0 | 276.7 | 125.3 | 105.3 | 60.5 | 24.4 | |
| Far Cry New Dawn | 105 | 75 | 70 | 63 | ||
| Metro Exodus | 129.6 | 72.7 | 55.2 | 43.8 | ||
| Apex Legends | 143.6 | 142.8 | 126.2 | 116.6 | ||
| Assassin´s Creed Odyssey | 97 | 79 | 65 | 45 | ||
| Shadow of the Tomb Raider | 118 | 87 | 80 | 70 | 20 | |
| Strange Brigade | 276 | 130 | 106 | 93.1 | ||
| Monster Hunter World | 104.5 | 94.2 | 75.6 | 63.6 | ||
| X-Plane 11.11 | 103 | 90 | 76 | 62 | ||
| Final Fantasy XV Benchmark | 135 | 79 | 60 | 43.6 | 24.9 | |
| Fortnite | 124 | 110.2 | 107.4 | 81.2 | ||
| Middle-earth: Shadow of War | 155 | 123 | 97 | 76 | ||
| Rocket League | 246.9 | 249.7 | 219.3 | |||
| Overwatch | 299.9 | 299.7 | 229.7 | 146.9 | ||
| Doom | 125 | 125 | 118.2 | 111.5 | ||
| Ashes of the Singularity | 100.4 | 72.8 | 66.8 | |||
| Metal Gear Solid V | 60 | 60 | 60 | 59.2 | ||
| Dota 2 Reborn | 139 | 129 | 119 | 114 | 79 | |
| The Witcher 3 | 266 | 175 | 104 | 57 | 35 | |
| GTA V | 173 | 164 | 119 | 68.2 | ||
| BioShock Infinite | 278.3 | 252.3 | 229.5 | 126.2 | ||
| Guild Wars 2 | 130.3 | 67.3 | 67.4 | |||
| low | med. | high | ultra | QHD | 4K | < 30 fps < 60 fps < 120 fps ≥ 120 fps | 11 24 | 22 13 | 2 30 4 | 10 18 2 | 1 | 4 2 2 |
For more games that might be playable and a list of all games and graphics cards visit our Gaming List
Asus ROG Zephyrus G15 GA502IV-PH96: AMD Ryzen 9 4900HS, 15.60", 2.1 kg
External Review » Asus ROG Zephyrus G15 GA502IV-PH96
HP Pavilion Gaming 16-a0043ns: Intel Core i7-10750H, 16.10", 2.4 kg
External Review » HP Pavilion Gaming 16-a0043ns
HP Envy 15-ep0041ur: Intel Core i7-10750H, 15.60", 2.1 kg
External Review » HP Envy 15-ep0041ur
HP Envy 15-ep0175nd: Intel Core i7-10750H, 15.60", 2.1 kg
External Review » HP Envy 15-ep0175nd
Asus ROG Zephyrus G15 GA502IV-HN042: AMD Ryzen 9 4900HS, 15.60", 2.1 kg
External Review » Asus ROG Zephyrus G15 GA502IV-HN042
HP Pavilion Gaming 16-a0042ns: Intel Core i5-10300H, 16.10", 2.4 kg
External Review » HP Pavilion Gaming 16-a0042ns
HP Pavilion Gaming 16-a0033ns: Intel Core i7-10750H, 16.10"
External Review » HP Pavilion Gaming 16-a0033ns
HP Envy 15-ep008n: Intel Core i7-10750H, 15.60", 2.2 kg
External Review » HP Envy 15-ep008n
HP Envy 15-ep0016tx: Intel Core i7-10750H, 15.60", 2.2 kg
External Review » HP Envy 15-ep0016tx
HP Envy 15-ep0015nl: Intel Core i7-10750H, 15.60", 2.2 kg
External Review » HP Envy 15-ep0015nl
HP Pavilion Gaming 16-A0029NS: Intel Core i7-10750H, 16.10", 2.4 kg
External Review » HP Pavilion Gaming 16-A0029NS
HP Envy 15-ep0190nd: Intel Core i9-10885H, 15.60", 2.2 kg
External Review » HP Envy 15-ep0190nd
Asus Zephyrus G14 GA401IVC-HA275T (ACRNM RMT01): AMD Ryzen 9 4900HS, 15.60", 1.7 kg
External Review » Asus Zephyrus G14 GA401IVC-HA275T (ACRNM RMT01)
HP Gaming Pavilion 15-dk1064tx: Intel Core i5-10300H, 15.60", 2.2 kg
External Review » HP Gaming Pavilion 15-dk1064tx
Dell XPS 17 9700-C9T5T: Intel Core i9-10885H, 17.30", 2.5 kg
External Review » Dell XPS 17 9700-C9T5T
HP Envy 15-ep0098nr: Intel Core i7-10750H, 15.60", 2 kg
External Review » HP Envy 15-ep0098nr
HP Gaming Pavilion 15-dk1003ns: Intel Core i7-10750H, 15.60", 2.2 kg
External Review » HP Gaming Pavilion 15-dk1003ns
Dell XPS 17 9700 Core i7 RTX 2060 Max-Q: Intel Core i7-10875H, 17.00", 2.5 kg
External Review » Dell XPS 17 9700 Core i7 RTX 2060 Max-Q
Asus ROG Zephyrus G15 GA502IV-HN020: AMD Ryzen 7 4800HS, 15.60", 2.1 kg
External Review » Asus Zephyrus G15 GA502IV-HN020
Asus Zephyrus G14 GA401IV-HE003T: AMD Ryzen 7 4800HS, 14.00", 1.6 kg
External Review » Asus Zephyrus G14 GA401IV-HE003T
Asus Zephyrus G14 GA401IV-HE253T: AMD Ryzen 7 4800HS, 14.00", 1.7 kg
External Review » Asus Zephyrus G14 GA401IV-HE253T
Asus Zephyrus G14 GA401IV-HA116T: AMD Ryzen 9 4900HS, 14.00", 1.7 kg
External Review » Asus Zephyrus G14 GA401IV-HA116T
Asus Zephyrus G14 GA401IV-HE022: AMD Ryzen 7 4800HS, 14.00", 1.6 kg
External Review » Asus Zephyrus G14 GA401IV-HE022
Razer Blade 15 Base Model 2020, i7-10750H, RTX 2060 Max-Q: Intel Core i7-10750H, 15.60", 2.1 kg
External Review » Razer Blade 15 Base Model 2020, i7-10750H, RTX 2060 Max-Q
Asus ProArt StudioBook 17 H700GV RTX 2060, Xeon E-2276M: Intel Xeon E-2276M, 17.00", 2.4 kg
External Review » Asus ProArt StudioBook 17 H700GV RTX 2060, Xeon E-2276M
Asus Zephyrus G14 GA401IV: AMD Ryzen 9 4900HS, 14.00", 1.6 kg
External Review » Asus Zephyrus G14 GA401IV
Lenovo Legion Y540-15IRH-81SX00CKSP: Intel Core i7-9750H, 15.60", 2.3 kg
External Review » Lenovo Legion Y540-15IRH-81SX00CKSP
» Comparison of GPUs
Detailed list of all laptop GPUs sorted by class and performance.
» Benchmark List
Sort and restrict laptop GPUs based on performance in synthetic benchmarks.
» Notebook Gaming List
Playable games for each graphics card and their average FPS results.
* Approximate position of the graphics adapter
» Notebookcheck多媒体笔记本电脑Top 10排名
» Notebookcheck游戏笔记本电脑Top 10排名
» Notebookcheck低价办公/商务笔记本电脑Top 10排名
» Notebookcheck高端办公/商务笔记本电脑Top 10排名
» Notebookcheck工作站笔记本电脑Top 10排名
» Notebookcheck亚笔记本电脑Top 10排名
» Notebookcheck超级本产品Top 10排名
» Notebookcheck变形本产品Top 10排名
» Notebookcheck平板电脑Top 10排名
» Notebookcheck智能手机Top 10排名
» Notebookcheck评测过最出色的笔记本电脑屏幕
» Notebookcheck售价500欧元以下笔记本电脑Top 10排名
» Notebookcheck售价300欧元以下笔记本电脑Top 10排名